international migration and gender differentials in labor ... · international migration and gender...
TRANSCRIPT
International migration and gender differentials in labor market outcomes in Albania
Mariapia MendolaUniversity of Milan Bicocca and LdA
Gero CarlettoThe World Bank
IZA-WB Conference - Bonn, 2009
Aim
Shedding light on the role of labor migration in shaping socio-economic changes in countries of origin
Exploring the labor market impact of emigration in Albania
Looking at the relationship between male-dominated migration and a process of gender empowerment at origin- defined as the ability of women to access local earning opportunity
Motivation
General consensus: labour migration entails big welfare effects on source households- Yet, when household members are not co-resident certain allocations can only be imperfectly monitored (Chen,2006)
• Lack of evidence on different migration effects across household members (for other intra-hh analysis Duflo, Thomas etc.)
• Migration from LDCs has been typically structured around gender and family (Baker&Benjamin, 1997; Parrado &Flippen 2005)
• Little evidence on the relationship between male-dominated migration and women’s outcomes at origin (recent the reverse…)

Background- 1
• Non-unitary household models suggest the interdependence of work decisions within a family
• Migration of household members affect non-migrants mainly through time and resource allocation mechanisms within the family
– Most of the focus on the income (remittance) effect. Hanson (2007) and Amuedo-Dorantes and Pozo (2006) in Mexico; Rodriguez and Tiongson (2001) in Manila; and Funkhouser(1992) in Managua
– On the disruptive effect: migration withdraws working-aged members from the household- re-allocation of time by other household members (Albanesi and Olivetti, 2006)
• Overall, few studies distinguish the two effects

Background- 2• BUT in a traditional society, migration (i.e. changes in earned
income coupled with imperfect monitoring) may affectbargaining power in the control and allocation of resources at origin (Chen 2006) challenge to traditional gender roles
• Wage income and family influence are closely linked importance of assessing women’s employment outcomes
• Yet, in developing countries women are economically activeeven when providing informal or unpaid work
• Need to distinguish leisure from other non-market time (e.g. home production or unpaid labor) when assessing female labor outcomes
This paper
• Examine the impact of migration on labour supply of men and women at origin, controlling for potential endogeneity of migration
• Distinguish between paid and unpaid work out of home by gender (accounting for the significant role of both unpaid and informalwork of women)
• Distinguish between past/ current family migration exposure, controlling for the income (remittances) effect
• Policy implications for gender disparities and (future generation) growth.
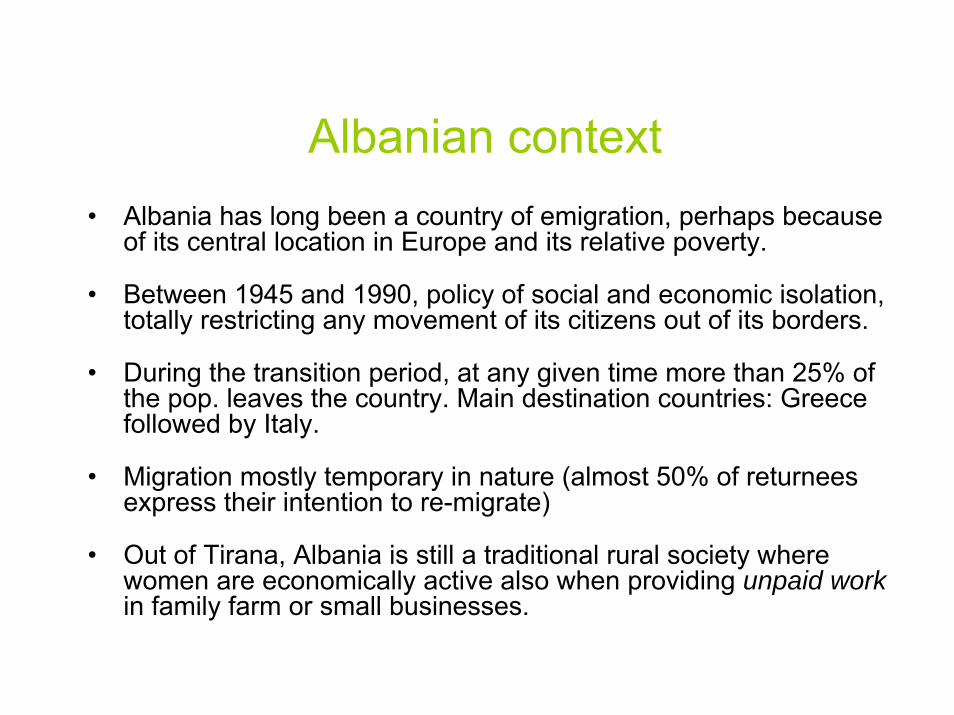
Albanian context• Albania has long been a country of emigration, perhaps because
of its central location in Europe and its relative poverty.
• Between 1945 and 1990, policy of social and economic isolation, totally restricting any movement of its citizens out of its borders.
• During the transition period, at any given time more than 25% ofthe pop. leaves the country. Main destination countries: Greece followed by Italy.
• Migration mostly temporary in nature (almost 50% of returnees express their intention to re-migrate)
• Out of Tirana, Albania is still a traditional rural society where women are economically active also when providing unpaid workin family farm or small businesses.

Albanian labor market trends
Active population by gender, 1998-2002
0200400600800
1000120014001600
1998 1999 2000 2001 2002
Thou
sand
s
TOTAL Men Women
Public sector employment by gender, 1999-2003
0
20
40
60
80
100
120
140
1998 1999 2000 2001 2002 2003 2004 2005Th
ousa
nds
Men Women
Source: ILO LABORSTA
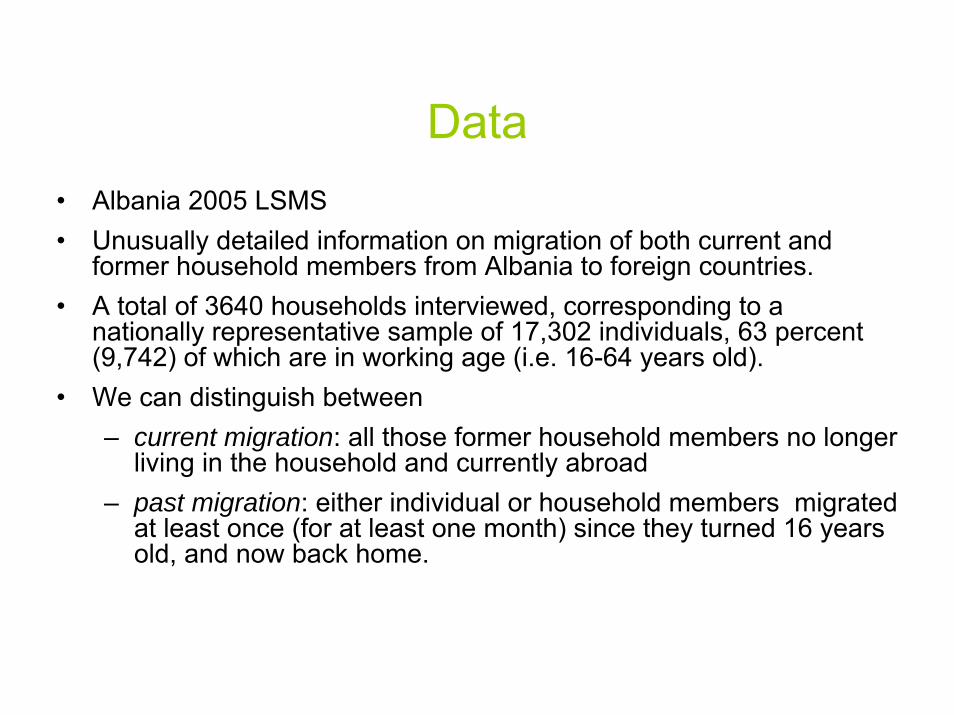
Data• Albania 2005 LSMS• Unusually detailed information on migration of both current and
former household members from Albania to foreign countries. • A total of 3640 households interviewed, corresponding to a
nationally representative sample of 17,302 individuals, 63 percent (9,742) of which are in working age (i.e. 16-64 years old).
• We can distinguish between – current migration: all those former household members no longer
living in the household and currently abroad– past migration: either individual or household members migrated
at least once (for at least one month) since they turned 16 years old, and now back home.

Sample migration rates by gender(self reported last migration episode since 1990)
025
000
last
-tim
e m
igra
nts
1991
1992
1993
1994
1995
1996
1997
1998
1999
2000
2001
2002
2003
Year migrated
male female
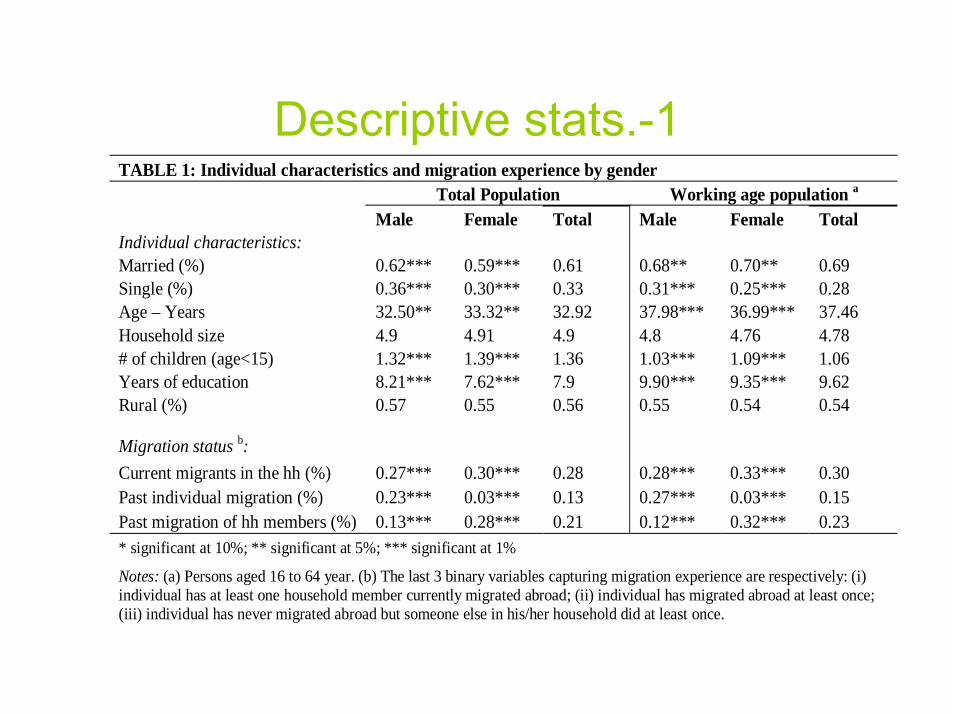
Descriptive stats.-1TABLE 1: Individual characteristics and migration experience by gender Total Population Working age population a Male Female Total Male Female Total Individual characteristics: Married (%) 0.62*** 0.59*** 0.61 0.68** 0.70** 0.69 Single (%) 0.36*** 0.30*** 0.33 0.31*** 0.25*** 0.28 Age – Years 32.50** 33.32** 32.92 37.98*** 36.99*** 37.46 Household size 4.9 4.91 4.9 4.8 4.76 4.78 # of children (age<15) 1.32*** 1.39*** 1.36 1.03*** 1.09*** 1.06 Years of education 8.21*** 7.62*** 7.9 9.90*** 9.35*** 9.62 Rural (%) 0.57 0.55 0.56 0.55 0.54 0.54
Migration status b: Current migrants in the hh (%) 0.27*** 0.30*** 0.28 0.28*** 0.33*** 0.30 Past individual migration (%) 0.23*** 0.03*** 0.13 0.27*** 0.03*** 0.15 Past migration of hh members (%) 0.13*** 0.28*** 0.21 0.12*** 0.32*** 0.23 * significant at 10%; ** significant at 5%; *** significant at 1%
Notes: (a) Persons aged 16 to 64 year. (b) The last 3 binary variables capturing migration experience are respectively: (i) individual has at least one household member currently migrated abroad; (ii) individual has migrated abroad at least once; (iii) individual has never migrated abroad but someone else in his/her household did at least once.
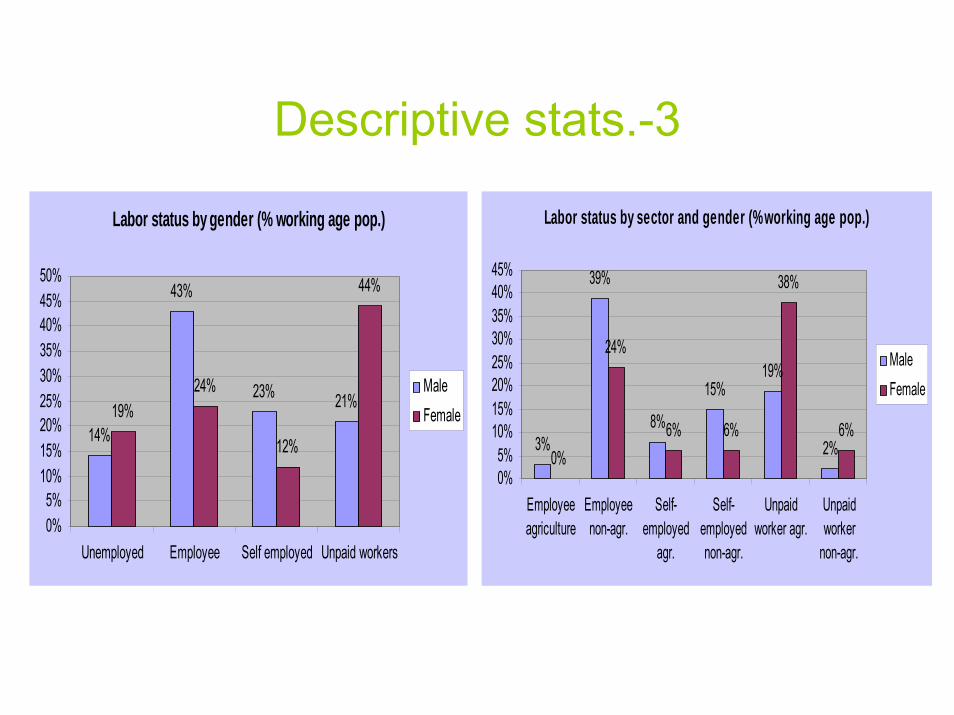
Descriptive stats.-3
Labor status by gender (% working age pop.)
14%
43%
23% 21%19%24%
12%
44%
0%5%
10%15%20%25%30%35%40%45%50%
Unemployed Employee Self employed Unpaid workers
MaleFemale
Labor status by sector and gender (% working age pop.)
3%
39%
8%
15%19%
2%0%
24%
6% 6%
38%
6%
0%5%
10%15%20%25%30%35%40%45%
Employeeagriculture
Employeenon-agr.
Self-employed
agr.
Self-employednon-agr.
Unpaidworker agr.
Unpaidworker
non-agr.
MaleFemale
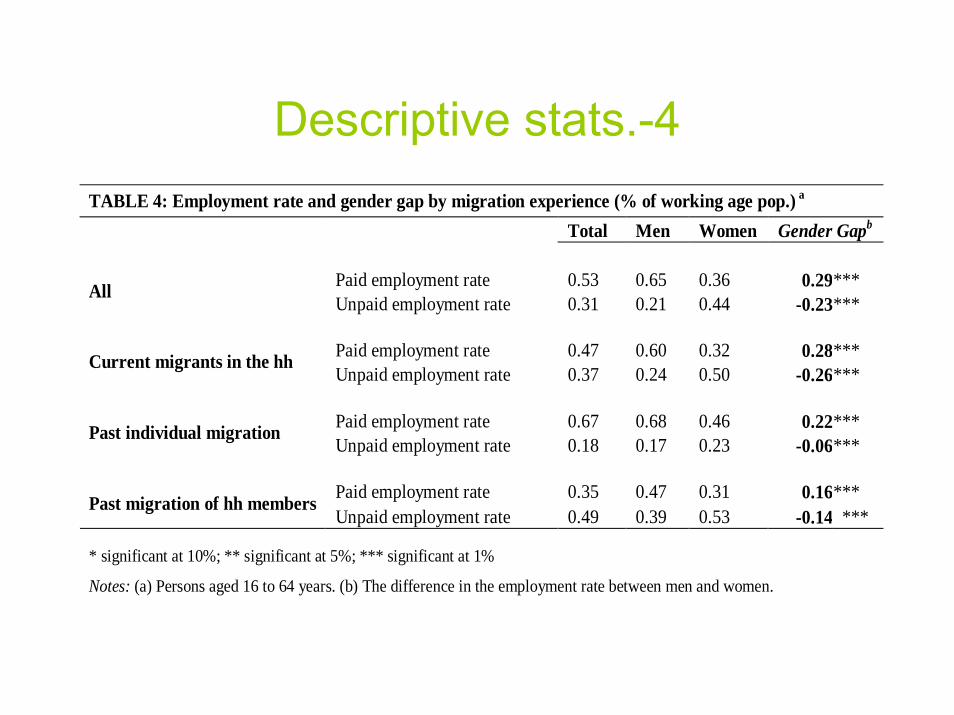
Descriptive stats.-4TABLE 4: Employment rate and gender gap by migration experience (% of working age pop.) a Total Men Women Gender Gapb
Paid employment rate 0.53 0.65 0.36 0.29*** All Unpaid employment rate 0.31 0.21 0.44 -0.23***
Paid employment rate 0.47 0.60 0.32 0.28*** Current migrants in the hh Unpaid employment rate 0.37 0.24 0.50 -0.26***
Paid employment rate 0.67 0.68 0.46 0.22*** Past individual migration Unpaid employment rate 0.18 0.17 0.23 -0.06***
Paid employment rate 0.35 0.47 0.31 0.16*** Past migration of hh members Unpaid employment rate 0.49 0.39 0.53 -0.14 ***
* significant at 10%; ** significant at 5%; *** significant at 1%
Notes: (a) Persons aged 16 to 64 years. (b) The difference in the employment rate between men and women.

Hours of work distribution, by type of work and gender
0.5
11.
5pr
ob d
ensi
ty
0 1 2 3 4log hours w
Men Women
Wage emp.
0.5
11.
5pr
ob d
ensi
ty
0 1 2 3 4 5log hours w
Men Women
Paid self-emp.
0.5
11.
5pr
ob d
ensi
ty
0 1 2 3 4log hours w
Men Women
Unpaid work

Empirical strategy
Labor choice equation (reduced form):
Li = 1 if L*>0, i.e. labor force participation in occupation S;Mi
J = 1 if individual i belongs to the jth hh migration statusXi = vectors of individual/ hh/ regional charact. (unemp rate at district level,
regional fixed effects);
Migration endogeneity concerns:
ZiJ= valid instruments s.t.
- Ortogonality condition:- Exclusion restriction assump.:
→ (1)-(2) Simultaneous equation model using IV estimator
iiJi
JSi XML εβββ +++= 210* (1)
0),( ≠XME Jε
0),( =XZuE J
),(),,( XMPEXMZPE JJJ =
iiJ
iJJ
iJ uZXM +++= 210 γγγ (2)
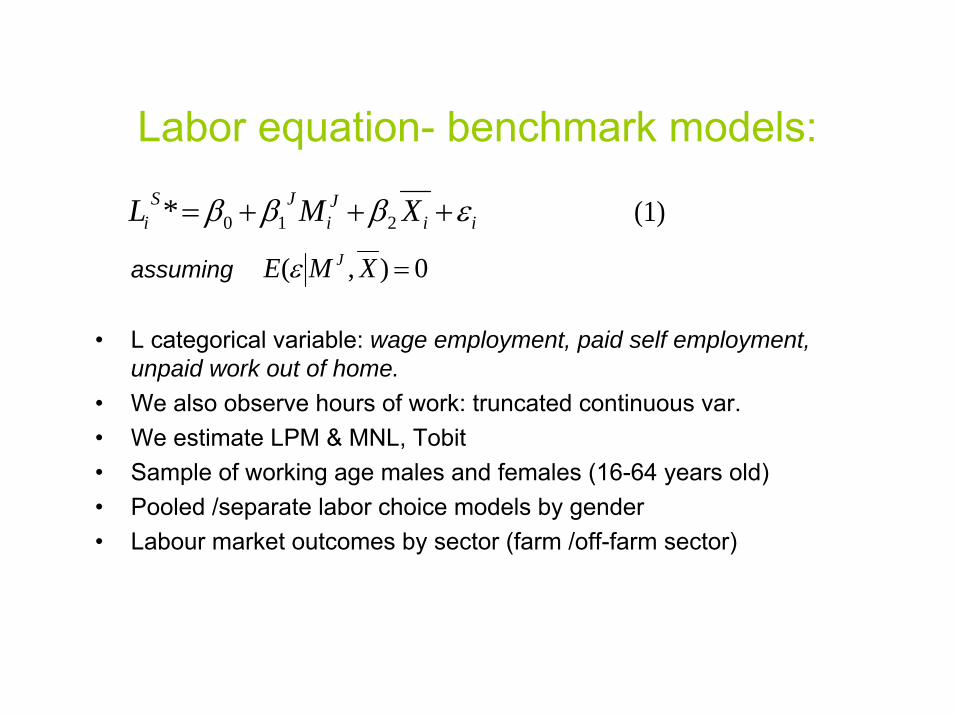
Labor equation- benchmark models:
assuming
• L categorical variable: wage employment, paid self employment, unpaid work out of home.
• We also observe hours of work: truncated continuous var.• We estimate LPM & MNL, Tobit• Sample of working age males and females (16-64 years old)• Pooled /separate labor choice models by gender• Labour market outcomes by sector (farm /off-farm sector)
0),( =XME Jε
iiJi
JSi XML εβββ +++= 210* (1)
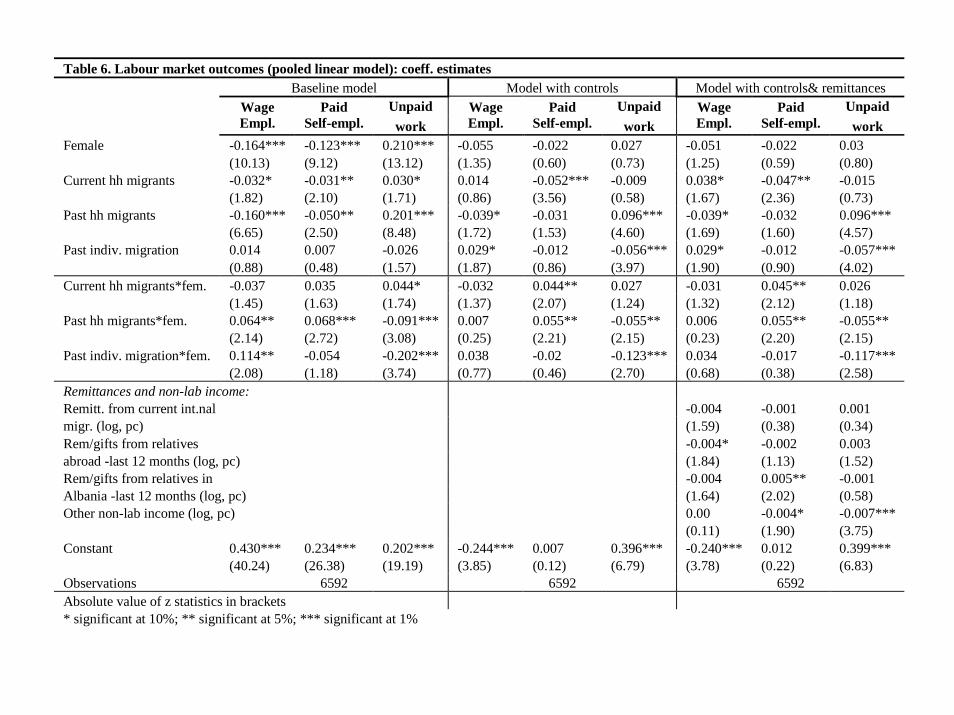
Table 6. Labour market outcomes (pooled linear model): coeff. estimates Baseline model Model with controls Model with controls& remittances
Unpaid Unpaid Unpaid Wage Empl.
Paid Self-empl. work
Wage Empl.
Paid Self-empl. work
Wage Empl.
Paid Self-empl. work
Female -0.164*** -0.123*** 0.210*** -0.055 -0.022 0.027 -0.051 -0.022 0.03 (10.13) (9.12) (13.12) (1.35) (0.60) (0.73) (1.25) (0.59) (0.80) Current hh migrants -0.032* -0.031** 0.030* 0.014 -0.052*** -0.009 0.038* -0.047** -0.015 (1.82) (2.10) (1.71) (0.86) (3.56) (0.58) (1.67) (2.36) (0.73) Past hh migrants -0.160*** -0.050** 0.201*** -0.039* -0.031 0.096*** -0.039* -0.032 0.096*** (6.65) (2.50) (8.48) (1.72) (1.53) (4.60) (1.69) (1.60) (4.57) Past indiv. migration 0.014 0.007 -0.026 0.029* -0.012 -0.056*** 0.029* -0.012 -0.057*** (0.88) (0.48) (1.57) (1.87) (0.86) (3.97) (1.90) (0.90) (4.02) Current hh migrants*fem. -0.037 0.035 0.044* -0.032 0.044** 0.027 -0.031 0.045** 0.026 (1.45) (1.63) (1.74) (1.37) (2.07) (1.24) (1.32) (2.12) (1.18) Past hh migrants*fem. 0.064** 0.068*** -0.091*** 0.007 0.055** -0.055** 0.006 0.055** -0.055** (2.14) (2.72) (3.08) (0.25) (2.21) (2.15) (0.23) (2.20) (2.15) Past indiv. migration*fem. 0.114** -0.054 -0.202*** 0.038 -0.02 -0.123*** 0.034 -0.017 -0.117*** (2.08) (1.18) (3.74) (0.77) (0.46) (2.70) (0.68) (0.38) (2.58) Remittances and non-lab income: Remitt. from current int.nal -0.004 -0.001 0.001 migr. (log, pc) (1.59) (0.38) (0.34) Rem/gifts from relatives -0.004* -0.002 0.003 abroad -last 12 months (log, pc) (1.84) (1.13) (1.52) Rem/gifts from relatives in -0.004 0.005** -0.001 Albania -last 12 months (log, pc) (1.64) (2.02) (0.58) Other non-lab income (log, pc) 0.00 -0.004* -0.007*** (0.11) (1.90) (3.75) Constant 0.430*** 0.234*** 0.202*** -0.244*** 0.007 0.396*** -0.240*** 0.012 0.399*** (40.24) (26.38) (19.19) (3.85) (0.12) (6.79) (3.78) (0.22) (6.83) Observations 6592 6592 6592 Absolute value of z statistics in brackets * significant at 10%; ** significant at 5%; *** significant at 1%
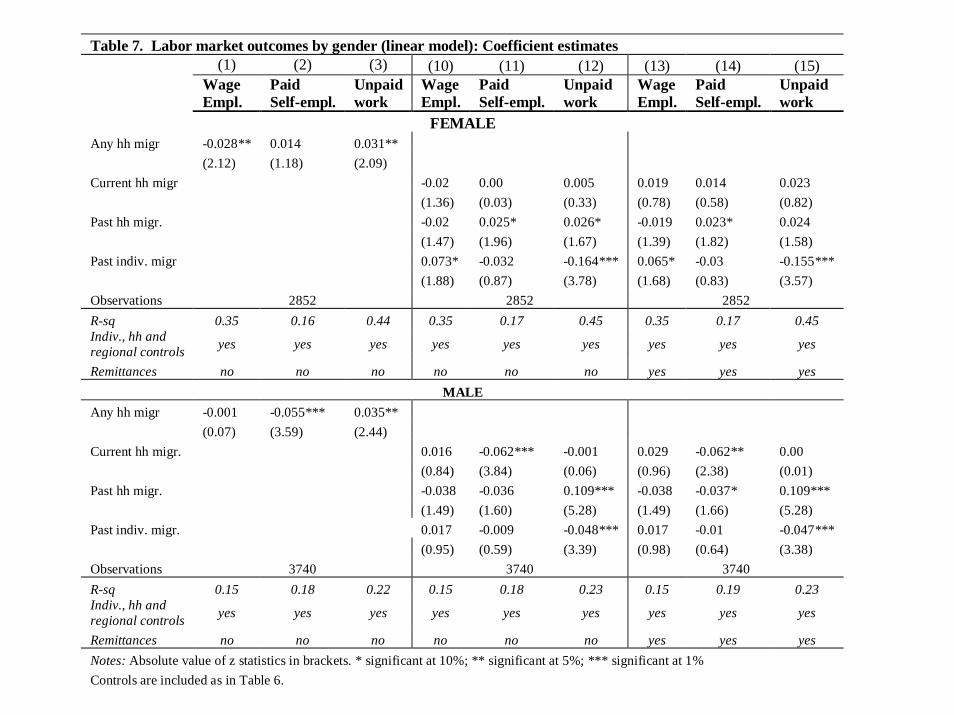
Table 7. Labor market outcomes by gender (linear model): Coefficient estimates (1) (2) (3) (10) (11) (12) (13) (14) (15)
Wage Empl.
Paid Self-empl.
Unpaid work
Wage Empl.
Paid Self-empl.
Unpaid work
Wage Empl.
Paid Self-empl.
Unpaid work
FEMALE Any hh migr -0.028** 0.014 0.031** (2.12) (1.18) (2.09) Current hh migr -0.02 0.00 0.005 0.019 0.014 0.023 (1.36) (0.03) (0.33) (0.78) (0.58) (0.82) Past hh migr. -0.02 0.025* 0.026* -0.019 0.023* 0.024 (1.47) (1.96) (1.67) (1.39) (1.82) (1.58) Past indiv. migr 0.073* -0.032 -0.164*** 0.065* -0.03 -0.155*** (1.88) (0.87) (3.78) (1.68) (0.83) (3.57) Observations 2852 2852 2852 R-sq 0.35 0.16 0.44 0.35 0.17 0.45 0.35 0.17 0.45 Indiv., hh and regional controls yes yes yes yes yes yes yes yes yes
Remittances no no no no no no yes yes yes MALE
Any hh migr -0.001 -0.055*** 0.035** (0.07) (3.59) (2.44) Current hh migr. 0.016 -0.062*** -0.001 0.029 -0.062** 0.00 (0.84) (3.84) (0.06) (0.96) (2.38) (0.01) Past hh migr. -0.038 -0.036 0.109*** -0.038 -0.037* 0.109*** (1.49) (1.60) (5.28) (1.49) (1.66) (5.28) Past indiv. migr. 0.017 -0.009 -0.048*** 0.017 -0.01 -0.047*** (0.95) (0.59) (3.39) (0.98) (0.64) (3.38) Observations 3740 3740 3740 R-sq 0.15 0.18 0.22 0.15 0.18 0.23 0.15 0.19 0.23 Indiv., hh and regional controls yes yes yes yes yes yes yes yes yes
Remittances no no no no no no yes yes yes Notes: Absolute value of z statistics in brackets. * significant at 10%; ** significant at 5%; *** significant at 1% Controls are included as in Table 6.
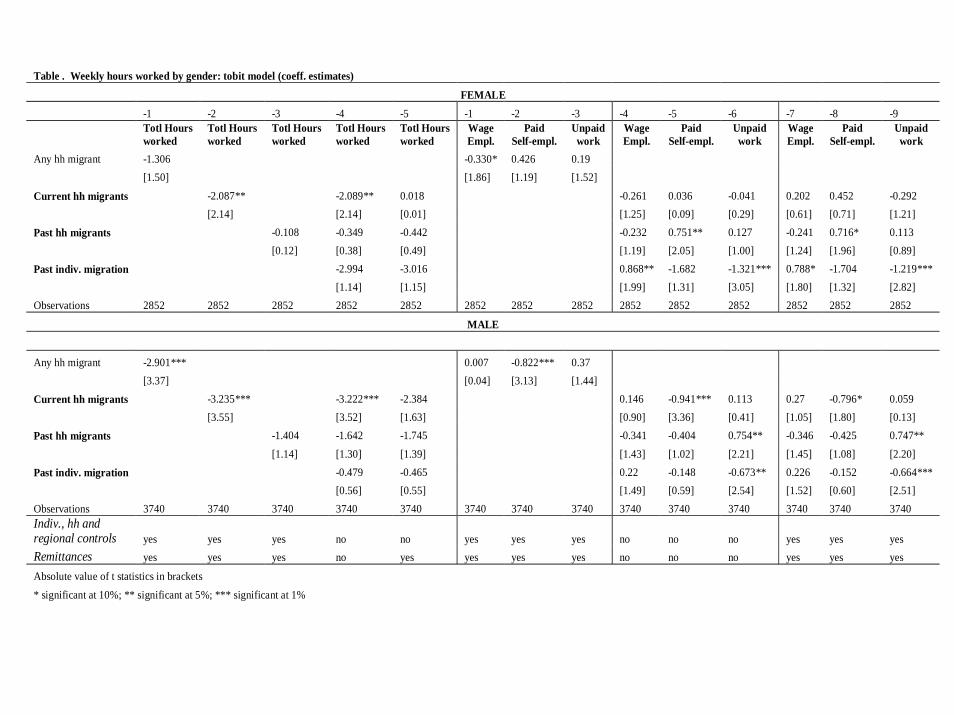
Table . Weekly hours worked by gender: tobit model (coeff. estimates)
FEMALE -1 -2 -3 -4 -5 -1 -2 -3 -4 -5 -6 -7 -8 -9
Totl Hours worked
Totl Hours worked
Totl Hours worked
Totl Hours worked
Totl Hours worked
Wage Empl.
Paid Self-empl.
Unpaid work
Wage Empl.
Paid Self-empl.
Unpaid work
Wage Empl.
Paid Self-empl.
Unpaid work
Any hh migrant -1.306 -0.330* 0.426 0.19 [1.50] [1.86] [1.19] [1.52]
Current hh migrants -2.087** -2.089** 0.018 -0.261 0.036 -0.041 0.202 0.452 -0.292 [2.14] [2.14] [0.01] [1.25] [0.09] [0.29] [0.61] [0.71] [1.21] Past hh migrants -0.108 -0.349 -0.442 -0.232 0.751** 0.127 -0.241 0.716* 0.113 [0.12] [0.38] [0.49] [1.19] [2.05] [1.00] [1.24] [1.96] [0.89] Past indiv. migration -2.994 -3.016 0.868** -1.682 -1.321*** 0.788* -1.704 -1.219*** [1.14] [1.15] [1.99] [1.31] [3.05] [1.80] [1.32] [2.82] Observations 2852 2852 2852 2852 2852 2852 2852 2852 2852 2852 2852 2852 2852 2852
MALE
Any hh migrant -2.901*** 0.007 -0.822*** 0.37 [3.37] [0.04] [3.13] [1.44] Current hh migrants -3.235*** -3.222*** -2.384 0.146 -0.941*** 0.113 0.27 -0.796* 0.059 [3.55] [3.52] [1.63] [0.90] [3.36] [0.41] [1.05] [1.80] [0.13] Past hh migrants -1.404 -1.642 -1.745 -0.341 -0.404 0.754** -0.346 -0.425 0.747**
[1.14] [1.30] [1.39] [1.43] [1.02] [2.21] [1.45] [1.08] [2.20] Past indiv. migration -0.479 -0.465 0.22 -0.148 -0.673** 0.226 -0.152 -0.664*** [0.56] [0.55] [1.49] [0.59] [2.54] [1.52] [0.60] [2.51] Observations 3740 3740 3740 3740 3740 3740 3740 3740 3740 3740 3740 3740 3740 3740 Indiv., hh and regional controls yes yes yes no no yes yes yes no no no yes yes yes Remittances yes yes yes no yes yes yes yes no no no yes yes yes
Absolute value of t statistics in brackets * significant at 10%; ** significant at 5%; *** significant at 1%
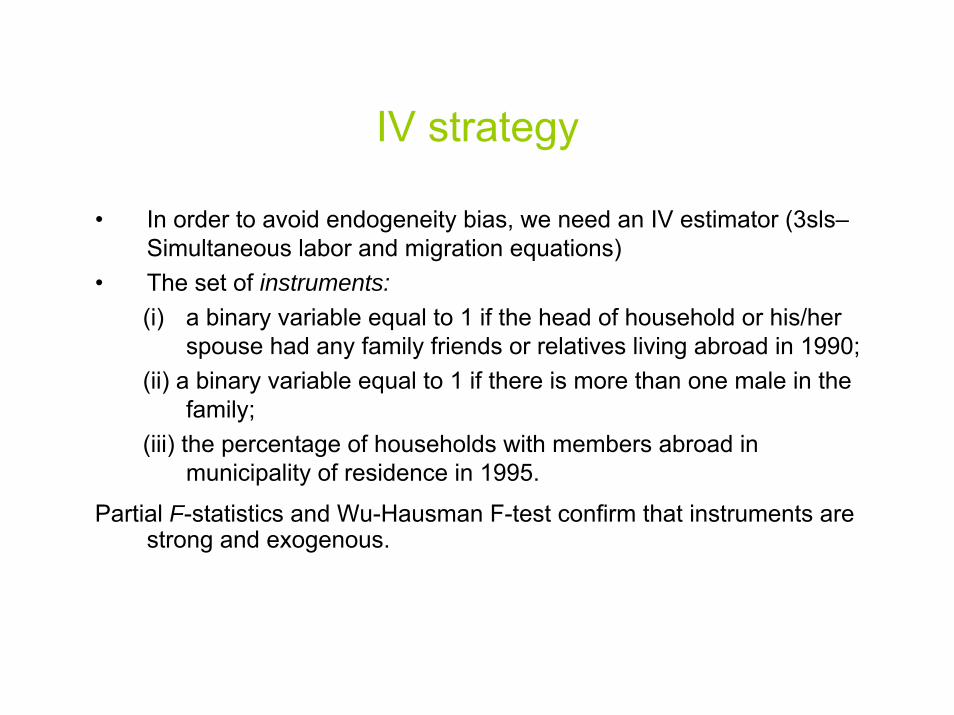
IV strategy
• In order to avoid endogeneity bias, we need an IV estimator (3sls–Simultaneous labor and migration equations)
• The set of instruments:(i) a binary variable equal to 1 if the head of household or his/her
spouse had any family friends or relatives living abroad in 1990; (ii) a binary variable equal to 1 if there is more than one male in the
family;(iii) the percentage of households with members abroad in
municipality of residence in 1995.
Partial F-statistics and Wu-Hausman F-test confirm that instruments are strong and exogenous.
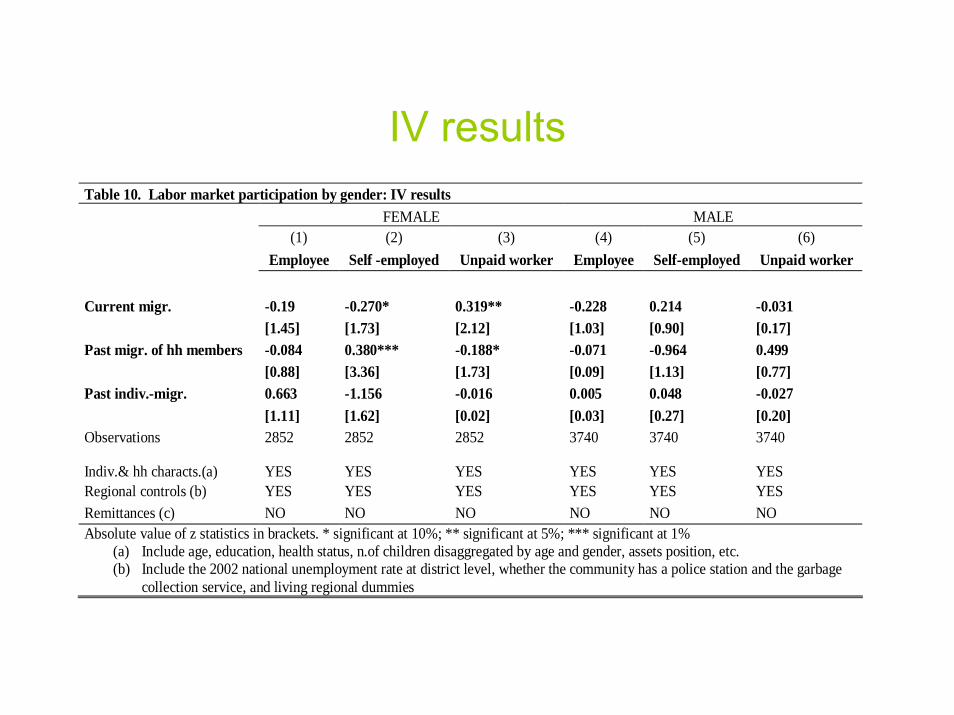
IV resultsTable 10. Labor market participation by gender: IV results FEMALE MALE
(1) (2) (3) (4) (5) (6) Employee Self -employed Unpaid worker Employee Self-employed Unpaid worker Current migr. -0.19 -0.270* 0.319** -0.228 0.214 -0.031 [1.45] [1.73] [2.12] [1.03] [0.90] [0.17] Past migr. of hh members -0.084 0.380*** -0.188* -0.071 -0.964 0.499 [0.88] [3.36] [1.73] [0.09] [1.13] [0.77] Past indiv.-migr. 0.663 -1.156 -0.016 0.005 0.048 -0.027 [1.11] [1.62] [0.02] [0.03] [0.27] [0.20] Observations 2852 2852 2852 3740 3740 3740
Indiv.& hh characts.(a) YES YES YES YES YES YES Regional controls (b) YES YES YES YES YES YES Remittances (c) NO NO NO NO NO NO Absolute value of z statistics in brackets. * significant at 10%; ** significant at 5%; *** significant at 1%
(a) Include age, education, health status, n.of children disaggregated by age and gender, assets position, etc. (b) Include the 2002 national unemployment rate at district level, whether the community has a police station and the garbage
collection service, and living regional dummies

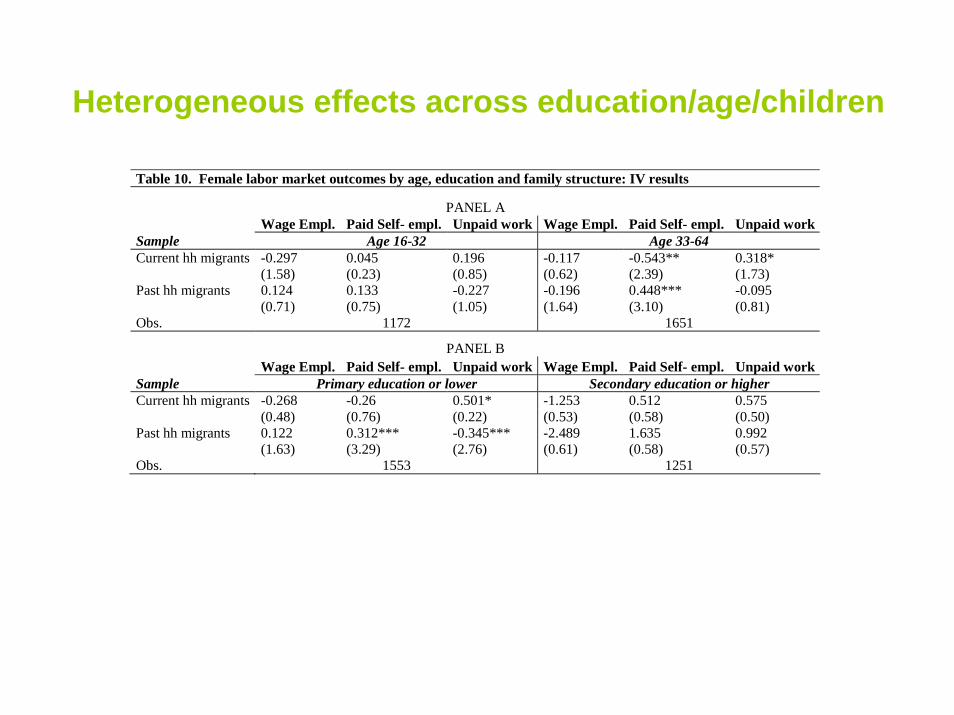
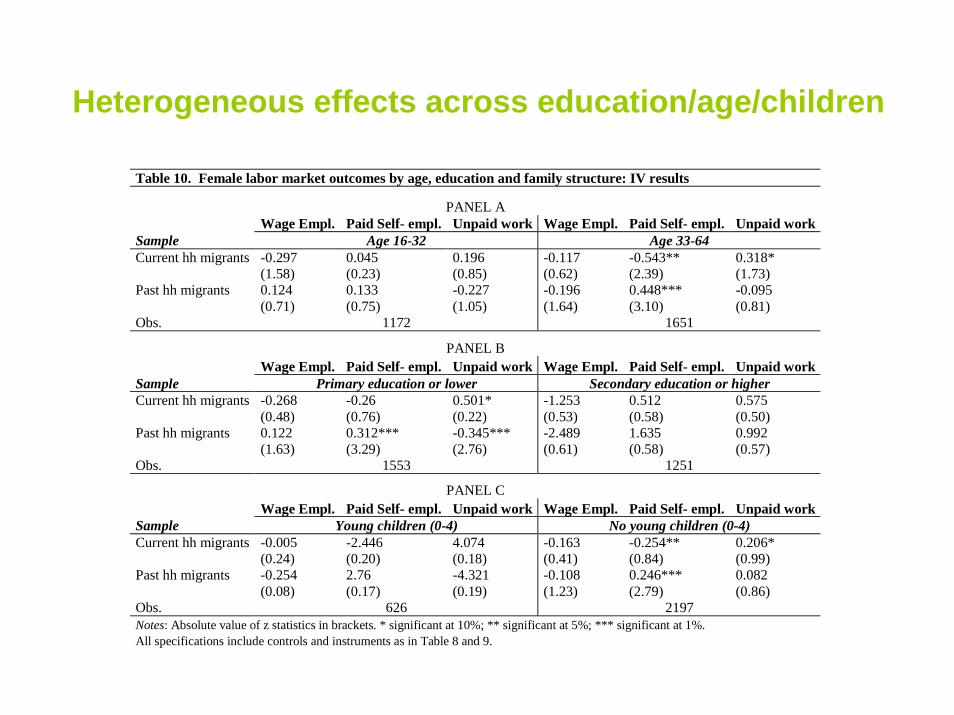
Heterogeneous effects across education/age/children
Table 10. Female labor market outcomes by age, education and family structure: IV results
PANEL A Wage Empl. Paid Self- empl. Unpaid work Wage Empl. Paid Self- empl. Unpaid workSample Age 16-32 Age 33-64 Current hh migrants -0.297 0.045 0.196 -0.117 -0.543** 0.318* (1.58) (0.23) (0.85) (0.62) (2.39) (1.73) Past hh migrants 0.124 0.133 -0.227 -0.196 0.448*** -0.095 (0.71) (0.75) (1.05) (1.64) (3.10) (0.81) Obs. 1172 1651
PANEL B Wage Empl. Paid Self- empl. Unpaid work Wage Empl. Paid Self- empl. Unpaid workSample Primary education or lower Secondary education or higher Current hh migrants -0.268 -0.26 0.501* -1.253 0.512 0.575 (0.48) (0.76) (0.22) (0.53) (0.58) (0.50) Past hh migrants 0.122 0.312*** -0.345*** -2.489 1.635 0.992 (1.63) (3.29) (2.76) (0.61) (0.58) (0.57) Obs. 1553 1251
PANEL C Wage Empl. Paid Self- empl. Unpaid work Wage Empl. Paid Self- empl. Unpaid workSample Young children (0-4) No young children (0-4) Current hh migrants -0.005 -2.446 4.074 -0.163 -0.254** 0.206* (0.24) (0.20) (0.18) (0.41) (0.84) (0.99) Past hh migrants -0.254 2.76 -4.321 -0.108 0.246*** 0.082 (0.08) (0.17) (0.19) (1.23) (2.79) (0.86) Obs. 626 2197 Notes: Absolute value of z statistics in brackets. * significant at 10%; ** significant at 5%; *** significant at 1%. All specifications include controls and instruments as in Table 8 and 9.

Conclusions
• Results show that male and female labor supplies respond differently to current and past family migration episodes
• Gender differentials in migration effects are robust to the income (remittance) effect
• Findings suggests that (over time) male-dominated Albanian migration may lead to a process of female empowering work-defined as the ability of women to access to local earning opportunities
• More disadvantaged women may gain more from this process• The gendered pattern of labor market outcomes in Albania may
have important (future) implications in terms of growth and gender equity.

Thank you!