gender differentials in agricultural production and decision-making among smallholders in ada
TRANSCRIPT

Gender Differentials in Agricultural
Production and Decision-Making Among
Smallholders in Ada, Lume, and
Gimbichu Woredas of theCentral Highlands of Ethiopia
Addis Tiruneh,
Teklu Tesfaye,
Wilfred Mwangi, and
Hugo Verkuijl
February 2001
Ethiopian AgriculturalResearch Organization
(EARO)

* Addis Tiruneh is with the Center for Education, Research and Training on Women in Development, of the Institute ofDevelopment Research (IDR)/Department of Economics at the Addis Ababa University in Ethiopia. Teklu Tesfaye is with theDebre Zeit Agricultural Research Centre of the Ethiopian Agricultural Research Organization. Wilfred Mwangi is a principaleconomist with the International Maize and Wheat Improvement Center (CIMMYT) and also Director of Agriculture, Ministryof Agriculture, Kenya. At the time this paper was drafted, Hugo Verkuijl was an associate scientist with CIMMYT, based inAddis Ababa, Ethiopia. The views presented in this paper are those of the authors and do not necessarily reflect policies oftheir respective organizations.
Gender Differentials in Agricultural
Production and Decision-Making
Among Smallholders in Ada, Lume,
and Gimbichu Woredas of the
Central Highlands of Ethiopia
Addis Tiruneh,
Teklu Tesfaye,
Wilfred Mwangi, and
Hugo Verkuijl*
February 2001
CIMMYT® (www.cimmyt.org) is an internationally funded, nonprofit, scientific research and training organization.Headquartered in Mexico, CIMMYT works with agricultural research institutions worldwide to improve the productivity,profitability, and sustainability of maize and wheat systems for poor farmers in developing countries. It is one of 16 foodand environmental organizations known as the Future Harvest Centers. Located around the world, the Future HarvestCenters conduct research in partnership with farmers, scientists, and policymakers to help alleviate poverty and increasefood security while protecting natural resources. The centers are supported by the Consultative Group on InternationalAgricultural Research (CGIAR) (www.cgiar.org), whose members include nearly 60 countries, private foundations, andregional and international organizations. Financial support for CIMMYT’s research agenda also comes from many othersources, including foundations, development banks, and public and private agencies.
Future Harvest® builds awareness and support for food and environmental research for a world withless poverty, a healthier human family, well-nourished children, and a better environment. It supports
research, promotes partnerships, and sponsors projects that bring the results of research to rural communities, farmers,and families in Africa, Asia, and Latin America (www.futureharvest.org).
International Maize and Wheat Improvement Center (CIMMYT) 2001. All rights reserved. The opinions expressed inthis publication are the sole responsibility of the authors. The designations employed in the presentation of materials inthis publication do not imply the expression of any opinion whatsoever on the part of CIMMYT or its contributoryorganizations concerning the legal status of any country, territory, city, or area, or of its authorities, or concerning thedelimitation of its frontiers or boundaries. CIMMYT encourages fair use of this material. Proper citation is requested.
Printed in Mexico.
Correct citation: A. Tiruneh, T. Tesfaye, W. Mwangi, and H. Verkuijl. 2001. Gender Differentials in AgriculturalProduction and Decision-Making Among Smallholders in Ada, Lume, and Gimbichu Woredas of the CentralHighlands of Ethiopia. Mexico, D.F.: International Maize and Wheat Improvement Center (CIMMYT) and EthiopianAgricultural Research Organization (EARO).
Abstract: This study provides concrete information about the role of gender in resource ownership and decision-making in the mixed farming systems of Ada, Lume, and Gimbichu woredas in the central highlands of Ethiopia. Amultistage purposive sampling method was used to select male-and female-headed households based on population,crops grown, altitude, and distance from the research center. Of a sample of 180 households, 81 (45%) were headed bywomen. On average, male-headed households (MHHs) were larger than female-headed households (FHHs). Male headsof households were more educated than female heads of household, and they owned more ox-plows and livestock. Theaverage area cultivated by MHHs was larger than that cultivated by FHHs for almost all crops. On the other hand, theaverage per capita land holding was almost equal between MHHs and FHHs. Both types of households acquired landthrough government allocation and used credit to purchase seed and fertilizer. Significant factors affecting gross value ofoutput for MHHs were the farmer’s age, family labor, farm size, livestock units, and inorganic fertilizer. The significantfactors affecting gross value of output for FHHs were family labor, farm size, livestock units, inorganic fertilizer, hiredlabor, and extension contact. The marginal value product (MVP) of family labor is higher in MHHs compared to its price(wage rate), but it is lower in FHHs, indicating that MHHs were able to increase their productivity by using more familylabor. The MVP of farm size was lower than its factor price for MHHs and higher for FHHs, indicating that FHHs couldincrease their productivity by cultivating more land. The MVP for inorganic fertilizer was higher than its factor cost forboth MHHs and FHHs, so both types of households could increase productivity by increasing their use of inorganicfertilizer. The gender difference in gross output was considerable, partly because FHHs used fewer inputs. If MHHs andFHHs had equal access to inputs, it is likely their levels of productivity would be similar. In 1997, about 59% of MHHsand 42% of FHHs grew wheat, and most of these grew local varieties (70% of MHHs and 86% of FHHs). A significantlyhigher proportion (t=5.7; p<0.05) of MHHs (30%) grew improved wheat varieties than FHHs (14%). In MHHs,extension services and farm size had a positive effect on the adoption of improved wheats, whereas radio ownership andfarm size increased the odds in favor of adopting improved wheats for FHHs.
ISBN: 970-648-061-7AGROVOC descriptors: Ethiopia; Production economics; Home economics; Plant production; Animal production;Farming systems; Farm management; Land management; Socioeconomic environment; Labour allocation; Workorganization; Technology transfer; Innovation adoption; Decision making; Role of women; Small farms; HighlandsAGRIS category codes: E16 Production Economics;
E14 Development Economics and PoliciesDewey decimal classification: 338.16

CONTENTS
Tables............................................................................................................................. ivFigures ........................................................................................................................... vAcronyms and abbreviations ............................................................................................viAcknowledgements ..........................................................................................................viExecutive Summary ........................................................................................................ vii
1.0 Introduction .................................................................................................................... 12.0 The Household Survey ..................................................................................................... 2
2.1 The Study Area ......................................................................................................................... 22.2 Methodology ............................................................................................................................. 3
3.0 Socioeconomic Characteristics ......................................................................................... 63.1 Household Characteristics .......................................................................................................... 63.2 Fertility Characteristics ............................................................................................................... 73.3 Household Amenities ............................................................................................................... 113.4 Farm Implements .................................................................................................................... 12
4.0 Gender Differentials in Farm Management Practices ........................................................ 134.1 Crop Production ..................................................................................................................... 134.2 Livestock Production ............................................................................................................... 224.3 Tree Crop Production .............................................................................................................. 26
5.0 Gender Differentials in Access to Land ............................................................................ 265.1 Land Rights ............................................................................................................................ 275.2 Land Acquisition ..................................................................................................................... 275.3 Land Quality ........................................................................................................................... 285.4 Decision-Making for Land Improvement, Acquisition, and Rental ................................................. 29
6.0 Gender Patterns of Labor Utilization ............................................................................... 306.1 Use of Family Labor in Crop Production ................................................................................... 306.2 Use of Family Labor in Livestock Production ............................................................................. 366.3 Use of Hired Labor in Crop Production ..................................................................................... 386.4 Use of Family Labor in Non-Agricultural Tasks ........................................................................... 40
7.0 Gender Differentials in Agricultural Production, Utilization, and Food Availability .............. 437.1 Methodology ........................................................................................................................... 447.2 Results and Discussion ............................................................................................................. 44
8.0 Gender Differentials in Agricultural Productivity .............................................................. 468.1 The Production Function ......................................................................................................... 478.2 Model Results ......................................................................................................................... 48
9.0 Gender Differentials in Technology Adoption ................................................................... 509.1 Factors Affecting the Adoption of Wheat Production Technologies .............................................. 509.2 Model Results ......................................................................................................................... 51
10.0 Gender Differentials in Access to Rural Institutions .......................................................... 5210.1 Credit Services ........................................................................................................................ 5210.2 Extension Services ................................................................................................................... 54
11.0 Conclusion and Policy Implications ................................................................................. 5811.1 Access to Resources ................................................................................................................ 5811.2 Division of Labor ..................................................................................................................... 5811.3 Decision-Making ..................................................................................................................... 5811.4 Adoption of Improved Wheat Varieties ...................................................................................... 5811.5 Gender Differentials in Agricultural Productivity .......................................................................... 59
References ............................................................................................................................ 61
iii

iv
TABLES
Table 1. Distribution of household types by production system, land area, and cropproduction in Ethiopia, 1983 .................................................................................................... 1
Table 2. Population size, density and area in Ada, Lume, and Gimbichu woredas, Ethiopia .......................... 3Table 3. Socioeconomic characteristics of households in Ada, Lume, and Gimbichu woredas, Ethiopia ......... 6Table 4. Statistics on childbearing and reproductive goals in Ada, Lume, and Gimbichu woredas, Ethiopia .... 7Table 5. Reasons for having or not having more children in Ada, Lume, and Gimbichu woredas, Ethiopia .... 8Table 6. Reasons that household members in MHHs gave for not sending girls to school in Ada, Lume,
and Gimbichu woredas, Ethiopia ................................................................................................ 8Table 7. Method and source of information for family planning in Ada, Lume, and
Gimbichu woredas, Ethiopia ...................................................................................................... 9Table 8. Childbearing and adoption data in Ada, Lume, and Gimbichu woredas, Ethiopia .......................... 10Table 9. Decision-making on the number of children and sending girls to school in Ada,
Lume, and Gimbichu woredas, Ethiopia .................................................................................... 10Table 10. Types of dwelling in Ada, Lume, and Gimbichu woredas, Ethiopia .............................................. 11Table 11. Household amenities of MHHs and FHHs in Ada, Lume, and Gimbichu woredas, Ethiopia ........... 12Table 12. Ownership of farm implements in Ada, Lume, and Gimbichu woredas, Ethiopia .......................... 12Table 13. Mean crop area cultivated (in kert) in Ada, Lume, and Gimbichu woredas, Ethiopia ...................... 13Table 14. Use of local and improved varieties in Ada, Lume, and Gimbichu woredas, Ethiopia ..................... 15Table 15. Farmers’ sources of information about improved varieties in Ada, Lume,
and Gimbichu woredas, Ethiopia .............................................................................................. 15Table 16. Farmers’ reasons for growing crops in Ada, Lume, and Gimbichu woredas, Ethiopia .................... 16Table 17. Average quantity of improved and local seed varieties used in Ada, Lume,
and Gimbichu woredas, Ethiopia .............................................................................................. 17Table 18. Mode of transport of farm products in Ada, Lume, and Gimbichu woredas, Ethiopia .................... 17Table 19. Fertilizer and insecticide use and farmers’ reasons for not using insecticides in Ada,
Lume, and Gimbichu woredas, Ethiopia .................................................................................... 18Table 20. Crop production constraints in Ada, Lume, and Gimbichu woredas, Ethiopia ............................... 19Table 21. Decision-making of households on sale and consumption of agricultural products in Ada,
Lume, and Gimbichu woredas, Ethiopia .................................................................................... 20Table 22. Responsibility for input use decisions in Ada, Lume, and Gimbichu woredas, Ethiopia .................. 21Table 23. Payment for farm inputs by gender of household heads in Ada, Lume,
and Gimbichu woredas, Ethiopia .............................................................................................. 22Table 24. Mean number of livestock owned and bought and cost of purchase (Birr) in Ada, Lume,
and Gimbichu woredas, Ethiopia .............................................................................................. 23Table 25. Livestock consumed and sold and their value (Birr) in Ada, Lume,
and Gimbichu woredas, Ethiopia .............................................................................................. 23Table 26. Costs of keeping livestock (Birr) in Ada, Lume, and Gimbichu woredas, Ethiopia .......................... 24Table 27. Responsibility for animal husbandry in Ada, Lume, and Gimbichu woredas, Ethiopia .................... 24Table 28. Reasons for keeping different types of livestock in Ada, Lume, and Gimbichu woredas, Ethiopia ... 25Table 29. Most important tree crop in Ada, Lume, and Gimbichu woredas, Ethiopia ................................... 26Table 30. Landholdings by gender of household head in Ada, Lume, and Gimbichu woredas, Ethiopia ......... 27Table 31. Methods of land acquisition by gender of household head in Ada, Lume,
and Gimbichu woredas, Ethiopia .............................................................................................. 28Table 32. Soil fertility status and irrigation of farmland in Ada, Lume, and Gimbichu woredas, Ethiopia ........ 29Table 33. Responsibility for decisions on land improvement, acquisition, and renting by gender
of household head in Ada, Lume, and Gimbichu woredas, Ethiopia ............................................. 30

Table 34. Division of household labor by gender and crop operation in Ada, Lume,and Gimbichu woredas, Ethiopia .............................................................................................. 31
Table 35. Division of family labor by gender and livestock production task in Ada, Lume,and Gimbichu woredas, Ethiopia .............................................................................................. 37
Table 36. Hired labor and reasons for not hiring labor in Ada, Lume, and Gimbichu woredas, Ethiopia ........ 38Table 37. Division of hired labor by gender and agricultural production tasks in Ada, Lume,
and Gimbichu woredas, Ethiopia .............................................................................................. 39Table 38. Divison of household labor by gender and non-agricultural tasks in Ada, Lume,
and Gimbichu woredas, Ethiopia .............................................................................................. 40Table 39. Mean quantities of agricultural production and consumption (quintal) by type of crop in Ada,
Lume, and Gimbichu woredas, Ethiopia .................................................................................... 45Table 40. Estimates of Cobb-Douglas production function by gender in Ada, Lume,
and Gimbichu woredas, Ethiopia .............................................................................................. 48Table 41. MVP and factor prices (in Birr) for significant variables by gender of household head in Ada,
Lume, and Gimbichu woredas, Ethiopia .................................................................................... 49Table 42. Parameter estimates of a logistic model for factors affecting adoption of improved wheat
varieties in Ada, Lume, and Gimbichu woredas, Ethiopia ........................................................... 51Table 43. Some selected variables on credit facilities by gender of household head in Ada, Lume,
and Gimbichu woredas, Ethiopia .............................................................................................. 53Table 44. Decision-making on the use and payment of credit by gender of household head in Ada,
Lume, and Gimbichu woredas, Ethiopia .................................................................................... 54Table 45. Type of extension services provided by gender of household head in Ada, Lume,
and Gimbichu woredas, Ethiopia .............................................................................................. 55Table 46. Selected variables on extension activities by gender of household head in Ada, Lume,
and Gimbichu woredas, Ethiopia .............................................................................................. 56Table 47. Gender of household heads with whom extension agents make contact in Ada, Lume,
and Gimbichu woredas, Ethiopia .............................................................................................. 56Table 48. Frequency of adopting recommended practices in Ada, Lume, and
Gimbichu woredas, Ethiopia .................................................................................................... 57Table 49. Is the household head a contact farmer, and reasons for wanting to be a contact farmer in Ada,
Lume, and Gimbichu woredas, Ethiopia .................................................................................... 57
FIGURES
Figure 1. Ada, Lume, and Gimbichu woredas, Ethiopia .............................................................................. 2Figure 2. Utilization of wheat by gender of household head in Ada, Lume, and
Gimbichu woredas, Ethiopia .................................................................................................... 46Figure 3. Utilization of tef by gender of household head in Ada, Lume, and
Gimbichu woredas, Ethiopia .................................................................................................... 46
v

ACKNOWLEDGEMENTS
We thank Efrem Bechere, former Vice-President for Research and Development of AlemayaUniversity of Agriculture; Tekalign Mamo and Negussie Taddesse, former Directors of the Debre ZeitAgricultural Research Centre (DZARC), for supporting this study. We would like to thank othercolleagues at DZARC who assisted in carrying out this study. Special thanks go to Gezahegn Ayele,who was one of the initiators of the project before he left for further studies, and HailemariamTeklewold for assisting in the fieldwork and data compilation.
The immense support given to the team by the offices of the Eastern Oromia Zone, AgriculturalDevelopment Offices of Ada, Lume, and Gimbichu woredas, and the co-operation of thedevelopment agents and officials of the surveyed Peasant Associations is highly appreciated.
We are grateful to the CIMMYT-European Union Project on Strengthening Economics and PolicyResearch in National Agricultural Research Systems in Eastern Africa for funding this project. Weappreciate the editorial assistance of Satwant Kaur in producing this paper, and Marcelo Ortiz forlayout and design.
Our deepest and heartfelt thanks go to the men and women farmers who willingly spared their timefor interviews and shared their experiences generously, and the enumerators who walked during therainy and dry seasons through the villages.
ACRONYMS AND ABBREVIATIONS
CSA Central Statistical Authority
CIMMYT International Maize and Wheat Improvement Center
DZARC Debre Zeit Agricultural Research Center
EARO Ethiopian Agricultural Research Organisation
FAO Food and Agricultural Organization
FHHs Female-Headed Households
FDRE Federal Democratic Republic of Ethiopia
GDP Gross Domestic Product
IDR Institute of Development Research
MHHs Male-Headed Households
MVP Marginal Value Product
OLS Ordinary Least Squares
PA Peasant Association
TBA Traditional Birth Attendant
UNDP United Nations Development Program
WHO World Health Organization
vi

vii
EXECUTIVE SUMMARY
Gender analysis has been at the heart of many studies which have sought to outline the complexity,flexibility, and political aspects of access to and control of resources. It is recognized and empiricalevidence indicates that women do play an important role in decision-making in agriculture and in theadoption of agricultural technologies. The transfer and adoption of agricultural technologies istherefore affected by who owns productive resources and who decides what to produce, when toproduce, and how much to produce. Information provided through research is, therefore, vital forpolicymakers to be informed of the basis on which decisions are made at the micro-level. This type ofinformation is lacking in Ethiopia, and this study attempts to fill that gap and provide concrete andstatistical information about gender’s role in agricultural production and decision-making in thehousehold economy. The main focus of the research was to assess the role of gender in terms ofresource ownership and decision-making power in the mixed farming systems of Ada, Lume, andGimbichu woredas in the central highlands of Ethiopia.
A multi-stage purposive sampling method was used to select male- and female-headed households.The households were selected based on the total population, types of crops grown, altitude, anddistance from the research center. Out of a sample of 180 households, 81 (45%) were headed byfemales. Female-headed households (FHHs) were those that were managed by a widowed, divorced,or single woman without the mediation of a husband, father, or male relative in the routine day-to-day activities of that household. Male-headed households (MHHs) were those where a husband waspresent and was the final decision-maker in important issues pertaining to the household (Starkey etal. 1994). The survey was carried out during the cropping season of 1997.
Survey results indicated a range of similarities and differences among FHHs and MHHs. The averagesize of MHHs was larger than FHHs, and male heads of household were more educated than femaleheads of household. In MHHs, the decision to have more children was made jointly by husband andwife. With respect to wealth and resource ownership, both MHHs and FHHs lived in thatched roofhouses, but the number of ox plows owned by MHHs was significantly higher than FHHs and theywere therefore better able to prepare their land. The mean number of livestock owned by MHHs washigher than FHHs.
The average area cultivated by MHHs was larger than FHHs for almost all crops. The main cropcultivated in Ada and Lume was tef, while in Gimbichu it was wheat. In Ada, both types ofhouseholds grew only local tef varieties, while 53% and 58% of the MHHs and FHHs in Lume,respectively, grew both local and improved varieties. In Lume, more MHHs (38.7%) grew improvedwheat varieties than FHHs (22.2%). In Ada, both types of households learned about improvedvarieties through extension services provided by the Ministry of Agriculture; in Lume 52.6% of FHHslearned about improved varieties from the market and 47% of MHHs through the extension service.In almost all FHHs it was the head who decided what to plant. In MHHs, it was mostly a jointdecision by the head and wife in Ada (48.4%) and Gimbichu (54.4%), while in Lume (83.3%) it wasthe head who decided. The mean daily energy production per person per day was about 2,278 and2,291 calories for MHHs and FHHs, respectively.

All MHHs and FHHs used fertilizer. For MHHs, this was a joint decision in Ada (50%), and ahousehold head decision in Lume (97.1%) and Gimbichu (59.4%). In FHHs, the head decided onthe use of fertilizer. About 38% and 44% of MHHs and FHHs in Ada, 66% and 50% in Lume, and21% and 4% in Gimbichu, respectively, used herbicides. Both male and female heads of householddecided on the use of herbicides.
The average per capita landholding was almost equal between MHHs and FHHs, and they acquiredtheir land from the government. MHHs indicated that their land was more fertile than FHHs. About68%, 100%, and 61% of male heads of household were responsible for deciding whether toimprove land in Ada, Lume, and Gimbichu, respectively. In FHHs, the majority of heads ofhousehold in Ada (96%), Lume (96%) and Gimbichu (100%) decided whether to improve land. Thedecision to lend land in Lume was the full responsibility of the wife in MHHs, while in Gimbichu itwas a joint decision between the husband and wife (75%). In FHHs in Gimbichu, the head and theson decided whether to lend land. The average amount of labor (h/ha) used for crop productionwas higher for MHHs than FHHs. Also, MHHs hired more labor for crop production than FHHs.Wives and daughters in MHHs and heads and daughters in FHHs were primarily responsible fornon-agricultural tasks.
Most farmers obtained credit to purchase seed and fertilizer from the Ministry of Agriculture. Manyfarmers were also members of a service cooperative that helped them obtain inputs. The decisionto use credit was made primarily by the male and female heads of household in Lume andGimbichu. In Ada, the decision to use credit was made jointly in MHHs, while most female heads ofhousehold decided whether to obtain credit. More MHHs had access to extension services thanFHHs, and extension contact actually had a negative effect on FHHs’ use of recommendedtechnology.
Analysis based on the Cobb-Douglas production function indicated that variation in gross value ofoutput per hectare associated with the factors of production was 72% and 82% in MHHs andFHHs, respectively. The significant factors affecting gross value of output for MHHs were thefarmer’s age, family labor, farm size, livestock units, and inorganic fertilizer. The significant factorsaffecting gross value of output for FHHs were family labor, farm size, livestock units, inorganicfertilizer, hired labor, and extension contact.
The marginal value product (MVP) of family labor compared to its price (wage rate) is higher inMHHs and lower in FHHs, which indicates that MHHs could increase their productivity by usingmore family labor. On the other hand, the MVP for farm size was lower than its factor price inMHHs and higher in FHHs. Thus, FHHs could increase their productivity by cultivating more land.The MVP for inorganic fertilizer was higher than its factor cost for both MHHs and FHHs, whichindicates that both types of household could increase their productivity by increasing the use ofinorganic fertilizer.
The gender difference in gross output was considerable. MHHs had a gross output of Birr 6,456/ha, while FHHs had a gross output of Birr 4,776/ha. These differences can be explained partly by
viii

the lower quantities of inputs used by FHHs. The use of average values of these inputs fromMHHs resulted in a gross output of Birr 6,541/ha for FHHs—1.3% higher than MHHs. Thissuggests that no productivity differences would have existed between both households if they hadequal access to inputs.
In 1997, about 59% and 42% of MHHs and FHHs, respectively, grew wheat. Local wheatvarieties were grown by 70% and 86% of MHHs and FHHs, respectively. A significantly higherproportion (t=5.7; p<0.05) of MHHs (30%) grew improved wheat varieties than FHHs (14%).The logit model explains 84% and 89% of the total variation specified in the model for MHHs andFHHs, respectively. The chi-square indicates that the parameters are significantly different fromzero at the 1% level for both households. In MHHs, extension services and farm size had apositive effect on the adoption of improved wheat varieties, while radio ownership and farm sizeincreased the odds in favor of adoption of improved wheat varieties in FHHs.
On the whole, the study found that the MHHs and FHHs in the three woredas had differences inendowments (land rights, education) and differential access to technologies, factors of production,and support services. These differences had implications for the productivity levels and adoptioncapacities of both types of households.
To address some of these differences, efforts should be made to provide credit and improve thesupply of preferred improved seed in time for planting. It is also recommended that technologiesshould take into account the resource base of female farmers; extension services should betargeted specifically to them; and the decision-making power of female household heads should beharnessed by exposing them to different opportunities.
ix

Gender Differentials in Agricultural Production andDecision-Making Among Smallholders in Ada, Lume, andGimbichu Woredas of the Central Highlands of Ethiopia
Addis Tiruneh, Teklu Tesfaye, Wilfred Mwangi, and Hugo Verkuijl
1.0 INTRODUCTION
This study is an attempt to address the lack of concrete and statistical information on gender roles inagricultural production and decision-making in the household economy of Ethiopia, focusingprimarily on the role of gender in resource ownership and decision-making power in the mixedfarming systems of Ada, Lume, and Gimbichu woredas in the central highlands.
Agriculture is a dominant sector in Ethiopia. It contributes 51% to the GDP, employs nearly 80% ofthe total labor force and generates the bulk of foreign exchange. Smallholder farms are predominantand account for more than 90% of agricultural production and over 95% of the total area undercultivation (Table 1). However, given the poor performance of the agricultural sector vis-à-vis thegrowing population — estimated at over 55 million and growing at a rate of 3% per annum—theintensification of agriculture is very critical. As a result, there has been an overall effort to increaseagricultural productivity to meet the growing food demand.
Much valuable research already exists on the different roles of women and men in various farmactivities and non-farm activities like food preparation, household maintenance, and childcare, andthere is now growing recognition that they often have very different rights and responsibilities withrespect to resource use (Adepoju and Oppong 1994; Bryceson 1995; Dey 1981; McSweeny 1979;Whitehead 1985). The transfer and adoption of agricultural technologies is affected by who ownsproductive resources and who decides what to produce, when to produce, and how much toproduce. Empirical evidence show that women do play a greater role than previously thought indecision-making in agriculture and in the adoption of agricultural technologies. Information providedthrough research is vital for policymakers to be informed of the basis on which decisions are made atthe micro-level.
Table 1. Distribution of household types by production system, land area, and crop production in Ethiopia, 1983
Production of major Production of
Households Cultivated areafood grains all cropsa
(% of cultivated (% of cultivated(No.) (%) (ha) (%) area) area)
Smallholders 8,206,000 98.7 5,987,000 94.7 95.1 94.4Producer cooperatives 94,000 1.1 114,000 1.8 1.9 2.0State farms 18,000 0.2 222,000 3.8 3.0 3.6
Source: Cohen and Isaksson (1988); cited in Franzel (1993).a Excluding coffee.
1

Gender also constitutes an important factor in the growing trend of widening disparities in thedistribution of income and assets in many low-income countries, which reflects both the erosion oftraditional rights of access to resources and increasing population pressures. Female-headedhouseholds (FHHs) typically have a much smaller asset base than male-headed households (MHHs),and it is not coincidental that relative poverty in the sense of relative deprivation bears most heavilyon women (Dasgupta 1993; UNDP 1990).
While gender is culture neutral, interest in gender relations also derives from gender's explanatorypower as a primary organizing principle of society, including agricultural society. For this study, welook at gender not as a means of categorizing household headship, but as a basic key tounderstanding structures and actions, including production relationships within and acrosshouseholds, goal setting and priorities, mobilization of resources, willingness to take risks, and thedecision-making process vis-à-vis the rights to benefits derived from increased farm production.
The specific objectives of the research were to:• Look into the structure and patterns of production and composition of crops grown, farm sizes
and tenure arrangements, types of technology used, and distribution of output across producersand end-users.
• Take stock of the different access of male and female farmers to resources—land, credit, andtechnology.
• Estimate production functions using both conventional inputs like land, labor, capital, andpurchased inputs, and non-conventional inputs like education, extension, and infrastructure.
• Test the heterogeneity of labor—adult male labor, adult female labor, child labor, hired male labor,hired female labor, and hired child labor.
• Compare differences in managerial efficiency and decision-making power between male andfemale household heads.
• Determine how socioeconomic factors and infrastructure contribute to the adoption oftechnology.
2.0 THE HOUSEHOLD SURVEY
2.1 The Study Area
Ada, Lume, and Gimbichuworedas were selected as studyareas because their accessibilityfacilitated the organization andmonitoring of the field study(Figure 1). Ada woreda, about 40km southeast of Addis Ababa,covers 1,750 km2; two-thirds ofthis area lies above 1,800 m(Gryseels and Anderson 1983).
Map?
2

Much of the land in Ada is eroded and poorly drained. July and August are the wettest months of theyear and April and May are the hottest. The major soil type is vertisol and major crops are tef, wheat,barley, faba beans, chickpeas, and lentils (Workneh Negatu 1989).
Lume woreda lies northeast of Debre Zeit at an altitude ranging from 1,700 to 2,100 m. July andAugust are the wettest months and April, May, and June are the hottest. The major soil type is vertisol.The major crops grown are tef, wheat, haricot beans, maize, chickpeas, barley, and faba beans.
Gimbichu woreda, at an average altitude of 2,450 m, borders Ada on the northern side of Debre Zeit.July and August are, on average, the wettest months. The major soil type is vertisol and the majorcrops grown are wheat, tef, chickpeas, and faba beans.
The male-female ratio in all three areas is almost 1:1 (Table 2).
2.2 Methodology
“Household,” “gender,” or other social constructs influence the way in which field research isstructured. Experience has shown that both “household” and “gender” have practical value asconceptual frameworks around which to structure field research. An appropriate balance must,however, be struck between adopting practical research methodologies and accurately describing thecomplexity of African rural society (Warner, Hassan, and Kydd 1997).
Since the choice of research methodology depends on the goals of each particular research project, theresources available, time constraints, and a host of other factors, it is not appropriate to advocate oneresearch approach over others. It is vital to chose methods that make it possible to elicit as muchinformation as possible about individual members of rural societies, rather than to choose methodsbased on preconceptions of the significance of any one social construct (Warner, Hassan, and Kydd1997).
Boserup was one of the first scholars to provide a comparative analysis of women’s work based on datafrom a wide range of societies. In her 1970 book, Women’s Role in Economic Development, sheemphasized that in spite of sex-role stereotyping and cross-cultural regularities in the sexual division oflabor, women’s work differs from society to society.
In much of the anthropological literature, “household” is the term used to refer to the basic unit ofsociety involved in production, reproduction, consumption, and socialization. The exact nature and
Table 2. Population size, density and area in Ada, Lume, and Gimbichu woredas, Ethiopia
Population
Woreda Male Female Total Density Area (km2)
Lume 56,849 53,518 110,367 155.5 709.85Gimbichu 36,754 35,236 71,990 101.8 707.49Ada 141,265 137,837 279,102 170.7 1,635.16
Source: FDRE, CSA. Statistical Abstract, Ethiopia (1998).
3
function of the household clearly varies from culture to culture and in different periods, but theanthropological definition usually rests on what the people themselves regard as the significant unitof their society. It is important to recognize that although recruitment to households is oftenthrough kinship and marriage, household units are not necessarily the same as family units. Leavingaside the definitional difficulties, households are important in feminist analysis because theyorganize a large part of women’s domestic/reproductive labor. As a result, both the compositionand the organization of households have a direct impact on women’s lives, and in particular ontheir ability to gain access to resources, labor, and income (Moore 1988).
Female-headed and female-centered domestic groups have been identified in a wide range ofcommunities all over the world (Smith 1973; Tanner 1974), and FHHs have emerged in increasingnumbers in recent times. It is important to consider under what conditions—social, economic,political, and ideological—FHHs become a significant proportion of the total number ofhouseholds. The evidence is complex, but it seems that FHHs are more common in situations ofurban poverty, in societies with a high level of male labor migration, and in situations where generalinsecurity and vulnerability prevail (Youssef and Hefler 1983; Merrick and Schmink 1983).
In Africa, preliminary studies from rural areas and national sample survey data suggest that theincidence of FHHs varies inversely with the economic potential of the area. Incidence tends to behigh in areas where agricultural productivity is low, either due to population pressure or unfavorableecological factors. For example, a study conducted by Chipande (1987) in the Lilongwe LandDevelopment Program, Malawi, an area of very high agricultural potential, showed that womenheaded only 16% of the 160 households sampled. These households were largely composed ofolder women (45 years and over) who were mostly widowed, divorced, single, or living alone orwith their unmarried children. The prevailing view in the literature is that this trend results frommale labor migration. It is clear that in some rural economies the strain placed on conjugal relationsby the exploitation of rural areas as labor reserves is producing an enormously high proportion ofFHHs (Murray 1981; Bush, Cliffe, and Jansen 1986).
In addition to male labor migration, there is evidence that increasing socioeconomic differentiationin rural communities is producing FHHs (Cliffe 1978). Changes in kinship systems and in theorganization of agricultural production have meant that many poorer women have lost the securityprovided by former kinship networks and relationships.
It is true that FHHs are very poor, but as Peters (1994) points out, this is not the case for all ofthem, and we have to be very careful to avoid any analytical illusion: lack of males = FHHs =marginal = poor. The situation is more complex and requires more research. For example, there isevidence from Africa and other parts of the world that some women are choosing not to marry(Allison 1986; Nelson 1978; Obbo 1980) and that significant numbers of married women arechoosing to live separately from their husbands (Bukh 1979). This trend is perhaps more a featureof urban than rural life, but it highlights the dangers of easy generalization and reinforces theimportance of historically and socially grounded research.
4

When households headed by women are taken into account, total female participation in agricultureis greater in all developing regions. It is important to consider the role of headship because availabledata show that female headship is relatively high and increasing in many places. In sub-SaharanAfrica, for example, it is estimated that women head one-fourth of rural households; in some areasthey head almost half (Due and Gladwin 1991). In Central America, nearly 20% of rural householdsare headed by women (Yudelman 1994), and in Bangladesh the proportion of FHHs rose from 5-7%to 16% over 20 years (Mekra 1995).
Women become household heads as a result of death, divorce, separation, and, increasingly, malemigration, with the frequent result that more women participate in the labor force. For instance,women’s participation in agriculture in Tunisia more than doubled between 1970 and 1985 becausemale migration from rural areas left women as household heads (United Nations 1989) who werefully responsible for farm production and management. The type and variety of farm tasks performedby women may also increase, as well as their role in decision-making. Staudt (1979) found this to bethe case in 40% of farms headed by women in two areas of western Kenya.
A multi-stage sampling method was used for this study to select male- and female-headed households.Formal contacts were made with officials in Peasant Associations (PAs). Informal contacts were madewith farmers in different PAs in the three woredas to supplement secondary information gatheredprior to the actual survey. After collection of the secondary data and the preliminary survey, thesample PAs were selected. Selection was based on total population, types of crops grown, altitude,and distance from the center of the Ministry of Agriculture.
In each woreda, 60 households were selected from six centers of the Ministry of Agriculture. Out ofthe three PAs, ten households were selected, among which three were headed by women. The list ofde jure female household heads was made purposively, but the samples were selected randomlyusing the prepared list to make sure that the women selected were full-time farmers. In general, thehouseholds were more or less homogeneous in types of crops grown, farming operations, and socio-economic characteristics. Enumerators were recruited and trained to administer a formalquestionnaire. The survey was conducted after the cropping calendar in the three woredas, with closesupervision.
Of a sample of 180 households, 81 (45%) were headed by females. FHHs were defined ashouseholds managed by a widowed, divorced, or a single woman without the mediation of ahusband, father, or male relative in the routine day-to-day activities of that household. MHHs werethose in which a husband was present and was the final decision-maker in the important issuespertaining to the household (Starkey, Mweamyae amd Stares 1994).
Researchers developed the questionnaire in November 1995 and it was pre-tested in February 1996.The questionnaire had four different and related parts designed to fit in the different agriculturalactivities phase by phase. The information gathered during the pre-testing was used to modify thequestionnaire. Part one was pre-tested with assistance from development agents in the three PAs perworeda. After the pre-testing, the questionnaire was modified to its final version.
5

3.0 SOCIOECONOMIC CHARACTERISTICS
3.1 Household Characteristics
Of the180 households interviewed across the three woredas, 99 (55%) were headed by males and 81(45%) were headed by females. Table 3 shows the socioeconomic characteristics of households in Ada,Lume, and Gimbichu. On average, MHHs had larger households and more family members (sons,daughters, relatives, and non-relatives1) than FHHs in all three woredas. The average number ofdaughters was significantly higher in MHHs than FHHs.This situation is similar in most developingcountries where FHHs have been found to be smaller than MHHs (Buvinic and Gupta 1997). Theaverage age of the head in MHHs was about 43, 47, and 51 years in Ada, Lume, and Gimbichu,respectively; in FHHs it was about 46, 51, and 47 years.
Table 3. Socioeconomic characteristics of households in Ada, Lume, and Gimbichu woredas, Ethiopia
Ada Lume Gimbichu
MHH FHH MHH FHH MHH FHH
Characteristic (Respondents) (Respondents) (Respondents) (Respondents) (Respondents) (Respondents)
Household size (No.) 8.1 – 6.5 – 7.6 – 5.5 – 7.8 – 5.6 –Sons 3.0 – 2.5 – 2.8 – 2.3 – 2.4 – 2.6 –Daughters 2.7 – 2.0 – 2.4 – 1.6 – 3.1 – 2.2 –Relatives 1.2 – 2.1 – 1.8 – 1.1 – 1.9 – 1.8 –Non-relatives 1.4 – 1.8 – 1.6 – 1.4 – 1.8 – 1.6 –
Age of head (yr) 43.4 – 45.6 – 46.7 – 50.5 – 51.4 – 47.2 –Education of head (%)
Illiterate 28.1 9 50.0 14 17.1 6 70.8 17 48.5 16 85.2 23Literacy class 40.6 13 46.4 13 48.6 17 29.2 7 30.3 10 11.1 3Primary school 28.1 9 – – 28.6 10 – – 12.1 4 3.7 1Secondary school 3.1 1 3.6 1 5.7 2 – – 9.1 3 – –
Education of wife (%)Illiterate 37.5 12 – – 47.1 16 – – 48.4 15 – –Literacy class 50.0 16 – – 47.1 16 – – 48.4 15 – –Primary school 9.4 3 – – 5.9 2 – – 3.2 1 – –Secondary school 3.1 1 – – – – – – – – – –
Education of son (%)Illiterate 61.8 21 38.2 13 58.3 14 41.7 10 100.0 31 100.0 29Literacy class 59.1 13 40.9 9 57.1 12 42.9 9 – – – –Primary school 54.5 6 45.5 5 81.8 9 18.2 2 – – – –Secondary school 45.5 5 54.5 6 45.5 5 54.5 6 – – – –
Education of daughter (%)Illiterate 65.5 19 34.5 10 69.6 16 30.4 7 100.0 31 100.0 29Literacy class 57.9 11 42.1 8 36.4 4 63.6 7 – – – –Primary school 40.0 2 60.0 3 80.0 4 20.0 1 – – – –Secondary class 54.4 3 55.6 5 20.0 1 80.0 4 – – – –
Religion (%)Christian 100.0 32 100.0 28 100.0 35 100.0 24 100.0 33 96.3 26Muslim – – – – – – – – – – 3.7 1
Ethnic group (%)Oromo 71.1 22 64.0 18 74.3 26 87.5 21 90.6 29 96.3 26Amhara 29.0 9 36.0 10 25.7 9 12.5 3 9.4 3 3.7 1
Marital status of head (%)Married 96.9 31 3.6 1 97.1 34 4.2 1 78.8 26 – –Single 3.1 1 35.7 10 2.9 1 – – 18.2 6 3.8 1Divorced – – 7.1 2 – – 20.8 5 – – 15.4 4Widowed – – 53.6 15 – – 75.0 18 – – 80.8 21
1 Non-relatives refer to those who live in the household but are not related to the husband or wife.
6
MHHs and FHHs in all three woredas showed significant difference in access to education andliteracy. This scenario is also found in some African countries. In Uganda, for instance, more thanhalf of the female household heads received no schooling compared to less than a quarter of theirmale counterparts (Appleton 1996, Bisanda and Mwangi 1996). All farmers in MHHs and FHHs inAda and Lume were Christians; in Gimbichu 3.7% of FHHs were Muslims. The dominant ethnicgroups were Oromo and Amhara. The proportion of MHHs whose ethnic group is Oromo isgreater than that of Amhara in all the woredas. The marital status of household heads differedwidely between MHHs and FHHs.
3.2 Fertility Characteristics
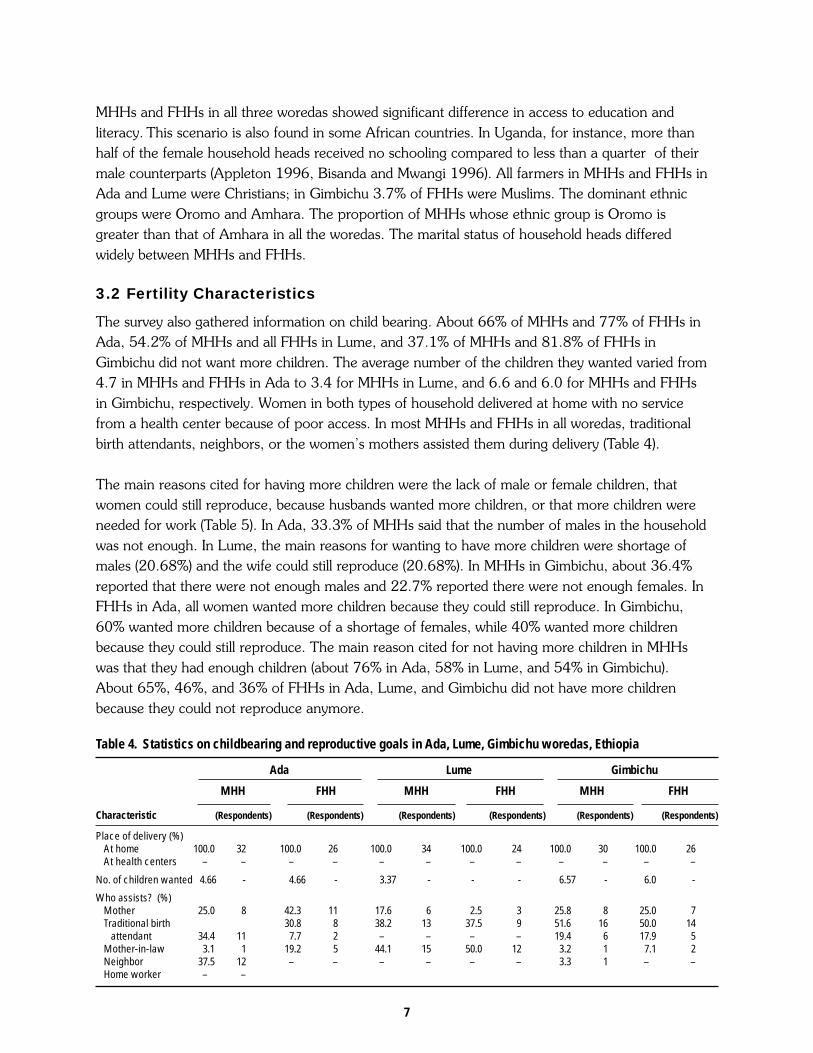
The survey also gathered information on child bearing. About 66% of MHHs and 77% of FHHs inAda, 54.2% of MHHs and all FHHs in Lume, and 37.1% of MHHs and 81.8% of FHHs inGimbichu did not want more children. The average number of the children they wanted varied from4.7 in MHHs and FHHs in Ada to 3.4 for MHHs in Lume, and 6.6 and 6.0 for MHHs and FHHsin Gimbichu, respectively. Women in both types of household delivered at home with no servicefrom a health center because of poor access. In most MHHs and FHHs in all woredas, traditionalbirth attendants, neighbors, or the women’s mothers assisted them during delivery (Table 4).
The main reasons cited for having more children were the lack of male or female children, thatwomen could still reproduce, because husbands wanted more children, or that more children wereneeded for work (Table 5). In Ada, 33.3% of MHHs said that the number of males in the householdwas not enough. In Lume, the main reasons for wanting to have more children were shortage ofmales (20.68%) and the wife could still reproduce (20.68%). In MHHs in Gimbichu, about 36.4%reported that there were not enough males and 22.7% reported there were not enough females. InFHHs in Ada, all women wanted more children because they could still reproduce. In Gimbichu,60% wanted more children because of a shortage of females, while 40% wanted more childrenbecause they could still reproduce. The main reason cited for not having more children in MHHswas that they had enough children (about 76% in Ada, 58% in Lume, and 54% in Gimbichu).About 65%, 46%, and 36% of FHHs in Ada, Lume, and Gimbichu did not have more childrenbecause they could not reproduce anymore.
Table 4. Statistics on childbearing and reproductive goals in Ada, Lume, Gimbichu woredas, Ethiopia
Ada Lume Gimbichu
MHH FHH MHH FHH MHH FHH
Characteristic (Respondents) (Respondents) (Respondents) (Respondents) (Respondents) (Respondents)
Place of delivery (%)At home 100.0 32 100.0 26 100.0 34 100.0 24 100.0 30 100.0 26At health centers – – – – – – – – – – – –
No. of children wanted 4.66 - 4.66 - 3.37 - - - 6.57 - 6.0 -
Who assists? (%)Mother 25.0 8 42.3 11 17.6 6 2.5 3 25.8 8 25.0 7Traditional birth 30.8 8 38.2 13 37.5 9 51.6 16 50.0 14 attendant 34.4 11 7.7 2 – – – – 19.4 6 17.9 5Mother-in-law 3.1 1 19.2 5 44.1 15 50.0 12 3.2 1 7.1 2Neighbor 37.5 12 – – – – – – 3.3 1 – –Home worker – –
7
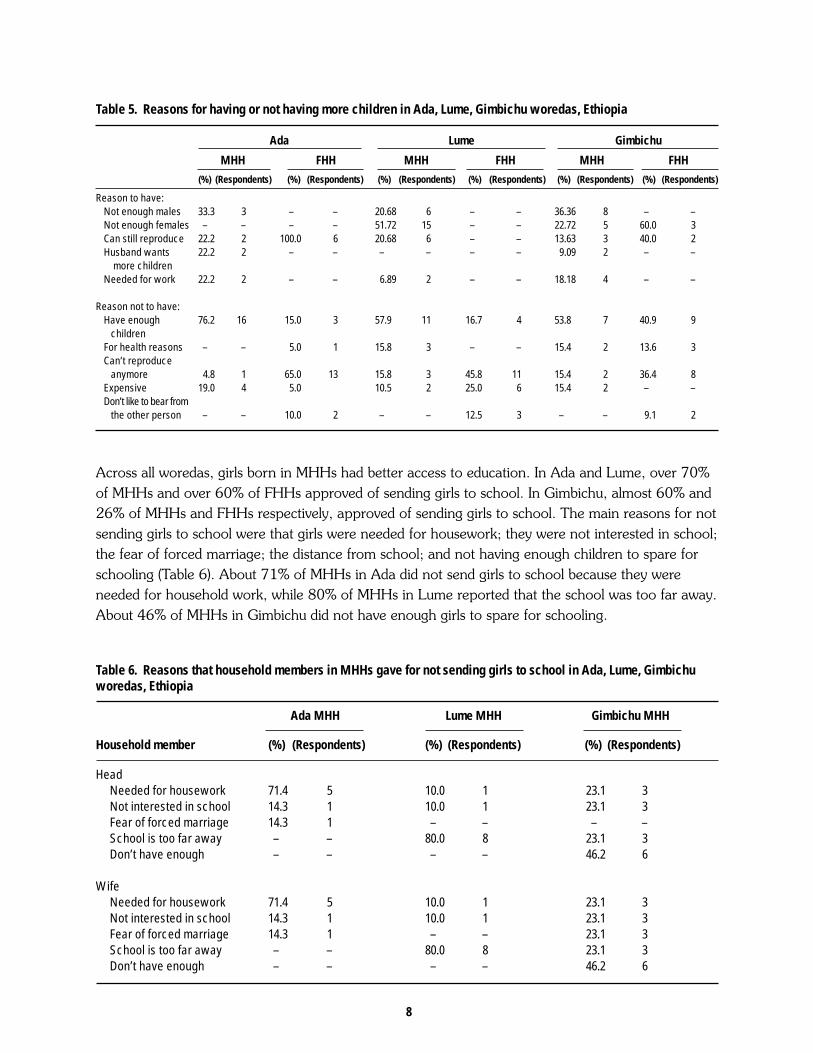
Across all woredas, girls born in MHHs had better access to education. In Ada and Lume, over 70%of MHHs and over 60% of FHHs approved of sending girls to school. In Gimbichu, almost 60% and26% of MHHs and FHHs respectively, approved of sending girls to school. The main reasons for notsending girls to school were that girls were needed for housework; they were not interested in school;the fear of forced marriage; the distance from school; and not having enough children to spare forschooling (Table 6). About 71% of MHHs in Ada did not send girls to school because they wereneeded for household work, while 80% of MHHs in Lume reported that the school was too far away.About 46% of MHHs in Gimbichu did not have enough girls to spare for schooling.
Table 6. Reasons that household members in MHHs gave for not sending girls to school in Ada, Lume, Gimbichuworedas, Ethiopia
Ada MHH Lume MHH Gimbichu MHH
Household member (%) (Respondents) (%) (Respondents) (%) (Respondents)
Head Needed for housework 71.4 5 10.0 1 23.1 3 Not interested in school 14.3 1 10.0 1 23.1 3 Fear of forced marriage 14.3 1 – – – – School is too far away – – 80.0 8 23.1 3 Don’t have enough – – – – 46.2 6
Wife Needed for housework 71.4 5 10.0 1 23.1 3 Not interested in school 14.3 1 10.0 1 23.1 3 Fear of forced marriage 14.3 1 – – 23.1 3 School is too far away – – 80.0 8 23.1 3 Don’t have enough – – – – 46.2 6
Table 5. Reasons for having or not having more children in Ada, Lume, Gimbichu woredas, Ethiopia
Ada Lume Gimbichu
MHH FHH MHH FHH MHH FHH
(%) (Respondents) (%) (Respondents) (%) (Respondents) (%) (Respondents) (%) (Respondents) (%) (Respondents)
Reason to have:Not enough males 33.3 3 – – 20.68 6 – – 36.36 8 – –Not enough females – – – – 51.72 15 – – 22.72 5 60.0 3Can still reproduce 22.2 2 100.0 6 20.68 6 – – 13.63 3 40.0 2Husband wants 22.2 2 – – – – – – 9.09 2 – – more childrenNeeded for work 22.2 2 – – 6.89 2 – – 18.18 4 – –
Reason not to have:Have enough 76.2 16 15.0 3 57.9 11 16.7 4 53.8 7 40.9 9 childrenFor health reasons – – 5.0 1 15.8 3 – – 15.4 2 13.6 3Can’t reproduce anymore 4.8 1 65.0 13 15.8 3 45.8 11 15.4 2 36.4 8Expensive 19.0 4 5.0 10.5 2 25.0 6 15.4 2 – –Don’t like to bear from the other person – – 10.0 2 – – 12.5 3 – – 9.1 2
8

Table 7. Method and source of information for family planning in Ada, Lume, Gimbichu woredas, Ethiopia
Ada Lume Gimbichu
MHH FHH MHH FHH MHH FHH
(%) (Respondents) (%) (Respondents) (%) (Respondents) (%) (Respondents) (%) (Respondents) (%) (Respondents)
Family planning 3.1 1 – – 34.3 12 8.3 2 3.0 1 3.7 1
Method:Pills 100.0 1 – – 75.0 9 100.0 2 – – – –Traditional method – – – – 25.0 3 – – 100.0 1 100.0 1
Source of information:Family planning 100.0 1 – – 91.7 11 100.0 2 – – – –Mass media – – – – 8.3 1 – – – – – –Friends and relatives – – – – – – – – 100.0 1 100.0 1
About 3% of MHHs in Ada and Gimbichu and 34% of MHHs in Lume practiced family planning, whilenone of the FHHs in Ada, 8.3% in Lume, and 3.7% in Gimbichu practiced family planning. Of thosefarmers practicing family planning in Lume, all FHHs and 75% of MHHs used birth control pills. Themost important source of information for contraception was the family planning office (Table 7).
Table 8 shows numbers of boys and girls who were born, adopted, and died; age at first marriage andpregnancy; age at last pregnancy; and the numbers of adopted girls and boys. On average, more girlswere born in MHHs than FHHs. About 1.5 boys and girls died in both types of households. Theaverage age at first marriage was higher for MHHs than FHHs. In all woredas, girls married when theywere teenagers, perhaps because of the prevailing culture of girls marrying while they are young. Theaverage age of heads at first marriage was 21.9, 22.5, and 22.1 in MHHs and 15.1, 15.3, and 16.8in FHHs in Ada, Lume, and Gimbichu, respectively. The average age of first marriage of the wife was15.9, 16.8, and 16.9 in Ada, Lume and Gimbichu, respectively. The average age at first pregnancywas 23.5, 24.2, and 24.1 in MHHs and 17.9, 19.3, and 19.3 in FHHs in Ada, Lume, and Gimbichu,respectively. The average age of the wife at first pregnancy was 17.7, 18.5, and 19 in Ada, Lume,and Gimbichu, respectively. In contrast to the age at first marriage, female household heads were olderthan wives at first pregnancy. The age at last pregnancy was higher in MHHs and lower in FHHs. Theaverage age of the wife at last pregnancy was 31.1 years in Ada, 34 years in Lume, and 38.6 years inGimbichu. Wives were younger than female heads of household at last pregnancy. In Ada, Lume, andGimbichu, 46.2%, 62.5%, and 57.7% of FHHs, respectively, did not have more children due to thedeath of a husband.
The mean number of adopted boys was 2.0 for Ada, 1.0 for Lume, and 0.25 for Gimbichu in MHHs.In FHHs, it was 1.2, 2.0, and 1.5 for Ada, Lume, and Gimbichu, respectively. The mean number ofgirls adopted in MHHs was 1.5 for Ada and 1.7 for Gimbichu, and 1.25, 1.2, and 1.5 for FHHs inAda, Lume, and Gimbichu, respectively.
Table 9 presents information for MHHs and FHHs on who determined the number of children anddecided whether to send girls to school.
9

Table 9. Decision-making on the number of children and sending girls to school in Ada, Lume, Gimbichuworedas, Ethiopia
Ada Lume Gimbichu
MHH FHH MHH FHH MHH FHH
Who decides on: (%) (Respondents) (%) (Respondents) (%) (Respondents) (%) (Respondents) (%) (Respondents) (%) (Respondents)
No. of childrenHusband 21.9 7 3.8 1 5.9 2 – – 10.3 3 3.8 1Wife – – 15.4 4 2.9 1 29.2 7 3.4 1 – –Both 65.6 21 34.6 9 64.7 22 8.3 2 51.7 15 38.5 10Nature 12.5 4 46.2 12 26.5 9 62.5 15 34.5 10 57.7 15
Sending girls to schoolHead – – 65.4 17 – – 62.5 15 59.4 19 26.9 7Joint 78.1 25 – – 71.4 25 – – 55.2 16 – –
Table 8. Childbearing and adoption data in Ada, Lume, Gimbichu woredas, Ethiopia
Ada Lume Gimbichu
MHH FHH MHH FHH MHH FHHNo. of girls born
Head 3.00 2.50 2.63 2.25 3.03 74.0Wife 2.80 0.00 2.83 – 3.37 –Daughter 1.00 1.00 – 1.00 – 1.0Relative – 1.25 – – – –
No. of boys bornHead 3.15 3.21 3.16 2.95 3.18 2.96Wife 3.05 – 3.21 3.48 – –Daughter – – – 1.00 – –Relative 1.00 2.66 – 1.00 – –
No. of boys diedHead 1.55 1.27 1.23 2.25 1.47 1.35Wife 1.44 – 1.28 – 1.35 –Daughter – – – – – –Relative – 1.00 – – – –
No. of girls diedHead 1.33 1.40 1.41 1.36 1.50 1.18Wife 1.33 – 1.36 – 1.20 –Daughter – – – – – –Relative – 1.00 – – – –
Age at first marriageHead 21.96 15.11 22.45 15.29 22.06 16.81Wife 15.96 – 16.80 – 16.89 –Daughter 15.50 – – 15.00 – –Relative – 13.00 – 28.00 – –
Age at first pregnancyHead 23.5 17.88 24.23 19.29 24.06 19.34Wife 17.7 – 18.47 – 19.03 –Daughter 16.5 16.50 – 16.50 – –Relative – 14.66 – 29.00 – –
Age at last pregnancyHead 39.21 34.34 41.32 35.41 43.96 37.92Wife 31.09 – 33.94 – 38.57 –Daughter 19.00 – – 20.0 – –Relative – 39.0 – 29.0 – –
No. of foster/adopted childrenBoys 2.00 1.16 1.00 2.00 0.25 1.50Girls 1.50 1.25 – 1.20 1.66 1.50
10

3.3 Household Amenities
The characteristics of household dwellings in Ada, Lume, and Gimbichu are shown in Table 10. The“simple family home” is a single hut where all family members live together, while “several familyhomes” are a number of huts in which household members live. Household heads own all dwellings. InAda, about 66% of MHHs and 44% of FHHs lived in a simple family home. The proportion of MHHsthat lived as a single family in several huts and the proportion living in several family homes was roughlysimilar and lower than the proportion of FHHs that had the same living arrangements. In Lume, 60% ofMHHs and 37.5% of FHHs lived in a single-family home; about 34% of MHHs and 50% of FHHs livedas a single family in several huts, and 6% of MHHs and 13% of FHHs lived in several family homes. InGimbichu, about 70% of MHHs and 81.5% of FHHs lived in a simple family home.
Aside from gathering information on housing arrangements, the sample survey also gatheredinformation on household wealth indicators. The roof of a dwelling is an indicator of wealth: analuminum sheet roof indicates more wealth than a grass roof. MHHs and FHHs differed little withrespect to this wealth indicator. In Ada and Lume, 65% of both types of households had grass roofs. InGimbichu, about 71% of MHHs and 77% of FHHs had houses with thatch roofs, while 29.3% ofMHHs and about 23% of FHHs had houses roofed with aluminum.
Mud walls (made from mud, straw, and wood) and cement walls are also wealth indicators. In Ada, allMHHs and 87.1% of FHHs had houses with mud walls whereas about 13% of FHHs had houses withcement walls. In Lume, both types of households had mud walls. In Gimbichu, about 94% of MHHsand all FHHs had houses with mud walls and only 6.1% of MHHs had houses with cement walls.
Table 11 presents additional data on household amenities in the three woredas. In Ada, 21.7% ofMHHs and 10% of FHHs owned a radio, while 1.7% of both households owned a tape recorder.None of the households owned a TV, gas stove, or refrigerator. In Lume, about 29% of MHHs and14% of FHHs owned a radio, while only 10.2% and 1.7% of MHHs owned a tape recorder andbicycle, respectively. About 5% of MHHs and 3% of FHHs owned a gas stove. In Gimbichu, 20% ofMHHs and 8.3% of FHHs owned a radio, while 10% of MHHs and no FHHs owned a tape recorder.Only one MHH owned a gas stove.
Table 10. Types of dwelling in Ada, Lume, and Gimbichu woredas, Ethiopia
Ada Lume Gimbichu
MHH FHH MHH FHH MHH FHH(%) (Respondents) (%) (Respondents) (%) (Respondents) (%) (Respondents) (%) (Respondents) (%) (Respondents)
Type of dwellingSimple family home 65.5 21 44.4 12 60.0 21 37.5 9 69.7 23 81.5 22Single family in several huts 18.8 6 33.3 9 34.3 12 50.0 12 18.2 6 11.1 3Several family home 15.6 5 22.2 6 5.7 2 12.5 3 12.1 4 7.4 2
Type of roofGrass thatch 65 26 64.5 22 64.5 20 64.5 20 70.7 29 77.4 24Aluminum sheet 35 20 35.5 19 35.5 11 35.5 11 29.3 12 22.6 7
Type of wallMud 100.0 32 87.1 27 100.0 32 100.0 28 93.9 31 100.0 27Cement – – 12.9 4 – – – – 6.1 2 – –
11

Most households did not use any type of toilet. In Ada, 3.1% of MHHs and 3.7% of FHHs had apit latrine, while in Lume about 6% of MHHs had a pit latrine. About 25% of both types ofhouseholds in Lume used open community areas. Most households in all woredas used oil lampsfor lighting. In Ada and Lume, a very small percentage of MHHs and none of the FHHs hadelectricity. About 37% and 21% of the MHHs and FHHs in Lume used a tile lamp, respectively,while 18.5% of FHHs in Ada and 6% of MHHs inGimbichu used a tile lamp.
Most farmers used wood or cow dung for fuel. Veryfew households in all woredas used a kerosenestove. Most farmers collected water from rivers,ponds, and other natural sources of water, althoughsome purchased it from the water vendor.
3.4 Farm Implements
The number of farm implements owned by bothtypes of households across all the woredas was low(Table 12). All households used ox plows forcultivation and sickles for harvesting. For
Table 11. Household amenities of farmers in Ada, Lume, and Gimbichu woredas, Ethiopia
Ada Lume Gimbichu
MHH FHH MHH FHH MHH FHH(%) (Respondents) (%) (Respondents) (%) (Respondents) (%) (Respondents) (%) (Respondents) (%) (Respondents)
Radio 28.8 17 13.6 8 21.7 13 10.0 6 20.0 12 8.3 5Radio tape recorder 10.2 6 – – 1.7 1 1.7 1 10.0 6 – –Bicycle 1.7 1 – – – – – – – – – –Gas stove 5.1 3 3.4 2 – – – – 1.7 1 – –
Type of toiletPit latrine 5.7 2 – – 3.1 1 3.7 1 – – – –Open community 25.7 9 25.0 6 – – – – – – – –None 68.6 24 75.0 25 96.9 31 96.3 26 100.0 33 100.0 27
Source of lightingElectricity 29.0 1 – – 6.3 2 – – – – – –Tile lamp 37.1 1.3 20.8 5 – – 18.5 5 5.9 2 – –Oil lamp 60.0 21 79.2 19 93.7 30 81.5 22 94.1 32 100.0 27
Type of fuelFirewood 62.8 22 60.0 15 44.6 25 46.9 23 62.9 22 53.5 15Cow dung 37.2 13 36.0 9 55.4 31 51.0 25 37.1 13 42.9 12Kerosene stove – – 4.0 1 – – 2.1 1 – – 3.6 1
Source of firewoodCollection 72.0 18 87.0 20 50.0 11 71.4 10 27.3 6 13.3 2Purchase 4.0 1 8.7 2 9.1 2 7.1 10 27.3 6 33.3 5Own 24.0 6 4.3 1 40.9 9 21.4 3 45.5 10 53.3 8
Source of waterCollection 90.6 29 96.3 26 39.5 15 55.2 16 94.0 31 96.3 26Water vendor 9.4 3 3.7 1 28.9 11 34.5 10 3.0 1 3.7 1Own – – – – 31.6 12 10.3 3 3.0 1 – –
Table 12. Number of farm implements owned by MHHsand FHHs in Ada, Lume, and Gimbichu woredas, Ethiopia
Ada Lume Gimbichu
Implement MHH FHH MHH FHH MHH FHH
Hoe 1.3 1.0 1.0 1.5 1.4 1.1Shovel 1.1 1.0 1.0 1.0 2.6 1.8Spade 1.0 1.0 1.0 1.2 - 1.0Digging implement 1.1 1.1 1.1 1.0 1.3 1.0Sickle 2.2 1.9 1.4 1.0 2.3 1.6Sprayer 1.0 1.0 1.0 - - -Plow 2.6 1.7 1.2 1.1 2.2 1.6Mensha 2.3 1.6 1.3 1.1 1.5 1.1Lydaa 1.3 1.2 1.1 1.0 1.4 1.3Axe 1.7 1.4 1.1 1.0 1.2 1.0
a Amharic words for implements that farmers use for winnowingtheir produce while threshing.
12

winnowing, they used the mensh and lyda. In Ada, the average number of ox plows owned byMHHs (2.6) was significantly higher than FHHs (1.7) (t=2.9; p<0.01); in Lume and Gimbichu, FHHshad fewer ox plows but the difference was not significant. Because MHHs generally had more oxplows than FHHs, they were better able to prepare their land on time. In Lume, the average numberof sickles owned by MHHs was significantly higher than FHHs (t=2.5; p<0.05). Similarly, theaverage number of hoes, spades and digging implements owned by MHHs was higher than FHHs(t=2.2, p<0.05; t=2.6; p<0.05; and t=2.2, p<=0.05, respectively).,
4.0 GENDER DIFFERENTIALS IN FARM MANAGEMENT PRACTICES
4.1 Crop Production
Agriculture in the study area is based on the cultivation of small grain cereals (tef and wheat), with theexception of lowlands in Lume, where farmers grew maize and haricot beans (Table 13). Dependingon the type of crops grown, most farmers used seedbed preparation techniques such as flatbeds,ridge and furrow, and broad bed and furrow during land preparation. The majority of households inall woredas used ox plows to form ridges and furrows.
In Ada and Lume, tef is the most important crop, followed by wheat and highland pulses; inGimbichu, wheat is the most important crop, followed by tef and highland pulses. Wheat and tefseed and highland pulses were broadcasted whereas maize was usually planted in rows. All MHHsand FHHs reported broadcasting small grain cereals. Very few MHHs (2.9%) and FHHs (8.3%) thatgrew maize in Lume broadcasted.
Households weed the main crops by hand or apply herbicide. In Ada, 9.1% of households usedherbicides, while 27.3% of MHHs and 36.4 % of FHHs weeded by hand. The other households didnot weed. About 63.3% of the MHHs and 54.6 % of FHHs used both herbicides and hand weeding;
Table 13. Mean crop area cultivated (in kerta) in Ada, Lume, and Gimbichu woredas, Ethiopia
Ada Lume Gimbichu
MHH FHH MHH FHH MHH FHH
Crop (in kert) (Respondents) (Respondents) (Respondents) (Respondents) (Respondents) (Respondents)
Tef 5.43 32 4.74 27 7.64 34 6.47 24 2.79 29 2.35 24Wheat 1.72 25 1.33 21 2.07 31 1.20 18 5.92 33 4.92 26Chickpeas 0.88 18 0.94 13 1.32 14 1.50 10 2.00 11 1.85 7Lentils 1.00 2 - - 0.60 5 0.60 5 3.19 31 2.86 25Barley 1.62 12 1.08 12 1.00 31 1.00 21 1.00 1 - -Faba beans 1.33 6 1.00 2 0.64 7 0.43 4 0.56 2 1.00 1Haricot beans 0.50 3 0.50 1 1.14 21 1.00 10 - - - -Horticultural crops - - - - 0.30 1 0.81 4 - - - -Other crops - - - - 0.75 4 0.37 2 - - - -
a A kert is one_fourth of a hectare.
13

hand weeding, supplemented by herbicides, was used particularly to control broadleaf weeds. InLume and Gimbichu, most MHHs (98.2%) and all FHHs weeded by hand. Only about 2% of theMHHs used herbicides. MHHs and FHHs in all woredas harvested crops manually. Harvesting wasusually done by hired labor because labor was scarce at that time.
The major crops grown in the study area were tef, wheat, chickpeas, lentils, barley, faba beans, fieldpeas, haricot beans, maize, rough peas, and horticultural crops, mainly tomatoes (Table 13). MHHsin Ada had higher average area of tef, wheat, barley, and faba beans than FHHs. In MHHs in Lume,the average area under tef (7.6 kert) and wheat (2.1 kert) was the highest, followed by chickpeas(1.3 kert), haricot beans (1.1 kert), and barley (1.0 kert). The FHHs in Lume grew an average of 6.5kert of tef, chickpeas (1.5 kert), wheat (1.2 kert), barley (1.0 kert), and haricot beans (1.0 kert).Lume is different from the other woredas because farmers grew horticultural crops probably becausethey have irrigation. In Gimbichu, wheat covers the largest area (5.9 kert and 4.9 kert for MHHs andFHHs, respectively), followed by lentils and tef.
Households were questioned about their use of local and improved varieties (Table 14). In Lume,about 53% of MHHs and 58% of FHHs plant both local and improved tef varieties. In Ada, allfarmers grew local tef varieties, while in Gimbichu all FHHs and 93.1% of MHHs planted localvarieties. The use of wheat varieties followed a similar pattern, in which more farmers grew localvarieties. FHHs grew fewer improved wheat varieties. All farmers in Ada and Gimbichu grew localchickpea varieties, while 21% of MHHs and 20% of FHHs in Lume grew improved chickpeavarieties. Very few farmers planted improved varieties of lentils, barley, faba beans, and rough peas.In Lume, households grew improved varieties of field peas, maize, and haricot beans. Less than one-third of MHHs and FHHs grew improved field pea varieties and only 13% of MHHs and 11% ofFHHs grew improved maize varieties. Only 10% of the MHHs grew improved haricot bean varieties.
Farmers’ sources of information about improved varieties are shown in Table 15. In Lume, wherefarmers grew more improved varieties than farmers in the other woredas, extension agents were themain source of information (47% of MHHs and 21% of FHHs). About 53% of FHHs and 24% ofMHHs learned about new varieties from the market. Other farmers were another source ofinformation on improved varieties (29% of MHHs and 26% of FHHs). The different responsesreflected the bias of extension services in favor of MHHs.
Farmers reported that their choice of crops depends on their profitability and their use as food.Some farmers cited good soil as a reason to grow certain crops (Table 16). Tef, wheat, barley,maize, haricot beans, and horticultural crops were grown for food and also because they wereprofitable. Chickpeas, lentil, faba beans, rough peas, and field peas were grown for similar reasons,although their compatibility with soils was a third important reason.
14
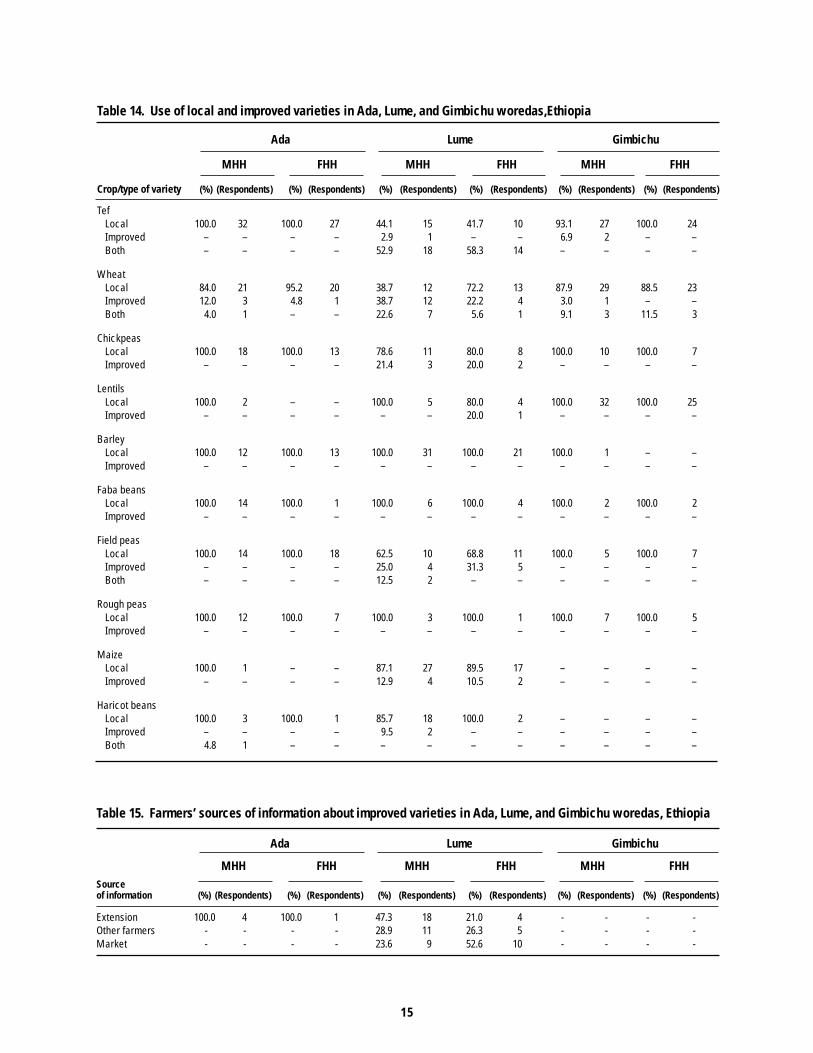
Table 14. Use of local and improved varieties in Ada, Lume, and Gimbichu woredas,Ethiopia
Ada Lume Gimbichu
MHH FHH MHH FHH MHH FHH
Crop/type of variety (%) (Respondents) (%) (Respondents) (%) (Respondents) (%) (Respondents) (%) (Respondents) (%) (Respondents)
TefLocal 100.0 32 100.0 27 44.1 15 41.7 10 93.1 27 100.0 24Improved – – – – 2.9 1 – – 6.9 2 – –Both – – – – 52.9 18 58.3 14 – – – –
WheatLocal 84.0 21 95.2 20 38.7 12 72.2 13 87.9 29 88.5 23Improved 12.0 3 4.8 1 38.7 12 22.2 4 3.0 1 – –Both 4.0 1 – – 22.6 7 5.6 1 9.1 3 11.5 3
ChickpeasLocal 100.0 18 100.0 13 78.6 11 80.0 8 100.0 10 100.0 7Improved – – – – 21.4 3 20.0 2 – – – –
LentilsLocal 100.0 2 – – 100.0 5 80.0 4 100.0 32 100.0 25Improved – – – – – – 20.0 1 – – – –
BarleyLocal 100.0 12 100.0 13 100.0 31 100.0 21 100.0 1 – –Improved – – – – – – – – – – – –
Faba beansLocal 100.0 14 100.0 1 100.0 6 100.0 4 100.0 2 100.0 2Improved – – – – – – – – – – – –
Field peasLocal 100.0 14 100.0 18 62.5 10 68.8 11 100.0 5 100.0 7Improved – – – – 25.0 4 31.3 5 – – – –Both – – – – 12.5 2 – – – – – –
Rough peasLocal 100.0 12 100.0 7 100.0 3 100.0 1 100.0 7 100.0 5Improved – – – – – – – – – – – –
MaizeLocal 100.0 1 – – 87.1 27 89.5 17 – – – –Improved – – – – 12.9 4 10.5 2 – – – –
Haricot beansLocal 100.0 3 100.0 1 85.7 18 100.0 2 – – – –Improved – – – – 9.5 2 – – – – – –Both 4.8 1 – – – – – – – – – –
Table 15. Farmers’ sources of information about improved varieties in Ada, Lume, and Gimbichu woredas, Ethiopia
Ada Lume Gimbichu
MHH FHH MHH FHH MHH FHHSourceof information (%) (Respondents) (%) (Respondents) (%) (Respondents) (%) (Respondents) (%) (Respondents) (%) (Respondents)
Extension 100.0 4 100.0 1 47.3 18 21.0 4 - - - -Other farmers - - - - 28.9 11 26.3 5 - - - -Market - - - - 23.6 9 52.6 10 - - - -
15
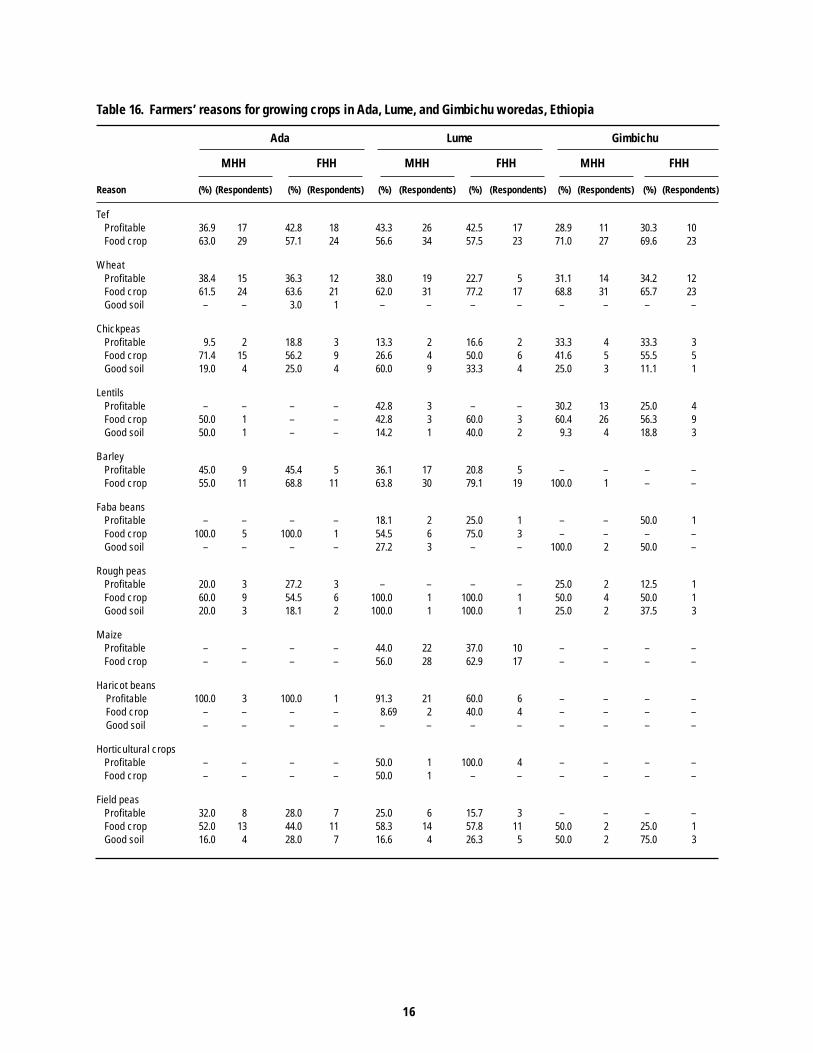
Table 16. Farmers’ reasons for growing crops in Ada, Lume, and Gimbichu woredas, Ethiopia
Ada Lume Gimbichu
MHH FHH MHH FHH MHH FHH
Reason (%) (Respondents) (%) (Respondents) (%) (Respondents) (%) (Respondents) (%) (Respondents) (%) (Respondents)
TefProfitable 36.9 17 42.8 18 43.3 26 42.5 17 28.9 11 30.3 10Food crop 63.0 29 57.1 24 56.6 34 57.5 23 71.0 27 69.6 23
WheatProfitable 38.4 15 36.3 12 38.0 19 22.7 5 31.1 14 34.2 12Food crop 61.5 24 63.6 21 62.0 31 77.2 17 68.8 31 65.7 23Good soil – – 3.0 1 – – – – – – – –
ChickpeasProfitable 9.5 2 18.8 3 13.3 2 16.6 2 33.3 4 33.3 3Food crop 71.4 15 56.2 9 26.6 4 50.0 6 41.6 5 55.5 5Good soil 19.0 4 25.0 4 60.0 9 33.3 4 25.0 3 11.1 1
LentilsProfitable – – – – 42.8 3 – – 30.2 13 25.0 4Food crop 50.0 1 – – 42.8 3 60.0 3 60.4 26 56.3 9Good soil 50.0 1 – – 14.2 1 40.0 2 9.3 4 18.8 3
BarleyProfitable 45.0 9 45.4 5 36.1 17 20.8 5 – – – –Food crop 55.0 11 68.8 11 63.8 30 79.1 19 100.0 1 – –
Faba beansProfitable – – – – 18.1 2 25.0 1 – – 50.0 1Food crop 100.0 5 100.0 1 54.5 6 75.0 3 – – – –Good soil – – – – 27.2 3 – – 100.0 2 50.0 –
Rough peasProfitable 20.0 3 27.2 3 – – – – 25.0 2 12.5 1Food crop 60.0 9 54.5 6 100.0 1 100.0 1 50.0 4 50.0 1Good soil 20.0 3 18.1 2 100.0 1 100.0 1 25.0 2 37.5 3
MaizeProfitable – – – – 44.0 22 37.0 10 – – – –Food crop – – – – 56.0 28 62.9 17 – – – –
Haricot beans Profitable 100.0 3 100.0 1 91.3 21 60.0 6 – – – – Food crop – – – – 8.69 2 40.0 4 – – – – Good soil – – – – – – – – – – – –
Horticultural cropsProfitable – – – – 50.0 1 100.0 4 – – – –Food crop – – – – 50.0 1 – – – – – –
Field peasProfitable 32.0 8 28.0 7 25.0 6 15.7 3 – – – –Food crop 52.0 13 44.0 11 58.3 14 57.8 11 50.0 2 25.0 1Good soil 16.0 4 28.0 7 16.6 4 26.3 5 50.0 2 75.0 3
16
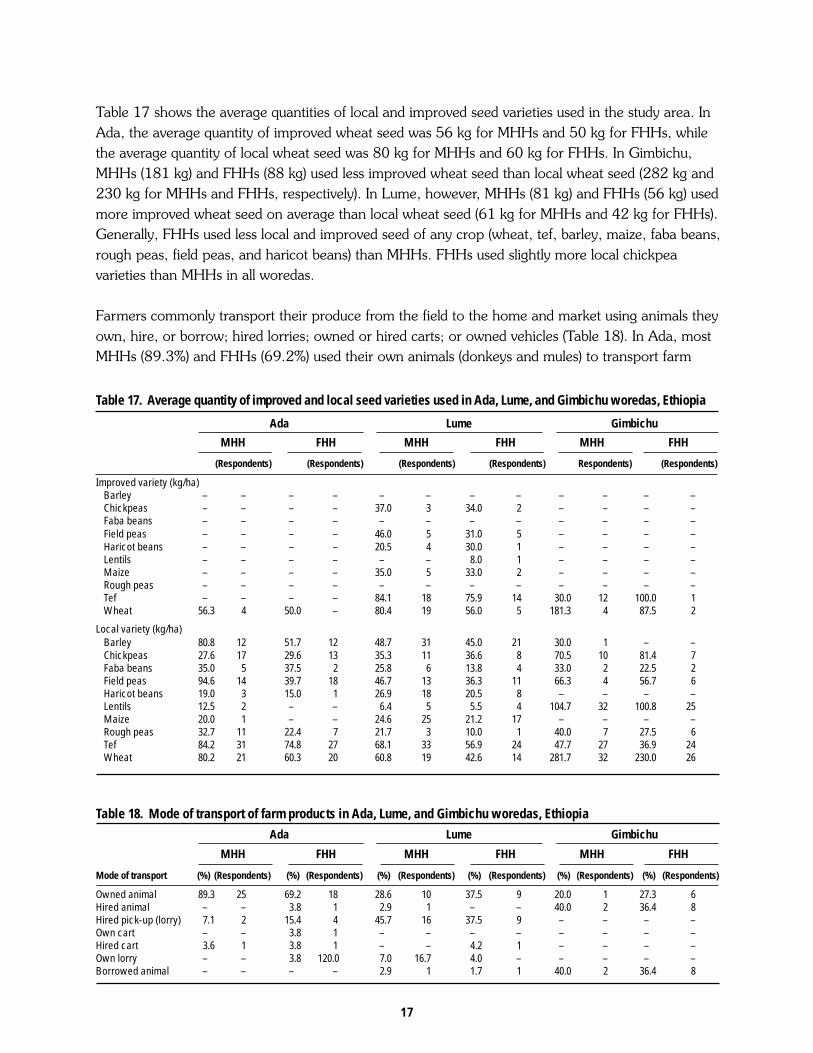
Table 17. Average quantity of improved and local seed varieties used in Ada, Lume, and Gimbichu woredas, Ethiopia
Ada Lume Gimbichu
MHH FHH MHH FHH MHH FHH
(Respondents) (Respondents) (Respondents) (Respondents) Respondents) (Respondents)
Improved variety (kg/ha)Barley – – – – – – – – – – – –Chickpeas – – – – 37.0 3 34.0 2 – – – –Faba beans – – – – – – – – – – – –Field peas – – – – 46.0 5 31.0 5 – – – –Haricot beans – – – – 20.5 4 30.0 1 – – – –Lentils – – – – – – 8.0 1 – – – –Maize – – – – 35.0 5 33.0 2 – – – –Rough peas – – – – – – – – – – – –Tef – – – – 84.1 18 75.9 14 30.0 12 100.0 1Wheat 56.3 4 50.0 – 80.4 19 56.0 5 181.3 4 87.5 2
Local variety (kg/ha)Barley 80.8 12 51.7 12 48.7 31 45.0 21 30.0 1 – –Chickpeas 27.6 17 29.6 13 35.3 11 36.6 8 70.5 10 81.4 7Faba beans 35.0 5 37.5 2 25.8 6 13.8 4 33.0 2 22.5 2Field peas 94.6 14 39.7 18 46.7 13 36.3 11 66.3 4 56.7 6Haricot beans 19.0 3 15.0 1 26.9 18 20.5 8 – – – –Lentils 12.5 2 – – 6.4 5 5.5 4 104.7 32 100.8 25Maize 20.0 1 – – 24.6 25 21.2 17 – – – –Rough peas 32.7 11 22.4 7 21.7 3 10.0 1 40.0 7 27.5 6Tef 84.2 31 74.8 27 68.1 33 56.9 24 47.7 27 36.9 24Wheat 80.2 21 60.3 20 60.8 19 42.6 14 281.7 32 230.0 26
Table 18. Mode of transport of farm products in Ada, Lume, and Gimbichu woredas, Ethiopia
Ada Lume Gimbichu
MHH FHH MHH FHH MHH FHH
Mode of transport (%) (Respondents) (%) (Respondents) (%) (Respondents) (%) (Respondents) (%) (Respondents) (%) (Respondents)
Owned animal 89.3 25 69.2 18 28.6 10 37.5 9 20.0 1 27.3 6Hired animal – – 3.8 1 2.9 1 – – 40.0 2 36.4 8Hired pick-up (lorry) 7.1 2 15.4 4 45.7 16 37.5 9 – – – –Own cart – – 3.8 1 – – – – – – – –Hired cart 3.6 1 3.8 1 – – 4.2 1 – – – –Own lorry – – 3.8 120.0 7.0 16.7 4.0 – – – – –Borrowed animal – – – – 2.9 1 1.7 1 40.0 2 36.4 8
Table 17 shows the average quantities of local and improved seed varieties used in the study area. InAda, the average quantity of improved wheat seed was 56 kg for MHHs and 50 kg for FHHs, whilethe average quantity of local wheat seed was 80 kg for MHHs and 60 kg for FHHs. In Gimbichu,MHHs (181 kg) and FHHs (88 kg) used less improved wheat seed than local wheat seed (282 kg and230 kg for MHHs and FHHs, respectively). In Lume, however, MHHs (81 kg) and FHHs (56 kg) usedmore improved wheat seed on average than local wheat seed (61 kg for MHHs and 42 kg for FHHs).Generally, FHHs used less local and improved seed of any crop (wheat, tef, barley, maize, faba beans,rough peas, field peas, and haricot beans) than MHHs. FHHs used slightly more local chickpeavarieties than MHHs in all woredas.
Farmers commonly transport their produce from the field to the home and market using animals theyown, hire, or borrow; hired lorries; owned or hired carts; or owned vehicles (Table 18). In Ada, mostMHHs (89.3%) and FHHs (69.2%) used their own animals (donkeys and mules) to transport farm
17
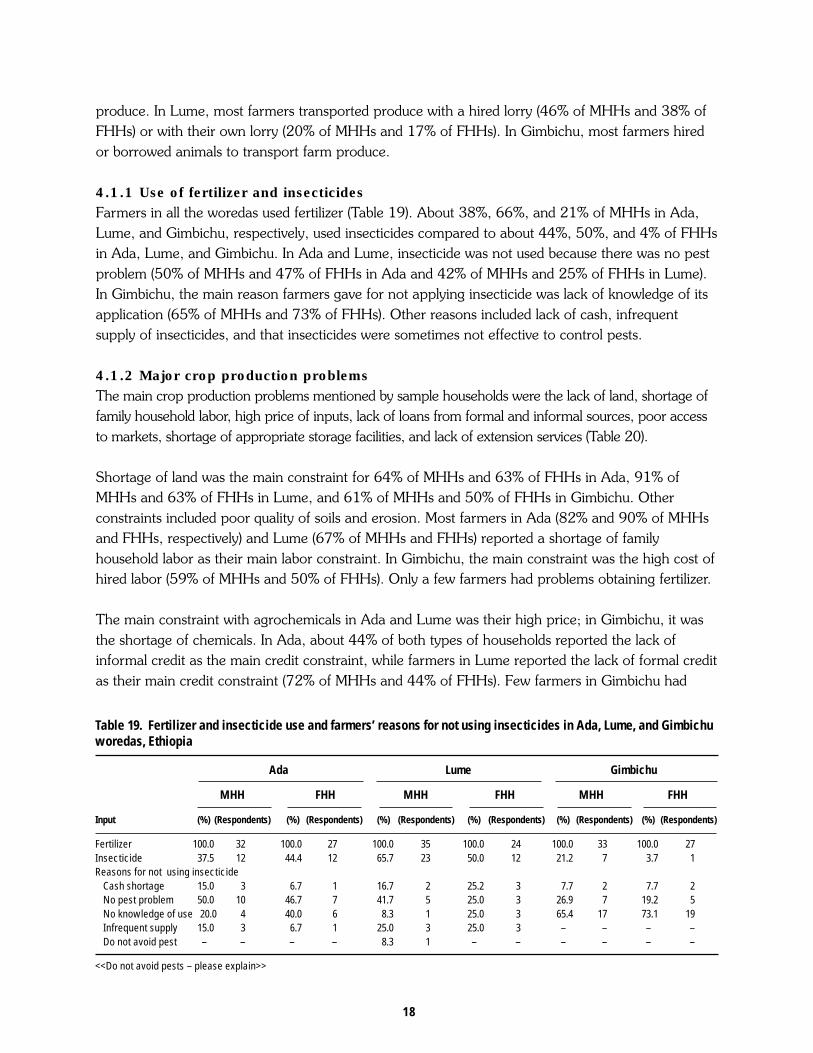
Table 19. Fertilizer and insecticide use and farmers’ reasons for not using insecticides in Ada, Lume, and Gimbichuworedas, Ethiopia
Ada Lume Gimbichu
MHH FHH MHH FHH MHH FHH
Input (%) (Respondents) (%) (Respondents) (%) (Respondents) (%) (Respondents) (%) (Respondents) (%) (Respondents)
Fertilizer 100.0 32 100.0 27 100.0 35 100.0 24 100.0 33 100.0 27Insecticide 37.5 12 44.4 12 65.7 23 50.0 12 21.2 7 3.7 1Reasons for not using insecticide
Cash shortage 15.0 3 6.7 1 16.7 2 25.2 3 7.7 2 7.7 2No pest problem 50.0 10 46.7 7 41.7 5 25.0 3 26.9 7 19.2 5No knowledge of use 20.0 4 40.0 6 8.3 1 25.0 3 65.4 17 73.1 19Infrequent supply 15.0 3 6.7 1 25.0 3 25.0 3 – – – –Do not avoid pest – – – – 8.3 1 – – – – – –
<<Do not avoid pests – please explain>>
produce. In Lume, most farmers transported produce with a hired lorry (46% of MHHs and 38% ofFHHs) or with their own lorry (20% of MHHs and 17% of FHHs). In Gimbichu, most farmers hiredor borrowed animals to transport farm produce.
4.1.1 Use of fertilizer and insecticidesFarmers in all the woredas used fertilizer (Table 19). About 38%, 66%, and 21% of MHHs in Ada,Lume, and Gimbichu, respectively, used insecticides compared to about 44%, 50%, and 4% of FHHsin Ada, Lume, and Gimbichu. In Ada and Lume, insecticide was not used because there was no pestproblem (50% of MHHs and 47% of FHHs in Ada and 42% of MHHs and 25% of FHHs in Lume).In Gimbichu, the main reason farmers gave for not applying insecticide was lack of knowledge of itsapplication (65% of MHHs and 73% of FHHs). Other reasons included lack of cash, infrequentsupply of insecticides, and that insecticides were sometimes not effective to control pests.
4.1.2 Major crop production problemsThe main crop production problems mentioned by sample households were the lack of land, shortage offamily household labor, high price of inputs, lack of loans from formal and informal sources, poor accessto markets, shortage of appropriate storage facilities, and lack of extension services (Table 20).
Shortage of land was the main constraint for 64% of MHHs and 63% of FHHs in Ada, 91% ofMHHs and 63% of FHHs in Lume, and 61% of MHHs and 50% of FHHs in Gimbichu. Otherconstraints included poor quality of soils and erosion. Most farmers in Ada (82% and 90% of MHHsand FHHs, respectively) and Lume (67% of MHHs and FHHs) reported a shortage of familyhousehold labor as their main labor constraint. In Gimbichu, the main constraint was the high cost ofhired labor (59% of MHHs and 50% of FHHs). Only a few farmers had problems obtaining fertilizer.
The main constraint with agrochemicals in Ada and Lume was their high price; in Gimbichu, it wasthe shortage of chemicals. In Ada, about 44% of both types of households reported the lack ofinformal credit as the main credit constraint, while farmers in Lume reported the lack of formal creditas their main credit constraint (72% of MHHs and 44% of FHHs). Few farmers in Gimbichu had
18

Table 20. Crop production constraints in Ada, Lume, and Gimbichu woredas, Ethiopia
Ada Lume Gimbichu
MHH FHH MHH FHH MHH FHH
Constraint (%) (Respondents) (%) (Respondents) (%) (Respondents) (%) (Respondents) (%) (Respondents) (%) (Respondents)
LandUnavailability 63.6 7 62.5 5 90.9 20 63.2 12 61.1 11 50.0 9Poor quality of land – – – – 9.1 2 15.8 3 33.3 6 33.3 6Serious erosion 36.4 4 37.5 3 – – 21.0 4 5.6 1 16.7 3
LaborNot enough family labor 81.8 9 90.0 9 66.7 6 66.7 8 41.2 7 35.7 5Hired labor not available 18.2 2 – – 11.1 1 – – – – 14.3 2Hired labor expensive – – 10.0 1 22.2 2 33.3 4 58.8 10 50.0 7
FertilizerUntimely delivery 33.3 1 100.0 1 100.0 1 – – – – – –Infrequent availability 66.7 2 – – – – – – – – – –
ChemicalsChemicals not available 7.1 2 8.3 2 30.0 3 10.0 1 50.0 6 60.0 12Price too high 89.6 25 91.7 22 40.0 4 60.0 6 8.3 1 35.0 7Infrequent supply 3.6 1 – – 30.0 3 30.0 3 14.7 5 15.0 1
CreditDon’t have required collateral 6.3 1 – – – – – – 100.0 3 75.0 3Bank loans not available – – – – 72.2 13 44.4 4 – – – –Informal loans not available 43.8 7 44.4 4 5.6 1 – – – – – –Unfavorable repayment terms 6.3 1 11.1 1 16.7 3 44.4 4 – – – –High interest rates 31.3 5 22.2 2 5.6 1 11.1 1 – – – –Not aware about credit 12.5 2 22.2 2 – – – – – – 25.0 –
MarketMarket centers are too far 88.9 16 78.3 18 50.0 7 66.7 6 – – – –High transportation cost 11.1 2 17.4 4 – – 22.2 2Poor farm roads – – 4.3 1 7.1 1 – – – – – –Price instability – – – – 42.9 6 11.1 1 100.0 3 100.0 1
StorageNo appropriatestoragefacilities 100.0 1 – – 100.0 5 100.0 6 20.0 1 – –
Available storage space not suitable – – – – – – – – 80.0 4 – –
ExtensionNone 9.4 3 11.1 3 37.1 13 12.5 3 36.4 12 14.8 4Extension service unavailable 71.9 23 81.5 22 25.7 9 37.5 9 45.5 15 66.7 18Extension not appropriate 3.1 1 3.7 1 14.3 5 16.7 4 3.0 1 3.7 1Extension services not timely 3.1 1 – – 5.7 2 4.2 1 12.1 4 11.1 3Infrequent visits 18.75 6 7.4 3 17.1 6 29.2 7 3.0 1 3.7 1
19

Table 21. Decision-making of households on sale and consumption of agricultural produce in Ada, Lume, andGimbichu woredas, Ethiopia
Ada Lume Gimbichu
MHH FHH MHH FHH MHH FHH
Constraint (%) (Respondents) (%) (Respondents) (%) (Respondents) (%) (Respondents) (%) (Respondents) (%)(Respondents)
Who decides how much to consume?Head 31.3 10 88.9 24 20.0 7 100.0 24 36.4 12 96.3 26Head and son – – 11.1 3 – – – – – – 3.7 1Head and wife 68.8 22 – – 80.0 28 – – 63.6 21 – –
Who decides how much to sell?Head 31.3 10 88.9 24 60.0 21 100.0 24 42.4 14 92.3 24Head and son – – – 11.1 3 – – – – – 7.7 2Head and wife 68.8 22 – – 40.0 14 – – 57.6 19 – –
Who decides how to use stored produce?Head 31.3 10 92.6 25 80.0 28 66.7 16 – – – –Wife – – – – – – – – 80.0 4 – –Son – – 7.4 2 – – – – 20.0 1 – –Head and son – – – – 2.9 1 33.3 8 – – 100.0 1Head and wife 68.8 22 – – – – – – – – – –Non-relative – – – – – – – – – – – –
Who actually sells?Head 93.8 30 55.6 15 97.1 34 75.0 18 72.7 24 42.3 11Son – – 29.6 8 – – 12.5 3 3.0 1 23.1 6Head and son – – 7.4 2 – – 12.5 3 6.1 2 11.5 3Head and wife 6.3 2 – – 2.9 – – – 15.2 5 – –Relative – – 3.7 1 – – – – – – 15.4 4Non relative – – – – – – – – 3.0 1 7.7 2
Place of saleLocal market 100.0 32 100.0 27 100.0 34 100.0 24 100.0 33 100.0 26Farm gate & service 2.9 1 – – – – – – – – – –
Who keeps revenues?Head 34.4 11 92.6 25 100.0 32 – – 39.4 13 100.0 26Son – – – – – – 100.0 1 – – –Wife – – – – – – – – 24.2 8 – –Husband and wife 65.6 21 – – – – – – 36.4 12 – –Head and son – – 7.4 2 – – – – – – – –
credit problems. The main marketing problem was the distance between the farm and the market.About 89% of MHHs and 78% of FHHs in Ada, and 50% of MHHs and 67% of FHHs in Lume,reported this as their main problem, while all farmers in Gimbichu reported price instability as amarketing constraint. Inappropriate storage structures were primarily a problem for farmers in Lume.More FHHs than MHHs said they suffered from a lack of extension services.
4.1.3 Decision-Making in Crop ProductionTable 21 shows the decision-making pattern of households for the sale and consumption of agriculturalproduction by woreda. Both husbands and wives made decisions on consumption in 68%, 80%, and63% of MHHs in Ada, Lume, and Gimbichu, respectively. Otherwise, the head made the decision. InFHHs the head of the household usually made the decision (88% in Ada, 100% in Lume, and 96% inGimbichu). Sons participated in decision-making in 11% of FHHs in Ada and 3.7% in Gimbichu.
About 60% of heads in MHHs in Lume made the decision to sell the produce. The head and wife in69% of MHHs in Ada and 58% of MHHs in Gimbichu made this decision jointly. About 89% of
20

female heads of households in Ada, 100% in Lume, and 92% in Gimbichu decided how muchproduce to sell. In MHHs in Ada, the decision to utilize stored produce was made jointly (69%),while in FHHs, heads almost always made the decision (93%). In Lume, it was mostly the head ofthe household who made this decision (about 80% and 67% of the MHHs and FHHs, respectively).
In MHHs, the head was primarily responsible for selling the produce, while in FHHs, the head andher son played an important role. About 94%, 97%, and 73% of males heads of household in Ada,Lume, and Gimbichu, respectively, were responsible for selling the produce. The head wasresponsible in around 56%, 75%, and 42% of FHHs in Ada, Lume, and Gimbichu, respectively; in37%, 25%, and 35% of FHHs, the son alone or the head and the son were responsible. Mostproduce was sold at the local market. In 65.6% of MHHs in Ada and 36.4% of MHHs in Gimbichu,husbands and wives kept the revenue from the sale of produce. In MHHs in Lume the head kept therevenues. Household heads usually kept the revenue in FHHs (92.6% and 100% of the FHHs inAda and Gimbichu, respectively).
The decision to use agricultural inputs by gender is shown in Table 22. In MHHs in Ada andGimbichu, the decision on the type of crops grown was either made jointly by the head and wife orby the head alone, while in Lume it was mainly the head (83.3%) who decided what to plant. InFHHs, the head often decided what to plant (77%, 100%, and 96% in Ada, Lume, and Gimbichu,respectively).
Male heads of household in Lume (97.1%) were often the sole decision-makers in the use offertilizers, while in Gimbichu they made the decision with their wives (59.4%). In 50% of MHHs inAda, the decision was made either jointly or by the household head. More than 80% of femaleheads of households in Ada, Lume, and Gimbichu are responsible for decisions about fertilizer use.The decision to use improved seed was primarily a joint decision in MHHs in Ada (75%) andGimbichu (75%), while in 50% of the MHHs in Lume it was either a joint decision or a decision bythe head. In FHHs in all woredas, the head decided on the use of improved seed. In MHHs in Lumeand Gimbichu, heads of households decided on the use of chemicals, while in 80% of MHHs inAda, the head and wife decided together. Household heads made this decision in all FHHs. InMHHs in Lume, the decision to use manure was made by the head alone (67%) or jointly (23%).
Table 22. Responsibility for input use decisions in Ada, Lume, and Gimbichu woredas, Ethiopia (%)
MHH FHH
Head Head and wife Head Head and son
Who decides: Ada Lume Gimbichu Ada Lume Gimbichu Ada Lume Gimbichu Ada Lume Gimbichu
What to plant 51.6 83.3 45.5 48.4 16.7 54.5 76.9 100.0 96.2 19.2 – 3.8To use fertilizer 50.0 97.1 31.3 50.0 – 59.4 82.1 95.7 88.9 – – 7.4To use manure – 66.7 – – 22.2 – 100.0 100.0 100.0 – – –To use improved seed 25.0 50.0 25.0 75.0 50.0 75.0 100.0 100.0 100.0 – – –To use chemicals 20.0 100.0 100.0 80.0 – – 100.0 100.0 – – – –
21
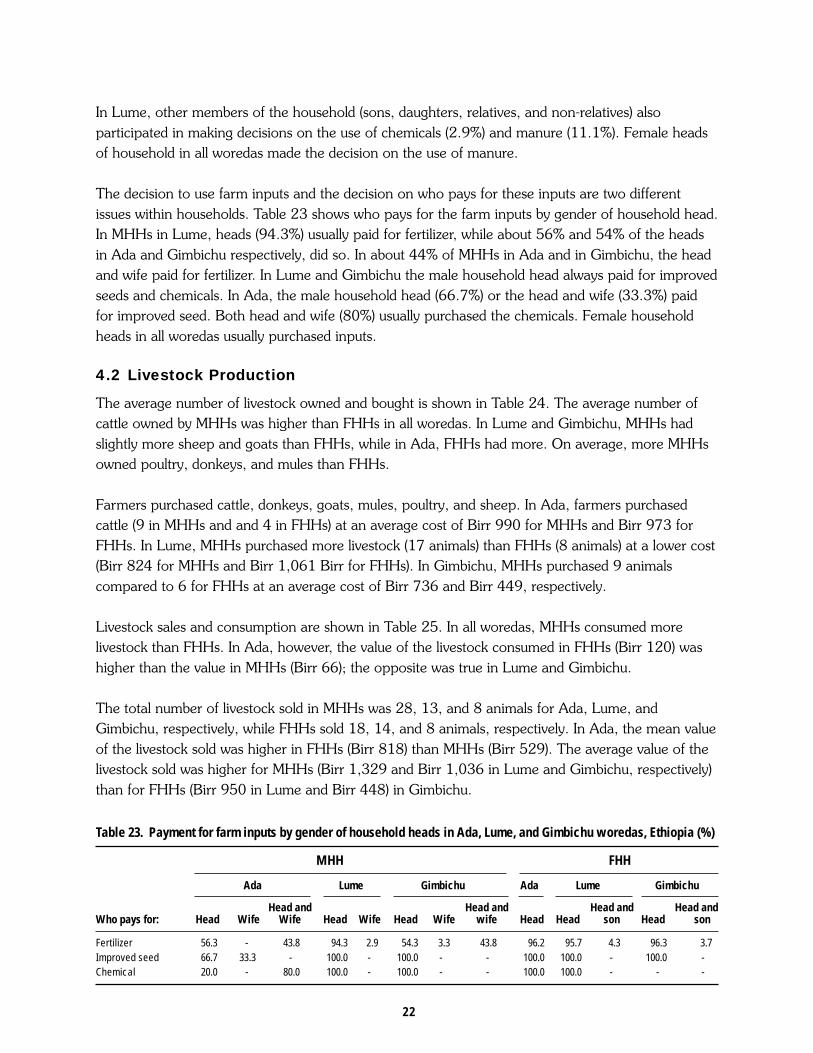
In Lume, other members of the household (sons, daughters, relatives, and non-relatives) alsoparticipated in making decisions on the use of chemicals (2.9%) and manure (11.1%). Female headsof household in all woredas made the decision on the use of manure.
The decision to use farm inputs and the decision on who pays for these inputs are two differentissues within households. Table 23 shows who pays for the farm inputs by gender of household head.In MHHs in Lume, heads (94.3%) usually paid for fertilizer, while about 56% and 54% of the headsin Ada and Gimbichu respectively, did so. In about 44% of MHHs in Ada and in Gimbichu, the headand wife paid for fertilizer. In Lume and Gimbichu the male household head always paid for improvedseeds and chemicals. In Ada, the male household head (66.7%) or the head and wife (33.3%) paidfor improved seed. Both head and wife (80%) usually purchased the chemicals. Female householdheads in all woredas usually purchased inputs.
4.2 Livestock Production
The average number of livestock owned and bought is shown in Table 24. The average number ofcattle owned by MHHs was higher than FHHs in all woredas. In Lume and Gimbichu, MHHs hadslightly more sheep and goats than FHHs, while in Ada, FHHs had more. On average, more MHHsowned poultry, donkeys, and mules than FHHs.
Farmers purchased cattle, donkeys, goats, mules, poultry, and sheep. In Ada, farmers purchasedcattle (9 in MHHs and and 4 in FHHs) at an average cost of Birr 990 for MHHs and Birr 973 forFHHs. In Lume, MHHs purchased more livestock (17 animals) than FHHs (8 animals) at a lower cost(Birr 824 for MHHs and Birr 1,061 Birr for FHHs). In Gimbichu, MHHs purchased 9 animalscompared to 6 for FHHs at an average cost of Birr 736 and Birr 449, respectively.
Livestock sales and consumption are shown in Table 25. In all woredas, MHHs consumed morelivestock than FHHs. In Ada, however, the value of the livestock consumed in FHHs (Birr 120) washigher than the value in MHHs (Birr 66); the opposite was true in Lume and Gimbichu.
The total number of livestock sold in MHHs was 28, 13, and 8 animals for Ada, Lume, andGimbichu, respectively, while FHHs sold 18, 14, and 8 animals, respectively. In Ada, the mean valueof the livestock sold was higher in FHHs (Birr 818) than MHHs (Birr 529). The average value of thelivestock sold was higher for MHHs (Birr 1,329 and Birr 1,036 in Lume and Gimbichu, respectively)than for FHHs (Birr 950 in Lume and Birr 448) in Gimbichu.
Table 23. Payment for farm inputs by gender of household heads in Ada, Lume, and Gimbichu woredas, Ethiopia (%)
MHH FHH
Ada Lume Gimbichu Ada Lume Gimbichu
Head and Head and Head and Head andWho pays for: Head Wife Wife Head Wife Head Wife wife Head Head son Head son
Fertilizer 56.3 - 43.8 94.3 2.9 54.3 3.3 43.8 96.2 95.7 4.3 96.3 3.7Improved seed 66.7 33.3 - 100.0 - 100.0 - - 100.0 100.0 - 100.0 -Chemical 20.0 - 80.0 100.0 - 100.0 - - 100.0 100.0 - - -
22

Table 24. Mean number of livestock owned and bought and cost of purchase (Birr) in Ada, Lume, and Gimbichuworedas, Ethiopia
Ada Lume Gimbichu
MHH FHH MHH FHH MHH FHH
Mean no. Mean no. Mean no. Mean no. Mean no. Mean no.
Livestockowned
Cattle 5.6 4.9 7.9 5.9 5.7 4.8Sheep 2.4 3.3 7.3 6.0 4.3 2.7Goats 3.1 4.0 6.1 5.3 4.7 3.3Poultry 4.2 3.9 6.5 5.3 4.5 4.3Donkeys 2.0 1.2 1.9 1.3 1.2 1.4Mules – – – – 1.1 1.0
Livestock Mean Respon- Mean Respon- Mean Respon- Mean Respon- Mean Respon- Mean Respon-bought no. dents no. dents no. dents no. dents no. dents no. dents Cattle 1.1 8 1.0 4 2.0 8 1.2 6 1.0 2 2.0 1 Donkeys – – – – 1.0 3 1.0 1 1.0 3 1.0 1 Goats – – – – 1.0 1 – – 1.0 1 – – Mules – – – – – – – – – – – – Poultry – – – – 1.3 4 1.0 1 – – 2.0 2 Sheep – – – – 2.0 1 – – 4.0 3 3.0 2Mean cost of purchased stock
Cost Respon- Cost Respon- Cost Respon- Cost Respon- Cost Respon- Cost Respon-(Birr) dents (Birr) dents (Birr) dents (Birr) dents (Birr) dents (Birr) dents
990 8 973 4 824 17 1,051 8 736 9 449 6
Table 25. Livestock consumed and sold and their value (Birr) in Ada, Lume, and Gimbichu woredas, Ethiopia
Ada Lume Gimbichu
MHH FHH MHH FHH MHH FHH
Mean Mean Mean Mean Mean Meanno. Respondents no. Respondents no. Respondents no. Respondents no. Respondents no. Respondents
Livestock consumed Cattle 1.0 1 1.0 1 - - 2.0 1 1.0 2 - - Goats 1.0 3 1.5 2 1.5 6 1.0 3 2.4 5 1.0 1 Poultry 1.8 14 1.8 8 3.3 13 2.7 12 - - 1.0 1 Sheep 2.5 2 1.0 4 1.5 8 1.3 6 - - - 1
Livestock sold Cattle 1.6 12 1.3 10 1.1 9 1.5 2 1.1 6 1.2 5 Donkeys - - 1.0 1 1.0 1 - - - - - - Goat 1.5 4 1.0 1 1.0 1 3.5 2 1.0 2 1.0 1 Mule - - - - - - - - - - - - Poultry 11.1 7 3.6 3 2.0 1 1.0 10 - - 3.0 2 Sheep 2.4 5 2.3 3 1.0 1 - - - - - -
Mean value of stock sold during the yearCost Respondents Cost Respondents Cost Respondents Cost Respondents Cost Respondents Cost Respondents(Birr) (Birr) (Birr) (Birr) (Birr) (Birr)529 28 818 18 1,329 13 950 14 1,036 8 448 8
Mean value of stock consumed at homeCost Respondents Cost Respondents Cost Respondents Cost Respondents Cost Respondents Cost Respondents(Birr) (Birr) (Birr) (Birr) (Birr) (Birr)
66 20 120 15 115 27 89 22 193 7 148 2
23
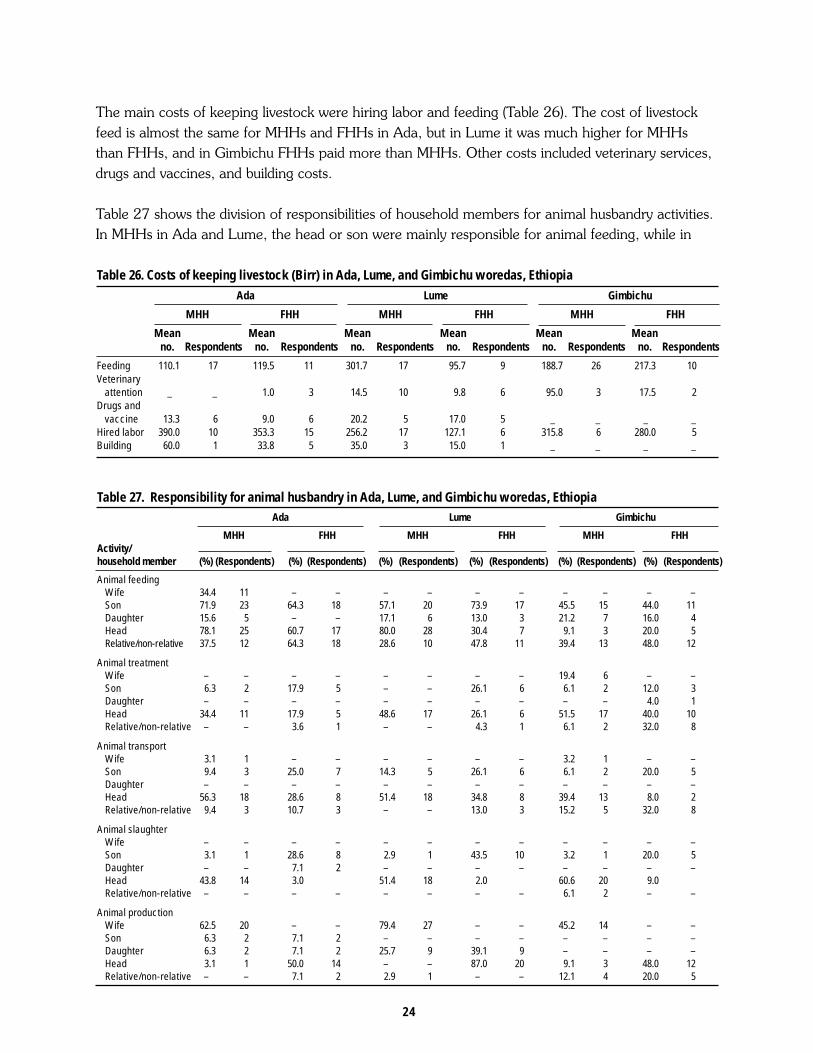
The main costs of keeping livestock were hiring labor and feeding (Table 26). The cost of livestockfeed is almost the same for MHHs and FHHs in Ada, but in Lume it was much higher for MHHsthan FHHs, and in Gimbichu FHHs paid more than MHHs. Other costs included veterinary services,drugs and vaccines, and building costs.
Table 27 shows the division of responsibilities of household members for animal husbandry activities.In MHHs in Ada and Lume, the head or son were mainly responsible for animal feeding, while in
Table 27. Responsibility for animal husbandry in Ada, Lume, and Gimbichu woredas, EthiopiaAda Lume Gimbichu
MHH FHH MHH FHH MHH FHHActivity/household member (%) (Respondents) (%) (Respondents) (%) (Respondents) (%) (Respondents) (%) (Respondents) (%) (Respondents)
Animal feedingWife 34.4 11 – – – – – – – – – –Son 71.9 23 64.3 18 57.1 20 73.9 17 45.5 15 44.0 11Daughter 15.6 5 – – 17.1 6 13.0 3 21.2 7 16.0 4Head 78.1 25 60.7 17 80.0 28 30.4 7 9.1 3 20.0 5Relative/non-relative 37.5 12 64.3 18 28.6 10 47.8 11 39.4 13 48.0 12
Animal treatmentWife – – – – – – – – 19.4 6 – –Son 6.3 2 17.9 5 – – 26.1 6 6.1 2 12.0 3Daughter – – – – – – – – – – 4.0 1Head 34.4 11 17.9 5 48.6 17 26.1 6 51.5 17 40.0 10Relative/non-relative – – 3.6 1 – – 4.3 1 6.1 2 32.0 8
Animal transportWife 3.1 1 – – – – – – 3.2 1 – –Son 9.4 3 25.0 7 14.3 5 26.1 6 6.1 2 20.0 5Daughter – – – – – – – – – – – –Head 56.3 18 28.6 8 51.4 18 34.8 8 39.4 13 8.0 2Relative/non-relative 9.4 3 10.7 3 – – 13.0 3 15.2 5 32.0 8
Animal slaughterWife – – – – – – – – – – – –Son 3.1 1 28.6 8 2.9 1 43.5 10 3.2 1 20.0 5Daughter – – 7.1 2 – – – – – – – –Head 43.8 14 3.0 51.4 18 2.0 60.6 20 9.0Relative/non-relative – – – – – – – – 6.1 2 – –
Animal productionWife 62.5 20 – – 79.4 27 – – 45.2 14 – –Son 6.3 2 7.1 2 – – – – – – – –Daughter 6.3 2 7.1 2 25.7 9 39.1 9 – – – –Head 3.1 1 50.0 14 – – 87.0 20 9.1 3 48.0 12Relative/non-relative – – 7.1 2 2.9 1 – – 12.1 4 20.0 5
Table 26. Costs of keeping livestock (Birr) in Ada, Lume, and Gimbichu woredas, EthiopiaAda Lume Gimbichu
MHH FHH MHH FHH MHH FHH
Mean Mean Mean Mean Mean Meanno. Respondents no. Respondents no. Respondents no. Respondents no. Respondents no. Respondents
Feeding 110.1 17 119.5 11 301.7 17 95.7 9 188.7 26 217.3 10Veterinary
attention _ _ 1.0 3 14.5 10 9.8 6 95.0 3 17.5 2Drugs and
vaccine 13.3 6 9.0 6 20.2 5 17.0 5 _ _ _ _Hired labor 390.0 10 353.3 15 256.2 17 127.1 6 315.8 6 280.0 5Building 60.0 1 33.8 5 35.0 3 15.0 1 _ _ _ _
24

Gimbichu it was mainly the son, non-relatives, and relatives. In FHHs in Ada, the female head andher son were mainly responsible for animal feeding, while in Lume and Gimbichu it was mainly theson or relatives. The head of the household was mainly responsible for the treatment of sick animalsand the transport of animals. In MHHs in all woredas, the household head slaughtered the animals,and in FHHs, the son or head were primarily responsible. In MHHs, the wife was mainlyresponsible for animal production, while in FHHs it was the household head.
Table 28 gives respondents’ reasons for keeping different types of livestock. Households mainlykept livestock for draft power and dairy products. MHHs also kept cattle for dowries, but none ofthe FHHs did so. Donkeys were mainly used for transport although a few households sold them.Mules and horses were reported only in Gimbichu and were used for transport. Goats were bothconsumed and sold.
Table 28. Reasons for keeping different types of livestock in Ada, Lume, and Gimbichu woredas, Ethiopia
Ada Lume Gimbichu
MHH FHH MHH FHH MHH FHH
(%) (Respondents) (%) (Respondents) (%) (Respondents) (%) (Respondents) (%) (Respondents) (%) (Respondents)
CattleGift 12.5 4 14.3 4 – – – 3.1 1 – –Consumption main products 31.3 10 42.9 12 61.1 22 43.5 10 18.8 6 12.0 3Draft power 100.0 32 100.0 28 97.2 35 91.3 21 100.0 32 100.0 25Dowry 100.0 32 – – 100.0 32 – – 100.0 32 – –Consumption of by-products 84.4 27 100.0 28 50.0 18 100.0 23 81.3 26 100.0 25Transportation 100.0 32 71.4 20 – 43.5 10 – – 80 20
DonkeysGift 11.1 3 – – – – – – – – – –Sale 18.5 5 9.5 2 35.5 11 15.8 3 – – – –Transportation 100.0 27 100.0 21 100.0 31 100.0 19 100.0 27 100.0 19
Mules and horsesTransportation – – – – – – – – 100 15 100 2
GoatConsume by-products 28.6 2 20.0 1 – – – – 36.4 4 42.9 3Gift 14.3 1 20.0 1 – – – – – – – –Consume main products 100.0 7 100.0 5 100.0 8 100.0 4 90.9 10 85.7 6Sale 57.1 4 60.0 3 100.0 8 100.0 4 72.7 8 85.7 6
PoultryConsume main products 100.0 19 100.0 16 96.0 24 100.0 13 57.1 12 72.2 13Sale 63.2 12 75.0 10 96.0 24 92.3 12 57.1 12 38.9 7
SheepConsume by-products 11.1 1 – – – – – – – – – –Dowry – – 12.5 1 – – – – – – – –Gift 33.3 3 25.0 2 – – – – – – – –Consume main products 100.0 9 100.0 8 90.9 10 84.6 11 94.1 16 69.2 9Sale 77.8 7 87.5 7 100 11 100.0 13 41.2 7 69.2 9
25

Almost all of the MHHs and FHHs in Ada and Lume kept poultry for consumption; fewerhouseholds in Gimbichu kept poultry for this purpose. More FHHs than MHHs kept poultry for sale.Sheep were kept for consumption and sale.
4.3 Tree Crop Production
Table 29 shows tree crops on farmers’ fields in the study area. More households in Ada and Lumehad trees in their fields than Gimbichu. Acacia was the most common species, although eucalyptuswas also important.
5.0 GENDER DIFFERENTIALS IN ACCESS TO LAND
Studies of African concepts of land tenure during the colonial period report that land was conceivedof primarily as an inalienable community property which was indispensable for the cohesion ofsocial relations. Land, the most important means of production, was the basis of the family, thesource of life, and formed the link between social organization and ideology. For these reasons,access to land was subjected to strictly patriarchal control, and land was inalienable to anyone (Bergvan den 1997). The total amount of land available per household and its use are crucial, given thepopulation growth and the need for increased agricultural productivity.
In all three woredas, MHHs had relatively larger farm sizes than FHHs, but there was no significantdifference between the two groups of households. The difference in farm size could have resultedfrom the nature of land ownership in the study area. Traditionally, in Oromo culture, women hadaccess to land only through marriage, and a widow’s land was still the property of the husband, but aPA policy allowed them to allocate land to FHHs. In general, the law in Ethiopia does not discrimateovertly against women in terms of land inheritance, ownership, and management, but women’srights have not been fully asserted in major legislation (Daniel Haile 1980). In Africa in general,women’s access to land is not a problem where social institutions allocate land to both men andwomen or where women can borrow or claim unused land (Bryson 1981).
Table 29. Most important tree crop in Ada, Lume, and Gimbichu woredas, Ethiopia
Ada Lume Gimbichu
MHH FHH MHH FHH MHH FHH
Tree crop (%) (Respondents) (%) (Respondents) (%) (Respondents) (%) (Respondents) (%) (Respondents) (%) (Respondents)
Most important tree cropEucalyptus 10.0 20 5.3 1 3.6 1 6.7 10 – – – –Acacia 85.0 17 94.7 18 53.6 15 46.7 7 – – 50.0 1Wacho 5.0 1 – – – – 6.7 1 100.0 1 50.0 1True man tree – – – – 3.6 1 13.3 2 – – – –Other – – – – 39.3 11 26.7 4 – – – –
Second most important tree cropAcacia 50.0 1 50.0 1 20.0 2 28.6 2 – – – –Wacho – – 50.0 1 – – 14.3 1 – – – –Others 50.0 1 – – 60.0 6 57.1 40 – – – –Eucalyptus – – – – 10.0 1 – – – – – –True man tree – – – – 10.0 1 – – – – – –
26

Per capita landholdings of both MHHs and FHHs did not vary significantly. In Lume, MHHs heldmore land per capita than FHHs, while in Gimbichu FHHs had larger land holdings per capita thanMHHs (Table 30). This difference can be explained by the fact that, in Ethiopia, there is no individualownership of land/plots within the farm household. Instead, all productive resources owned by thefamily are used collectively, with the exception of small plots in the backyard that women use to growvegetables.
5.1 Land Rights
An increasing number of African farmers are finding themselves with insufficient land to feed theirfamilies, or worse still, no land at all. An abundant and available resource prior to colonialoccupation, land was rarely owned in the western sense of exclusive, inalienable rights vested in oneindividual in exchange for cash. There is confusion over terms related to land rights, such as tenure,usufruct, freehold, and ownership when they are applied in the African context. “Tenure” refers tolandholding rights, including land that is passed on through inheritance, through a loan or rent for anestablished exchange value, or through an outright sale. “Usufruct” refers to a collective group orindividual right to use land. “Freehold” refers to an individual’s or a corporate body’s exclusive rightto hold a piece of land that can be transferred. “Ownership” refers to land that has cash orcommodity value and is registered through a process of entitlement to an individual or corporategroup (Davis 1988).
A critical issue for smallholder agriculture throughout Africa is the shortage of good quality farmingland. Increasing population pressures and fragmentation of holdings have sharply reduced cultivatedarea per person. Within this context of rapid population growth and the need for increasedproductivity of land, there is a growing debate about whether women farmers’ access to land andtheir decision-making power are constraints to agricultural transformation (Saito, Mekonnen, andSpurling 1994). Historically, men gained access to land as lineage members, but in the majority ofcases, women gained access as wives; in a few cases, women inherited land as lineage daughters(Davis 1988). Both men and women farmers are generally better off when they have the rightto land.
5.2 Land Acquisition
Unlike other African countries, in Ethiopia MHHs and FHHs acquired land primarily throughallocation by the government or the village head. In Kenya, for instance, a higher percentage ofMHHs and FHHs obtained land through inheritance and purchase, and in Nigeria, most MHHs andFHHs acquired land through inheritance. In Burkina Faso, government interventions in land tenurehave ignored the rights of women (Saito, Mekonnen, and Spurling 1994).
Table 30. Landholdings by gender of household head in Ada, Lume, and Gimbichu woredas, Ethiopia
Ada Lume Gimbichu
MHH FHH MHH FHH MHH FHH
Farm size (ha) 2.35 1.90 3.15 2.82 3.16 2.64Household size (no. persons) 8.10 6.50 7.60 5.50 7.80 5.60Per capita holding (ha/person) 0.29 0.29 0.46 0.51 0.41 0.47
27
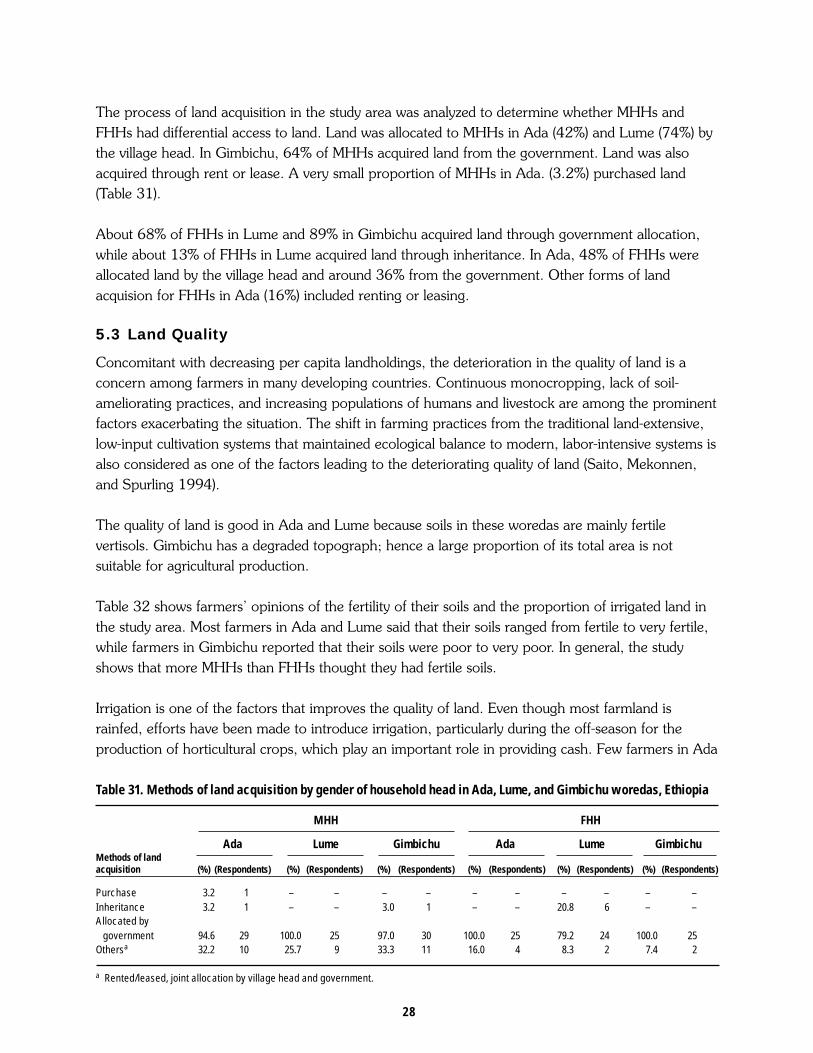
The process of land acquisition in the study area was analyzed to determine whether MHHs andFHHs had differential access to land. Land was allocated to MHHs in Ada (42%) and Lume (74%) bythe village head. In Gimbichu, 64% of MHHs acquired land from the government. Land was alsoacquired through rent or lease. A very small proportion of MHHs in Ada. (3.2%) purchased land(Table 31).
About 68% of FHHs in Lume and 89% in Gimbichu acquired land through government allocation,while about 13% of FHHs in Lume acquired land through inheritance. In Ada, 48% of FHHs wereallocated land by the village head and around 36% from the government. Other forms of landacquision for FHHs in Ada (16%) included renting or leasing.
5.3 Land Quality
Concomitant with decreasing per capita landholdings, the deterioration in the quality of land is aconcern among farmers in many developing countries. Continuous monocropping, lack of soil-ameliorating practices, and increasing populations of humans and livestock are among the prominentfactors exacerbating the situation. The shift in farming practices from the traditional land-extensive,low-input cultivation systems that maintained ecological balance to modern, labor-intensive systems isalso considered as one of the factors leading to the deteriorating quality of land (Saito, Mekonnen,and Spurling 1994).
The quality of land is good in Ada and Lume because soils in these woredas are mainly fertilevertisols. Gimbichu has a degraded topograph; hence a large proportion of its total area is notsuitable for agricultural production.
Table 32 shows farmers’ opinions of the fertility of their soils and the proportion of irrigated land inthe study area. Most farmers in Ada and Lume said that their soils ranged from fertile to very fertile,while farmers in Gimbichu reported that their soils were poor to very poor. In general, the studyshows that more MHHs than FHHs thought they had fertile soils.
Irrigation is one of the factors that improves the quality of land. Even though most farmland israinfed, efforts have been made to introduce irrigation, particularly during the off-season for theproduction of horticultural crops, which play an important role in providing cash. Few farmers in Ada
Table 31. Methods of land acquisition by gender of household head in Ada, Lume, and Gimbichu woredas, Ethiopia
MHH FHH
Ada Lume Gimbichu Ada Lume GimbichuMethods of landacquisition (%) (Respondents) (%) (Respondents) (%) (Respondents) (%) (Respondents) (%) (Respondents) (%) (Respondents)
Purchase 3.2 1 – – – – – – – – – –Inheritance 3.2 1 – – 3.0 1 – – 20.8 6 – –Allocated by government 94.6 29 100.0 25 97.0 30 100.0 25 79.2 24 100.0 25Othersa 32.2 10 25.7 9 33.3 11 16.0 4 8.3 2 7.4 2
a Rented/leased, joint allocation by village head and government.
28

and Gimbichu practiced irrigation. In Lume more FHHs (21%) practiced irrigation than MHHs (17%),possibly because in Lume, women were responsible for horticultural crop production on small plots ofland using irrigation.
5.4 Decision-Making for Land Improvement, Acquisition, and Rental
Some researchers regard the indigenous tenure system as a static constraint to agriculturaldevelopment, providing insufficient tenure security to induce farmers to make necessary land-improving investments (Dorner 1972; World Bank 1974; Harrison 1987). Others counter thatindigenous tenure arrangements are dynamic and evolve in response to changes in factor prices(Cohen 1980; Boserup 1981; Nornha 1985; Bruce 1988). In Kenya, for instance, womentraditionally did not inherit land, but their rights to use land belonging to a male relative were assured.Today, unless the land is registered in her own name, a women’s right to use land is threatened byland commercialization. In fact, it could be argued that there is a spontaneous individualization of landrights over time, whereby farm households acquire a broader and more powerful set of transfer andexclusionary rights over land as population pressure and agricultural commercialization proceed. Thistrend in turn raises the question of whether or not there is a need for expensive land registration andtitling programs at this stage of economic development in sub-Saharan Africa. On the other hand, ifindigenous tenure systems are dynamic, then it is relevant to ask if governments can take more usefulmeasures to facilitate the process of technology adoption.
Table 33 shows the decision-making responsibilities to improve, lend, or rent land in the threeworedas. About 68%, 100%, and 61% of male heads of household are responsible for decisions toimprove land in Ada, Lume, and Gimbichu, respectively. Almost all female heads of household areresponsible for this decision in all woredas. The decision to lend land in Lume was the fullresponsibility of the wife in MHHs, while in Gimbichu it was mostly a joint decision between thehusband and wife (75%). In Gimbichu, female household heads and their sons were the ones whodecided to lend land.
Table 32. Soil fertility status and irrigation of farmland in Ada, Lume, and Gimbichu woredas, Ethiopia
Ada Lume Gimbichu
MHH FHH MHH FHH MHH FHH
(%) (Respondents) (%) (Respondents) (%) (Respondents) (%) (Respondents) (%) (Respondents) (%) (Respondents)
Very fertile 32.3 20 18.8 9 22.4 13 26.0 13 3.3 3 1.3 1Fertile 38.7 24 41.7 20 56.9 33 42.0 21 31.9 29 29.9 23Poor 24.2 15 31.3 15 19.0 11 26.0 13 28.6 26 33.8 26Very poor 4.8 3 8.3 4 1.7 1 6.0 3 36.3 33 35.1 27Irrigated 18.4 7 4.0 1 16.7 5 21.4 6 9.7 3 11.1 3Not irrigated 81.6 31 96.0 24 83.3 25 78.6 22 90.3 28 88.9 24
29

In Ada, there is no lending or renting of land. The decision to rent land in Lume was made byhusband and wife (67%), while in FHHs the decision was the joint responsibility of the female headand son. In MHHs in Gimbichu, the decision to rent land was made by the husband and wife (100%)and in FHHs, by the female head and son (100%).
6.0 GENDER PATTERNS OF LABOR UTILIZATION
People often refer to the “triple roles” of gender: production, reproduction, and communitymanagement. The productive role involves the production of goods and services for consumptionand trade. Work related to crop and livestock production (agricultural production) and other income-generating activities is regarded as productive. Reproductive work involves the care andmaintenance of the household and its members. Collecting fuelwood and water, caring for children,cooking, and cleaning are all considered reproductive work. These activities do not directly bringcash into the household and are often not even recognized as work. If it is clear that a woman orgroups of women are collecting fuelwood for sale, however, then this activity is consideredproductive. Community management work involves the collective organization of social events andservices. Thus group work such as cleaning irrigation channels and terracing is viewed as communitymanagement.
6.1 Use of Family Labor in Crop Production
6.1.1 Land preparationUnlike some African countries where the gender division of family labor in agricultural production isbecoming less distinct (Saito, Mekonnen, and Spurling 1994), in Ethiopia in the study area, no femalefarmers engaged in land preparation. Across all three woredas, land preparation was the responsibilityof the male household head, son, male relatives, and male non-relatives in MHHs; in FHHs, the son,male relatives, and male non-relatives were responsible (Table 34).
In Ada and Gimbichu, male household heads prepared most of the land. The average number of daysmale heads spent preparing land was 34, 21.5, and 30 in Ada, Lume, and Gimbichu, respectively.The difference between Ada and Lume and between Ada and Gimbichu was significant at p<0.01.The average number of days allotted for land preparation in Ada is probably higher because tef is
Table 33. Responsibility for decisions on land improvement, acquisition, and renting by gender of household head inAda, Lume, and Gimbichu woredas, Ethiopia
MHH FHH
Ada Lume Gimbichu Ada Lume Gimbichu
Who Head Head Head Headdecides to: Head Wife Head Wife and wife Head Wife and wife Head Son Head and son Head and son
Improve land 67.7 32.3 100 – – 60.6 39.4 – 96.3 3.7 95.7 4.3 100 –Lend land – – – 100 – 25.0 – 75.0 – – – – – 100Rent land – – – 33.3 66.7 – – 100 – – – 100 – 100
30

Table 34. Division of household labor by gender and crop operation in Ada, Lume, and Gimbichu woredas, Ethiopia
Ada Lume Gimbichu
Crop operation MHH FHH MHH FHH MHH FHH
Land preparationAverage number of days
Head 34.0 – 21.5 – 30.0 –Son 29.3 29.8 26.6 28.2 20.3 19.6Relatives – 28.7 40.0 32.0 14.3 19.0Non-relatives 27.8 31.4 16.4 28.2 29.0 20.8
Average h/dayHead 7.4 – 6.6 – 6.9 –Son 7.1 7.5 6.6 6.5 7.8 7.6Relatives – 6.7 6.2 6.8 6.4 6.2Non-relatives 6.5 8.0 7.4 6.4 6.9 7.1
PlantingAverage number of days
Head 17.0 – 11.4 – 15.5 –Son 14.1 13.1 9.2 13.6 14.7 13.0Relatives – 15.7 – 8.0 18.7 15.2Non-relatives 16.5 15.0 9.2 12.0 14.0 14.1
Average h/dayHead 8.6 – 7.9 – 8.6 –Son 8.5 8.8 7.6 7.7 7.4 8.5Relatives – 11.3 – 4.0 7.3 7.5Non-relatives 9.0 9.2 8.0 7.1 8.4 9.0
First weedingAverage number of days
HeadWife 14.3 13.7 21.3 18.6 14.5 15.9Son 13.7 – 18.0 – 16.9 –Daughter 22.6 20.9 26.3 26.0 19.3 20.2Relatives 18.3 20.7 20.2 19.0 16.0 21.3Non-relatives 3.3 12.7 93.0 8.0 18.3 21.3
Average h/dayHead 8.7 8.8 7.8 7.2 7.6 7.3Wife 8.9 – 7.7 – 7.0 –Son 9.1 8.5 7.7 7.8 7.3 7.8Daughter 8.9 8.3 7.8 7.6 7.8 7.3Relatives 9.5 8.5 8.0 9.0 6.3 8.0Non-relatives 8.4 9.2 7.9 7.3 7.7 7.2
Second weedingAverage number of days
Head 6.7 8.6 7.8 9.6 4.7 3.0Wife 7.1 – 7.9 – 4.5 –Son 10.6 9.3 13.9 13.0 10.5 –Daughter 12.4 9.0 9.2 8.3 8.0 10.0Relatives 11.0 7.7 – 4.0 – –Non-relatives 13.0 10.3 10.3 10.7 2.0 –
Average h/dayHead 7.7 9.0 6.8 7.8 9.0 7.0Wife 8.0 – 7.2 – 9.0 –Son 8.4 8.5 6.6 8.8 8.9 –Daughter 7.2 8.3 6.1 7.8 8.5 9.0Relatives 7.5 5.5 – 9.5 – –Non-relatives 7.7 8.3 7.5 9.3 8.0 –
(Continued) ➞
31

Table 34. (Cont'd.)
Ada Lume Gimbichu
Crop operation MHH FHH MHH FHH MHH FHH
HarvestingAverage number of days
Head 12.2 3.2 11.2 6.4 18.9 7.2Wife 4.1 – 6.1 – 5.3 –Son 16.5 16.0 12.1 11.0 21.5 23.4Daughter 6.3 6.0 5.2 8.2 9.9 10.7Relatives 20.3 16.5 9.1 9.8 17.1 20.7Non-relatives 10.2 15.4 12.0 8.3 25.0 27.0
Average h/dayHead 7.7 7.4 7.2 6.5 8.8 7.1Wife 7.2 – 6.8 – 7.8 –Son 7.5 8.2 7.1 7.0 8.7 8.6Daughter 7.3 5.3 7.5 8.1 8.1 8.1Relatives 8.0 8.2 7.8 7.8 8.5 8.1Non-relatives 7.9 7.9 7.3 7.4 8.4 7.5
TransportingAverage number of days
Head 9.6 – 9.4 5.7 10.6 6.9Wife 8.5 – 8.9 – 8.3Son 16.9 11.0 12.1 9.2 13.8 12.5Daughter 10.1 – 7.7 9.3 7.3 7.8Relatives 17.1 9.2 21.7 19.2 10.4 20.1Non-relatives 9.7 11.8 11.3 5.2 15.3 17.6
Average h/dayHead 6.9 – 7.0 6.6 6.2 5.8Wife 6.4 – 7.2 – 6.5 –Son 6.7 7.0 7.1 6.8 6.2 5.7Daughter 6.5 – 7.3 7.2 6.8 5.8Relatives 7.4 6.8 7.8 8.5 6.3 6.1Non-relatives 7.2 6.7 6.5 7.5 5.9 5.9
Threshing/storage Average number of days
Head 13.0 4.7 16.4 9.5 11.9 7.2Wife 7.1 – 10.8 – 8.3 –Son 17.8 14.1 19.5 19.1 14.5 12.6Daughter 12.9 3.3 8.5 16.4 9.3 7.9Relatives 22.5 10.4 9.6 14.0 6.2 11.1Non-relatives 18.3 13.3 19.1 12.0 18.3 9.9
Average h/dayHead 8.6 6.5 8.5 7.9 8.7 6.5Wife 6.9 – 7.7 – 7.9 –Son 8.8 8.8 8.6 8.5 8.8 8.6Daughter 7.0 9.0 8.1 7.3 7.6 7.6Relatives 7.7 7.8 8.4 8.4 7.3 8.2Non-relatives 10.0 8.4 8.2 8.9 8.6 8.2
32
the dominant crop and the land requires several plowings before it is planted. Even though farmersin Lume and Gimbichu also grow tef, tef performs so well in Ada that farmers give it top priority inthe allocation of labor. The average number of days spent on land preparation was relatively higherin Gimbichu than in Lume because of waterlogging, which is the dominant crop productionproblem there.
In Ada and Lume, FHHs spent 30 days on land preparation while in Gimbichu they spent 20 days.MHHs in Lume and Gimbichu spent more time on land preparation than FHHs, while in Ada bothtypes of household spent roughly the same amount of time on land preparation.
There was little difference in the number of hours spent on land preparation between MHHs and FHHsacross the three woredas. In Ada, male household heads spent more hours per day preparing land thanother members of the household, while in Lume and Gimbichu the male head spent fewer hours perday than other members of the household, although the difference was not significant. In FHHs, sons,relatives, and non-relatives spent more than six hours per day on land preparation.
6.1.2 PlantingThere was little difference between MHHs and FHHs in the average number of hours spent on plantingper day. The male household head, sons, and non-relatives in MHHs in Ada and Lume did theplanting, while relatives also participated in Gimbichu. Female heads of household did not engage inplanting. In all three woredas, the son, relatives, and non-relatives were engaged in planting. In Adaand Lume, male heads spent more days on planting than other members of the household. InGimbichu, relatives spent more days planting than male heads. In FHHs in all woredas, sons spent onaverage 13 days on planting. With the exception of Lume, relatives in FHHs spent more days plantingthan relatives in MHHs.
6.1.3 WeedingAll members of farm households were involved in weeding (Table 34). In MHHs, the son worked thehighest number of days (more than 20 days) on the first weeding, followed by non-relatives (close to 20days) and daughters (more than 16 days). The number of days spent on weeding ranged from about 3 inAda to 18 in Gimbichu. In all woredas, there was little difference in the number of days husbands andwives spent on weeding. In FHHs, the average number of days spent on weeding was greatest for sons(more than 20 days). In Ada and Lume, daughters and relatives spent on average 21 days on weeding.Female heads spent the fewest hours on weeding. The average number of days for the first weeding inFHHs ranged from 8 days by relatives to 26 days by sons in Lume. Female heads on average spent about14, 19, and 16 days on weeding in Ada, Lume, and Gimbichu, respectively. There was no markeddifference in the number of days spent by male and female heads on first weeding.
In MHHs, the average hours spent by relatives per day on the first weeding ranged from around 6 hoursin Gimbichu to around 10 hours in Ada. There was no significant difference in the average number ofhours per day among members of the household. However, household members spent on average morehours per day on weeding in Ada, followed by Lume and Gimbichu. There was no significant differencebetween the average number of hours that male heads and wives spent per day spent on weeding in the
33

three woredas. In FHHs, the average hours spent on weeding ranged from about 7 by the female headin Lume and non-relatives in Gimbichu to 9 by non-relatives in Ada per day. Female heads spent fewerhours per day on weeding than male heads in all the three woredas, although the difference was notsignificant.
The average number of days spent on the second weeding was less than the average number of daysspent on first weeding in all woredas. In MHHs, it ranged from 2 days by non-relatives in Gimbichu to 14days by sons in Lume. Heads spent on average 6.7, 7.8, and 4.7 days on the second weeding in Ada,Lume, and Gimbichu, respectively. In Ada and Lume, wives spent more days on the second weedingthan the heads, but again, the difference was not significant. The average number of days spent on thesecond weeding was the lowest in Gimbichu. Relatives did not participate in the second weeding in Lumeand Gimbichu.
In FHHs, the average number of days spent on the second weeding ranged from 3 days by the head inGimbichu to about 11 days by non-relatives in Lume. Female heads spent an average of 8.6 days in Ada,9.6 days in Lume, and 3 days in Gimbichu on the second weeding. In FHHs in Gimbichu, the secondweeding was limited to the head (3 days) and daughters (10 days). MHHs spent more days on the secondweeding than FHHs, although the difference was not significant.
The average hours per day spent on the second weeding in MHHs ranged from about 6 hours bydaughters in Lume to 9 hours by the head and wife in Gimbichu. Heads spent on average 7.7, 6.8, and9 hours per day on the second weeding in Ada, Lume, and Gimbichu, respectively. The average numberof hours per day that wives spent on the second weeding was higher than the time spent by householdheads in Ada and Lume, while wives and heads spent the same number of hours per day (9) inGimbichu. The average number of hours that household members spent each day on the secondweeding was higher in Gimbichu, followed by Ada and Lume.
In FHHs, the average number of hours per day spent on second weeding ranged from about 6hours by relatives to 9 hours by the head in Ada and daughters in Gimbichu. Heads spent onaverage 9, 7.8, and 7 hours per day in Ada, Lume, and Gimbichu, respectively, on the secondweeding. FHHs spent more time on second weeding than MHHs, although the difference was notsignificant.
6.1.4 HarvestingAll household members in the study area took part in harvesting (Table 34). Non-relatives weremore involved in harvesting than other members of the household. On average, MHHs spent muchmore time on harvesting than FHHs in all woredas (p<0.01). There was little difference betweenMHHs and FHHs in the average number of days that household members (sons, daughters,relatives, and non-relatives) spent on harvesting. In MHHs, the average number of days spent onharvesting ranged from 4 days by the wife in Ada to 25 days by non-relatives in Gimbichu, while inFHHs it ranged from 3 days by the head in Ada to 27 days by non-relatives in Gimbichu.
34
The average hours spent per day on harvesting in MHHs ranged from about 7 hours by the wife inLume to about 9 hours by the head in Gimbichu. On average, all household members in MHHs inAda and Lume spent more time on harvesting than FHHs. In Ada, this was because daughters inMHHs spent more hours (7) harvesting. This difference was significant (p<0.01). In Lume, there waslittle difference in the average number of hours household members spent each day on harvestingbetween MHHs and FHHs. In Gimbichu, there was a significant difference in the average number ofhours that male and female heads of households spent on harvesting (p<0.01).
6.1.5 Transporting produceThis activity entails the transportation of agricultural produce from the field to the threshing area andto the nearest market. There was no significant difference between MHHs and FHHs in the number ofdays spent transporting produce (Table 34). The average number of days household members spenttransporting produce ranged from 5.2 days by non-relatives in FHHs to 21.7 days by relatives inMHHs in Lume. In MHHs in Ada, household heads spent an average of 9.6 days transportingproduce, while wives spent 8.5 days. Relatives, followed by sons in MHHs, undertook most of thetransporting. In FHHs, non-relatives and sons did most of the transporting. Heads and daughters inFHHs in Ada were not involved in transporting at all.
In Lume, heads and non-relatives in MHHs spent significantly more time transporting produce thanheads and non-relatives in FHHs (p<0.01). In FHHs in Lume and Gimbichu, all household memberswere involved in transporting produce. More household members in MHHs transported produce thanin FHHs. In Gimbichu, there was a significant difference in the average number of days that male andfemale heads of households (p< 0.05) and relatives (p<=0.05) spent transporting produce. Onaverage, household members in FHHs in Gimbichu spent more days transporting produce thanhousehold members in MHHs.
The average hours spent per day transporting produce ranged from about 6 hours by sons in FHHs inGimbichu to about 9 hours by relatives in FHHs in Lume. Except for relatives and non-relatives inMHHs in Ada, Lume, and Gimbichu, the average number of hours that farm household membersspent transporting produce per day was higher in MHHs than in FHHs.
6.1.6 Threshing/storageIn the study area,threshing of small grain cereals involves both animal power and human labor.Animals are rotated over the thinly spread crop on a specially prepared threshing ground, andhousehold members winnow the grain from the straw. In Ada, the average number of days spentthreshing and storing grain ranged from about 5 days by the head in FHHs to about 23 days byrelatives in MHHs (Table 34). With the exception of daughters and relatives in Lume and relatives inGimbichu, the average number of days that household members spent on threshing and storing grainwas higher in MHHs than FHHs in all woredas.
In Ada, relatives followed by non-relatives in MHHs recorded the highest average number of daysspent on threshing/storage, while in FHHs the son followed by non-relatives and relatives recordedthe highest average number of days. Time spent on this operation differed significantly only between
35

the heads (p<0.01) and daughters (p<0.07) of MHHs and FHHs. Female heads (4.7 days) anddaughters (3.3 days) spent the least number of days on threshing/storage.
In MHHs in Lume, the head, son, and non-relatives spent more than 15 days on threshing/storage,while in FHHs, only sons and daughters spent more than 15 days on threshing/storage. There wasa significant difference between MHHs and FHHs in the case of the heads (p<0.01), daughters(p<0.00), and relatives (p<0.00). Female heads spent the least number of days on threshing/storage.
The average hours per day of threshing/storage ranged from about 7 hours by the female head inAda and Gimbichu to 10 hours by non-relatives in MHHs in Ada. Sons spent more hours per dayon threshing/storage than other members of the household with the exception of non-relatives inMHHs in Ada and Lume. Household members in MHHs spent on average more hours per day onthreshing/storage than household members in FHHs. On average, daughters in MHHs and FHHsin Ada spent significantly fewer hours per day on threshing/storage than daughters in Lume andGimbichu.
6.2 Use of Family Labor in Livestock Production
All household members in MHHs and FHHs were involved in livestock activities though differenthousehold members were responsible for different activities (Table 35).
In most MHHs in Ada, the head (78%) and the son (72%) were responsible for animal feeding,while the wife (34%) and relatives/non-relatives (36%) were less active. In about 80% of the MHHsin Lume, the head was responsible for livestock feeding, while in Gimbichu, only 9% of heads inMHHs were responsible. In Gimbichu, the son (46%) was mainly responbile for livestock feeding,followed by relatives/non-relatives (39%), the daughter (21%), and the wife (7%). In FHHs, theresponsibility for animal feeding rested mainly with the son and relatives/non-relatives across allworedas.
Heads of households were primarily responsible for treating sick animals in all woredas. In MHHs,heads were responsible for slaughtering and selling animals. In Ada, Lume, and Gimbichu, the headwas responsible for slaughtering and selling animals in about 44%, 51%, and 61% of the MHHs,respectively; in FHHs, sons and relatives/non-relatives were responsible. Heads of household wereresponsible for transporting animals to the market in about 56%, 51%, and 39% of MHHs in Ada,Lume, and Gimbichu, respectively, while sons were responsible in 9% of MHHs in Ada, 14% inLume, and 6% in Gimbichu. In FHHs, 29% of heads in Ada, 35% in Lume, and 8% in Gimbichutransported animals to the market, while sons did this in 25% of FHHs in Ada, 26% in Lume, and20% in Gimbichu. Relatives/non-relatives transported animals to the market in 11%, 13%, and32% of FHHs in Ada, Lume, and Gimbichu, respectively.
36

Table 35. Division of family labor by gender and livestock production task in Ada, Lume, and Gimbichu woredas, Ethiopia (%)
Ada Lume Gimbichu
Task MHH FHH MHH FHH MHH FHH
FeedingHead 78.1 60.7 80.0 30.4 9.1 20.0Wife 34.4 – 22.9 – 6.5 –Son 71.9 64.3 57.1 73.9 45.5 44.0Daughter 15.6 – 17.1 13.0 21.2 16.0Relative/non-relative 37.5 64.3 28.6 47.8 39.4 48.0
Treating sick animalsHead 34.4 17.9 48.6 26.1 51.5 40.0Wife – – – – 19.4 –Son 6.3 17.9 – 26.1 6.1 12.0Daughter – – – – – 4.0Relative/non-relative – 3.6 – 4.3 6.1 32.0
Slaughter and saleHead 43.8 7.1 51.4 – 60.6 –Wife – – – – – –Son 3.1 26.6 2.9 43.5 3.2 40.0Daughter – – – – – –Relative/non-relative – 10.7 – 8.7 6.1 36.0
Transport to marketHead 56.3 28.6 51.4 34.8 39.4 8.0Wife 3.1 – – – 3.2 –Son 9.4 25.0 14.3 26.1 6.1 20.0Daughter – – – – – –Relative/non-relative 9.4 10.7 – 13.0 15.2 32.0
Product processingHead 3.1 50.0 – 87.0 9.1 48.0Wife 62.5 – 79.4 – 45.2 –Son 6.3 7.1 – – – –Daughter 6.3 7.1 25.7 39.1 – –Relative/non-relative – 7.1 2.9 – 12.1 20.0
Wives in MHHs were mainly responsible for processing animal products. Heads of households wereresponsible in 50% of FHHs in Ada, 87% in Lume, and 48% in Gimbichu. In Lume, daughters alsoparticipated considerably in processing animal products.
In general, the head was mainly responsible for feeding, treating, slaughtering, and transportinganimals in MHHs, while the wife processed animal products. Other family members assisted only intreating, slaughtering, and transporting animals. On the other hand, other family members wereresponsible for all livestock activities in FHHs. It is important to note, however, that in Ethiopia thesexual division of labor and gender roles varies from one cultural setting to another depending onwhether the plow or the hoe are used for cultivation. For instance, in some parts of Ethiopia, womendo not sell or buy bulls, oxen, heifers, or cows (Rahamato 1991).
37

6.3 Use of Hired Labor in Crop Production
The use of hired labor in crop production is shown in Table 36. Hired labor in agricultural operationsis limited to weeding, harvesting, threshing and transporting. Both male and female workers werehired for these operations. Children were also hired for weeding. In Ada, Lume, and Gimbichu, about88%, 97%, and 82% of MHHs, respectively, hired labor for crop production compared to about78%, 96%, and 74% of FHHs. The main reason given by both types of households for not hiringlabor was that the labor supply was sufficient. Other reasons were that cash was short or that hiringlabor was not profitable.
The division of hired labor by gender and agricultural production tasks in Ada, Lume, and Gimbichuis shown in Table 37. In MHHs in Ada, male and female labor was hired for weeding for 19 and 15days, respectively, and for 11 and 10 days in FHHs. In Lume, only male labor was used (17 days inMHHs and 25 days in FHHs). In Gimbichu, households hired male labor (33 days in MHHs and 19days, in FHHs) and child labor (2 days in MHH and 8 days in FHHs). Laborers were paid Birr 4-5per day for weeding.
In Ada, both types of households hired mainly male labor for harvesting. Only MHHs in Ada (6 days)and Lume (8 days) hired female labor. Male laborers were paid Birr 5-9 for harvesting per day, whilefemale laborers were paid Birr 5- 6 per day.
In MHHs in Ada, Lume, and Gimbichu, male labor was hired for about 10, 19, and 7 days fortransportation, while FHHs in Gimbichu hired male labor for an average of 28 days. Hired laborerswere paid Birr 5-7 per day.
Most households hired only male labor for threshing, with the exception of FHHs in Lume, whichhired men as well as women. In Lume, the cash payment and cash equivalent per day for malelaborers were Birr 5.7 and 3.8, respectively, in both MHHs and FHHs, while that of female laborwas Birr 7. In Gimbichu, MHHs and FHHs hired male labor for an average of 8 and 9 days,respectively. The cash payment per day was Birr 8.8 in MHHs and Birr 4.3 in FHHs. The cashequivalent was Birr 6.8 in MHHs and Birr 5 in FHHs.
Table 36. Hired labor and reasons for not hiring labor in Ada, Lume, and Gimbichu woredas, Ethiopia
Ada Lume Gimbichu
MHH FHH MHH FHH MHH FHH
(%) (Respondents) (%) (Respondents) (%) (Respondents) (%) (Respondents) (%) (Respondents) (%) (Respondents)
Households usinghired labor 87.5 28 77.8 21 97.1 34 95.8 23 81.8 27 74.1 20
Reasons for not hiring laborHave enough labor 100.0 4 83.3 5 100.0 1 – 50.0 3 71.4 5Cash shortage – 16.7 1 – 100.0 1 33.3 2 26.6 2Not profitable – – – – 16.7 1 – –
38

Table 37. Division of hired labor by gender and agricultural production tasks in Ada, Lume, and Gimbichuworedas, Ethiopia
Ada Lume Gimbichu
Production task MHH FHH MHH FHH MHH FHH
Weeding Number of days
Male labor 19.0 11.0 16.9 25.0 33.3 19.0Female labor 14.7 10.4 – – – –Child labor – 2.0 – – 2.0 8.0
Cash payment (Birr)Male labor 4.5 4.0 4.2 5.0 4.6 4.5Female labor 4.7 3.9 – – – –Child labor – 1.0 – – 3.0 4.0
Harvesting Number of days
Male labor 28.1 23.2 38.4 22.8 30.6 28.2Female labor 5.5 – 8.0 – – –
Cash payment (Birr)Male labor 8.9 8.6 8.9 8.4 5.3 6.0Female labor 6.0 – 5.0 – – –
Cash equivalent (Birr)Male labor 5.2 5.2 4.2 4.4 4.4 4.8Female labor 6.0 – 5.3 – – –
Transporting Number of days
Male labor 9.7 – 19.0 1.0 7.0 28.0Female labor – – – – – –
Cash payment (Birr)Male labor 5.5 – 5 7.0 5.0 5.0Female labor – – – – – –
Cash equivalent (Birr)Male labor 6.5 – 4 6.8 3.0 3.0Female labor – – – – – –
Threshing Number of days
Male labor 9.7 – 28.4 22.3 8.0 9.0Female labor – – – 8.0 – –
Cash payment (Birr)Male labor 6.8 – 5.7 5.7 8.8 4.3Female labor – – – 7.0 – –
Cash equivalent (Birr)Male labor 5.4 – 3.8 3.8 6.8 5.0Female labor – – – – – –
39

Table 38. Division of household labor by gender and non-agricultural tasks in Ada, Lume, and Gimbichu woredas, Ethiopia
Ada Lume Gimbichu
Task MHH FHH MHH FHH MHH FHH
Food preparationAverage number of days/week
Head – 7.0 – 6.1 – 5.6Wife 6.7 – 6.5 – 5.2 –Son – – – – – –Daughter 6.4 6.3 6.2 5.3 3.6 4.1Relatives 7.0 7.0 7.0 – 6.0 5.5Non-relatives – 7.0 – 7.0 4.8 –
Average hours per dayHead – 3.5 – 4.2 – 2.6Wife 3.02 – 5.3 – – –Son – – – – – –Daughter 3.6 3.85 6.5 3.4 2.9 2.6Relatives 3.0 – 5.8 – 4.7 2.8Non-relatives – 2.8 – 6.5 4.2 –
Fetching waterAverage number of days/week
Head 7.0 6.2 4.3 6.0 4.3 4.7Wife 7.0 – 6.2 – 5.6 –Son – 4.5 4.6 5.0 5.0 4.5Daughter 6.8 5.6 6.0 6.0 5.6 5.5Relatives 7.0 7.0 2.0 5.0 5.5 5.8Non-relatives 7.0 6.6 5.3 3.5 5.5 –
Average hours per dayHead 1.0 1.1 0.7 1.1 0.4 1.0Wife 1.2 – 0.9 – 0.8 –Son – 2.0 1.6 1.2 1.4 1.2Daughter 2.01 1.7 1.1 1.2 0.8 1.4Relatives 1.0 2.0 1.5 1.3 0.6 0.9Non-relatives 1.0 0.8 2.6 1.0 1.0 –
ChildcareAverage number of days/week
Head 6.7 7.0 – 7.0 3.0 5.8Wife 6.4 – 6.8 – 5.5 –Son – – – – – –Daughter 6.1 7.0 6.8 7.0 3.5 –Relatives – 1.0 – 7.0 – –Non-relatives – – 7.0 7.0 1.0 –
Average hours per dayHead 3.0 6.1 – 5.3 3.5 7.1Wife 6.0 – 5.1 – 5.8 –Son – – – – – –Daughter 7.5 7.5 5.5 5.7 1.1 –Relatives – 6.0 – 8.0 – –Non-relatives – – 4.0 6.0 4.0 –
(Continued) ➞
6.4 Use of Family Labor in Non-Agricultural Production Tasks
6.4.1 Food preparationHousehold members’ involvement in various non-agricultural tasks is shown in Table 38. Foodpreparation is generally the responsibility of women in Ethiopia and no male heads of householdwere involved. In all woredas, wives, daughters, and relatives participated in food prepartion. Non-relatives also participated in MHHs in Gimbichu and in FHHs in Ada and Lume. Relatives were moreinvolved in food preparation than wives across all three woredas, perhaps because of a cultural
40

Table 38. (Cont'd.)
Ada Lume Gimbichu
Task MHH FHH MHH FHH MHH FHH
Social activitiesAverage number of days/week
Head 2.3 2.3 2.0 4.4 2.7 2.0Wife 2.1 – 4.7 – 2.0 0.7Son 1.5 1.8 2.0 2.1 4.5 –Daughter 2.0 1.0 4.8 5.2 3.6 4.0Relatives – – 1.0 – 3.5 4.0Non-relatives – – 2.8 1.3 3.3 2.0
Average hours per day 2.7Head 4.5 4.8 4.2 3.6 5.6 4.5Wife 4.7 – 3.6 – 3.9 –Son 2.5 3.0 5.0 4.0 6.5 5.1Daughter 6.5 3.0 3.4 2.7 6.0 3.4Relatives – – 5.0 – 6.5 5.0Non-relatives – – 2.1 3.3 5.3 3.8
Making handicraftsAverage number of days/week
Head – – – 3.3 – 3.0Wife – – 2.9 – 2.3 –Son – – – – – –Daughter 4.3 – 2.6 3.8 4.0 4.0Relatives – – – – – 4.0Non-relatives – – 2.0 – 1.0 –
Average hours per dayHead – – – 3.0 – 5.3Wife – – 3.0 – 3.5Son – – – – – –Daughter 3.3 – 3.0 2.5 5.0 6.0Relatives – – – – – 3.0Non-relatives – – 2.0 – 1.0 –
tradition that considers it disrespectful for wives to cook in the presence of relatives. The averagenumber of days spent per week on food preparation in MHHs varied from 3.6 days by daughters inGimbichu to 7 days by relatives in both Ada and Lume.
In FHHs, the average number of days spent on food preparation per week ranged from 4.1 days bydaughters in Gimbichu to 7 days by heads, relatives, and non-relatives in Ada and non-relatives inLume. With the exception of Gimbichu, female heads of households, like wives in MHHs, spentfewer days per week on food preparation than other household members. Again, relatives and non-relatives spent more days per week on food preparation than other family members. In general,household members spent on average relatively fewer days on food preparation in FHHs than inMHHs, although the difference was not significant.
The average hours spent per day on food preparation in MHHs ranged from 2.9 hours by daughtersin Gimbichu to 6.5 hours by daughters in Lume. The average number of hours spent by all householdmembers on food preparation per day was highest in Lume followed by Gimbichu and Ada. Amongmembers of the farm household, wives spent fewer hours per day on food preparation thandaughters, relatives, and non-relatives. With the exception of Lume, daughters in Ada and Gimbichuspent more hours per day on food preparation than any other family member.
41
In FHHs, the average hours spent per day on food preparation ranged from 2.6 hours by heads anddaughters in Gimbichu to 6.5 hours by non-relatives in Lume. Female heads of household spent onaverage 3.5, 4.2, and 2.6 hours on food prepartion in Ada, Lume, and Gimbichu, respectively.However, daughters in Ada, non-relatives in Lume, and relatives in Gimbichu spent on average morehours per day on food preparation than female heads of household. With the exception of Ada,household members in MHHs spent on average more hours per day on food preparation thanhousehold members in FHHs, although the difference was not significant.
6.4.2 Fetching waterIn both MHHs and FHHs in all woredas, the average time spent per day on fetching water wasaround 2 hours, an indication that water points were relatively close to homesteads. All householdmembers in MHHs spent more than 4 days each week fetching water, with the exception of relativesin Lume and sons in Ada. The average number of days spent fetching water per week varied from 2by relatives in Lume to 7 by the head, wife, relatives, and non-relatives in Ada. Heads of householdsspent an average of 7 days per week in Ada and 4.3 days in Lume and Gimbichu fetching water,while wives spent 7 days in Ada, 6.2 days in Lume, and 5.6 days in Gimbichu. With the exception ofAda, wives spent more days per week fetching water than male heads. Daughters spent an averageof 6.8 days, 6 days, and 5.6 days per week fetching water in MHHs in Ada, Lume, and Gimbichu,respectively.
In general, household members in FHHs spent more days per week fetching water than householdmembers in MHHs. In FHHs, the average number of days spent fetching water ranged from 3.5 bynon-relatives in Lume to 7 by relatives in Ada. Female heads spent on average 6.2, 6, and 4.7 daysfetching water in Ada, Lume, and Gimbichu, respectively, while relatives spent 7, 5, and 5.8 daysper week fetching water in Ada, Lume, and Gimbichu. Daughters and relatives spent 5.6 and 7 daysin Ada, 6 and 5 days in Lume, and 5.5 and 5.8 days in Gimbichu, respectively.
6.4.3 ChildcareChildcare is one of the reproductive roles of gender. In both MHHs and FHHs in Ada and Lume,daughters were usually responsible for childcare, while in Gimbichu it was the wife in MHHs and thehead in FHHs.
In MHHs, household heads spent on average 6.7 days per week in Ada and 3 days per week inGimbichu taking care of children. Male heads in Lume did not spend time caring for children. Wivesspent 6.4, 6.8 and 5.5 days per week in Ada, Lume, and Gimbichu, respectively, looking afterchildren. Daughters spent 6.1, 6.8 and 3.5 days per week in Ada, Lume and Gimbichu, respectively,while non-relatives spent 7 and 1 days per week in Lume and Gimbichu, respectively.
In FHHs, the responsibility for children rested with the head, daughters, and relatives. Heads ofhousehold and daughters spent on average 7 days per week caring for children in both Ada andLume while the head spent 5.8 days per week in Gimbichu. In Gimbichu only the household headcared for the children. Relatives spent 1 day in Ada and 7 days per week in Lume caring forchildren. In Lume, non-relatives spent on average 7 days per week caring for children.
42

In MHHs, household heads spent on average 3 and 3.5 hours per day on childcare in Ada andGimbichu, respectively, while in Lume, the head did not spend any time on childcare. Wives, on theother hand, spent 6, 5.1, and 5.8 hours per day in Ada, Lume, and Gimbichu, respectively.Daughters spent 7.5, 5.5, and 1.1 hours per day in Ada, Lume, and Gimbichu, respectively. Non-relatives spent 4 hours per day in Lume and Gimbichu while they did not spend any time onchildcare in Ada.
Female household heads spent on average 6.1 hours per day in Ada, 5.3 hours per day in Lume and7.1 hours per day in Gimbichu on childcare while daughters spent 7.5 and 5.7 hours per day in Adaand Lume, respectively. Relatives spent 6 and 8 hours per day in Ada and Lume, respectively, whilenon-relatives spent 6 hours per day in Lume.
6.4.4 Firewood collectionAlmost all household members collected firewood. In MHHs, the head spent 5 and 1 days per weekcollecting firewood in Ada and Lume, respectively, while in Gimbichu the head did not collectfirewood. Wives spent 3.6, 3.8, and 2.6 days per week collecting firewood in Ada, Lume, andGimbichu, respectively, while daughters spent 4.1, 2, and 2.5 days per week. Relatives and non-relatives also gathered firewood.
In FHHs, the head and daughters were mainly responsible for collecting firewood. Household headsspent 3.6, 3.3, and 3.8 days per week collecting firewood in Ada, Lume, and Gimbichu,respectively, while daughters spend 5.2 and 3.3 days per week in Ada and Lume.
6.4.5 Social activities and handicraft makingHousehold members also spent time attending local festivals, funerals, wedding ceremonies, andother social gatherings. In general, MHHs and FHHs spent the same amount of time on socialactivities.
Household members in all three woredas spent little time making handicrafts. Across woredas, moredaughters participated in this activity than any other household member.
7.0 GENDER DIFFERENTIALS IN AGRICULTURAL PRODUCTION,UTILIZATION, AND FOOD AVAILABILITY
In sub-Saharan Africa, agriculture is the livelihood of 69% of the economically active population. Theproductive capacities of natural resources on the continent depend on the productive capacities of itspeople. In rural communities, producers and consumers live in the same household and are often thesame people. The way rural households function and make decisions and their visions of the futurehave long been recognized as essential information for planners and policymakers in the agriculturalsector. What is less frequently recognized is the significance of the consequences of different levelsand patterns of consumption and the effects of agricultural decisions on household food security andnutritional status of both the producers and consumers in rural and urban areas (FAO 1997).
43
Food security may have different meanings for different people. The International Conference onNutrition, held in Rome in 1992, defined food security as “access by all people at all times to thefood needed for a healthy life” (FAO/WHO 1992). Essentially, to achieve food security a countrymust achieve three basic aims: ensure adequate quantity, quality, and variety of food; optimizestability in the flow of food supplies; and secure sustainable access to available food supplies by allwho need them. Adequate food availability at the national, regional, and household levels, obtainedthrough markets and other channels, is the cornerstone of nutritional well being. At the householdlevel, food security implies physical and economic access to foods that are adequate in terms ofquantity, nutritional quality, safety, and cultural acceptability to meet each person’s needs. Householdfood security depends on adequate income and assets, including land and other productive resources.It is ultimately associated with access to nutritionally adequate food at the household level, i.e., theability of households or individuals to acquire a nutritionally adequate diet at all times.
Agricultural decisions may result in a direct change in diet or in the quantity, quality, variety, andsafety of food available in a particular community. Frequently, the effect is a change in access to foodfor a particular sector of society or community because of fluctuations in food prices or in householdincome. All of these changes affect consumers' consumption of food, health, and productivity. Thepoor, who do not have the resources or adequate stocks to withstand a crisis and to maintainhousehold food security on a sustainable basis, are especially affected by these changes (FAO 1997).
7.1 Methodology
Food balance data simply provide information on the quantity of food available to the consumer.Actual food consumption data, on the other hand, help to identify the types of food consumed andnutritional problems experienced by a certain population group. Food consumption data may comefrom two types of surveys: by actually weighing the food consumed in the household and/or bycollecting data on household food expenditure (the quantity and monetary value of food itemsacquired and/or consumed by households). Surveys of actual consumption rather than expenditureyield more representative and complete estimates of “habitual” food intake, as information such asfood wastage and food produced at home is accounted for (FAO 1997).
Table 39 shows the production and consumption patterns of each household in Ada, Lume, andGimbichu for main food crops. From these quantities of grains and pulses the calorie equivalent wascalculated (using the conversion factors of FAO’s Country Nutrition Profile of Ethiopia 1997). Itshould be noted from the outset that these data by no means represent the food security status of thehousehold. Rather, they give a rough estimate of whether there were gender differentials in dailyenergy production and consumption from the major food crops produced in the study area.
7.2 Results and Discussion
The Ethiopian diet is based mainly on cereals, which provide about 70% of calorie intake. Ada,Lume, and Gimbichu are known for their cereal and pulse production, and thus the calorie intake isbased on cereal and pulse production (Mulat et al. 1995).
44

The mean daily energy (in calories) of production per person per day was about 2,278 for MHHsand 2,291 for FHHs. These amounts are higher than the average national energy supply fromcereals (1,713 calories per person per day) (FAO 1996). MHHs and FHHs did not differsignificantly in total calorie production per person per day. This finding is different from otherfindings reported in the literature, in which FHHs are usually categorized as being at the chronicstage in terms of access to food (Debebe and Maxwell 1992).
The total cereal calorie consumption of both MHHs and FHHs was lower than the dailyrequirement recommended by FAO/WHO/UNU (1,540 calories per person per day for cerealsonly). The amount of calories consumed per person per day was about 894 and 877 for MHHsand FHHs, respectively. The main explanation for the low calorie consumption per person per day
Table 39. Mean quantities of agricultural production and consumption (quintal) by type of crop in Ada, Lume, andGimbichu woredas, Ethiopia
Ada Lume GimbichuCrop production andutilization MHH FHH MHH FHH MHH FHH
BarleyGrain produced 7.66 4.92 4.67 3.81 3.00 –Grain consumed 3.08 2.13 2.73 2.01 1.00 –
ChickpeaGrain produced 3.66 3.73 5.78 5.30 4.22 4.16Grain consumed 2.03 2.06 1.51 1.43 1.01 0.95
Faba beansGrain produced 3.83 4.00 2.16 1.33 1.25 2.31Grain consumed 1.96 2.00 0.99 0.70 0.87 0.50
Field peasGrain produced 3.13 1.56 2.48 1.49 2.16 1.70Grain consumed 1.35 0.82 0.95 0.74 0.41 0.65
Haricot beansGrain produced 1.36 1.50 3.85 3.95 – –Grain consumed 0.98 – 1.12 1.38 – –
LentilsGrain produced 2.75 – 0.65 1.08 8.00 6.40Grain consumed 1.60 – 0.50 0.70 0.68 0.61
MaizeGrain produced 4.00 – 7.62 5.73 – –Grain consumed 2.40 – 3.29 2.28 – –
Rough peasGrain produced 2.52 3.28 2.86 0.50 2.25 1.41Grain consumed 1.93 1.50 0.90 0.35 0.90 0.79
TefGrain produced 14.82 12.19 16.70 13.65 6.44 5.05Grain consumed 7.02 5.55 6.13 4.69 2.62 1.81
WheatGrain produced 7.54 5.65 8.56 4.79 20.16 15.05Grain consumed 3.47 2.57 3.68 2.65 6.80 5.65
45

is that the households consumed small portions of the cereals and pulses they produce. Figures 2 and3 show the wheat and teff utilization by gender of the household head. About 38% of MHHs and42% of FHHs consumed the wheat they produced, while 40% of MHHs and 39% of FHHsconsumed their tef produce. The amount of food that farmers purchased after they sold theirproduce was not included in the calculation of calories consumed, and therefore the daily calorieintake is underestimated.
The three woredas differed significantly with respect to the calorie production per person per day.The mean calorie production per person per day was 1,707, 2,668, and 2,478 in Ada, Lume, andGimbichu, respectively. The daily calorie production per person was below the joint recommendationof FAO/WHO/UNU only in Ada. The daily cereal calorie consumption per person was about 810 inAda, 775 in Gimbichu, and 1,083 in Lume. The calorie consumption per person per day wassignificantly higher in Lume than in Ada and Gimbichu (p<0.05). In Ada, environmental degradationhas significantly reduced land availability, and hence contributed to food insecurity (Debebe andMaxwell 1992).
8.0 GENDER DIFFERENTIALS IN AGRICULTURAL PRODUCTIVITY
Overcoming stagnating agricultural productivity and food insecurity hinges on increasing agriculturalproductivity. In many parts of sub-Saharan Africa, where subsistence agriculture predominates, it isparamount to place strong emphasis on increasing the productivity of labor, land, capital, and otherresources. Agricultural productivity may vary by gender if men and women use different technologiesor different quantities of production factors, or if there are differences in the quality of these factors(Saito, Mekonnen, and Spurling 1994). In this section, we use a Cobb-Douglas production functionto assess whether agricultural productivity varies in MHHs and FHHs.
45
40
35
30
25
20
15
10
5
0Consumed Kept as seed Sold Given away
Figure 2. Utilization of wheat by gender of householdhead in Ada, Lume, and Gimbichu woredas, Ethiopia.
MHH
FHH
%
50
45
40
35
30
25
20
15
10
5
0Consumed Kept as seed Sold Given away
Figure 3. Utilization of tef by gender of household headin Ada, Lume, and Gimbichu woredas, Ethiopia.
MHH
FHH
%
46

8.1 The Production Function
A Cobb-Douglas production function, in which coefficients of input variables were estimated fromsurvey data, was used to used to assess the extent to which productivity was affected by variousinputs. The variables were hypothesized to influence the adoption of improved wheat varieties eitherpositively (+), negatively (-), or positively and/or negatively (+/-). The production function can beexpressed as:
[1] Y = β0,i * X1,iβ1,i * X2,i
β2,i…Xn,iβn,i
i =1,2 (1= MHH; 2= FHH),
where:
Y = gross value of farm output in Birr2 ;X1 = age of the household head (yr) (+/-);X2 = total family labor used for agricultural production (weighted by 1 h/yr for
men and women and 0.5 h/yr for children) (+);X3 = farm size (ha) (+);X4 = number of tropical livestock units (weighted by 1 for cattle, 0.14 for goats
and sheep, 0.43 for donkeys, and 0.02 for poultry) (+);X5 = amount of inorganic fertilizer used (kg N/ha) (+);X6 = quantity of herbicide (ha) (+);X7 = quantity of insecticide (ha) (+);X8 = hired labor for agricultural production (h/yr) (+);X9 = extension contact (dummy variable = 0 if no contact, 1 if contact) (+);X10 = education of household head (dummy variable = 0 if illiterate, 1 if literate) (+);b0 = constant;bi’s = estimated parameters.
The Cobb-Douglas production function is used widely because of a number of desirable properties. Oneof these desirable properties is that βi’s are the elasticities of output with respect to the relevant input. Acritical assumption is that βi’s are positive and each is less than one. The sum of the βi’s also providesthe returns to scale parameter. Another attractive property of the production function is that,econometrically, it is easy to estimate, because in its log form, the parameters are linear and can beestimated easily using the Ordinary Least Squares method. However, since it treats input choices asexogenous, it is susceptible to management bias. Ideally, input choices should be modeledsimultaneously with the production function, but this usually requires price variation. In addition, theCobb-Douglas production functional form is not flexible for modeling complements and substitutes,such as the relationship of land and labor or the role of labor availability in choosing variable inputs(Saito, Mekonnen, and Spurling 1994).
2 Output is calculated as the farmgate price multiplied by yields (including straw yields). The crops included in the total outputwere barley, chickpeas, faba beans, field peas, lentils, maize, rough peas, teff, and wheat.
47

8.2 Model Results
The estimates of the Cobb-Douglas production function are shown in Table 40. The coefficients ofmultiple determination adjusted for degrees of freedom indicated that the variation in gross value ofoutput per hectare associated with the factors of production specified in the model was 72% and82% in MHHs and FHHs, respectively.
The significant factors affecting gross value of output for MHHs were farmer’s age, family labor,farm size, livestock units, and inorganic fertilizer; in FHHs, they were family labor, farm size,livestock units, inorganic fertilizer, hired labor, and extension contact.
In MHHs, a farmer’s age had a significant and negative impact on gross output. A 10% increase inthe farmer’s age resulted in a 2.1% decrease in gross output. Family labor had a significant andpositive impact on the gross value of output for both MHHs and FHHs. A 10% increase in theamount of labor resulted in a 2.3% and 1.8% increase in gross value of output for MHHs and FHHs,respectively. Farm size had a positive and significant impact on the gross value of output for MHHsand FHHs. A 10% increase in farm size resulted in a 5.6% and a 7.2% increase in gross value ofoutput for MHHs and FHHs, respectively.
The number of livestock had a positive and significant impact on the gross value of output for bothhouseholds. A 10% increase in the number of livestock for MHHs and FHHs resulted in a 1.3% and0.7% increase in the gross value of output, respectively. The amount of inorganic fertilizer used had apositive and significant impact on the gross value of output in both types of households as well. A 10%increase in the amount of fertilizer resulted in a 1% increase in gross value of output for both MHHs andFHHs. Saito, Mekonnen, and Spurling (1994) found that the use of inorganic fertilizer on plots managedby women in Kenya increased the gross output to 1.6% compared to 1.3% for plots managed by men.
Table 40. Estimates of Cobb-Douglas production function by gender in Ada, Lume, and Gimbichu woredas, Ethiopia
MHH FHH
Regression RegressionVariable coefficient (b) T-statistic coefficient (b) T-statistic
Intercept 6.6271 9.41* 6.3330 8.38*Age of household head (yr) -0.2112 1.80*** -0.0817 0.74Family labor (h/yr) 0.2342 2.54** 0.1809 2.05**Farm size (ha) 0.5592 7.46* 0.7551 10.49*Tropical livestock units (number) 0.1332 2.67* 0.0719 1.63***Inorganic fertilizer (kg N/ha) 0.1012 1.69*** 0.1027 1.92***Herbicide (l/ha) 0.0679 1.36 0.0386 0.54Insecticide (l/ha) 0.0367 0.43 0.1520 0.89Hired labor (h/yr) -0.0007 0.05 0.0278 2.56**Extension contact (dummy) -0.0461 0.77 -0.2844 4.04*Education of head (dummy) -0.0288 0.44 -0.0922 1.48
Adjusted R2 0.72 0.82F-test 26.2* 35.8*Sample size (N) 100 77
Note: * = significant at p<0.01; ** = significant at p<0.05; and *** = significant at p<0.1.
48

The use of hired labor for agricultural production positively and significantly affected the gross outputfor FHHs, although the impact was only very marginal, because a 10% increase in the amount ofhired labor resulted in a 0.03% increase in gross output. Extension contact had a negative andsignificant impact on the gross output for FHHs. The gross output was lower for FHHs that hadcontact with extension services.
Allocative efficiency can be determined by comparing the marginal value product (MVP) of a factor with itsopportunity cost (factor price). The MVP of a factor is the additional return from adding one more unit ofthat factor, holding all other inputs constant. In this study we have calculated the MVP using a 10%increase in the use of that factor. An MVP that exceeds its opportunity cost suggests that there is scopefor raising productivity by increasing the use of that factor. Conversely, increasing the use of a factor forwhich the MVP is less than the associated opportunity cost will decrease productivity.
MVPs for family labor, farm size, and fertilizer were determined for MHHs and FHHs. Table 41 shows theMVPs and factor prices for the significant variables for MHHs and FHHs using a 10% increase in theactual use of inputs. Thus, for FHHs 126.3 hours (10% of 1,263 h/yr) were added. The factor price wasthen calculated using a daily wage rate of Birr 5.5/day. The duration of a working day was 8 hours.Factor prices for farm size and fertilizer were calculated by using the average rent (Birr 311/kert) andactual fertilizer prices (Birr 5.2 per kilogram of N/ha). These prices were multiplied by a 10% increase infarm size (0.3 ha for MHHs and 0.24 ha for FHHs) and fertilizer use (6.4 kg N/ha for MHHs and 4.4 kgN/ha for FHHs). The MVP of family labor compared to its price (wage rate) is higher in MHHs and lowerin FHHs, indicating that MHHs could increase their productivity by using more family labor. A study byQuisumbing (1993) also found that the marginal product of women’s labor was lower than that of men’s.Also, Quisumbing (1996) cites a study in India in which the marginal product of male labor is greater thanthat of female labor.
The MVP of farm size was lower than its factor price for MHHs and higher for FHHs; thus FHHs couldincrease their productivity by cultivating more land. The MVP for inorganic fertilizer was higher than itsfactor cost for both MHHs and FHHs, which indicates that both types of household could increase theirproductivity by increasing their use of inorganic fertilizer.
In general, MHHs had more land, labor, and capital (particularly cattle) than FHHs. It was also shown thatMHHs had more access to formal education than FHHs.
Table 41. MVP and factor prices (in Birr) for significant variables by gender of household head in Ada, Lume, andGimbichu woredas, Ethiopia
MHH FHH
Factor MVP Factor price MVP Factor price
Family labor (h/yr) 145.70 114.74 82.05 86.72Farm size (ha) 353.36 372.96 356.33 299.32Inorganic fertilizer (kg N/ha) 62.55 33.07 47.02 23.11
49

The production function analysis showed that elasticities for the significant factors affecting the gross valueof output for MHHs were farmer’s age (-0.21), fertilizer (0.10), farm size (0.56), labor (0.23), and livestock(0.13). For FHHs the elasticities were fertilizer (0.10), farm size (0.76), labor (0.18), livestock (0.07), hiredlabor (0.03), and extension (-0.28). The negative elasticity for extension implies that policymakers and theMinistry of Agriculture should specifically target FHHs to mitigate extension’s negative effect on gross valueof output for FHHs.
The comparison of MVP with the factor cost showed that MHHs could increase productivity by usingmore labor and fertilizer, while FHHs could do so by using more land and fertilizer. MHHs (Birr 6,456/ha) had a higher gross output compared to FHHs (Birr 4,776/ha). However, the gross value of theoutput was 1.3% higher for FHHs if the average value of inputs from MHHs were used. This suggeststhat no significant productivity differences between MHHs and FHHs would exist if FHHs had equalaccess. Moock (1976) in Kenya also found that women obtained 6.6% more output at the mean levelsof input compared to men. Saito, Mekonnen, and Spurling (1994) found that women in Kenyaobtained about 22% more output than men if they had equal access to resources as men. Quisumbing(1996), however, stated that these kinds of simulations should be interpreted with caution, since we donot know how the levels of inputs could be raised for FHHs.
9.0 GENDER DIFFERENTIALS IN TECHNOLOGY ADOPTION
9.1 Factors Affecting the Adoption of Wheat Production Technologies
In 1997, about 59% and 42% of MHHs and FHHs, respectively, grew wheat. Local wheat varietieswere grown by 70% of MHHs and 86% of FHHs. A significantly higher proportion (t=5.7, p<0.05) ofMHHs (30%) grew improved wheat varieties than FHHs (14%). In FHHs, the decision to growimproved wheat varieties was always made by the head; in MHHs it was either a joint decision betweenthe head and wife (55.6%) or a decision by the head alone (44.4%). About five years ago, the adoptionof improved wheat varieties was over 90% in the same study area (Workneh et al. 1994). The declinecan be partly attributed to farmers who considered their recycled improved wheat seed as local.Furthermore, most farmers reported that the seed of the preferred wheat variety was not avalailable.
The two models frequently used in adoption studies are logit and probit (Feder, Just and Zilberman1985). For this study, the logit model is used to analyze factors affecting decisions in MHHs and FHHsto adopt improved wheat varieties. It is hypothesized that the use of improved wheat varieties isinfluenced by a combined (simultaneous) effect of a number of factors related to farmers’ objectives andconstraints (CIMMYT 1993). The variables were hypothesized to influence the adoption of improvedwheat varieties positively (+), negatively (-), or positively and/or negatively (+/-).
Following Gujarati (1988) the model is specified as:
[2] ln (P/(1-P)) = β0 + β1 X1 + β2 X2 + β3X3+β4 X4+β5 X5+β6 X6+β7 X7+β8 X8 + β9 X9+ e
where:
X1 = RADIO (owned) (+);X2 = LUNITS (number of livestock owned) (+);
50

X3 = MEMBCOOP (membership in a service cooperative) (+);X4 = HHSIZE (household size) (+);X5 = EXTCON (extension contact during the last 3 months) (+);X6 = EDUHEAD (education level of the head) (+);X7 = DISTMKT (average distance from farm to market in km) (-);X8 = AREALAND (area of farm in hectares) (+);X9 = AGEHH (age of the household head in years) (+/-); ande = error term.
9.2 Model Results
The logistic model explains 84% and 89% of the total variation specified in the model for MHHs andFHHs, respectively (Table 42). The chi-square indicates that the parameters are significantly differentfrom zero at the 1% level for MHHs and FHHs.
The odds in favor of adopting improved wheat varieties increased by a factor of 22.1 for MHHs thathad access to extension services. MHHs benefited more from extension than FHHs. Other studies(Moock 1976; Saito, Mekonnen and Spurling 1994) have found similar results.
Radio ownership increased the odds in favor of adopting improved wheat varieties by a factor of 5.9for FHHs. Chilot, Shapiro and Demeke (1996) also found that radio ownership significantly andpositively affected the adoption of improved wheat varieties.
Table 42.Parameter estimates of a logistic model for factors affecting adoption of improved wheat varieties in Ada,Lume, and Gimbichu woredas, Ethiopia
MHH FHH
Parameter Wald ParameterHousehold characteristic estimate (β) Statistic estimate (β) Wald statistic
Intercept -5.2808** 5.01 -12.5913*** 0.08Radio 0.1031 0.0136 -1.7676 0.8156Livestock (TLU) 0.0517 0.30 0.0609 0.11Membership in cooperative -1.8079 1.48 8.9540 0.04Household size (number of people) 0.1958 1.71 -0.0012 -Extension contact 3.0973*** 18.27 1.5066 2.27Education 1.1862 2.08 1.8381 2.48Distance to market (km) -0.0155 0.04 -0.1714 1.82Farm size (kert) 0.1285* 3.21 0.1650* 3.74Age (yr) 0.0012 - -0.0160 0.09Chi-square 47.74*** 20.42***Overall predicted 84.3% 89.2%N 89.0 65.0
Note: * = significant at p<0.1; ** = significant at p<0.05; and *** = significant at p<0.01.
51
If farm sizes are increased, the odds in favor of adopting improved wheat varieties increase by a factorof 1.1 for MHHs and 1.2 for FHHs. The average farm size, area under wheat, and livestock units weresignificantly higher for MHHs than FHHs. If the farm size of both MHHs and FHHs increased, theprobability of adopting improved wheat varieties would increase almost equally.
The results showed that MHHs were more likely to adopt improved wheat varieties than FHHs.However, the availability of seed of improved wheat varieties should be addressed, because lack of seedhas discouraged adoption. In FHHs, the decision to grow improved wheat varieties was always made bythe head, while in MHHs it was either a joint decision between the head and the wife (55.6%) or adecision by the head alone (44.4%). Some studies have also shown that women and men are faced bydifferential access to new technology, education, health care, and other resources (Ahmed 1985,Stamp 1989, Abu and Oppong 1987).
10.0 GENDER DIFFERENTIALS IN ACCESS TO RURAL INSTITUTIONS
10.1 Credit Services
Credit availability, by increasing risk-taking capacity, increasing the ability to invest, and improving accessto other productive inputs and assets, is very important for improving farm productivity and returns.
The high price of fertilizer and agro-chemical supplies (implying the need for more cash) and the non-availability of loans (as much as required) from the bank and informal credit sources are among the majorproblems of crop production. This problem is very much reflected in the list of items (fertilizer, seed,chemicals, and equipment, in order of importance) purchased by farmers with the credit they obtained(Table 43).
All the sampled MHHs, and 96.3% and 95.7% FHHs in Ada and Lume, respectively, said they usedsome kind of credit facility. Although credit sources included the bank, co-operative, local lenders, andrelatives, farmers’ use of credit varied among the woredas.
More than 85% of MHHs and FHHs across the woredas required collateral to obtain credit. The type ofcollateral used was generally co-signature in Ada (71.9% for MHHs and 92% for FHHs) and Lume (97%for MHHs and 95.5% for FHHs). This form of collateral was less common in Gimbichu where groupguarantee was used more frequently (76.7% for MHHs and 82.6% for FHHs). Land and future crop wereused less frequently as collateral. The head of the household was mainly responsible for putting upcollateral in all households.
All farmers in Ada reported that they obtained credit from the bank and not from the service co-operative, whereas farmers in the other two woredas (except 4.2% of FHH in Lume) said they obtainedcredit from their respective service co-operatives. Over 85% of both MHHs and FHHs in the threeworedas did not secure any credit from local moneylenders. Sample households in Lume woreda aredifferent because they use irrigation throughout the year and plant a lot of cash crops, especiallyhorticultural crops like tomatoes.
52

The credit that farmers received from the co-operative was tied to the extension program. Access to creditin this case was possible if one was willing to buy inputs included in the extension program at a givenprice. As Chipande (1987) has pointed out, extension programs use credit as a means of persuadingfarmers to adopt a certain package of technology. When the initial credit strategy is analyzed, two
Table 43. Some selected variables on credit facilities by gender of household head in Ada, Lume, and Gimbichuworedas, Ethiopia
Ada Lume Gimbichu
MHH FHH MHH FHH MHH FHH
(%) (Respondents) (%) (Respondents) (%) (Respondents) (%) (Respondents) (%) (Respondents) (%) (Respondents)
Use credit 100.0 32 96.3 26 100.0 35 95.7 23 100.0 33 100.0 27Collateral is required 100.0 32 96.2 25 94.3 33 95.7 22 90.9 30 85.2 23Type of collateral
Co-signature 71.9 23 92.0 23 97.0 32 95.5 21 23.3 7 17.4 4Group guarantee 15.6 5 – 3.0 1 4.5 1 76.7 23 82.6 19Land 9.4 3 8.0 2 – – – –Future crop 3.1 1 – – – – –
Who put up collateral?Head 100.0 32 91.7 22 97.0 32 100.0 22 96.7 29 87.0 20Wife – – 3.0 1 – – –Head and wife – – – – 3.3 1 –Son – 8.3 2 – – – 13.0 3
Where was credit obtained?Bank 100.0 32 100.0 27 – – – –Co-operatives – – 100.0 35 95.8 23 100.0 33 100.0 27Local money lenders 15.6 5 7.4 2 14.3 5 4.2 1 – 3.7 1Relatives – 3.7 1 8.6 3 – – –
Items purchased by creditFertilizer 100.0 32 100.0 26 100.0 35 100.0 23 100.0 33 100.0 27Seed 12.5 4 11.5 3 42.9 15 21.7 5 3 1 –Chemicals 3.1 1 – 42.9 15 30.4 7 – –Equipment – – 34.3 12 17.4 4 – –
Reason for not using creditNo need – 100.0 1 – – – –Lack of awareness – – – 100.0 1 – –
Membership in a service co-operative 75.0 24 74.1 20 100.0 35 100.0 24 97.0 32 100.0 27Co-operative Services
Marketing services – – 68.6 24 58.3 14 6.3 2 14.8 4Technical services 8.3 2 – 34.3 12 16.7 4 50.0 16 51.9 14Credit services – – 97.1 34 95.8 23 100.0 32 96.3 26Farm input 62.5 15 85.0 17 77.1 27 54.2 13 75.0 24 74.1 20
Membership in a women’s group 46.9 15 51.9 14 94.3 33 95.8 23 93.1 27 92.6 25Main activities of
women’s groupBusiness activities – – 84.8 28 91.3 21 – –Social activities – – 100.0 33 100.0 23 100.0 27 100.0 25
Women’s group affiliationwith another agency or institutionResearch 100.0 15 78.6 11 18.2 6 9.1 2 – – – –Aid agencies 100.0 15 100.0 14 100.0 6 100.0 2 – – – –
Average amount (Birr) andduration (months) of creditfrom co-operatives and bankAmount 762.71 32 635.00 26 1,046.57 35 736.69 23 1,296.21 33 1,056.77 27(t –value) NS 2.09* NS
53

conclusions can be drawn. First, the credit package did not take into account that land resources,managerial ability, and labor resources varied across households, so a number of farmers received creditpackages that were inappropriate for their needs and resources. Naturally such households defaulted(Kinsey 1974). Second, there was a close relationship between defaulting and the mean labor unitsavailable to the household. This finding suggests that labor-deficient households were offered labor-intensive packages that they were unable to manage adequately. This resulted in poor yields that in turn ledto defaults. The observation that labor-deficient households were likely to default led to a reorientation ofthe criteria for granting credit. During the second stage, the emphasis was on the “ability to repay”principle. Credit was granted only to those deemed credit-worthy and FHHs lost out.
The average amount of credit obtained from the bank by households in Ada amounted to Birr 762.71(MHHs) and Birr 635 (FHHs). The amount obtained from cooperatives in Lume was relatively higher.However, FHHs received smaller amounts than their male counterparts from either the bank orcooperative. No credit programs were designed especially for women.
More women were members of women’s groups in Lume and Gimbichu than Ada. All group activitieswere social in Gimbichu but included business actitivies as well in Lume. The women’s group in Adawas affiliated to a research institute, while in Lume it was affiliated to aid agencies.
In MHHs, the decision to use credit was made either by the head alone or in conjunction with thewife. In FHHs, the head made the decision with some participation from the son (Table 44).
10.2 Extension Services
Adams (1983) defined extension as assistance to farmers to help them to identify and analyze theirproduction problems and to become aware of the opportunities for improvement. Rolling (1988) on theother hand defined agricultural extension as a communication process geared towards bringing voluntarybehavioral change. Ban van den and Hawkins (1988) have defined extension as the consciouscommunication of information to help people form sound opinions and make good decisions.
Table 44. Decision-making on the use and payment of credit by gender of household head in Ada, Lume, andGimbichu woredas, Ethiopia
Ada Lume Gimbichu
MHH FHH MHH FHH MHH FHH
(%) (Respondents) (%) (Respondents) (%) (Respondents) (%) (Respondents) (%) (Respondents) (%) (Respondents)
Who decides whether to use credit?Head 37.5 12 84.6 22 80.0 28 100.0 23 78.8 26 92.6 25Head and wife 62.5 20 – 20.0 7 – 3.0 1Son – 15.4 4 3.7 1
Who repays the credit?Head 97.1 34 100.0 23 40.6 13 100.0 26 87.9 29 88.9 24Wife 2.9 1 – – – 3.0 1 –Head and wife – – 59.4 19 – – –Son – – 59.4 19 – – –
54

Extension provided agricultural and vocational training on the use of fertilizer, insecticides, improvedseed, land use practices, animal husbandry, and home economics. In Lume, 48.6% of MHHsreported that they received agricultural and vocational training as compared to 9.4% in Ada. InFHHs, it was 3.7% in Ada and 25% in Lume (Table 45).
All households in Lume and 37.5% of MHHs and FHHs in Ada indicated that they were taught how touse fertilizer. In Lume 62.9% of MHHs and 45.8% of FHHs received information on the use ofinsecticides and 51.4% of MHHs and 16.7% of FHHs received information on the use of improvedseed. About 91% of MHHs and 62.5% of FHHs in Lume were taught land use practices, and allhouseholds were taught animal husbandry. In Ada farmers were taught neither land use practices noranimal husbandry. In Lume 54.2% of FHHs were taught home economics but none were taughtin Ada.
In Gimbichu, the extension messages were related to credit services (all MHHs and 96.3% of FHHs), farminputs (75% of MHHs and 74.1% of FHHs), and marketing services (6.3% of MHHs and 14.8% of FHHs).
The extension contact of households differed from woreda to woreda in the last three months. About81% (MHHs) and 88.9% (FHHs) in Ada and 45.7% (MHHs) and 58.3% (FHHs) in Lume reportedthat they had no contact with extension agents (Table 46). In both cases the figure for FHHs wasslightly lower, indicating again their lack of access to extension facilities. Farmers in Lume had bettercontact with extension agents than in Ada, but here as well, it was relatively less for FHHs.
In Kakamega District of Kenya, 40% of the women interviewed knew nothing about the extensionservices’ credit program and no woman manager had ever obtained a loan (Due, Mollel, and Malone1987). A survey in Nigeria’s Ogun State Agricultural Development Project revealed that extensionagents visited only 10% of women farmers every week, whereas 70% of male farmers were visitedweekly (Elabour-Idemudia 1991). Apart from outright discrimination, a number of factors account forwomen’s low participation in extension programs. The methods used to disseminate technicalinformation, such as the contact farmer approach and the use of training centers, tend to channelinformation to farmers who have more resources and who are generally men (Berger, Delancey, andMellencamp 1984).
Table 45. Type of extension services provided by gender of household head in Ada, Lume, and Gimbichuworedas Ethiopia
Ada Lume Gimbichu
MHH FHH MHH FHH MHH FHH
(%) (Respondents) (%) (Respondents) (%) (Respondents) (%) (Respondents) (%) (Respondents) (%) (Respondents)
Agricultural andvocational training 9.4 3 3.7 1 48.6 17 25.0 6 33.3 11 – –
Fertilizer use 37.5 12 37.0 10 100.0 35 100.0 24 87.9 29 51.9 14Insecticide use 3.1 1 – – 62.9 22 45.8 11 36.4 12 11.1 3Improved seed use 12.5 4 11.1 3 51.4 18 16.7 4 30.3 10 14.8 4Land use practices – – – – 91.4 32 62.5 15 18.2 6 11.1 3Animal husbandry – – – – 100.0 35 100.0 24 9.1 3 – –Home economics 3.1 1 – – – – 54.2 13 15.2 5 3.7 1
55
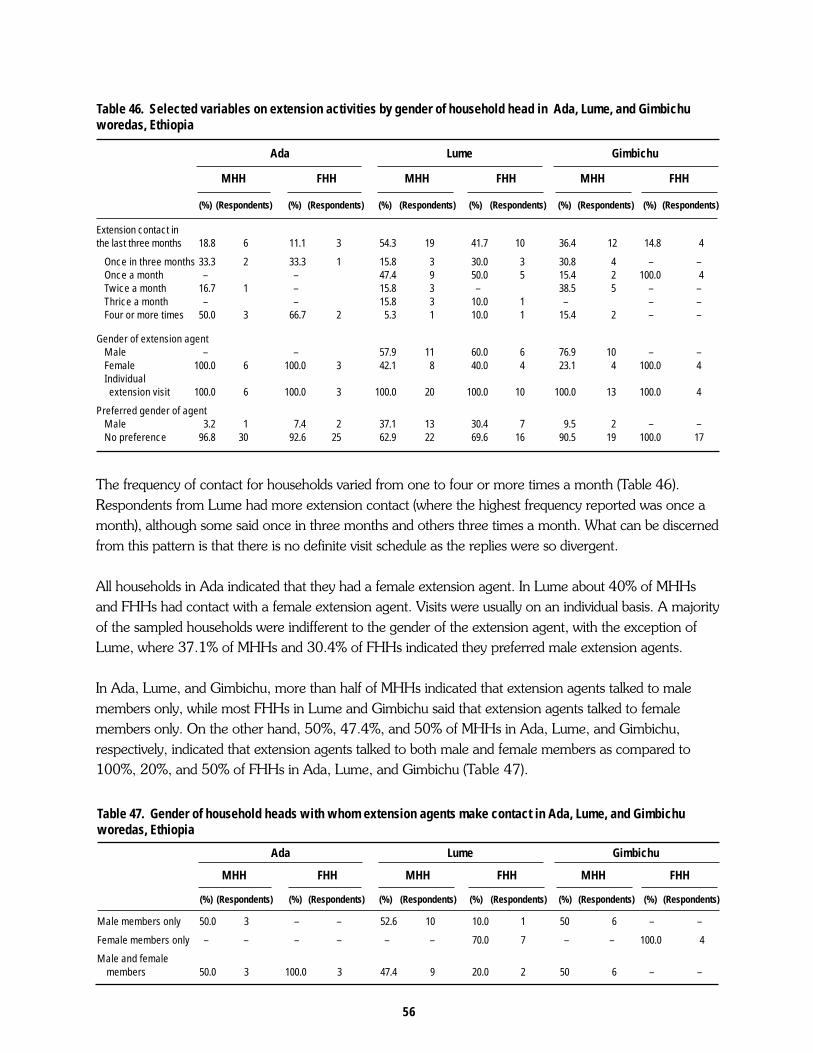
The frequency of contact for households varied from one to four or more times a month (Table 46).Respondents from Lume had more extension contact (where the highest frequency reported was once amonth), although some said once in three months and others three times a month. What can be discernedfrom this pattern is that there is no definite visit schedule as the replies were so divergent.
All households in Ada indicated that they had a female extension agent. In Lume about 40% of MHHsand FHHs had contact with a female extension agent. Visits were usually on an individual basis. A majorityof the sampled households were indifferent to the gender of the extension agent, with the exception ofLume, where 37.1% of MHHs and 30.4% of FHHs indicated they preferred male extension agents.
In Ada, Lume, and Gimbichu, more than half of MHHs indicated that extension agents talked to malemembers only, while most FHHs in Lume and Gimbichu said that extension agents talked to femalemembers only. On the other hand, 50%, 47.4%, and 50% of MHHs in Ada, Lume, and Gimbichu,respectively, indicated that extension agents talked to both male and female members as compared to100%, 20%, and 50% of FHHs in Ada, Lume, and Gimbichu (Table 47).
Table 46. Selected variables on extension activities by gender of household head in Ada, Lume, and Gimbichuworedas, Ethiopia
Ada Lume Gimbichu
MHH FHH MHH FHH MHH FHH
(%) (Respondents) (%) (Respondents) (%) (Respondents) (%) (Respondents) (%) (Respondents) (%) (Respondents)
Extension contact inthe last three months 18.8 6 11.1 3 54.3 19 41.7 10 36.4 12 14.8 4
Once in three months 33.3 2 33.3 1 15.8 3 30.0 3 30.8 4 – –Once a month – – 47.4 9 50.0 5 15.4 2 100.0 4Twice a month 16.7 1 – 15.8 3 – 38.5 5 – –Thrice a month – – 15.8 3 10.0 1 – – –Four or more times 50.0 3 66.7 2 5.3 1 10.0 1 15.4 2 – –
Gender of extension agentMale – – 57.9 11 60.0 6 76.9 10 – –Female 100.0 6 100.0 3 42.1 8 40.0 4 23.1 4 100.0 4Individual extension visit 100.0 6 100.0 3 100.0 20 100.0 10 100.0 13 100.0 4
Preferred gender of agentMale 3.2 1 7.4 2 37.1 13 30.4 7 9.5 2 – –No preference 96.8 30 92.6 25 62.9 22 69.6 16 90.5 19 100.0 17
Table 47. Gender of household heads with whom extension agents make contact in Ada, Lume, and Gimbichuworedas, Ethiopia
Ada Lume Gimbichu
MHH FHH MHH FHH MHH FHH
(%) (Respondents) (%) (Respondents) (%) (Respondents) (%) (Respondents) (%) (Respondents) (%) (Respondents)
Male members only 50.0 3 – – 52.6 10 10.0 1 50 6 – –
Female members only – – – – – – 70.0 7 – – 100.0 4
Male and female members 50.0 3 100.0 3 47.4 9 20.0 2 50 6 – –
56

Eighty percent of MHHs and 87.5% of FHHs in Ada indicated that they had not adoptedrecommended practices at all (Table 48). On the other hand, more than half of MHHs and FHHs inLume said they adopted recommended practices sometimes. Recommended practices were veryoften adopted by 25.7% of MHHs and 4.2% of FHHs in Lume, whereas 11.4% of MHHs and12.5% of FHHs said they seldom adopted them.
The reasons given for not adopting recommended practices in Ada were the lack of awareness, thatthe practice was not used by anybody, and that there was no need. A few observed that therecommendation was too technical. In Lume, some respondents said it was too risky and notapplicable.
Very few farmers in Ada and Lume (except 22.9% of MHHs in Lume and 6.1% in MHHs inGimbichu) were contact farmers. When asked whether they would be interested in being contactfarmers, 15.6% of MHHs in Ada, and 22.2% of MHHs and 12.5% of FHHs in Lume, wereinterested. The main incentive to be a contact farmer was to get new ideas (Table 49).
Table 48. Frequency of adopting recommended practices in Ada, Lume, and Gimbichu woredas, Ethiopia
Ada Lume Gimbichu
MHH FHH MHH FHH MHH FHH
(%) (Respondents) (%) (Respondents) (%) (Respondents) (%) (Respondents) (%) (Respondents) (%) (Respondents)
FrequencyVery often 10.0 3 – – 25.7 9 4.2 1 18.2 6 3.7 1Sometimes 6.7 2 8.3 2 54.3 10 50.0 12 9.1 3 1.1 3Seldom 3.3 1 4.2 1 11.4 4 12.5 3 18.2 6 25.9 7Not at all 80.0 24 87.5 21 8.6 3 33.3 8 54.5 18 59.3 16
Reason for not adopting recommended practicesToo expensive – – – – – – 2.5 1 – – 6.3 1Too technical 4.2 1 – – – – – – 44.4 8 37.5 6Don’t apply 8.3 2 – – 33.3 1 37.5 3 – – – –Too risky – – – – 33.3 1 12.5 1 11.1 2 37.5 60No need for it 33.3 8 28.6 6 33.3 1 12.5 1 11.1 2 6.3 1No one use them 33.3 8 42.9 9 – – 25.0 2 27.8 5 12.5 2Lack of awareness 20.8 5 28.6 6 – – – – 5.6 1 – –
Table 49. Is the household head a contact farmer, and reasons for wanting to be a contact farmer in Ada, Lume, andGimbichu woredas, Ethiopia
Ada Lume Gimbichu
MHH FHH MHH FHH MHH FHH
(%) (Respondents) (%) (Respondents) (%) (Respondents) (%) (Respondents) (%) (Respondents) (%) (Respondents)
Is contact farmer – – – – 22.9 8 – – 6.1 2 – –
Is interested in beinga contact farmer 15.6 5 – – 22.2 6 12.5 3 22.6 7 7.7 2
Reason to be a contact farmerTo get new ideas 100.0 5 – – 100.0 6 66.7 2 66.7 2 100.0 1To get improved seed – – – – – – 33.3 1 33.3 1 – –
57
11.0 CONCLUSION AND POLICY IMPLICATIONS
On the whole the differences in endowments (land rights, education), access to technologies, factorsof production, and support services had implications for agricultural productivity in both types ofhouseholds.
The major problems faced by all farmers, male or female, were: insufficient land; shortage of familylabor; high price of fertilizer and agro-chemical supplies; lack of loans from formal and informalsources; distance from market centers; the shortage of appropriate storage facilities; and inadequateextension services. Of these, the biggest constraints were the shortage of land and labor, the highcost of labor, and poor soils. While these problems affected all respondents equally, the degree andmagnitude varied between households. Differences and similarities were observed between the twogroups with respect to access to resources, division of labor, decision-making, and adoption ofimproved wheat varieties.
11.1 Access to Resources
Male heads of household were more educated than female heads of household. MHHs had betterland, bigger households, and owned more cattle than FHHs. MHHs also had better access to formaland informal financial institutions and extension services. They owned more ox plows and were thusbetter able to prepare their land on time. Both types of households owned the same number of farmimplements.
11.2 Division of Labor
There was a very high and varied involvement of all household members, including male and femaleheads, in various farm activities. Across all three woredas, land preparation was the responsibility ofmale members of both types of households. Female household members (wives and daughters inMHHs and heads and daughters in FHHs) were primarily responsible for non-agricultural tasks suchas food preparation, household maintenance, and childcare. Sons, relatives and non-relatives weremainly responsible for planting. All household members participated in weeding, harvesting, andanimal husbandry.
11.3 Decision-Making
The inter- and intra-household decision-making pattern used as a proxy to portray the control thatone has over a certain resource in a household also gave some indication of the degree of power thehead of the household exercised over other household members. As result of the differences inendowment and access to resources, however, the capacity of FHHs and MHHs to adopt improvedagricultural technology is different (see next section).
11.4 Adoption of Improved Wheat Varieties
About five years ago, the adoption of improved wheat varieties was over 90% in the study area(Workneh et al. 1994). Sample farmers in this study, however, reported growing a smallerpercentage of improved wheat. The apparent decline in adoption of improved wheat varieties can be
58
attributed to the fact that many farmers considered their recycled improved wheat seed to be local,and to the unavailability of the preferred variety of seed in the market.
The findings indicate that MHHs were more likely to adopt improved wheat varieties than FHHs.However, the availability of seed of improved wheat varieties should be addressed, because lack ofseed has discouraged adoption
In FHHs, the decision to grow improved wheat varieties was always made by the head; slightly morethan half of MHHs made the decision jointly.
The odds in favor of adopting improved wheat varieties increased by a factor of 22.1 for MHHs whohad access to extension services, while in FHHs, radio ownership increased the adoption of improvedwheat varieties by a factor of 5.9. These data reflect the bias of extension services in favor of MHHs.Other farmers (29% of MHHs and 26% of FHHs) constituted another source of information aboutimproved varieties.
With increasing farm size, adoption of improved wheat varieties increased by a factor of 1.1 forMHHs and 1.2 for FHHs. While the average farm size, area under wheat, and livestock units weresignificantly higher for MHHs than FHHs, the probability of adopting improved wheat varieties wouldincrease almost equally for MHHs and FHHs if farm sizes were increased.
11.5 Gender Differentials in Agricultural Productivity
Gender differences in gross output were considerable. MHHs had a gross output of Birr 6,456/ha,while FHHs had a gross output of Birr 4,776/ha. These differences can be explained partly by thelower quantities of inputs used by FHHs. The use of average values of these inputs from MHHsresulted in a gross output of Birr 6,541/ha in FHHs (1.3% higher than MHHs). This suggests that ifboth types of households had equal access to inputs, no productivity differences would exist.
The significant factors affecting gross value of output for MHHs were the farmer’s age, family labor,farm size, livestock units, and the use of inorganic fertilizer; in FHHs, they were family labor, farmsize, livestock units, the use of inorganic fertilizer, hired labor, and extension contact.
Labor and farm size had a significant and positive impact on the gross value of output for bothMHHs and FHHs. A 10% increase in labor resulted in a 2.3% and 1.8% increase in gross value ofoutput for both types of households; a 10% increase in farm size resulted in a 5.6% and 7.2%increase in gross value of output for MHHs and FHHs, respectively. In MHHs, a farmer’s age had asignificant and negative impact on the gross output. A 10% increase in farmer’s age resulted in a2.1% decrease in gross output.
The number of livestock owned and amount of fertilizer used had a positive and significant impact onthe gross value of output for both types of households. A 10% increase in the number of livestockresulted in a 1.3% increase in the gross value of output for MHHs and a 0.7% increase for FHHs; a10% increase in fertilizer use resulted in a 1% increase in gross value of output in both types of
59
household. Extension contact also had a negative and significant impact on gross output in FHHs–gross output was lower for FHHs that had contact with extension services.
The production function analysis showed that the elasticities for the significant factors affecting thegross value of output for MHHs were farmer’s age (-0.21), fertilizer (0.10), farm size (0.56), labor(0.23), and livestock (0.13). For FHHs the elasticities were fertilizer (0.10), farm size (0.76), labor(0.18), livestock (0.07), hired labor (0.03), and extension (-0.28). The negative elasticity for extensionimplies that policymakers should specifically target extension services for FFHs to mitigateextension’s negative effect on gross value of output in these households.
The production function analysis therefore shows that the significant factors affecting gross value ofoutput per hectare in FHHs were household size, farm size, livestock units, inorganic fertilizer, hiredlabor, and extension contact.
The logit analysis showed that in MHHs, farm size and extension contact significantly and positivelyaffected the adoption of improved wheat variety, while in FHHs it was farm size and ownership of aradio.
Based on these findings, it is recommended that to increase agricultural productivity in both MHHsand FHHs, it is crucial to improve the provision of credit and the supply of preferred variety ofimproved seed in time for planting. To increase agricultural productivity in FHHs specifically, it isrecommended that technologies take into account their resource base and improve FHHs access toresources. Extension services should also target FHHs to ease their constraints and facilitate adoptionof improved varieties. Furthermore, female farmers’ decision-making power and control of resourcesshould be positively exploited by exposing them to different opportunities.
60

61
REFERENCES
Abu, K., and C. Oppong. 1987. Seven Roles of Women: Impactof Education, Migration and Employment on GhanaianMothers. Women Switzerland, Work and Development SeriesNo. 13. Geneva: International Labor Organization (ILO).
Adams, M.E. 1983. Agricultural Extension in DevelopingCountries. Intermediate Tropical Agriculture Series. Essex,UK: Longman Scientific and Technical.
Adepoju, A., and C. Oppong. 1994. Gender, Work and Populationin sub-Saharan Africa. London, UK: James Currey.
Ahmed, I. 1985. Technology and rural women: Conceptual andempirical issues. In L. N. Kimenye. Analysis of TechnologyDissemination and Utilization by Women and Men Farmers:Case study of Embu and Mbeere Districts, Kenya. London,Boston and Sydney: George Allen and Unwin.
Allison, C. 1986. It’s Like Holding the Key to Your Own Jail:Women in Namibia. Geneva, Switzerland: World Council ofChurches
Appleton, S. 1996. Women-headed households and householdwelfare: An empirical deconstruction for Uganda. WorldDevelopment. 24 (12):1811-1827.
Ban, A.W. van den, and H.S. Hawkins. 1988. AgriculturalExtension. Essex, UK: Longman Scientific and Technical.
Berg, A. van den. 1997. Land Right Marriage left: Women'sManagement of Insecurity in North Cameroon. Leiden,Netherlands: CNWS Publications.
Berger, M., V. Delancey, and A. Mellencamp. 1984. Bridging theGender Gap in Agricultural Extension. Report prepared forthe Office of Women in Development/USAID, InternationalConference on Research for Women.
Bisanda, S., and W. Mwangi. 1996. Adoption of RecommendedMaize Technologies in Myeba Region of the SouthernHighlands of Tanzania. Addis Ababa, Ethiopia: CIMMYT(International Maize and Wheat Improvement Center) andMinistry of Agriculture, United Republic of Tanzania
Boserup, E. 1970. Women’s Role in Economic Development.New York, NY: St Martin’s Press.
Boserup, E. 1981. Population and Technological Change.Chicago, Illinois: University of Chicago Press.
Bruce, J., 1988. Homes Divided: Women and Income in theThird World. Sanford, North Carolina: Sanford UniversityPress.
Bryceson, D.F. (Ed.). 1995. Women Wielding the Hoe. Lessonsfrom Rural Africa for Feminist Theory and DevelopmentPractice. Oxford, UK: Berg Publishers.
Bryson, J.C. 1981. Women and agriculture in sub-Saharan Africa:Implications for development (An exploratory study). In N.Nelson (Ed.), African Women in the Development Process.Totowa, New Jersey: Cass F. Publishers.
Bukh, J. 1979. The Village Woman in Ghana. Uppsala:Scandinavia Institute of African Studies
Bush, R., L. Cliffe, and V. Jansen. 1986. The crisis in thereproduction of migrant labor in Southern Africa. In P.Lawrence (Ed.). World Recession and the Food Crisis inAfrica. London, UK: James Currey
Buvinic, M., and G.R. Gupta. 1997. Female-headed households andfemale-maintained families: Are they worth targeting to reducepoverty in developing countries? Economic Development andCultural Change. 45(2): 259-280.
Central Statistical Authority (CSA). 1998. Statistical Abstract,Addis Ababa, Ethiopia.
Chilot, Y., B.I. Shapiro, and M. Demeke. 1996. Factorsinfluencing adoption of new wheat technologies in Wolmeraand Addis Alem areas of Ethiopia. Ethiopian Journal ofAgricultural Economics 1 (1): 63-84
Chipande, G.H. 1987. Innovation adoption among female-headedhouseholds: The case of Malawi. Development and Change18: 315-27.
Cliffe, L. 1978. Labor migration and peasant Differentiation:Zambian experiences. Journal of Peasant Studies 5(3).
CIMMYT Economics Program. 1993. The Adoption ofAgricultural Technology: A Guide for Survey Design.Mexico, D.F.: International Maize and Wheat ImprovementCenter (CIMMYT).
Cohen, J. 1980. Land Tenure and Rural Development in Africa.In R. Bates and M. Lofchie (Eds.). Agricultural DevelopmentIn Africa. New York, NY: Praeger.
Dasgupta, P. 1993. An Inquiry into Well-being and Destitution.New York, NY: Oxford University Press.
Davis, J. 1988. Agriculture, Women, and Land: The AfricanExperience. Boulder, Colorada: Westview USA.
Debebe, H. and S. Maxwell. 1992. Vulnerability Profiles andRisk Mapping in Ethiopia. Addis Ababa: Food and NutritionUnit, Ministry of Planning and Economic Development, AddisAbaba, Ethiopia. Mimeo.
Demeke M., A. Wolday, S. Ehui, and T. Zegeye. 1995. FoodSecurity, Nutrition, and Poverty Alleviation in Ethiopia.Proceedings of the Inaugural and First Annual Conference ofthe Agricultural Economics Society of Ethiopia, 8-9 June1995, Addis Ababa, Ethiopia. Addis Ababa, Ethiopia:Agricultural Economics Society of Ethiopia.
Dey, J. 1981. Gambian Women: Unequal partners in ricedevelopment projects. Journal of Development Studies17(3): 109-122
Dorner, P. 1972. Land Reform and Economic Development.Kingsport, Tennessee: Kingsport Press.
Due, J. and C. H. Gladwin. 1991. Impacts of StructuralAdjustment Programs on African Women Farmers andFemale-Headed Households. American Journal ofAgricultural Economics. 73(5):1431-1439.
Due J.M., N. Mollel and V. Malone. 1987. Does the T & V systemreach female-headed families? Some evidence fromTanzanian Agriculture. Administration and Extension 26:209-217
Elabour-Idemudia, P. 1991. The impact of structural adjustmentprogram on women and their households in Bender andOgun States, Nigeria. In C.H. Gladwin (Ed.). StructuralAdjustment and African Women Farmers. Gainesville,Florida: University of Florida Press.
FAO (Food and Agricultural Organization). 1997. Technical Notesfor Country Nutrition Profile (ESNA). Rome, Italy: FAO.
FAO. 1996. Mapping Under-Nutrition. Poster for the WorldFood Summit, Nov 13-17, 1996. Rome, Italy: FAO
FAO/WHO (World Health Organization). 1992. Assessing,analyzing and monitoring nutrition situation. In Major Issuesfor Nutrition Strategies. Rome, Italy: FAO/WHO.
Feder,G., R.E. Just, and D. Zilberman. 1985. Adoption ofagricultural innovations in developing countries: A survey.Economic Development and Cultural Change 33(2):255-297
62
Franzel, S. and H. van Houten. 1992. Research with Farmers:Lessons from Ethiopia. Addis Ababa: Ethiopia. CABInternational for the Institute of Agricultural Research,Ethiopia.
Gryseels, G., and F.M. Anderson. 1983. Research on Farm andLivestock Productivity in the Central Ethiopian Highlands:Initial Results, 1977-1980. ILCA Research Report No. 4.Addis Ababa, Ethiopia: International Livestock Center forAfrica (ILCA).
Gujarati, D.N. 1988. Basic Econometrics. 2nd Edition. NewYork, NY: McGraw-Hill.
Haile, D. 1980. Law and the Status of Women in Ethiopia.Addis Ababa: Economic Commission for Africa, UnitedNations.
Harrison, B. 1987. The Greening of Africa. London, UK:Paladin Grafton.
Kinsey, B.H. 1974. Rural Development in Malawi: A Review ofthe Lilongwe Land Development Program. Washington,D.C.: World Bank.
Mekra, R. 1995. Raising agricultural productivity: The role ofwomen farmers. In G.H. Peters and D.D. Hedley (Eds.).Agricultural Competitiveness: Market Forces and PolicyChoice. Proceedings of the 22nd International Conference ofAgricultural Economists, International Association ofAgricultural Economics (IAAE), 22-29 August 1994, Harare,Zimbabwe. Oxford, UK: University of Oxford.
Merrick, T., and M. Schmink. 1983. Households headed bywomen and urban poverty in Brazil. In M. Buvinic et al(Eds.). Women and Poverty in the Third World. Baltimore:Johns Hopkins University Press.
McSweeney, B., and M. Freedman.1980. Lack of time as anobstacle to women’s education: The case of Upper Volta.Comparative Education Review. P.p.134-139.
Moock, P.R. 1976. The efficiency of women as farm managers inKenya. American Journal of Agricultural Economics.Dec.:831-835
Moore, H. 1988. Feminism and Anthropology. Minneapolis,Minnesota: University of Minnesota. Pp. 42-72.
Mulat, D., A. Wolday, S. Ehui and T. Zegeye (Eds.). 1995. FoodSecurity, Nutrition, and Poverty Alleviation in Ethiopia:Problems and Prospects. Proceedings of the Inaugural andFirst Annual Conferencce of the Agricultural EconomicsSociety of Ethiopia, Addis Ababa, Ethiopia, 8-9 June, 1995.Addis Ababa, Ethiopia: Agricultural Economics Society ofEthiopia
Murray, C. 1981. Class, gender and the household: Thedevelopment cycle in Southern Africa. Development andChange 18:235-50.
Negatu, W. 1989. Diagnostic Survey of the Farming Systems inAda, Lume, and Akaki (Unpublished). Debre Zeit, Ethiopia:Alemaya University of Agriculture and Debre Zeit AgriculturalResearch Center.
Negatu, W, W. Mwangi, and T. Tessema. 1994. CulturalPractices and Varietal Preferences for Durum Wheat byFarmers of Ada, Lume and Gimbichu Woredas ofEthiopia. Research Report Series No. 1. Debre Zeit,Ethiopia: Alemaya University of Agriculture and Debre ZeitAgricultural Research Center.
Nornha, R. 1985. A Review of the Literature on Land TenureSystems in sub-Saharan Africa. Report No. ARU 43.World Bank Agriculture and Rural DevelopmentDepartment. Washington, D.C.: World Bank.
Obbo, C. 1980. African Women: Their Struggle for EconomicIndependence. London, UK: Zed Press
Peters, G.H., and D. Hedley (Eds.) 1994. Proceedings of the22nd International Conference of AgriculturalEconomists, 22-29 August 1994, Harare, Zimbabwe.
Quisumbing, A.R. 1993. Improving women’s agriculturalproductivity as farmers and workers. Paper prepared for aspecial study on Women in Development, World Bank,Washington, D.C.
Quisumbing, A.R. 1996. Male-female differences in agriculturalproductivity: Methodological issues and empirical evidence.World Development 24(10):1579-1595.
Rahamato D.1991. Rural women in Ethiopia: Problems andprospects. In T. Berhane-Selassie (Ed.). Gender Issues inEthiopia. Addis Ababa: Institute of Ethiopian Studies, AddisAbaba University. Pp. 31-45.
Rolling, N. 1988. Extension Science: Information Systems inAgricultural Development. WYE Studies in Agriculturaland Rural Development. Cambridge, UK: CambridgeUniversity Press.
Saito, K.A., H. Mekonnen, and D. Spurling. 1994. Raising theproductivity of women farmers in sub-Saharan Africa.World Bank Discussion Paper 230. Washington D.C.: WorldBank.
Stamp, P. 1989. Gender, Power and Technology. Ottawa:IDRC (International Development Research Centre).
Starkey, P., E. Mwenyae, and J. Stares. 1994. ImprovingAnimal Traction Technology. Proceedings of the FirstWorkshop of Animal Traction Network for Eastern andSouthern Africa, 18-23 January 1992, Lusaka, Zambia.
Staudt, K.A. 1979. Class and sex in the politics of womenfarmers. J. Politics 41 (2):492-512
United Nations. 1989. Compendium of Statistics andIndicators on the Situation of Women. New York, NY:UN.
Warner, M.W., R.M.Hassan, and J.G. Kydd. 1997. Beyondgender roles? Conceptualizing the social and economic livesof rural peoples in sub-Saharan Africa. Development andChange 28:143-168.
Whitehead, A. 1985. Effects of technological change on ruralwomen: A review of analysis and concepts. In I. Ahmed(Ed.). Technology and Rural Women: Conceptual andEmpirical Issues London, UK: George Allen and Unwin.Pp. 27-64.
Yirga, C., B.I. Shapiro and M. Demeke. 1996. Factorsinfluencing adoption of new wheat technologies in Wolmeraand Addis Alem areas of Ethiopia. Ethiopian Journal ofAgricultural Economics 1(1): 63-84.
Workneh, N., W. Mwangi, and T. Tesema. 1994. CulturalPractices and Varietal Preferences for Durum Wheat byFarmers of Ada, Lume, and Gimbichu Woredas of Ethiopia.Research Report Series No. 1. Debre Zeit, Ethiopia: AUA,DZARC
World Bank.1996. Ethiopia: An Economic Overview.Washington, D.C.: World Bank.
Yudelman, S. 1994 . Women farmers in Central America.Myths, roles, reality. Grassroots Development 17(2).