international network for comparison of hiv …lup.lub.lu.se/search/ws/files/3339763/3558891.pdf ·...
TRANSCRIPT

LUND UNIVERSITY
PO Box 117221 00 Lund+46 46-222 00 00
International Network for Comparison of HIV Neutralization Assays: The NeutNetReport II
Heyndrickx, Leo; Heath, Alan; Sheik-Khalil, Enas; Alcami, Jose; Bongertz, Vera; Jansson,Marianne; Malnati, Mauro; Montefiori, David; Moog, Christiane; Morris, Lynn; Osmanov,Saladin; Polonis, Victoria; Ramaswamy, Meghna; Sattentau, Quentin; Tolazzi, Monica;Schuitemaker, Hanneke; Willems, Betty; Wrin, Terri; Fenyö, Eva Maria; Scarlatti, GabriellaPublished in:PLoS ONE
DOI:10.1371/journal.pone.0036438
Published: 2012-01-01
Link to publication
Citation for published version (APA):Heyndrickx, L., Heath, A., Sheik-Khalil, E., Alcami, J., Bongertz, V., Jansson, M., ... Scarlatti, G. (2012).International Network for Comparison of HIV Neutralization Assays: The NeutNet Report II. PLoS ONE, 7(5).DOI: 10.1371/journal.pone.0036438
General rightsCopyright and moral rights for the publications made accessible in the public portal are retained by the authorsand/or other copyright owners and it is a condition of accessing publications that users recognise and abide by thelegal requirements associated with these rights.
• Users may download and print one copy of any publication from the public portal for the purpose of privatestudy or research. • You may not further distribute the material or use it for any profit-making activity or commercial gain • You may freely distribute the URL identifying the publication in the public portal

Take down policyIf you believe that this document breaches copyright please contact us providing details, and we will removeaccess to the work immediately and investigate your claim.
Download date: 01. Sep. 2018

International Network for Comparison of HIVNeutralization Assays: The NeutNet Report IILeo Heyndrickx5*, Alan Heath4, Enas Sheik-Khalil3, Jose Alcami1, Vera Bongertz2, Marianne Jansson6,
Mauro Malnati7, David Montefiori8, Christiane Moog9, Lynn Morris10, Saladin Osmanov11,
Victoria Polonis12, Meghna Ramaswamy4, Quentin Sattentau13, Monica Tolazzi14,
Hanneke Schuitemaker15, Betty Willems5, Terri Wrin16, Eva Maria Fenyo3, Gabriella Scarlatti14
1 Unidad de Immunopatologia del SIDA, Instituto de Salud Carlos III, Madrid, Spain, 2 Laboratory of AIDS and Molecular Immunology, Fundacao Oswaldo Cruz, Rio de
Janeiro, Brazil, 3 Department of Laboratory Medicine, University of Lund, Lund, Sweden, 4 National Institute for Biological Standards and Control, Potters Bar,
Hertfordshire, United Kingdom, 5 Virology Unit, Biomedical Department, Institute of Tropical Medicine, Antwerp, Belgium, 6 Department of Microbiology, Tumor and Cell
Biology, Karolinska Institutet, Stockholm, Sweden, 7 Unit of Human Virology, San Raffaele Scientific Institute, Milan, Italy, 8 Duke University Medical Center, Durham, North
Carolina, United States of America, 9 Pathogenie des infections persistantes, University Louis Pasteur, Strasbourg, France, 10 National Institute for Communicable
Diseases, Johannesburg, South Africa, 11 WHO-UNAIDS HIV Vaccine Initiative, World Health Organization, Geneva, Switzerland, 12 Department of Vaccine Research, Henry
Jackson Foundation for the Advancement of Military Medicine, Rockville, Maryland, United States of America, 13 The Sir William Dunn School of Pathology, The University
of Oxford, Oxford, United Kingdom, 14 Viral Evolution and Transmission Unit, San Raffaele Scientific Institute, Milan, Italy, 15 Department of Experimental Immunology,
Academic Medical Center at the University of Amsterdam, Amsterdam, The Netherlands, 16 Monogram Biosciences, San Francisco, California, United States of America
Abstract
Background: Neutralizing antibodies provide markers for vaccine-induced protective immunity in many viral infections. Byanalogy, HIV-1 neutralizing antibodies induced by immunization may well predict vaccine effectiveness. Assessment ofneutralizing antibodies is therefore of primary importance, but is hampered by the fact that we do not know which assay(s)can provide measures of protective immunity. An international collaboration (NeutNet) involving 18 different laboratoriespreviously compared different assays using monoclonal antibodies (mAbs) and soluble CD4 (Phase I study).
Methods: In the present study (Phase II), polyclonal reagents were evaluated by 13 laboratories. Each laboratory evaluatednine plasmas against an 8 virus panel representing different genetic subtypes and phenotypes. TriMab, a mixture of threemAbs, was used as a positive control allowing comparison of the results with Phase I in a total of nine different assays. Theassays used either uncloned virus produced in peripheral blood mononuclear cells (PBMCs) (Virus Infectivity Assays, VIA), orEnv (gp160)-pseudotyped viruses (pseudoviruses, PSV) produced in HEK293T cells from molecular clones or from unclonedvirus. Target cells included PBMC and genetically engineered cell lines in either single- or multiple-cycle infection format.Infection was quantified by using a range of assay read-outs including extra- or intra-cellular p24 antigen detection,luciferase, beta-galactosidase or green fluorescent protein (GFP) reporter gene expression.
Findings: Using TriMab, results of Phase I and Phase II were generally in agreement for six of the eight viruses tested andconfirmed that the PSV assay is more sensitive than PBMC (p = 0.014). Comparisons with the polyclonal reagents showedthat sensitivities were dependent on both virus and plasma.
Conclusions: Here we further demonstrate clear differences in assay sensitivities that were dependent on both theneutralizing reagent and the virus. Consistent with the Phase I study, we recommend parallel use of PSV and VIA for vaccineevaluation.
Citation: Heyndrickx L, Heath A, Sheik-Khalil E, Alcami J, Bongertz V, et al. (2012) International Network for Comparison of HIV Neutralization Assays: The NeutNetReport II. PLoS ONE 7(5): e36438. doi:10.1371/journal.pone.0036438
Editor: Shibo Jiang, Shanghai Medical College, Fudan University, China
Received December 19, 2011; Accepted April 2, 2012; Published May 9, 2012
Copyright: � 2012 Heyndrickx et al. This is an open-access article distributed under the terms of the Creative Commons Attribution License, which permitsunrestricted use, distribution, and reproduction in any medium, provided the original author and source are credited.
Funding: The project ‘‘NeutNet: Standardisation of HIV neutralization assays to be used in vaccine research and clinical trials’’ was sponsored by the EuropeanCommunity under grant numbers LSSP-CT-2004-012190, EUROPRISE-Network of Excellence grant number LSHP CT-2006-037611 and NGIN grant number 201433.The WHO/UNAIDS HIV Vaccine Initiative provided partial support for the conduct of the project, including the activities of the Repository, such as preparation andshipment of reagents. Additional support was received from The Bill and Melinda Gates Foundation Collaboration for AIDS Vaccine Discovery (CAVD), andDepartamento de DST, Aids e Hepatites Virais, MS-Brasil 147/08. The funders had no role in study design, data collection and analysis, decision to publish, orpreparation of the manuscript.
Competing Interests: All the envelopes and plasmas were in common among the NeutNet group - there was nothing unique about the authors’ viruses/reagents. This does not alter the authors’ adherence to all the PLoS ONE policies on sharing data and materials.
* E-mail: [email protected]
Introduction
Interest in HIV neutralization as a correlate of immune
protection has been inconsistent over the years. Initial vaccine
trials in the early 1990s were discouraging after discovering that
neutralizing antibodies, if elicited at all, had narrow specificity,
and were only directed to the virus strain included in the vaccine
PLoS ONE | www.plosone.org 1 May 2012 | Volume 7 | Issue 5 | e36438

[1,2,3,4,5,6]. Cell-mediated immunity (CMI) came into focus, but
subsequent vaccine trials eliciting CMI showed no greater success
in protection from HIV infection [7,8]. Early in the 2000s interest
turned back to neutralization, and the idea that a vaccine should
aim to elicit both humoral and cellular immune responses was put
forward [9]. It was felt that by mounting a broad neutralizing
antibody response the immune response might overcome virus
variation [10,11,12]. In view of this development, standardization
of evaluation of neutralizing activity became an important issue
[13,14,15,16].
In 2004, a group of 18 laboratories, performing a range of
different techniques to measure neutralizing antibodies, was
assembled within the framework of an EC-sponsored interna-
tional collaborative study, called NeutNet. The group aimed at
the standardization of HIV-1 neutralization assays to be used in
vaccine research and clinical vaccine trials, by testing different
monoclonal antibodies (mAbs) and soluble (s)CD4 against 11
HIV-1 isolates and their clonal derivatives in 10 different
neutralization assays. The NeutNet Phase I study showed that:
1) in general, PSV assays were more sensitive than VIA; 2)
variation was dependent on both the reagent (in this case mAbs
and sCD4) and the virus used; 3) the apparent larger variation
in the PBMC assays was probably due to different operating
procedures in the participating laboratories. It was concluded
that no single assay was capable of detecting the entire
spectrum of antibody neutralizing activities. Since it is not
known which in vitro assay correlates with in vivo protection, the
use of a range of assays was recommended [17].
In 2008, NeutNet continued its activity within the EURO-
PRISE network of Excellence by comparing neutralization assays
with polyclonal reagents, carefully selected for the purpose and
centrally distributed to all partners. The polyclonal reagents were
tested against eight viruses, selected from the previous Phase I
virus panel, in the different neutralization assays. The results of the
network study, now comprised of nine different assays are
presented herein.
Methods
Neutralization AssaysThe methodologies used in this study were previously published
[17] and are available on the EUROPRISE website (www.
europrise.org). Briefly, two kinds of assays were performed: (1)
Virus Infectivity Assays (VIA) using replicating viruses and Env
(gp160)-pseudotyped virus (PSV) assays (Figure 1). In the first type
of assay, partners 3B, 5A, 6B, 7, 8, 14 and 15 used peripheral
blood mononuclear cells (PBMC) as target cells, while lab 9 and
3A used established cell lines [18,19,20,21,22]. PBMCs were
isolated from buffy coats from HIV-negative blood donors as
previously described, detailed protocols are available on the
EUROPRISE website (www.europrise.org). Partner 9 performed a
plaque reduction assay using GHOST(3) cells and partner 3A used
a fusion assay with HeLa cells [17,23,24,25,26]. Both cell lines
were engineered to express CD4 and coreceptors for HIV. In all
labs using VIA, except lab 3A, 8 and 9, assays were characterized
by multiple rounds of infection. The PSV assays performed by
partners 2, 4A, 4B, 6A, 10 and 13 were single cycle assays
[27,28,29]. The PSV assay performed by partner 12, was a
multiple cycle infection assay [30,31]. Two readouts were used for
the plaque reduction assay on GHOST(3) cells, both exploiting
activation of the gene encoding the green fluorescence protein
(GFP) upon HIV infection. Plaques were either manually counted
by microscopic reading, as previously described, or by a newly
developed automated microscopy reading platform followed by
image analysis using the CellProfiler software version r10997 [32]
(www.cellprofiler.org). The pipeline used will be described in detail
separately (Sheik-Khalil, manuscript in preparation).
Inhibitory ReagentsAll reagents were distributed by the Centre for AIDS Reagents
(CFAR) NIBSC, UK. TriMab, an equal mixture of three mAbs
IgG1b12, 2G12 and 2F5 was prepared by CFAR and was used as
positive control in each experiment and for comparison with Phase
I results. In order to have reagents with both high and low
neutralizing titres in both types of assays, 19 HIV-1-positive
plasma obtained from Zeptometrix Corporation (USA) were pre-
screened in the recombinant virus assay against a total of 14
Figure 1. Neutralization assays and their characteristics. Cell target: PBMC, peripheral blood mononuclear cells; the cell lines GHOST, U87 andHeLa are stably transfected with CD4 and CCR5 or CXCR4. MR, multiple round infection; SR, single round infection. The fusion assay is limited to cellsurface-viral envelope interaction. Ab persistence: time of incubation of the inhibitory reagent with virus and cells before washout. Day: time of read-out, numbers indicate days; hr, hours. Env plasmid, Env expression plasmids obtained through NIBSC.doi:10.1371/journal.pone.0036438.g001
The NeutNet Report II
PLoS ONE | www.plosone.org 2 May 2012 | Volume 7 | Issue 5 | e36438
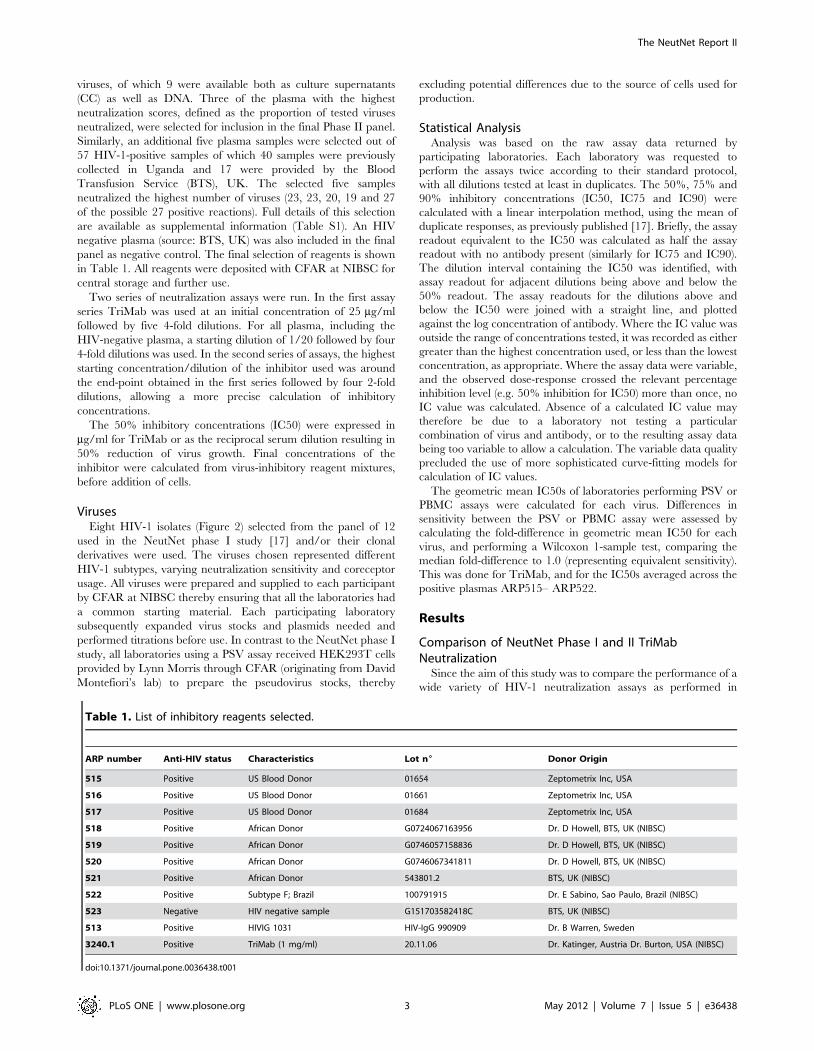
viruses, of which 9 were available both as culture supernatants
(CC) as well as DNA. Three of the plasma with the highest
neutralization scores, defined as the proportion of tested viruses
neutralized, were selected for inclusion in the final Phase II panel.
Similarly, an additional five plasma samples were selected out of
57 HIV-1-positive samples of which 40 samples were previously
collected in Uganda and 17 were provided by the Blood
Transfusion Service (BTS), UK. The selected five samples
neutralized the highest number of viruses (23, 23, 20, 19 and 27
of the possible 27 positive reactions). Full details of this selection
are available as supplemental information (Table S1). An HIV
negative plasma (source: BTS, UK) was also included in the final
panel as negative control. The final selection of reagents is shown
in Table 1. All reagents were deposited with CFAR at NIBSC for
central storage and further use.
Two series of neutralization assays were run. In the first assay
series TriMab was used at an initial concentration of 25 mg/ml
followed by five 4-fold dilutions. For all plasma, including the
HIV-negative plasma, a starting dilution of 1/20 followed by four
4-fold dilutions was used. In the second series of assays, the highest
starting concentration/dilution of the inhibitor used was around
the end-point obtained in the first series followed by four 2-fold
dilutions, allowing a more precise calculation of inhibitory
concentrations.
The 50% inhibitory concentrations (IC50) were expressed in
mg/ml for TriMab or as the reciprocal serum dilution resulting in
50% reduction of virus growth. Final concentrations of the
inhibitor were calculated from virus-inhibitory reagent mixtures,
before addition of cells.
VirusesEight HIV-1 isolates (Figure 2) selected from the panel of 12
used in the NeutNet phase I study [17] and/or their clonal
derivatives were used. The viruses chosen represented different
HIV-1 subtypes, varying neutralization sensitivity and coreceptor
usage. All viruses were prepared and supplied to each participant
by CFAR at NIBSC thereby ensuring that all the laboratories had
a common starting material. Each participating laboratory
subsequently expanded virus stocks and plasmids needed and
performed titrations before use. In contrast to the NeutNet phase I
study, all laboratories using a PSV assay received HEK293T cells
provided by Lynn Morris through CFAR (originating from David
Montefiori’s lab) to prepare the pseudovirus stocks, thereby
excluding potential differences due to the source of cells used for
production.
Statistical AnalysisAnalysis was based on the raw assay data returned by
participating laboratories. Each laboratory was requested to
perform the assays twice according to their standard protocol,
with all dilutions tested at least in duplicates. The 50%, 75% and
90% inhibitory concentrations (IC50, IC75 and IC90) were
calculated with a linear interpolation method, using the mean of
duplicate responses, as previously published [17]. Briefly, the assay
readout equivalent to the IC50 was calculated as half the assay
readout with no antibody present (similarly for IC75 and IC90).
The dilution interval containing the IC50 was identified, with
assay readout for adjacent dilutions being above and below the
50% readout. The assay readouts for the dilutions above and
below the IC50 were joined with a straight line, and plotted
against the log concentration of antibody. Where the IC value was
outside the range of concentrations tested, it was recorded as either
greater than the highest concentration used, or less than the lowest
concentration, as appropriate. Where the assay data were variable,
and the observed dose-response crossed the relevant percentage
inhibition level (e.g. 50% inhibition for IC50) more than once, no
IC value was calculated. Absence of a calculated IC value may
therefore be due to a laboratory not testing a particular
combination of virus and antibody, or to the resulting assay data
being too variable to allow a calculation. The variable data quality
precluded the use of more sophisticated curve-fitting models for
calculation of IC values.
The geometric mean IC50s of laboratories performing PSV or
PBMC assays were calculated for each virus. Differences in
sensitivity between the PSV or PBMC assay were assessed by
calculating the fold-difference in geometric mean IC50 for each
virus, and performing a Wilcoxon 1-sample test, comparing the
median fold-difference to 1.0 (representing equivalent sensitivity).
This was done for TriMab, and for the IC50s averaged across the
positive plasmas ARP515– ARP522.
Results
Comparison of NeutNet Phase I and II TriMabNeutralization
Since the aim of this study was to compare the performance of a
wide variety of HIV-1 neutralization assays as performed in
Table 1. List of inhibitory reagents selected.
ARP number Anti-HIV status Characteristics Lot n6 Donor Origin
515 Positive US Blood Donor 01654 Zeptometrix Inc, USA
516 Positive US Blood Donor 01661 Zeptometrix Inc, USA
517 Positive US Blood Donor 01684 Zeptometrix Inc, USA
518 Positive African Donor G0724067163956 Dr. D Howell, BTS, UK (NIBSC)
519 Positive African Donor G0746057158836 Dr. D Howell, BTS, UK (NIBSC)
520 Positive African Donor G0746067341811 Dr. D Howell, BTS, UK (NIBSC)
521 Positive African Donor 543801.2 BTS, UK (NIBSC)
522 Positive Subtype F; Brazil 100791915 Dr. E Sabino, Sao Paulo, Brazil (NIBSC)
523 Negative HIV negative sample G151703582418C BTS, UK (NIBSC)
513 Positive HIVIG 1031 HIV-IgG 990909 Dr. B Warren, Sweden
3240.1 Positive TriMab (1 mg/ml) 20.11.06 Dr. Katinger, Austria Dr. Burton, USA (NIBSC)
doi:10.1371/journal.pone.0036438.t001
The NeutNet Report II
PLoS ONE | www.plosone.org 3 May 2012 | Volume 7 | Issue 5 | e36438

different laboratories and since TriMab was included in both
Phase I and II, it allowed comparison of IC50s both within the
same laboratory and between laboratories. Results from nine
laboratories, participating in both Phase I and Phase II studies
showed that results were generally in agreement with six of the
eight viruses tested (Figure 2). In phase II, two viruses (92RW009
and CM244) showed a mean variation .3-fold, for all other
viruses this was less than 3-fold. In addition, the mean IC50s
obtained in the PSV assays were lower, meaning more sensitive,
than in PBMC (p = 0.014) (Table 2, Figure 3b).
Neutralization with Polyclonal ReagentsPlasma from an individual who tested negative for HIV
(ARP523) was included in all experiments. Results from six
laboratories showed occasional low-level neutralization (detected
at IC50 but not at IC75) with the HIV-negative plasma, while five
laboratories tested negative with all viruses. The rare positive
reactions were randomly distributed among viruses and included
both types of assays (Figure S1).
The intra-laboratory consistency for repeat tests was assessed by
comparing the calculated IC values (expressed as a fold-difference
(maximum/minimum)) for the HIV-1 positive samples. Analysis
was restricted to tests where it had been possible to calculate an IC
value from the data for both tests, and the calculated IC values
were within the dilution range used. There was reasonable intra-
laboratory consistency with a mean difference between tests of less
than 2-fold (Table S2a) for each IC value, and no significant
differences between IC50, IC75 or IC90. The IC50 was selected
for all subsequent analysis.
The calculations were repeated for laboratories using PSV and
VIA (using PBMC) separately (Table S2b). The fold-differences
between repeat tests for the PSV assays were lower than for the
PBMC assays (around 1.7-fold and 2.0-fold respectively), indicat-
ing modestly better intra-laboratory consistency for the PSV
assays.
Comparison of Plasma Neutralizing Activities in PSV andPBMC Assays
The relative neutralization performance of the different assays
across viruses at the IC50 levels, are shown in Table 2. For
completeness the information at the IC75 and IC90 levels is shown
in Table S3. Comparison of PSV (blue line) and PBMC (red line)
is highlighted in circular ‘‘radar’’ plots (Figure 3A). The scale is set
such that the centre represents no neutralization and the
concentric grid-lines are 2-fold dilution steps moving out to
highest neutralization at the edge. Equal IC’s against each virus
would result in a circular pattern. However, the curves assume
different shapes and the IC50 concentrations obtained in PBMC
do not always show the same pattern as seen with PSV assays
(Figure 3A).
Strikingly, the relative pattern of neutralization obtained in PSV
and PBMC assays with different viruses varies for different
plasmas. For example, 92UG024 and SF162 were more sensitive
to neutralization by ARP522 in the PSV than VI assays.
Conversely, 92RW009, SF162, MN(P) and QH0692 were better
neutralized by ARP520 in the PBMC than the PSV assay. Taken
together, there are substantial differences in neutralization of
individual viruses by different plasma. Using TriMab higher
sensitivity was observed in the PSV assays for all viruses except
CM244 and 92RW009 where comparable IC50 were obtained for
both PSV and PBMC assays. This allows ranking of viruses for
relative sensitivity to neutralization by TriMab (Figure 3B) and
plasma (means over ARP515-522) (Figure 3C). While SF162 was
the most sensitive virus in both types of assays with both
monoclonal and polyclonal reagents, MN(P) is on the top with
TriMab in the PSV assay only. The primary virus 92UG024 had a
similarly high sensitivity in both assays when neutralized by
TriMab, but was sensitive to polyclonal antibodies in the PSV
assay only. Comparison of IC50 values with TriMab between the
two types of assay showed that the PSV assay was generally more
sensitive than PBMC assay (Figure 3B). The differences in
sensitivity were calculated (ratio of IC50 values for PSV and
PBMC) for each virus, and there was a median 3.4-fold increase in
Figure 2. Mean inhibitory concentration (IC) 50 values for duplicate assays performed with TriMab and virus as indicated in theNeutNet Phase I (P1) and Phase II (P2) study. The cells are colour coded: green, poor or no neutralization, IC50.25 mg/ml; yellow, IC50 5–25 mg/ml; orange, IC50 1–5 mg/ml; red, IC50,1 mg/ml; white, no results available. Assays are grouped on the basis of several criteria: (1) the use of plasmidsor culture supernatants as a source of HIV-1; (2) fusion based assays or infection based assays, either with pseudotyped virus or replication competentvirus; and (3) the use of cell lines or PBMC. Laboratories performing the assays are numbered (see Figure 1 for reference) and colour coded: blue,TZMbl assay or PSV/plasmid assays; green, PBMC assays using extracellular p24 as readout; pink, plaque reduction assay. In the listing of viruses, tothe left, the cells of X4 viruses are labelled grey, the cells of R5 viruses are white.doi:10.1371/journal.pone.0036438.g002
The NeutNet Report II
PLoS ONE | www.plosone.org 4 May 2012 | Volume 7 | Issue 5 | e36438

Table 2. Inter-Laboratory comparisons IC50 values.
Pseudovirus Based Assays PBMC Assays Fusion Plaque reduction
Labs 6A,10,12,13 Labs 3B,6B,7,8,14,15 Lab 3A Lab 9
TRIMAB
Virus N lab Mean Min Max Fold N lab Mean Min Max Fold Mean Manual reading Automated reading
92RW009 4 5,9 0,3 38,8 114,5 6 7,3 0,6 .50 90,7 26,1 15,4 4,8
SF 162 4 0,3 ,0,2 0,5 2,5 6 0,6 ,0,2 1,8 9,2 1,5 1,4 1,8
MN(P) 4 0,3 ,0,2 0,7 3,5 4 4,3 1,1 14,5 13 1,9 3,1 5,2
QH0692 4 0,8 0,4 2,7 7,5 5 2,7 0,3 7,6 27,9 10,7 1,9 2,8
DU174 4 4,2 1,3 11,4 9,1 5 14,3 1,4 .50 35,2 17,7 15,4
92BR025 4 1 ,0,2 5,5 27,4 5 11,2 1,3 .50 37,5 32,7 28,1 14,8
92UG024 4 0,4 ,0,2 0,8 4 6 1,8 0,6 8,2 14,5 3,6 1,4 1,5
CM244 3 13,7 5,2 45,9 8,8 6 13,7 1 .50 50,5 11,9 14,9 8,8
ARP 515
Virus N lab Mean Min Max Fold N lab Mean Min Max Fold Mean Manual reading Automated reading
92RW009 4 48 ,20 542 27,1 6 61 ,20 410 20,5 47 392 1544
SF 162 4 1070 471 .1280 2,7 6 386 197 718 3,6 54 130 91
MN(P) 4 252 115 477 4,2 3 340 90 937 10,4 221 497 544
QH0692 4 52 22 92 4,1 5 46 ,20 320 16 ,20 82 62
DU174 4 ,20 ,20 23 1,2 5 33 ,20 179 8,9 22 ,20
92BR025 4 28 ,20 54 2,7 5 58 40 79 2 53 31 ,20
92UG024 4 478 ,20 .1280 64 6 43 ,20 121 6,1 36 40 58
CM244 3 69 47 129 2,7 6 58 ,20 512 25,6 63 31 61
ARP 516
Virus N lab Mean Min Max Fold N lab Mean Min Max Fold Mean Manual reading Automated reading
92RW009 4 52 ,20 1054 52,7 6 70 34 220 6,5 55 32 461
SF 162 4 1209 726 .1280 1,8 6 281 44 962 21,8 109 186 255
MN(P) 4 81 50 281 5,7 4 55 ,20 130 6,5 98 ,20 ,20
QH0692 4 113 53 925 17,4 5 35 ,20 93 4,7 ,20 ,20 ,20
DU174 4 20 ,20 29 1,5 5 33 ,20 262 13,1 ,20 23
92BR025 4 374 286 536 1,9 5 216 45 500 11,1 65 ,20 96
92UG024 4 659 45 .1280 28,3 6 32 ,20 130 6,5 45 21 363
CM244 3 32 28 39 1,4 6 44 ,20 160 8 114 34 23
ARP 517
Virus N lab Mean Min Max Fold N lab Mean Min Max Fold Mean Manual reading Automated reading
92RW009 4 74 ,20 936 46,8 6 81 28 350 12.3 ,20 47 155
SF 162 4 .1280 475 .1280 2,7 6 555 263 1236 4.7 27 113 625
MN(P) 4 370 182 921 5,1 4 506 215 1427 6.0 140 249 421
QH0692 4 58 32 137 4,3 5 37 ,20 62 3.1 ,20 31 28
DU174 4 ,20 ,20 31 1,5 5 44 ,20 497 24.9 ,20 22
92BR025 4 38 24 71 2,9 5 82 ,20 301 15.1 ,20 22 22
92UG024 4 503 20 .1280 62,5 6 33 ,20 160 8.0 ,20 ,20 79
CM244 3 92 69 137 2 6 73 ,20 286 14.3 ,20 34 63
ARP 518
Virus N lab Mean Min Max Fold N lab Mean Min Max Fold Mean Manual reading Automated reading
92RW009 4 82 36 253 7 6 81 40 280 7 86 39 325
SF 162 4 187 119 293 2,5 6 232 52 1220 23,3 52 74 90
MN(P) 4 92 64 203 3,2 4 233 ,20 .1280 64 86 32 116
QH0692 4 38 27 58 2,2 5 35 ,20 117 5,8 ,20 ,20 ,20
DU174 4 88 23 775 33 5 36 ,20 151 7,6 ,20 ,20
92BR025 4 149 120 176 1,5 5 180 37 .1280 34,2 108 ,20 81
92UG024 4 181 20 .1280 63,2 6 40 ,20 79 4 71 ,20 60
The NeutNet Report II
PLoS ONE | www.plosone.org 5 May 2012 | Volume 7 | Issue 5 | e36438

sensitivity for PSV across viruses. This is significantly different
from a median of 1.0 which would represent equivalent sensitivity
for the assay methods (p = 0.014, Wilcoxon 1-sample test).
However, with the polyclonal reagents the difference in sensitivity
between PSV and PBMC was less pronounced with the exception
of 92UG024. The median fold-increase was 1.1, which was not
significantly different from 1.0. It has to be noted that this overall
pattern is based on means across laboratories and plasma and it
may therefore mask differences in individual lab results, or for
different plasma.
Table 2. Cont.
Pseudovirus Based Assays PBMC Assays Fusion Plaque reduction
Labs 6A,10,12,13 Labs 3B,6B,7,8,14,15 Lab 3A Lab 9
CM244 3 74 57 122 2,1 6 27 ,20 71 3,6 164 ,20 82
ARP 519
Virus N lab Mean Min Max Fold N lab Mean Min Max Fold Mean Manual reading Automated reading
92RW009 4 108 35 1173 33,2 5 115 ,20 252 12,6 85 54 327
SF 162 4 346 107 861 8,1 6 236 45 1280 28,7 46 243 747
MN(P) 4 46 23 70 3,1 4 42 ,20 110 5,5 70 35 ,20
QH0692 4 59 24 203 8,5 5 56 ,20 181 9,1 ,20 57 65
DU174 4 578 371 1114 3 5 220 160 320 2 640 2023
92BR025 4 418 157 1140 7,3 5 279 93 1810 13,7 150 320 280
92UG024 4 921 66 6788 19,4 6 54 ,20 190 9,5 69 21 84
CM244 3 41 22 57 2,6 5 53 21 226 11 140 ,20 24
ARP 520
Virus N lab Mean Min Max Fold N lab Mean Min Max Fold Mean Manual reading Automated reading
92RW009 4 48 ,20 995 49,8 5 232 60 .1280 21.3 54 166 149
SF 162 4 194 121 456 3,8 6 302 63 .1280 20.3 21 219 1072
MN(P) 4 46 ,20 161 8,1 4 96 ,20 865 43.3 53 ,20 ,20
QH0692 4 38 31 46 1,5 5 62 ,20 301 15.1 ,20 59 38
DU174 4 38 26 58 2,2 5 61 21 310 14.8 80 119
92BR025 4 367 205 858 4,2 5 240 130 345 2.7 77 356 628
92UG024 4 437 56 1031 18,6 5 65 ,20 221 11.1 64 57 136
CM244 3 126 65 185 2,9 6 95 28 400 14.1 115 49 123
ARP 521
Virus N lab Mean Min Max Fold N lab Mean Min Max Fold Mean Manual reading Automated reading
92RW009 4 59 ,20 .1280 64 6 46 ,20 304 15.2 22 21 ,20
SF 162 4 589 301 .1280 4,3 6 393 60 .1280 21.2 29 98 42
MN(P) 4 64 28 178 6,3 4 40 ,20 270 13.5 78 ,20 ,20
QH0692 4 46 24 114 4,8 5 26 ,20 61 3.1 ,20 27 ,20
DU174 4 29 ,20 89 4,4 5 52 ,20 396 19.8 ,20 28
92BR025 4 86 34 225 6,7 5 42 ,20 330 16.5 28 ,20 ,20
92UG024 4 900 81 .1280 15,7 6 27 ,20 194 9.7 ,20 ,20 32
CM244 3 40 23 94 4,1 6 33 ,20 100 5.0 40 27 ,20
ARP 522
Virus N lab Mean Min Max Fold N lab Mean Min Max Fold Mean Manual reading Automated reading
92RW009 4 123 21 .1280 61,1 5 50 ,20 99 5 68 23 ,20
SF 162 4 .1280 682 .1280 1,9 5 239 50 991 19,7 88 ,20 22
MN(P) 4 49 21 345 16,6 4 47 ,20 615 30,7 152 ,20 ,20
QH0692 4 58 ,20 109 5,5 5 33 ,20 89 4,4 ,20 ,20 ,20
DU174 4 42 23 100 4,4 5 36 20 101 5 69 198
92BR025 4 101 72 150 2,1 5 50 32 101 3,2 114 35 ,20
92UG024 4 .1280 212 .1280 6,1 6 36 ,20 272 13,6 89 ,20 ,20
CM244 3 29 20 40 2 6 39 ,20 326 16,3 81 ,20 20
Values of the IC50s are expressed as reciprocal dilutions for plasma and as mg/ml for TriMab. N lab; Number of laboratories involved.doi:10.1371/journal.pone.0036438.t002
The NeutNet Report II
PLoS ONE | www.plosone.org 6 May 2012 | Volume 7 | Issue 5 | e36438

Comparison of Virus Sensitivities to Neutralization in thePSV and PBMC Assays
Differences in sensitivities of viruses to neutralization by the
different plasmas was further analysed by using a separate radar
plot for each virus with plasma around the circle. Again, the scales
were adjusted such that no neutralization (IC50,20) is at the
centre, and the outer ring is strong neutralization (IC50.1280).
The concentric grid-lines are 2-fold dilution steps.
Accordingly 92UG024 and SF162 have the highest IC50s
(Figure 4), meaning high sensitivity to neutralization but only in
the PSV assay. For 92UG024 it is notable that the PSV assays (blue
line) were universally more sensitive than PBMC assays, but that was
not the case for the other viruses. SF162 showed that PSV assays
were a lot more sensitive for neutralization by ARP515, 516, 517 and
522, but not for 518, 519, 520 or 521. For 92RW009, ARP520
stands out as having more potent neutralizing activity in PBMC than
PSV assays. This is all based on means across laboratories, so may
still be masking individual differences in sensitivity between
laboratories performing the same type of assay. In particular, we
looked carefully at the outstanding sensitivity of 92UG024.
The IC50’s from lab 12 differed from those of the 3 other
laboratories (6A, 10 and 13) performing PSV assays. Looking at
the geometric mean across all eight plasma, the mean IC50 from
laboratories 6A, 10 and 13 was 1284, compared to 45 from
laboratory 12. This compares to a mean IC50 of 36 from the
laboratories performing PBMC assays. The difference in IC50
between laboratory 12 (45) and the other PSV laboratories (1284)
was highly significant (p,0.001, paired t-test) while the difference
between lab 12 and the laboratories performing PBMC assays (36)
was not (p = 0.29) (Figure S3). A possible explanation might be that
lab 12 used a pool of amplified clones starting from viral
supernatant, whereas a single clone was used by the three other
laboratories. A pool of amplified clones might better represent the
quasi-species present in a virus as compared to one single clone.
Partial sequence analysis was done on both the virus culture
supernatant and the plasmid used for the pseudovirus production.
Overall 99% homology (amino acid level) was found for near the
complete env gene (2190bp). Amino acid differences were found in
the C2 (at position 204 A or E) and in gp41 (at position 845 T or
A) respectively. Another 3 double amino acid populations were
Figure 3. Comparison of PSV and VI assays across viruses. (A) circular ‘‘radar’’ plots. Lines from the centre represent an axis for each virus. Thegeometric mean IC value for PSV (blue lines) and PBMC (red lines) against each virus is plotted, and the points joined. The scale is set such that thecentre represents no neutralization and the concentric grid-lines are 2-fold dilution steps moving out to highest neutralization at the edge. (B) and (C)Ranking of viruses for relative sensitivity to neutralization was done by calculating geometric mean IC50s across laboratories (grouping PSV andPBMC separately). (B) Ranking by TriMab and (C) ranking by plasma (means over ARP515-522). The scale is set such that the most neutralizationsensitive viruses are at the top.doi:10.1371/journal.pone.0036438.g003
The NeutNet Report II
PLoS ONE | www.plosone.org 7 May 2012 | Volume 7 | Issue 5 | e36438

found in gp41 at positions 595, 732 and 734 (numbering according
to HxB2) in the culture supernatant (Figure S2). We cannot
exclude that the differences found between the culture supernatant
and the PSV plasmid are responsible for the dramatic differences
seen in neutralization sensitivity. This would require further
analysis by use of site directed mutants, however this was outside
the scope of our study. Another, maybe more important difference
is that the PSV assay used by lab 12 is a multiple cycle assay as
compared to a single cycle assay used by the 3 other laboratories
performing the PSV assay. This further emphasizes the influence
of the assay on the outcome of results.
Evaluation of Neutralization by Plaque Reduction:Comparison of Manual Reading and AutomatedImage Analysis
For these experiments, lab 9 used GHOST(3) cells and
exploited activation of the green fluorescent protein (GFP) in
HIV-infected cells [25,33]. Cells showing green fluorescence were
enumerated either visually or by use of an automated platform
attached to an AxioVision Z1 microscope. Out of a total of 76
neutralization reactions 46 (61%) showed similar potency of
neutralization between the two types of readouts (Table 2). In the
remaining 30 reactions the potency of neutralization was different,
such that automated reading gave stronger neutralization in 20
cases (67%). Comparison to the PBMC assays showed that in three
virus-plasma combinations the plaque reduction (PR) assay yielded
higher IC50 than the maximum IC50 obtained in the PBMC
assay and in three other combinations IC50s were below that of
the minimum value obtained in the PBMC assay. In all other cases
the results of PR assay were within the range of min/max values of
inter-lab variation for PMBC assays (Figure 5). Performance in the
PR assay appeared to be random since no selectivity for a
particular reagent or virus was observed. The results show that the
previously standardized and validated PR assay can be subjected
to automated reading allowing high-throughput application and
further improvement of assay sensitivity. The PR assay has been
repeatedly shown to be highly reproducible, sensitive and cheap
[23,24,34,35,36]. It is now available with high throughput readout
and could be considered as an alternative to the PBMC assay.
Discussion
The primary aim of this study was to compare methods for the
measurement of HIV-1 neutralizing antibodies in order to make
recommendation for general use of one or two assays in research
as well as in clinical trials of candidate HIV-1 vaccines. The
results show that assay outcome is dependent on both the virus and
the inhibitory reagent used, as well as the type of assay. This is in
line with the observation made in the NeutNet Phase I study
where monoclonal antibodies and soluble CD4 were used (www.
europrise.org) [17]. The present study has extended this
observation by including polyclonal reagents (plasma from HIV-
1 infected individuals).
A comparison of the intra-laboratory consistency obtained when
using either the IC50, IC75 or IC90 did not indicate that one had a
significant advantage over the others, with all three giving mean
differences between repeat tests of less than 2-fold. The IC50 was used
in all subsequent analyses. In most of the assays 90% or even 75% of
neutralization could not be achieved at the lowest plasma dilution
(1:20) tested, and use of the IC50 levels ensured a larger dataset for the
study analysis. These results also suggest that VI assays may be
evaluated with the less stringent IC50 rather than the usual IC90.
Comparison of the two types of assays, the PSV assay and
PBMC, with TriMab, a mixture of three monoclonal antibodies,
indicated that the PSV assay detects HIV-1 neutralization with
higher sensitivity than PBMC (p = 0.014). This relationship was
confirmed over time and was similar in both Phase I and II studies.
Figure 4. Comparison of PSV and VI assays across plasma by circular ‘‘radar’’ plots. The scales were adjusted such that no neutralization(IC50,20) is at the centre, and the outer ring is strong neutralization (IC50.1280). The concentric grid-lines are 2-fold dilution steps. Lines from thecentre represent an axis for each plasma. The geometric mean IC value for PSV (blue lines) and PBMC (red lines) against each plasma is plotted, andthe points joined.doi:10.1371/journal.pone.0036438.g004
The NeutNet Report II
PLoS ONE | www.plosone.org 8 May 2012 | Volume 7 | Issue 5 | e36438

However, a clear difference in sensitivities of the two types of
assays could not be established with polyclonal reagents. When
neutralizing activity was examined across viruses or across plasma
the two assay types showed comparable sensitivities for most but
not all combinations. PSV appeared to be more sensitive in some
but not all virus-plasma combinations and sensitivity was
dependent on both the virus and the plasma. We cannot exclude
that the apparent higher sensitivity of the PSV assay with some
virus-plasma combinations as compared to VIA could be due to
the pre-selection of the polyclonal reagents done with PSV assays.
Also, polyclonal samples containing different Ig subtypes with
various functional activity, together with PBMC, a mix of varieties
of cell types responsible for different inhibitory functions, may
exert a differential effect on replication of the different viruses.
Specificities of the plasma used in our study were not tested and
reactivity might be against multiple epitopes present. Furthermore,
it is clear that for cases where specificity testing was attempted, it
was concluded that reactivity against multiple epitopes was
present, some of which are well known, while others are not
typed yet [37,38,39].
Results were markedly different with the 92UG024 virus, being
extremely sensitive (Tier 1) in the PSV assay but showing a more
resistant profile in VIA. However assay results of the four
laboratories performing the PSV assay were very disparate.
Interestingly the nature of the virus, single- versus multiple-round
infection might have had a dramatic impact for this particular
virus-plasma combination. However, such dramatic differences
were not seen with the other inhibitory reagents used. We can also
not exclude that the amino acid differences (n = 5) seen between
the culture supernatant and the PSV plasmid might have been
responsible for the observed differences.
Due to the set-up of our NeutNet study each lab was obliged to
use their own protocol both for virus production and neutraliza-
tion assay. This is different to the comparative study by Todd et al.
[16] in which the goal was to compare neutralization results
obtained by several laboratories all using the same assay (PSV-
TZMbl). From that study the authors concluded that pseudovirus
stocks generated in individual laboratories were a major source for
assay variability. Inter-laboratory results were more homogenous
when the same titrated PSV stocks were distributed among
participants. In our study, HEK293T cells were from a common
source, whereas production and titration of PSV stocks were done
in individual laboratories. This is likely to have contributed to
assay variability, which however was anyhow limited. In addition,
our study aimed at comparing different protocols rather than use
of one standard protocol.
Figure 5. Comparison of PBMC assay with the automated readout of the plaque reduction assay. Plaques, identified as GFP-expressingcells, were evaluated by use of an AxioVision Z1 Microscope with automated reading platform. The 96-well plates were screened through withillumination time of 200 ms throughout experiments. To reduce auto fluorescence, medium was removed and PBS was gently added pre-microscopy.Plaque quantity was measured with CellProfiler software ( [32] (www.cellprofiler.org), version r10997. Image analysis was performed using fifteen 56mosaic images per well. Results presented are the means of 2–3 experiments. Black dots, IC50 obtained by individual laboratories in the PBMC assay;red squares, IC50 obtained in the plaque reduction assay.doi:10.1371/journal.pone.0036438.g005
The NeutNet Report II
PLoS ONE | www.plosone.org 9 May 2012 | Volume 7 | Issue 5 | e36438
Within the group of VIAs, the conventional PBMC assay was
compared to the PR assay using the GHOST(3) cell line. The
previously standardized and validated PR assay has been subjected
to automated reading allowing high-throughput application and
further improvement of assay sensitivity. In particular, the high-
throughput readout gives results that are within the range of
variation of PBMC assays. Since the PBMC assay is cumbersome
and difficult to standardize, the use of the reliable, simple and
cheap PR assay is encouraged.
However, the recommendation of one assay for general use is
complicated by the fact that we still lack knowledge about which
in vitro assay best correlates with in vivo protection. The variation
of assay sensitivity with the virus and the inhibitory reagent
justifies the use of both types of assays, PSV and VIA. Although
initially our goal was to choose ‘‘the best’’ assay for use in
vaccine research and clinical vaccine trials, the most important
lesson learned is that no assay alone detects neutralization over
the entire spectrum of virus-reagent combinations [17,40]. In
addition to neutralization, additional inhibitory activity of
antibodies, identified as antibody-dependent cellular virus inhi-
bition (ADCVI) or antibody-dependent cellular cytotoxicity
(ADCC), may contribute to HIV protection [41]. For ADCC
and ADCVI different protocols exist [42,43], and possibly a
similar exercise as the one performed within NeutNet should be
considered for other functional assays.
Future work should aim at clarifying the biological significance
of both neutralizing and non-neutralizing antibodies detected in
the different assays. If a correlation between in vitro antibody
mediated viral inhibition and in vivo protection can be established,
it will also be possible to choose the most appropriate assay to
measure such antibodies in future vaccine trials.
In summary, clear differences in assay sensitivities, dependent
on both the neutralizing reagent and the virus, were once again
demonstrated. As previously, the use of both PSV and VI
neutralization assays are recommended for vaccine evaluation.
Supporting Information
Figure S1 Mean inhibitory concentration (IC) 50 values for
duplicate assays performed with HIV negative plasma (ARP523) and
virus as indicated. The cells are colour coded: green, poor or no
neutralization, reciprocal plasma dilution ,20; yellow, reciprocal
plasma dilution 20–160. Assays are grouped as in Figure 2.
Laboratories performing the assays are numbered and colour coded.
(TIF)
Figure S2 Partial amino acid sequence alignment of 92UG024
from culture supernatant and PSV plasmid. Differences in
sequence were highlighted.
(DOCX)
Figure S3 Inhibitory concentration (IC) 50 values generated by
laboratories using 92UG024 PSV, using either plasmid (6A, 10
and 13) or culture supernatant (12) as starting material for virus
production, as compared to IC50’s of PBMC using laboratories.
(TIF)
Table S1 Selection and characterization of plasma samples. (A)
Characterization of samples obtained from Zeptometrix. (B) and
(C) Selection of blood donor samples obtained through NIBSC.
Foot note: Colour code for assays: orange, indicates IC50 in the
PSV (DNA) - TZMbl assay; minimum assay cut off ,20. Pink,
indicates IC50 in the PSV recombinant virus assay (CC), except
for *(DNA used; CC not tested); blue, titer given in percentage
using a 1: 30 plasma dilution (S1A) or in IC90 (S1C) in the PBMC
assay (mean of 2 tests). Minimum assay cut off or negative values in
white. Selected plasma samples are in bold (in Table S1B and
S1C). Results are displayed for viruses tested simultaneously in two
or three assays. Another 13 and 10 viruses were tested in the PSV-
TZMbl and PSV recombinant assay, respectively (S1B and S1C).
(XLSX)
Table S2 Intra-laboratory consistency of inhibitory concentra-
tions (IC). Foot note: (S2a); Analysis was restricted to tests where it
had been possible to calculate an IC value from the data for both
tests, and the calculated IC values were within the dilution range
used (20–1280). Values were calculated in two ways (1)
individually for each IC value across repeat tests that satisfied
the predefined criteria and (2) restricted to tests where all three IC
values could be calculated. (S2b); Based on data from laboratories
2, 4B, 6A, 10, 12 and 13 (PSV) and laboratories 3B, 6B, 7, 8, 14
and 15 (PBMC). A two-sample t-test was used on the pooled set of
fold differences to compare the PSV and PBMC consistency.
(XLSX)
Table S3 Inter-laboratory comparisons. Foot note: For each
laboratory, a geometric mean IC value for the repeat tests was
calculated. For each virus and inhibitory combination, an overall
geometric mean of the individual laboratory means was calculated,
along with the minimum, maximum, and range between labora-
tories. Values of the ICs are expressed as mg/ml for TriMab and as
reciprocal dilutions for plasma. To allow calculations of the
geometric means, any IC value that was greater than the highest
dilution used were taken as equal to the next two-fold dilution step,
so results recorded as .1280 were taken as equal to 2560. Similarly,
IC values that were below the lowest dilution were taken as the next
two-fold dilution step (e.g. ,20 was converted to 10). To calculate
fold-ranges for inter-laboratory comparisons, a conservative
estimate was calculated by taking, for example ,20 = 20, to give
a minimum fold-range. N lab, number of laboratories involved.
(XLSX)
Acknowledgments
Expert technical assistance of Karoliina Lamaanen at the University of
Oxford; Marit J. van Gils, Evelien Bunnik and Zelda Euler, Academic
Medical Center at the University of Amsterdam; Maphuti Madiga of the
National Institute for Communicable Diseases, South Africa; Nuria
Gonzalez of the Instituto de Salud Carlos III, Madrid; Stefania Dispinseri
and Francesca Sironi, San Raffaele Scientific Institute, Milan; Monica
Oberg and Elzbieta Vincic Lund University; Katleen Vereecken, Katrijn
Grupping and Derek Atkinson, Institute of Tropical Medicine, Antwerp;
and Sarah Goriup, National Institute for Biological Standards and Control
is greatly appreciated.
The Ghost (3) cells were kindly provided by Dr. Dan Littman, Skirball
Institute of Biomolecular Medicine, New York University, New York,
USA; the HELA cells (ARP019) were provided by the EU Programme
EVA Centre for AIDS Reagents, NIBSC, UK (AVIP Contract Number
LSHP-CT-2004-503487). For development of automated reading of
plaque reduction assay partner 9 collaborated with Dr. Anne Carpenter,
Imaging Platform, Broad Institute, Cambridge, USA.
Author Contributions
Conceived and designed the experiments: LH EMF SO GS. Performed the
experiments: LH AH ESK JA VB MJ MM DM CM LM SO VP MR QS
MT HS BW TW EMF GS. Analyzed the data: AH LH EMF ESK GS.
Contributed reagents/materials/analysis tools: MR AH SO. Wrote the
paper: LH EMF AH GS. Complemented and approved the final version of
the manuscript: LH AH ESK JA VB MJ MM DM CM LM SO VP MR
QS MT HS BW TW EMF GS. Extensive discussion and expertise: LH AH
ESK JA VB MJ MM DM CM LM SO VP MR QS MT HS BW TW EMF
GS.
The NeutNet Report II
PLoS ONE | www.plosone.org 10 May 2012 | Volume 7 | Issue 5 | e36438

References
1. Belshe RB, Graham BS, Keefer MC, Gorse GJ, Wright P, et al. (1994)Neutralizing antibodies to HIV-1 in seronegative volunteers immunized with
recombinant gp120 from the MN strain of HIV-1. NIAID AIDS VaccineClinical Trials Network. JAMA : the journal of the American Medical
Association 272: 475–480.
2. Esparza J, Osmanov S (2003) HIV vaccines: a global perspective. Current
molecular medicine 3: 183–193.
3. Goudsmit J, Debouck C, Meloen RH, Smit L, Bakker M, et al. (1988) Human
immunodeficiency virus type 1 neutralization epitope with conserved architec-ture elicits early type-specific antibodies in experimentally infected chimpanzees.
Proceedings of the National Academy of Sciences of the United States of
America 85: 4478–4482.
4. McElrath MJ, Corey L, Montefiori D, Wolff M, Schwartz D, et al. (2000) A
phase II study of two HIV type 1 envelope vaccines, comparing theirimmunogenicity in populations at risk for acquiring HIV type 1 infection.
AIDS Vaccine Evaluation Group. AIDS research and human retroviruses 16:907–919.
5. Fenyo EM, Albert J, McKeating J (1996) The role of the humoral immuneresponse in HIV infection. AIDS 10 Suppl A. pp S97–106.
6. Osmanov S, Heyward WL, Esparza J (1994) The World Health OrganizationNetwork for HIV Isolation and Characterization: summary of a pilot study.
AIDS research and human retroviruses 10: 1325–1326.
7. McCarthy M (2003) HIV vaccine fails in phase 3 trial. Lancet 361: 755–756.
8. (2007) HIV vaccine failure prompts Merck to halt trial. Nature 449: 390.
9. McMichael AJ, Borrow P, Tomaras GD, Goonetilleke N, Haynes BF (2010) The
immune response during acute HIV-1 infection: clues for vaccine development.
Nature reviews Immunology 10: 11–23.
10. Moore JP, Cao Y, Leu J, Qin L, Korber B, et al. (1996) Inter- and intraclade
neutralization of human immunodeficiency virus type 1: genetic clades do notcorrespond to neutralization serotypes but partially correspond to gp120
antigenic serotypes. Journal of virology 70: 427–444.
11. Nyambi PN, Nkengasong J, Lewi P, Andries K, Janssens W, et al. (1996)
Multivariate analysis of human immunodeficiency virus type 1 neutralizationdata. Journal of virology 70: 6235–6243.
12. Weber J, Fenyo EM, Beddows S, Kaleebu P, Bjorndal A (1996) Neutralizationserotypes of human immunodeficiency virus type 1 field isolates are not
predicted by genetic subtype. The WHO Network for HIV Isolation andCharacterization. Journal of virology 70: 7827–7832.
13. D’Souza MP, Durda P, Hanson CV, Milman G (1991) Evaluation of
monoclonal antibodies to HIV-1 by neutralization and serological assays: aninternational collaboration. Collaborating Investigators. AIDS 5: 1061–1070.
14. D’Souza MP, Livnat D, Bradac JA, Bridges SH (1997) Evaluation of monoclonalantibodies to human immunodeficiency virus type 1 primary isolates by
neutralization assays: performance criteria for selecting candidate antibodies forclinical trials. AIDS Clinical Trials Group Antibody Selection Working Group.
The Journal of infectious diseases 175: 1056–1062.
15. Li M, Gao F, Mascola JR, Stamatatos L, Polonis VR, et al. (2005) Human
immunodeficiency virus type 1 env clones from acute and early subtype Binfections for standardized assessments of vaccine-elicited neutralizing antibod-
ies. Journal of virology 79: 10108–10125.
16. Todd CA, Greene KM, Yu X, Ozaki DA, Gao H, et al. (2011) Developmentand implementation of an international proficiency testing program for a
neutralizing antibody assay for HIV-1 in TZM-bl cells. Journal of immunolog-ical methods.
17. Fenyo EM, Heath A, Dispinseri S, Holmes H, Lusso P, et al. (2009)International network for comparison of HIV neutralization assays: the NeutNet
report. PloS one 4: e4505.
18. Davis D, Donners H, Willems B, Vermoesen T, Heyndrickx L, et al. (2003)
Epitopes corresponding to the envelope genetic subtype are present on thesurface of free virions of HIV-1 group M primary isolates and can be detected in
neutralization assays with extended incubation phases. Journal of medical
virology 71: 332–342.
19. Quakkelaar ED, van Alphen FP, Boeser-Nunnink BD, van Nuenen AC,
Pantophlet R, et al. (2007) Susceptibility of recently transmitted subtype Bhuman immunodeficiency virus type 1 variants to broadly neutralizing
antibodies. Journal of virology 81: 8533–8542.
20. Scarlatti G, Albert J, Rossi P, Hodara V, Biraghi P, et al. (1993) Mother-to-child
transmission of human immunodeficiency virus type 1: correlation withneutralizing antibodies against primary isolates. The Journal of infectious
diseases 168: 207–210.
21. Holl V, Peressin M, Decoville T, Schmidt S, Zolla-Pazner S, et al. (2006)
Nonneutralizing antibodies are able to inhibit human immunodeficiency virus
type 1 replication in macrophages and immature dendritic cells. Journal of
virology 80: 6177–6181.22. Polonis VR, De Souza MS, Chanbancherd P, Chantakulkij S, Jugsudee A, et al.
(2001) HIV type 1 subtype E-infected patients with broadened, dual (B/E) V3loop serology have increased cross-neutralizing antibodies. AIDS research and
human retroviruses 17: 69–79.
23. Nordqvist A, Fenyo EM (2005) Plaque-reduction assays for human and simianimmunodeficiency virus neutralization. Methods in molecular biology 304:
273–285.24. Shi Y, Albert J, Francis G, Holmes H, Fenyo EM (2002) A new cell line-based
neutralization assay for primary HIV type 1 isolates. AIDS research and human
retroviruses 18: 957–967.25. Morner A, Bjorndal A, Albert J, Kewalramani VN, Littman DR, et al. (1999)
Primary human immunodeficiency virus type 2 (HIV-2) isolates, like HIV-1isolates, frequently use CCR5 but show promiscuity in coreceptor usage. Journal
of virology 73: 2343–2349.26. Maddon PJ, Dalgleish AG, McDougal JS, Clapham PR, Weiss RA, et al. (1986)
The T4 gene encodes the AIDS virus receptor and is expressed in the immune
system and the brain. Cell 47: 333–348.27. Montefiori DC (2005) Evaluating neutralizing antibodies against HIV, SIV, and
SHIV in luciferase reporter gene assays. Curr Protoc Immunol Chapter 12: Unit12 11.
28. Richman DD, Wrin T, Little SJ, Petropoulos CJ (2003) Rapid evolution of the
neutralizing antibody response to HIV type 1 infection. Proceedings of theNational Academy of Sciences of the United States of America 100: 4144–4149.
29. Heyndrickx L, Vermoesen T, Vereecken K, Kurth J, Coppens S, et al. (2008)Antiviral compounds show enhanced activity in HIV-1 single cycle pseudovirus
assays as compared to classical PBMC assays. J Virol Methods 148: 166–173.30. Garcia-Perez J, Perez-Olmeda M, Sanchez-Palomino S, Perez-Romero P,
Alcami J (2008) A new strategy based on recombinant viruses for assessing the
replication capacity of HIV-1. HIV medicine 9: 160–171.31. Gonzalez N, Perez-Olmeda M, Mateos E, Cascajero A, Alvarez A, et al. (2010)
A sensitive phenotypic assay for the determination of human immunodeficiencyvirus type 1 tropism. Journal of Antimicrobial Chemotherapy 65: 2493–2501.
32. Carpenter AE, Jones TR, Lamprecht MR, Clarke C, Kang IH, et al. (2006)
CellProfiler: image analysis software for identifying and quantifying cellphenotypes. Genome biology 7: R100.
33. Cecilia D, KewalRamani VN, O’Leary J, Volsky B, Nyambi P, et al. (1998)Neutralization profiles of primary human immunodeficiency virus type 1 isolates
in the context of coreceptor usage. Journal of virology 72: 6988–6996.34. Lauren A, Thorstensson R, Fenyo EM (2006) Comparative studies on mucosal
and intravenous transmission of simian immunodeficiency virus (SIVsm): the
kinetics of evolution to neutralization resistance are related to progression rate ofdisease. The Journal of general virology 87: 595–606.
35. Ozkaya Sahin G, Bowles EJ, Parker J, Uchtenhagen H, Sheik-Khalil E, et al.(2010) Generation of neutralizing antibodies and divergence of SIVmac239 in
cynomolgus macaques following short-term early antiretroviral therapy. PLoS
pathogens 6: e1001084.36. Ozkaya Sahin G, Holmgren B, da Silva Z, Nielsen J, Nowroozalizadeh S, et al.
(2012) Potent intratype neutralizing activity distinguishes human immunodefi-ciency virus type 2 (HIV-2) from HIV-1. Journal of virology 86: 961–971.
37. Walker LM, Simek MD, Priddy F, Gach JS, Wagner D, et al. (2010) A limitednumber of antibody specificities mediate broad and potent serum neutralization
in selected HIV-1 infected individuals. PLoS pathogens 6: e1001028.
38. Li Y, Svehla K, Louder MK, Wycuff D, Phogat S, et al. (2009) Analysis ofneutralization specificities in polyclonal sera derived from human immunode-
ficiency virus type 1-infected individuals. Journal of virology 83: 1045–1059.39. Gray ES, Taylor N, Wycuff D, Moore PL, Tomaras GD, et al. (2009) Antibody
specificities associated with neutralization breadth in plasma from human
immunodeficiency virus type 1 subtype C-infected blood donors. J Virol 83:8925–8937.
40. Polonis VR, Brown BK, Rosa Borges A, Zolla-Pazner S, Dimitrov DS, et al.(2008) Recent advances in the characterization of HIV-1 neutralization assays
for standardized evaluation of the antibody response to infection and
vaccination. Virology 375: 315–320.41. von Bubnoff A (2010) Antibodies: beyond neutralization. IAVI report :
newsletter on international AIDS vaccine research 14: 8–12.42. Forthal DN, Moog C (2009) Fc receptor-mediated antiviral antibodies. Current
opinion in HIV and AIDS 4: 388–393.43. Ljunggren K, Bottiger B, Biberfeld G, Karlson A, Fenyo EM, et al. (1987)
Antibody-dependent cellular cytotoxicity-inducing antibodies against human
immunodeficiency virus. Presence at different clinical stages. Journal ofimmunology 139: 2263–2267.
The NeutNet Report II
PLoS ONE | www.plosone.org 11 May 2012 | Volume 7 | Issue 5 | e36438