international search funds – 2016 selected … · iese business school-university of navarra...
TRANSCRIPT
IESE Business School-University of Navarra - 1
INTERNATIONAL SEARCH FUNDS – 2016 Selected Observations
Lenka Kolarova
Peter Kelly
Antonio Dávila
Robert Johnson
The authors would like to thank all of the search fund principals who participated in this study. Additional thanks go to Francisco Liquido (MBA 2014, IESE) and Ricardo Velilla (MBA 2015, IESE) for pioneering and updating earlier versions of this study.
IESE Business School – University of Navarra Av. Pearson, 21 – 08034 Barcelona, Spain. Phone: (+34) 93 253 42 00 Fax: (+34) 93 253 43 43 Camino del Cerro del Águila, 3 (Ctra. de Castilla, km 5,180) – 28023 Madrid, Spain. Phone: (+34) 91 357 08 09 Fax: (+34) 91 357 29 13 Copyright © 2016 IESE Business School
ST-415-E
June 2016

IESE Business School-University of Navarra
INTERNATIONAL SEARCH FUNDS – 2016 Selected Observations
Lenka Kolarova1
Peter Kelly2
Antonio Dávila3
Robert Johnson4
Abstract This note is a biannual study completed by IESE Business School on search funds that were formed outside the United States and Canada. It was undertaken in partnership with Stanford Graduate School of Business. By using a quantitative survey-based research method, the study aims to shed light on the evolving characteristics of all known international search funds, including changes in the characteristics of search fund entrepreneurs. The study is drawn from a pool of 45 first-time search funds, the earliest of which was formed in 1992. The sample set is diverse, with international searchers in 14 countries on four continents.
1 MBA 2011, IESE Business School. 2 Lecturer in Management, Stanford Graduate School of Business. 3 Professor of Entrepreneurship, Accounting and Control, IESE Business School. 4 Visiting Professor of Entrepreneurship, IESE Business School.
2 - IESE Business School-University of Navarra
INTERNATIONAL SEARCH FUNDS – 2016 Selected Observations
Introduction In 2011, IESE Business School (IESE) agreed with the Stanford Graduate School of Business (GSB) to identify and track international search funds.1 This note is the third to be published by IESE, which plans to update it biannually in concert with Stanford’s report on search funds.2
By using a quantitative survey-based research method this note aims to shed light on the evolving characteristics of all known international search funds,3 including changes in the characteristics of search fund entrepreneurs.4 The number of search funds outside the United States and Canada has increased to the point that this report is able for the first time to evaluate investment returns generated by first-time search funds to their original investors.5
The principals tracked in this study are from diverse locations, and in order to convey their varied experiences Appendix A presents qualitative observations based on a series of interviews with international, rather than U.S. and Canada-based, entrepreneurs.
In brief, search funds offer entrepreneurs the opportunity to become equity-owning business operators before they have accumulated the capital or experience often required to buy or lead a company. For investors, the asset class is a stage-based investment, first in an entrepreneur and next in the acquisition of an existing business. The life cycle of a search fund can be reduced to four stages: (1) raising a search fund, i.e., a pool of capital with which the searcher(s) find a company to acquire; (2) search and acquisition, during which time the searcher(s) locate and acquire an operating business; (3) operation, the longest stage, during which the searcher(s) lead and grow the business; and (4) exit, at which point the searcher(s) and investors achieve liquidity by various means. For additional background information on the search fund asset class, see the Stanford GSB Center for Entrepreneurial Studies (CES) Search Fund Primer and website.
1 “International" in this use means outside the United States and Canada.
2 For more information on Stanford’s research in the United States and Canada, which has tracked more than 258 search funds formed since 1983, see http://www.gsb.stanford.edu/ces/resources/search_funds.html. 3 “Known search funds” refers to those of which IESE is aware. Despite the broad network of search fund principals, investors, and advisors that share searcher data with IESE, it is possible that search funds have existed or do exist that are not known to IESE. 4 The data in this study is reported as of December 31, 2015. 5 An original investor is defined as one who contributed capital to the initial search fund and the initial acquisition capital.
IESE Business School-University of Navarra - 3
International Search Fund Asset Class This study is drawn from a pool of 45 first-time search funds, the earliest of which was formed in 1992. It only considers first-time search funds, excluding self-funded searches and second-time search funds since those imply different skill sets, capital and external requirements.
Each principal, or pair of principals, was asked to complete a standardized, electronically distributed survey that included questions about their personal background and professional profile. They were also asked about the fundraising process and the geographic focus, target industries and company characteristics of their search fund. Searchers that completed an acquisition were asked about purchase and operational metrics, and those that had achieved liquidity or operated for more than a year were asked about the returns or valuation (and implied return).
Although every effort was made to contact and collect information from every known search fund outside the United States and Canada, readers are cautioned that some were likely not included and, as this study is repeated, additional searches may be retroactively added to the sample set as they become known, possibly affecting the information presented in this report.6
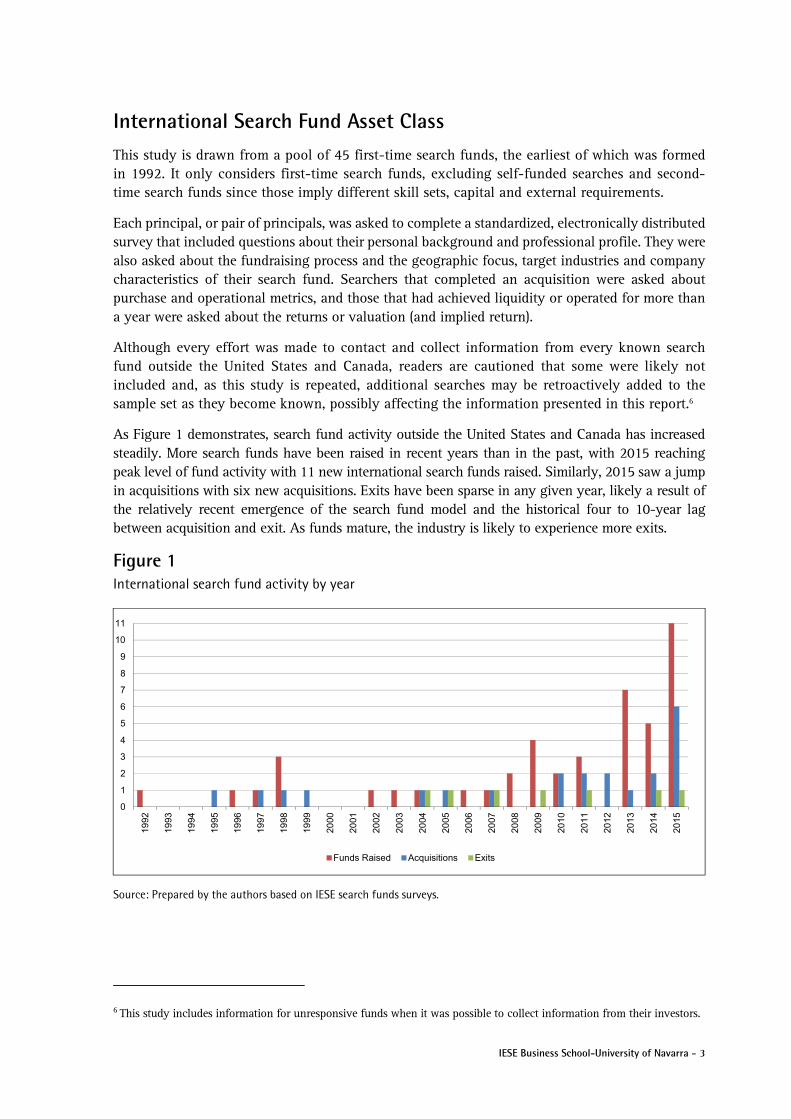
As Figure 1 demonstrates, search fund activity outside the United States and Canada has increased steadily. More search funds have been raised in recent years than in the past, with 2015 reaching peak level of fund activity with 11 new international search funds raised. Similarly, 2015 saw a jump in acquisitions with six new acquisitions. Exits have been sparse in any given year, likely a result of the relatively recent emergence of the search fund model and the historical four to 10-year lag between acquisition and exit. As funds mature, the industry is likely to experience more exits.
Figure 1 International search fund activity by year
Source: Prepared by the authors based on IESE search funds surveys.
6 This study includes information for unresponsive funds when it was possible to collect information from their investors.
0
1
2
3
4
5
6
7
8
9
10
11
1992
1993
1994
1995
1996
1997
1998
1999
2000
2001
2002
2003
2004
2005
2006
2007
2008
2009
2010
2011
2012
2013
2014
2015
Funds Raised Acquisitions Exits
4 - IESE Business School-University of Navarra
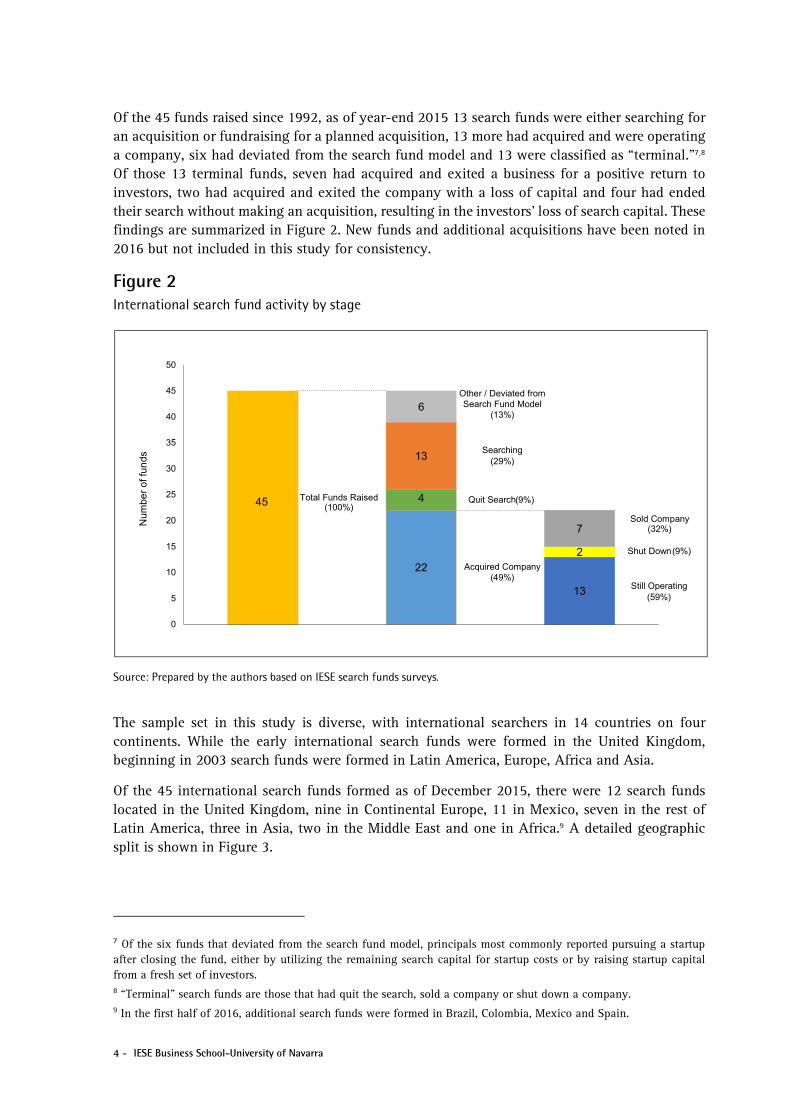
Of the 45 funds raised since 1992, as of year-end 2015 13 search funds were either searching for an acquisition or fundraising for a planned acquisition, 13 more had acquired and were operating a company, six had deviated from the search fund model and 13 were classified as “terminal.”7,8 Of those 13 terminal funds, seven had acquired and exited a business for a positive return to investors, two had acquired and exited the company with a loss of capital and four had ended their search without making an acquisition, resulting in the investors’ loss of search capital. These findings are summarized in Figure 2. New funds and additional acquisitions have been noted in 2016 but not included in this study for consistency.
Figure 2 International search fund activity by stage
Source: Prepared by the authors based on IESE search funds surveys.
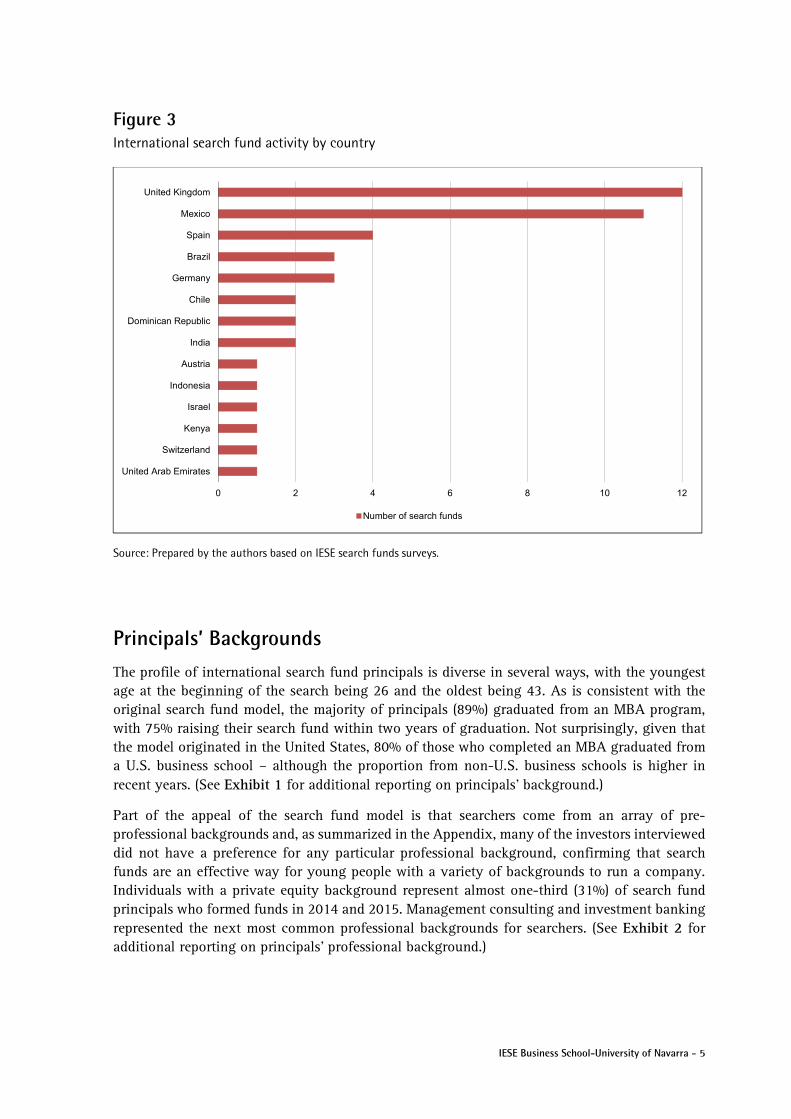
The sample set in this study is diverse, with international searchers in 14 countries on four continents. While the early international search funds were formed in the United Kingdom, beginning in 2003 search funds were formed in Latin America, Europe, Africa and Asia.
Of the 45 international search funds formed as of December 2015, there were 12 search funds located in the United Kingdom, nine in Continental Europe, 11 in Mexico, seven in the rest of Latin America, three in Asia, two in the Middle East and one in Africa.9 A detailed geographic split is shown in Figure 3.
7 Of the six funds that deviated from the search fund model, principals most commonly reported pursuing a startup after closing the fund, either by utilizing the remaining search capital for startup costs or by raising startup capital from a fresh set of investors. 8 “Terminal” search funds are those that had quit the search, sold a company or shut down a company. 9 In the first half of 2016, additional search funds were formed in Brazil, Colombia, Mexico and Spain.
45
22
4
13
6
13
2
7
0
5
10
15
20
25
30
35
40
45
50
1 2 3
Num
ber
of f
unds
Total Funds Raised(100%)
Other / Deviated from Search Fund Model
(13%)
Searching(29%)
Quit Search(9%)
Acquired Company(49%)
Sold Company(32%)
Shut Down(9%)
Still Operating(59%)
IESE Business School-University of Navarra - 5
Figure 3 International search fund activity by country
Source: Prepared by the authors based on IESE search funds surveys.
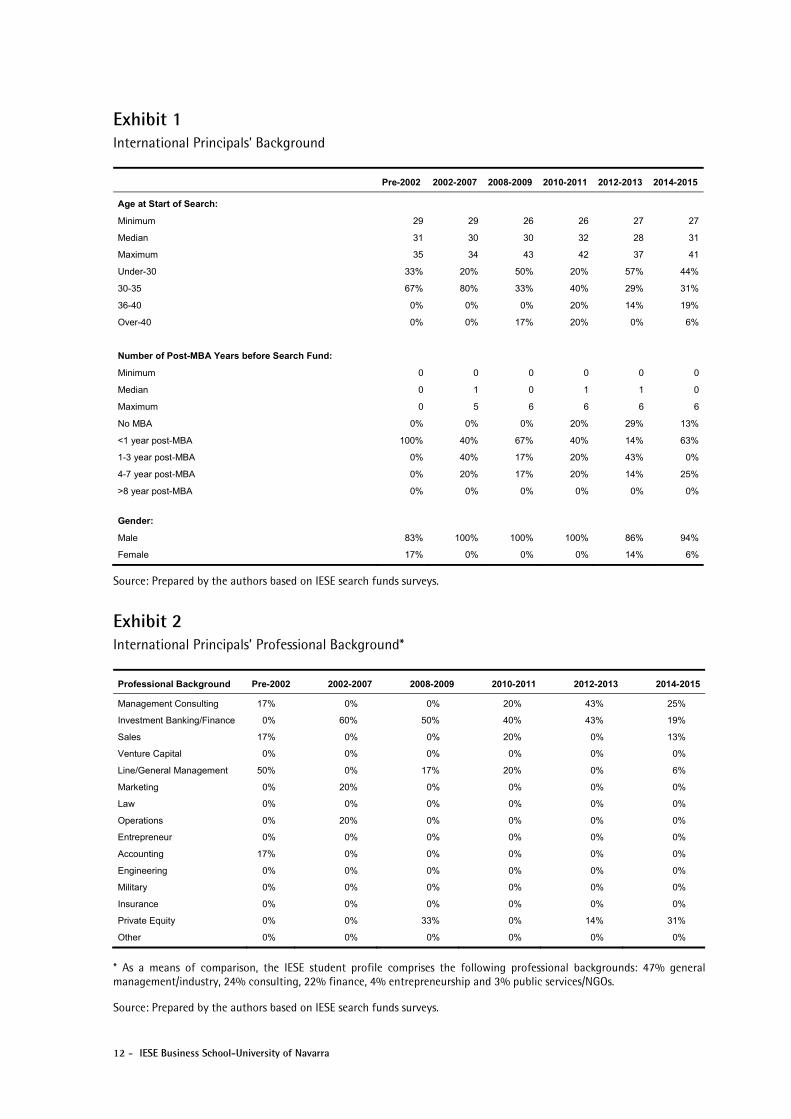
Principals’ Backgrounds The profile of international search fund principals is diverse in several ways, with the youngest age at the beginning of the search being 26 and the oldest being 43. As is consistent with the original search fund model, the majority of principals (89%) graduated from an MBA program, with 75% raising their search fund within two years of graduation. Not surprisingly, given that the model originated in the United States, 80% of those who completed an MBA graduated from a U.S. business school – although the proportion from non-U.S. business schools is higher in recent years. (See Exhibit 1 for additional reporting on principals’ background.)
Part of the appeal of the search fund model is that searchers come from an array of pre-professional backgrounds and, as summarized in the Appendix, many of the investors interviewed did not have a preference for any particular professional background, confirming that search funds are an effective way for young people with a variety of backgrounds to run a company. Individuals with a private equity background represent almost one-third (31%) of search fund principals who formed funds in 2014 and 2015. Management consulting and investment banking represented the next most common professional backgrounds for searchers. (See Exhibit 2 for additional reporting on principals’ professional background.)
0 2 4 6 8 10 12
United Arab Emirates
Switzerland
Kenya
Israel
Indonesia
Austria
India
Dominican Republic
Chile
Germany
Brazil
Spain
Mexico
United Kingdom
Number of search funds
6 - IESE Business School-University of Navarra
Fundraising and Search Partnerships formed 40% of all international search funds. Most of the searchers interviewed stated they had decided to search with a partner for a variety of reasons – e.g., wanting someone with a complementary professional background, being able to more efficiently search with two principals instead of one, or simply having someone else to accompany him or her on what is often described as a “lonely” journey.
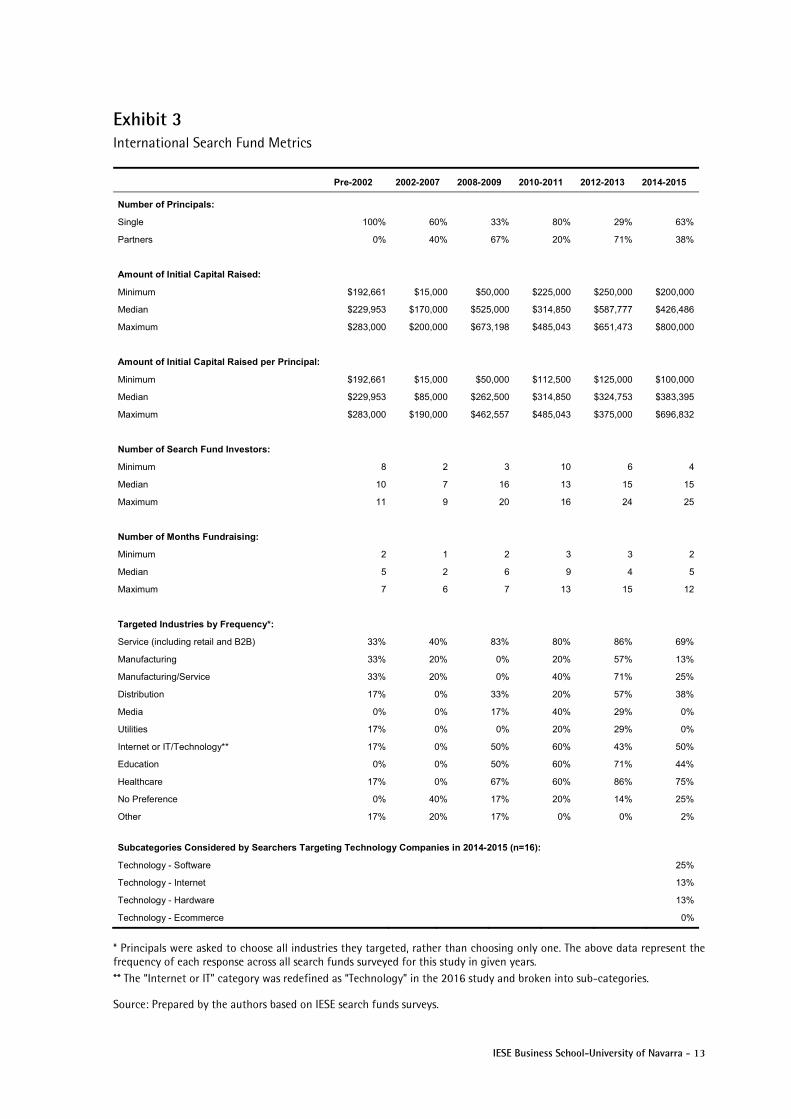
Fundraising metrics varied widely across the sample of all international search funds; the median amount raised equaled $391,195, the minimum amount was $15,000 and the maximum was $800,000.10 This divergence can be explained in part by the practice of dual-searcher funds raising more search capital to cover dual salaries and can be further explained by differences in local searching costs. The median capital raised per principal (rather than per fund) has risen steadily over the last several years, from $262,500 in 2008-2009 to $383,395 in this year’s study. The median number of search fund investors per fund stayed consistent at 15, and the median number of months to raise a fund decreased to between four and five.
The international searchers generally described themselves as “opportunistic” in their search process but did exhibit some industry preferences. Service businesses were generally a popular industry theme, with 67% of all international searchers stating that business services were a priority industry. After service, Internet/information technology (IT), health care, and education represented the most targeted industries in recent years. Given the proliferation and diversification of technology companies over the last decade, the most recent study breaks down the technology category further to provide a detailed view of how searchers are evaluating this sector. (See Exhibit 3 for additional comparison of search fund metrics.)
Acquiring a Company Search funds, both international and those in the United States and Canada, often include recurring revenue, high EBITDA margins and stable cash flow history in their investment criteria. In a sample of offering memoranda reviewed by the research team, nearly all mentioned these acquisition characteristics.
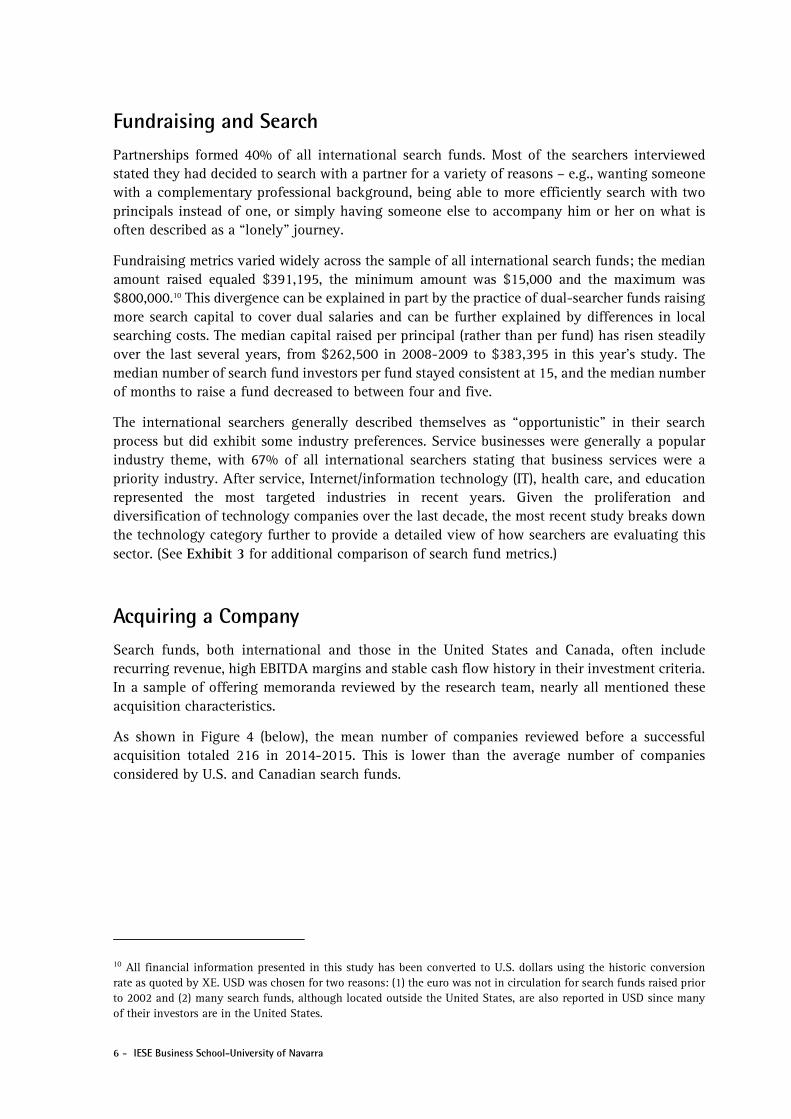
As shown in Figure 4 (below), the mean number of companies reviewed before a successful acquisition totaled 216 in 2014-2015. This is lower than the average number of companies considered by U.S. and Canadian search funds.
10 All financial information presented in this study has been converted to U.S. dollars using the historic conversion rate as quoted by XE. USD was chosen for two reasons: (1) the euro was not in circulation for search funds raised prior to 2002 and (2) many search funds, although located outside the United States, are also reported in USD since many of their investors are in the United States.
IESE Business School-University of Navarra - 7
Figure 4 Acquisition funnel of successful acquisitions: pre-2010, 2011, 2013 and 2015
Source: Prepared by the authors based on IESE search funds surveys.
“Self-sourcing” remains the predominant source of deal flow, which typically involves contacting businesses directly to learn whether they may be acquisition candidates. Brokers and investment banks also serve as a reliable source of deal flow for international searchers.
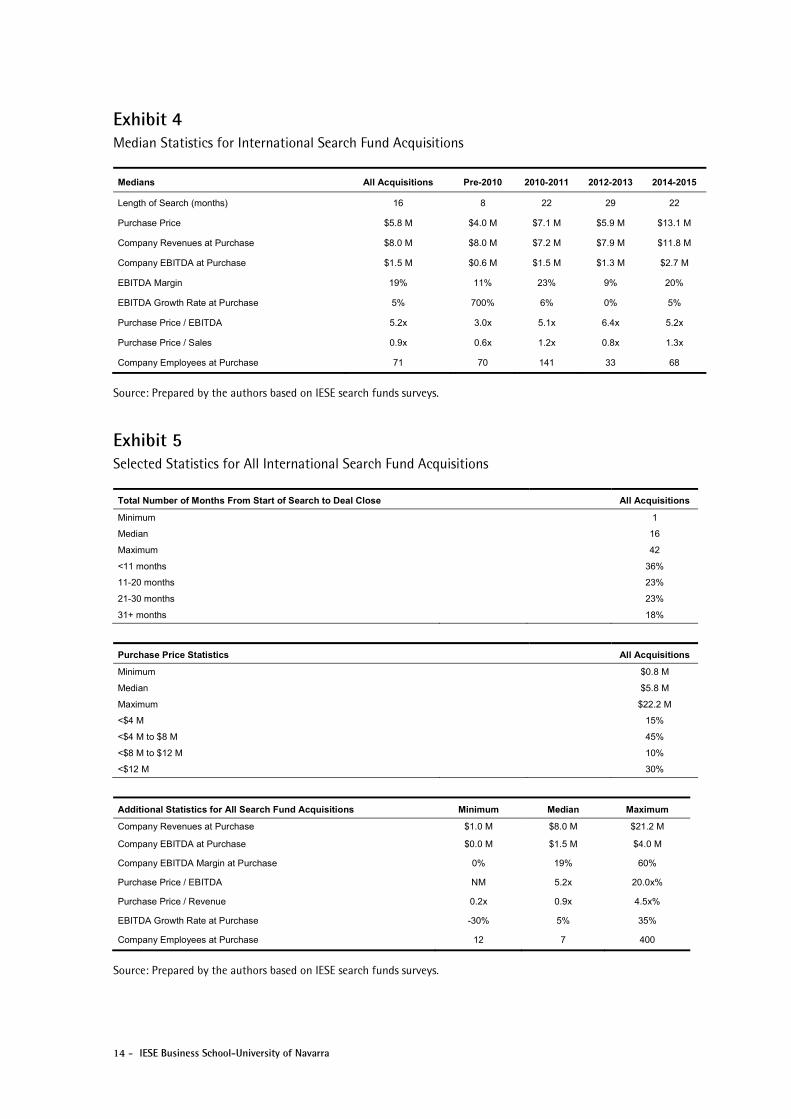
There have been 22 acquisitions made outside the United States and Canada through the search fund model to date (of the 45 search funds tracked by IESE versus 258 known U.S. and Canadian search funds tracked by Stanford GSB). Of these 22 acquisitions, seven were successfully sold, 13 are currently operating and two were exited with loss of equity. Of those that successfully completed an acquisition, 15% were purchased for less than $4 million, 45% for $4 million to $8 million, 10% for $8 million to $12 million and 30% for $12 million or more. The median search fund acquisition has the following characteristics at purchase: $8.0 million in revenues, EBITDA margin of 19%, a purchase price to EBITDA multiple of 5.2x, trailing annual EBITDA growth rate of 5% and 71 employees. (See Exhibit 4 and Exhibit 5 for more search fund acquisition statistics.)
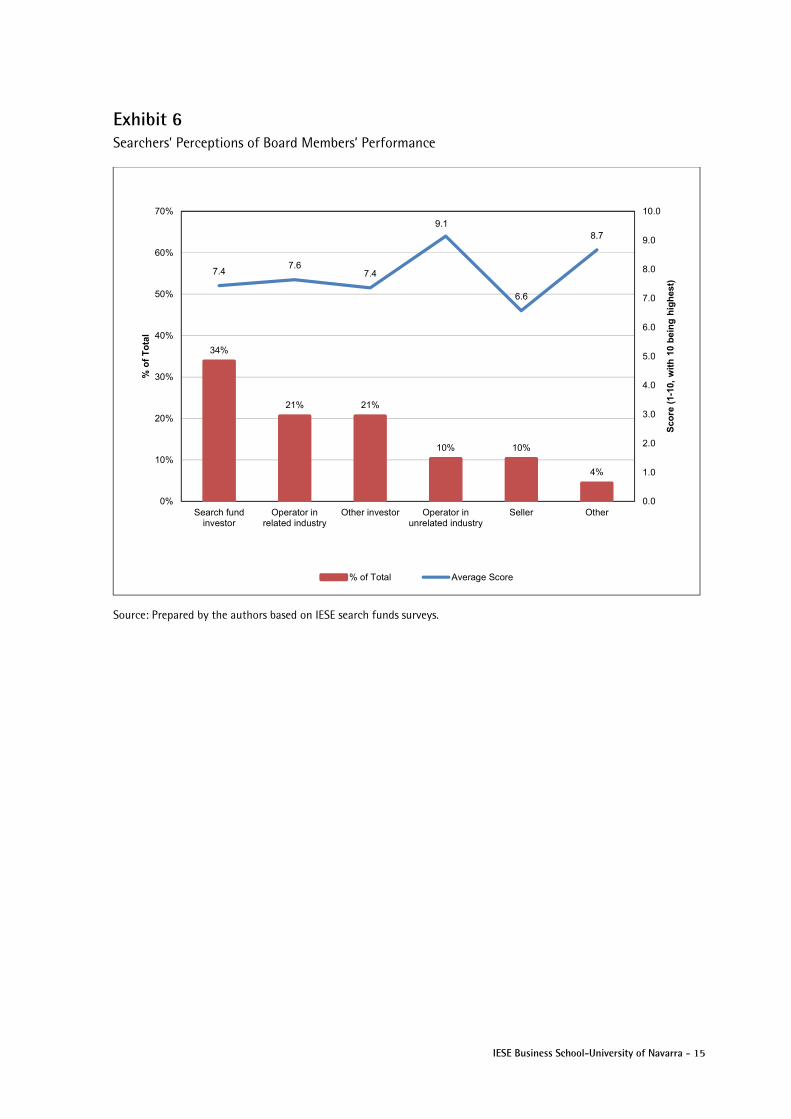
In this most recent study, searchers who had acquired a company were asked to provide information about the composition of their Board of Directors. The 18 searchers who responded provided professional background, years of experience, and a subjective score of their Board members’ early contributions, for 68 total Board members.11 Thirty-four percent of Board members were search fund investors, followed by operators in related industries and other types of investors, both at 21%. Board members had a median of 25 years of professional experience, and almost two-thirds had previous experience of serving on Boards. Overall, searchers reported high effectiveness for their Board members, with a median score of 8. (See Exhibit 6 for searchers’ perceptions of Board members’ performance.)
11 Searchers were asked to rate their Board members’ performance in terms of “effectiveness” on a scale of 1 to 10, with 10 being the highest.
1
2
9
60
2
4
27
224
5
4
60
333
1
2
29
216
0 50 100 150 200 250 300 350
Due diligence
Serious discussions
Initial approach
Identification
2014-2015 2012-2013 2010-2011 Pre-2010
8 - IESE Business School-University of Navarra
Additionally, and perhaps due to the earlier stage of some industries in some geographic regions, searchers have failed to find suitable acquisitions in targeted industries and instead, with investor support and after a sufficient period of investigation and searching, embarked on a startup. Even though most search investors discourage search entrepreneurs from planning a startup at the beginning, and indeed the search fund path is seen as less risky than a startup, investors’ participation in these deals has followed the typical search fund economics model. Indeed, of the six searchers that deviated from the search fund model, three founded startups with the backing of their search investors. Again, because of the limited sample set, readers are cautioned against making conclusions concerning a typical international search fund acquisition.
Financial Performance This study calculated financial returns from the perspective of investors of initial search capital, that is, it measured returns based on infusions from and distributions to the original search fund investors who invested in both the search and acquisition phases of the deal. Two measures of return were used: return on investment (ROI)12 and internal rate of return (IRR).13 Both ROI and IRR were calculated on a cash flow basis, including both equity and debt that was invested as initial search capital and as acquisition capital. Unsuccessful searches were included, along with both operating and exited companies.
The timing of the cash flows for each search fund was adjusted to a common start date and currency.14 All returns were calculated on a pre-tax basis using data provided by the principals of the funds or by their search fund investors. We assumed that the searchers’ share of equity had fully vested,15 all external debt was repaid, and funds were distributed in proportion to the investors’ share of equity and subordinated debt.
Of the 26 funds eligible (i.e., that had raised a search fund and either acquired a company or shut down the fund), 16 were included in the calculations of returns.16 This number includes four unsuccessful searches and 12 search funds that completed acquisitions. The calculation of
12 Return on investment (ROI) represents the multiple of initial cash invested that is returned to investors (also known as MOIC) – i.e., if the group of initial investors invested $5 million and received back $10 million, this would be described as a 2.0x ROI. A return of $1 million would be a 0.2x ROI and so forth. A complete loss of capital is an ROI of 0.0x. 13 Internal rate of return (IRR) represents the annual compounding rate derived from the adjusted dates and actual amounts of search and acquisition capital invested and returned by an investment. For investments returning nothing, or only a fraction of the investors’ original investment, IRR is not a meaningful metric. 14 The IRR for search funds as an asset class was calculated by shifting the dates of all cash flows such that all funds appear to have raised initial search capital on the same “day one.” Subsequent infusions from, and distributions to, search fund investors occurred at the same intervals reported by each fund. Thus, the asset class IRR is a hypothetical return an investor would have realized if all funds had started at the same time and the investor had participated in each fund in proportion to the amount of capital raised by each fund. In addition, for comparability reasons, the cash flows have been converted to U.S. dollars using the historic conversion rate as quoted by XE. 15 This results in a more conservative IRR to investors since funds typically include both time-based vesting and performance hurdle rates which must be exceeded before the searchers vest at least a portion of their equity. Also, most investments in the search phase include downside protection for investors in the form of preferred returns or liquidity preference. 16 Six funds were removed from the sample because the principals had operated the acquisition for less than one year, two were removed due to insufficient data, one due to unresponsiveness, and one due to personnel change resulting in the principal’s exit. The impact of removing these older funds is slightly, but not significantly, beneficial to the overall calculations of returns.
IESE Business School-University of Navarra - 9
enterprise value was straightforward for the 10 terminal funds included; the capital table as of the terminal event (e.g., closure, exit, sale, recapitalization, etc.) was applied. For the remaining six funds that were operating companies at the time of the study, the enterprise value as of December 31, 2015, was based on principals’ estimates of market value.17
While we have made every effort to provide accurate returns, it is important to note that precise information for all cash infusions and distributions over the life of each fund is difficult to obtain, especially for funds with long operating histories and complex capital structures. In addition, given that there have only been seven exits by international search fund entrepreneurs as of December 2015 and two cases of companies failing, it is too early to draw firm conclusions about the financial performance of the international search fund asset class. Readers should keep this in mind when considering the ROI and IRR figures presented in this study.
As an asset class, international search funds have achieved an ROI of 2.8x and an IRR of 33.4%. When excluding unsuccessful searches in order to further examine the much larger acquisition investment, the overall asset class MOIC increases to 2.9x and the effect on overall IRR is negligible. The median fund returned 1.9x of initial search fund investors' capital, whereas the top-performing fund returned 9.2x. Excluding search funds that closed without an acquisition, the median return on all search funds that have completed an acquisition is 3.4x ROI. (See Exhibit 7 and Exhibit 8 for more ROI and IRR information, respectively.)
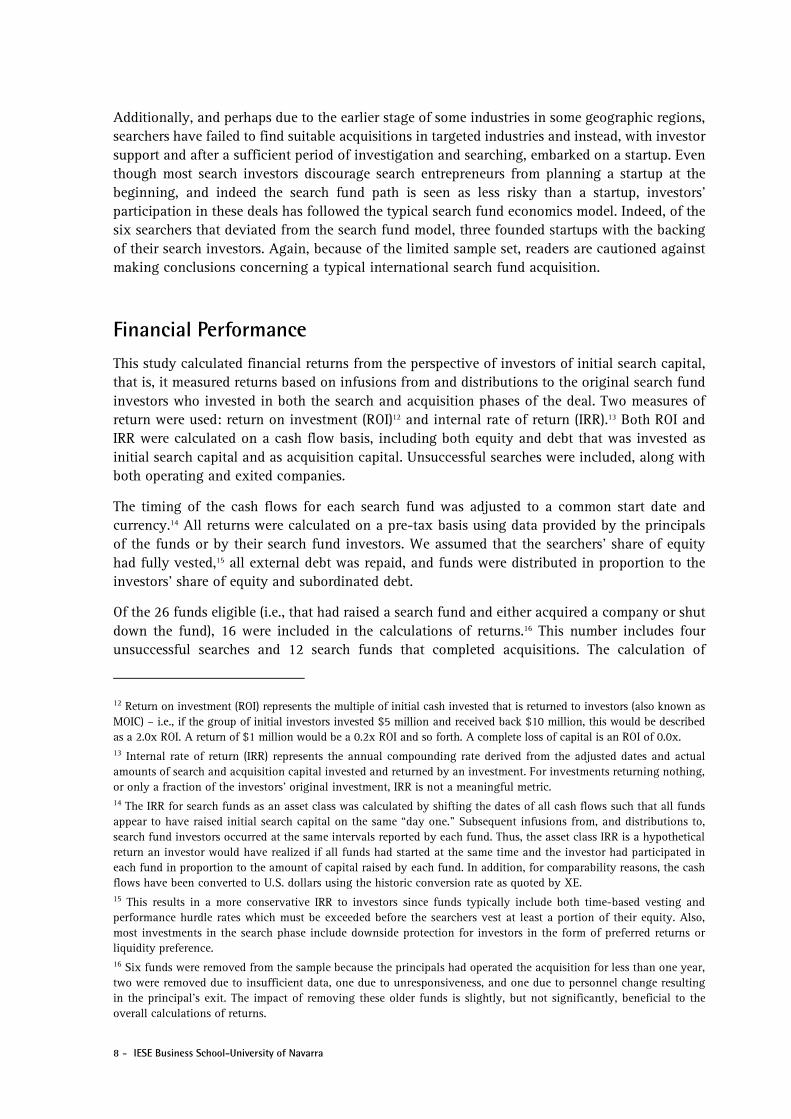
The performance of individual international search funds has varied widely. Figure 5 (below) reflects the percentage of search funds in each phase of the search fund cycle, as well as their return characteristics. (See Exhibit 9 for a distribution of international search funds by ROI and Exhibit 10 for a histogram by IRR.)
Figure 5 Percentage of international search funds in each phase of the search fund life cycle
Source: Prepared by the authors based on IESE search funds surveys.
17 The estimation of enterprise value is an independent estimation of value based on a recent equity transaction, comparable company transaction, or third party valuation.
Raised a
search fund
26 (100%)
No acquisition
4 (15%)
Acquisition
22 (85%)
Gain
12 (55%)
1-2x return
5 (42%)
2-5x return
4 (33%)
5-10x return
3 (25%)
>10x return
0 (0%)
Operating <1 year
6 (27%)
Insufficient data
4 (18%)
10 - IESE Business School-University of Navarra
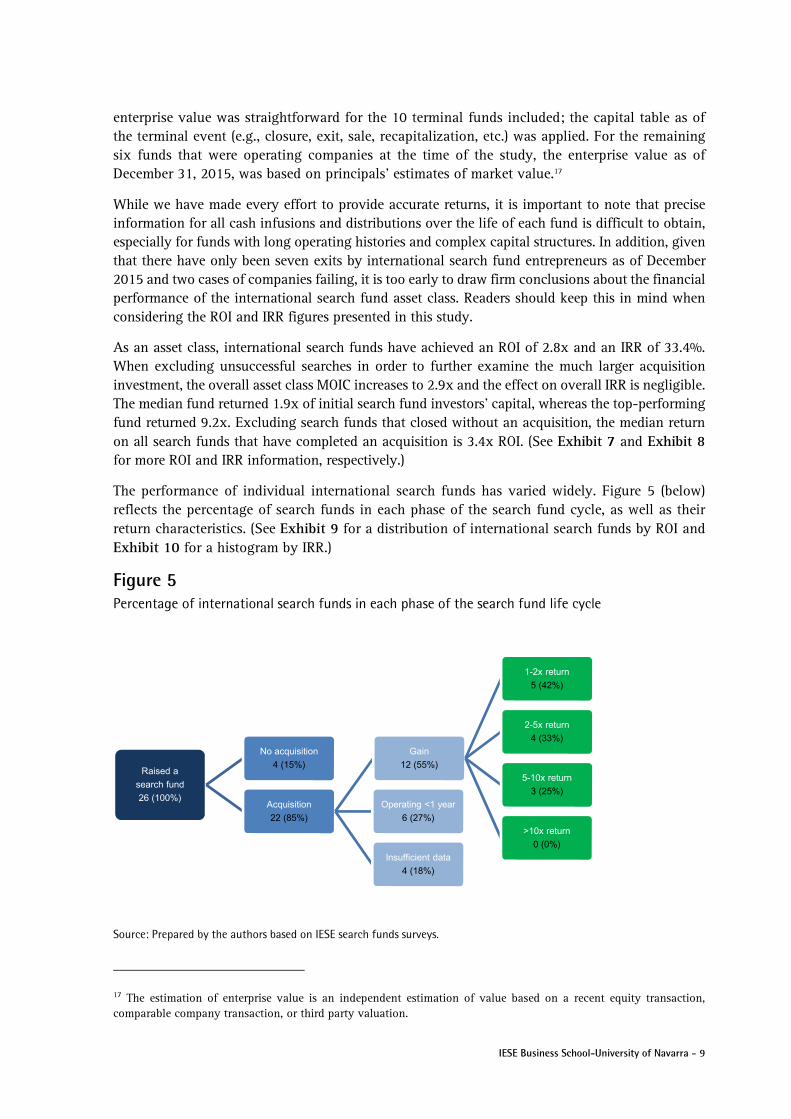
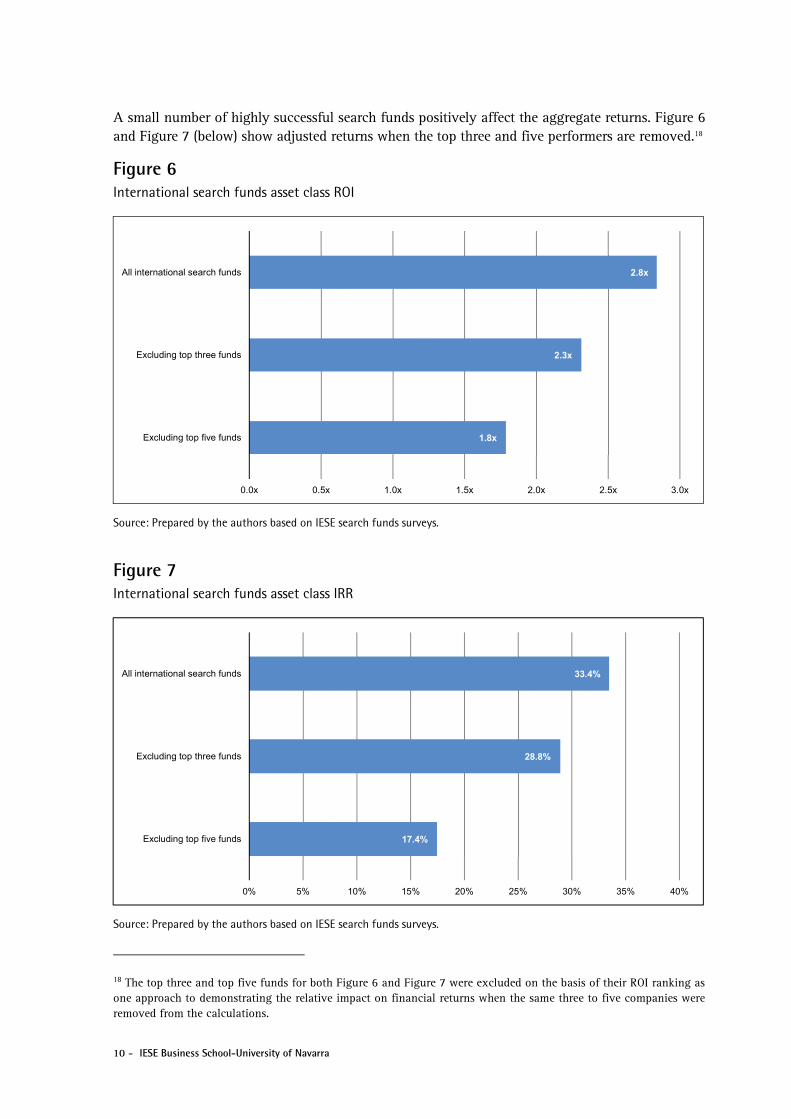
A small number of highly successful search funds positively affect the aggregate returns. Figure 6 and Figure 7 (below) show adjusted returns when the top three and five performers are removed.18
Figure 6 International search funds asset class ROI
Source: Prepared by the authors based on IESE search funds surveys.
Figure 7 International search funds asset class IRR
Source: Prepared by the authors based on IESE search funds surveys.
18 The top three and top five funds for both Figure 6 and Figure 7 were excluded on the basis of their ROI ranking as one approach to demonstrating the relative impact on financial returns when the same three to five companies were removed from the calculations.
1.8x
2.3x
2.8x
0.0x 0.5x 1.0x 1.5x 2.0x 2.5x 3.0x
Excluding top five funds
Excluding top three funds
All international search funds
17.4%
28.8%
33.4%
0% 5% 10% 15% 20% 25% 30% 35% 40%
Excluding top five funds
Excluding top three funds
All international search funds
IESE Business School-University of Navarra - 11
The IRR performance of international search funds seems to match the search fund performance of U.S. and Canadian search funds profiled in the 2016 Stanford GSB note, while ROI is lower due to shorter holding periods. As a reference, the Stanford note reported an aggregate internal rate of return of 36.7% and ROI of 8.4x invested capital. Excluding the top three performers, the note reported an aggregate IRR of 28.8% and an ROI of 3.1x.
Outlook Given the low number of “terminal” international search funds, it is too early to judge the performance of the search fund model outside the United States and Canada. As the number of acquisitions made through the model increases, IESE plans to publish more performance information for the international search fund asset class. Seemingly promising search acquisitions have been made in Germany, Spain, the United Kingdom, Mexico and other countries. Searches have begun in even more countries, including some in Africa. Still, readers are cautioned against making firm conclusions about the model’s outcomes in international arenas from this note alone. As detailed in the Appendix, many searchers were able to successfully export the model internationally, whereas others faced significant difficulty for a variety of reasons. Thus, rather than using this note as a basis of judging the performance of international search funds as an asset class, this note should be used to understand common search fund characteristics outside the United States and Canada.
During the writing of this note, new reports arrived from international search funds raising capital, negotiating to acquire, operating with both negative and positive results, and selling successfully. We look forward to collecting and disseminating the next set of data.
12 - IESE Business School-University of Navarra
Exhibit 1 International Principals’ Background
Pre-2002 2002-2007 2008-2009 2010-2011 2012-2013 2014-2015
Age at Start of Search:
Minimum 29 29 26 26 27 27
Median 31 30 30 32 28 31
Maximum 35 34 43 42 37 41
Under-30 33% 20% 50% 20% 57% 44%
30-35 67% 80% 33% 40% 29% 31%
36-40 0% 0% 0% 20% 14% 19%
Over-40 0% 0% 17% 20% 0% 6%
Number of Post-MBA Years before Search Fund:
Minimum 0 0 0 0 0 0
Median 0 1 0 1 1 0
Maximum 0 5 6 6 6 6
No MBA 0% 0% 0% 20% 29% 13%
<1 year post-MBA 100% 40% 67% 40% 14% 63%
1-3 year post-MBA 0% 40% 17% 20% 43% 0%
4-7 year post-MBA 0% 20% 17% 20% 14% 25%
>8 year post-MBA 0% 0% 0% 0% 0% 0%
Gender:
Male 83% 100% 100% 100% 86% 94%
Female 17% 0% 0% 0% 14% 6%
Source: Prepared by the authors based on IESE search funds surveys.
Exhibit 2 International Principals’ Professional Background*
Professional Background Pre-2002 2002-2007 2008-2009 2010-2011 2012-2013 2014-2015
Management Consulting 17% 0% 0% 20% 43% 25%
Investment Banking/Finance 0% 60% 50% 40% 43% 19%
Sales 17% 0% 0% 20% 0% 13%
Venture Capital 0% 0% 0% 0% 0% 0%
Line/General Management 50% 0% 17% 20% 0% 6%
Marketing 0% 20% 0% 0% 0% 0%
Law 0% 0% 0% 0% 0% 0%
Operations 0% 20% 0% 0% 0% 0%
Entrepreneur 0% 0% 0% 0% 0% 0%
Accounting 17% 0% 0% 0% 0% 0%
Engineering 0% 0% 0% 0% 0% 0%
Military 0% 0% 0% 0% 0% 0%
Insurance 0% 0% 0% 0% 0% 0%
Private Equity 0% 0% 33% 0% 14% 31%
Other 0% 0% 0% 0% 0% 0%
* As a means of comparison, the IESE student profile comprises the following professional backgrounds: 47% general management/industry, 24% consulting, 22% finance, 4% entrepreneurship and 3% public services/NGOs.
Source: Prepared by the authors based on IESE search funds surveys.
IESE Business School-University of Navarra - 13
Exhibit 3 International Search Fund Metrics
Pre-2002 2002-2007 2008-2009 2010-2011 2012-2013 2014-2015
Number of Principals:
Single 100% 60% 33% 80% 29% 63%
Partners 0% 40% 67% 20% 71% 38%
Amount of Initial Capital Raised:
Minimum $192,661 $15,000 $50,000 $225,000 $250,000 $200,000
Median $229,953 $170,000 $525,000 $314,850 $587,777 $426,486
Maximum $283,000 $200,000 $673,198 $485,043 $651,473 $800,000
Amount of Initial Capital Raised per Principal:
Minimum $192,661 $15,000 $50,000 $112,500 $125,000 $100,000
Median $229,953 $85,000 $262,500 $314,850 $324,753 $383,395
Maximum $283,000 $190,000 $462,557 $485,043 $375,000 $696,832
Number of Search Fund Investors:
Minimum 8 2 3 10 6 4
Median 10 7 16 13 15 15
Maximum 11 9 20 16 24 25
Number of Months Fundraising:
Minimum 2 1 2 3 3 2
Median 5 2 6 9 4 5
Maximum 7 6 7 13 15 12
Targeted Industries by Frequency*:
Service (including retail and B2B) 33% 40% 83% 80% 86% 69%
Manufacturing 33% 20% 0% 20% 57% 13%
Manufacturing/Service 33% 20% 0% 40% 71% 25%
Distribution 17% 0% 33% 20% 57% 38%
Media 0% 0% 17% 40% 29% 0%
Utilities 17% 0% 0% 20% 29% 0%
Internet or IT/Technology** 17% 0% 50% 60% 43% 50%
Education 0% 0% 50% 60% 71% 44%
Healthcare 17% 0% 67% 60% 86% 75%
No Preference 0% 40% 17% 20% 14% 25%
Other 17% 20% 17% 0% 0% 2%
Subcategories Considered by Searchers Targeting Technology Companies in 2014-2015 (n=16):
Technology - Software 25%
Technology - Internet 13%
Technology - Hardware 13%
Technology - Ecommerce 0%
* Principals were asked to choose all industries they targeted, rather than choosing only one. The above data represent the frequency of each response across all search funds surveyed for this study in given years.
** The “Internet or IT” category was redefined as “Technology” in the 2016 study and broken into sub-categories.
Source: Prepared by the authors based on IESE search funds surveys.
14 - IESE Business School-University of Navarra
Exhibit 4 Median Statistics for International Search Fund Acquisitions
Medians All Acquisitions Pre-2010 2010-2011 2012-2013 2014-2015
Length of Search (months) 16 8 22 29 22
Purchase Price $5.8 M $4.0 M $7.1 M $5.9 M $13.1 M
Company Revenues at Purchase $8.0 M $8.0 M $7.2 M $7.9 M $11.8 M
Company EBITDA at Purchase $1.5 M $0.6 M $1.5 M $1.3 M $2.7 M
EBITDA Margin 19% 11% 23% 9% 20%
EBITDA Growth Rate at Purchase 5% 700% 6% 0% 5%
Purchase Price / EBITDA 5.2x 3.0x 5.1x 6.4x 5.2x
Purchase Price / Sales 0.9x 0.6x 1.2x 0.8x 1.3x
Company Employees at Purchase 71 70 141 33 68
Source: Prepared by the authors based on IESE search funds surveys.
Exhibit 5 Selected Statistics for All International Search Fund Acquisitions
Total Number of Months From Start of Search to Deal Close All Acquisitions
Minimum 1
Median 16
Maximum 42
<11 months 36%
11-20 months 23%
21-30 months 23%
31+ months 18%
Purchase Price Statistics All Acquisitions
Minimum $0.8 M
Median $5.8 M
Maximum $22.2 M
<$4 M 15%
<$4 M to $8 M 45%
<$8 M to $12 M 10%
<$12 M 30%
Additional Statistics for All Search Fund Acquisitions Minimum Median Maximum
Company Revenues at Purchase $1.0 M $8.0 M $21.2 M
Company EBITDA at Purchase $0.0 M $1.5 M $4.0 M
Company EBITDA Margin at Purchase 0% 19% 60%
Purchase Price / EBITDA NM 5.2x 20.0x%
Purchase Price / Revenue 0.2x 0.9x 4.5x%
EBITDA Growth Rate at Purchase -30% 5% 35%
Company Employees at Purchase 12 7 400
Source: Prepared by the authors based on IESE search funds surveys.
IESE Business School-University of Navarra - 15
Exhibit 6 Searchers’ Perceptions of Board Members’ Performance
Source: Prepared by the authors based on IESE search funds surveys.
34%
21% 21%
10% 10%
4%
7.47.6
7.4
9.1
6.6
8.7
0.0
1.0
2.0
3.0
4.0
5.0
6.0
7.0
8.0
9.0
10.0
0%
10%
20%
30%
40%
50%
60%
70%
Search fundinvestor
Operator inrelated industry
Other investor Operator inunrelated industry
Seller Other
Sco
re (
1-10
, w
ith
10
bei
ng
hig
hes
t)
% o
f T
ota
l
% of Total Average Score
16 - IESE Business School-University of Navarra
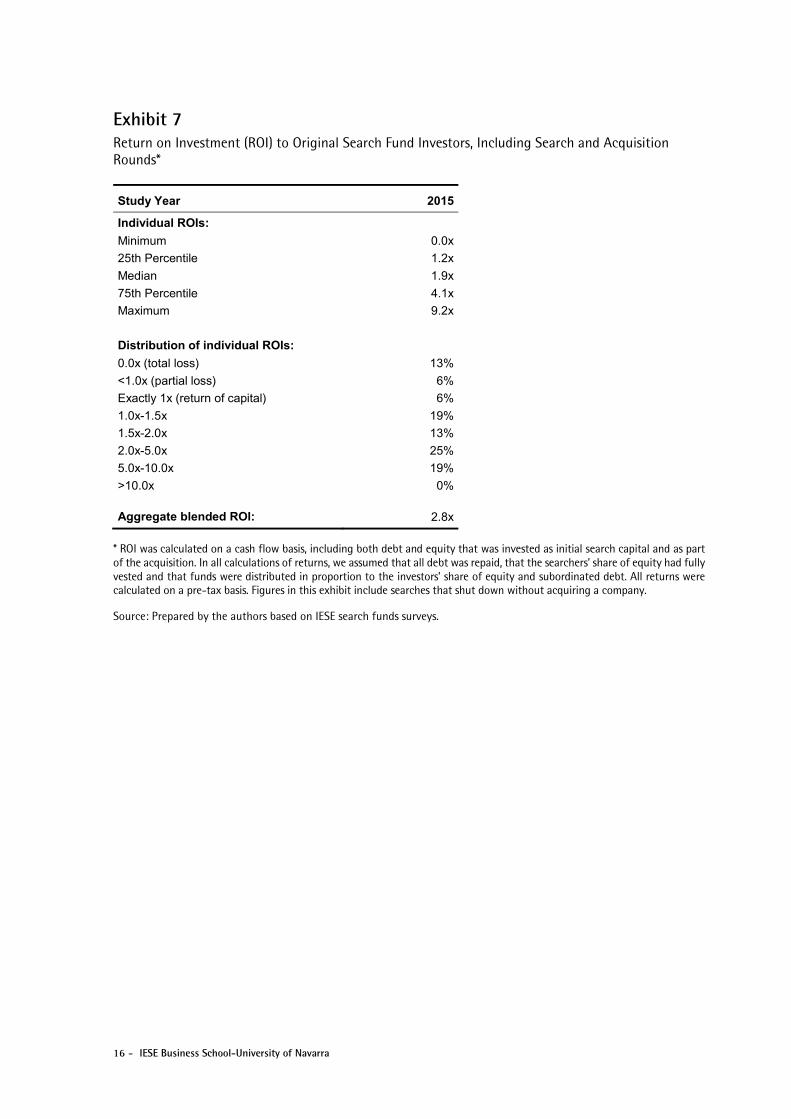
Exhibit 7 Return on Investment (ROI) to Original Search Fund Investors, Including Search and Acquisition Rounds*
Study Year 2015
Individual ROIs:
Minimum 0.0x
25th Percentile 1.2x
Median 1.9x
75th Percentile 4.1x
Maximum 9.2x
Distribution of individual ROIs:
0.0x (total loss) 13%
<1.0x (partial loss) 6%
Exactly 1x (return of capital) 6%
1.0x-1.5x 19%
1.5x-2.0x 13%
2.0x-5.0x 25%
5.0x-10.0x 19%
>10.0x 0%
Aggregate blended ROI: 2.8x
* ROI was calculated on a cash flow basis, including both debt and equity that was invested as initial search capital and as part of the acquisition. In all calculations of returns, we assumed that all debt was repaid, that the searchers’ share of equity had fully vested and that funds were distributed in proportion to the investors’ share of equity and subordinated debt. All returns were calculated on a pre-tax basis. Figures in this exhibit include searches that shut down without acquiring a company.
Source: Prepared by the authors based on IESE search funds surveys.
IESE Business School-University of Navarra - 17
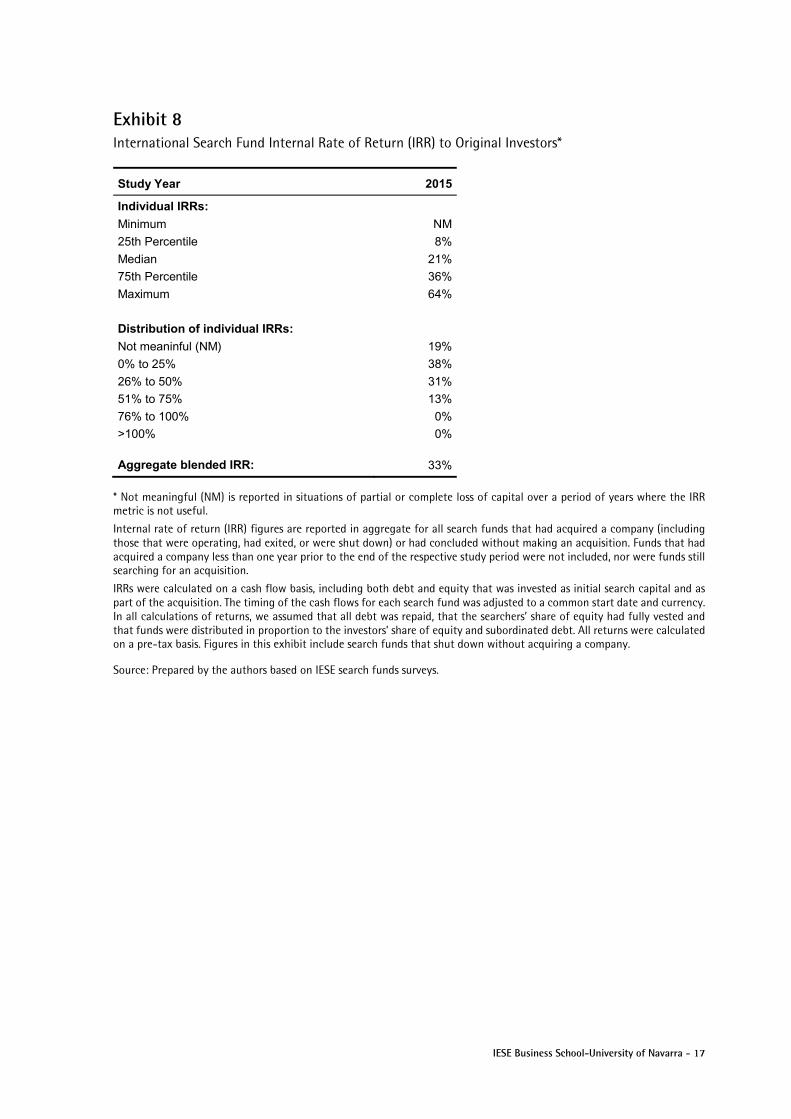
Exhibit 8 International Search Fund Internal Rate of Return (IRR) to Original Investors*
Study Year 2015
Individual IRRs:
Minimum NM
25th Percentile 8%
Median 21%
75th Percentile 36%
Maximum 64%
Distribution of individual IRRs:
Not meaninful (NM) 19%
0% to 25% 38%
26% to 50% 31%
51% to 75% 13%
76% to 100% 0%
>100% 0%
Aggregate blended IRR: 33%
* Not meaningful (NM) is reported in situations of partial or complete loss of capital over a period of years where the IRR metric is not useful.
Internal rate of return (IRR) figures are reported in aggregate for all search funds that had acquired a company (including those that were operating, had exited, or were shut down) or had concluded without making an acquisition. Funds that had acquired a company less than one year prior to the end of the respective study period were not included, nor were funds still searching for an acquisition.
IRRs were calculated on a cash flow basis, including both debt and equity that was invested as initial search capital and as part of the acquisition. The timing of the cash flows for each search fund was adjusted to a common start date and currency. In all calculations of returns, we assumed that all debt was repaid, that the searchers’ share of equity had fully vested and that funds were distributed in proportion to the investors’ share of equity and subordinated debt. All returns were calculated on a pre-tax basis. Figures in this exhibit include search funds that shut down without acquiring a company.
Source: Prepared by the authors based on IESE search funds surveys.
18 - IESE Business School-University of Navarra
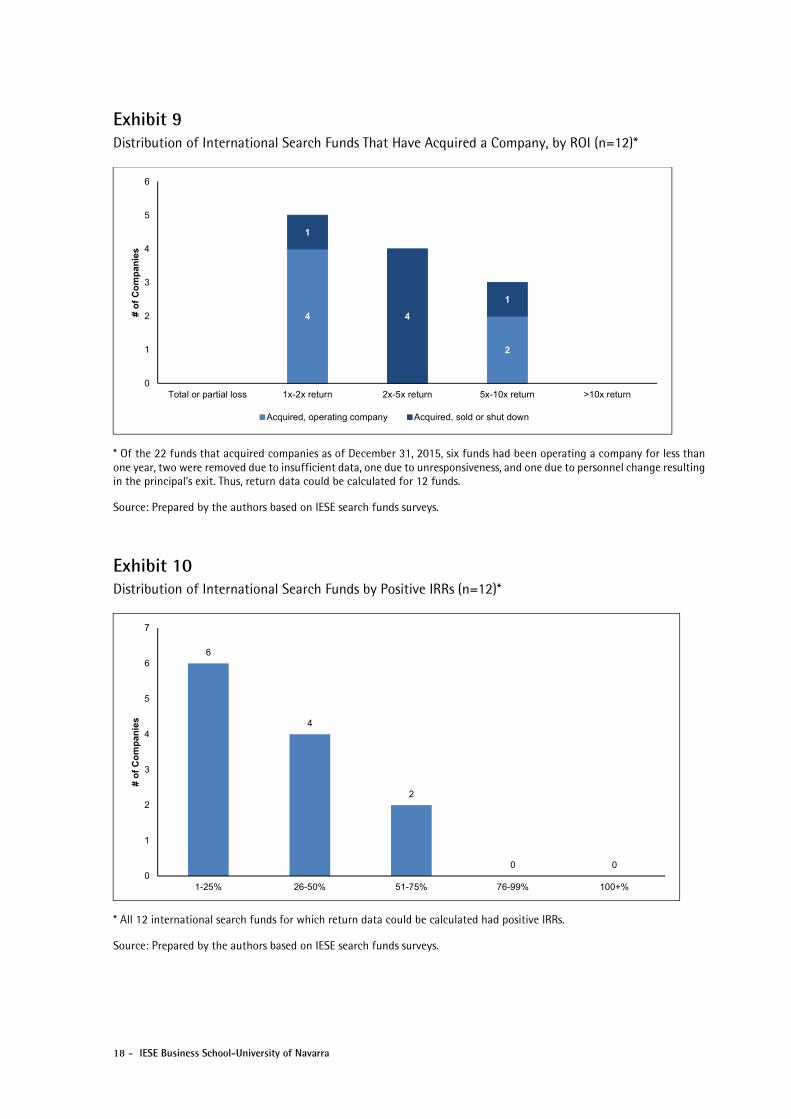
Exhibit 9 Distribution of International Search Funds That Have Acquired a Company, by ROI (n=12)*
* Of the 22 funds that acquired companies as of December 31, 2015, six funds had been operating a company for less than one year, two were removed due to insufficient data, one due to unresponsiveness, and one due to personnel change resulting in the principal’s exit. Thus, return data could be calculated for 12 funds.
Source: Prepared by the authors based on IESE search funds surveys.
Exhibit 10 Distribution of International Search Funds by Positive IRRs (n=12)*
* All 12 international search funds for which return data could be calculated had positive IRRs.
Source: Prepared by the authors based on IESE search funds surveys.
4
2
1
4
1
0
1
2
3
4
5
6
Total or partial loss 1x-2x return 2x-5x return 5x-10x return >10x return
# o
f C
om
pan
ies
Acquired, operating company Acquired, sold or shut down
6
4
2
0 00
1
2
3
4
5
6
7
1-25% 26-50% 51-75% 76-99% 100+%
# o
f C
om
pan
ies
IESE Business School-University of Navarra - 19
Appendix Qualitative Observations
This appendix is meant to provide a deeper perspective on the experiences and obstacles faced by international searchers. It is organized into four stages and attempts to focus on instances in which international searchers’ experiences deviated from those in the United States and Canada.
The qualitative observations presented are based on interviews with more than 40 current and past international search fund entrepreneurs and investors based in Europe, the United States and Canada, Latin America, Africa and Asia. Because the experiences presented were those faced by individual search funds, readers are cautioned against drawing definitive conclusions from them.
Stage 1: Raising a Search Fund
Many international searchers reported that the initial fundraising process was the most challenging stage. As noted earlier, the median time given to raise funds was five months, longer than the three months noted in the Stanford GSB study for U.S. and Canadian search funds. With more than 25 years of search fund activity in the United States and Canada, hopeful searchers have access to serial search fund investors, including small search-focused funds, as well as a roster of successful search fund entrepreneurs and investors currently re-investing in the model. With only a handful of acquisitions completed internationally so far, a prospective international searcher has to access this resource from a distance, if at all.
In most instances, the prospective international searcher faces the task of educating many potential investors about search funds – how they work and why they can be attractive. One such searcher raising the first search fund in Spain described taking more than 11 months to raise the capital even though he had a top-tier U.S. MBA and had interned at a search fund in the United States. U.S. investors were not familiar with investing in his country of origin and in total the searcher reported having to hold more than 100 meetings with local and international investors. In many cases, prospective investors wanted to know why search capital was needed (e.g., “come back to me when you have a deal”) or how the search model differed from traditional private equity. This scenario was common among international searchers who described having to spend much more time “selling the model” than “selling themselves.” Having committed investors familiar with both U.S. and target-country searchers seemed to help the process significantly.
Additionally, a handful of searchers reported that it became apparent that their local investors did not fully understand the search concept. In India, one searcher decided to shut down his fund in part due to his conclusion that his local investors were only seeking venture-capital type growth and returns, which differ from those of typical search funds, and were unlikely to provide the necessary acquisition capital. This highlights the importance of ensuring that investors who are unfamiliar with the model clearly understand the likely risks, returns, opportunities and functioning of prior search funds.
More recently, as the number of international search funds increases in certain countries, groups of investors with a specific focus on search funds have been formed in Germany, Spain and the United Kingdom, among others, making it easier for searchers to raise search capital from local investors.
20 - IESE Business School-University of Navarra
Appendix (Continued)
There were exceptions and a few international searchers reported that raising the search fund was relatively easy. The majority of searchers in Latin America reported a quick fundraising process, perhaps due to strong family connections, to local U.S. business school alumni aware of the concept or to the fact that serial U.S. search fund investors were more comfortable investing in a closer geography. In Israel, one searcher realized that it would be incredibly difficult to find investors from his home country and as a result purposefully raised a relatively modest amount of search capital, soliciting units from a handful of investors; the same happened in Brazil. A Kenyan searcher reported that she had learned about the search fund model more than three years before beginning business school and as a result had been pitching the concept to local investors well before beginning to fundraise. Another searcher in India said that because his country had become a hotspot for private equity activity, he was able to secure more than half of his commitments from U.S. investors (most of whom had previous experience investing in the asset class).
From the investors’ perspective, many U.S.-based serial search fund investors said that they relied on the knowledge of local investors before making a commitment since it was likely to be their first investment in that country (or region). Interestingly, this has also been the case among local investors. One European investor who committed to a domestic search fund reported that he made the investment primarily because of the quality of serial search fund investors that invested – the search fund model and the entrepreneur were secondary considerations.
After raising the search fund, many searchers expressed frustration at the lack of an appropriate legal entity. U.S. searchers most commonly form a limited liability corporation (LLC) since its flexibility allows for various outcomes including the conversion of search capital into different kinds of equity. However, the LLC vehicle does not typically exist outside the United States and Canada. Many searchers reported forming an LLC in the United States in order to attract U.S. investors, and Latin American searchers did the same since many of their local investors were already familiar with the LLC structure. However, European searchers have had to be creative, with one fund selling their units as pieces of convertible debt. One Spanish searcher set up a U.K. company for the search fund because (a) the structure had already been created in the United Kingdom for prior search funds and (b) the searcher had commitments from several U.K. investors as well as U.S. investors who had invested in those prior U.K. search funds. The organization costs have also been significantly higher, with many funds reporting initial legal costs above €20,000. Many U.S. and Canadian lawyers will delay payment of organization costs, whereas most European lawyers require upfront payment so far.
As these anecdotes demonstrate, the initial hurdles of raising search capital and forming the search entity are surmountable, but international searchers face unique challenges that may contribute to the formation of fewer international search funds, even with a 20-year history outside the United States and Canada.
IESE Business School-University of Navarra - 21
Appendix (Continued)
Stage 2: Search and Acquisition
During the search phase, the most limiting factor that international searchers face may be the size of the economy in which they search. In Germany, one searcher mentioned that even though his country is home to Europe’s largest economy, there are less than one-third as many small and medium-sized businesses as in the United States. This is a common complaint of European searchers and many have resorted to regional and even pan-European searches (citizenship in an EU state provides residency). This is done especially when a searcher can speak multiple European languages (one U.K. searcher has looked for companies in Spain, Italy, Austria and Germany) and even more common among countries that share a mother tongue (an Austrian search also covered Belgium, Germany and Switzerland). In Africa, one searcher reported that she is based in Uganda and is searching across East Africa (primarily Kenya) to increase the chances of buying a high-quality company. The number of completed searches in Mexico, an economy far smaller than that of the United States, may indicate that the right economic circumstances are not a serious barrier to a successful search.
Searchers reported a common, initial approach to searching for acquisition targets: mass emailing, cold calling and letter writing, as is done in the United States. However, many international searchers learned that sometimes these methods did not work unless modified for the local context. In Spain, a searcher stated that owners’ email addresses are not normally public and mass emailing was therefore not viable. In Germany, cold calling was seen as being too direct, while letter writing was seen as the most appropriate form of communication. In Brazil, where personal ties are paramount, cold calling and letter writing simply did not work; the use of a personal and professional network generated most of a searcher’s successful leads.
In addition, the same education about search funds required of investors was also needed for owners. One searcher in Asia reported that he was unable to convince sellers that his search investors would also provide sufficient acquisition capital, so he decided to market himself as a “private equity fund,” while German searchers avoided that term and its pejorative connotations in Germany.19 Indeed, there is often no translation for “search fund” in the local language and entrepreneurs can find themselves inventing descriptions – “business partnership” (Unternehmer-Partnerschaft) in Germany; “investment society” (sociedad de inversión) in Spain; “succession entrepreneur” (Nachfolge-Unternehmer) in Switzerland.
One of the attractive features of the search fund model is a roster of accomplished investors and entrepreneurs that add credibility to a searcher’s efforts. Many international searchers said that although they received capital from some of the most respected serial investors in the United States, the local connections mattered more. One searcher in India reported that he relied almost exclusively on the strength of the reputations of his local investors to find deals, and one search team in Mexico stated that they did not accept U.S. investors because they believed that only local names would help the search process.
19 The search fund entrepreneurs specifically requested that their countries of origin remain anonymous.
22 - IESE Business School-University of Navarra
Appendix (Continued)
Furthermore, unlike their U.S. counterparts many international searchers reported that they used publicly available business registries to screen potential acquisition targets, particularly for companies registered in Belgium, Austria, Germany, Italy, Spain and the United Kingdom. This made the screening process much more efficient since searchers could quickly find attractive companies in industries of interest rather than having to invest time “pre-screening” businesses before contacting them. U.K. searchers could also see the names and ages of all directors, which revealed issues with succession. However, it is generally understood that companies often do not report full revenues and profits, which clouds the accuracy of public records.
Many international searchers found cultural sensitivities particular to their country of origin. In the United Kingdom, business owners wanted to know how a searcher would create value. In Germany, Spain and Austria, where most businesses are family-owned, the prospect of ending a family’s control over a multigenerational company was quite sensitive; thus, in many cases final negotiations centered on both price and on whether a searcher was the right “fit” for a company. In India, it was almost shameful for a family to sell their multigenerational enterprise. Generally speaking, in the few cases when families do decide to sell their company, it is still hard to replace not only the owner but also other family members that have key roles.
U.S. search funds have traditionally relied on bank debt to help finance an acquisition, at times around 50%. However, this has sometimes been impossible in other countries. In India, where banks are not allowed to lend for acquiring company shares, searchers report that the only available options are nontraditional financing, such as asset-backed or working capital loans that carry high interest rates and short payback periods. In the United Kingdom, because of local market conditions and the quality of the deal, one search fund entrepreneur was able to convince his investors to invest in both debt and equity to finance the deal. In Mexico and Brazil, because the leveraged buyout model is not as established, searchers reported using a relatively modest amount of debt (e.g., 20% of enterprise value). Another common form of search fund acquisition capital in the United States and Canada is seller financing. While searchers have been able to negotiate seller financing in the United Kingdom and Germany, searchers in India, Spain, Mexico and Kenya have reported that seller financing is not traditionally used.
Unlike U.S. search funds, European search funds are often formed as corporate entities that, by regulation, have a Board of Directors. As a result, European searchers often meet regularly with their Board members (typically three or more investors), which strengthens the relationship between a searcher and those investors and provides a model for post-acquisition mentorship. Additionally, this gives the searcher frequent feedback on deals but may lead the entrepreneur to under-rely on input from the other investors.
IESE Business School-University of Navarra - 23
Appendix (Continued)
Finally, because international search funds often have investors in far-off countries, entrepreneurs have had to be especially cognizant of maintaining positive investor relationships. In India, a searcher closed his fund early without an acquisition after concluding that it was too difficult to get sufficient attention from both U.S. and Indian investors. Using modern technology, some searchers have found creative ways to keep foreign investors involved. In Germany, two searchers reported regular videoconferences with their backers and in Spain a searcher dialed-in foreign investors during meetings with potential sellers.
Stage 3: Operation
Search fund entrepreneurs have bought companies in Mexico, Brazil, Chile, the United Kingdom and Germany and have experienced operating conditions similar to those of U.S. and Canadian search funds. Many past and current search fund operators described the role as a combination of a salaried CEO and a significant equity owner. Similar to a salaried CEO, search fund operators have to receive approval from a Board of Directors to make major financial or strategic decisions (including that of executive compensation). However, unlike a purely salaried CEO, search fund owner-operators are more highly motivated to make the business succeed. In Chile, a current CEO said fatigue is common, given the lengthy time of the project (fundraise, search and then operate); his business partner decided that the eventual payoff was too uncertain and left the company in pursuit of investment banking.
Searchers also reported that the search fund model allows operators to benefit from the experience of their investors. In Mexico, a current CEO stated that having external investors forces him to be more disciplined and also gives him the freedom to make more rational decisions. In the United Kingdom, a former CEO said that having the backing of very experienced entrepreneurs helped him successfully manage his company through multiple recessions, eventually leading to the successful sale of the company. In Germany, a current CEO realized that he did not have direct industry experience and the company’s founder agreed to stay on as a minority shareholder and a member of the executive team in order to ensure a smooth transition.
Lack of operating and management experience is common among search fund entrepreneurs of all continents and their investors report that there is no ideal preparation for the CEO’s chair. This lack of experience is a risk and while it has contributed to failures it has not prevented significant successes.
24 - IESE Business School-University of Navarra
Appendix (Continued)
Stage 4: Exit
With only seven known exits by international search fund entrepreneurs – three in the United Kingdom, two in Mexico, one in Brazil and one in Chile – comparisons about this stage are particularly hard to make. Two investments, both in Europe, resulted in the company entering receivership.
For one exit in the United Kingdom, the searcher reported that one contributing factor to his success was that two of his investors sat on the Board of his search fund as well as the Board of the company that he eventually acquired. From a mentoring and advice perspective, this was very helpful especially while managing the company through difficult periods. As mentioned, this is a departure from the U.S. model since the search phase there is often structured without a formal Board and investor oversight is less formal. Regardless of how it is achieved, meaningful mentorship from investors who are wise and experienced businesspeople appears to be central to a search fund’s operating success.
For the exit in Brazil, two unusual qualities stand out. The holding period was brief (less than one year) as the entrepreneur repositioned the company to take advantage of fast industry growth and a booming equity market. Furthermore, two of his investors with a combined 50 years’ experience in executive positions at multinational consumer goods companies in turn joined the acquired company’s management team. The searcher in this case reports that the successful exit would not have been possible without the active operating role of his investors and Brazil’s rapidly growing economy. It has been rare for search funds to use public markets to achieve liquidity, although several in the United States have had the scale to do so and one has actually gone public (ServiceSource; NASDAQ: SREV).
Some of the significant successes in U.S. search funds have had long holding periods, over 10 years at times (e.g., Asurion, ServiceSource, Alta Colleges, MedMart). Some international searchers report pressure for short holding periods from their domestic investors who prefer “flipping” companies and redeploying the returns in new high-return opportunities. This and other possible differences with U.S. search investor practices will affect each stage of international search funds and further data will shed light on the impact of these trends on the next generation of international search entrepreneurs.