international statistical facts and trends in highjump
TRANSCRIPT

1
International statistical facts and
trends in highjump
7th Pole Vault & Highjump Conference
Cologne 11-13.11.2016 Jan-Gerrit Keil
National Coach Germany Highjump Women U18/20

2
Agenda
• Development trends Olympic Games • Gender Gap in highjump • Best highjump nations worldwide

3
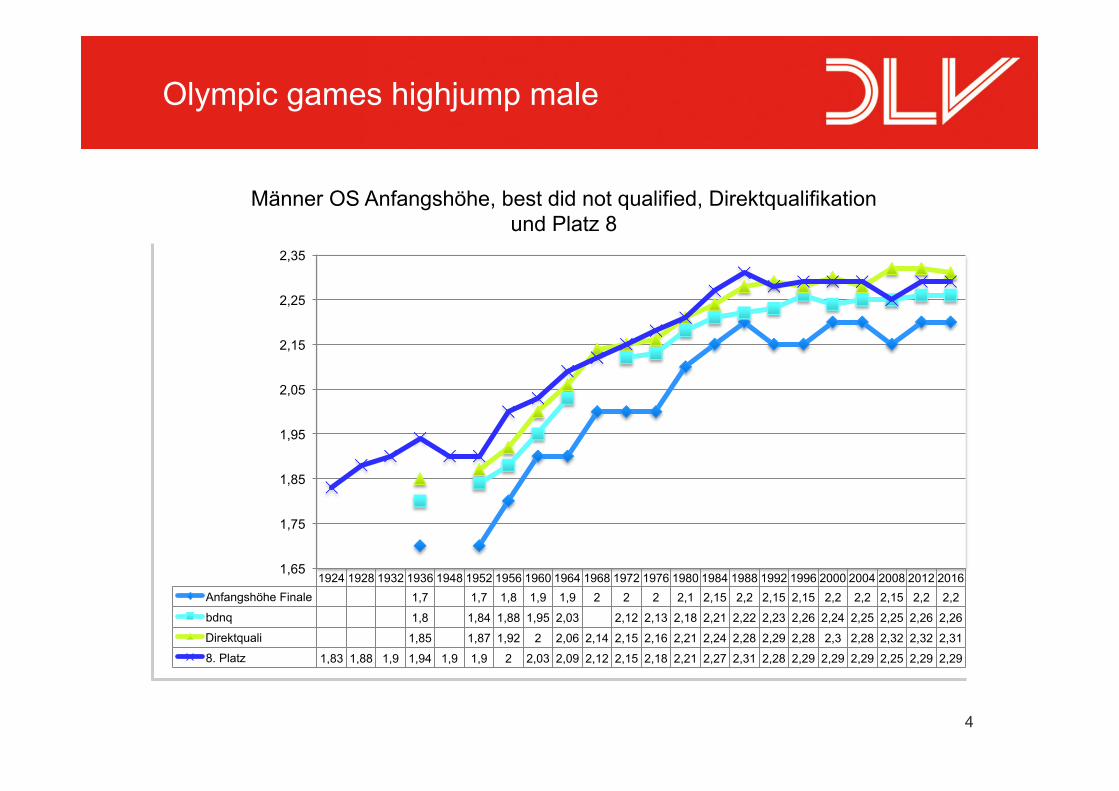
Olympic games highjump male
1924 1928 1932 1936 1948 1952 1956 1960 1964 1968 1972 1976 1980 1984 1988 1992 1996 2000 2004 2008 2012 2016 Gold 1,98 1,94 1,97 2,03 1,98 2,04 2,12 2,16 2,18 2,24 2,23 2,25 2,36 2,35 2,38 2,34 2,39 2,35 2,36 2,36 2,38 2,38 Silber 1,95 1,91 1,97 2 1,95 2,01 2,1 2,16 2,18 2,22 2,21 2,23 2,31 2,33 2,36 2,34 2,37 2,32 2,34 2,34 2,33 2,36 Bronze 1,92 1,91 1,97 2 1,95 1,98 2,08 2,14 2,16 2,2 2,21 2,21 2,31 2,31 2,36 2,34 2,35 2,32 2,34 2,34 2,29 2,33 8. Platz 1,83 1,88 1,9 1,94 1,9 1,9 2 2,03 2,09 2,12 2,15 2,18 2,21 2,27 2,31 2,28 2,29 2,29 2,29 2,25 2,29 2,29
1,8
1,9
2
2,1
2,2
2,3
2,4
Hochsprung Männer OS Finalleistungen ab 1924 Gold Silber Bronze 8. Platz
4
Olympic games highjump male
1924 1928 1932 1936 1948 1952 1956 1960 1964 1968 1972 1976 1980 1984 1988 1992 1996 2000 2004 2008 2012 2016 Anfangshöhe Finale 1,7 1,7 1,8 1,9 1,9 2 2 2 2,1 2,15 2,2 2,15 2,15 2,2 2,2 2,15 2,2 2,2
bdnq 1,8 1,84 1,88 1,95 2,03 2,12 2,13 2,18 2,21 2,22 2,23 2,26 2,24 2,25 2,25 2,26 2,26
Direktquali 1,85 1,87 1,92 2 2,06 2,14 2,15 2,16 2,21 2,24 2,28 2,29 2,28 2,3 2,28 2,32 2,32 2,31
8. Platz 1,83 1,88 1,9 1,94 1,9 1,9 2 2,03 2,09 2,12 2,15 2,18 2,21 2,27 2,31 2,28 2,29 2,29 2,29 2,25 2,29 2,29
1,65
1,75
1,85
1,95
2,05
2,15
2,25
2,35
Männer OS Anfangshöhe, best did not qualified, Direktqualifikation und Platz 8

5
Olympic games highjump male nations & participants
28
43
0
5
10
15
20
25
30
35
40
45
1924 1928 1932 1936 1948 1952 1956 1960 1964 1968 1972 1976 1980 1984 1988 1992 1996 2000 2004 2008 2012 2016
Teilnehmer und Länder OS Männer Hoch Gesamt Länder Teilnehmer Linear (Länder) Linear (Teilnehmer)

6
Olympic games Top 8 finalists highjump male Europe (AM 4,9) vs. Rest of the world (AM 3,6)
5
3 2 3
4 4 3
7 5
4
6 6
8
2
9
4
5 5 5
8
3 4
0%
10%
20%
30%
40%
50%
60%
70%
80%
90%
100%
1924 1928 1932 1936 1948 1952 1956 1960 1964 1968 1972 1976 1980 1984 1988 1992 1996 2000 2004 2008 2012 2016
Finalteilnehmer 1-8 Platz OS Männer Hoch Europa vs. Welt
Finale TN Welt Finale TN Europa

7
Olympic games highjump male antropometric data (average)
Alter 1-3 in Jahren Größe 1-3 in cm Gewicht 1-3 in kg BMI 1-3 Mittelwert 25,81 192,43 77,43 20,90
0
20
40
60
80
100
120
140
160
180
200
Alter, Größe und Gewicht von OS-Medaillengewinnern Männer 1992-2016
8
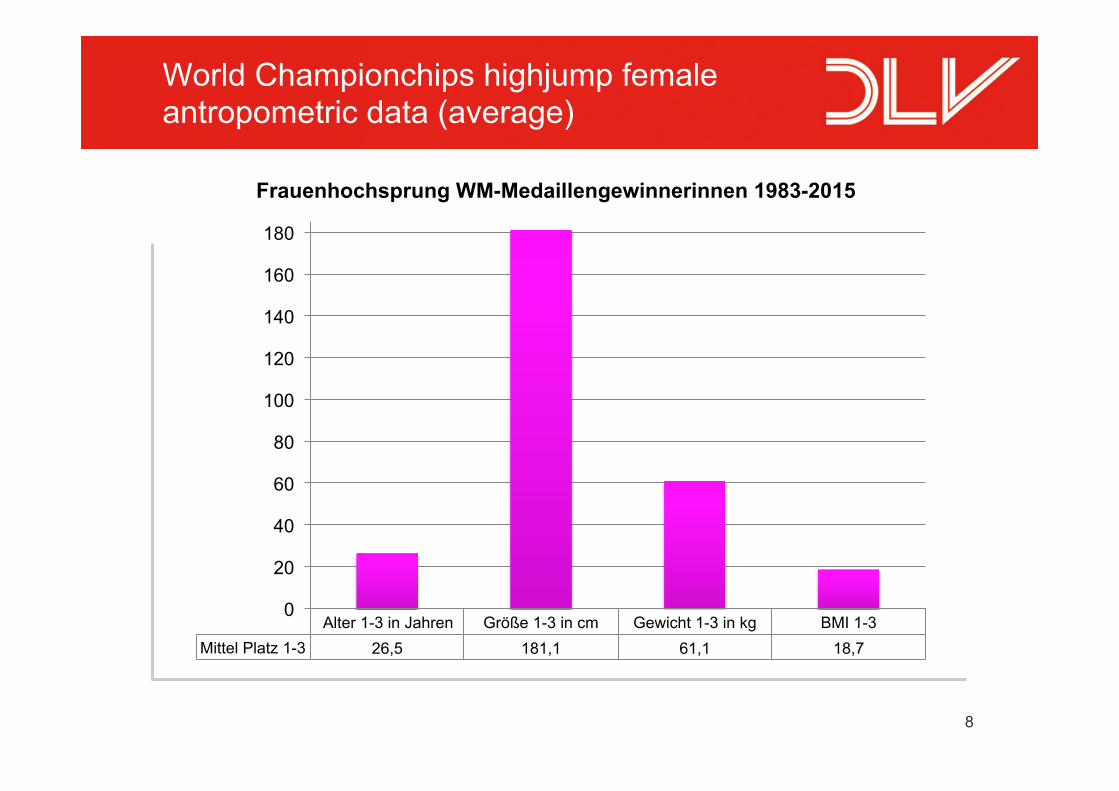
World Championchips highjump female antropometric data (average)
Alter 1-3 in Jahren Größe 1-3 in cm Gewicht 1-3 in kg BMI 1-3 Mittel Platz 1-3 26,5 181,1 61,1 18,7
0
20
40
60
80
100
120
140
160
180
Frauenhochsprung WM-Medaillengewinnerinnen 1983-2015

9
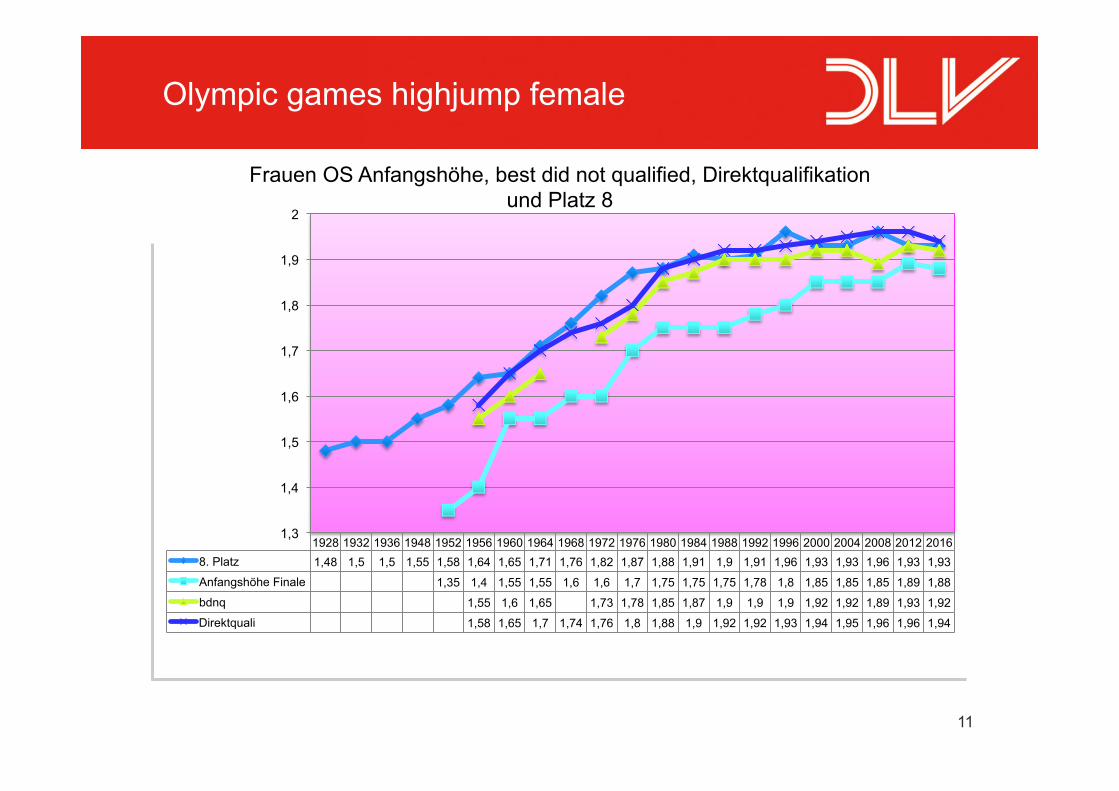
Olympic games highjump female
OS Moskau 1980 OS Rio 2016 Gold medal 1,97 Simeoni/ITA 1,97 Beitia/ESP Bronce medal 1,94 1,97 (+3cm) 8. Place 1,88 1,93 (+5cm) Direct qualification 1,88 1,94 (+6cm) Best did not qualified 1,85 1,92 (+7cm) Starting hight final 1,75 1,88 (+13cm) Increase heights 75-80-85-88-91-94-97-02
8 heights to 2m 88 – 93 – 97 – 00 4 heights to 2m
Participants final 12 17 (clearing 1,94!!!) Competition history 7 of 12 jumped over the
5. height 1,91m 13 athletes cleared only first or second height
Winner 80 o – 85 o – 88 - – 91 o – 94 o – 97 xo – 02 xxx
88 o – 93 o – 97 o – 00 xxx

10
Olympic games highjump female
1928 1932 1936 1948 1952 1956 1960 1964 1968 1972 1976 1980 1984 1988 1992 1996 2000 2004 2008 2012 2016 Gold 1,595 1,65 1,6 1,68 1,67 1,76 1,85 1,9 1,82 1,92 1,93 1,97 2,02 2,03 2,02 2,05 2,01 2,06 2,05 2,05 1,97 Silber 1,56 1,65 1,6 1,68 1,65 1,67 1,71 1,8 1,8 1,88 1,91 1,94 2 2,01 2 2,03 2,01 2,02 2,05 2,03 1,97 Bronze 1,56 1,6 1,6 1,61 1,63 1,67 1,71 1,78 1,8 1,88 1,91 1,94 1,97 1,99 1,97 2,01 1,99 2,02 2,03 2,03 1,97 8. Platz 1,48 1,5 1,5 1,55 1,58 1,64 1,65 1,71 1,76 1,82 1,87 1,88 1,91 1,9 1,91 1,96 1,93 1,93 1,96 1,93 1,93
1,4
1,5
1,6
1,7
1,8
1,9
2
Hochsprung Frauen OS Finalleistungen ab 1928 Gold Silber Bronze 8. Platz
11
Olympic games highjump female
1928 1932 1936 1948 1952 1956 1960 1964 1968 1972 1976 1980 1984 1988 1992 1996 2000 2004 2008 2012 2016 8. Platz 1,48 1,5 1,5 1,55 1,58 1,64 1,65 1,71 1,76 1,82 1,87 1,88 1,91 1,9 1,91 1,96 1,93 1,93 1,96 1,93 1,93
Anfangshöhe Finale 1,35 1,4 1,55 1,55 1,6 1,6 1,7 1,75 1,75 1,75 1,78 1,8 1,85 1,85 1,85 1,89 1,88
bdnq 1,55 1,6 1,65 1,73 1,78 1,85 1,87 1,9 1,9 1,9 1,92 1,92 1,89 1,93 1,92
Direktquali 1,58 1,65 1,7 1,74 1,76 1,8 1,88 1,9 1,92 1,92 1,93 1,94 1,95 1,96 1,96 1,94
1,3
1,4
1,5
1,6
1,7
1,8
1,9
2
Frauen OS Anfangshöhe, best did not qualified, Direktqualifikation und Platz 8

12
Olympic games highjump female nations & participants
27
36
0
5
10
15
20
25
30
35
40
45
1928 1932 1936 1948 1952 1956 1960 1964 1968 1972 1976 1980 1984 1988 1992 1996 2000 2004 2008 2012 2016
Anz
ahl
Teilnehmer und Länder Frauen OS Hoch gesamt Länder Teilnehmer Linear (Länder ) Linear (Teilnehmer)

13
Olympic games Top 8 finalists highjump female Europe (AM 6,0) vs. Rest of the world (AM 2,0)
3 2
8 5
7
5
7
4
8 7 7 7
3
6
4
8
6 6 7
5 6
0%
10%
20%
30%
40%
50%
60%
70%
80%
90%
100%
1928 1932 1936 1948 1952 1956 1960 1964 1968 1972 1976 1980 1984 1988 1992 1996 2000 2004 2008 2012 2016
Finalteilnehmer Frauen OS Europa vs. Welt Finale TN Welt Finale TN Europa

14
Vergleich OS 1980-1996 vs. 2000-2016
Moskau Los Angeles
Seoul Barcelona
Atlanta
Sydney Athen Peking London
Rio
1980-1996 16 years 5 OG
2000-2016 16 years 5 OG

15
2,36
2,27
2,32
2,15
2,22
2,26
2,37
2,28
2,32
2,19
2,25
2,31
2,10
2,15
2,20
2,25
2,30
2,35
2,40
Gold 8. Platz Mittelwert Anfangshöhe Finale bdnq Direktquali
Vergleich OS Hochsprung männlich AM 1980-1996 mit AM 2000-2016
AM 1980-1996 AM 2000-2016
Olympic games highjump male
5cm
4cm

16
Olympic games highjump female
2,02
1,91
1,96
1,77
1,88 1,91
2,03
1,94
1,98
1,86
1,92
1,95
1,7
1,75
1,8
1,85
1,9
1,95
2
2,05
Gold 8. Platz Mittelwert 1-8 Anfangshöhe Finale
bdnq Direktquali
Vergleich OS Hochsprung weiblich AM 1980-1996 mit AM 2000-2016
AM 1980-1996 AM 2000-2016
9cm

17
Male highjump OG 1980 - 1996 OG 2000 - 2016 Gold medal 2,36 2,36 8. place 2,29 2,30 (+0,4%) Direct qualification 2,26 2,31 (+1,9%) Best did not qualified 2,22 2,25 (+1,4%) starting hight in the final 2,15 2,19 (+1,9%)
Vergleich OS 1980-1996 vs. 2000-2016
Female highjump OG 1980 - 1996 OG 2000 - 2016 Gold medal 2,02 2,03 (+0,5%) 8. place 1,91 1,94 (+1,3%) Direct qualification 1,91 1,95 (+2,1%) Best did not qualified 1,88 1,92 (+1,7%) starting hight in the final 1,77 1,86 (+5,5%)

18
Male highjump OS 1980 - 1996 OS 2000 - 2016 Nations 21,6 27 (+25%) Participants 33,4 38,2 (+14,4%) Finalists Europe 5,6 5 Finalists Rest of the World 3,4 3,2
Vergleich OS 1980-1996 vs. 2000-2016
Female highjump OS 1980 - 1996 OS 2000 - 2016 Nations 19 26,8 (+41%) Participants 29,2 35,8 (+22,6%) Finalists Europe 5,6 6 Finalists Rest of the World 2,6 2

19
Summary olympic trends in highjump
• Gleichbleibende Sieghöhen • Gleichbleibend europäische Dominanz (vor
allem weiblich) • Verdichtung des Wettbewerbs
§ Mehr Nationen und mehr Teilnehmer § Schwierigerer Finalzugang (bdnq, Direktquali)
• Unproportionale Steigerung der Einstiegshöhe im Finale (vor allem weiblich)

20
Agenda
• Development trends Olympic Games • Gender Gap in highjump • Best highjump nations worldwide

21
1,65
1,75
1,85
1,95
2,05
2,15
2,25
U16 U18 U20 U23 Mä/Fr
win
ning
hig
hts
in m
eter
Average winning hights highjump at german nationals in different
age groups (2002-2016)
1. place male 1. place female
Gender Gap Highjump

22
1,65
1,75
1,85
1,95
2,05
2,15
2,25
U16 U18 U20 U23 Mä/Fr
high
jum
p hi
ghts
in m
eter
Top 6 average hights highjump at german nationals in different
age groups (2002-2016)
Top 6 average male Top 6 average female
Gender Gap Highjump
23
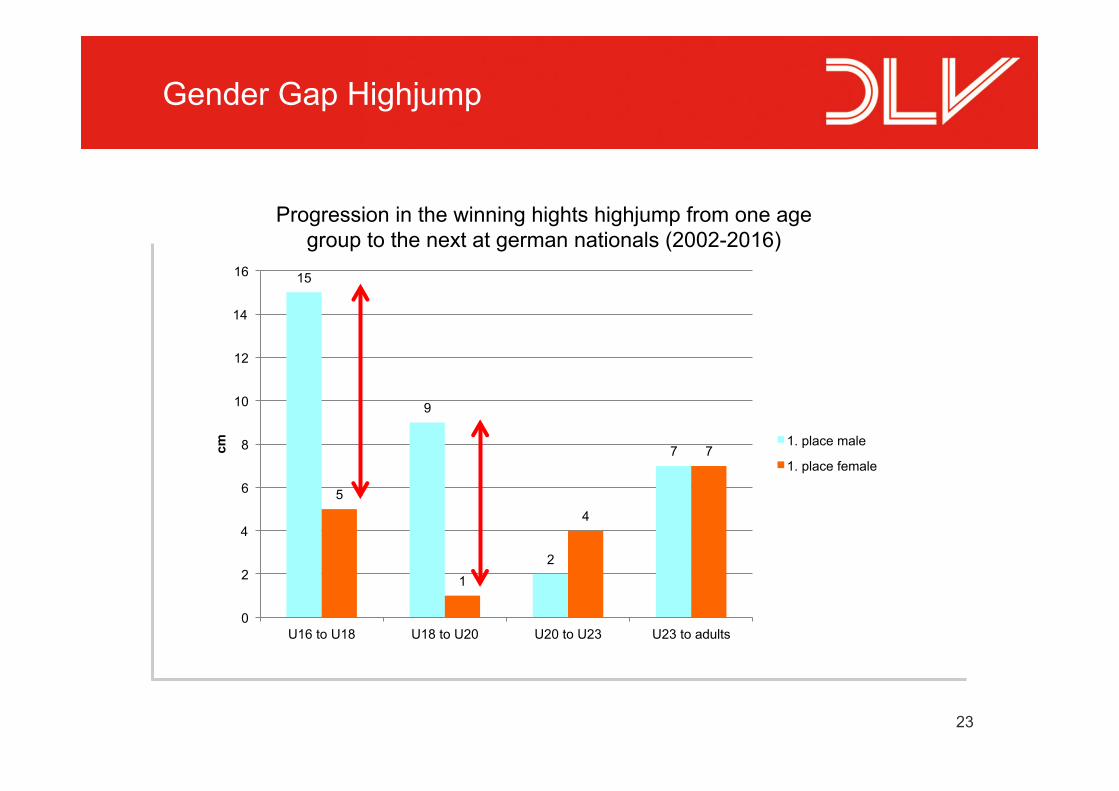
15
9
2
7
5
1
4
7
0
2
4
6
8
10
12
14
16
U16 to U18 U18 to U20 U20 to U23 U23 to adults
cm
Progression in the winning hights highjump from one age group to the next at german nationals (2002-2016)
1. place male
1. place female
Gender Gap Highjump

24
Gender Gap Highjump
13
7
3
9
5
1
2
6
0
2
4
6
8
10
12
14
U16 to U18 U18 to U20 U20 to U23 U23 to adults
Progression in the Top 6 average hights highjump from one age group to the next at german nationals (2002-2016)
Top 6 average male
Top 6 averagen female

25
0,1
0,15
0,2
0,25
0,3
0,35
0,4
U16 U18 U20 U23 Mä/Fr
met
er
Gender gap winning hights highjump at german nationals (2002-2016)
gender gap 1. place
gender gap Top 6 average
Gender Gap Highjump

26
Gender Gap Highjump
1,82
1,88 1,9
1,92 1,94
2 2,03 2,03
1,7
1,76
1,8 1,81 1,84
1,91 1,92 1,93
1,5
1,6
1,7
1,8
1,9
2
2,1
U18 EM ab 2016
U18 WM ab 1999
U20 EM ab 1989
U20 WM ab 1986
U23 EM ab 1997
EM ab 1990 WM ab 1983 OS ab 1988
1. Place & 8. Place average at international Championchips (female)
Platz 1 AM Fr
Platz 8 AM Fr
4cm 11cm

27
Gender Gap Highjump
2,18 2,19
2,23
2,27 2,28
2,33 2,36 2,37
2,07 2,07
2,14 2,15 2,18
2,25 2,28 2,29
1,9
1,95
2
2,05
2,1
2,15
2,2
2,25
2,3
2,35
2,4
U18 EM ab 2016
U18 WM ab 1999
U20 EM ab 1989
U20 WM ab 1986
U23 EM ab 1997
EM ab 1990 WM ab 1983 OS ab 1988
Platz 1 AM Mä
Platz 8 AM Mä
1. Place & 8. Place average at international Championchips (male)
8cm
9cm

28
Gender Gap Highjump
8
9
4
11
0
2
4
6
8
10
12
U18 WC to U20 WC U20 WC zu WC Adults
prog
ress
ion
in c
m
Progression in the winning hights highjump from one age group to the next at worldchampionchips (1999-2016)
1. place male
1. place female

29
Gender Gap annual best performance
• Gender gap world leading = 34cm • Gender gap german leading = 34cm
0,00
0,05
0,10
0,15
0,20
0,25
0,30
0,35
0,40
0,45
0,50
m
Gender Gap annual best performances highjump since 1970 in the world and germany
WBL Mä-Fr DLV BL Mä-Fr

30
1,45
1,55
1,65
1,75
1,85
1,95
2,05
2,15 01
.01.
18
01.0
1.22
01.0
1.26
01.0
1.30
01.0
1.34
01.0
1.38
01.0
1.42
01.0
1.46
01.0
1.50
01.0
1.54
01.0
1.58
01.0
1.62
01.0
1.66
01.0
1.70
01.0
1.74
01.0
1.78
01.0
1.82
01.0
1.86
01.0
1.90
01.0
1.94
01.0
1.98
01.0
1.02
01.0
1.06
01.0
1.10
Weltrekord Hochsprung Frauen
World record progression female
29 years no progression Older redords: 400m, 800m, shotput

31
2
2,05
2,1
2,15
2,2
2,25
2,3
2,35
2,4
2,45
2,5
01.0
1.08
01
.01.
11
01.0
1.14
01
.01.
17
01.0
1.20
01
.01.
23
01.0
1.26
01
.01.
29
01.0
1.32
01
.01.
35
01.0
1.38
01
.01.
41
01.0
1.44
01
.01.
47
01.0
1.50
01
.01.
53
01.0
1.56
01
.01.
59
01.0
1.62
01
.01.
65
01.0
1.68
01
.01.
71
01.0
1.74
01
.01.
77
01.0
1.80
01
.01.
83
01.0
1.86
01
.01.
89
01.0
1.92
01
.01.
95
01.0
1.98
01
.01.
01
01.0
1.04
01
.01.
07
01.0
1.10
Weltrekord Hochsprung Männer
World record progression male
23 years no progression Older redords: 400m hurdles, longjump, shotput, discus, hammer

32
Gender Gap World Record Development
1,4
1,6
1,8
2
2,2
2,4
1910
19
13
1916
19
19
1922
19
25
1928
19
31
1934
19
37
1940
19
43
1946
19
49
1952
19
55
1958
19
61
1964
19
67
1970
19
73
1976
19
79
1982
19
85
1988
19
91
1994
19
97
2000
20
03
2006
20
09
Met
er
Jahre
World Record Highjump since 1910 Weltrekord Männer Weltrekord Frauen
Linear (Weltrekord Männer) Linear (Weltrekord Frauen)

33
Summary: Gender Gap Highjump
• Gender gap world record (2,45m – 2,09m) = 36cm • Gender gap annual world leading since 1970 = 34cm • Gender gap annual german leading since 1970 =34cm • Gender gap world championchips first place since 1983 = 33cm • Gender gap world championchips 8. place since 1983 = 36cm • Gender gap Olympic games first place since 1988 = 34cm • Gender gap Olympic games 8. place since 1988 = 36cm • Our results in general: Gender gap 14,5-15,5%
• Thibault et al (2010): § average gender gap highjump for all WR between 1961-1993 ist 17,17% § Gender gap Sprint about 10% § Gender gap middle and long distancerunning also about 10%

34
Agenda
• Development trends Olympic Games • Gender Gap in highjump • Best highjump nations worldwide

35
Medal winner 1-3 World Championchips continental spread (male & female)
54% 35%
2% 7%
2%
WM Medaillengewinner Hochsprung männlich seit
1983
Europa
Amerika
Afrika
Asien
Ozeanien
87%
11%
2%
WM Medaillengewinner Hochsprung weiblich seit
1983
Europa
Amerika
Afrika
Asien
Ozeanien

36
Medal winner highjump female since 1983
14
5 5
4 4
3
2 2 2 2
1 1 1
0
2
4
6
8
10
12
14
RUS GER UKR SWE CRO USA RSA CUB ITA BUL AUT NOR ESP
WM Medaillengewinner Hochsprung weiblich seit 1983

37
Medal winner highjump male since 1983
8
5 5
4 4 4
3 3
2 2 2
1 1 1 1
0
1
2
3
4
5
6
7
8
9
RUS CUB UKR POL USA CAN GER BAH ZYP SWE CHN GBR AUS QAT RSA
WM Medaillengewinner Hochsprung männlich seit 1983

38
Medal winner highjump male & female together since 1983
22
10
8 7 7
6
4 4 4 3 3
2 2 2 2 1 1 1 1 1 1
0
5
10
15
20
25
RUS UKR GER USA CUB SWE CRO POL CAN RSA BAH BUL ZYP ITA CHN AUT ESP QAT GBR AUS NOR
WM Medaillengewinner Hochsprung m/w gesamt seit 1983

39
Top 100 of the world all time best highjump male & female
25
12 13
6 3 4 2 3 5 4 2 1 1 1
17
25
10
8
5 3 5 3 1 1 3 4 4 4
0
5
10
15
20
25
30
35
40
45
RUS USA GER UKR POL ITA CAN SWE BUL ROU CUB CZE GBR CHN
Top 100 Leistungen ewige Weltbestenliste (Stand 31.12.2015) nach Nationen
Fr 2,09-1,97m Mä 2,45-2,33m

40
1,9
2
2,1
2,2
2,3
2,4
Zehnerschnitt BRD/DDR-GER, RUS/UdSSR, USA und Welt seit 1958 Männerhochsprung
BRD
DDR
GER
RUS/UdSSR
Welt
USA
Top Ten Average world and best nations highjump male since 1958

41
Top Ten Average best nations highjump female
1,941
1,902 1,893
1,873
1,850 1,848 1,841
1,834 1,833 1,830
1,760
1,780
1,800
1,820
1,840
1,860
1,880
1,900
1,920
1,940
1,960
RUS USA UKR GER ITA CHN GBR AUS POL SWE
Leading nations top 10 averages female 2000-2015
7cm

42
Top Ten Average best nations highjump male
2,286 2,283
2,229 2,222 2,220 2,216
2,209 2,200 2,197 2,192
2,14
2,16
2,18
2,20
2,22
2,24
2,26
2,28
2,30
USA RUS UKR CHN ITA POL GBR GER JPN FRA
Leading nations top 10 averages highjump male
8cm
43
Summary: best highjump nations in the world
• All time best performance: § US-Boys are better in the world rankings than the russians § Russian Women are dominant
• Medals at world Championchips: § Europe is in the lead (especially female) § Russians are in the lead
• National top 10 averages: § Russian womens are on top § US-Boys are on top

44
Literatur: Killing, Böttcher & Keil (2016). Sportwissenschaftliche Aspekte des Hochsprungs. Köln: Strauss-Verlag.
• just published:
• Fotos: Copyright footcorner, Hensel, Gantenberg, Neuthe, Weber und Internet