international trade and job polarisation€¦ · the notion of job polarisation in developed...
TRANSCRIPT
Honours Thesis
International Trade and Job Polarisation:
Are all the middle-waged jobs disappearing?
Jason P. Maxted
supervised by
Dr. Richard Pomfret
Submitted to The University of Adelaide, School of Economics as partial fulfilment for
the Bachelor of Economics (Honours) degree.
4 November 2016

Declaration
Except where appropriately acknowledged this thesis is my own work, has been expressed
in my own words and has not previously been submitted for assessment.
Word Count: 8137 Words
Signature Date
1
4/11/2016

Acknowledgements
I would firstly like to thank Dr Richard Pomfret as my supervisor for his guidance and
the access I was granted to his vast knowledge. I would also like to thank Dr Firmin Doko
Tchatoka for his assistance with some of the econometric specification. To Dr Benedikt
Heid, the once-off meeting I had with you proved valuable and I am very appreciative.
Appreciation must also be given to my friends and family for your continued support. And
lastly to my fellow honours students, I will be forever grateful for having met you and I
wish you all the very best in the next stage of your lives.
2

Abstract
This thesis investigates the influence that international trade exposure has on the com-
position of the labour force in the manufacturing sector in Australia between 2008 and
2013. In particular we investigate whether the phenomenon of job polarisation is present
within the industry, and whether increased trade exposure contributes to this. Thus we
have had to carefully map employment data with trade data. Our panel data fixed effects
estimation suggests that job polarisation does not exist within the manufacturing sector.
This does not rule out its existence when accounting for the entire labour force however.
The most significant finding is that increased exposure to trade leads to a movement of
labour down the wage distribution. Such a finding has the potential to have significant
policy implications.
3

Contents
1 Introduction 6
2 Literature Review 9
3 Data Description 12
3.1 Data Mapping . . . . . . . . . . . . . . . . . . . . . . . . . . . . . . . . . . 13
4 Empirical Model 16
5 Variables 19
5.1 Dependent Variable . . . . . . . . . . . . . . . . . . . . . . . . . . . . . . . 19
5.1.1 ln Shareit . . . . . . . . . . . . . . . . . . . . . . . . . . . . . . . . . 19
5.2 Independent Variables . . . . . . . . . . . . . . . . . . . . . . . . . . . . . . 20
5.2.1 Qualityit . . . . . . . . . . . . . . . . . . . . . . . . . . . . . . . . . 20
5.2.2 Tradeit . . . . . . . . . . . . . . . . . . . . . . . . . . . . . . . . . . 21
5.2.3 Quality∗Tradeit . . . . . . . . . . . . . . . . . . . . . . . . . . . . . 22
5.3 Controls . . . . . . . . . . . . . . . . . . . . . . . . . . . . . . . . . . . . . . 23
5.3.1 Industry V alue Added . . . . . . . . . . . . . . . . . . . . . . . . . 23
5.3.2 Australian Tariff Rate . . . . . . . . . . . . . . . . . . . . . . . . 23
5.3.3 World Tariff Rate . . . . . . . . . . . . . . . . . . . . . . . . . . . 23
5.3.4 Trade Weighted Index . . . . . . . . . . . . . . . . . . . . . . . . . 23
5.4 Instrumental Variables . . . . . . . . . . . . . . . . . . . . . . . . . . . . . . 25
6 Results 26
6.1 Pooled OLS . . . . . . . . . . . . . . . . . . . . . . . . . . . . . . . . . . . . 26
6.2 IV Fixed Effects . . . . . . . . . . . . . . . . . . . . . . . . . . . . . . . . . 28
6.3 Fixed Effects . . . . . . . . . . . . . . . . . . . . . . . . . . . . . . . . . . . 30
7 Discussion 33
8 References 35
9 Appendices 37
9.1 Appendix 1 . . . . . . . . . . . . . . . . . . . . . . . . . . . . . . . . . . . . 37
4

9.1.1 Data Mapping . . . . . . . . . . . . . . . . . . . . . . . . . . . . . . 37
9.2 Appendix 2 . . . . . . . . . . . . . . . . . . . . . . . . . . . . . . . . . . . . 52
9.2.1 Annual Wage Summary Statistics . . . . . . . . . . . . . . . . . . . . 52
9.3 Appendix 3 . . . . . . . . . . . . . . . . . . . . . . . . . . . . . . . . . . . . 53
9.3.1 Trade Summary Statistics . . . . . . . . . . . . . . . . . . . . . . . . 53
9.4 Appendix 4 . . . . . . . . . . . . . . . . . . . . . . . . . . . . . . . . . . . . 54
9.4.1 Pooled OLS - Trade with Developing Countries . . . . . . . . . . . . 54
9.5 Appendix 5 . . . . . . . . . . . . . . . . . . . . . . . . . . . . . . . . . . . . 55
9.5.1 Pooled OLS - Trade with Industrialised Countries . . . . . . . . . . 55
9.6 Appendix 6 . . . . . . . . . . . . . . . . . . . . . . . . . . . . . . . . . . . . 56
9.6.1 IV analysis - Trade with Developing Countries . . . . . . . . . . . . 56
9.7 Appendix 7 . . . . . . . . . . . . . . . . . . . . . . . . . . . . . . . . . . . . 57
9.7.1 IV analysis - Trade with Industrialised Countries . . . . . . . . . . . 57
9.8 Appendix 8 . . . . . . . . . . . . . . . . . . . . . . . . . . . . . . . . . . . . 58
9.8.1 Fixed Effects - Trade with Developing Countries . . . . . . . . . . . 58
9.9 Appendix 9 . . . . . . . . . . . . . . . . . . . . . . . . . . . . . . . . . . . . 59
9.9.1 Fixed Effects - Trade with Industrialised Countries . . . . . . . . . . 59
5

1 Introduction
Job polarisation is the phenomenon in which the labour market experiences an increase
in the share of bad jobs and an increase in the share of good jobs, but a decrease in the
share of jobs in between. It is just one pattern of labour movement that international
trade exposure has been theorised to exacerbate. Other trade-induced labour movements
will be discussed in the literature review. The measurement of the quality of a job can be
done using many alternative approaches but for this thesis, wage will be used to indicate
quality. Evidence of this ‘hollowing out’ of the labour market has been observed in many
developed countries including the United States, Denmark, Britain and much of Western
Europe. One particular hypothesis that has been used to explain the occurrence is that
medium quality jobs have the tendency to be more routine in their tasks and as such are
most likely to be replaced by technology, displacing workers into the tails of the job quality
distribution (Autor et al. 2003). This is known as the routinisation hypothesis. Another
explanation is that globalisation has contributed to job polarisation as these medium qual-
ity jobs are more susceptible to being off-shored, again leading to the displacement of the
labour force (Goos and Manning 2007). Furthermore, import competition has also been
hypothesised to lead to a decrease in demand for workers specifically concentrated in the
middle of the job quality distribution (Keller and Utar 2016). This thesis will examine
the latter, that being the influence of international trade on labour market composition.
The focus of the analysis will be the Australian manufacturing industry over six years
from 2008 to 2013. Traditionally it has been argued that the manufacturing sector has an
important role in the explanation of job polarisation. This is noted by Keller and Utar
(2016) as manufacturing jobs are typically middle waged occupations. And as many de-
veloped countries have seen a decline in the share of workers in the manufacturing sector,
largely due to off-shoring, these workers are then forced into other jobs which are often of
differing quality (Keller and Utar 2016). Thus they tend to move up or down the wage
distribution. Between 2008 and 2013 employment in the Australian manufacturing sector
had not only decreased in terms of share of the labour force, but it has also seen a nomi-
nal decrease in employment of approximately 15% (Australian Bureau of Statistics 2015).
6

This thesis opts to slightly alter the focus of analysis and instead will solely look at the
manufacturing industry. Firstly it will be determined whether labour market polarisation
exists within the manufacturing sector. And secondly whether international trade influ-
ences any movement of labour within manufacturing in Australia. A previous study from
Keller and Utar (2016) found there not to be job polarisation within the Danish manufac-
turing sector, and instead it only existed when taking into account the entire labour force.
Nevertheless we will enquire as to its presence in the Australian manufacturing sector. It
should also be mentioned that a benefit of conducting an analysis from the manufacturing
industry perspective is that it is traditionally one of the most traded sectors (Lake and
Millimet 2016). The following graph displays how each disaggregated manufacturing in-
dustry analysed has changed in employment share from 2008 to 2013.
Data sourced from the Australian Burueau of Statistics, 2015
For job polarisation to be confirmed there should be increases in employment shares at
the tails of the distribution and a decline in the middle. This is not obvious in the graph
and is an initial indication that it may not be a phenomenon within the Australian man-
ufacturing sector. However average wage per industry here is measured at 2008 levels and
7

does not allow for changes in wages over time. This displays how using a cross-sectional
model can be misleading. As will be discussed later, we allow for such changes in wages
in industries by using a panel data model. This is a major contribution to the literature
as most previous work does not capture changes in job quality over time. Another con-
tribution to the literature is that there has been limited attention paid to trade-induced
movement of labour within manufacturing as well as minimal recent research devoted to
polarisation of the Australian labour market.
The existence of job polarisation signals increasing inequality. This is why study of the
phenomenon is considered to be important (Keller and Utar 2016). There are potential
policy implications for international trade if it is determined that it is exacerbating in-
equality. For example it can lead to disagreements between people who benefit and those
who lose from the labour market changes. Similarly if job polarisation does not exist in
the manufacturing sector but trade impacts upon the composition of the labour force,
there are again implications for policy makers. This will be discussed further at a later
stage. The structure for the remainder of the thesis is that a literature review immediately
follows, after which there will be sections devoted to description of the data, an outline of
the model, a description of the variables, the empirical results and a subsequent discussion.
8

2 Literature Review
The notion of job polarisation in developed countries is not an entirely new sensation as
the trend is noticeable as early back as the 1970s, as observed by Goos and Manning
(2007). However the trend, like all trends, takes time to be noticed and thus polarisation
of the labour market has only become identified and analysed relatively recently. Goos and
Manning (2007) explore the entire labour market in Britain between 1975 and 1999 and
observe a distinct reduction in the share of jobs within the middle of the wage distribution.
Their argument for the structural change in the labour market echoes the notion of Autor,
Levy and Murnane (2003) that technology is responsible for this polarisation. The reason-
ing for such a claim is that all jobs fall into one of three categories. Non-routine tasks that
are complementary to technology such as professional jobs. These appear in the upper
part of the wage distribution. Next are routine tasks such as bookkeeping. These are con-
centrated within the middle of the income distribution as the moderate level of precision
required to perform these tasks ensures they are not within the low wage bracket. And
finally non-routine manual tasks not directly influenced by technology such as cleaning
that occupy the lowest wage group (Autor et al. 2003). Ultimately due to the structured
nature of routine tasks they are the most suited to becoming redundant as human labour
is substituted with technology. This theory is the most commonly recognised alternative
proposal to trade for the main cause of job polarisation. However as Goos and Manning
(2007) later concede, trade and technology are not necessarily competing explanations for
the phenomenon. They further note that the jobs that can be routinised are the ones that
are most likely to be moved overseas.
Keller and Utar (2016) specifically look at the influence of trade on job polarisation.
Their research of the Danish labour market between 1999 and 2009 finds that import
competition from China has led to job polarisation through the shift from manufacturing
towards services domestically. They also note that offshoring and technical change play a
role of the restructuring of the labour market, but to a lesser extent. Their explanation as
to why increased import competition can lead to job polarisation is as follows. Production
of traded goods intensively requires tasks that are performed by workers with moderate
9

skills, which are usually mid-level wage positions. Any increase in productivity within the
traded goods sector overseas will increase foreign competitiveness and exports. Therefore
domestically there will be a rise in the level of import competition and a decrease in the
demand for these mid-level waged jobs (Keller and Utar 2016). As such these workers will
be redistributed either to higher wage jobs or lower wage jobs. Keller and Utar (2016)
declare which way they move on the wage distribution is influenced by their education level.
Lake and Millimet (2016) discover that the US labour market has also seen a dis-
appearance in the share of middle-waged jobs. Their initial finding is that local import
competition, measured by tariff reductions and import penetration from China, reduces
employment growth in low-waged jobs but increases employment growth in high-waged
jobs. Thus they conclude that globalisation in the US is responsible for reallocating work-
ers upwards in the distribution of job quality, and not exacerbating polarisation. However
when they reclassify jobs into three categories similar to what is done by Goos and Man-
ning (2007), they find that an increase in local trade exposure does contribute to labour
market polarisation. They label this occupational polarisation and distinguish it from
job polarisation. Occupation in this sense is an aggregation of multiple jobs into the
three broad categories previously mentioned. Conversely Keller and Utar (2016) find that
despite the manufacturing sector being responsible for a high portion of mid-wage em-
ployment declines, there is no gain in employment in high-wage manufacturing jobs and
in fact employment in low-wage manufacturing jobs has decreased. Hence they discover
that there is no trade-induced polarisation within manufacturing in Denmark. This is an
important finding and suggests job polarisation within the manufacturing sector in Aus-
tralia is not necessarily expected.
A similar paper is written by Autor, Dorn and Hansen (2013). They look at the in-
fluence of rising Chinese import competition on the US labour market between 1990 and
2007. Specifically looking at the manufacturing industry they find that import competi-
tion is responsible for one quarter of the decline in US manufacturing employment (Autor
et al. 2013). Furthermore the labour market in Japan is analysed by Kambayashi and
Kato (2016). Popular narrative has claimed that the Japanese labour market has seen a
movement towards ‘bad’ jobs over the past three decades. Kambayashi and Kato dispel
10

this notion and argue that there has been a movement between ‘bad’ jobs. Whilst not
discussing job polarisation at length, they note that trade (in particular import penetra-
tion) is an influential factor in the change in composition of the labour market, but does
not necessarily cause job polarisation.
There also exists some Australian literature on the topic of job polarisation, but per-
haps not to the same extensive extent that exists abroad. Coelli and Borland (2015)
analyse the Australian labour market over the period 1966-2011 and find that, particu-
larly in the 1980s and 1990s, there is substantial evidence in support of the phenomenon of
job polarisation. Their paper does not incorporate trade like some of the other literature
and instead mainly focuses on the routinisation hypothesis first introduced by Autor, Levy
and Murnane (2003). Ultimately Coelli and Borland (2015) conclude that the data that
they observe supports the routinisation hypothesis. Another interesting finding of theirs
is that job polarisation is mainly a male phenomenon. The proposal for this occurrence is
that males were originally over represented in middle-skilled and middle-waged jobs.
11

3 Data Description
For the construction of this paper two sources of data were used. Firstly the employment
and wage data was sourced from the Australian Bureau of Statistics (2015), catalogue num-
ber 8155.0 titled Australian Industry. The manufacturing subsection consists of 4-digit
level industries, totalling 143 all together, and details the number of people employed
within each industry, the industry value added by each industry, their respective sales and
service incomes, as well as the total dollars spent on wages and salaries. Data is collected
annually. The industries are classified according to the Australian and New Zealand Stan-
dard Industrial Classification (ANZSIC).
The second dataset is sourced from the United Nations Industrial Development Or-
ganisation (2016). It contains trade data on 75 countries worldwide at the 4-digit manu-
facturing level. Specific variables of the country-level annual measurements are as follows:
output, apparent consumption, exports to industrialised countries, exports to developing
countries, exports to the entire world, imports from developing countries, imports from
industrialised countries, and imports from the entire world. The data availability for some
countries and variables is imperfect. However the availability of data on countries’ im-
ports, the variable of interest for our model, is relatively good for the desired countries.
The specific data source is titled ‘Industrial Demand-Supply Balance Database’. There are
137 manufacturing categories, which are classified according to the International Standard
Industrial Classification (ISIC) Revision four.
The two different classifications of manufacturing industries ensured that a method to
match the data was necessary for an appropriate analysis to be conducted. It was subse-
quently required that there be just one classification for all variables so as to satisfy our
model. This is a similar issue that was faced by Coelli and Borland (2015) where they dis-
cover a lack of one-to-one matches between their datasets for occupations. Unfortunately
there is no perfect manner in which to map such data. The Australian Bureau of Statis-
tics (ABS) provides correspondence tables between the two classifications as a means of
conversion and comparison. Ultimately it was these conversion tables that allowed trade
estimates to be determined and is discussed in more detail in the following section.
12

3.1 Data Mapping
As mentioned in the previous section, matching the trade data variables with the labour
data variables to form a single, comparable dataset ensured some estimates were required
to be made. The ABS correspondence tables resulted in a final total of 88 manufactur-
ing industries remaining in the sample. The two primary reasons why this number is
considerably lower than the original number of industries under both the ANZSIC and
ISIC classifications are due to the non-availability of data within some of the industries,
as well as the matching of some particular industries proving too unrealistic. The follow-
ing industry mapping examples demonstrate the process that was used to correspond the
ABS industries with the United Nations Industrial Development Organisation (UNIDO)
industries.
Firstly below essentially demonstrates a “perfect match”, where all the activities in
the ISIC classification of ‘Manufacture of Sugar’ are contained within the ANZSIC classi-
fication of ‘Sugar Manufacturing’. No other ISIC classifications are contained within this
ANZSIC classification. This can be considered a direct match and is the ideal scenario.
Therefore the trade variables under this ISIC classification are directly mapped to this
ANZSIC classification with no adjustment required.
ANZSIC ISIC
1181 Sugar Manufacturing 1072 Manufacture of Sugar
Table 1: Data Matching 1
The next example on the following page shows a partial match, denoted by p, between
the ISIC and ANZSIC classification. This indicates that only part of the particular ISIC
class (Manufacture of clay building materials) corresponds to the ANZSIC class of ‘Clay
Brick Manufacturing’. Nevertheless this is treated as a direct match as there is no reason-
able alternative, since it is not clear as to the strength of the partial match. As a result it
is important to note that these trade variables are estimates.
13

ANZSIC ISIC
2021 Clay Brick Manufacturing 2392p Manufacture of clay building materials
Table 2: Data Matching 2
A third example can be seen next. Here there are two ISIC classes. Both only partly
correspond to the ANZSIC class. To convert into a single ANZSIC class, the two ISIC
class variables are simply added together. The method is used for when there are at most
two partial ISIC classes per ANZSIC class. This is a necessary mapping rule to ensure
there are a sufficient number of industries in the analysis. Also, importantly, it does not
distort changes over time within an industry or between instrumental variables (which will
be discussed later) as all years and IVs are measured in the same manner.
ANZSIC ISIC
1171 Bread Manufacturing 1061p Manufacture of grain mill products1071p Manufacture of bakery products
Table 3: Data Matching 3
Lastly is an example of an ANZSIC class that has not been included in the analysis.
This is because it was not deemed appropriate to simply add all partial ISIC matches, be-
cause the high number of them is likely to overly inflate ‘Medical and Surgical Equipment
Manufacturing’ trade figures. Consequently doing so would have been misleading.
ANZSIC ISIC
2412 Medical and Surgical Equipment Manufacturing 2023p Soap and detergents, cleaning and polishing preparation
2593p Manufacture of cutlery, hand tools and general hardware
2651p Measuring, testing, Navigating and control equipment
2660p Irridiation, electromedical and electrotherapeutic equipment
2670p Optical instruments and photographic equipment
3250p Medical and dental instruments and supplies
3290p other manufacturing n.e.c
Table 4: Data Matching 4
14

Following these mapping ’rules’ that have been created, there are also a small number
of exceptions where author discretion and common sense were used to correspond ISIC
classes to ANZSIC classes. Appendix 1 details the full correspondence between the two
datasets and classifications. It also notes the 88 industries which are used in the analysis.
15

4 Empirical Model
Ultimately this section depicts the assessment of trade exposure on employment growth of
differing quality jobs in the manufacturing industry in Australia between 2008 and 2013.
It also allows for the presence of job polarisation to be investigated. The model that we
use in our analysis is as follows:
ln Shareit = αi + β1Qualit + β2Qual2it + θ1Tradeit + θ2QualitTradeit +
γ1Indcontrolsit + γ2Macrocontrolsit + εit
Overall there are six time periods and 88 industries, constituting 528 observations. Shareit
here represents the share of employment that manufacturing industry i has of the entire
manufacturing sector, at time t. Qual is the quality of employment within manufacturing
industry i and is measured by wage. Trade is the the exposure of industry i to imports.
αi is the unobserved heterogeneity. All these variables, as well as the controls included,
will be discussed in greater detail shortly.
This model is very similar to that used by Lake and Millimet (2016). The benefit
of using such a specification is that it incorporates the influence of both job quality and
trade exposure on the share of a specific industry within the manufacturing sector. The
cross-sectional version of this model proposed by Lake and Millimet (2016) is effectively
an amalgamation of models from two previous papers. Firstly the linear and quadratic
quality variables originate from the paper written by Goos and Manning (2007). They
seek to identify job polarisation and ultimately do so by finding the linear term is negative
while the quadratic term is positive. This implies a U-shaped relationship between growth
in employment and the quality level of a job (which they also measure using wage). This
indicates an increase in the share of low wage jobs and high wage jobs. The second paper
that provides a precedent regarding the trade aspect of the model is that written by Autor
et al. (2013). The variable that they include is a measurement of import exposure per
worker, as well as using controls, while their dependent variable is the share of the labour
force employed in manufacturing. Thus the model of Lake and Millimet (2016), which is
16

followed closely in this thesis, is effectively a combination of two previous models. One of
these previous papers focuses on job polarisation and the other investigates the influence
of import exposure on employment share. We want to do both. It should be noted that
all three of these models discussed are cross-sectional. Hence we build upon this by incor-
porating a panel dimension.
Initially, and somewhat naively, we estimate the model using pooled OLS. This is
essentially trivial as it is unrealistic to assume that error terms from different years are
uncorrelated. As a result pooled OLS produces inefficient estimators. Moving forward we
choose the methodology of estimating by fixed effects instead of random effects. Firstly
fixed effects reduces the threat of omitted variable bias that pooled OLS does not address.
Secondly, using fixed effects over random effects is largely commonplace in empirical panel
data analysis and is the option chosen by Kambayashi and Kato (2016). As mentioned
in the literature review, they focus on the influence of trade on the composition of the
labour force and their use of panel data is contrary to much of the relevant literature.
The popularity of using the fixed effects approach over random effects stems from the fact
that it is less restrictive. In explanation, the random effects model assumes that indi-
vidual specific effects, αi, are uncorrelated with the independent variables. Consequently
this assumption is likely to be violated so, consistent with the literature, we opt to use
the fixed effects model. Additionally using a fixed effects estimation is preferred to using
first differences as when a time period is greater than two, the coefficients are more efficient.
To address the presence of heteroskedasticity and autocorrelation in the model, which
will be further discussed in the results section, we use robust standard errors. In much of
the literature, including the papers by Keller and Utar (2016) as well as Lake and Millimet
(2016), the approach to addressing these shortcomings is to use clustered standard errors.
Clustered standard errors are robust to heteroskedasticity and autocorrelation. However
their limitation is that they do not consider cross-sectional correlation. As a consequence
the assumption that the errors of a panel model are correlated within observations but
not between observations can often be an inappropriate constraint (Hoechle 2007). This
is particularly relevant to this thesis as the observations are all industries within the man-
ufacturing sector. Most previous literature has a broader scope of the entire labour force
17

and perhaps have stronger grounds for clustering standard errors. Nevertheless it would
be naive to assume there is no relationship across manufacturing industries.
The approach we use is to employ Driscoll-Kraay standard errors. Whilst typically
most suitable for panels with a relatively large number of time periods, T, there are no
feasibility issues if the number of panels, N, exceeds the time periods. Driscoll-Kraay
standard errors are robust to heteroskedasticity and autocorrelation as well as permitting
cross-sectional dependence. This means that they allow for correlation between panels
(Hoechle 2007). Thus it is reasonable to use them in our analysis. These will be the
standard errors presented in the results section. A shortcoming of using Drsicoll-Kraay
standard errors in Stata is that is does not allow a test as to whether variables are en-
dogenous but this will be addressed later.
18

5 Variables
5.1 Dependent Variable
5.1.1 ln Shareit
The dependent variable that is used in the model is the log of employment share of specific
manufacturing industry i out of the whole manufacturing industry. Consequently this will
be a number between zero and one, and since there are 88 industries, this will be a number
much closer to zero. By using a log dependent variable, it allows for the effect of changes
in independent variables on the share of manufacturing industry i to be interpreted in
percentage terms. This is a strategy employed by Goos and Manning (2007). These
employment estimates relate to the number of workers employed within the industry at
the end of the recorded year, regardless of the nature of their employment (full-time, part-
time or casual). The below table displays the summary statistics of this variable when it
is not logged, in order to help with interpretation.
Employment share of industries Inter-Quartile Range
Variable Minimum LowerQuartile
Median UpperQuartile
Maximum
2008 0.0002213 0.002457 0.0042888 0.0091759 0.04443562009 0.000244 0.0027192 0.0043082 0.0095901 0.04738092010 0.0002516 0.0025219 0.0041136 0.0092459 0.04803092011 0.0002542 0.0024177 0.003871 0.0096109 0.04776972012 0.0002366 0.0023597 0.0044627 0.0102816 0.0498332013 0.0002298 0.002471 0.0043612 0.0098987 0.04941172008-2013 0.0002213 0.0024777 0.0042969 0.0096678 0.049833
Table 5: Employment Share Summary Statistics 2008-2013
It is interesting to note that the manufacturing industry with the least employment out of
the whole sector is that of Wool Scouring Manufacturing. It has the lowest employment
in the sector in each of the six years analysed, of around 0.02% each year. The indus-
try with the greatest share of employment within the manufacturing sector for four of
the six years is Bakery Product Manufacturing while for the other two years Printing
Manufacturing occupies the greatest share of any industry within the sector. There is no
dominant industry which possesses more than five per cent of the manufacturing labour
force at any period between 2008 and 2013.
19

5.2 Independent Variables
5.2.1 Qualityit
The measure for the quality of a job within a specific industry is the average wage for
the industry, measured in Australian dollars. This data is extracted from the ABS manu-
facturing labour data source and is calculated by dividing the total annual expenses paid
towards wages and salaries in each industry by the total number of people employed within
the industry at the end of the year. Using wage as an indicator for job quality, or in this
case quality of employment within an industry, is commonplace in the literature. Goos
and Manning (2007) adopt this method for their model. Keller and Utar (2016) do the
same thing. Coelli and Borland (2015) choose to measure the quality of a job by using
the skill levels attributed to each occupation. Alternatively Lake and Millimet (2016) opt
to measure job quality by using the Nam-Powers-Boyd (NPB) index which is a function
of the median wage and median education level of a job. The NPB index ranges from
zero to one, and is the approximate percentage of the labour force who are employed in
jobs with a lower wage and education combination (Lake and Millimet 2016). Due to
existing literature, and data limitations, mean wage has been chosen to be the sole in-
dicator of the quality of employment within a specific industry. Additionally, for ease of
interpretation of variables within the model, this paper will follow a similar approach to
Lake and Millimet in that wage has been normalised to be a number between zero and one.
Annual Wage Inter-Quartile Range ($)
Variable Minimum LowerQuartile
Median UpperQuartile
Maximum
2008 26,950.43 46,302.25 55,044.7 63,245.82 115,604.42009 22,264.2 48,406.41 54,810.01 66,531.78 102,148.82010 18,867.09 49,047.41 60,197.9 73,430.12 120,611.62011 23,017.27 50,587.53 63,576.35 74,842.62 127,116.82012 22,825.02 52,382.03 65,453.05 78,341.02 121,797.62013 22,540.46 54,736.07 65,814.73 79,382.8 141,798.12008-2013 18,867.09 49,598.34 60,848.14 74,422.65 141,798.1
Table 6: Annual Wage Summary Statistics 2008-2013
The above table displays the summary statistics of the non-normalised wages by in-
dustries between 2008 and 2013. Appendix 2 shows a visual representation of these wages,
20

in box-plot form, over the six year time period. For each of the six years Bakery Product
Manufacturing is the industry where workers were paid the least and the highest paid
industry is Alumina Production Manufacturing. There is a large discrepancy between
the lowest and highest paid industries, which is increasing over time but could potentially
be partially explained by specific industry variables. Such variables not captured could
include the type of employment common to the industry, being that of casual employment,
part-time or full-time.
The squared term is included as non-linearity is anticipated between Quality and share
of employment. Also it assists in the identification of job polarisation. Goos and Manning
(2007) employ the same technique. As the literature details, job polarisation resembles
a U-shaped pattern. If it is found that the linear quality variable is negative and the
quadratic quality term is positive, a U-shaped relationship between wages and employ-
ment share is implied. This means that there is an increase in employment share in both
tails of the wage distribution but a necessary decrease in the middle.
5.2.2 Tradeit
This variable is measured by the value of imports into Australia annually and is an in-
dication of exposure of an industry to trade. It also follows the literature of Lake and
Millimet (2016) and Autor et al (2013) in the sense that it is not a logged variable. It is
in current US dollar terms. Using imports as an indicator for trade exposure is common-
place in the literature. Lake and Millimet (2016) are an example of this as they choose
to use Chinese import penetration for their measure of trade exposure. Keller and Utar
do the exact same. So do Autor, Dorn and Hanson (2013). Their papers have slightly
different intentions and have a focus on trade with China. As such the broader scope
of this analysis ensures that trade exposure will be measured through aggregate imports
into Australia. Alternatively, the data also allows for additional separate analysis using
imports from industrialised countries as well as imports from developing countries as trade
exposure measures.
21

Appendix 3 contains the 5-point summary of Australian imports sourced from devel-
oping countries, from industrialised countries and from the entire world. It is evident
that Australia receives much more imports from industrialised countries than from devel-
oping countries. For imports from developing countries the industries which import the
least include Sugar Manufacturing and Printing Support Services Manufacturing.
The industries among those who import the most include Aluminium Rolling, Drawing,
and Extruding Manufacturing as well as Motor V ehicle Manufacturing. Similarly
for imports from industrialised countries, Sugar Manufacturing and Printing Support
Services Manufacturing are also the industries which import the least. Likewise Motor
V ehicle Manufacturing is among those that imports the most, together with Industrial
Gas Manufacturing.
5.2.3 Quality∗Tradeit
This interaction term is used in the model as it is expected that trade exposure and
job quality are related in their explanation of employment share within an industry. In
further explanation it is likely that the quality of a job within a specific industry has
differing effects on the industry’s employment share when exposed to differing levels of
imports. Lake and Millimet (2016) adopt this same approach. This term also aids in the
interpretation of the results, which will be discussed shortly.
22

5.3 Controls
5.3.1 Industry V alue Added
The Industry Value Added (IVA) in each industry is controlled for by including this vari-
able. IVA is a measure of GDP of each industry. To take into account the different sizes
of these industries, these values are divided by the total amount of workers employed in
the industry. Thus it is essentially a measure of GDP per capita. Ultimately this variable
is controlling for productivity of industries. Lake and Millimet (2016) adopt a similar
approach when they use total factor productivity as a control for their model.
5.3.2 Australian Tariff Rate
This is one of three macroeconomic controls that are included in the model specification. It
is expected that the Trade variable is related to these controls and as such they appear in
the regression. Specifically this is the Australian weighted mean tariff rate for all products.
5.3.3 World Tariff Rate
Similarly to the Australian tariff rate, we also include the world tariff rate. Again this is
the world weighted mean tariff rate for all products. Lake and Millimet (2016) too include
home and foreign tariff rates in their model.
5.3.4 Trade Weighted Index
Finally the trade weighted index (TWI) is also put in the model. The TWI is essentially
the average of the exchange rates of the currency of a country, with weighting placed on all
trading partners to reflect their significance to the country’s trade. This is not a standard
approach in the literature to include such a variable but it is likely nevertheless to be
related to Trade and consequently the dependent variable.
23

Interpretation of the model and its trade parameters is as follows. Recall that industry
wage is normalised to be a number between zero and one. This means that the low-wage
industries have wages close to zero and the high-wage industries have wages close to one.
θ1 therefore represents the effect of a one unit increase ($1,000,000) in the value of imports
when Quality is equal to zero. Thus it indicates how changes in imports affect employ-
ment share of bad jobs. On the other hand θ1 + θ2 represents the effect of a one unit
increase in imports when wage is equal to one. Therefore θ1 + θ2 measures how imports
affect the employment share of good jobs.
24

5.4 Instrumental Variables
To address potential endogeneity we identify suitable instrumental variables. The variable
that we will instrument for is Trade, or in particular, Australian imports. Lake and
Millimet (2016) instrument for trade exposure, in which they measure by imports from
China, using industry level Chinese exports to eight other high income countries. These
countries are Australia, Denmark, Finland, Germany, Japan, New Zealand, Spain and
Switzerland. Autor et al. (2013) use the exact same approach when instrumenting for
growth in Chinese exports to the United States. The instrumental variables are identical.
Keller and Utar (2016) also instrument for imports from China using Chinese exports to
eight other high income countries. However, they substitute Denmark and Spain for the
Netherlands and US. It should be noted that these three papers measure trade exposure
using imports from China. As we are focusing on imports from the entire world, the
IVs that we will employ are total imports into eight other high income countries. These
countries will follow the previous literature and be the same as the ones set out initially
by Autor et al. (2013) and then later adopted by Lake and Millimet (2016). The one
alteration will be to replace Australia with the US. Past empirical evidence has proven
such instruments to be relevant. However endogeneity is not always found to exist and as
such, IVs are not always required (Lake and Millimet 2016). Nevertheless we will conduct
our own testing.
25

6 Results
6.1 Pooled OLS
Table 7 presents the baseline results from naively conducting Pooled OLS. In this particular
finding here Trade represents imports into Australia from all countries. Column 1 regresses
Share on Quality and Quality Squared. Here it is confirmed that there is job polarisation
at the manufacturing industry level in Australia. This is evident in Column 1 where the
linear quality term is negative while the quadratic is positive. This illustrates the U-
shaped relationship previously discussed where there is an increase in the share of both
good and bad jobs. Also of importance is that both these values are significant at the
one per cent level. It is reminded that the standard errors are robust and of the Driscoll-
Kraay type previously discussed. We do this in response to testing for heteroskedasticity
and autocorrelation in Stata and finding their presence. The industry controls in the
below table comprise solely of the Industry Value Added per person. The macroeconomic
controls are the Australian tariff rate, the world tariff rate, and the trade weighted index.
Trade with all countries
Variable 1 2 3 4
Quality -0.942*** -1.147*** -1.075*** -1.075***(0.086) (0.057) (0.077) (0.079)
Quality Squared 0.820*** 1.112*** 1.29*** 1.30***(0.101) (0.068) (0.115) (0.115)
Trade 0.032*** 0.032*** 0.032***(0.006) (0.006) (0.006)
Quality∗Trade -0.045*** -0.043*** -0.044***(0.011) (0.010) (0.010)
MacroeconomicControls
No No No Yes
Industry Controls No No Yes Yes
Table 7: Pooled OLS - Imports from all Countries
*p < 0.10, **p < 0.05 and ***p < 0.01
26

Column 2 displays the results from when the two trade variables are introduced into the
regression. Here Trade is deemed significant at the one per cent level and the interaction
is also significant at this same level. In fact all variables in all estimations are significant at
the one per cent level. The results tell us that an increase in Australian imports increases
the share of bad jobs, θ1, but decreases the share of good jobs. This is evidenced by
the positive coefficient on θ1 and the negative coefficient on θ2. Hence trade here seems
to have an adverse influence on the manufacturing labour market; as there is an evident
move down the wage distribution. The remaining columns introduce the controls into the
model and do not drastically change the coefficients, standard errors or significance levels.
This suggests that endogeneity may not be cause for concern, nevertheless we will formally
test this next (Lake and Millimet 2016). Appendix 4 and Appendix 5 display the Pooled
OLS results when the trade exposure is imports from developing countries and when
imports are from industrialised countries. It can be deduced by looking at those tables
that trade with industrialised countries produces more significant results. Importantly it
is unrealistic to assume the error terms from different periods are uncorrelated when using
pooled OLS. Thus it is likely to produce inefficient estimators. Furthermore there is a
potential endogeneity problem that has been previously mentioned. As such we move on
to conducting an IV fixed effects regression.
27

6.2 IV Fixed Effects
We next turn our attention to the instrumental variable analysis. As previously mentioned
we address potential endogeneity of Australian imports using the imports of eight other
high income countries. The results of the analysis can be seen below.
Trade with all the World
Variable Non-RobustSEs
Heteroskedastic-Robust SEs
Clustered SEs Driscoll-KraaySEs
Quality -0.114 -0.114 -0.114 -0.114(0.112) (0.159) (0.170) (0.167)
Quality Squared 0.047 0.047 0.047 0.047(0.112) (0.146) (0.148) (0.158)
Trade 0.006 0.006 0.006 0.006***(0.005) (0.005) (0.006) (0.002)
Quality∗Trade -0.015** -0.015** -0.015*** -0.015***(0.006) (0.007) (0.005) (0.003)
MacroeconomicControls
Yes Yes Yes Yes
Industry Controls Yes Yes Yes YesWeak IdentificationTest
Strong IVs atall levels
Strong IVs atall levels
Strong IVs atall levels
Strong IVs atall levels
Sargan Statistic P=0.33 P=0.36 P=0.52 N/AEndogeneity Test P=0.26 P=0.26 P=0.24 N/A
Table 8: IV Fixed Effects - Imports from all Countries
*p < 0.10, **p < 0.05 and ***p < 0.01
Here we display the results of the IV fixed effects estimation using different standard
errors. The purpose of showing the results achieved using alternative standard error mea-
sures is to show that the Driscoll-Kraay standard errors are not too dissimilar. This is
necessary to do because a limitation of using Driscoll-Kraay standard errors is that Stata
does not allow for an endogeneity test when using them. But since the standard error
values are similar to the other forms of standard errors, which all support the hypothesis
of Trade being exogenous (as p>0.05 in endogeneity tests), it is reasonable to conclude
that Trade is exogenous even when using Driscoll-Kraay standard errors. It should be
noted exogeneity of the variable Trade is confirmed even when disaggregating trade to be
imports from developed and industrialised countries. These results are shown in Appen-
dices 6 and 7 respectively. It should also be noted that using the Driscoll-Kraay standard
28

errors does alter the standard error value for Trade relatively substantially and makes
it statistically significant. Nevertheless the other standard errors remain quite stable so
we will assume Trade is exogenous and conduct a regular fixed effects estimation. If the
results are similar this will provide further evidence for exogeneity.
Lake and Millimet (2016) produce a similar finding when they conclude that their
instrumental variables, which as mentioned previously are almost identical to those used
in this thesis, are not required due to a lack of endogeneity. They consequently revert to
OLS for the remainder of their estimations. However as we are using panel data, pooled
OLS is likely to be inefficient. This is why we revert to a standard fixed effects approach.
In terms of the other results presented in the table the Sargan statistic supports the null
hypothesis that the overidentifying restrictions are valid. Also the Stock and Yogo weak
identification test returns a Cragg-Donald Wald F-statistic that exceeds all the critical
values. This indicates that the instruments are strong. Not shown in the table but a
result nonetheless, is that the instruments are not underidentified. This means that the
instruments are correlated with the Trade variable. It should be noted that these results
were made attainable by using the user-written Stata command xtivreg2 (Schaffer 2010).
29

6.3 Fixed Effects
We will now revert to a non-IV fixed effects estimation. We continue to use Driscoll-Kraay
standard errors to correct for the groupwise heteroskedasticity and autocorrelation that is
again identified, but also allow for errors across industries to be correlated. Below displays
the results.
Trade with all the World
Variable 1 2 3 4
Quality -0.137 -0.135 -0.141 -0.176(0.12) (0.108) (0.095) (0.13)
Quality Squared -0.013 0.041 0.064 0.088(0.117) (0.103) (0.102) (0.120)
Trade 0.006*** 0.007*** 0.008***(0.002) (0.002) (0.001)
Quality∗Trade -0.012*** -0.012*** -0.012***(0.002) (0.001) (0.002)
MacroeconomicControls
No No No Yes
Industry Controls No No Yes Yes
Table 9: Fixed Effects - Imports from all Countries
*p < 0.10, **p < 0.05 and ***p < 0.01
Our first important observation is that the results presented in Column 4 are not too
dissimilar to the IV estimation using Driscoll-Kraay errors, in terms of both coefficients
and standard errors. This suggests a lack of endogeneity within the model and that a
regular fixed effects estimation is sufficient. This now allows us to interpret the findings
in this table.
In contrast to our Pooled OLS estimation, Column 1 finds that polarisation of the
labour force in the manufacturing sector is not an occurrence between 2008 and 2013. In
fact the Quality Squared variable has even reversed its sign so there is no longer a U-
shaped relationship between Quality and Quality Squared. However both variables are
insignificant so we conclude that there is no evidence to support job polarisation within
the manufacturing industry over the six year period.
30

The next result of interest are the findings presented in Column 4. Here the pos-
itive sign of Quality Squared returns to again imply a U-shaped relationship between
the quality variables. However they still remain statistically insignificant. The variables
that do display statistical significance, of which they do at the 1% level, are Trade and
Quality∗Trade. This consequently illustrates that despite there being no evidence of
job polarisation in manufacturing in Australia over the six year time frame, there is evi-
dence to suggest that the level of imports in an industry influences its employment share.
Recalling from earlier that average wages in each industry have been normalised to a
number between zero and one, the positive significant value of Trade suggests that as
the amount of imports increases, the share of employment within low-wage industries also
increases. Or less formally, trade increases the share of bad jobs. The negative coefficient
on Quality∗Trade however indicates that imports reduce the share of people employed in
high-wage industries. Thus trade decreases the share of good jobs. Ultimately this result
indicates that, when considering trade with all countries, increasing imports in the manu-
facturing sector leads to a movement of labour down the wage distribution. However this
result is not an overall trend within the sector. It only describes the influence of trade on
employment share. For this to have been a trend throughout the entire industry, Quality
and Quality Squared would have been required show significance and different signs. So
there are other factors that appear to influence the distribution of the labour force other
than trade. This is relatively intuitive.
Appendices 8 and 9 illustrate the same process but disaggregating the origin of trade
to be from developing and industrialised countries. The results of the regression when
using imports from industrialised countries for the Trade variable is similar to the results
displayed in Table 9. Here we are focusing our attention on Column 4. The more inter-
esting finding is in Appendix 8 when trade represents imports from developing countries,
also in Column 4. While Trade and Quality∗Trade remain significant, at the 1% and
10% levels respectively, Quality is also found to be statistically significant. It should be
noted that coefficient signs do not change across the three regressions. This effectively
says that when imports with developing countries are introduced into the model, there is
a negative relationship between the quality, or more specifically wage, of an industry and
the employment share of the industry. But there remains to be no statistically significant
31

U-shaped relationship between Quality and Quality Squared. Instead industries are de-
creasing in their employment share as their average wage increases.
A summation of the findings is as follows. After estimating the model using the appro-
priate fixed effects estimation, it is found that there is no polarisation of the manufacturing
labour force in Australia between 2008 and 2013. Furthermore there is no significant move-
ment of labour up or down the wage distribution at all. The exception is when we estimate
the model using imports from developing countries as the Trade determinant. What we
do find however is that trade is an influential factor in the employment share of an indus-
try. Specifically our results indicate that an increase in imports into Australia increases
the share of employment in low-waged industries, or ’bad jobs’. Conversely an increase in
imports into Australia reduces the share of employment in high-wage industries, or ’good
jobs’. So while there has largely been no evident labour movement trend over this six year
period, trade increases have led to a movement of employment down the wage distribution.
32

7 Discussion
As initially mentioned at the start of this thesis manufacturing has traditionally played
an important role in the explanation of job polarisation (Keller and Utar 2016). How-
ever we attempted to investigate whether the phenomenon existed within the industry,
which is one of the most heavily traded sectors. Despite our pooled OLS results initially
confirming the existence of job polarisation, our further robust fixed effects analysis ruled
this out. Therefore we conclude that while the role of the manufacturing industry may be
significant in the existence of job polarisation on a larger labour force scale, its existence
within the manufacturing industry is not supported by our results.
A significant finding of our analysis is the influence that trade has on the employment
share of an industry. As mentioned in the previous section, increases in imports, regard-
less of their origin, increase the share of employment in bad jobs but decrease the share of
employment in good jobs. Thus trade causes a movement down the wage distribution in
the manufacturing sector. Such a finding has the potential to have implications for policy
makers as it is possible domestic workers will be averse to the notion of increased trade
openness knowing that it could lead to an overall shift of employment down the wage
distribution. For example there may be worker backlash to new free trade agreements or
further tariff reductions.
It is important to reiterate that manufacturing is a unique industry in Australia, and
in many other high income countries throughout the world at the moment, in that not
only is employment share of the industry decreasing but also it is declining in nominal
employment numbers (Australian Bureau of Statistics 2015). Thus we do not intend to
generalise and suggest that increased trade exposure is likely to lead to a movement of
the entire labour force down the wage distribution. We also do not suggest that work-
ers in other industries are susceptible to move down this wage distribution within their
particular industry. Manufacturing is clearly not a representative industry in Australia.
But something we can conclude is that increasing imports has had an adverse affect on
labour in the manufacturing sector in Australia between 2008 and 2013. Bear in mind
33

that labour in the manufacturing sector has not been adversely affected overall in this
time period however.
In terms of explaining why trade has this influence on employment share of industries
of different qualities, much of the literature is relatively irrelevant as it attempts to explain
job polarisation. However we have already found this not to be the circumstance. Kalle-
berg and Hewison (2013) find that globalisation has the potential to increase the number
of bad jobs relatively. They argue that cost reductions are a cause and that these often
come in the form of wage reductions. For example, if a multinational company enters into
a new country, they are likely to employ workers at low wages. Therefore the share of
low-waged jobs increase. However they have a large focus on developing countries and
their explanations are largely not applicable to this scenario. Nevertheless it is possible
to comprehend how increased import competition could increase the share of bad jobs.
For instance Keller and Utar’s (2016) hypothesis that an increase in productivity within
the traded goods sector abroad will increase foreign competitiveness and exports, which
then increases import competition, may still be applicable. But perhaps in the manufac-
turing sector this increase in import competition has been concentrated in the middle and
high-wage industries. This could then cause a redistribution of workers into lower-waged
industries. It should be said that this is merely speculation and one possible explanation
for the occurrence. Further research is required in order to make a more informed hypoth-
esis. Our results are not consistent with the routinisation hypothesis either. However this
is somewhat expected as, firstly, our thesis differs in focus to much of the literature, and
secondly it is likely that job descriptions between manufacturing industries entail similar
levels of routine tasks.
This thesis can be extended in the future by analysing the entire labour market in Aus-
tralia and researching how trade influences its movement, providing the data is available.
While focusing on the manufacturing industry has proved insightful, especially by employ-
ing a panel data model, there remains room for further analysis. This is especially the
case if we are attempting to identify if there has been recent job polarisation in Australia,
which is initially found by Coelli and Borland (2015) in the 1990s.
34

8 References
Acemoglu, D and Autor, D, 2011. Skills, Tasks and Technologies: Implications for Em-
ployment and Earnings. Handbook of Labour Economics, Volume 4b, 1043-1169.
Australian Bureau of Statistics, 2015. Australian Industry. [Data File]. Cat. no. 8155.0.
Autor, D, Dorn, D and Hansen, G, 2013. The China Syndrome: Local Labour Market
Effects of Import Competition in the United States. The American Economic Review,
103(6), 2121-2168.
Autor, D, Levy, F and Murnane, RJ, 2003. The Skill Content of Recent Technolgical
Change: An Empirical Exploration. The Quarterly Journal of Economics, 1279-1333.
Coelli, M and Borland, J, 2015. Job Polarisation and earnings inequality in Australia.
Department of Economics, University of Melbourne.
Davis, D and Harrigan, J, 2011. Good Jobs, bad jobs, and trade liberalization. Journal
of International Economics 84, 26-36.
Goos, M and Manning, A, 2007. Lousy and Lovely Jobs: The Rising Polarization of Work
in Britain. The Review of Economics and Statistics, 89(1), 118-133.
Hoechle, D, 2007. Robust Standard Errors for Panel Regressions with Cross-Sectional
Dependence. The Stata Journal, 7(3):281-312.
Kalleberg, AL, Hewison, K, 2012. Precarious Work and the Challenge for Asia. Amercian
Behavioural Scientist, 57(3) 271–288.
Kambayashi, R and Kato, T, 2016. Good Jobs and Bad Jobs in Japan: 1982-2007.
Columbia Working Paper No. 348.
35

Keller, W and Utar, H, 2016. International Trade and Job Polarisation: Evidence at the
Worker Level. NBER Working Paper No. 22315.
Lake, J and Millimet, DL, 2016. Good Jobs, Bad Jobs: What’s Trade Got To Do With
it? Institute of Study of Labour (IZA) Discussion Paper No. 9814.
Marcoli, L, Miroudot, S and Squicciarini, M, 2016. Routine Jobs, Emplyment and Tech-
nological Innovation in Global Value Chains. OECD Science, Technology and Industry
Working Papers 2016/01
Schaffer, M.E., 2010. xtivreg2: Stata module to perform extended IV/2SLS, GMM and
AC/HAC, LIML and k-class regression for panel data models.
http://ideas.repec.org/c/boc/bocode/s456501.html.
United Nations Industrial Development Organisation, 2016. Industrial Demand-Supply
Balance Database. [Data File]. UNIDO
36

9 Appendices
9.1 Appendix 1
9.1.1 Data Mapping
As described earlier in Section 3.1 it was required to map the ISIC manufacturing industries
to the ANZSIC manufacturing industries. Consequently the full correspondence follows in
a comprehensive table, starting on the next page. The industries with a line through them
were not used in the analysis due to data availability issues or difficulty in the matching
of the data.
37

Table 10: ANZSIC - ISIC Correspondence Table.
ANZSIC ISIC
1111 Meat Processing 1010p Processing and preserving of meat
1075p Manufacture of prepared meals and dishes
1112 Poultry Processing 1010p Processing and preserving of meat
1075p Manufacture of prepared meals and dishes
1113 Cured Meat and Smallgoods Manufacturing 1010p Processing and preserving of meat
1075p Manufacture of prepared meals and dishes
1120 Seafood Processing 0311p Marine fishing
1020p Processing and preserving of fish, crustaceans
and molluscs
1075p Manufacture of prepared meals and dishes
1131 Milk and Cream Processing 1050p Manufacture of dairy products
1132 Ice Cream Manufacturing 1050p Manufacture of dairy products
1133 Cheese and Other Dairy Product Manufacturing 1050p Manufacture of dairy products
1079p Manufacture of other food products n.e.c.
1140 Fruit and Vegetable Processing1030p Processing and preserving of fruit and vegeta-
bles
1075p Manufacture of prepared meals and dishes
1079p Manufacture of other food products n.e.c.
1150 Oil and Fat Manufacturing1040 Manufacture of vegetable and animal oils and
fats
1062p Manufacture of starches and starch products
1073p Manufacture of cocoa, chocolate and sugar con-
fectionery
1161 Grain Mill Product Manufacturing 1061p Manufacture of grain mill products
1062p Manufacture of starches and starch products
1075p Manufacture of prepared meals and dishes
1079p Manufacture of other food products n.e.c.
1103p Manufacture of malt liquors and malt
1162 Cereal, Pasta and Baking Mix Manufacturing 1061p Manufacture of grain mill products
1074 Manufacture of macaroni, noodles, couscous and
similar farinaceous products
1171 Bread Manufacturing (Factory based) 1061p Manufacture of grain mill products
1071p Manufacture of bakery products
1172 Cake and Pastry Manufacturing (Factory based) 1071p Manufacture of bakery products
1173 Biscuit Manufacturing (Factory based) 1071p Manufacture of bakery products
1174 Bakery Product Manufacturing (Non-factory
based)1071p Manufacture of bakery products
1181 Sugar Manufacturing 1072 Manufacture of sugar
38

ANZSIC ISIC
1182 Confectionery Manufacturing1073p Manufacture of cocoa, chocolate and sugar con-
fectionery
1191 Potato, Corn and Other Crisp Manufacturing1030p Processing and preserving of fruit and vegeta-
bles
1071p Manufacture of bakery products
1079p Manufacture of other food products n.e.c.
1192 Prepared Animal and Bird Feed Manufacturing 1080 Manufacture of prepared animal feeds
1199 Other Food Product Manufacturing n.e.c.1030p Processing and preserving of fruit and vegeta-
bles
1071p Manufacture of bakery products
1075p Manufacture of prepared meals and dishes
1079p Manufacture of other food products n.e.c.
1211 Soft Drink, Cordial and Syrup Manufacturing1030p Processing and preserving of fruit and vegeta-
bles
1079p Manufacture of other food products n.e.c.
1102p Manufacture of wines
1104 Manufacture of soft drinks; production of min-
eral waters and other bottled water
1212 Beer Manufacturing 1103p Manufacture of malt liquors and malt
1213 Spirit Manufacturing 1101 Distilling, rectifying and blending of spirits
1214 Wine and Other Alcoholic Beverage Manufac-
turing1079p Manufacture of other food products n.e.c.
1102p Manufacture of wines
1220 Cigarette and Tobacco Product Manufacturing 1200 Manufacture of tobacco products
1311 Wool Scouring 1311p Preparation and spinning of textile fibres
2023p Manufacture of soap and detergents, clean-
ing and polishing preparations, perfumes and toilet
preparations
1312 Natural Textile Manufacturing 1311p Preparation and spinning of textile fibres
1312p Weaving of textiles
1313 Synthetic Textile Manufacturing 1311p Preparation and spinning of textile fibres
1312p Weaving of textiles
1399p Manufacture of other textiles n.e.c.
1320 Leather Tanning, Fur Dressing and Leather
Product Manufacturing1420p Manufacture of articles of fur
1511 Tanning and dressing of leather; dressing and
dyeing of fur
1512p Manufacture of luggage, handbags and the like,
saddlery and harness
3092p Manufacture of bicycles and invalid carriages
3290p Other manufacturing n.e.c.
1331 Textile Floor Covering Manufacturing 1393 Manufacture of carpets and rugs
39

ANZSIC ISIC
1332 Rope, Cordage and Twine Manufacturing 1394 Manufacture of cordage, rope, twine and netting
1333 Cut and Sewn Textile Product Manufacturing1392p Manufacture of made-up textile articles, except
apparel
1399p Manufacture of other textiles n.e.c.
1334 Textile Finishing and Other Textile Product
Manufacturing1313p Finishing of textiles
1392p Manufacture of made-up textile articles, except
apparel
1399p Manufacture of other textiles n.e.c.
1709p Manufacture of other articles of paper and pa-
perboard
2100p Manufacture of pharmaceuticals, medicinal
chemical and botanical products
1340 Knitted Product Manufacturing 1391 Manufacture of knitted and crocheted fabrics
1392p Manufacture of made-up textile articles, except
apparel
1410p Manufacture of wearing apparel, except fur ap-
parel
1430 Manufacture of knitted and crocheted apparel
1351 Clothing Manufacturing 1399p Manufacture of other textiles n.e.c.
1410p Manufacture of wearing apparel, except fur ap-
parel
1420p Manufacture of articles of fur
2219p Manufacture of other rubber products
2220p Manufacture of plastics products
3230p Manufacture of sports goods
3290p Other manufacturing n.e.c.
1352 Footwear Manufacturing 1520p Manufacture of footwear
1629p Manufacture of other products of wood; manu-
facture of articles of cork, straw and plaiting materials
2219p Manufacture of other rubber products
2220p Manufacture of plastics products
3230p Manufacture of sports goods
1411 Log Sawmilling 1610p Sawmilling and planing of wood
1412 Wood Chipping 1610p Sawmilling and planing of wood
1413 Timber Resawing and Dressing 1610p Sawmilling and planing of wood
1622p Manufacture of builders’ carpentry and joinery
1491 Prefabricated Wooden Building Manufacturing 1622p Manufacture of builders’ carpentry and joinery
1492 Wooden Structural Fitting and Component
Manufacturing1622p Manufacture of builders’ carpentry and joinery
4330p Building completion and finishing
40

ANZSIC ISIC
1493 Veneer and Plywood Manufacturing1621p Manufacture of veneer sheets and wood-based
panels
1494 Reconstituted Wood Product Manufacturing1621p Manufacture of veneer sheets and wood-based
panels
1499 Other Wood Product Manufacturing n.e.c. 1623 Manufacture of wooden containers
1629p Manufacture of other products of wood; manu-
facture of articles of cork, straw and plaiting materials
3290p Other manufacturing n.e.c.
1510 Pulp, Paper and Paperboard Manufacturing 1701p Manufacture of pulp, paper and paperboard
1521 Corrugated Paperboard and Paperboard Con-
tainer Manufacturing
1702p Manufacture of corrugated paper and paper-
board and of containers of paper and paperboard
1522 Paper Bag Manufacturing1702p Manufacture of corrugated paper and paper-
board and of containers of paper and paperboard
1523 Paper Stationery Manufacturing1709p Manufacture of other articles of paper and pa-
perboard
3240p Manufacture of games and toys
1524 Sanitary Paper Product Manufacturing1709p Manufacture of other articles of paper and pa-
perboard
3250p Manufacture of medical and dental instruments
and supplies
1529 Other Converted Paper Product Manufacturing1709p Manufacture of other articles of paper and pa-
perboard
1611 Printing 1313p Finishing of textiles
1811 Printing
1612 Printing Support Services 1812 Service activities related to printing
1620 Reproduction of Recorded Media 1820 Reproduction of recorded media
1701 Petroleum Refining and Petroleum Fuel
Manufacturing1920p Manufacture of refined petroleum products
1709 Other Petroleum and Coal Product
Manufacturing1910p Manufacture of coke oven products
1920p Manufacture of refined petroleum products
2011p Manufacture of basic chemicals
2029p Manufacture of other chemical products n.e.c.
2399p Manufacture of other non-metallic mineral
products n.e.c.
1811 Industrial Gas Manufacturing 1910p Manufacture of coke oven products
1920p Manufacture of refined petroleum products
2011p Manufacture of basic chemicals
1812 Basic Organic Chemical Manufacturing 1910p Manufacture of coke oven products
2011p Manufacture of basic chemicals
41

ANZSIC ISIC
1813 Basic Inorganic Chemical Manufacturing 2011p Manufacture of basic chemicals
2012p Manufacture of fertilizers and nitrogen com-
pounds
2100p Manufacture of pharmaceuticals, medicinal
chemical and botanical products
1821 Synthetic Resin and Synthetic Rubber
Manufacturing
2013p Manufacture of plastics and synthetic rubber
in primary forms
1829 Other Basic Polymer Manufacturing2013p Manufacture of plastics and synthetic rubber
in primary forms
2030 Manufacture of man-made fibres
1831 Fertiliser Manufacturing2012p Manufacture of fertilizers and nitrogen com-
pounds
3821p Treatment and disposal of non-hazardous
waste
1832 Pesticide Manufacturing2021 Manufacture of pesticides and other agrochem-
ical products
1841 Human Pharmaceutical and Medicinal Product
Manufacturing
2100p Manufacture of pharmaceuticals, medicinal
chemical and botanical products
1842 Veterinary Pharmaceutical and Medicinal Prod-
uct Manufacturing
2100p Manufacture of pharmaceuticals, medicinal
chemical and botanical products
1851 Cleaning Compound Manufacturing
2023p Manufacture of soap and detergents, clean-
ing and polishing preparations, perfumes and toilet
preparations
1852 Cosmetic and Toiletry Preparation Manufactur-
ing
2023p Manufacture of soap and detergents, clean-
ing and polishing preparations, perfumes and toilet
preparations
1891 Photographic Chemical Product Manufacturing 2011p Manufacture of basic chemicals
2029p Manufacture of other chemical products n.e.c.
1892 Explosive Manufacturing 2011p Manufacture of basic chemicals
2012p Manufacture of fertilizers and nitrogen com-
pounds
2029p Manufacture of other chemical products n.e.c.
1899 Other Basic Chemical Product Manufacturing
n.e.c.2011p Manufacture of basic chemicals
2029p Manufacture of other chemical products n.e.c.
1911 Polymer Film and Sheet Packaging Material
Manufacturing2220p Manufacture of plastics products
1912 Rigid and Semi-Rigid Polymer Product
Manufacturing2220p Manufacture of plastics products
2733p Manufacture of wiring devices
3100p Manufacture of furniture
3290p Other manufacturing n.e.c.
42

ANZSIC ISIC
1913 Polymer Foam Product Manufacturing 2220p Manufacture of plastics products
2733p Manufacture of wiring devices
3290p Other manufacturing n.e.c.
4330p Building completion and finishing
1914 Tyre Manufacturing2211 Manufacture of rubber tyres and tubes; retread-
ing and rebuilding of rubber tyres
1915 Adhesive Manufacturing 2029p Manufacture of other chemical products n.e.c.
1916 Paint and Coatings Manufacturing 2011p Manufacture of basic chemicals
2022 Manufacture of paints, varnishes and similar
coatings, printing ink and mastics
2029p Manufacture of other chemical products n.e.c.
1919 Other Polymer Product Manufacturing1410p Manufacture of wearing apparel, except fur ap-
parel
2219p Manufacture of other rubber products
2220p Manufacture of plastics products
2930p Manufacture of parts and accessories for motor
vehicles
3011p Building of ships and floating structures
3290p Other manufacturing n.e.c.
1920 Natural Rubber Product Manufacturing 2219p Manufacture of other rubber products
2010 Glass and Glass Product Manufacturing 2310p Manufacture of glass and glass products
2021 Clay Brick Manufacturing 2392p Manufacture of clay building materials
2029 Other Ceramic Product Manufacturing 2391 Manufacture of refractory products
2392p Manufacture of clay building materials
2393 Manufacture of other porcelain and ceramic
products
2031 Cement and Lime Manufacturing 2394p Manufacture of cement, lime and plaster
2032 Plaster Product Manufacturing 2394p Manufacture of cement, lime and plaster
2395p Manufacture of articles of concrete, cement and
plaster
2033 Ready-Mixed Concrete Manufacturing2395p Manufacture of articles of concrete, cement and
plaster
2034 Concrete Product Manufacturing2395p Manufacture of articles of concrete, cement and
plaster
2090 Other Non-Metallic Mineral Product
Manufacturing
1709p Manufacture of other articles of paper and pa-
perboard
2310p Manufacture of glass and glass products
2395p Manufacture of articles of concrete, cement and
plaster
2396 Cutting, shaping and finishing of stone
2399p Manufacture of other non-metallic mineral
products n.e.c.
43

ANZSIC ISIC
3290p Other manufacturing n.e.c.
2110 Iron Smelting and Steel Manufacturing 2410p Manufacture of basic iron and steel
2599p Manufacture of other fabricated metal prod-
ucts n.e.c.
2121 Iron and Steel Casting 2410p Manufacture of basic iron and steel
2431 Casting of iron and steel
2599p Manufacture of other fabricated metal prod-
ucts n.e.c.
2122 Steel Pipe and Tube Manufacturing 2410p Manufacture of basic iron and steel
2131 Alumina Production2420p Manufacture of basic precious and other non-
ferrous metals
2132 Aluminium Smelting2420p Manufacture of basic precious and other non-
ferrous metals
2133 Copper, Silver, Lead and Zinc Smelting and Re-
fining
2420p Manufacture of basic precious and other non-
ferrous metals
2139 Other Basic Non-Ferrous Metal Manufacturing2420p Manufacture of basic precious and other non-
ferrous metals
2141 Non-Ferrous Metal Casting 2432 Casting of non-ferrous metals
2142 Aluminium Rolling, Drawing, Extruding2420p Manufacture of basic precious and other non-
ferrous metals
2591p Forging, pressing, stamping and roll-forming of
metal; powder metallurgy
2599p Manufacture of other fabricated metal prod-
ucts n.e.c.
2149 Other Basic Non-Ferrous Metal Product Manu-
facturing
2420p Manufacture of basic precious and other non-
ferrous metals
2591p Forging, pressing, stamping and roll-forming of
metal; powder metallurgy
2599p Manufacture of other fabricated metal prod-
ucts n.e.c.
2210 Iron and Steel Forging2591p Forging, pressing, stamping and roll-forming of
metal; powder metallurgy
2221 Structural Steel Fabricating 2511p Manufacture of structural metal products
2222 Prefabricated Metal Building Manufacturing 2511p Manufacture of structural metal products
2223 Architectural Aluminium Product Manufactur-
ing2511p Manufacture of structural metal products
2224 Metal Roof and Guttering Manufacturing (ex-
cept Aluminium)2511p Manufacture of structural metal products
2229 Other Structural Metal Product Manufacturing 2511p Manufacture of structural metal products
2231 Boiler, Tank and Other Heavy Gauge Metal
Container Manufacturing
2512 Manufacture of tanks, reservoirs and containers
of metal
2513p Manufacture of steam generators, except cen-
tral heating hot water boilers
44

ANZSIC ISIC
2239 Other Metal Container Manufacturing2599p Manufacture of other fabricated metal prod-
ucts n.e.c.
2240 Sheet Metal Product Manufacturing (except
Metal Structural and Container Products)2511p Manufacture of structural metal products
2591p Forging, pressing, stamping and roll-forming of
metal; powder metallurgy
2599p Manufacture of other fabricated metal prod-
ucts n.e.c.
2291 Spring and Wire Product Manufacturing2599p Manufacture of other fabricated metal prod-
ucts n.e.c.
3099p Manufacture of other transport equipment
n.e.c.
2292 Nut, Bolt, Screw and Rivet Manufacturing2599p Manufacture of other fabricated metal prod-
ucts n.e.c.
2293 Metal Coating and Finishing 2592 Treatment and coating of metals; machining
2299 Other Fabricated Metal Product Manufacturing
n.e.c.2511p Manufacture of structural metal products
2520 Manufacture of weapons and ammunition
2593p Manufacture of cutlery, hand tools and general
hardware
2599p Manufacture of other fabricated metal prod-
ucts n.e.c.
2811p Manufacture of engines and turbines, except
aircraft, vehicle and cycle engines
2812p Manufacture of fluid power equipment
2813p Manufacture of other pumps, compressors,
taps and valves
3290p Other manufacturing n.e.c.
2311 Motor Vehicle Manufacturing 2910p Manufacture of motor vehicles
2312 Motor Vehicle Body and Trailer Manufacturing2920 Manufacture of bodies (coachwork) for motor
vehicles; manufacture of trailers and semi-trailers
2313 Automotive Electrical Component
Manufacturing2733p Manufacture of wiring devices
2740p Manufacture of electric lighting equipment
2790p Manufacture of other electrical equipment
2930p Manufacture of parts and accessories for motor
vehicles
2319 Other Motor Vehicle Parts Manufacturing2811p Manufacture of engines and turbines, except
aircraft, vehicle and cycle engines
2910p Manufacture of motor vehicles
2930p Manufacture of parts and accessories for motor
vehicles
45

ANZSIC ISIC
2391 Shipbuilding and Repair Services2811p Manufacture of engines and turbines, except
aircraft, vehicle and cycle engines
3011p Building of ships and floating structures
3012p Building of pleasure and sporting boats
3312p Repair of machinery
3315p Repair of transport equipment, except motor
vehicles
3830p Materials recovery
2392 Boatbuilding and Repair Services2811p Manufacture of engines and turbines, except
aircraft, vehicle and cycle engines
3011p Building of ships and floating structures
3012p Building of pleasure and sporting boats
3312p Repair of machinery
3315p Repair of transport equipment, except motor
vehicles
2393 Railway Rolling Stock Manufacturing and Re-
pair Services
2811p Manufacture of engines and turbines, except
aircraft, vehicle and cycle engines
3020p Manufacture of railway locomotives and rolling
stock
3312p Repair of machinery
3315p Repair of transport equipment, except motor
vehicles
2394 Aircraft Manufacturing and Repair Services2651p Manufacture of measuring, testing, navigating
and control equipment
2829p Manufacture of other special-purpose machin-
ery
3030p Manufacture of air and spacecraft and related
machinery
3313p Repair of electronic and optical equipment
3315p Repair of transport equipment, except motor
vehicles
2399 Other Transport Equipment Manufacturing
n.e.c.
2811p Manufacture of engines and turbines, except
aircraft, vehicle and cycle engines
2816p Manufacture of lifting and handling equipment
3011p Building of ships and floating structures
3012p Building of pleasure and sporting boats
3040 Manufacture of military fighting vehicles
3091 Manufacture of motorcycles
3092p Manufacture of bicycles and invalid carriages
3099p Manufacture of other transport equipment
n.e.c.
3100p Manufacture of furniture
46
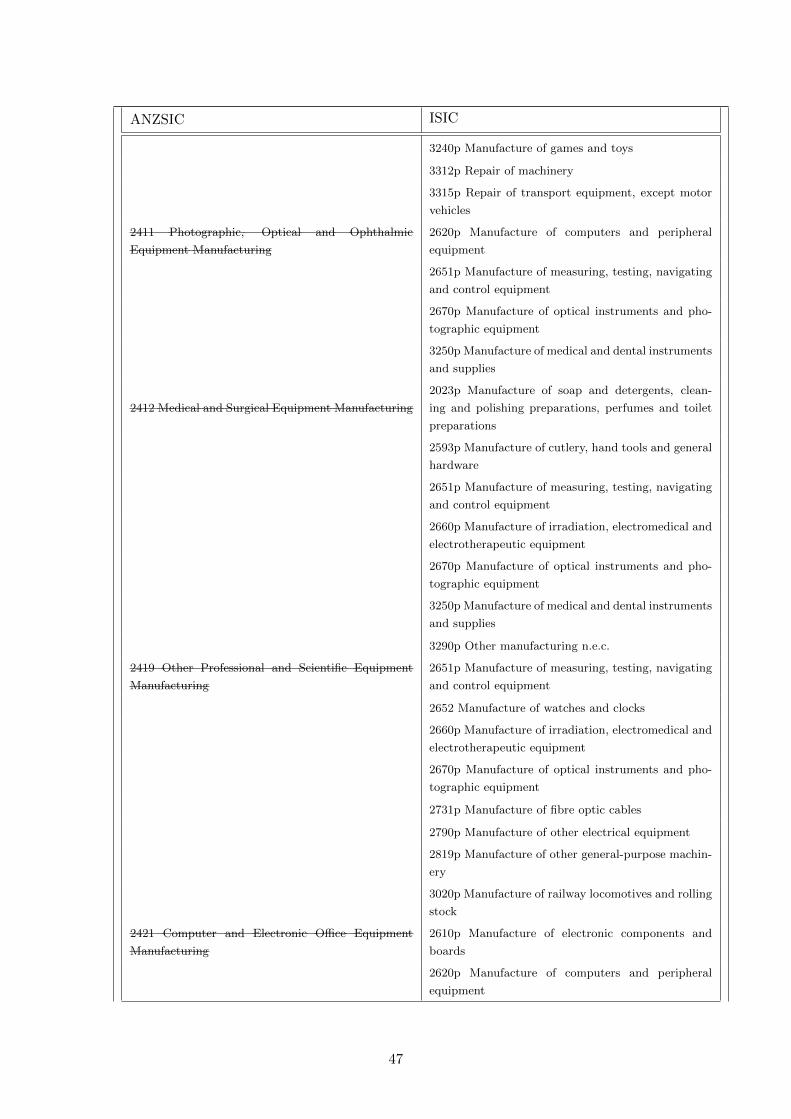
ANZSIC ISIC
3240p Manufacture of games and toys
3312p Repair of machinery
3315p Repair of transport equipment, except motor
vehicles
2411 Photographic, Optical and Ophthalmic
Equipment Manufacturing
2620p Manufacture of computers and peripheral
equipment
2651p Manufacture of measuring, testing, navigating
and control equipment
2670p Manufacture of optical instruments and pho-
tographic equipment
3250p Manufacture of medical and dental instruments
and supplies
2412 Medical and Surgical Equipment Manufacturing
2023p Manufacture of soap and detergents, clean-
ing and polishing preparations, perfumes and toilet
preparations
2593p Manufacture of cutlery, hand tools and general
hardware
2651p Manufacture of measuring, testing, navigating
and control equipment
2660p Manufacture of irradiation, electromedical and
electrotherapeutic equipment
2670p Manufacture of optical instruments and pho-
tographic equipment
3250p Manufacture of medical and dental instruments
and supplies
3290p Other manufacturing n.e.c.
2419 Other Professional and Scientific Equipment
Manufacturing
2651p Manufacture of measuring, testing, navigating
and control equipment
2652 Manufacture of watches and clocks
2660p Manufacture of irradiation, electromedical and
electrotherapeutic equipment
2670p Manufacture of optical instruments and pho-
tographic equipment
2731p Manufacture of fibre optic cables
2790p Manufacture of other electrical equipment
2819p Manufacture of other general-purpose machin-
ery
3020p Manufacture of railway locomotives and rolling
stock
2421 Computer and Electronic Office Equipment
Manufacturing
2610p Manufacture of electronic components and
boards
2620p Manufacture of computers and peripheral
equipment
47

ANZSIC ISIC
2640p Manufacture of consumer electronics
2817p Manufacture of office machinery and equip-
ment (except computers and peripheral equipment)
2422 Communication Equipment Manufacturing2610p Manufacture of electronic components and
boards
2630p Manufacture of communication equipment
2651p Manufacture of measuring, testing, navigating
and control equipment
2670p Manufacture of optical instruments and pho-
tographic equipment
2733p Manufacture of wiring devices
2790p Manufacture of other electrical equipment
2429 Other Electronic Equipment Manufacturing2610p Manufacture of electronic components and
boards
2630p Manufacture of communication equipment
2640p Manufacture of consumer electronics
2651p Manufacture of measuring, testing, navigating
and control equipment
2670p Manufacture of optical instruments and pho-
tographic equipment
2680 Manufacture of magnetic and optical media
2750p Manufacture of domestic appliances
2790p Manufacture of other electrical equipment
2431 Electric Cable and Wire Manufacturing2610p Manufacture of electronic components and
boards
2731p Manufacture of fibre optic cables
2732 Manufacture of other electronic and electric
wires and cables
2790p Manufacture of other electrical equipment
2432 Electric Lighting Equipment Manufacturing 2740p Manufacture of electric lighting equipment
2790p Manufacture of other electrical equipment
2439 Other Electrical Equipment Manufacturing2610p Manufacture of electronic components and
boards
2630p Manufacture of communication equipment
2651p Manufacture of measuring, testing, navigating
and control equipment
2710 Manufacture of electric motors, generators,
transformers and electricity distribution and control
apparatus
2720 Manufacture of batteries and accumulators
2733p Manufacture of wiring devices
48

ANZSIC ISIC
2790p Manufacture of other electrical equipment
2815p Manufacture of ovens, furnaces and furnace
burners
2441 Whiteware Appliance Manufacturing 2750p Manufacture of domestic appliances
2449 Other Domestic Appliance Manufacturing2651p Manufacture of measuring, testing, navigating
and control equipment
2750p Manufacture of domestic appliances
2813p Manufacture of other pumps, compressors,
taps and valves
2815p Manufacture of ovens, furnaces and furnace
burners
2819p Manufacture of other general-purpose machin-
ery
2826p Manufacture of machinery for textile, apparel
and leather production
2451 Pump and Compressor Manufacturing 2812p Manufacture of fluid power equipment
2813p Manufacture of other pumps, compressors,
taps and valves
2452 Fixed Space Heating, Cooling and Ventilation
Equipment Manufacturing
2651p Manufacture of measuring, testing, navigating
and control equipment
2813p Manufacture of other pumps, compressors,
taps and valves
2815p Manufacture of ovens, furnaces and furnace
burners
2819p Manufacture of other general-purpose machin-
ery
2461 Agricultural Machinery and Equipment Manu-
facturing
2821 Manufacture of agricultural and forestry ma-
chinery
2825p Manufacture of machinery for food, beverage
and tobacco processing
2462 Mining and Construction Machinery Manufac-
turing
2824 Manufacture of machinery for mining, quarrying
and construction
2463 Machine Tool and Parts Manufacturing2593p Manufacture of cutlery, hand tools and general
hardware
2818 Manufacture of power-driven hand tools
2819p Manufacture of other general-purpose machin-
ery
2822p Manufacture of metal-forming machinery and
machine tools
2823 Manufacture of machinery for metallurgy
2469 Other Specialised Machinery and Equipment
Manufacturing
2593p Manufacture of cutlery, hand tools and general
hardware
2660p Manufacture of irradiation, electromedical and
electrotherapeutic equipment
49

ANZSIC ISIC
2790p Manufacture of other electrical equipment
2819p Manufacture of other general-purpose machin-
ery
2825p Manufacture of machinery for food, beverage
and tobacco processing
2826p Manufacture of machinery for textile, apparel
and leather production
2829p Manufacture of other special-purpose machin-
ery
2491 Lifting and Material Handling Equipment Man-
ufacturing2816p Manufacture of lifting and handling equipment
2499 Other Machinery and Equipment
Manufacturing n.e.c.
2513p Manufacture of steam generators, except cen-
tral heating hot water boilers
2811p Manufacture of engines and turbines, except
aircraft, vehicle and cycle engines
2812p Manufacture of fluid power equipment
2813p Manufacture of other pumps, compressors,
taps and valves
2814 Manufacture of bearings, gears, gearing and
driving elements
2815p Manufacture of ovens, furnaces and furnace
burners
2819p Manufacture of other general-purpose machin-
ery
2822p Manufacture of metal-forming machinery and
machine tools
2826p Manufacture of machinery for textile, apparel
and leather production
3250p Manufacture of medical and dental instruments
and supplies
2511 Wooden Furniture and Upholstered Seat
Manufacturing
2930p Manufacture of parts and accessories for motor
vehicles
3011p Building of ships and floating structures
3020p Manufacture of railway locomotives and rolling
stock
3030p Manufacture of air and spacecraft and related
machinery
3100p Manufacture of furniture
2512 Metal Furniture Manufacturing2930p Manufacture of parts and accessories for motor
vehicles
3011p Building of ships and floating structures
3020p Manufacture of railway locomotives and rolling
stock
50

ANZSIC ISIC
3030p Manufacture of air and spacecraft and related
machinery
3100p Manufacture of furniture
2513 Mattress Manufacturing 2219p Manufacture of other rubber products
3100p Manufacture of furniture
2519 Other Furniture Manufacturing2817p Manufacture of office machinery and equip-
ment (except computers and peripheral equipment)
3100p Manufacture of furniture
2591 Jewellery and Silverware Manufacturing2599p Manufacture of other fabricated metal prod-
ucts n.e.c.
3211p Manufacture of jewellery and related articles
3212 Manufacture of imitation jewellery and related
articles
2592 Toy, Sporting and Recreational Product
Manufacturing3230p Manufacture of sports goods
3240p Manufacture of games and toys
2599 Other Manufacturing n.e.c.1629p Manufacture of other products of wood; manu-
facture of articles of cork, straw and plaiting materials
1701p Manufacture of pulp, paper and paperboard
2219p Manufacture of other rubber products
2220p Manufacture of plastics products
2599p Manufacture of other fabricated metal prod-
ucts n.e.c.
3220 Manufacture of musical instruments
3240p Manufacture of games and toys
3290p Other manufacturing n.e.c.
51

9.2 Appendix 2
9.2.1 Annual Wage Summary Statistics
52

9.3 Appendix 3
9.3.1 Trade Summary Statistics
Trade (with all countries) Inter-Quartile Range ($USm)
Variable Minimum LowerQuartile
Median UpperQuartile
Maximum
2008 6,745 387,364 1,039,872 3,040,452 23,456,4872009 7,874 343,940 930,084.5 2,810,186 16,875,4582010 16,466 392,698 1,161,039 3,100,455 25,310,5062011 21,271 415,833.5 1,775,210 3,353,217 20,998,5932012 17,982 402,666 1,797,308 3,833,178 25,534,0562013 16,205 420,486.5 1,655,965 3,675,357 24,874,8662008-2013 6,745 392,698 1,441,756 3,104,756 25,534,056
Table 11: Trade (with all countries) Summary Statistics 2008-2013
Trade (with developing countries) Inter-Quartile Range ($USm)
Variable Minimum LowerQuartile
Median UpperQuartile
Maximum
2008 1,007 99,979 272,969 1,015,883 5,416,5462009 658 97,837 286,330 884,561 5,783,0192010 3,357 138,302 373,174 1,095,616 6,789,7612011 8,683 142,728 424,839 1,441,111 6,352,1722012 8,596 149,655 473,600 1,590,859 7,240,8322013 8,057 169,554 485,980 1,592,479 5,891,4522008-2013 658 138,302 351,668 1,239,802 7,240,832
Table 12: Trade (with developing countries) Summary Statistics 2008-2013
Trade (with industrialised countries) Inter-Quartile Range ($USm)
Variable Minimum LowerQuartile
Median UpperQuartile
Maximum
2008 5,738 232,321 564,888 1,889,246 18,174,1232009 7,215 215,613 487,873 1,670,969 13,194,5622010 13,109 207,336 603,181.5 1,860,321 19,507,0782011 12,588 204,947.5 646,552.5 1,978,261 17,245,4602012 9,387 212,685 647,416 2,059,366 20,277,9902013 8,148 202,864.5 648,004 1,985,620 18,983,3002008-2013 5,738 207,336 612,531 1,890,331 20,277,990
Table 13: Trade (with industrialised countries) Summary Statistics 2008-2013
53

9.4 Appendix 4
9.4.1 Pooled OLS - Trade with Developing Countries
Trade with Developing Countries
Variable 1 2 3 4
Quality -0.942*** -0.898*** -0.871*** -0.865***(0.086) (0.077) (0.115) (0.113)
Quality Squared 0.820*** 0.720*** 0.960*** 0.965***(0.101) (0.092) (0.198) (0.200)
Trade 0.025*** 0.030*** 0.031***(0.004) (0.0025) (0.0026)
Quality∗Trade -0.001 -0.015* -0.016*(0.007) (0.0084) (0.0085)
MacroeconomicControls
No No No Yes
Industry Controls No No Yes Yes
Table 14: Pooled OLS - Imports from Developing Countries
*p < 0.10, **p < 0.05 and ***p < 0.01
54

9.5 Appendix 5
9.5.1 Pooled OLS - Trade with Industrialised Countries
Trade with Industrialised Countries
Variable 1 2 3 4
Quality -0.942*** -1.19*** -1.11*** -1.11***(0.086) (0.060) (0.080) (0.082)
Quality Squared 0.820*** 1.161*** 1.33*** 1.34***(0.101) (0.063) (0.119) (0.119)
Trade 0.053*** 0.052*** 0.052***(0.0085) (0.008) (0.008)
Quality∗Trade -0.077*** -0.074*** -0.074***(0.015) (0.014) (0.014)
MacroeconomicControls
No No No Yes
Industry Controls No No Yes Yes
Table 15: Pooled OLS - Imports from Industrialised Countries
*p < 0.10, **p < 0.05 and ***p < 0.01
55

9.6 Appendix 6
9.6.1 IV analysis - Trade with Developing Countries
Trade with Developing Countries
Variable Non-RobustSEs
Heteroskedastic-Robust SEs
Clustered SEs Driscoll-KraaySEs
Quality -0.045 -0.045 -0.045 -0.045(0.117) (0.18) (0.20) (0.20)
Quality Squared -0.033 -0.033 -0.033 -0.033(0.110) (0.16) (0.17) (0.17)
Trade 0.009 0.009 0.009 0.009(0.018) (0.019) (0.020) (0.013)
Quality∗Trade -0.040 -0.040 -0.040 -0.040**(0.024) (0.033) (0.037) (0.016)
MacroeconomicControls
Yes Yes Yes Yes
Industry Controls Yes Yes Yes YesWeak IdentificationTest
Strong IVs at10% level
Strong IVs at10% level
Strong IVs at10% level
Strong IVs at10% level
Sargan Statistic P=0.15 P=0.23 P=0.23 N/AEndogeneity Test P=0.24 P=0.47 P=0.33 N/A
Table 16: IV analysis - Imports from Developing Countries
*p < 0.10, **p < 0.05 and ***p < 0.01
56

9.7 Appendix 7
9.7.1 IV analysis - Trade with Industrialised Countries
Trade with Industrialised Countries
Variable Non-RobustSEs
Heteroskedastic-Robust SEs
Clustered SEs Driscoll-KraaySEs
Quality -0.131 -0.131 -0.131 -0.131(0.112) (0.16) (0.171) (0.168)
Quality Squared 0.061 0.061 0.061 0.061(0.112) (0.15) (0.15) (0.162)
Trade 0.009 0.009 0.009 0.009***(0.006) (0.007) (0.009) (0.002)
Quality∗Trade -0.021** -0.021** -0.021** -0.021***(0.008) (0.009) (0.006) (0.003)
MacroeconomicControls
Yes Yes Yes Yes
Industry Controls Yes Yes Yes YesWeak IdentificationTest
Strong IVs atall levels
Strong IVs atall levels
Strong IVs atall levels
Strong IVs atall levels
Sargan Statistic P=0.31 P=0.36 P=0.53 N/AEndogeneity Test P=0.12 P=0.16 P=0.26 N/A
Table 17: IV analysis - Imports from Industrialised Countries
*p < 0.10, **p < 0.05 and ***p < 0.01
57

9.8 Appendix 8
9.8.1 Fixed Effects - Trade with Developing Countries
Trade with Developing Countries
Variable 1 2 3 4
Quality -0.137 -0.135 -0.196** -0.250*(0.12) (0.121) (0.097) (0.144)
Quality Squared -0.013 0.002 0.056 0.087(0.117) (0.111) (0.096) (0.120)
Trade 0.006*** 0.014*** 0.015***(0.003) (0.004) (0.003)
Quality∗Trade -0.014** -0.022** -0.022*(0.0076) (0.0098) (0.011)
MacroeconomicControls
No No No Yes
Industry Controls No No Yes Yes
Table 18: Fixed Effects - Imports from Developing Countries
*p < 0.10, **p < 0.05 and ***p < 0.01
58

9.9 Appendix 9
9.9.1 Fixed Effects - Trade with Industrialised Countries
Trade with Industrialised Countries
Variable 1 2 3 4
Quality -0.137 -0.139 -0.146 -0.183(0.12) (0.108) (0.097) (0.13)
Quality Squared -0.013 0.065 0.064 0.089(0.117) (0.106) (0.102) (0.125)
Trade 0.008*** 0.008*** 0.009***(0.002) (0.002) (0.0017)
Quality∗Trade -0.017*** -0.015*** -0.016***(0.002) (0.001) (0.0015)
MacroeconomicControls
No No No Yes
Industry Controls No No Yes Yes
Table 19: Fixed Effects - Imports from Industrialised Countries
*p < 0.10, **p < 0.05 and ***p < 0.01
59