interpretation of control charts - hcmut.edu.vnntdung_ise/material/quality...
TRANSCRIPT
1
Page 1
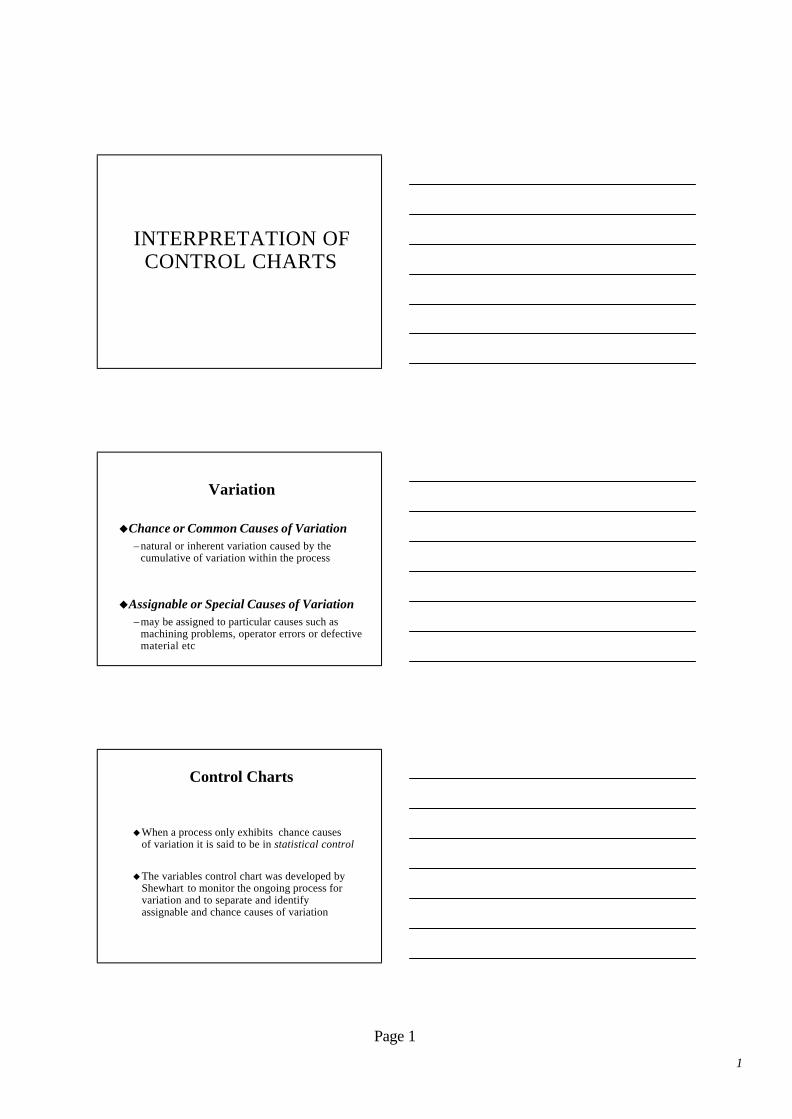
INTERPRETATION OF CONTROL CHARTS
Variation
uChance or Common Causes of Variation– natural or inherent variation caused by the
cumulative of variation within the process
uAssignable or Special Causes of Variation– may be assigned to particular causes such as
machining problems, operator errors or defective material etc
Control Charts
uWhen a process only exhibits chance causes of variation it is said to be in statistical control
uThe variables control chart was developed by Shewhart to monitor the ongoing process for variation and to separate and identify assignable and chance causes of variation
2
Page 2
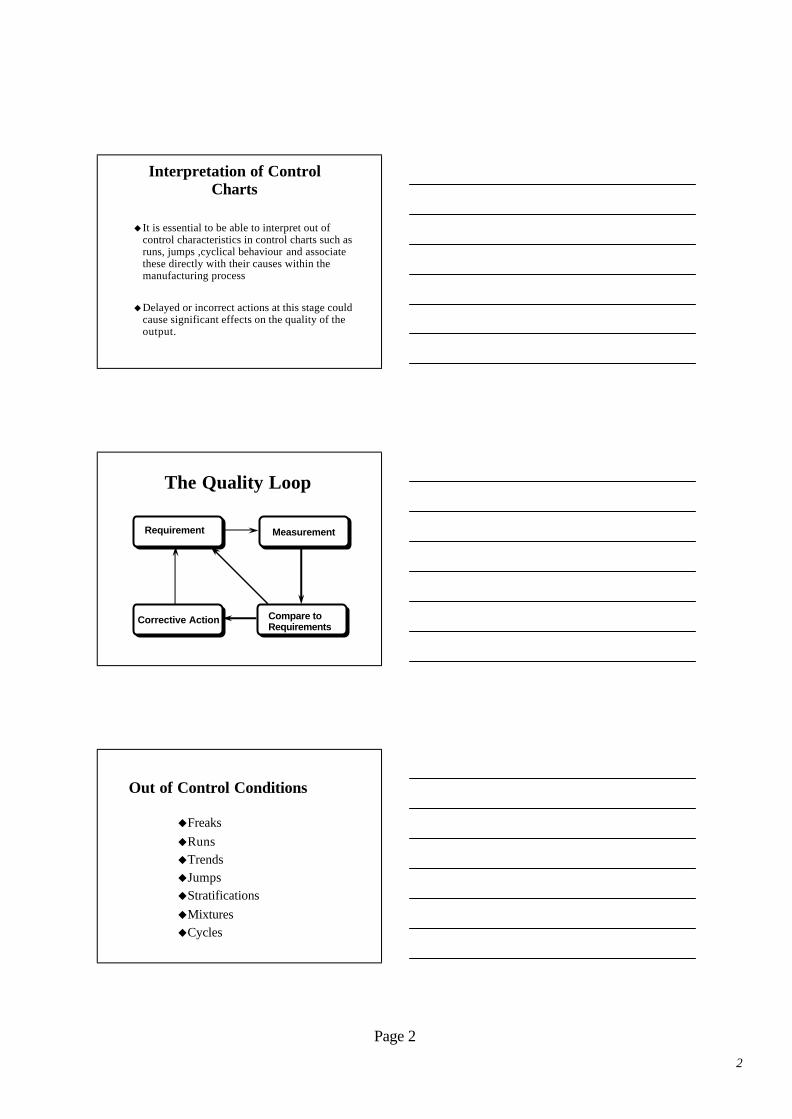
Interpretation of Control Charts
u It is essential to be able to interpret out of control characteristics in control charts such as runs, jumps ,cyclical behaviour and associate these directly with their causes within the manufacturing process
uDelayed or incorrect actions at this stage could cause significant effects on the quality of the output.
The Quality Loop
Requirement Measurement
Corrective Action Compare to Requirements
Out of Control Conditions
uFreaksuRunsuTrendsuJumpsuStratificationsuMixturesuCycles
3
Page 3
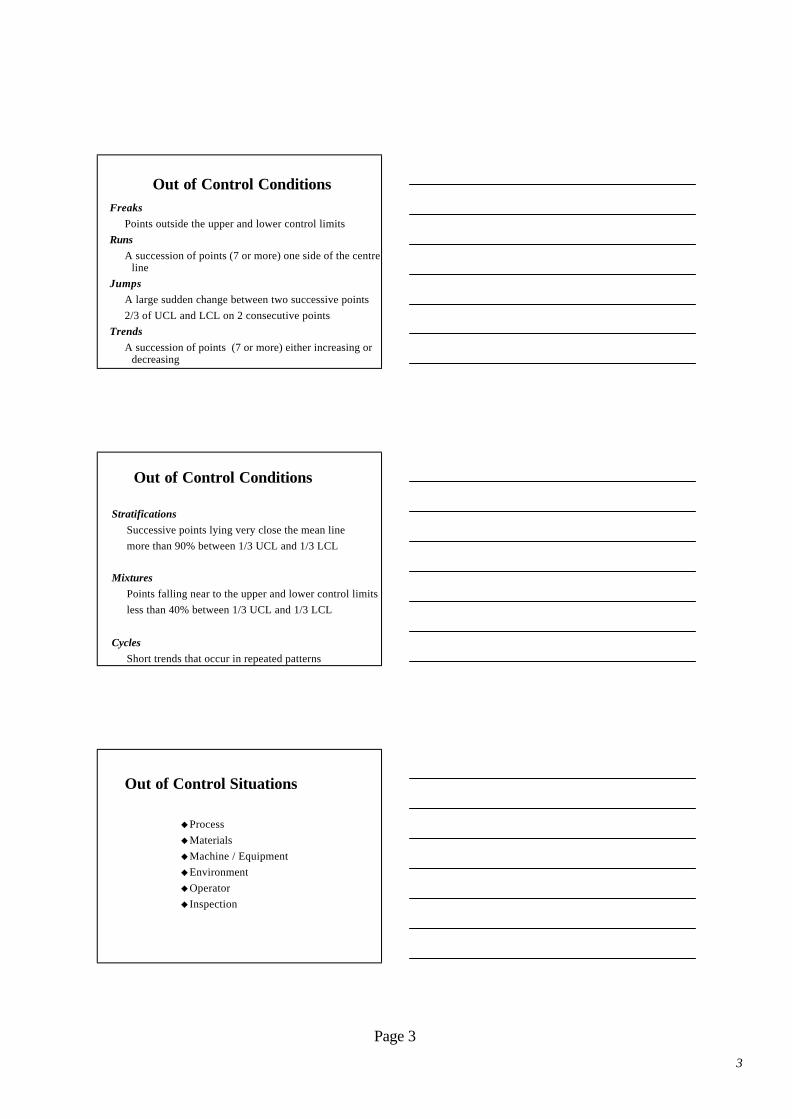
Out of Control ConditionsFreaks
Points outside the upper and lower control limitsRuns
A succession of points (7 or more) one side of the centre line
JumpsA large sudden change between two successive points2/3 of UCL and LCL on 2 consecutive points
TrendsA succession of points (7 or more) either increasing or
decreasing
Out of Control Conditions
StratificationsSuccessive points lying very close the mean linemore than 90% between 1/3 UCL and 1/3 LCL
Mixtures Points falling near to the upper and lower control limitsless than 40% between 1/3 UCL and 1/3 LCL
CyclesShort trends that occur in repeated patterns
Out of Control Situations
uProcessuMaterialsuMachine / EquipmentuEnvironmentuOperatoru Inspection
4
Page 4
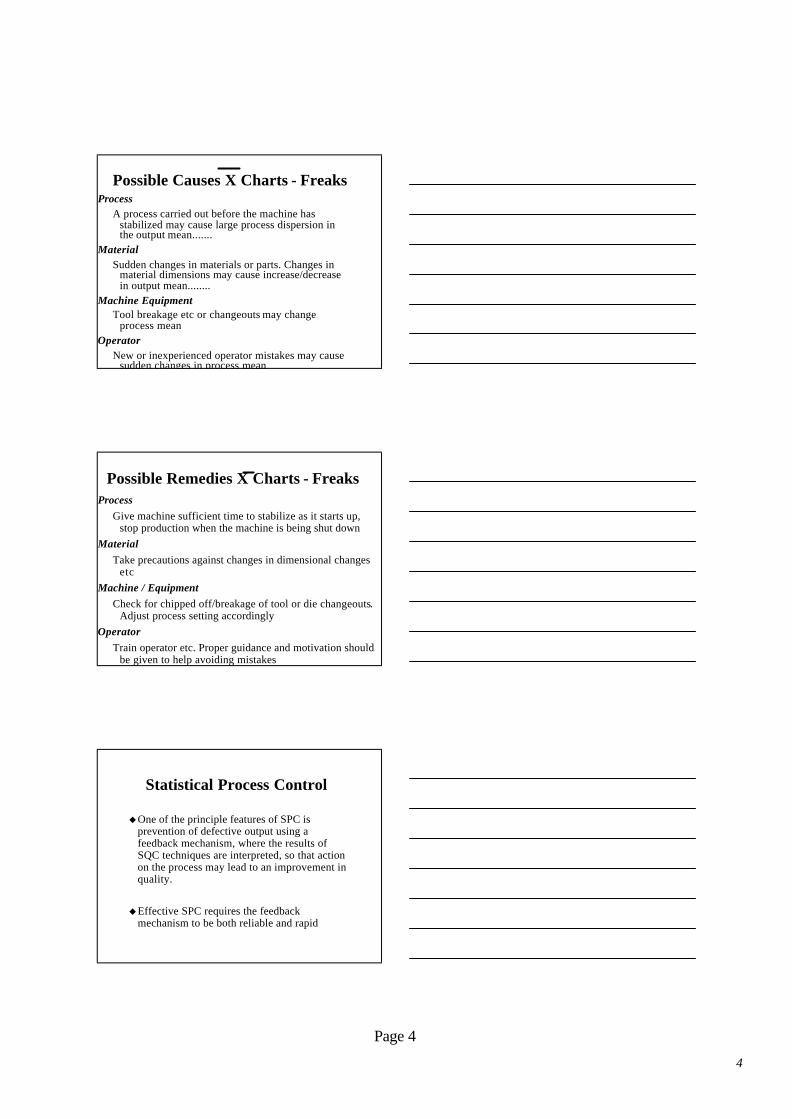
Possible Causes X Charts - FreaksProcess
A process carried out before the machine has stabilized may cause large process dispersion in the output mean.......
MaterialSudden changes in materials or parts. Changes in
material dimensions may cause increase/decrease in output mean........
Machine EquipmentTool breakage etc or changeouts may change
process meanOperator
New or inexperienced operator mistakes may cause sudden changes in process mean
Possible Remedies X Charts - FreaksProcess
Give machine sufficient time to stabilize as it starts up, stop production when the machine is being shut down
MaterialTake precautions against changes in dimensional changes
etcMachine / Equipment
Check for chipped off/breakage of tool or die changeouts. Adjust process setting accordingly
OperatorTrain operator etc. Proper guidance and motivation should
be given to help avoiding mistakes
Statistical Process Control
uOne of the principle features of SPC is prevention of defective output using a feedback mechanism, where the results of SQC techniques are interpreted, so that action on the process may lead to an improvement in quality.
uEffective SPC requires the feedback mechanism to be both reliable and rapid
5
Page 5
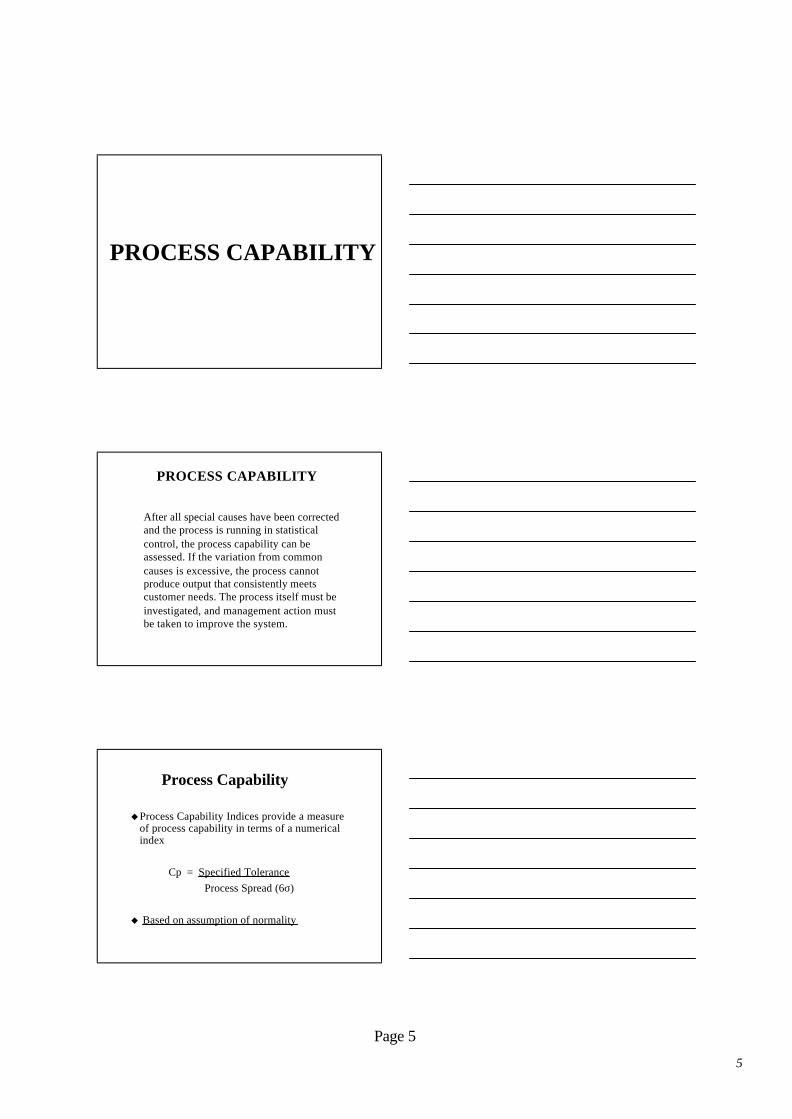
PROCESS CAPABILITY
After all special causes have been corrected and the process is running in statistical control, the process capability can be assessed. If the variation from common causes is excessive, the process cannot produce output that consistently meets customer needs. The process itself must be investigated, and management action must be taken to improve the system.
PROCESS CAPABILITY
Process Capability
uProcess Capability Indices provide a measure of process capability in terms of a numerical index
Cp = Specified ToleranceProcess Spread (6σ)
u Based on assumption of normality
6
Page 6
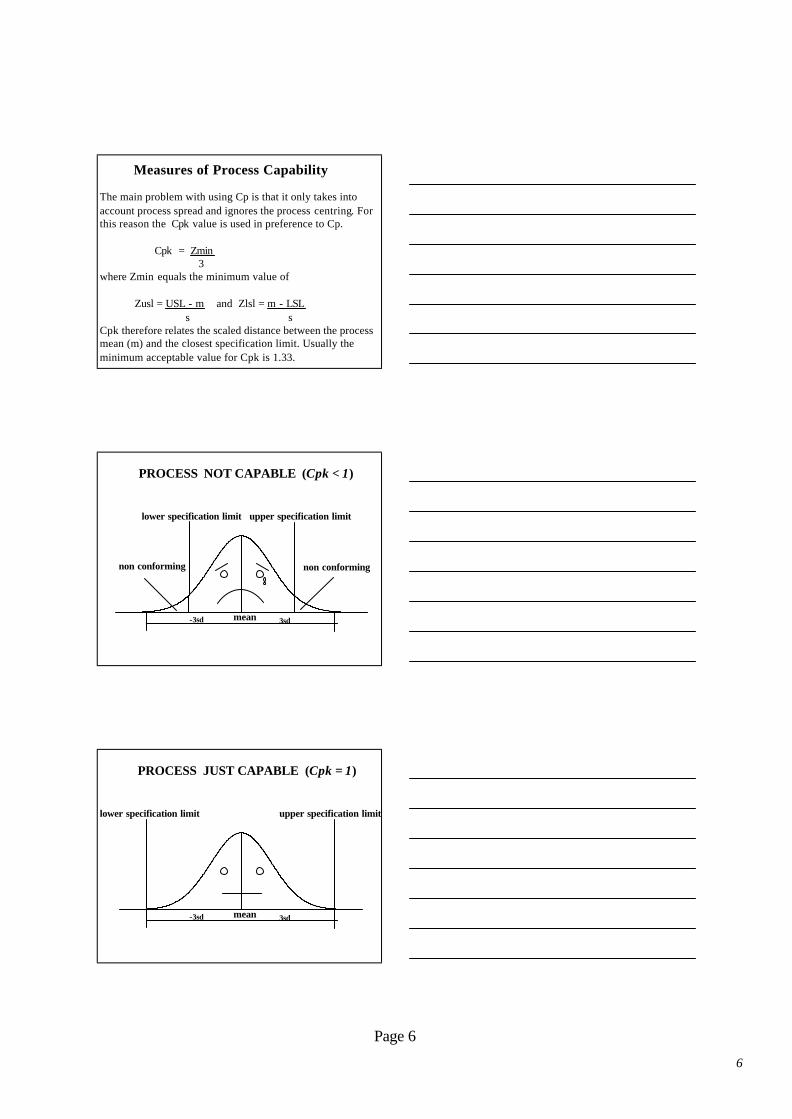
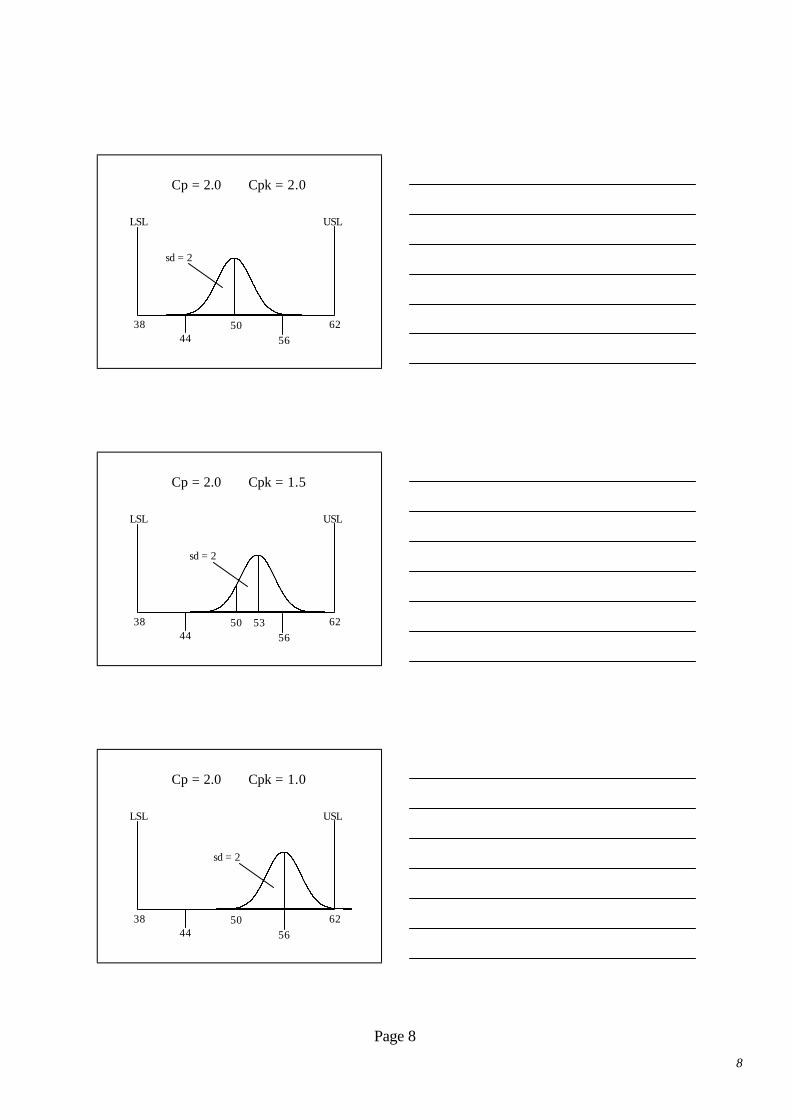
The main problem with using Cp is that it only takes into account process spread and ignores the process centring. For this reason the Cpk value is used in preference to Cp.
Cpk = Zmin3
where Zmin equals the minimum value of
Zusl = USL - m and Zlsl = m - LSLs s
Cpk therefore relates the scaled distance between the process mean (m) and the closest specification limit. Usually the minimum acceptable value for Cpk is 1.33.
Measures of Process Capability
PROCESS NOT CAPABLE (Cpk < 1)
lower specification limit upper specification limit
mean-3sd 3sd
non conforming non conforming
PROCESS JUST CAPABLE (Cpk = 1)
lower specification limit upper specification limit
mean-3sd 3sd
7
Page 7
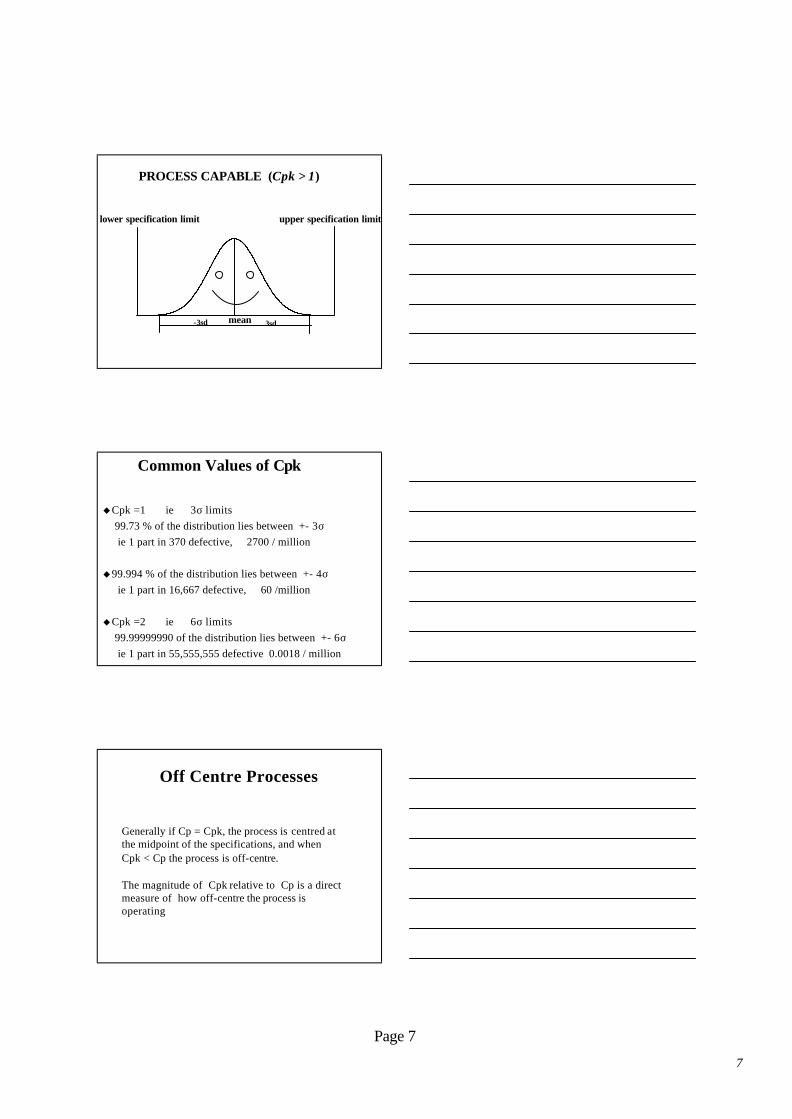
PROCESS CAPABLE (Cpk > 1)
lower specification limit upper specification limit
mean-3sd 3sd
Common Values of Cpk
uCpk =1 ie 3σ limits99.73 % of the distribution lies between +- 3σ ie 1 part in 370 defective, 2700 / million
u99.994 % of the distribution lies between +- 4σ ie 1 part in 16,667 defective, 60 /million
uCpk =2 ie 6σ limits99.99999990 of the distribution lies between +- 6σ ie 1 part in 55,555,555 defective 0.0018 / million
Off Centre Processes
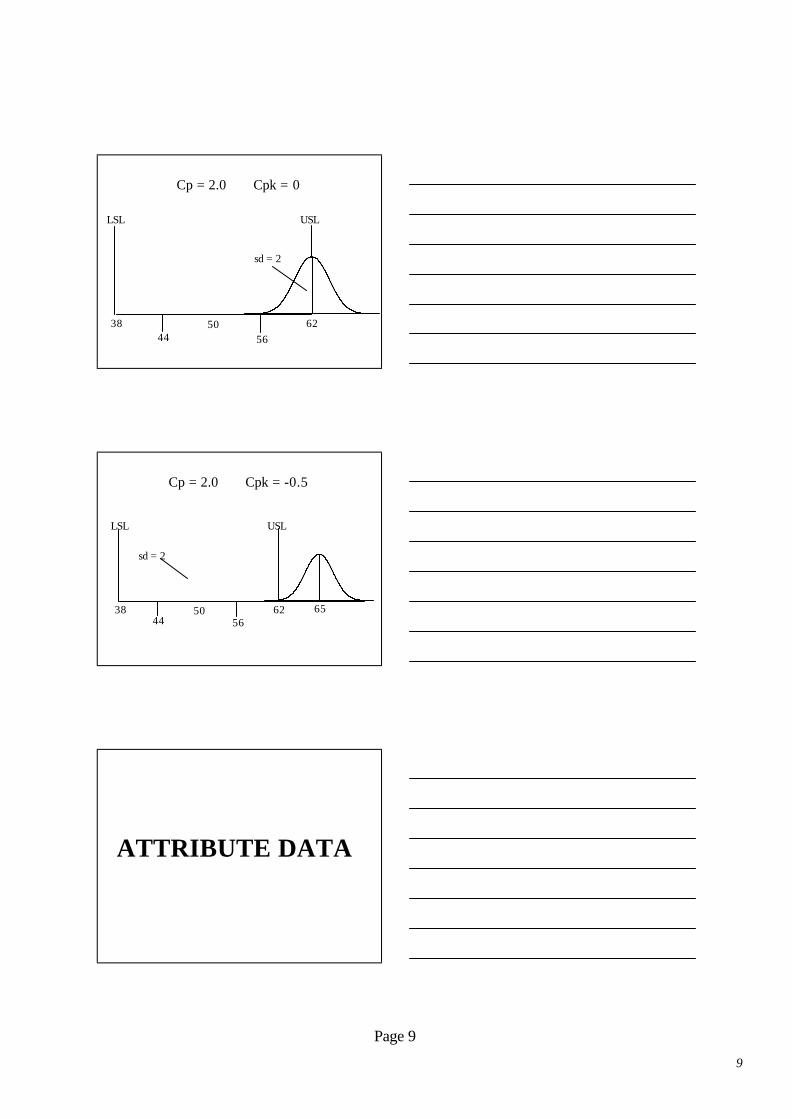
Generally if Cp = Cpk, the process is centred at the midpoint of the specifications, and when Cpk < Cp the process is off-centre.
The magnitude of Cpk relative to Cp is a direct measure of how off-centre the process is operating
8
Page 8
LSL USL
sd = 2
3844 56
6250
Cp = 2.0 Cpk = 2.0
LSL USL
sd = 2
3844 56
6250
Cp = 2.0 Cpk = 1.5
53
LSL USL
sd = 2
3844 56
6250
Cp = 2.0 Cpk = 1.0
9
Page 9
Cp = 2.0 Cpk = 0
LSL USL
sd = 2
3844 56
6250
Cp = 2.0 Cpk = -0.5
LSL USL
sd = 2
3844 56
6250 65
ATTRIBUTE DATA
10
Page 10
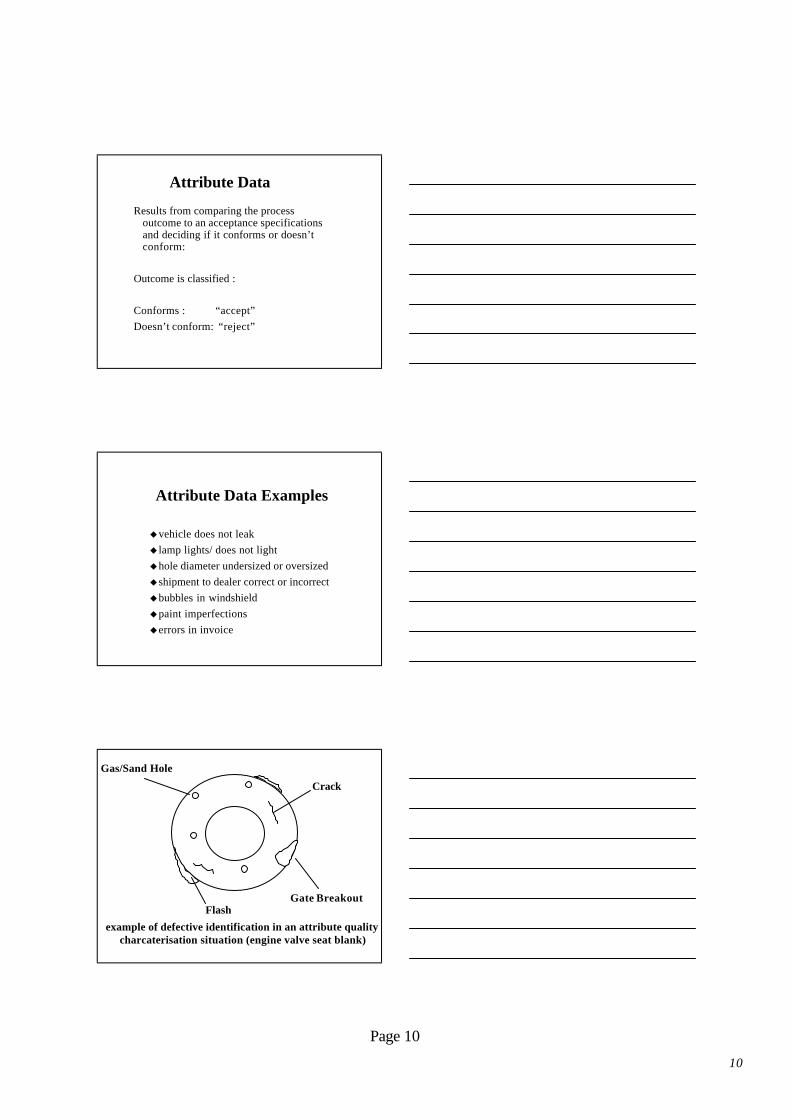
Attribute Data
Results from comparing the process outcome to an acceptance specifications and deciding if it conforms or doesn’t conform:
Outcome is classified :
Conforms : “accept” Doesn’t conform: “reject”
Attribute Data Examples
uvehicle does not leaku lamp lights/ does not lightuhole diameter undersized or oversized ushipment to dealer correct or incorrectububbles in windshieldupaint imperfectionsuerrors in invoice
Crack
Gate Breakout
Gas/Sand Hole
Flash
example of defective identification in an attribute quality charcaterisation situation (engine valve seat blank)
11
Page 11
Cracks =Holes =Flash =Gate Breakout =
3611
3 Cracks Number of defects = 6 Holes Number of Defectives =1 Flash Fraction Defective =1 Gate Breakout Number of defects/ unit =
1166/10 = 0.611/10 = 1.1
Attribute Control Charts
uThere are four types of attribute control chart:
uControl Chart for Fraction of Defective Items (p chart)
uControl Chart for Number of Defective Items (np chart)
uControl Chart for Number of Defects per Unit (u chart)
uControl Chart for Number of Defects per Sample (c chart)
12
Page 12
Attribute Control Charts
uThe p chart (varied sample size - defective)
uThe np chart (constant sample size defective)
uThe u chart (varied sample size - defects)
uThe c chart (constant sample size defects)
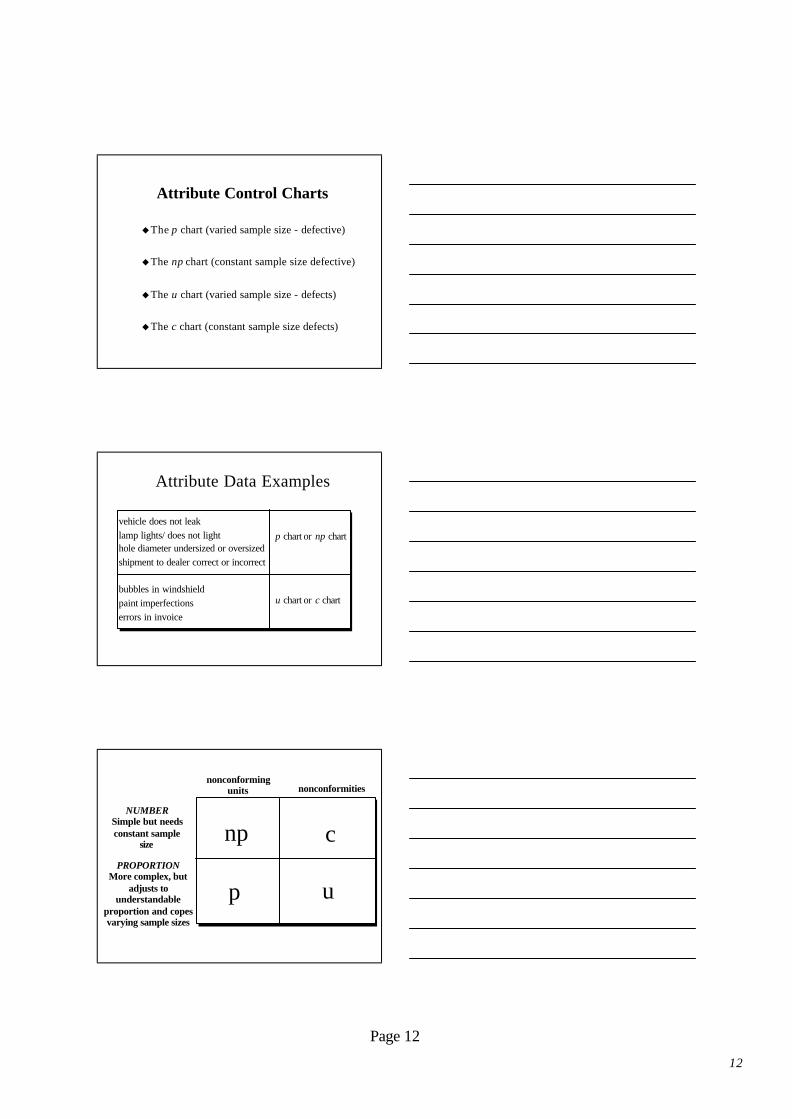
vehicle does not leaklamp lights/ does not lighthole diameter undersized or oversized shipment to dealer correct or incorrect
bubbles in windshieldpaint imperfectionserrors in invoice
p chart or np chart
u chart or c chart
Attribute Data Examples
np c
p u
nonconforming units nonconformities
NUMBERSimple but needs constant sample
size
PROPORTIONMore complex, but
adjusts to understandable
proportion and copes varying sample sizes
13
Page 13
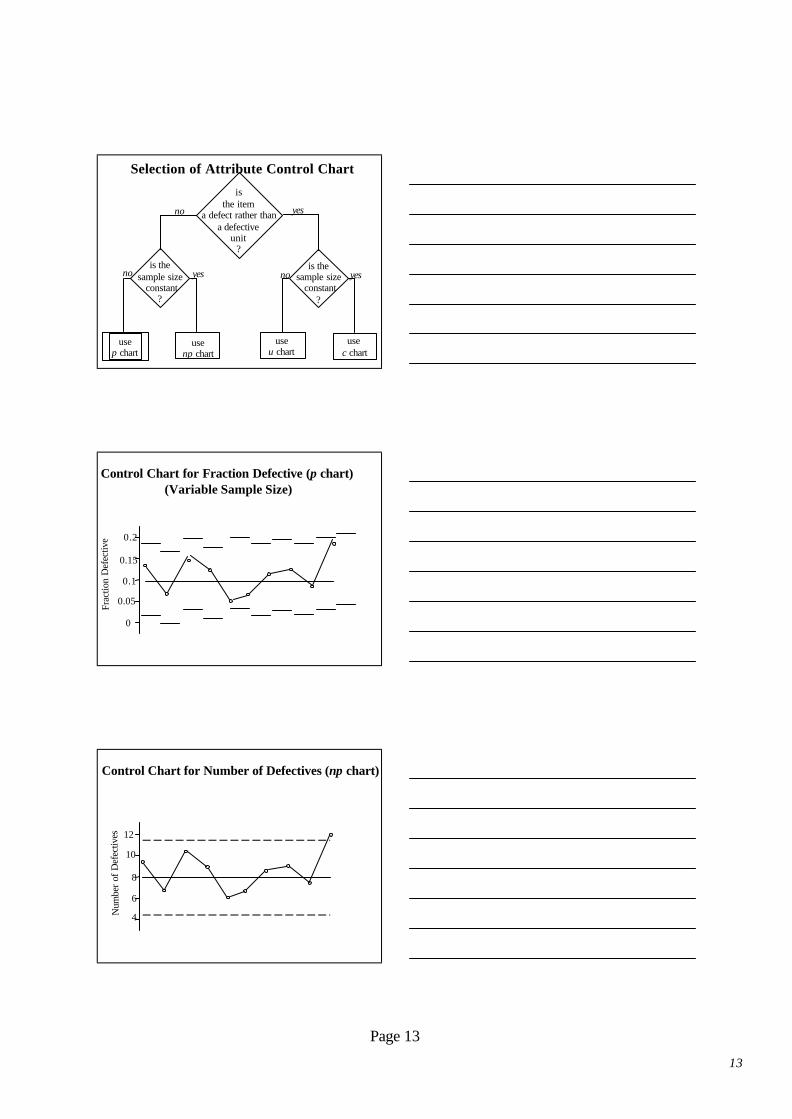
Selection of Attribute Control Chart
is the item
a defect rather than a defective
unit?
is the sample size
constant ?
is the sample size
constant ?
use p chart
use np chart
use c chart
use u chart
no
no
yes
yes no yes
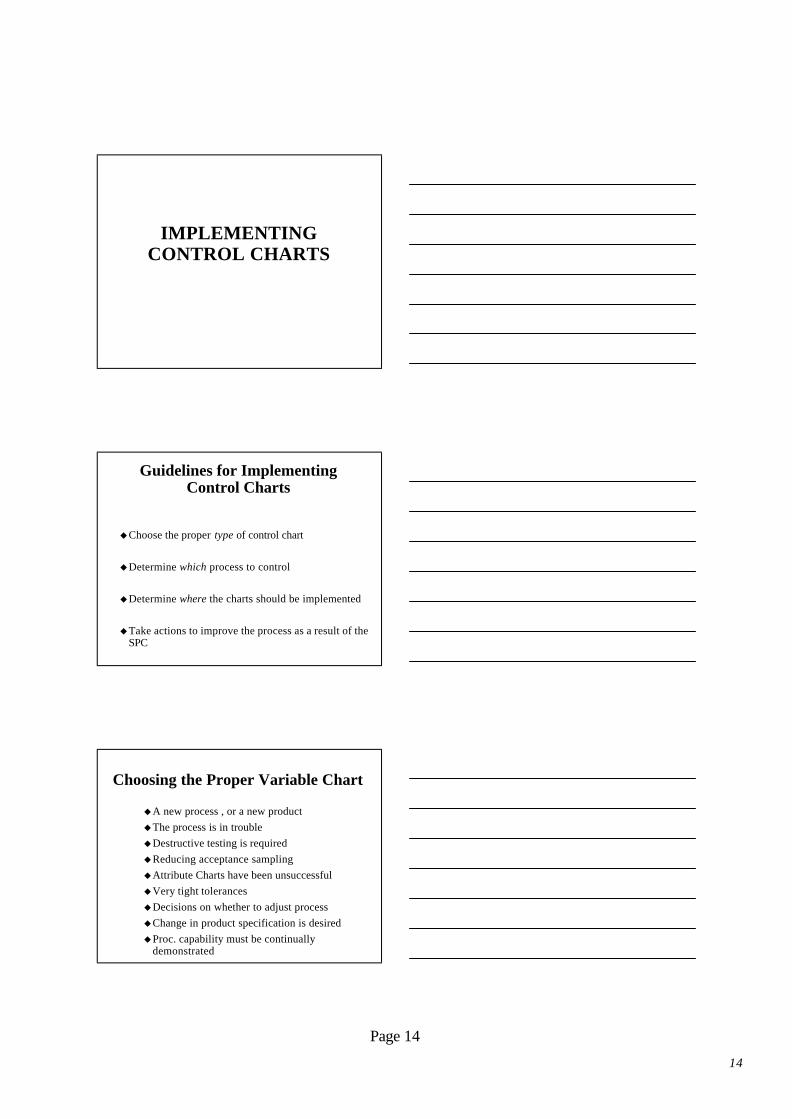
0.1
0.15
0.2
0.05
0
Frac
tion
Def
ectiv
e
Control Chart for Fraction Defective (p chart)(Variable Sample Size)
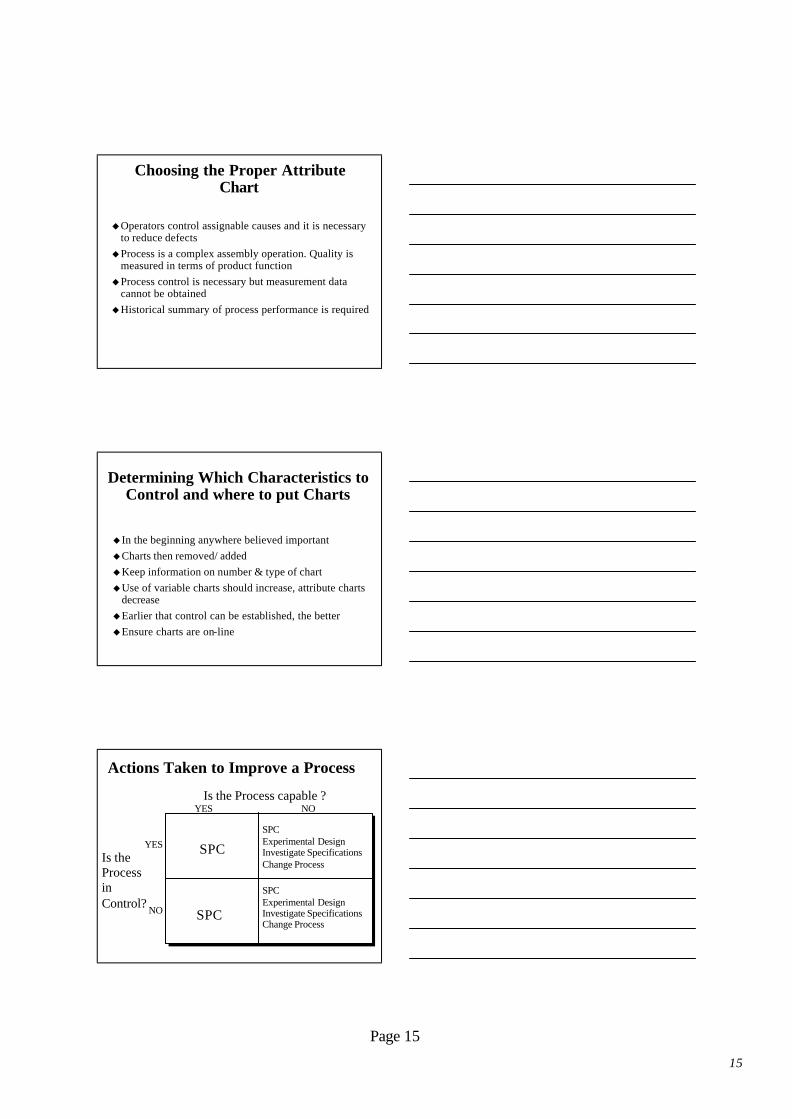
8
10
12
6
4Num
ber o
f Def
ectiv
es
Control Chart for Number of Defectives (np chart)
14
Page 14
IMPLEMENTING CONTROL CHARTS
Guidelines for Implementing Control Charts
uChoose the proper type of control chart
uDetermine which process to control
uDetermine where the charts should be implemented
uTake actions to improve the process as a result of the SPC
Choosing the Proper Variable Chart
uA new process , or a new productuThe process is in troubleuDestructive testing is requireduReducing acceptance samplinguAttribute Charts have been unsuccessfuluVery tight tolerancesuDecisions on whether to adjust processuChange in product specification is desireduProc. capability must be continually
demonstrated
15
Page 15
Choosing the Proper Attribute Chart
uOperators control assignable causes and it is necessary to reduce defects
uProcess is a complex assembly operation. Quality is measured in terms of product function
uProcess control is necessary but measurement data cannot be obtained
uHistorical summary of process performance is required
Determining Which Characteristics to Control and where to put Charts
u In the beginning anywhere believed importantuCharts then removed/ added uKeep information on number & type of chartuUse of variable charts should increase, attribute charts
decreaseuEarlier that control can be established, the betteruEnsure charts are on-line
Actions Taken to Improve a Process
SPC
SPC
SPCExperimental DesignInvestigate SpecificationsChange Process
SPCExperimental DesignInvestigate SpecificationsChange Process
Is the Process capable ?
Is the Process in Control? NO
YES
YES NO
16
Page 16
Control Charts for Individuals
u Inconvenient or impossible to obtain more than one measurement per sample (or repeat measurements will differ)
uAutomated testing and inspection technology used allowing measurement of every unit produced
uWaiting for large amounts of data may be impractical
ADVANCED CHARTING
TECHNIQUES
CUSUM CHARTS
uPrimary used to maintain control over ongoing process
uBetter than standard charts in picking up small shifts in process mean
uEasier to determine point at which shift occurred
ucumulative sum plotted rather then individual values
17
Page 17
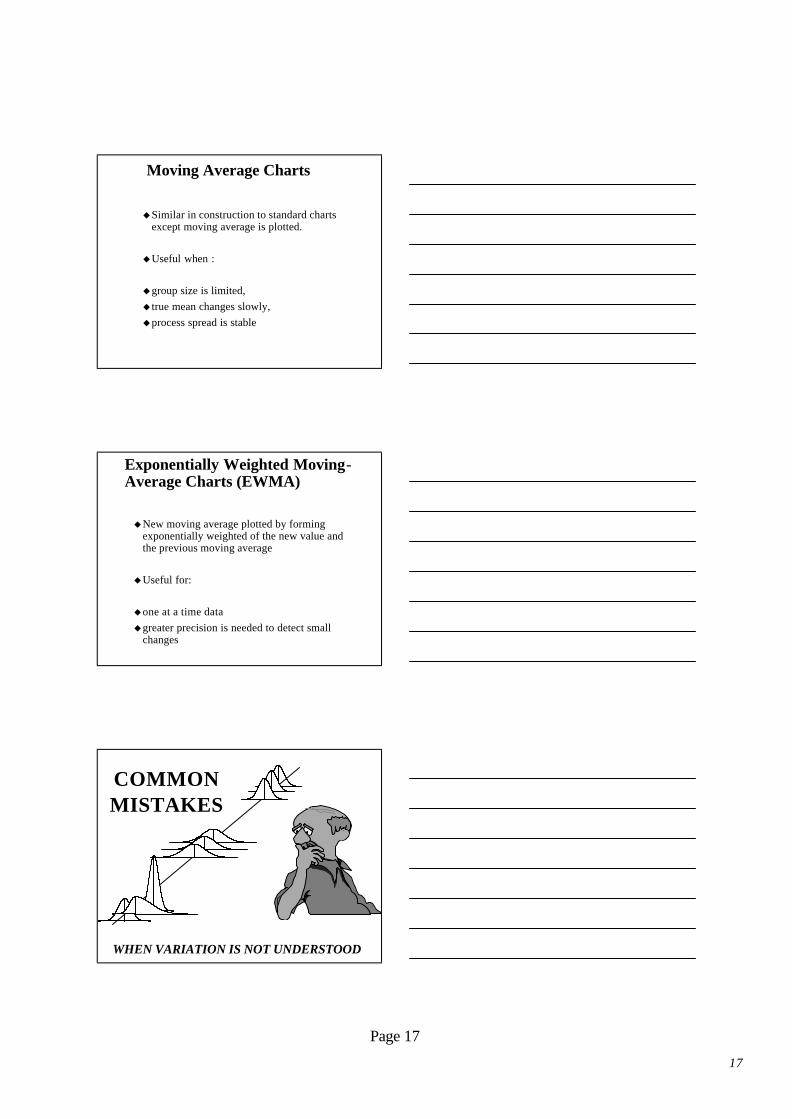
Moving Average Charts
uSimilar in construction to standard charts except moving average is plotted.
uUseful when :
ugroup size is limited, u true mean changes slowly, uprocess spread is stable
Exponentially Weighted Moving-Average Charts (EWMA)
uNew moving average plotted by forming exponentially weighted of the new value and the previous moving average
uUseful for:
uone at a time dataugreater precision is needed to detect small
changes
COMMON MISTAKES
WHEN VARIATION IS NOT UNDERSTOOD
18
Page 18
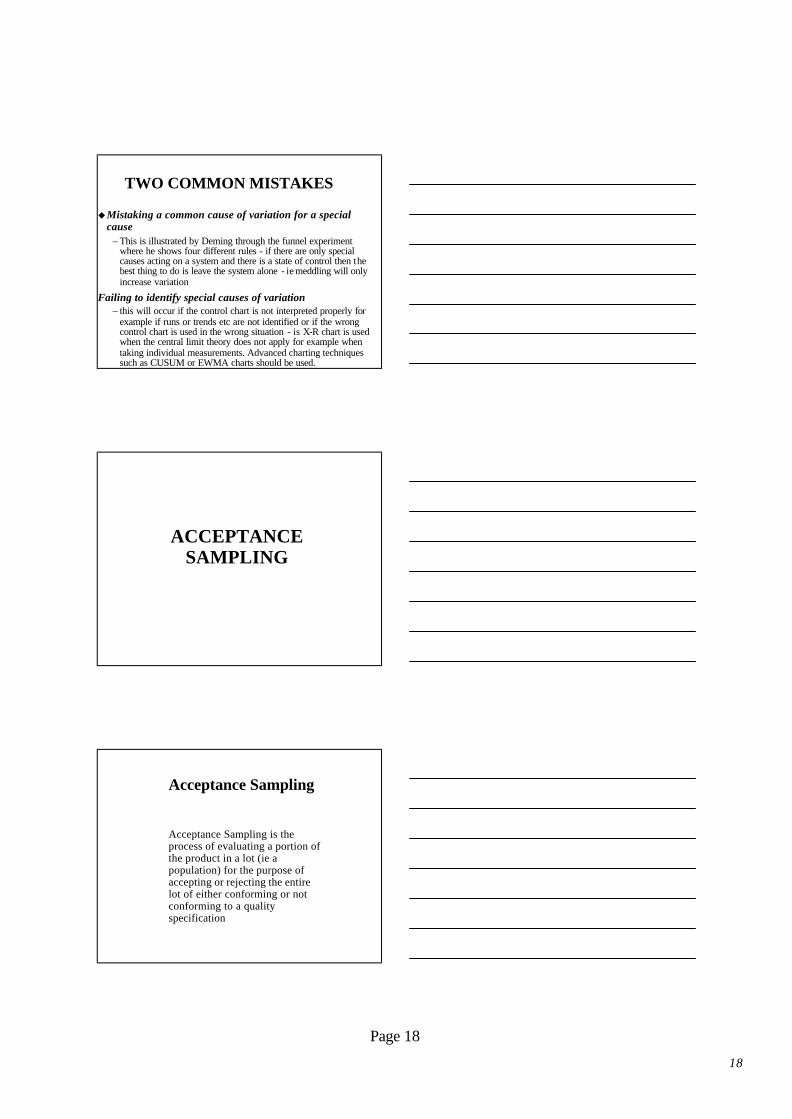
TWO COMMON MISTAKES
uMistaking a common cause of variation for a special cause
– This is illustrated by Deming through the funnel experiment where he shows four different rules - if there are only special causes acting on a system and there is a state of control then the best thing to do is leave the system alone - ie meddling will only increase variation
Failing to identify special causes of variation – this will occur if the control chart is not interpreted properly for
example if runs or trends etc are not identified or if the wrongcontrol chart is used in the wrong situation - is X-R chart is used when the central limit theory does not apply for example when taking individual measurements. Advanced charting techniques such as CUSUM or EWMA charts should be used.
ACCEPTANCE SAMPLING
Acceptance Sampling
Acceptance Sampling is the process of evaluating a portion of the product in a lot (ie a population) for the purpose of accepting or rejecting the entire lot of either conforming or not conforming to a quality specification
19
Page 19
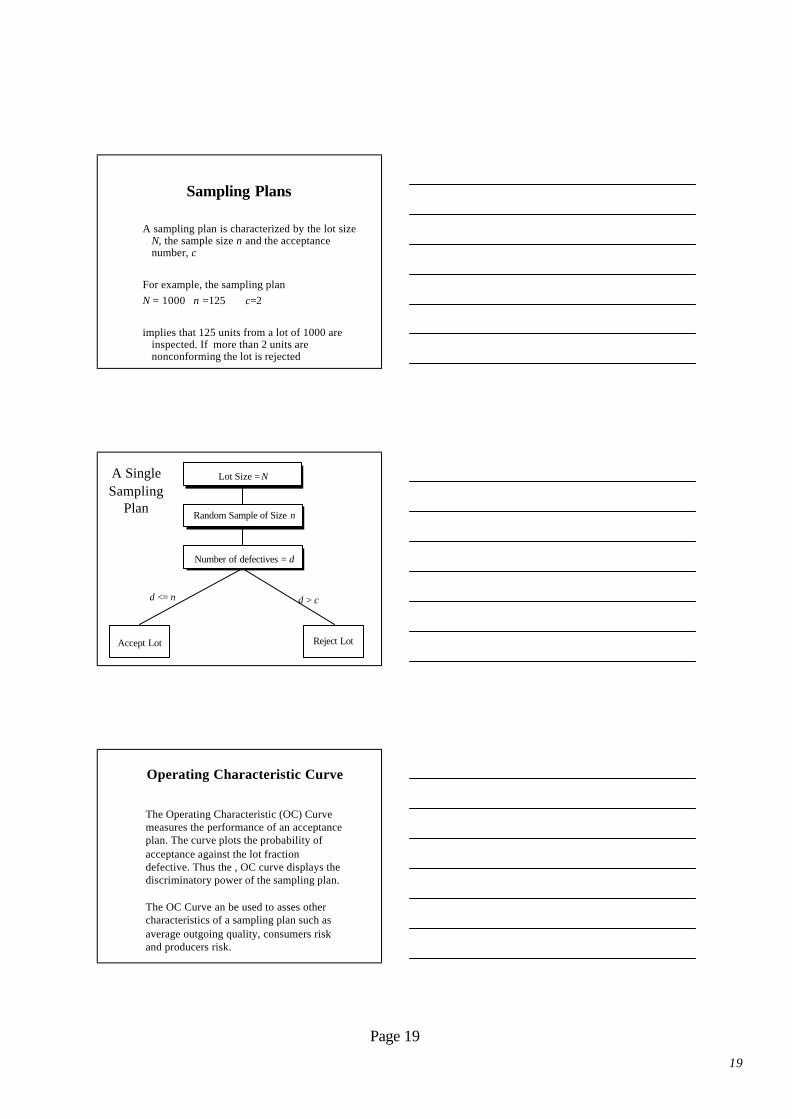
Sampling Plans
A sampling plan is characterized by the lot size N, the sample size n and the acceptance number, c
For example, the sampling planN = 1000 n =125 c=2
implies that 125 units from a lot of 1000 are inspected. If more than 2 units are nonconforming the lot is rejected
Lot Size = N
Random Sample of Size n
Number of defectives = d
Accept Lot Reject Lot
d <= n d > c
A Single Sampling
Plan
Operating Characteristic Curve
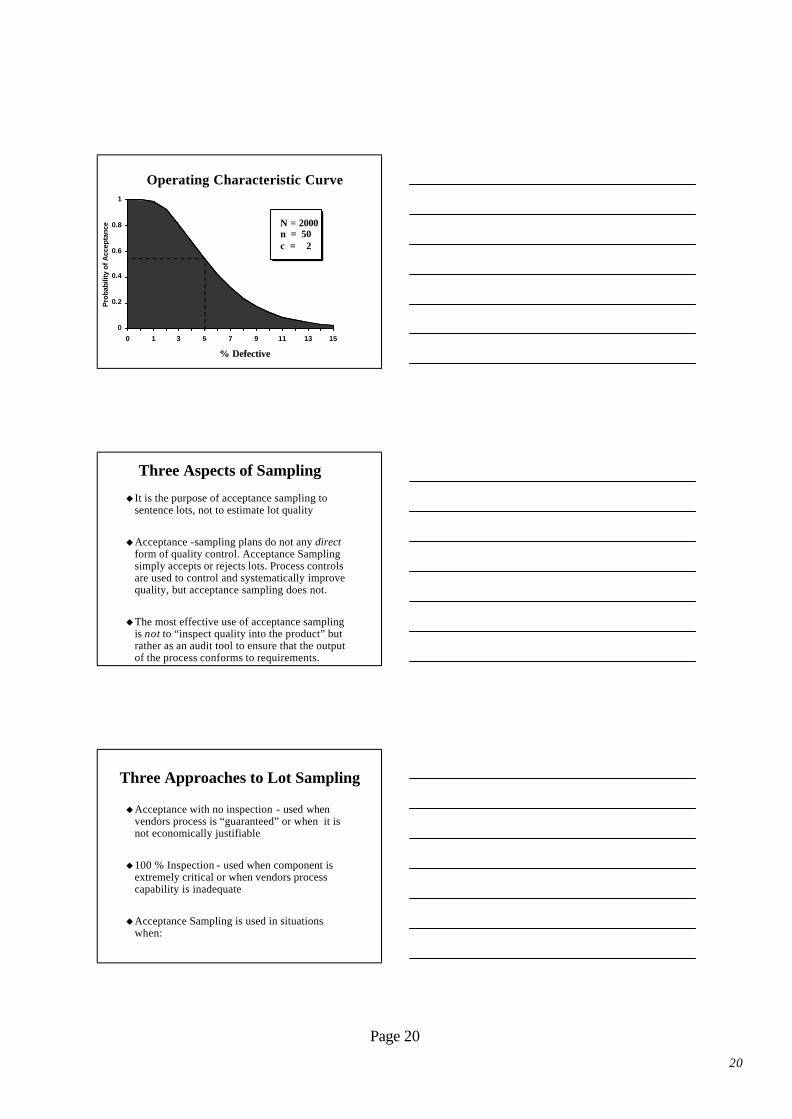
The Operating Characteristic (OC) Curve measures the performance of an acceptance plan. The curve plots the probability of acceptance against the lot fraction defective. Thus the , OC curve displays the discriminatory power of the sampling plan.
The OC Curve an be used to asses other characteristics of a sampling plan such as average outgoing quality, consumers risk and producers risk.
20
Page 20
0
0.2
0.4
0.6
0.8
1
0 1 3 5 7 9 11 13 15
Pro
babi
lity
of A
ccep
tanc
e
Operating Characteristic Curve
% Defective
N = 2000n = 50c = 2
Three Aspects of Sampling
u It is the purpose of acceptance sampling to sentence lots, not to estimate lot quality
uAcceptance -sampling plans do not any directform of quality control. Acceptance Sampling simply accepts or rejects lots. Process controls are used to control and systematically improve quality, but acceptance sampling does not.
uThe most effective use of acceptance sampling is not to “inspect quality into the product” but rather as an audit tool to ensure that the output of the process conforms to requirements.
Three Approaches to Lot Sampling
uAcceptance with no inspection - used when vendors process is “guaranteed” or when it is not economically justifiable
u100 % Inspection - used when component is extremely critical or when vendors process capability is inadequate
uAcceptance Sampling is used in situations when:
21
Page 21
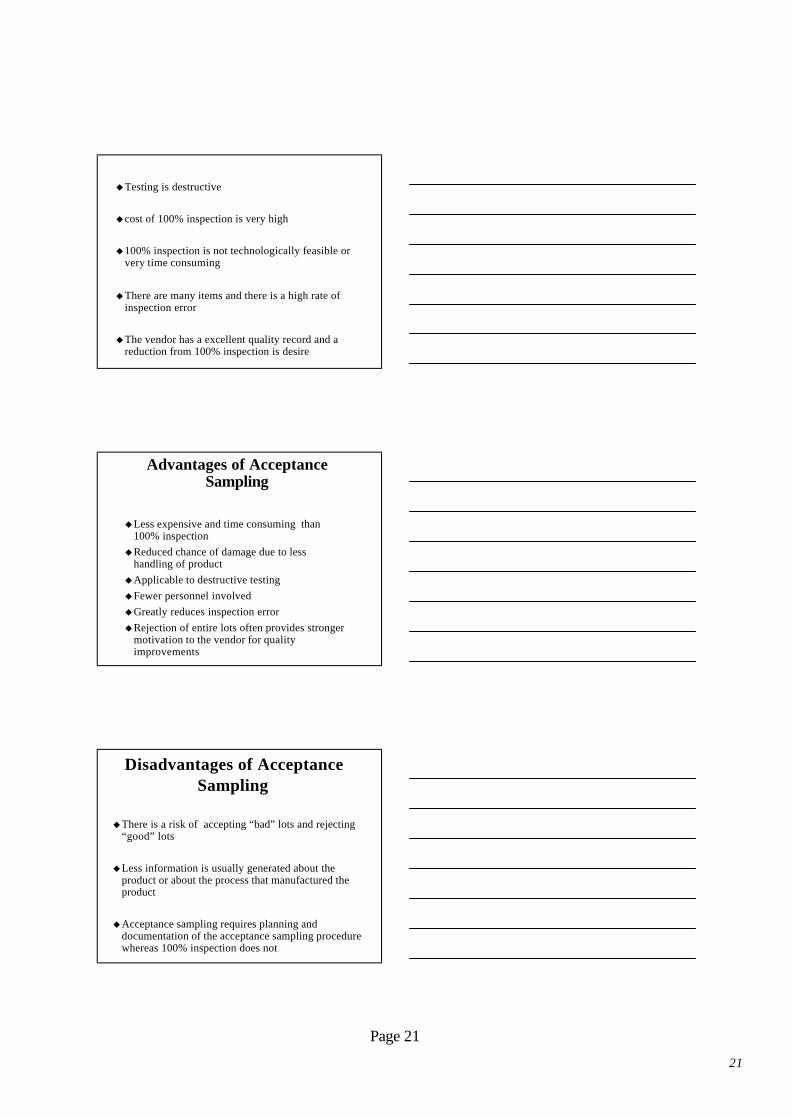
uTesting is destructive
ucost of 100% inspection is very high
u100% inspection is not technologically feasible or very time consuming
uThere are many items and there is a high rate of inspection error
uThe vendor has a excellent quality record and a reduction from 100% inspection is desire
Advantages of Acceptance Sampling
uLess expensive and time consuming than 100% inspection
uReduced chance of damage due to less handling of product
uApplicable to destructive testinguFewer personnel involveduGreatly reduces inspection erroruRejection of entire lots often provides stronger
motivation to the vendor for quality improvements
uThere is a risk of accepting “bad” lots and rejecting “good” lots
uLess information is usually generated about the product or about the process that manufactured the product
uAcceptance sampling requires planning and documentation of the acceptance sampling procedure whereas 100% inspection does not
Disadvantages of Acceptance Sampling
22
Page 22
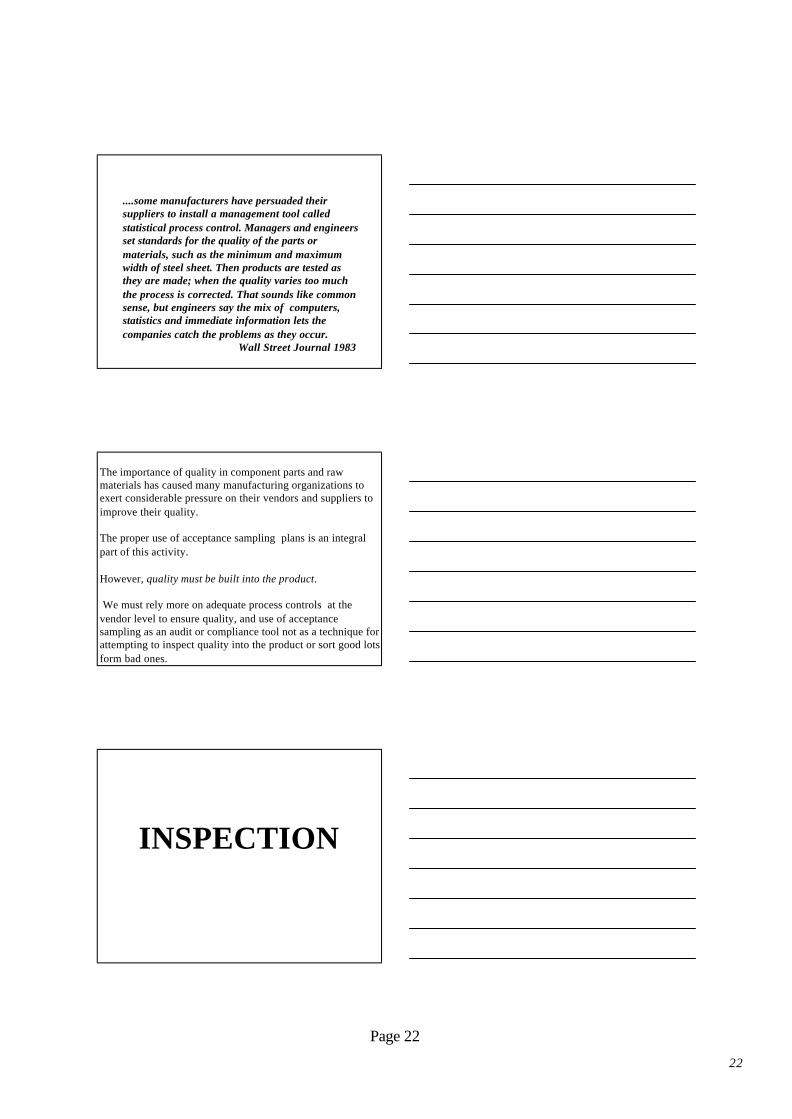
....some manufacturers have persuaded their suppliers to install a management tool called statistical process control. Managers and engineers set standards for the quality of the parts or materials, such as the minimum and maximum width of steel sheet. Then products are tested as they are made; when the quality varies too much the process is corrected. That sounds like common sense, but engineers say the mix of computers, statistics and immediate information lets the companies catch the problems as they occur.
Wall Street Journal 1983
The importance of quality in component parts and raw materials has caused many manufacturing organizations to exert considerable pressure on their vendors and suppliers to improve their quality.
The proper use of acceptance sampling plans is an integral part of this activity.
However, quality must be built into the product.
We must rely more on adequate process controls at the vendor level to ensure quality, and use of acceptance sampling as an audit or compliance tool not as a technique for attempting to inspect quality into the product or sort good lotsform bad ones.
INSPECTION
23
Page 23
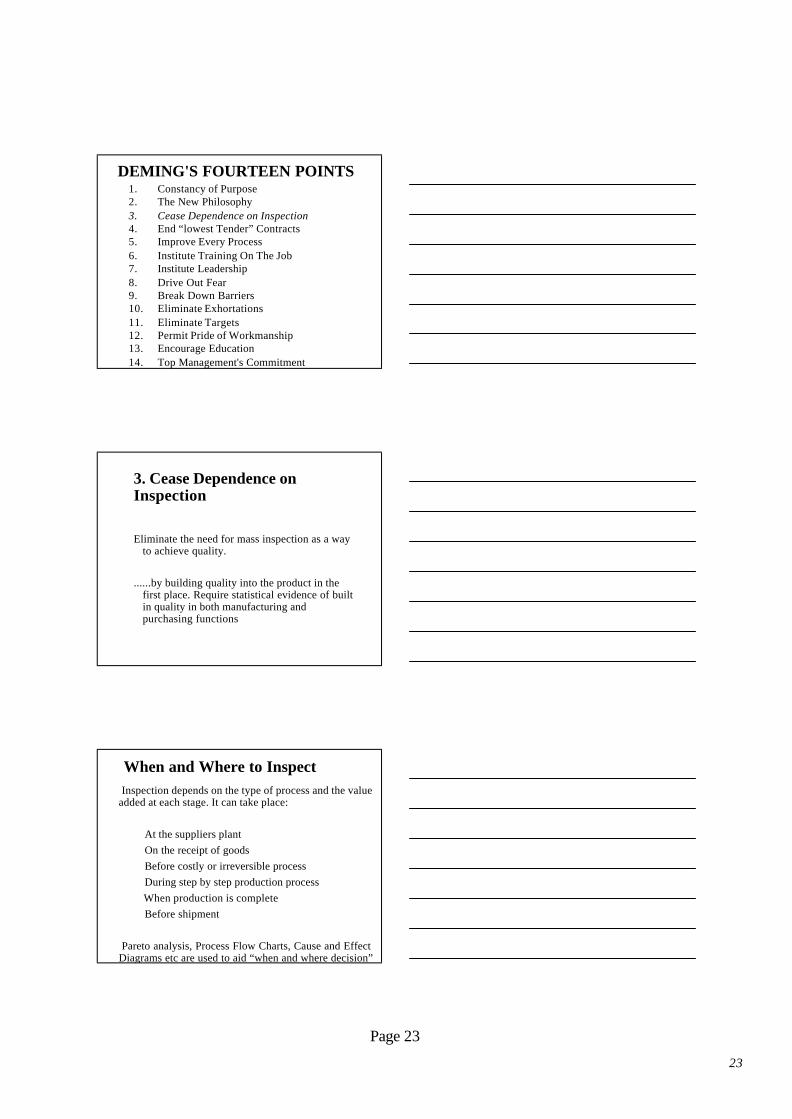
1. Constancy of Purpose2. The New Philosophy3. Cease Dependence on Inspection4. End “lowest Tender” Contracts5. Improve Every Process6. Institute Training On The Job7. Institute Leadership8. Drive Out Fear9. Break Down Barriers10. Eliminate Exhortations11. Eliminate Targets12. Permit Pride of Workmanship13. Encourage Education14. Top Management's Commitment
DEMING'S FOURTEEN POINTS
3. Cease Dependence on Inspection
Eliminate the need for mass inspection as a way to achieve quality.
......by building quality into the product in the first place. Require statistical evidence of built in quality in both manufacturing and purchasing functions
When and Where to InspectInspection depends on the type of process and the value
added at each stage. It can take place:
At the suppliers plantOn the receipt of goodsBefore costly or irreversible processDuring step by step production processWhen production is completeBefore shipment
Pareto analysis, Process Flow Charts, Cause and Effect Diagrams etc are used to aid “when and where decision”
24
Page 24
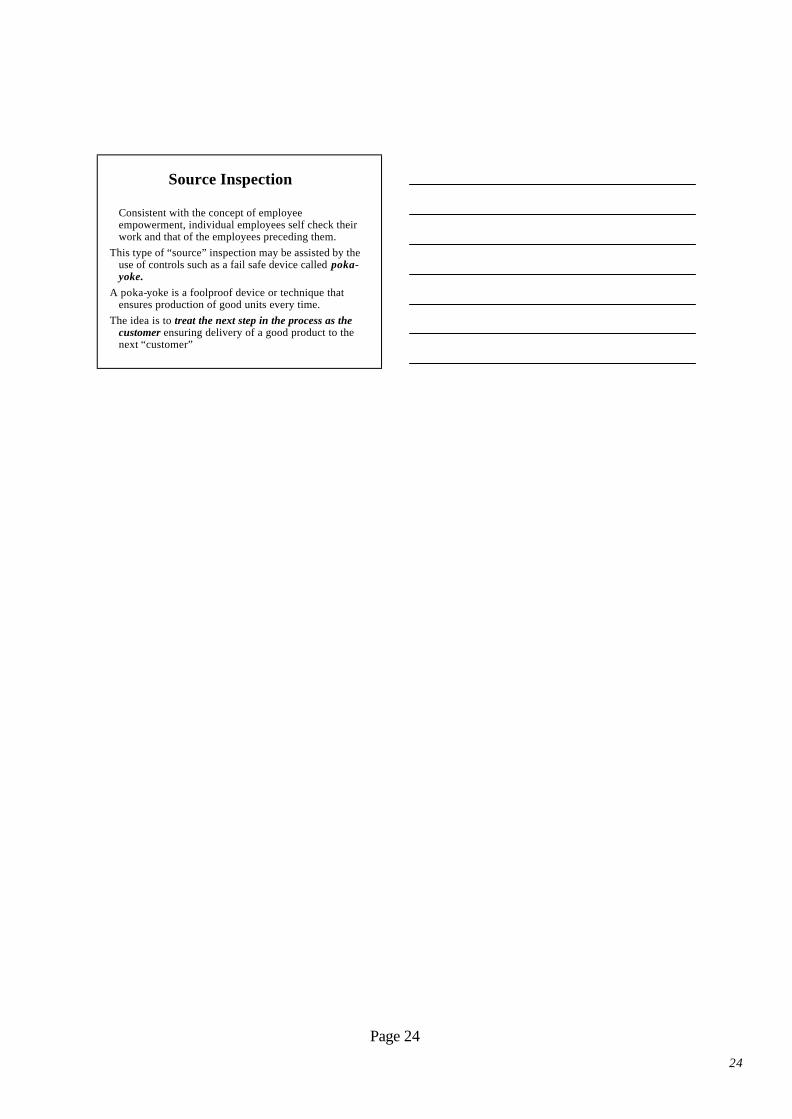
Source Inspection
Consistent with the concept of employee empowerment, individual employees self check their work and that of the employees preceding them.
This type of “source” inspection may be assisted by the use of controls such as a fail safe device called poka-yoke.
A poka-yoke is a foolproof device or technique that ensures production of good units every time.
The idea is to treat the next step in the process as the customer ensuring delivery of a good product to the next “customer”