interpreting statistical measures—class scores -...
TRANSCRIPT

Interpreting Statistical Measures—Class Scores
© 2016 by Education Development Center. Interpreting Statistical Measures—Class Scores is licensed under the Creative Commons Attribution-NonCommercial-NoDerivatives 4.0 International License. To view a copy of this license, visit https://creativecommons.org/licenses/by-nc-nd/4.0/. To contact the copyright holder email [email protected] This material is based on work supported by the National Science Foundation under Grant No. DRL-1119163. Any opinions, findings, and conclusions or recommendations expressed in this material are those of the author(s) and do not necessarily reflect the views of the National Science Foundation.
About Illustrations: Illustrations of the Standards for Mathematical Practice (SMP) consist of several pieces, including a mathematics task, student dialogue, mathematical overview, teacher reflection questions, and student materials. While the primary use of Illustrations is for teacher learning about the SMP, some components may be used in the classroom with students. These include the mathematics task, student dialogue, and student materials. For additional Illustrations or to learn about a professional development curriculum centered around the use of Illustrations, please visit mathpractices.edc.org. About the Interpreting Statistical Measures—Class Scores Illustration: This Illustration’s student dialogue shows the conversation among three students who are given the mean, median, and standard deviation of the test scores for two classes and are asked to explain which class did better. Students come to realize this question is not easy to answer and they use spreadsheets and graphical representations of the data set in order to make sense of the given information. Highlighted Standard(s) for Mathematical Practice (MP) MP 1: Make sense of problems and persevere in solving them. MP 3: Construct viable arguments and critique the reasoning of others. MP 4: Model with mathematics. MP 5: Use appropriate tools strategically. Target Grade Level: Grades 9–12 Target Content Domain: Interpreting Categorical and Quantitative Data (Statistics and Probability Conceptual Category) Highlighted Standard(s) for Mathematical Content HSS-ID.A.2 Use statistics appropriate to the shape of the data distribution to compare center
(median, mean) and spread (interquartile range, standard deviation) of two or more different data sets.
HSS-ID.A.3 Interpret differences in shape, center, and spread in the context of the data sets, accounting for possible effects of extreme data points (outliers).
Math Topic Keywords: mean, median, standard deviation, unimodal, bimodal, distributions

Interpreting Statistical Measures—Class Scores
Mathematics Task Suggested Use This mathematics task is intended to encourage the use of mathematical practices. Keep track of ideas, strategies, and questions that you pursue as you work on the task. Also reflect on the mathematical practices you used when working on this task. The following results describe the scores from a pre-test (a test given before a chapter is taught) in two math classes.
Class 1 Class 2 Mean 78 72 Median 65 73 Standard deviation 16 6
What do the pre-test scores seem to say about how much the students in each class already know about the topic of this test? Task Source: Adapted from Falk, R. (1993). Understanding Probability and Statistics: A Book of Problems. Wellesley, MA: A.K. Peters.

Interpreting Statistical Measures—Class Scores
Student Dialogue Suggested Use The dialogue shows one way that students might engage in the mathematical practices as they work on the mathematics task from this Illustration. Read the student dialogue and identify the ideas, strategies, and questions that the students pursue as they work on the task. Students in this dialogue have studied measures of shape, center, and spread of distributions. They have explored these ideas with and without technology aids. (1) Chris: Class 1’s students must know more of the material already. Their mean is higher.
And their median is… oh wait, their median is lower than Class 2. And lower by so much! I mean, if the median is 65, that means that half of the class got 65 or less!
(2) Matei: OK, so that's the core of the problem! I guess we’ve got to figure out which
measure—higher mean or higher median—better indicates how much the class already knows.
(3) Lee: Well, maybe it's not a simple question of which one's a better indicator. It
probably matters how big the difference is. In fact, maybe we shouldn't be trying to think about the class as a whole. It may make more sense to think about what these numbers might say about the distributions of scores.
(4) Chris: Ok, wait. I need to play with the numbers. I’m gonna make a spreadsheet and see
if I can figure out at least one scenario for what the actual students’ scores could have been.
(5) Matei: Good. And while you do that, I'll try to sketch the overall shape of the data in a
graph. [Students work individually for a while, and then each returns to the group with a product.] (6) Lee: I couldn’t figure out how to compare the means and medians, so I looked at the
standard deviation to see how the scores are spread out. I used the mean and the standard deviation and drew this:
C l a s s 1
C l a s s 2
Interpreting Statistical Measures—Class Scores
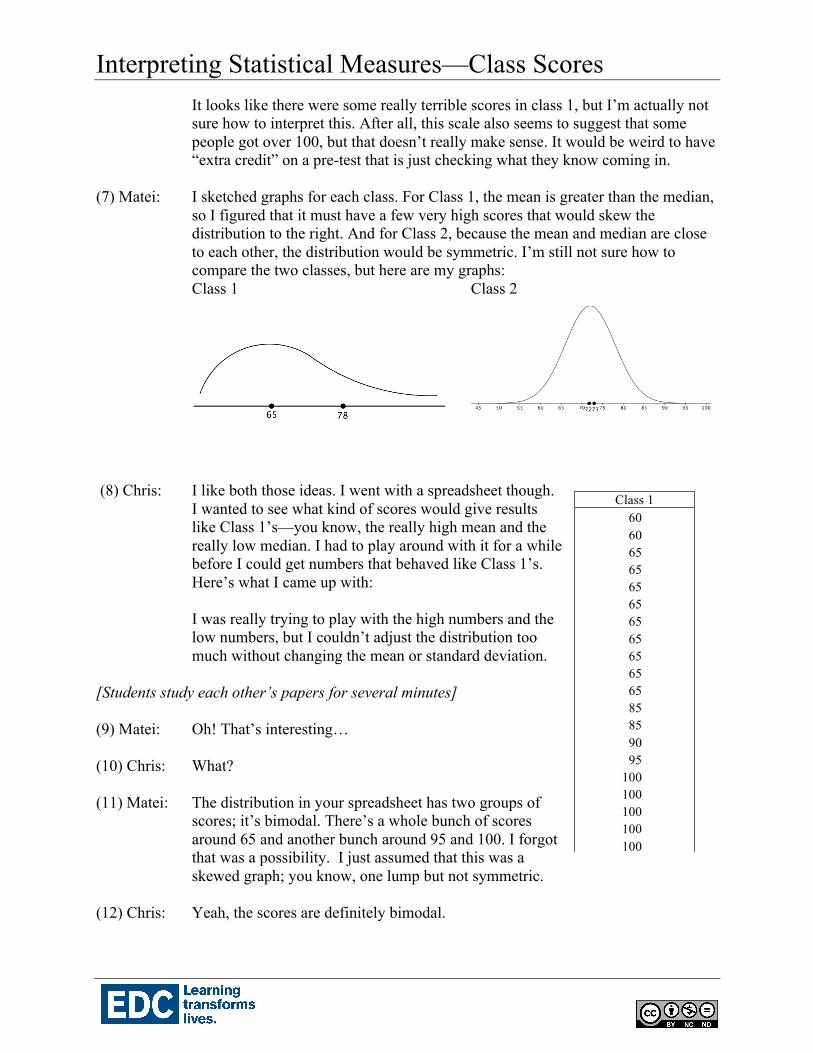
It looks like there were some really terrible scores in class 1, but I’m actually not sure how to interpret this. After all, this scale also seems to suggest that some people got over 100, but that doesn’t really make sense. It would be weird to have “extra credit” on a pre-test that is just checking what they know coming in.
(7) Matei: I sketched graphs for each class. For Class 1, the mean is greater than the median,
so I figured that it must have a few very high scores that would skew the distribution to the right. And for Class 2, because the mean and median are close to each other, the distribution would be symmetric. I’m still not sure how to compare the two classes, but here are my graphs: Class 1 Class 2
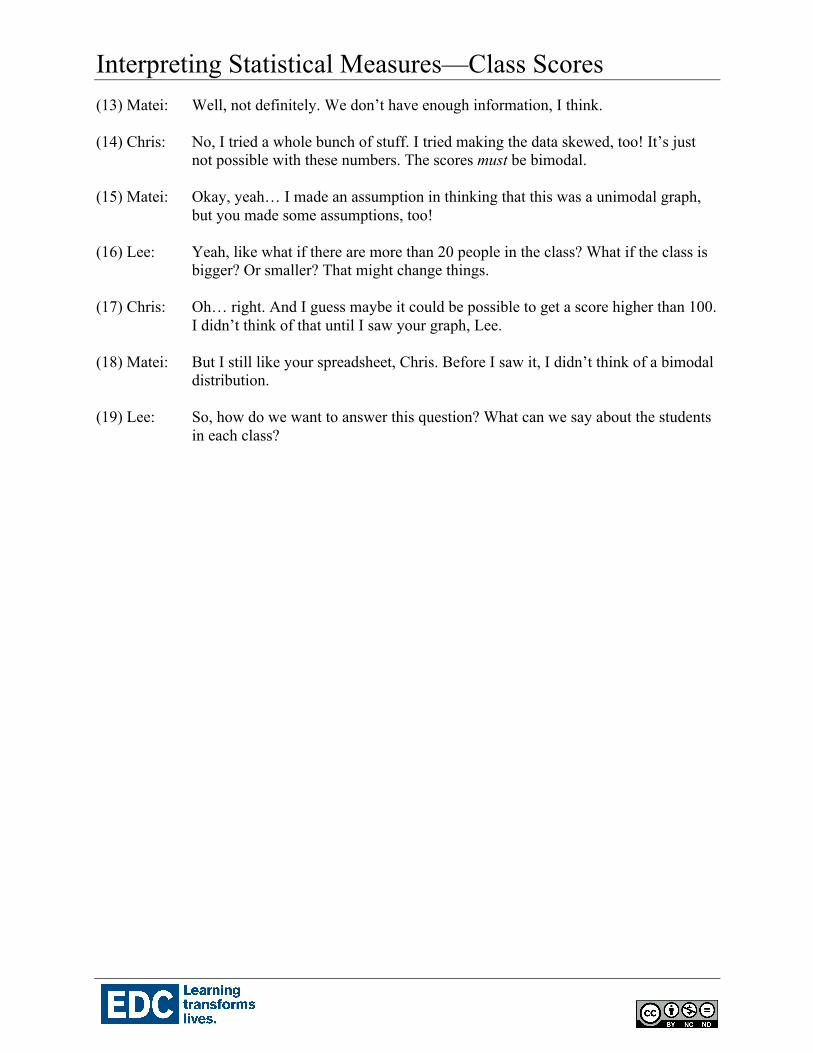
(8) Chris: I like both those ideas. I went with a spreadsheet though.
I wanted to see what kind of scores would give results like Class 1’s—you know, the really high mean and the really low median. I had to play around with it for a while before I could get numbers that behaved like Class 1’s. Here’s what I came up with:
I was really trying to play with the high numbers and the
low numbers, but I couldn’t adjust the distribution too much without changing the mean or standard deviation.
[Students study each other’s papers for several minutes] (9) Matei: Oh! That’s interesting… (10) Chris: What? (11) Matei: The distribution in your spreadsheet has two groups of
scores; it’s bimodal. There’s a whole bunch of scores around 65 and another bunch around 95 and 100. I forgot that was a possibility. I just assumed that this was a skewed graph; you know, one lump but not symmetric.
(12) Chris: Yeah, the scores are definitely bimodal.
Class 1 60 60 65 65 65 65 65 65 65 65 65 85 85 90 95
100 100 100 100 100
Interpreting Statistical Measures—Class Scores
(13) Matei: Well, not definitely. We don’t have enough information, I think. (14) Chris: No, I tried a whole bunch of stuff. I tried making the data skewed, too! It’s just
not possible with these numbers. The scores must be bimodal.
(15) Matei: Okay, yeah… I made an assumption in thinking that this was a unimodal graph, but you made some assumptions, too!
(16) Lee: Yeah, like what if there are more than 20 people in the class? What if the class is
bigger? Or smaller? That might change things. (17) Chris: Oh… right. And I guess maybe it could be possible to get a score higher than 100.
I didn’t think of that until I saw your graph, Lee. (18) Matei: But I still like your spreadsheet, Chris. Before I saw it, I didn’t think of a bimodal
distribution. (19) Lee: So, how do we want to answer this question? What can we say about the students
in each class?

Interpreting Statistical Measures—Class Scores
Teacher Reflection Questions Suggested Use These teacher reflection questions are intended to prompt thinking about 1) the mathematical practices, 2) the mathematical content that relates to and extends the mathematics task in this Illustration, 3) student thinking, and 4) teaching practices. Reflect on each of the questions, referring to the student dialogue as needed. Please note that some of the mathematics extension tasks presented in these teacher reflection questions are meant for teacher exploration, to prompt teacher engagement in the mathematical practices, and may not be appropriate for student use.
1. What evidence do you see of students in the dialogue engaging in the Standards for Mathematical Practice?
2. How would you describe the students in each class based on their scores? 3. The students in the dialogue mention several assumptions they made as they explored the
data. What are these assumptions and how do they affect the analysis? What other assumptions, if any, do the students make but not mention?
4. How can you use this problem to increase student understanding about mean, median, and
standard deviation? 5. How does each student in the dialogue use the mean in reasoning about the problem? 6. How do the students in the dialogue use standard deviation in reasoning about the problem? 7. What could further discussion of Lee’s graphic have contributed to the group’s analysis? 8. Lee’s diagram is both pertinent to the problem and quite informative, but the students in the
dialogue don’t follow up on the implications of that diagram. Even Lee is not sure what to make of it. Does this ever happen in your classroom discussions, i.e., students moving from contribution to contribution without necessarily connecting or using each other’s ideas? How might you help students dwell a bit longer on an analysis to see what each idea provides and what more might be needed?
9. How does Chris’s use of numbers help the group think about this problem? 10. We didn’t see any spreadsheets from Chris about Class 2. Make some spreadsheets of student
scores that fit with the summary statistics. What different distributions can you model? What insights does this add to the problem?
11. What if students don’t know how to start this problem? What might you suggest? 12. Give another situation in which you might see one group have both a larger mean and a
smaller median (or vice versa) than another group? What might this imply in such a situation?
13. In what contexts are mean, median, mode, and/or standard deviation likely to be meaningful? 14. If you were working with the students in this dialogue during this conversation, when and
how might you intervene? Why?

Interpreting Statistical Measures—Class Scores
Mathematical Overview Suggested Use The mathematical overview provides a perspective on 1) how students in the dialogue engaged in the mathematical practices and 2) the mathematical content and its extensions. Read the mathematical overview and reflect on any questions or thoughts it provokes. Commentary on the Student Thinking
Mathematical Practice Evidence
Make sense of problems and persevere in solving them.
A key feature of making sense is finding “the core of the problem,” as Matei does in line 2. The three students come up with three different entry points for solving the problem, with Matei and Lee creating two different types of diagrams to try to represent the important features of the data sets, and with Chris building a numerical model. Through these diagrams, as well as Chris’s exploration of possible data sets, the students find ways to make sense of the given information. The students also check their progress: at the end of the dialogue, Lee restates the question they need to answer, realizing that their discussion so far has not directly answered the question. They are also checking on their progress when they identify assumptions that they are working from, as in lines 15–17.
Construct viable arguments and critique the reasoning of others.
The students in this dialogue do not explicitly construct chains of reasoning and are, therefore, also not in a position to “critique the reasoning of others.” However, they are engaged regularly in challenging and clarifying their assumptions, thinking about their own reasoning as well as each other’s. They listen to each other’s arguments and adjust their own based on the new ideas. Lee’s challenge in line 16 (“What if there are more than 20 people in the class?”) helps to reveal assumptions that Chris has made.
Model with mathematics.
Students work with models in two different senses. Given a set of properties (the summary statistics), Chris generates a model—a concrete set of data points—that exhibits those properties. This kind of model building is not described in the Standards for Mathematical Practice but is, in fact, an important element of mathematical practice. Understood a different way, the students are given the mathematical model—an abstraction in the form of the summary statistics—and analyze it in order to understand what situation it represents (i.e., what might be true of classes that have such scores). The assumptions that the students use and their identification of those assumptions are important features of how these students use the model to work toward conclusions.
Interpreting Statistical Measures—Class Scores
Use appropriate tools strategically.
Students choose tools—a spreadsheet (Chris in line 8) and two kinds of graphic representations (Lee in line 6 and Matei in line 7)—all of which are appropriate to the task and well matched to the particular way in which they are approaching this task.
Commentary on the Mathematics Statistics, both as a mathematical discipline and as a tool for understanding the world, is quite subtle. Even the notions of mean and median contain subtleties that are not often considered in education and are likely not to be recognized by students. Consider the following example: Imagine Daddy’s Night at a preschool. The room has 18 three-year-olds and 18 fathers who are all approximately 35 years old. The mean and median ages are 19, yet this value represents nobody in the room even very approximately. One can’t say that these statistical constructions summarize anything, or represent typical ages or individuals in any way. In a situation like this, neither statistic should be calculated at all, and neither of them means anything. In this example, the two sets of ages can’t sensibly be added, not because the distribution is bimodal but because the attendees represent two distinct populations—no preschoolers are 35, and no daddies are 3—and so averaging their ages is as meaningless as averaging the lifespans of houseflies and tortoises. By contrast, looking at summary statistics for the age of viewers of a new television show or the average lifespan of residents of different countries could provide useful information depending on what questions are being asked. It’s easy enough to understand why the “average age” in a case like the preschool Daddy’s Night makes no sense, but it’s less easy to state a principle that we can apply more broadly to other data sets to be sure we are not misapplying statistical techniques. But what about the class scores in this dialogue? Presumably these two classes come from the same population. In most cases, that is a reasonable enough assumption. However, then we would not expect an apparent bimodal distribution, as in Class 1, except in very small samples, where mode is unstable anyway. (Note that mode, as a statistical tool, does not appear in the Common Core State Standards at any grade band.) When the students mention a bimodal distribution of scores, they do not consider the possibility this might mean something “unaverageable” about the class (e.g., that the class really represents two distinct groups—like the daddies and toddlers—whose scores should be treated separately). Because this is a pre-test, it should represent prior learning, not achievement in this class, and may be an artifact of, say, different schools in the previous year. A teacher who is using these data would want, whatever the reason for the bimodality, to attend to the fact that some of these students are starting the year with less information than others and to account for that in his or her teaching. Evidence of the Content Standards Often, statistics problems ask students to compute summary statistics, exercising only knowledge of what calculation is required and their ability to perform it. These problems often do not ask them to consider what the calculation “says” in the context of the problem or even whether the calculation makes sense at all. Rich and complex problems are more interesting because they require students to consider the meaning of the statistical values and make contextual inferences

Interpreting Statistical Measures—Class Scores
using these values. These rich and complex problems, therefore, allow students opportunities to choose and understand appropriate statistics (HSS-ID.A.2) and interpret differences between summary statistics for data sets based on the context of the data (HSS-ID.A.3). Note: For additional information about statistics and probability in the Common Core State Standards, see the draft progressions documents for statistics and probability at http://ime.math.arizona.edu/progressions/
Interpreting Statistical Measures—Class Scores
Student Materials Suggested Use Student discussion questions and related mathematics tasks are supplementary materials intended for optional classroom use with students. If you choose to use the mathematics task and student dialogue with your students, the discussion questions can stimulate student conversation and further exploration of the mathematics. Related mathematics tasks provide students an opportunity to engage in the mathematical practices as they connect to content that is similar to, or an extension of, that found in the mathematics task featured in the student dialogue. Student Discussion Questions 1. What information does Lee in the student dialogue use to generate the graphs in line 6? What
does that graph tell you about the students in Classes 1 and 2? 2. What information does Matei use to generate the graphs in line 7? What does it suggest about
the students in Classes 1 and 2? 3. Use a spreadsheet program to make up a set of scores that has the summary statistics of Class
1. Then make up a set with the summary statistics of Class 2. Try generating more than one set for each class.
4. In line 16, Lee points out that Chris has made an assumption about class size. How would
class size affect Chris’ thinking? As you think about this question, try creating class sets for classes with 25 students, 30 students, and 50 students that have the given summary statistics.
5. Lee points out that the problem they started with was never solved. Write your own solution:
How would you describe the students in each class based on their pre-test scores? Related Mathematics Tasks 1. It’s Daddy’s Night at preschool. The room contains 18 people who are about 40 months old;
the other 18 people are about 40 years old. What, if any, meaning would you ascribe to the mean, median, mode, and standard deviation of this set of 36 numbers? Give reasons for your response.
2. Describe a situation where the mean, median, mode, and/or standard deviation would help
answer a question about that situation. Explain why the mean, median, mode, and/or standard deviation are helpful in this case.
3. The formula that computes the distance between two points on a plane involves an
expression like x2 − x1( )2 + y2 − y1( )2 . The distance between two opposite vertices on a rectangular prism is also expressible as the square root of a sum of squared distances:
x2 − x1( )2 + y2 − y1( )2 + z2 − z1( )2 (where the coordinates of those opposite vertices are

Interpreting Statistical Measures—Class Scores
x1, y1, z1( ) and x2, y2, z2( ) or just l2 +w2 + h2 ). The formula that computes the standard deviation also involves the square root of a sum of squared differences. Given these similarities between expressions for measures of distances and expressions for measures of standard deviation from a mean, in what sense might standard deviation be thought of as a measure of a kind of distance? Distance of what from what?
Interpreting Statistical Measures—Class Scores
Answer Key Suggested Use The possible responses provided to the teacher reflection questions are meant to be used as an additional perspective after teachers have thought about those questions themselves. The possible responses to the student discussion questions and related mathematics tasks are intended to help teachers prepare for using the student materials in the classroom. Possible Responses to Teacher Reflection Questions 1. What evidence do you see of students in the dialogue engaging in the Standards for
Mathematical Practice?
Refer to the Mathematical Overview for notes related to this question. 2. How would you describe the students in each class based on their scores?
Responses will vary. There is more variation in the students in Class 1. Half the students didn’t know the material on the pre-test (evidenced by their median score of 65), but at least a few students seemed to know the material very well because their scores raised the mean to 78. There is less variation among the students in Class 2. Their mean and median are quite close, and their class scores have a smaller standard deviation.
3. The students in the dialogue mention several assumptions they made as they explored the
data. What are these assumptions and how do they affect the analysis? What other assumptions, if any, do the students make but not mention?
Matei assumes that the distribution is unimodal (line 15) and applies the generalization that when the mean and median are different, the graph is skewed in the direction of the mean. Chris assumes that there are 20 people in the class (line 16) even though the task does not mention class size. The assumption affects the analysis because Chris’s strategy is to “play” with the numbers, and the effect of changing any one value is greater when the sample size is lower. An assumption about the highest score (line 17) naturally affects any analysis that is dependent on specific numbers. There are other assumptions that the students make. For example, in line 6, Lee only uses the mean and standard deviation to compare the classes, even though those two measures are highly susceptible to the effect of outliers. Lee does not mention the effect that such outliers might have. They also assume that the two classes are comparable in size, although this assumption does not seem to have influenced their reasoning.
4. How can you use this problem to increase student understanding about mean, median, and
standard deviation?
Have students engage in and discuss the problem themselves. Help them consider the different ways that they used these terms in their analysis. Have students who have used different approaches for considering the data sets share what they have discovered about

Interpreting Statistical Measures—Class Scores
the two classes and compare and contrast how each of their approaches made use of mean, median, and standard deviation. Ask students to consider how changing any of these summary statistics changes the comparisons they have made between the two classes. Ask students to explain what kind of information they learned about the two classes from each summary statistic.
Note: If students do not have access to computer spreadsheets, it may be helpful to have prepared 10 or so sets of class data that fit the criteria in the problem as a potential scaffold. Example data sets are found in the response to question 10. Another possible scaffold for understanding the summary statistics is to have students start by looking at data sets with only three values and seeing how changing those values impacts the mean and median. Students could also benefit from exploring the problem with software (e.g., TinkerPlots or MS Excel). For example, students could explore how the separation between the mean and the median affects the shape of a graph of the data.
5. How does each student in the dialogue use the mean in reasoning about the problem?
Lee is interested in the spread. Because the standard deviation measures deviation from the mean, Lee essentially ignores the median and uses the mean strictly as the center of the distribution. If the problem had included information about quartiles or deciles, Lee might have focused first on the median. Matei uses the mean and its relationship to the median to inform the shape of the distribution. Chris takes a numeric approach, showing that for Class 1 to have a mean of 78 when half the scores are 65 or below, there must also be some very high scores.
6. How do the students in the dialogue use standard deviation in reasoning about the problem?
Lee’s diagram is the only work that makes explicit use of standard deviation. Lee knows to connect the measure of standard deviation to the mean, and uses it to get a sense of the spread of the two classes. Even without incorporating the median, Lee’s picture gives a sense of differences between the two classes. Matei and Chris also take the standard deviation into account in their strategies but do not do any explicit reasoning about the role of the standard deviation in their thinking. Chris uses the given standard deviations as a constraint in the spreadsheets, making sure that any possible generated class sets of data have the appropriate standard deviations. Matei’s sketched graphs for the data for the two classes show attention to how spread out the students’ scores in each class are, though the standard deviation is not labeled in the graphs.
7. What could further discussion of Lee’s graphic have contributed to the group’s analysis?
Lee lines up the two scales, value for value, showing that even though Class 2’s center (mean = 72) is lower than Class 1’s (mean = 78), a large proportion of Class 1 appears to come in knowing less (as measured by the test) than nearly all of Class 2. If we were to use the data in planning for teaching those classes, it would make sense to look at what particular background the classes did not yet have. In Class 1, we would also need to
Interpreting Statistical Measures—Class Scores
plan more differentiation, as some students appear to have very little background, while others seem to know most of the material already.
8. Lee’s diagram is both pertinent to the problem and quite informative, but the students in the
dialogue don’t follow up on the implications of that diagram. Even Lee is not sure what to make of it. Does this ever happen in your classroom discussions, i.e., students moving from contribution to contribution without necessarily connecting or using each other’s ideas? How might you help students dwell a bit longer on an analysis to see what each idea provides and what more might be needed?
When students appear to be moving on too quickly, you can sometimes support deeper analysis just by asking for it, perhaps with a comparison question such as “What is similar and different between this idea/strategy/method/diagram and this one?” (e.g., “What is similar and different between the diagram you came up with, Matei, and the one you came up with, Lee?”). Your own genuine curiosity about what is behind the students’ work can also encourage greater depth: “What got you thinking of diagramming the data that way?” or “What are these two diagrams really telling us?”
9. How does Chris’s use of numbers help the group think about this problem?
Where Lee’s diagram uses only mean and standard deviation and Matei’s uses only mean and median, Chris’s “playing with the numbers” is an attempt to find a data set that fits all three measures. While Chris’s data set may not be the only one that fits the criteria—a discussion that comes up (lines 17–18)—it gives the group something concrete to discuss, whereas Lee’s and Matei’s diagrams are still somewhat more abstract descriptions. It may not be a surprise, then, that Chris’s is the representation that the group latches on to and discusses further. Chris’s numbers draw the group’s attention to the possibility that Class 1’s scores might have a bimodal distribution; they also call attention to assumptions that are implicit in each model.
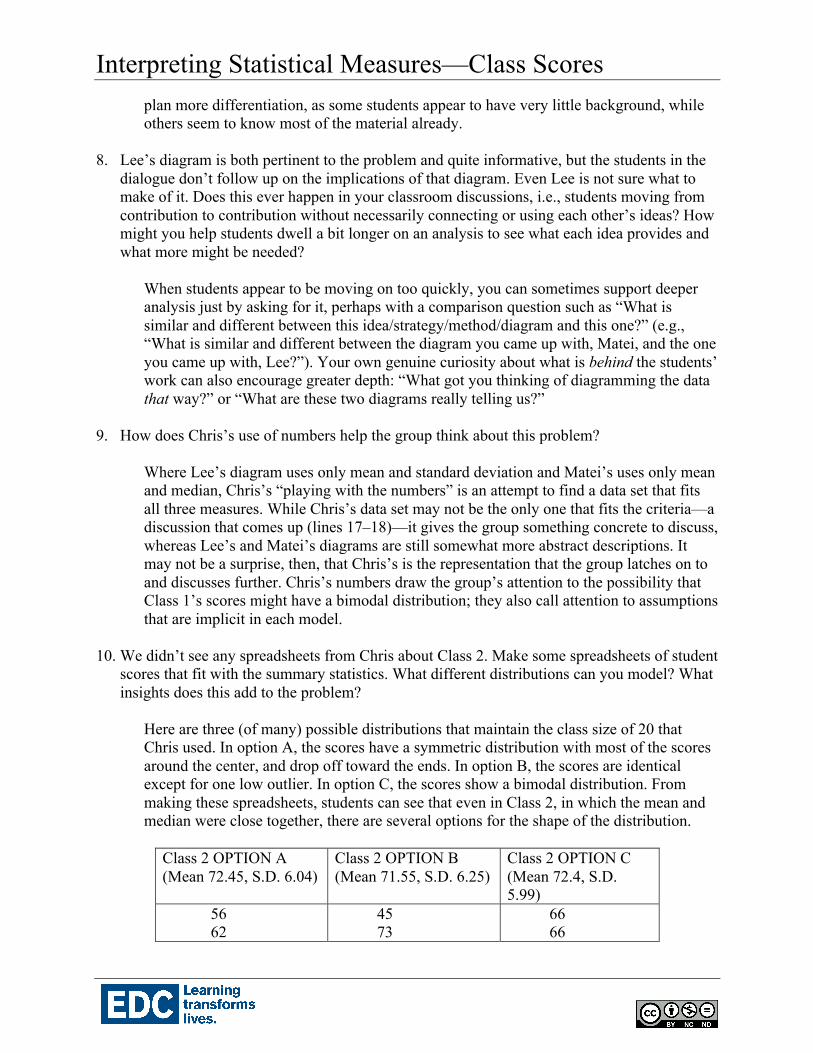
10. We didn’t see any spreadsheets from Chris about Class 2. Make some spreadsheets of student
scores that fit with the summary statistics. What different distributions can you model? What insights does this add to the problem?
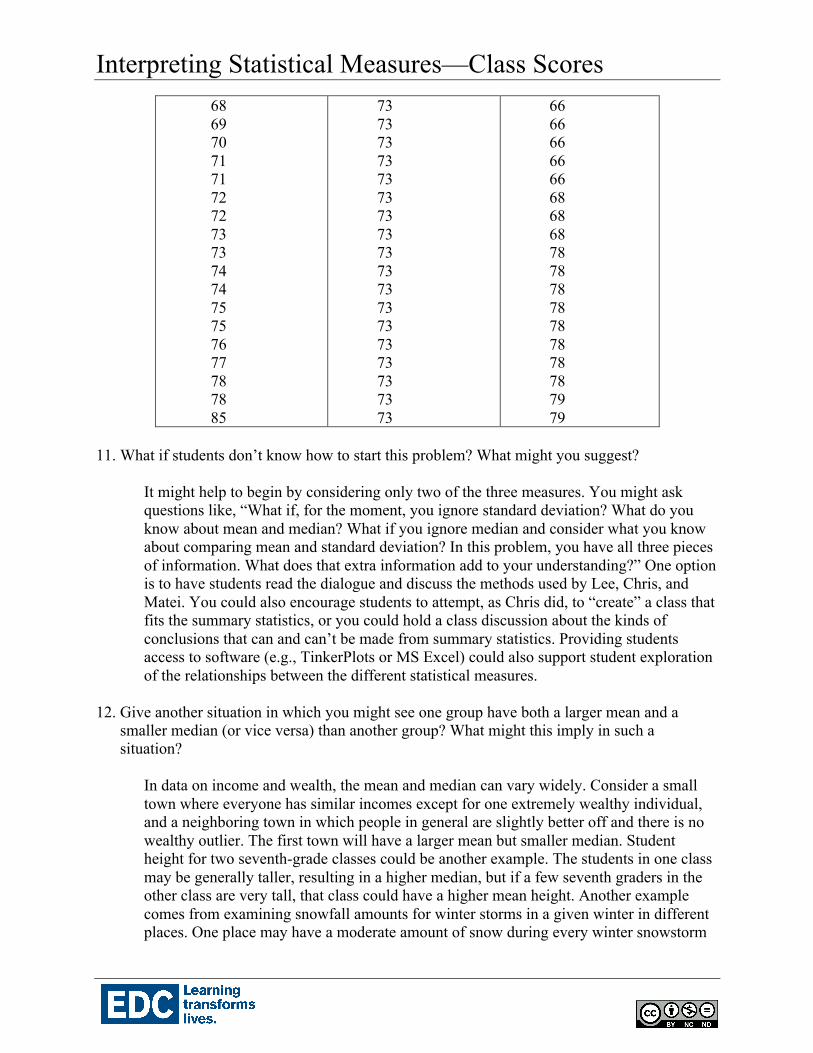
Here are three (of many) possible distributions that maintain the class size of 20 that Chris used. In option A, the scores have a symmetric distribution with most of the scores around the center, and drop off toward the ends. In option B, the scores are identical except for one low outlier. In option C, the scores show a bimodal distribution. From making these spreadsheets, students can see that even in Class 2, in which the mean and median were close together, there are several options for the shape of the distribution.
Class 2 OPTION A (Mean 72.45, S.D. 6.04)
Class 2 OPTION B (Mean 71.55, S.D. 6.25)
Class 2 OPTION C (Mean 72.4, S.D. 5.99)
56 62
45 73
66 66
Interpreting Statistical Measures—Class Scores
68 69 70 71 71 72 72 73 73 74 74 75 75 76 77 78 78 85
73 73 73 73 73 73 73 73 73 73 73 73 73 73 73 73 73 73
66 66 66 66 66 68 68 68 78 78 78 78 78 78 78 78 79 79
11. What if students don’t know how to start this problem? What might you suggest?
It might help to begin by considering only two of the three measures. You might ask questions like, “What if, for the moment, you ignore standard deviation? What do you know about mean and median? What if you ignore median and consider what you know about comparing mean and standard deviation? In this problem, you have all three pieces of information. What does that extra information add to your understanding?” One option is to have students read the dialogue and discuss the methods used by Lee, Chris, and Matei. You could also encourage students to attempt, as Chris did, to “create” a class that fits the summary statistics, or you could hold a class discussion about the kinds of conclusions that can and can’t be made from summary statistics. Providing students access to software (e.g., TinkerPlots or MS Excel) could also support student exploration of the relationships between the different statistical measures.
12. Give another situation in which you might see one group have both a larger mean and a
smaller median (or vice versa) than another group? What might this imply in such a situation?
In data on income and wealth, the mean and median can vary widely. Consider a small town where everyone has similar incomes except for one extremely wealthy individual, and a neighboring town in which people in general are slightly better off and there is no wealthy outlier. The first town will have a larger mean but smaller median. Student height for two seventh-grade classes could be another example. The students in one class may be generally taller, resulting in a higher median, but if a few seventh graders in the other class are very tall, that class could have a higher mean height. Another example comes from examining snowfall amounts for winter storms in a given winter in different places. One place may have a moderate amount of snow during every winter snowstorm

Interpreting Statistical Measures—Class Scores
while another place may get very little snow with each snowstorm with the exception of a couple of extremely heavy snowfalls. The first place may, therefore, have a higher median snowfall amount per storm whereas the second place could have a higher mean snowfall amount based on the very large storms. There are many other situations, as well.
13. In what contexts are mean, median, mode, and/or standard deviation likely to be meaningful?
In general, summary statistics are meaningful only when a data set is large enough both to need a summary and to keep that summary stable. In a small data set, the summary can be too sensitive to a change in just one or two data points, meaning that it is still too dependent on individuals to be truly a summary of the group. But, in large enough data sets, the value of the summary is that it does suppress the details and give a picture of the whole group. Which summary statistic is useful also depends on what questions you have about the given context. For example, if you are a marketer for a charitable cause, you might be interested in the mode for the donation amount because it might allow you to set up future donation requests to make it easy to donate that amount (or for multiple amounts if the distribution is multimodal, as you might expect). Or, you might use the median to differentiate between higher and lower donations though, in general, you would likely be interested in describing the distribution more sensitively—e.g., understanding whether you are reaching lots of small donors or relying mostly on a few large donations—than a “center” measure gives by itself. The mean and standard deviation can give you a sense of how much you need to differentiate your requests for donations to different audiences.
14. If you were working with the students in this dialogue during this conversation, when and how might you intervene? Why?
One reasonable response is “I wouldn’t intervene. The students’ initial thinking is good, and they are even on track to thinking about how their analysis so far might help them answer the question.” Or, depending on your agenda for the class, you might consider intervening after line 14 and ask the students what it might mean about the class data sets if one of them was bimodal. This would help unpack students’ understanding of bimodal distributions. Or, after line 8, a question could prompt students to compare their different approaches. For example, “Does Chris’s class set of data seem to match with the models that Matei or Lee made?” Or, “Where are the mean, median, and standard deviation represented in each of your models?”
Interpreting Statistical Measures—Class Scores
Possible Responses to Student Discussion Questions 1. What information does Lee in the student dialogue use to generate the graphs in line 6? What
does that graph tell you about the students in Classes 1 and 2?
Lee uses the mean and standard deviation to produce the graph. For Class 1, 78 is the mean, 62 and 94 represent the scores that are 1 standard deviation below and above the mean, respectively, and 46 and 110 are the scores 2 standard deviations below and above the mean. For Class 2, the mean is 72, and the scores 1 and 2 standard deviations below and above the mean are also shown. Lee also has drawn the two lines so that they are on the same scale relative to each other. If Lee’s graphs give us an accurate picture of the two classes, we see that though Class 1 has the higher “average score” (mean), its scores are so spread out that a significant number of students scored lower than virtually all of Class 2.
2. What information does Matei use to generate the graphs in line 7? What does it suggest about
the students in Classes 1 and 2?
Matei knows that for the mean and median to be about the same, the values on both sides must “balance” each other in some way, so Matei draws a symmetric graph for Class 2, with the large lump in the middle and low “tails” at both ends to reflect the most common assumption: super-high and super-low scores are less common than middle scores. Matei also knows that if the mean is much higher or lower than the median, there must be extra high or low scores to “pull” the mean in that direction, so the “tail” on that side must be a bit thicker or extend farther. For Class 1, the mean is greater than the median, so Matei draws the graph skewed to the right (tail is to the right).
3. Use a spreadsheet program to make up a set of scores that has the summary statistics of Class
1. Then make up a set with the summary statistics of Class 2. Try generating more than one set for each class.
Some possible data sets for Class 2 are shown in the solution for Teacher Reflection Question 10.
4. In line 16, Lee points out that Chris has made an assumption about class size. How would
class size affect Chris’ thinking? As you think about this question, try creating class sets for classes with 25 students, 30 students, and 50 students that have the given summary statistics.
In line 14, Chris seems convinced by the hypothetical data set (line 8) that the scores must have a bimodal distribution. In making up the values for the data set, Chris explains a process of “playing around” and “trying a whole bunch of stuff” and being unable to get the correct summary statistics. Class size plays some role in being able to “play around” with numbers. With fewer numbers, any one number can have a large effect; with a large set of numbers, the effect of any one value is smaller. By contrast, one number rarely affects the median, pretty much no matter what the size of the data set. So it is possible

Interpreting Statistical Measures—Class Scores
with a larger set of numbers that Chris would have seen greater flexibility in being able to “play around” with the numbers.
5. Lee points out that the problem they started with was never solved. Write your own solution:
How would you describe the students in each class based on their pre-test scores?
Some students may decide that there are too many ambiguities and that nothing can be said without more information about class sizes or possible scores. As long as they are able to describe the limitations that not having such information provides, this is a fair conclusion. Another set of responses may focus on the greater spread evident in Class 1. Even without being able to draw specific conclusions, it does appear that the make-up of Class 1 is different from that of Class 2. The students in Class 2 seem to be more similar to each other; the students in Class 1 seem to include many who don’t know the material at all and many who know the material very well.
Possible Responses to Related Mathematics Tasks 1. It’s Daddy’s Night at preschool. The room contains 18 people who are about 40 months old;
the other 18 people are about 40 years old. What, if any, meaning would you ascribe to the mean, median, mode, and standard deviation of this set of 36 numbers? Give reasons for your response.
The mean and median have no real meaning. Both are around 22 years, and this value doesn’t help to describe anyone in the room. The standard deviation, around 19, is also essentially meaningless. It indicates that there is a large variation of ages, but even combined with the information about the mean and median, the statistics fail to provide a meaningful description of the people in the room. The two modes, one at 40 months and the other at 40 years, help show why the mean, median, and standard deviation don’t have a useful meaning. It doesn’t make sense to summarize the 36 numbers with one set of summary statistics when the 36 numbers include two different populations.
2. Describe a situation where the mean, median, mode, and/or standard deviation would help
answer a question about that situation. Explain why the mean, median, mode, and/or standard deviation are helpful in this case.
One example is tracking running speeds. If you time yourself running three miles every day, then the median speed would likely be more meaningful than the mean speed in telling you what a speed in the “middle” is for you because the mean would be highly impacted by one really fast or really slow day. After enough times running the three miles, the best predictor of what your speed would be on any given run might be the bracket around the mean, given by the standard deviation.
3. The formula that computes the distance between two points on a plane involves an
expression like x2 − x1( )2 + y2 − y1( )2 . The distance between two opposite vertices on a rectangular prism is also expressible as the square root of a sum of squared distances:

Interpreting Statistical Measures—Class Scores
x2 − x1( )2 + y2 − y1( )2 + z2 − z1( )2 (where the coordinates of those opposite vertices are
x1, y1, z1( ) and x2, y2, z2( ) or just l2 +w2 + h2 ). The formula that computes the standard deviation also involves the square root of a sum of squared differences. Given these similarities between expressions for measures of distances and expressions for measures of standard deviation from a mean, in what sense might standard deviation be thought of as a measure of a kind of distance? Distance of what from what?
Similarity in formulas is never enough to require similarity in interpretation, but similar structures should always at least invite the question, “What might this common underlying structure tell us?” The answer can, of course, be, “Nothing, it’s just coincidence,” but at least sometimes there is more. In the case of standard deviation, it is, in a real sense, the average “distance” of a set of data points from the center. One might imagine the data as a cloud of points, the mean as a center, and the standard deviation as a measure of the (average) radius of the cloud.