interstate 80/united states 50 davis to downtown...
TRANSCRIPT

IInntteerrssttaattee 8800//UUnniitteedd SSttaatteess 5500 DDaavviiss ttoo DDoowwnnttoowwnn SSaaccrraammeennttoo PPrreelliimmiinnaarryy IInnvveessttiiggaattiioonn
OOffffiiccee ooff TTrraavveell FFoorreeccaassttiinngg aanndd MMooddeelliinngg CCaallttrraannss,, DDiissttrriicctt 33 JJuunnee,, 22001144
2
I-80/US 50 Davis to Downtown Sacramento Preliminary Investigation
June, 2014
TABLE OF CONTENTS 1. INTRODUCTION ...........................................................................................................................................3
Setting ....................................................................................................................................................................... 3
Purpose and Need ..................................................................................................................................................... 5
Study Approach ......................................................................................................................................................... 5
2. EXISTING CONDITIONS ANALYSIS ..................................................................................................................7
Existing Facilities and Volumes.................................................................................................................................. 7
Analysis Methods ...................................................................................................................................................... 7
PeMS Analysis ......................................................................................................................................................... 12
HCM Analysis ........................................................................................................................................................... 13
Microsimulation Analysis ........................................................................................................................................ 17
3. FUTURE YEAR ALTERNATIVES ..................................................................................................................... 20
No Build Alternative ................................................................................................................................................ 20
Mixed-Flow Lane Alternative .................................................................................................................................. 22
HOV Lane Alternative .............................................................................................................................................. 22
Other Alternative Considerations ........................................................................................................................... 22
4. MODEL DEVELOPMENT .............................................................................................................................. 25
SACSIM Model ......................................................................................................................................................... 25
Growth Forecasts .................................................................................................................................................... 26
Travel Demand Model Alternatives ........................................................................................................................ 27
Microsimulation Model ........................................................................................................................................... 30
5. FUTURE CONDITIONS ANALYSIS .................................................................................................................. 32
No Build Alternative ................................................................................................................................................ 32
Mixed-Flow Lane Alternative .................................................................................................................................. 35
HOV Lane Alternative .............................................................................................................................................. 37
Alternative Comparison .......................................................................................................................................... 39
Alternative Analysis ................................................................................................................................................. 41
6. IMPROVEMENT PROJECT PRIORITIZATION .................................................................................................. 43
Selected Alternative Evaluation .............................................................................................................................. 43
Phasing Description ................................................................................................................................................. 43
Phasing Analysis ...................................................................................................................................................... 46
7. CONCLUSIONS & RECOMMENDATIONS ....................................................................................................... 49
3
I‐80/US 50 Davis to Downtown Sacramento Preliminary Investigation
June, 2014
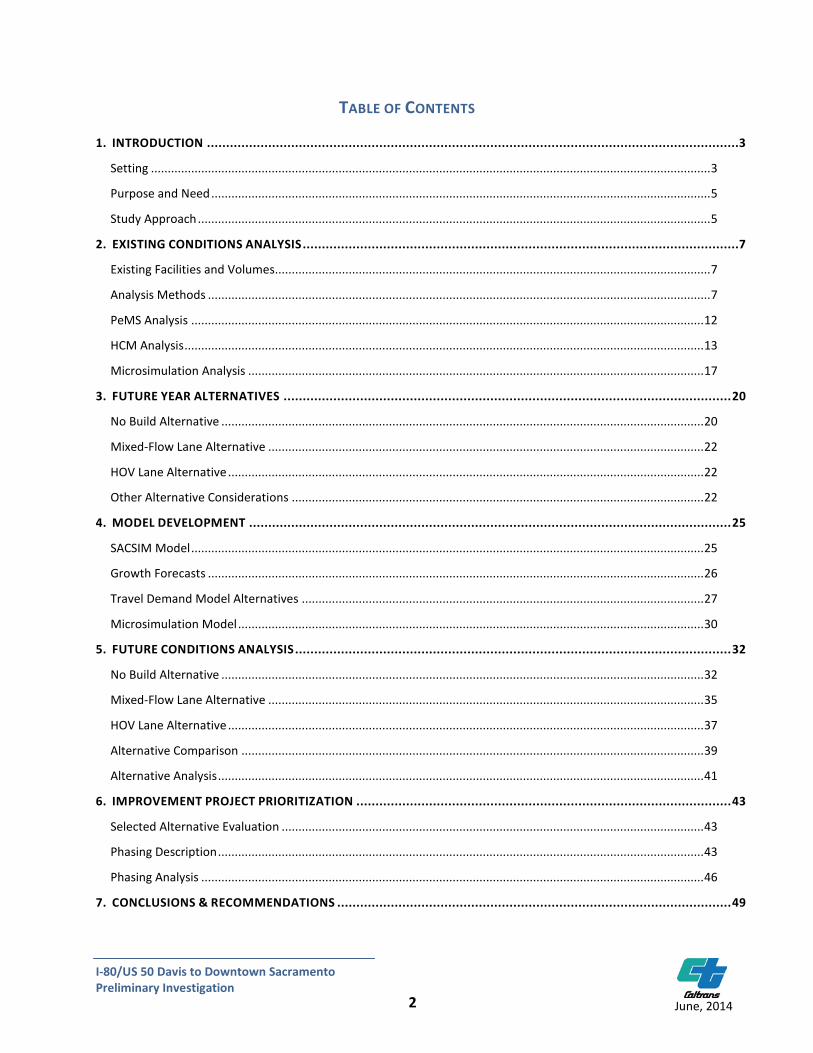
1. INTRODUCTION The freeway segments along Interstate 80 (I‐80) and United States 50 (US 50) linking the City of Davis with downtown Sacramento have been identified in their respective Corridor System Management Plans (CSMPs) and within the SACOG Metropolitan Transportation Plan (MTP) as requiring capital improvements over the next few decades to address current and future congestion. While the CSMP process identified improvements in a general sense, a link is needed between this and the project development process, beginning with the Project Initiation Document (PID) phase. The Preliminary Investigation (PI) study will serve as this link by identifying and prioritizing specific improvement projects based on their costs and benefits. This PI recommends a future 2035 selected facility alternative to handle the travel demands of the next 25 years and contains a prioritized list of specific State Highway System improvement projects to arrive at this future. SETTING Interstate 80 is the primary freeway serving the movement of people and goods between the San Francisco Bay Area and the eastern United States. Within the Sacramento region, the route mainly serves commute traffic to/from the San Francisco Bay Area, though it also carries seasonal recreational traffic and is a primary corridor for goods movement. Within the corridor, the Yolo Bypass Wildlife Area and floodplain limits east‐west linkages, funneling many modes and forms of transportation into the narrow corridor between Davis and Sacramento. Within a cross‐section of less than a quarter mile exists the Capitol Corridor inter‐regional rail, Interstate 80, and a dedicated Class I multi‐use bicycle and pedestrian path, linking Davis with downtown Sacramento. United States Route 50 begins within the study area at the I‐80 interchange in West Sacramento and continues over 3,000 miles to the east coast of the United States. Within the Sacramento region, US 50 carries mostly regional commute traffic and recreational traffic traveling to/from the Lake Tahoe Basin. The study corridor follows the historical route of I‐80 for over 13 miles, roughly within the bounds of Yolo County, and connects the City of Davis with the City of Sacramento. The limits extend along I‐80 for 9.5 miles from near the Yolo/Solano County line to the I‐80/US 50 interchange and continue 3.3 additional miles along US 50 (also signed as business I‐80) to the Yolo/Sacramento County line, terminating prior to the US 50/I‐5 interchange. The freeway within the study area functions principally as a three lane, mixed‐flow facility between the cities of Davis and West Sacramento and varies between a three and four lane, mixed‐flow facility through the City of West Sacramento to the Sacramento River. Ramp metering is currently operational at five on‐ramps within the corridor and auxiliary lanes are present between many of the interchanges in West Sacramento. Figure 1 presents the limits of the PI along the I‐80 and US 50 corridors, while Figure 2 shows the existing lane configuration and traffic control.
S O L A N OC O U N T Y
S A C R A M E N T OC O U N T Y
80
50
Y O L O C O U N T Y
City ofWest Sacramento
Chiles Rd
Enterprise Blvd
Mace
Blvd
Richards Blvd
City of Davis
City ofSacramento
Harb
or B
lvd
Jeffe
rson
Blvd
S Riv
er Rd
80
80
5
5
SacramentoRiver
FIGURE 1: Study Area
113
LEGEND
Capitol Corridor
Regional Bicycle Route NOT TO SCALE
Project Study Corridor
Yolo BypassWildlife Area
DESCRIPTION
State Highway System
The study corridor follows the historical route of I-80, roughly within thebounds of Yolo County, connecting the City of Davis with the City ofSacramento. The limits travel along I-80 for 9.5 miles from near the Yolo/SolanoCounty line to the I-80/US 50 interchange and continue 3.3 additional milesalong US 50 (also signed as business I-80) to near the Yolo/SacramentoCounty line, terminating just prior to the US 50/I-5 interchange.
Flood Plain
5
I-80/US 50 Davis to Downtown Sacramento Preliminary Investigation
June, 2014
While the majority of the corridor is an at-grade facility, two segments contain substantial bridge structures, adding a major constraint to any potential improvements. The first of these is a pair of structures along I-80 spanning the Yolo Bypass, a primary wildlife and agricultural area that experiences seasonal flooding. These bridge structures total over 2.2 miles in length at a height of approximately 16 feet above the ground. The second is a structure that begins in the middle of the Jefferson Blvd. interchange and extends across the Sacramento River for 0.8 miles, before meeting with the I-5/US 50 interchange. The portion of the corridor that travels through West Sacramento is threaded through a narrow right-of-way that would require additional acquisition to accommodate any widening. PURPOSE AND NEED The study corridor currently experiences significant congestion during the AM and PM peak periods at several locations in the eastbound and westbound direction along I-80 and US 50. Furthermore, the SACOG Blueprint plan for the Sacramento Region projects sizeable increases in vehicle volumes along the corridor over the next 25 years. With the potential for worsening congestion and the subsequent increase in travel times and vehicle emissions, the corridor has been identified in the respective I-80 and US 50 Corridor System Management Plans and Transportation Corridor Concept Reports as an area that will require further capital improvements. The Caltrans District 3 Mobility Action Plan supports a vision for a network of HOV lanes on all freeway facilities in the Sacramento region, with the study corridor providing a principal link in the proposed network. Without completing the network of HOV lanes, the incentive for carpooling is significantly decreased, and consequently, the effectiveness of HOV lanes across the entire region is compromised. The intent of this study is to determine what transportation scenario for the future will best accommodate current and future needs, while remaining consistent with the goals and policies of Caltrans and its partners. The resulting projects should provide for more efficient and environmentally friendly travel along the corridor, while considering both the supply and demand sides of the transportation system. STUDY APPROACH The process for determining a list of phased state highway system improvement projects contains two parts. The first is to determine the ultimate future configuration of the corridor. This may involve keeping the current travelway cross-section, adding a mixed-flow lane, adding a high-occupancy vehicle (HOV) lane, or adding a high-occupancy toll (HOT) lane. Upon determination of the selected alternative, the projects required to achieve this ultimate cross-section, including complimentary projects such as ramp metering and auxiliary lanes, will be phased to generate a prioritized list of projects. To this end, the remainder of the report contains the following chapters:
• Chapter 2: Existing Conditions • Chapter 3: Future Year Alternatives • Chapter 4: Travel Demand Forecasts • Chapter 5: Future Conditions Analysis • Chapter 6: Improvement Project Prioritization • Chapter 7: Conclusions and Recommendations

6
I-80/US 50 Davis to Downtown Sacramento Preliminary Investigation
June, 2014
Chapter 2 provides an overview of the current facilities along the corridor and their existing performance and level of service. Several potential future alternatives for the corridor are detailed in Chapter 3 and analyzed using the Highway Capacity Manual methodologies and microsimulation software in Chapter 5. Between these chapters, the future travel forecasts and their development are detailed. Chapter 6 presents the prioritization and phasing of the projects needed to deliver the future build alternative. Finally, a discussion of the overall findings of the report will be included in Chapter 7.
7
I-80/US 50 Davis to Downtown Sacramento Preliminary Investigation
June, 2014
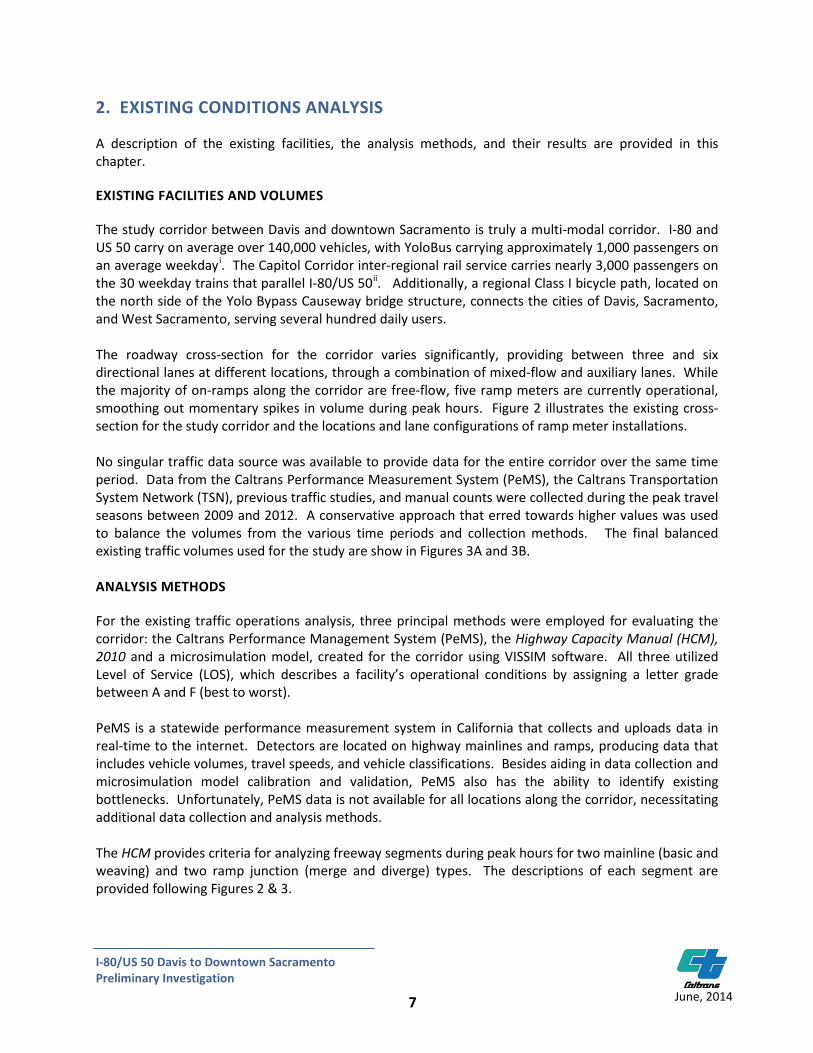
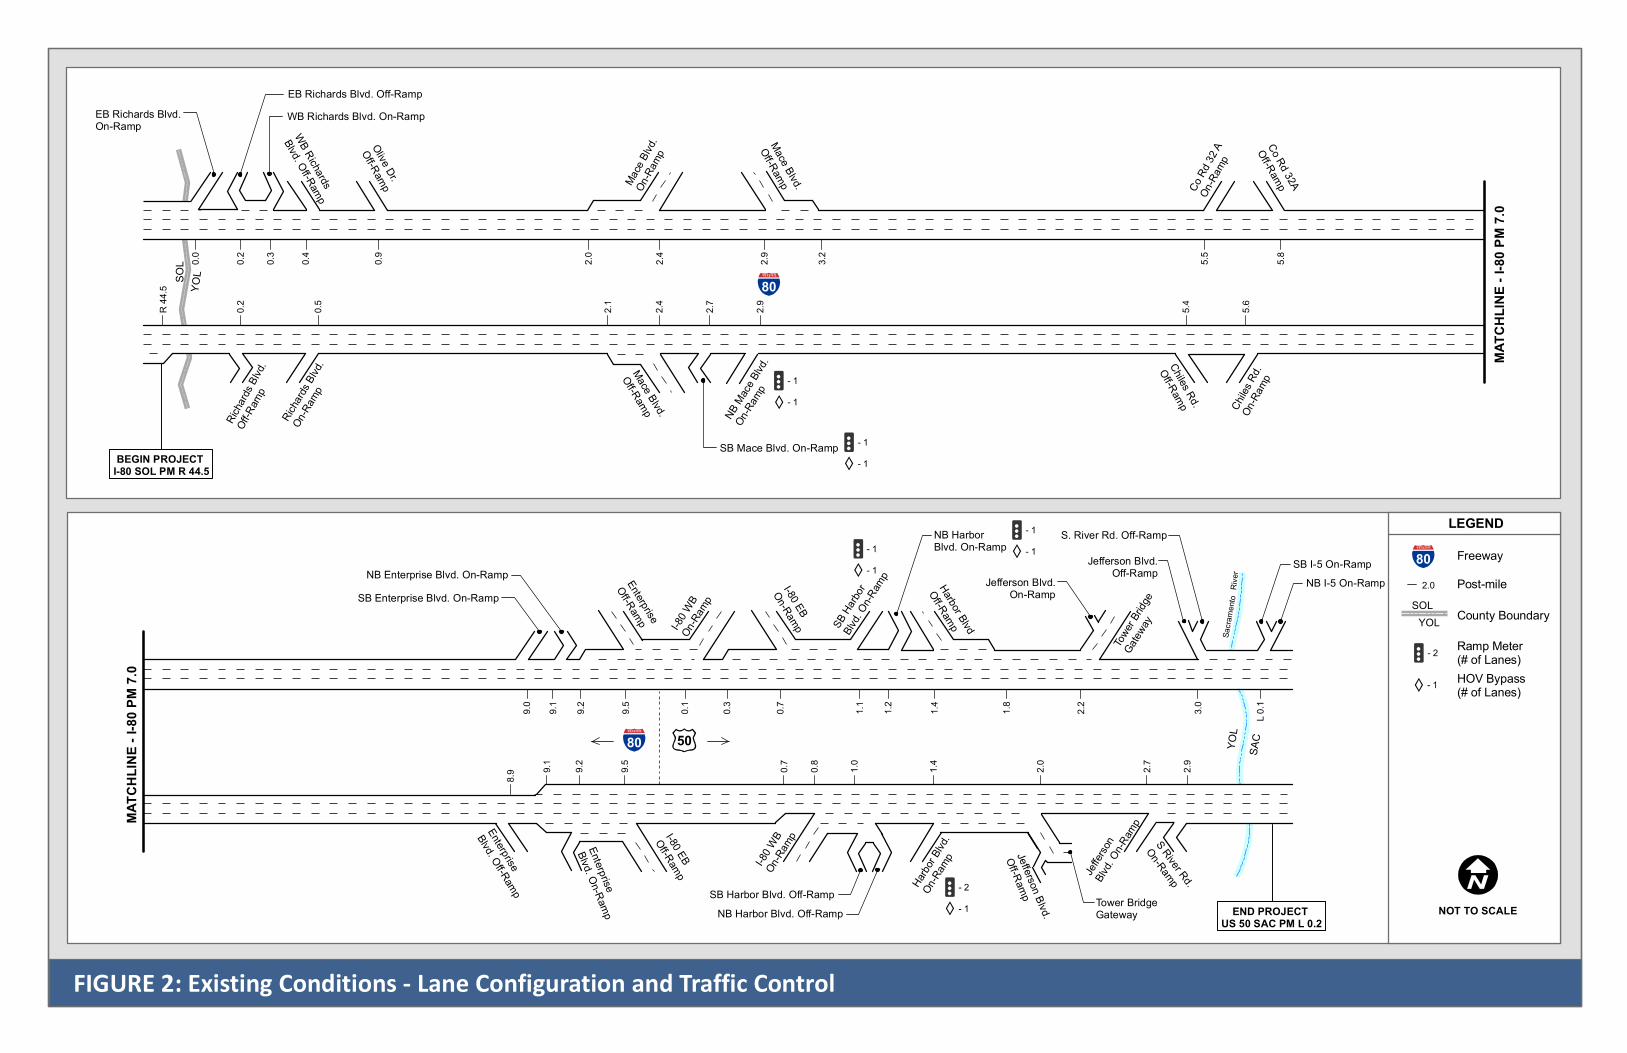
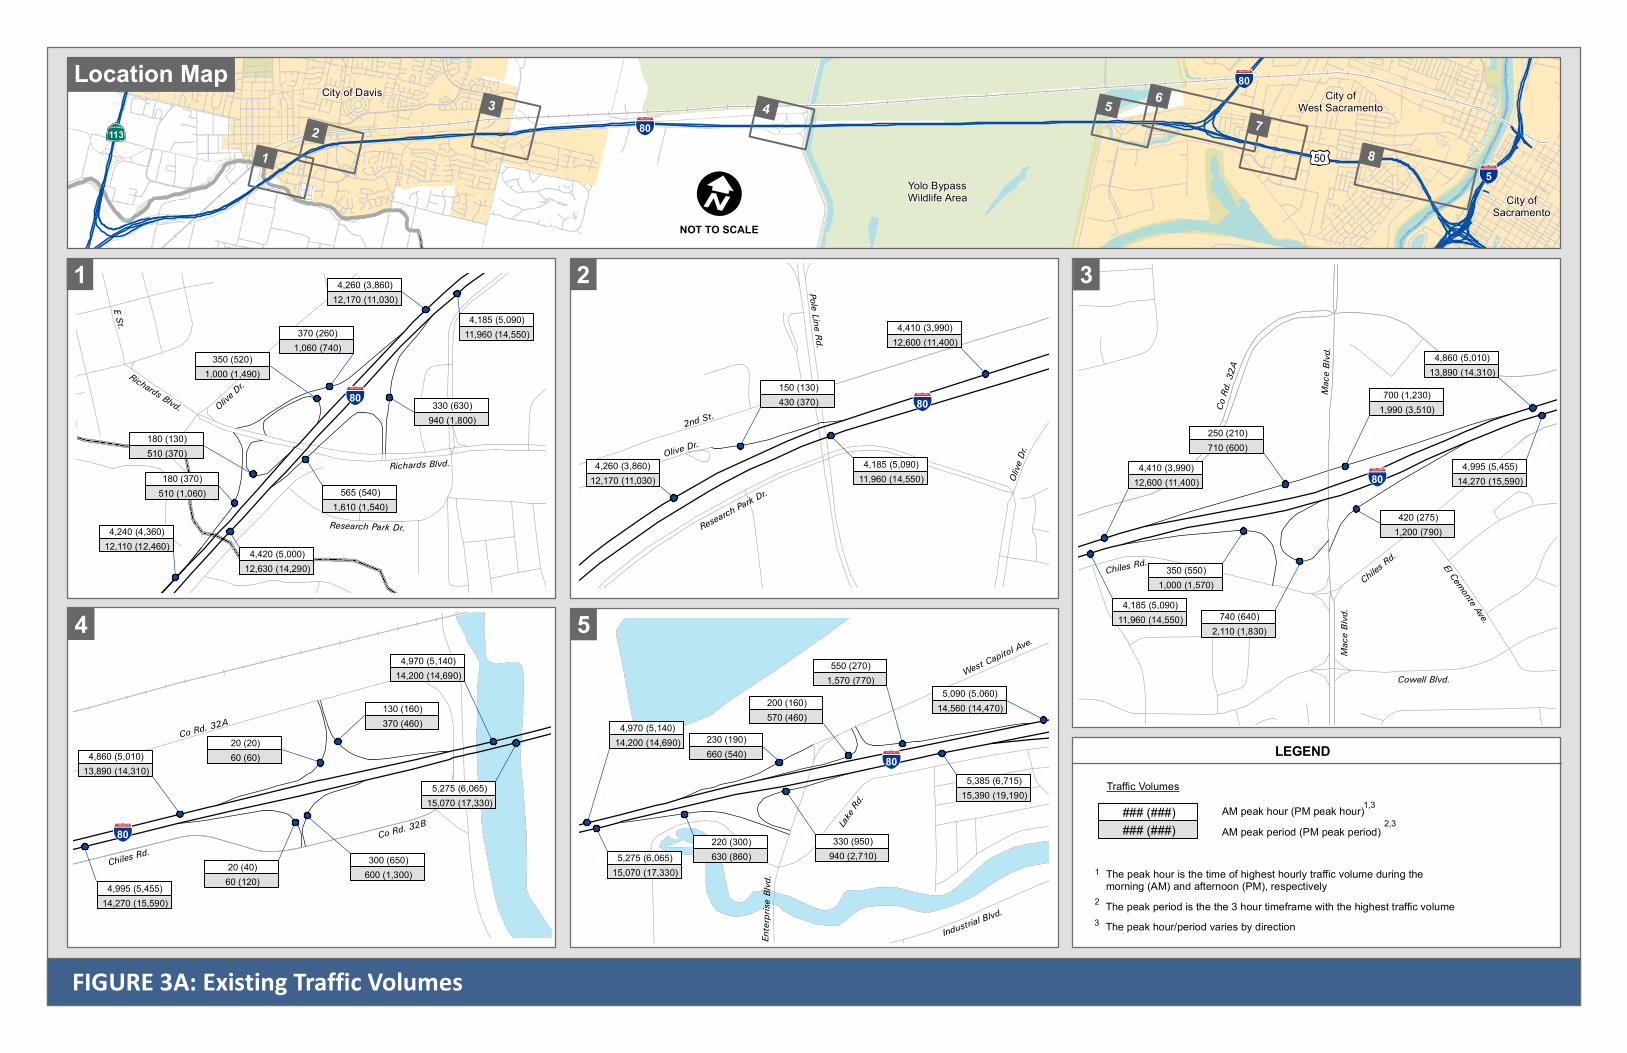
2. EXISTING CONDITIONS ANALYSIS A description of the existing facilities, the analysis methods, and their results are provided in this chapter. EXISTING FACILITIES AND VOLUMES The study corridor between Davis and downtown Sacramento is truly a multi-modal corridor. I-80 and US 50 carry on average over 140,000 vehicles, with YoloBus carrying approximately 1,000 passengers on an average weekdayi. The Capitol Corridor inter-regional rail service carries nearly 3,000 passengers on the 30 weekday trains that parallel I-80/US 50ii. Additionally, a regional Class I bicycle path, located on the north side of the Yolo Bypass Causeway bridge structure, connects the cities of Davis, Sacramento, and West Sacramento, serving several hundred daily users. The roadway cross-section for the corridor varies significantly, providing between three and six directional lanes at different locations, through a combination of mixed-flow and auxiliary lanes. While the majority of on-ramps along the corridor are free-flow, five ramp meters are currently operational, smoothing out momentary spikes in volume during peak hours. Figure 2 illustrates the existing cross-section for the study corridor and the locations and lane configurations of ramp meter installations. No singular traffic data source was available to provide data for the entire corridor over the same time period. Data from the Caltrans Performance Measurement System (PeMS), the Caltrans Transportation System Network (TSN), previous traffic studies, and manual counts were collected during the peak travel seasons between 2009 and 2012. A conservative approach that erred towards higher values was used to balance the volumes from the various time periods and collection methods. The final balanced existing traffic volumes used for the study are show in Figures 3A and 3B. ANALYSIS METHODS For the existing traffic operations analysis, three principal methods were employed for evaluating the corridor: the Caltrans Performance Management System (PeMS), the Highway Capacity Manual (HCM), 2010 and a microsimulation model, created for the corridor using VISSIM software. All three utilized Level of Service (LOS), which describes a facility’s operational conditions by assigning a letter grade between A and F (best to worst). PeMS is a statewide performance measurement system in California that collects and uploads data in real-time to the internet. Detectors are located on highway mainlines and ramps, producing data that includes vehicle volumes, travel speeds, and vehicle classifications. Besides aiding in data collection and microsimulation model calibration and validation, PeMS also has the ability to identify existing bottlenecks. Unfortunately, PeMS data is not available for all locations along the corridor, necessitating additional data collection and analysis methods. The HCM provides criteria for analyzing freeway segments during peak hours for two mainline (basic and weaving) and two ramp junction (merge and diverge) types. The descriptions of each segment are provided following Figures 2 & 3.
YOL
LEGEND
NOT TO SCALE
MATC
HLIN
E - I-8
0 PM
7.0
MATC
HLIN
E - I-8
0 PM
7.0EB Richards Blvd.On-Ramp
EB Richards Blvd. Off-RampWB Richards Blvd. On-Ramp
WB Richards
Blvd. Off-Ramp
Olive Dr.
Off-Ramp
0.0
0.2
0.3
0.4 0.9
2.4
2.9
3.2
Mace
Blvd.
On-Ra
mp
Co Rd
32 A
On-Ra
mp
Co Rd 32A
Off-Ramp
5.5
5.8
YOL
R 44
.5SO
L
BEGIN PROJECT I-80 SOL PM R 44.5
SAC
END PROJECT US 50 SAC PM L 0.2
Richa
rds Bl
vd.Off
-Ramp
Richar
ds Blv
d.On
-Ramp
Mace Blvd.
Off-Ramp
SB Mace Blvd. On-Ramp
NB Mace
Blvd.
On-Ra
mp
Chiles
Rd.
On-Ra
mp
Chiles Rd.
Off-Ramp
0.2
0.5
2.1
2.4
2.7
2.9
5.4
5.6
8.9 9.
1
9.2
9.5
0.7
0.8
1.0
1.4
2.0
2.7
2.9
Enterprise
Blvd. Off-Ramp
Enterprise
Blvd. On-Ramp
I-80 EB
Off-Ramp I-80 W
BOn
-Ramp
SB Harbor Blvd. Off-RampNB Harbor Blvd. Off-Ramp
Harbo
r Blvd
.On
-Ramp Jefferson Blvd.
Off-Ramp Tower BridgeGateway
Jeffer
sonBlv
d. On-R
amp
S River Rd.
On-Ramp
9.0
9.1
9.5
9.2
0.1
0.3
0.7
1.1
1.2
1.4
1.8
2.2
3.0
L 0.1
SB Enterprise Blvd. On-RampNB Enterprise Blvd. On-Ramp Enterprise
Off-Ramp I-80 W
BOn
-Ramp
I-80 EB
On-Ramp SB Ha
rbor
Blvd. O
n-Ram
p
NB HarborBlvd. On-Ramp
Harbor Blvd
Off-Ramp
Tower
Bridge
Gatew
ay
Jefferson Blvd.On-Ramp
Jefferson Blvd.Off-Ramp
S. River Rd. Off-Ramp
SB I-5 On-RampNB I-5 On-Ramp
- 1- 1
- 1- 1
- 2- 1
- 1- 1
- 1- 1
50
80
80
FIGURE 2: Existing Conditions - Lane Configuration and Traffic Control
2.0
Mace Blvd.
Off-Ramp
80
County Boundary
Post-mileSOL
YOL
Freeway
Ramp Meter(# of Lanes)
- 1 HOV Bypass(# of Lanes)
- 2
2.0
Sacra
mento
River
NOT TO SCALE
80113
50
80
5
FIGURE 3A: Existing Traffic Volumes
1
4
5 2
Location Map
3
80
420 (275)1,200 (790)
4,185 (5,090)11,960 (14,550)
4,410 (3,990)12,600 (11,400)
350 (550)1,000 (1,570)
740 (640)2,110 (1,830)
250 (210)710 (600)
700 (1,230)1,990 (3,510)
4,860 (5,010)13,890 (14,310)
4,995 (5,455)14,270 (15,590)
Co R
d. 32
A
Mac
e Blvd
.
Chiles R
d.Chiles Rd. El Cemonte Ave.
Cowell Blvd.
3
Mac
e Blvd
.
City of Davis City ofWest Sacramento
City ofSacramento
Yolo BypassWildlife Area
Sacram
ento
River
6
80
Richards Blvd.
Olive Dr.
Research Park Dr.
Richards Blvd.
E St. 4,185 (5,090)11,960 (14,550)
4,420 (5,000)12,630 (14,290)
565 (540)1,610 (1,540)
330 (630)940 (1,800)
4,240 (4,360)12,110 (12,460)
180 (370)510 (1,060)
180 (130)510 (370)
350 (520)1,000 (1,490)
370 (260)1,060 (740)
4,260 (3,860)12,170 (11,030)
1
80
Lake R
d.
West Capitol Ave.
Ente
rpris
e Blv
d.
Industrial Blvd.
4,970 (5,140)14,200 (14,690)
5,275 (6,065)15,070 (17,330)
230 (190)660 (540)
200 (160)570 (460)
5,090 (5,060)14,560 (14,470)
550 (270)1,570 (770)
330 (950)940 (2,710)
5,385 (6,715)15,390 (19,190)
220 (300)630 (860)
LEGEND
### (###)### (###)
AM peak hour (PM peak hour)AM peak period (PM peak period)
1,32,3
Traffic Volumes
1 The peak hour is the time of highest hourly traffic volume during the morning (AM) and afternoon (PM), respectively
2 The peak period is the the 3 hour timeframe with the highest traffic volume3 The peak hour/period varies by direction
8 7
5
2
80
4,185 (5,090)11,960 (14,550)
4,410 (3,990)12,600 (11,400)
150 (130)430 (370)
Olive Dr.2nd St.
Pole Line Rd.
Research Park
Dr.
Olive
Dr.
4,260 (3,860)12,170 (11,030)
4
80
Chiles Rd.
Co Rd. 32A
Co Rd. 32B
4,995 (5,455)14,270 (15,590)
4,860 (5,010)13,890 (14,310)
20 (40)60 (120)
300 (650)600 (1,300)
20 (20)60 (60)
130 (160)370 (460)
4,970 (5,140)14,200 (14,690)
5,275 (6,065)15,070 (17,330)
NOT TO SCALE
80113
50
80
5
FIGURE 3B: Existing Traffic Volumes
1
4
5 2
Location Map 3
City of Davis City ofWest Sacramento
City ofSacramento
Yolo BypassWildlife Area
Sacram
ento
River
5080
80
6
LEGEND
### (###)### (###)
AM peak hour (PM peak hour)AM peak period (PM peak period)
1,32,3
Traffic Volumes
1 The peak hour is the time of highest hourly traffic volume during the morning (AM) and afternoon (PM), respectively
2 The peak period is the the 3 hour timeframe with the highest traffic volume3 The peak hour/period varies by direction
420 (310)1,200 (890)
320 (305)910 (870)
300 (375)860 (1,070)
180 (210)510 (600)
1,060 (890)3,030 (2,540)
4,795 (4,980)13,710 (14,240)
4,850 (5,225)13,860 (14,930)
West Capitol Ave.
Evergreen Ave.
Beacon Blvd.
Harbor Blvd.
Port St.
Shor
e St
.
50
5
8
50
West Capitol Ave.
Evergreen Ave.
Northport Dr.
Harbor Blvd.
50
Park B
lvd
Jefferson Blvd.
Tower B
ridge G
ateway
S Rive
r Rd.
Jefferson Blvd.
Merkley Ave.
4,335 (4,610)12,400 (13,180)
4,785 (5,065)13,680 (14,480)
1,000 (1,050)2,860 (3,000)
2,610 (3,690)7,460 (10,540)
2,765 (2,490)7,900 (7,120)
1,755 (1,500)5,010 (4,290)
1,010 (990)2,890 (2,830)
1,610 (2,640)4,600 (7,540)
240 (280)690 (800)
520 (582)14,090 (16,060)
1,560 (1,190)4,460 (3,400)
495 (440)1,410 (1,260)
6,170 (6,325)17,630 (18,070)
5,175 (4,760)14,790 (13,630)
400 (130)1,140 (370)1,070 (1,000)
3,160 (2,860)
Wes
tacre
Rd.
880 (1,100)2,510 (3,150)
210 (280)600 (800)
5,090 (5,060)14,560 (14,470)5,385 (6,715)
15,390 (19,190)
7
4,785 (5,065)13,680 (14,480)
4,335 (4,610)12,400 (13,180)
685 (840)1,960 (2,400)
4,795 (4,980)13,710 (14,240)
4,850 (5,225)13,860 (14,930)
8
6 7

11
I-80/US 50 Davis to Downtown Sacramento Preliminary Investigation
June, 2014
• Ramp Merge – the 1,500 foot influence area downstream of an on-ramp gore point • Ramp Diverge – the 1,500 foot influence area upstream of an off-ramp gore point • Weaving Segment – a segment that occurs when the distance between an on-ramp and
downstream off-ramp is less than 2,500 feet • Basic Segment – includes all freeway segments that don’t meet the criteria for weaving, merge,
or diverge analysis
LOS for each analysis type is calculated using density in passenger cars per mile per lane (pc/mi/ln) for the 15 minute period with the highest volume during the morning and afternoon. Table 1 describes the LOS thresholds from the HCM, 2010.
TABLE 1: Highway Capacity Manual Freeway LOS Thresholds
Level of Service Description
Density (pc/mi/ln)
Basic Segment Ramp
Merge/Diverge & Weaving
A Unrestricted operations; drivers operate at free-flow speeds ≤ 11 ≤ 10
B Free-flow speed is generally maintained; merging and diverging maneuvers noticeable to drivers > 11 - 18 > 10 - 20
C Maneuverability within the traffic flow begins to become restricted; influence area speeds may begin to decline from free-flow > 18 - 26 > 20 - 28
D Drivers experience decrease in comfort from the inability to freely maneuver; influence area turbulence becomes intrusive > 26 - 35 > 28 - 35
E Facility is saturated, any disruption causes a breakdown in flow; turbulence felt by nearly all drivers > 35 - 45 > 35
F Demand volume exceeds capacity, total breakdown in flow; ramp and freeway queues begin to form > 45 N/A
Source: Highway Capacity Manual (2010). Transportation Research Board, Washington, D.C.. The Highway Capacity Manual describes eight instances where this freeway analysis methodology may be limited in accurately describing conditions on a particular facilityiii. Of these eight, five are relevant to the I-80/US 50 corridor currently or in the future, including:
1. The methodology does not account for the delays caused by vehicles using alternative routes or vehicles leaving before or after the analysis period.
2. Multiple overlapping breakdowns or bottlenecks are difficult to analyze and cannot be fully evaluated by this methodology.
3. The methodology can address local oversaturated flow but cannot directly address systemwide oversaturation flow conditions.
4. The completeness of the analysis will be limited if freeway segments in the first time interval, the last time interval, and the first freeway segment (in all time periods) have demand-to-capacity ratios greater than 1.00.

12
I-80/US 50 Davis to Downtown Sacramento Preliminary Investigation
June, 2014
5. The existence of HOV lanes on freeways raises the issues of the operating characteristics of such lanes and their effect on operating characteristics on the remainder of the freeway. The methodology does not directly address separated HOV facilities and does account for the interactions between HOV lanes and mixed-flow lanes and the weaving that may be produced.
Given these limitations, it was determined that microsimulation modeling was the preferred means to analyze future conditions along the corridor. VISSIM models were created, analyzing 3-hour time periods during the morning and afternoon peak periods that exhibited the highest volumes. The roadway network for these models includes the corridor and all nearby influence areas. To determine that the model accurately represented current conditions, a rigorous calibration process was undertaken. Vehicle fleet composition was altered and driver behavior characteristics were adjusted from default values using PeMS data, field observations, and the values used for previous studies within the area and across California. Further sensitivity testing was conducted in the model validation step to ensure that the model accurately replicated existing conditions with changes in inputs (e.g., volumes). PEMS ANALYSIS In addition to aiding in data collection, PeMS was used to identify several recurring bottlenecks along the corridor. These bottlenecks were verified by field observations. The locations, descriptions, and causes are listed below in Table 2.
TABLE 2: Bottlenecks Identified by PeMS Freeway/ Direction Location Description Cause
I-80 Eastbound
Near Yolo County Line Stop and go traffic between SR 113 and the Yolo County Line during the PM peak hour
Successive outside lane drops before Richards Blvd.
Chiles Rd. Interchange
Bottleneck sometimes extending miles back to Richards Blvd., with travel speeds averaging around 15 mi/hr, during the entire 3 hour PM peak period
Traffic bypassing the high-capacity Mace Blvd. interchange travels along county roads and enters at the low-capacity Chiles Rd. interchange; bottleneck becomes self-reinforcing as more people use bypass as congestion worsens, further increasing congestion
Jefferson Blvd. Interchange
Minor bottleneck resulting in reduced speeds during the PM peak hour
A series of factors, including very high traffic volume entering from Jefferson Blvd., the close proximity to the S River Rd. on-ramp, and weaving behavior in anticipation of the US 50/I-5 interchange
I-80 Westbound
Enterprise Blvd. Interchange
Stop and go traffic between the I-80/US 50 interchange and the westernmost Enterprise Blvd. on-ramp during the AM and PM peak hours
Short weaving section between interchanges and successive outside lane drops
13
I-80/US 50 Davis to Downtown Sacramento Preliminary Investigation
June, 2014
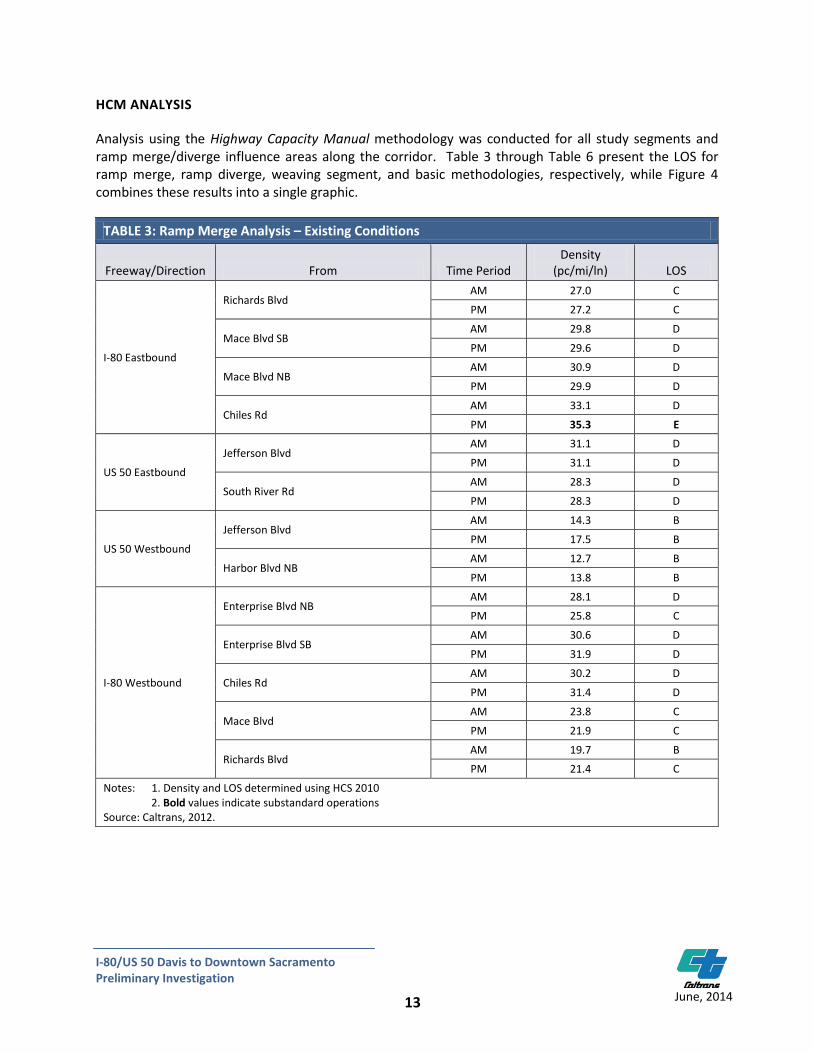
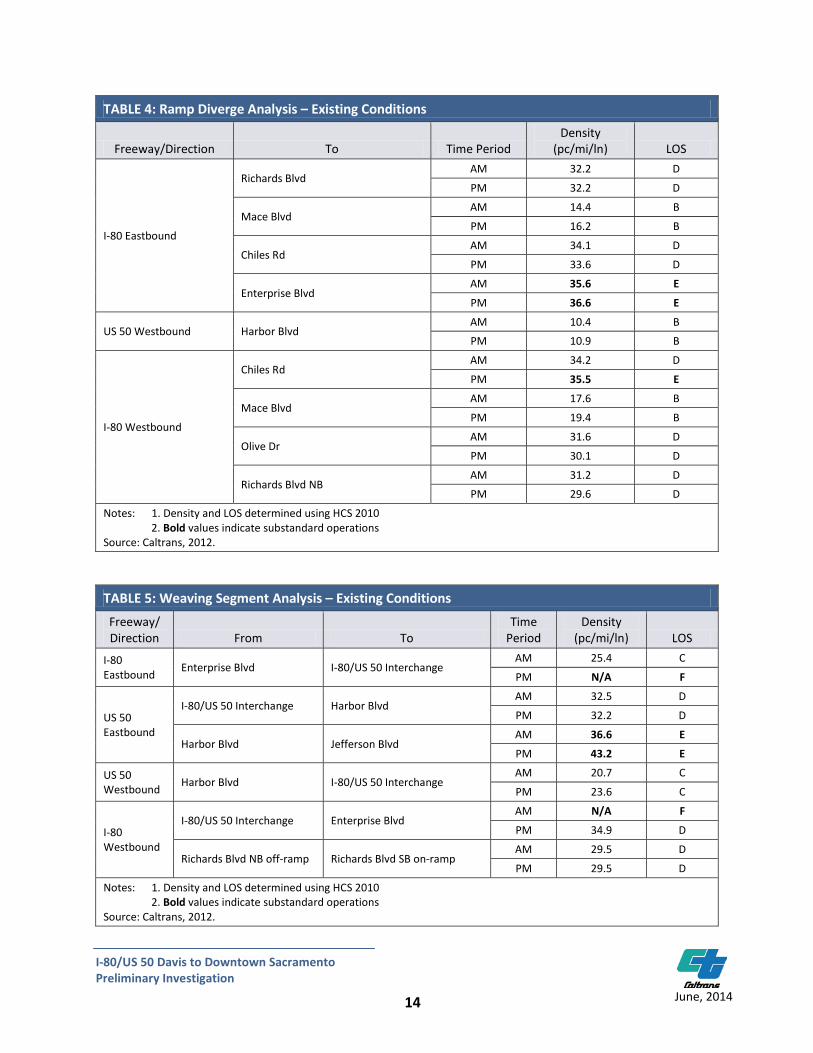
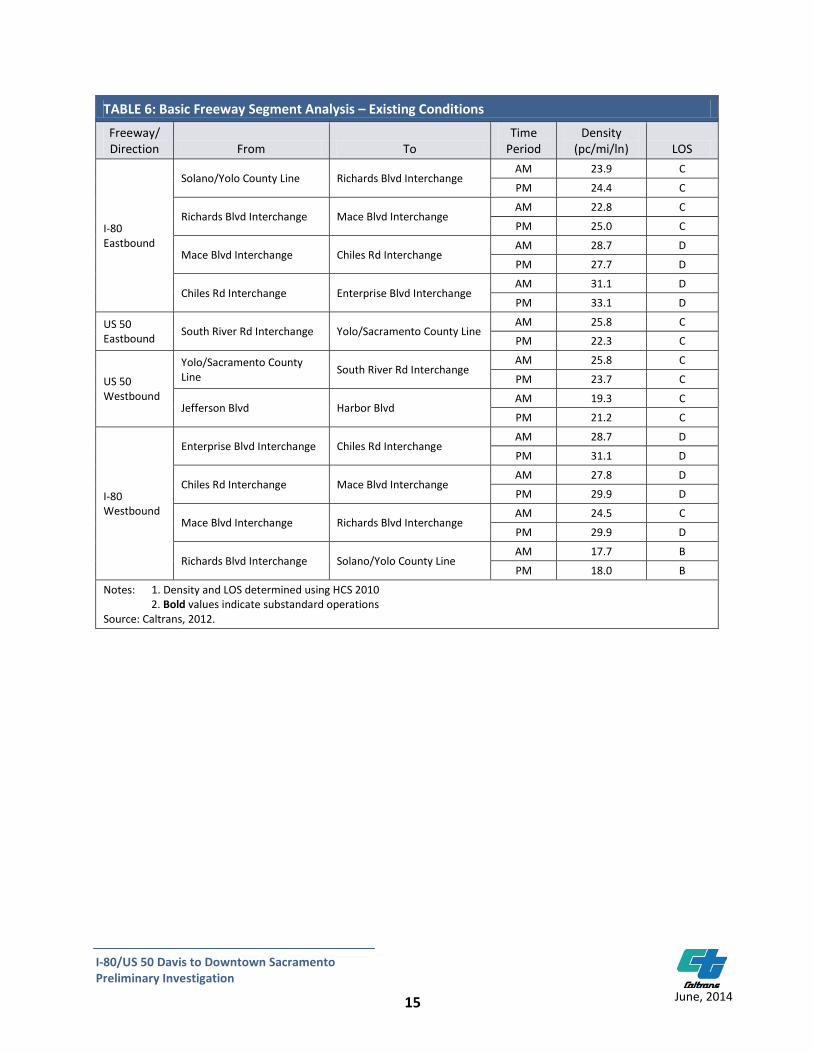
HCM ANALYSIS Analysis using the Highway Capacity Manual methodology was conducted for all study segments and ramp merge/diverge influence areas along the corridor. Table 3 through Table 6 present the LOS for ramp merge, ramp diverge, weaving segment, and basic methodologies, respectively, while Figure 4 combines these results into a single graphic.
TABLE 3: Ramp Merge Analysis – Existing Conditions
Freeway/Direction From Time Period Density
(pc/mi/ln) LOS
I-80 Eastbound
Richards Blvd AM 27.0 C
PM 27.2 C
Mace Blvd SB AM 29.8 D
PM 29.6 D
Mace Blvd NB AM 30.9 D
PM 29.9 D
Chiles Rd AM 33.1 D
PM 35.3 E
US 50 Eastbound
Jefferson Blvd AM 31.1 D
PM 31.1 D
South River Rd AM 28.3 D
PM 28.3 D
US 50 Westbound
Jefferson Blvd AM 14.3 B
PM 17.5 B
Harbor Blvd NB AM 12.7 B
PM 13.8 B
I-80 Westbound
Enterprise Blvd NB AM 28.1 D
PM 25.8 C
Enterprise Blvd SB AM 30.6 D
PM 31.9 D
Chiles Rd AM 30.2 D
PM 31.4 D
Mace Blvd AM 23.8 C
PM 21.9 C
Richards Blvd AM 19.7 B
PM 21.4 C
Notes: 1. Density and LOS determined using HCS 2010 2. Bold values indicate substandard operations
Source: Caltrans, 2012.
14
I-80/US 50 Davis to Downtown Sacramento Preliminary Investigation
June, 2014
TABLE 4: Ramp Diverge Analysis – Existing Conditions
Freeway/Direction To Time Period Density
(pc/mi/ln) LOS
I-80 Eastbound
Richards Blvd AM 32.2 D
PM 32.2 D
Mace Blvd AM 14.4 B
PM 16.2 B
Chiles Rd AM 34.1 D
PM 33.6 D
Enterprise Blvd AM 35.6 E
PM 36.6 E
US 50 Westbound Harbor Blvd AM 10.4 B
PM 10.9 B
I-80 Westbound
Chiles Rd AM 34.2 D
PM 35.5 E
Mace Blvd AM 17.6 B
PM 19.4 B
Olive Dr AM 31.6 D
PM 30.1 D
Richards Blvd NB AM 31.2 D
PM 29.6 D
Notes: 1. Density and LOS determined using HCS 2010 2. Bold values indicate substandard operations
Source: Caltrans, 2012.
TABLE 5: Weaving Segment Analysis – Existing Conditions Freeway/ Direction From To
Time Period
Density (pc/mi/ln) LOS
I-80 Eastbound Enterprise Blvd I-80/US 50 Interchange
AM 25.4 C
PM N/A F
US 50 Eastbound
I-80/US 50 Interchange Harbor Blvd AM 32.5 D
PM 32.2 D
Harbor Blvd Jefferson Blvd AM 36.6 E
PM 43.2 E
US 50 Westbound Harbor Blvd I-80/US 50 Interchange
AM 20.7 C
PM 23.6 C
I-80 Westbound
I-80/US 50 Interchange Enterprise Blvd AM N/A F
PM 34.9 D
Richards Blvd NB off-ramp Richards Blvd SB on-ramp AM 29.5 D
PM 29.5 D
Notes: 1. Density and LOS determined using HCS 2010 2. Bold values indicate substandard operations
Source: Caltrans, 2012.
15
I-80/US 50 Davis to Downtown Sacramento Preliminary Investigation
June, 2014
TABLE 6: Basic Freeway Segment Analysis – Existing Conditions Freeway/ Direction From To
Time Period
Density (pc/mi/ln) LOS
I-80 Eastbound
Solano/Yolo County Line Richards Blvd Interchange AM 23.9 C
PM 24.4 C
Richards Blvd Interchange Mace Blvd Interchange AM 22.8 C
PM 25.0 C
Mace Blvd Interchange Chiles Rd Interchange AM 28.7 D
PM 27.7 D
Chiles Rd Interchange Enterprise Blvd Interchange AM 31.1 D
PM 33.1 D
US 50 Eastbound South River Rd Interchange Yolo/Sacramento County Line
AM 25.8 C
PM 22.3 C
US 50 Westbound
Yolo/Sacramento County Line South River Rd Interchange
AM 25.8 C
PM 23.7 C
Jefferson Blvd Harbor Blvd AM 19.3 C
PM 21.2 C
I-80 Westbound
Enterprise Blvd Interchange Chiles Rd Interchange AM 28.7 D
PM 31.1 D
Chiles Rd Interchange Mace Blvd Interchange AM 27.8 D
PM 29.9 D
Mace Blvd Interchange Richards Blvd Interchange AM 24.5 C
PM 29.9 D
Richards Blvd Interchange Solano/Yolo County Line AM 17.7 B
PM 18.0 B
Notes: 1. Density and LOS determined using HCS 2010 2. Bold values indicate substandard operations
Source: Caltrans, 2012.

AM PEAK HOUR
80
80
80
80
50
50
PM PEAK HOUR
Level of ServiceMerge/Diverge
RampBasic/Weaving
SegmentA
EDCB
F
5
5
1 Mile
Chiles Rd
Enterprise BlvdJefferson Blvd
Mace Blvd
Richards Blvd
I-80/US 50 Interchange
Harbor Blvd
South River Rd
Chiles Rd
Enterprise BlvdJefferson Blvd
Mace Blvd
Richards Blvd
I-80/US 50 Interchange
Harbor Blvd
South River Rd
City ofWest Sacramento
City ofWest Sacramento
City of Davis
City of Davis
FIGURE 4: Existing Conditions - HCM Level of Service

17
I-80/US 50 Davis to Downtown Sacramento Preliminary Investigation
June, 2014
The HCM method, while limited, provides some insight into existing bottlenecks and congestion within the study area. No LOS values for the basic segments exceed LOS D, indicating relatively stable conditions throughout the corridor. The weaving segment analysis reveals the highest number of locations, four (two each during the AM and PM peak hours), that exceed LOS D. The eastbound Chiles Rd. interchange on-ramp during the PM peak hour (LOS E) is the only merge segment that exceeds LOS D, while eastbound Enterprise Rd. during the AM and PM peak hour and westbound Chiles Rd. during the PM peak hour all function at LOS E. Overall, the results of the HCM analysis indicate that the current mainline cross-section for the corridor is generally sufficient; however, geometric design issues (tight interchange spacing, insufficient merge distances, and successive lane drops) and the inefficient use of alternative corridors, limit mainline capacity at certain locations. This results in bottlenecks that limit downstream capacities and, by extension, the overall effective capacity of the corridor. MICROSIMULATION ANALYSIS Microsimulation models were created for the three hour morning and afternoon peak periods using VISSIM software. The models were calibrated and validated, in part, using PeMS and, therefore, present similar results. The VISSIM model, though, takes it a step further by quantifying the existing conditions for various measures of effectiveness (MOEs), with the further intention of modeling future conditions. Table 7 contains values for a range of corridor-wide, directional performance measures that will be used later to compare future scenarios. All metrics are sorted by peak period and direction.
TABLE 7: Existing Conditions Measures of Effectiveness Values
MOE Eastbound Westbound
AM Peak Period PM Peak Period AM Peak Period PM Peak Period
Vehicle-Miles Traveled 171,050 190,560 168,090 180,640
Average Travel Time (minutes) 12:54 23:47 12:12 13:09
Average Speed (mph) 59.0 32.0 62.6 58.1
Total Delay (vehicle-hours) 393 3,049 202 466
Average Delay (seconds) 1:36 12:28 0:54 1:52
Note: MOEs developed using VISSIM 4.3
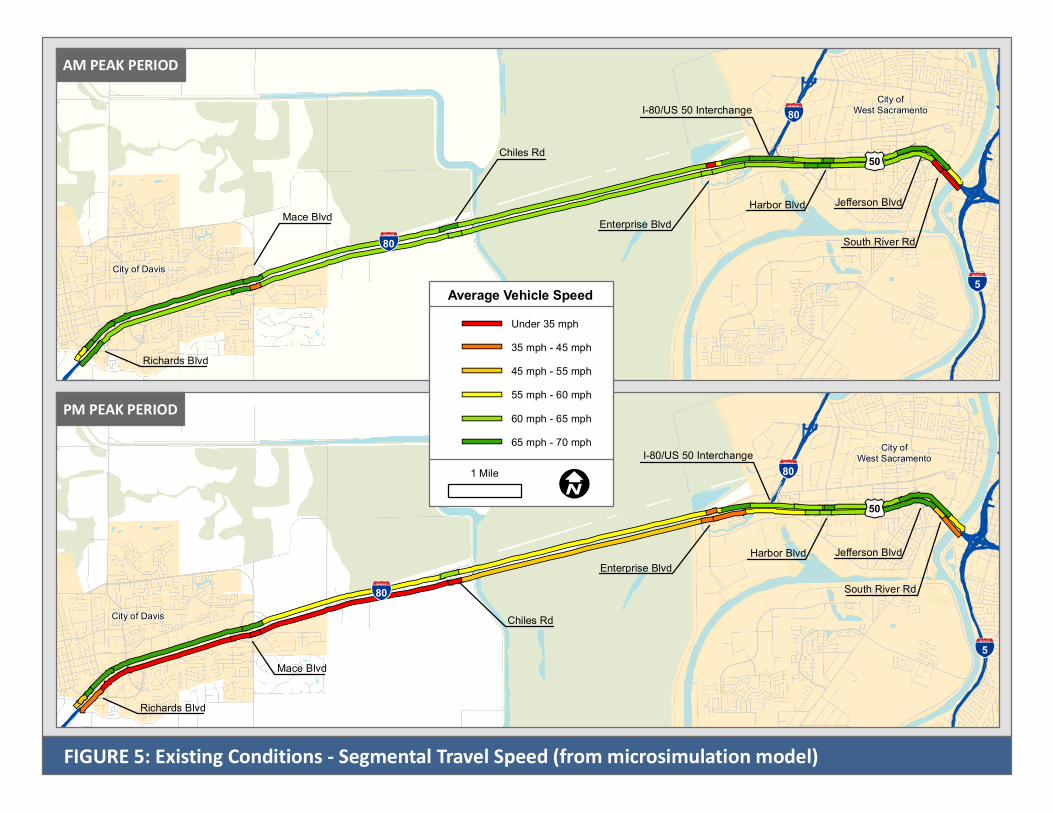
Source: Caltrans, 2012. During the AM peak period, 56,356 vehicles utilized the freeway within the study limits. The PM peak period, with significantly higher volumes and levels of congestion, served 62,139 vehicles along the corridor. Average travel speeds were faster in the westbound direction than the eastbound direction for both the AM and PM peak periods. The most congestion is experienced in the eastbound direction during the PM peak period, with average delays of twelve and a half minutes. By contrast, the least amount of delay is noticed during the AM peak period in the westbound direction, with delay of less than one minute. Travel speed is one measure that can also be utilized at a smaller scale than the corridor-level. Within the micro-simulation model, segments were created between ramp terminals to better understand the effect that specific improvements and bottlenecks have on vehicle speeds, both downstream and
18
I-80/US 50 Davis to Downtown Sacramento Preliminary Investigation
June, 2014
upstream. Figure 5 shows the segmental corridor travels speeds for the AM and PM peak periods from the microsimulation model.
80
80
80
80
50
50
Under 35 mph35 mph - 45 mph45 mph - 55 mph55 mph - 60 mph60 mph - 65 mph65 mph - 70 mph
Average Vehicle Speed
5
5
1 Mile
Chiles Rd
Enterprise BlvdJefferson Blvd
Mace Blvd
Richards Blvd
I-80/US 50 Interchange
Harbor Blvd
South River Rd
Chiles Rd
Enterprise BlvdJefferson Blvd
Mace Blvd
Richards Blvd
I-80/US 50 Interchange
Harbor Blvd
South River Rd
AM PEAK PERIOD
PM PEAK PERIOD
FIGURE 5: Existing Conditions - Segmental Travel Speed (from microsimulation model)
City ofWest Sacramento
City ofWest Sacramento
City of Davis
City of Davis
20
I-80/US 50 Davis to Downtown Sacramento Preliminary Investigation
June, 2014
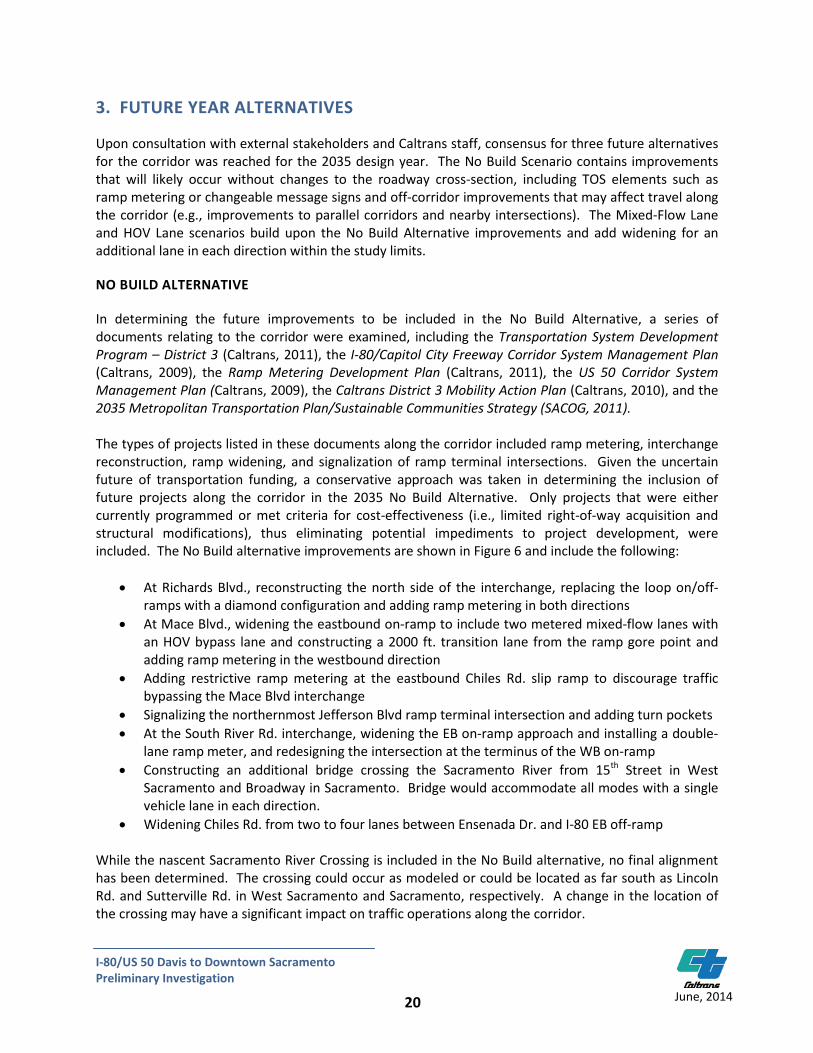
3. FUTURE YEAR ALTERNATIVES Upon consultation with external stakeholders and Caltrans staff, consensus for three future alternatives for the corridor was reached for the 2035 design year. The No Build Scenario contains improvements that will likely occur without changes to the roadway cross-section, including TOS elements such as ramp metering or changeable message signs and off-corridor improvements that may affect travel along the corridor (e.g., improvements to parallel corridors and nearby intersections). The Mixed-Flow Lane and HOV Lane scenarios build upon the No Build Alternative improvements and add widening for an additional lane in each direction within the study limits. NO BUILD ALTERNATIVE In determining the future improvements to be included in the No Build Alternative, a series of documents relating to the corridor were examined, including the Transportation System Development Program – District 3 (Caltrans, 2011), the I-80/Capitol City Freeway Corridor System Management Plan (Caltrans, 2009), the Ramp Metering Development Plan (Caltrans, 2011), the US 50 Corridor System Management Plan (Caltrans, 2009), the Caltrans District 3 Mobility Action Plan (Caltrans, 2010), and the 2035 Metropolitan Transportation Plan/Sustainable Communities Strategy (SACOG, 2011). The types of projects listed in these documents along the corridor included ramp metering, interchange reconstruction, ramp widening, and signalization of ramp terminal intersections. Given the uncertain future of transportation funding, a conservative approach was taken in determining the inclusion of future projects along the corridor in the 2035 No Build Alternative. Only projects that were either currently programmed or met criteria for cost-effectiveness (i.e., limited right-of-way acquisition and structural modifications), thus eliminating potential impediments to project development, were included. The No Build alternative improvements are shown in Figure 6 and include the following:
• At Richards Blvd., reconstructing the north side of the interchange, replacing the loop on/off-ramps with a diamond configuration and adding ramp metering in both directions
• At Mace Blvd., widening the eastbound on-ramp to include two metered mixed-flow lanes with an HOV bypass lane and constructing a 2000 ft. transition lane from the ramp gore point and adding ramp metering in the westbound direction
• Adding restrictive ramp metering at the eastbound Chiles Rd. slip ramp to discourage traffic bypassing the Mace Blvd interchange
• Signalizing the northernmost Jefferson Blvd ramp terminal intersection and adding turn pockets • At the South River Rd. interchange, widening the EB on-ramp approach and installing a double-
lane ramp meter, and redesigning the intersection at the terminus of the WB on-ramp • Constructing an additional bridge crossing the Sacramento River from 15th Street in West
Sacramento and Broadway in Sacramento. Bridge would accommodate all modes with a single vehicle lane in each direction.
• Widening Chiles Rd. from two to four lanes between Ensenada Dr. and I-80 EB off-ramp
While the nascent Sacramento River Crossing is included in the No Build alternative, no final alignment has been determined. The crossing could occur as modeled or could be located as far south as Lincoln Rd. and Sutterville Rd. in West Sacramento and Sacramento, respectively. A change in the location of the crossing may have a significant impact on traffic operations along the corridor.

YOL
LEGEND
NOT TO SCALE
MATC
HLIN
E - I-8
0 PM
7.0
MATC
HLIN
E - I-8
0 PM
7.0EB Richards Blvd.On-Ramp WB Richards
Blvd. Off-Ramp
Olive Dr.
Off-Ramp
0.0
0.2
0.3
0.4 0.9
2.4
2.9
3.2
Mace
Blvd.
On-Ra
mp Co Rd
32 A
On-Ra
mp Co Rd 32A
Off-Ramp
5.5
5.8
YOL
R 44
.5SO
L
BEGIN PROJECT I-80 SOL PM R 44.5
SAC
END PROJECT US 50 SAC PM L 0.2
Richa
rds Bl
vd.Off
-Ramp
Richar
ds Blv
d.On
-Ramp
Mace Blvd.
Off-Ramp
SB Mace Blvd. On-Ramp
NB Mace
Blvd.
On-Ra
mp
Chiles
Rd.
On-Ra
mp
Chiles Rd.
Off-Ramp
0.2
0.5
2.1
2.4
2.7
2.9
5.4
5.6
8.9 9.
1
9.2
9.5
0.7
0.8
1.0
1.4
2.0
2.7
2.9
Enterprise
Blvd. Off-Ramp
Enterprise
Blvd. On-Ramp
I-80 EB
Off-Ramp I-80 W
BOn
-Ramp
SB Harbor Blvd. Off-RampNB Harbor Blvd. Off-Ramp
Harbo
r Blvd
.On
-Ramp Jefferson Blvd.
Off-Ramp Tower BridgeGateway
Jeffer
sonBlv
d. On-R
amp
S River Rd.
On-Ramp
9.0
9.1
9.5
9.2
0.1
0.3
0.7
1.1
1.2
1.4
1.8
2.2
3.0
L 0.1
SB Enterprise Blvd. On-RampNB Enterprise Blvd. On-Ramp Enterprise
Off-Ramp I-80 W
BOn
-Ramp
I-80 EB
On-Ramp SB Ha
rbor
Blvd. O
n-Ram
p
NB HarborBlvd. On-Ramp
Harbor Blvd
Off-Ramp
Tower
Bridge
Gatew
ay
Jefferson Blvd.On-Ramp
Jefferson Blvd.Off-Ramp
S. River Rd. Off-Ramp
SB I-5 On-RampNB I-5 On-Ramp
- 1- 1
- 2- 1
- 1- 1
- 1- 1
50
80
80
80
County BoundaryPost-mile
SOLYOL
Freeway
Ramp Meter(# of Lanes)
- 1 Ramp Meter(# of Lanes)
FIGURE 6: 2035 No Build Alternative - Lane Configuration and Traffic Control
2.0
Mace Blvd.
Off-Ramp
- 2
- 1- 1
- 1- 1
- 2- 1
- 1- 2- 1
Addition fromExisting Conditions
2.0
Restripe LaneAdd Lane
- 1- 1
22
I-80/US 50 Davis to Downtown Sacramento Preliminary Investigation
June, 2014
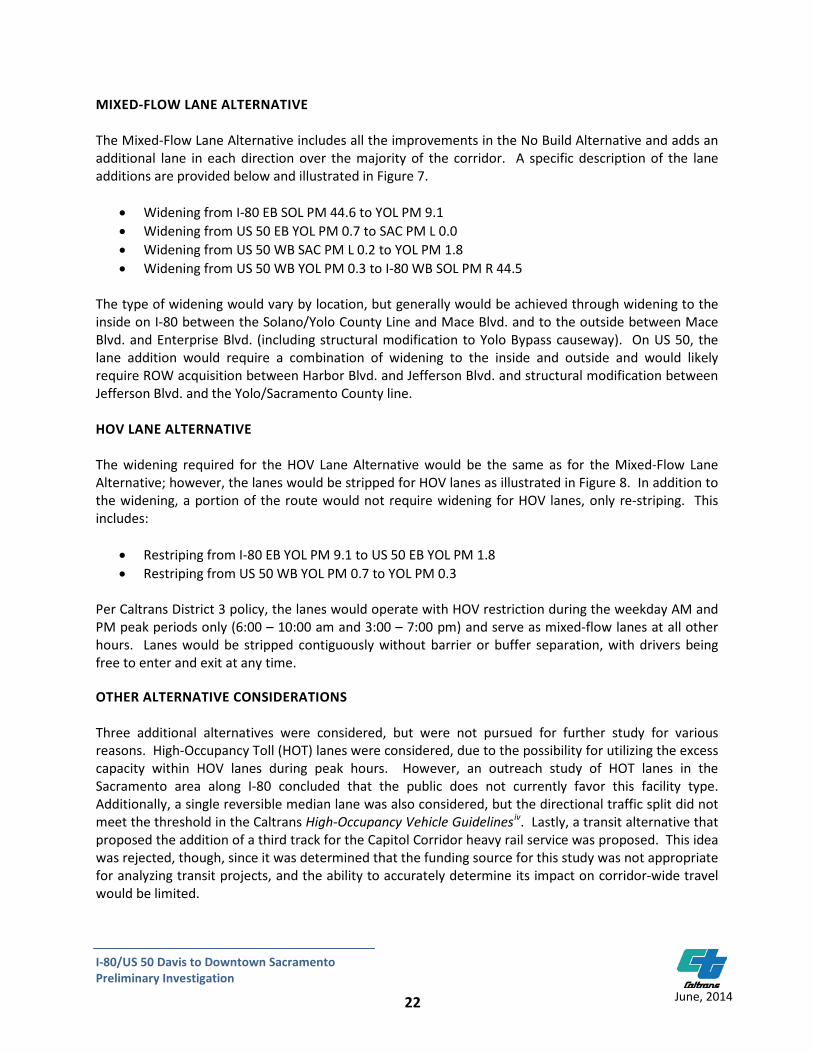
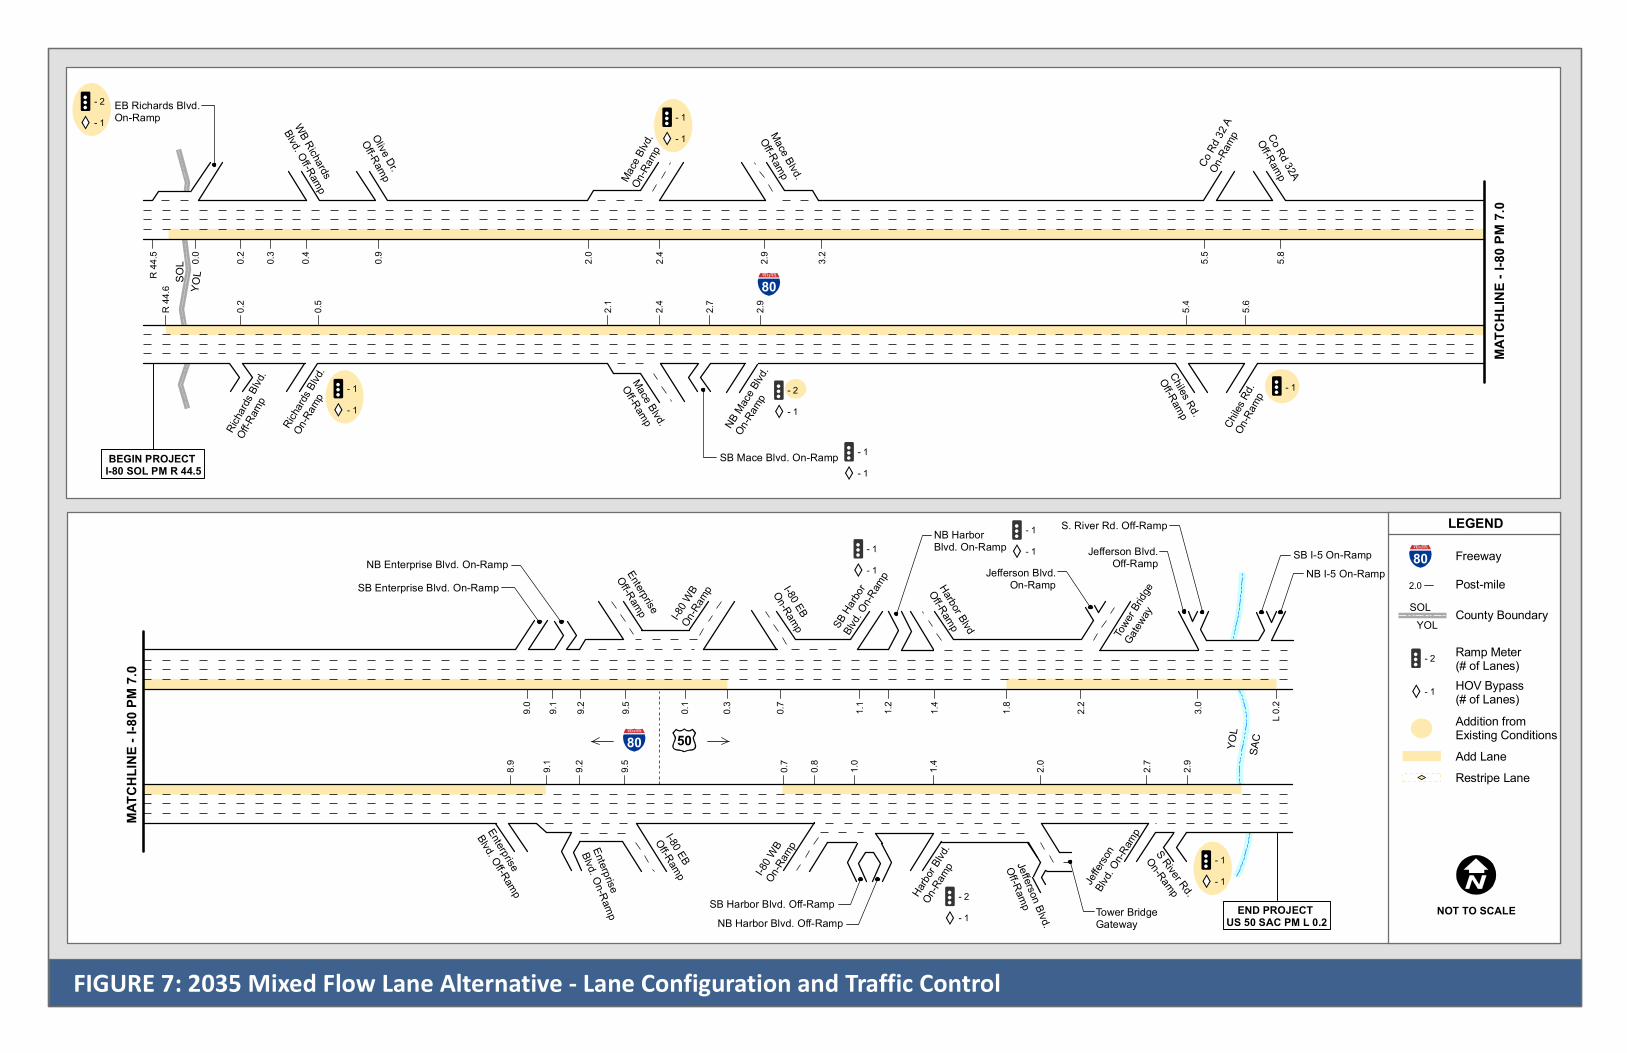
MIXED-FLOW LANE ALTERNATIVE The Mixed-Flow Lane Alternative includes all the improvements in the No Build Alternative and adds an additional lane in each direction over the majority of the corridor. A specific description of the lane additions are provided below and illustrated in Figure 7.
• Widening from I-80 EB SOL PM 44.6 to YOL PM 9.1 • Widening from US 50 EB YOL PM 0.7 to SAC PM L 0.0 • Widening from US 50 WB SAC PM L 0.2 to YOL PM 1.8 • Widening from US 50 WB YOL PM 0.3 to I-80 WB SOL PM R 44.5
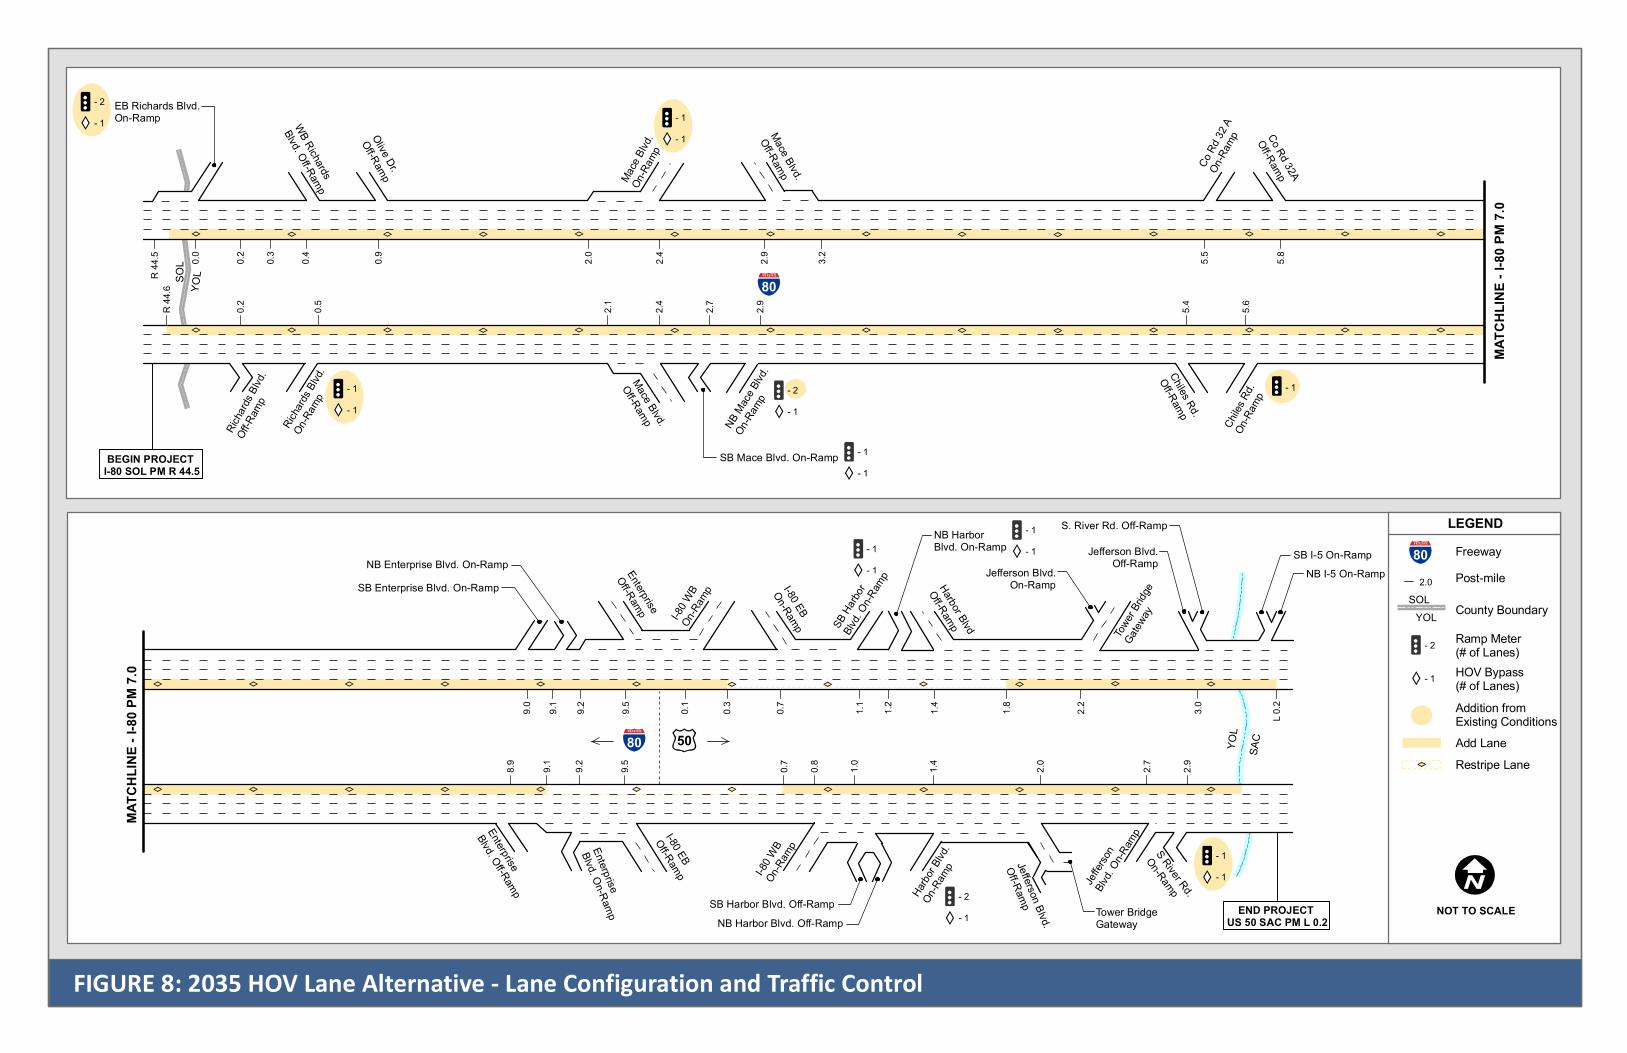
The type of widening would vary by location, but generally would be achieved through widening to the inside on I-80 between the Solano/Yolo County Line and Mace Blvd. and to the outside between Mace Blvd. and Enterprise Blvd. (including structural modification to Yolo Bypass causeway). On US 50, the lane addition would require a combination of widening to the inside and outside and would likely require ROW acquisition between Harbor Blvd. and Jefferson Blvd. and structural modification between Jefferson Blvd. and the Yolo/Sacramento County line. HOV LANE ALTERNATIVE The widening required for the HOV Lane Alternative would be the same as for the Mixed-Flow Lane Alternative; however, the lanes would be stripped for HOV lanes as illustrated in Figure 8. In addition to the widening, a portion of the route would not require widening for HOV lanes, only re-striping. This includes:
• Restriping from I-80 EB YOL PM 9.1 to US 50 EB YOL PM 1.8 • Restriping from US 50 WB YOL PM 0.7 to YOL PM 0.3
Per Caltrans District 3 policy, the lanes would operate with HOV restriction during the weekday AM and PM peak periods only (6:00 – 10:00 am and 3:00 – 7:00 pm) and serve as mixed-flow lanes at all other hours. Lanes would be stripped contiguously without barrier or buffer separation, with drivers being free to enter and exit at any time.
OTHER ALTERNATIVE CONSIDERATIONS Three additional alternatives were considered, but were not pursued for further study for various reasons. High-Occupancy Toll (HOT) lanes were considered, due to the possibility for utilizing the excess capacity within HOV lanes during peak hours. However, an outreach study of HOT lanes in the Sacramento area along I-80 concluded that the public does not currently favor this facility type. Additionally, a single reversible median lane was also considered, but the directional traffic split did not meet the threshold in the Caltrans High-Occupancy Vehicle Guidelinesiv. Lastly, a transit alternative that proposed the addition of a third track for the Capitol Corridor heavy rail service was proposed. This idea was rejected, though, since it was determined that the funding source for this study was not appropriate for analyzing transit projects, and the ability to accurately determine its impact on corridor-wide travel would be limited.
YOL
LEGEND
NOT TO SCALE
MATC
HLIN
E - I-8
0 PM
7.0
MATC
HLIN
E - I-8
0 PM
7.0EB Richards Blvd.On-Ramp WB Richards
Blvd. Off-Ramp
Olive Dr.
Off-Ramp Mace
Blvd.
On-Ra
mp Co Rd
32 A
On-Ra
mp Co Rd 32A
Off-Ramp
YOL
R 44
.6SO
L
BEGIN PROJECT I-80 SOL PM R 44.5
SAC
END PROJECT US 50 SAC PM L 0.2
Richa
rds Bl
vd.Off
-Ramp
Richar
ds Blv
d.On
-Ramp
Mace Blvd.
Off-Ramp
SB Mace Blvd. On-Ramp
NB Mace
Blvd.
On-Ra
mp
Chiles
Rd.
On-Ra
mp
Chiles Rd.
Off-Ramp
0.2
0.5
2.1
2.4
2.7
2.9
5.4
5.6
8.9
9.1
9.2
9.5
0.7
0.8
1.0
1.4
2.0
2.7
2.9
Enterprise
Blvd. Off-Ramp
Enterprise
Blvd. On-Ramp
I-80 EB
Off-Ramp I-80 W
BOn
-Ramp
SB Harbor Blvd. Off-RampNB Harbor Blvd. Off-Ramp
Harbo
r Blvd
.On
-Ramp Jefferson Blvd.
Off-Ramp Tower BridgeGateway
Jeffer
sonBlv
d. On-R
amp
S River Rd.
On-Ramp
9.0
9.1
9.5
9.2
0.1
0.3
0.7
1.1
1.2
1.4
1.8
2.2
3.0
L 0.2
SB Enterprise Blvd. On-RampNB Enterprise Blvd. On-Ramp Enterprise
Off-Ramp I-80 W
BOn
-Ramp I-80 EB
On-Ramp SB Ha
rbor
Blvd. O
n-Ram
p
NB HarborBlvd. On-Ramp
Harbor Blvd
Off-Ramp
Tower
Bridge
Gatew
ay
Jefferson Blvd.On-Ramp
Jefferson Blvd.Off-Ramp
S. River Rd. Off-Ramp
SB I-5 On-RampNB I-5 On-Ramp
- 1- 1
- 2- 1
- 1- 1
- 1- 1
50
80
80
802.0
County Boundary
Post-mileSOL
YOL
Freeway
Ramp Meter(# of Lanes)
- 1 HOV Bypass(# of Lanes)
FIGURE 7: 2035 Mixed Flow Lane Alternative - Lane Configuration and Traffic Control
Mace Blvd.
Off-Ramp
- 2
- 1- 1
- 1- 1
- 2- 1
- 1- 2- 1
Addition fromExisting Conditions
0.0
0.2
0.3
0.4 0.9
2.4
2.9
3.2
5.5
5.8
2.0
R 44
.5
Restripe LaneAdd Lane
- 1- 1
YOL
LEGEND
NOT TO SCALE
MATC
HLIN
E - I-8
0 PM
7.0
MATC
HLIN
E - I-8
0 PM
7.0EB Richards Blvd.On-Ramp WB Richards
Blvd. Off-Ramp
Olive Dr.
Off-Ramp Mace
Blvd.
On-Ra
mp Co Rd
32 A
On-Ra
mp Co Rd 32A
Off-Ramp
YOL
R 44
.6SO
L
BEGIN PROJECT I-80 SOL PM R 44.5
SAC
END PROJECT US 50 SAC PM L 0.2
Richa
rds Bl
vd.Off
-Ramp
Richar
ds Blv
d.On
-Ramp
Mace Blvd.
Off-Ramp
SB Mace Blvd. On-Ramp
NB Mace
Blvd.
On-Ra
mp
Chiles
Rd.
On-Ra
mp
Chiles Rd.
Off-Ramp
0.2
0.5
2.1
2.4
2.7
2.9
5.4
5.6
8.9
9.1
9.2
9.5
0.7
0.8
1.0
1.4
2.0
2.7
2.9
Enterprise
Blvd. Off-Ramp
Enterprise
Blvd. On-Ramp
I-80 EB
Off-Ramp I-80 W
BOn
-Ramp
SB Harbor Blvd. Off-RampNB Harbor Blvd. Off-Ramp
Harbo
r Blvd
.On
-Ramp Jefferson Blvd.
Off-Ramp Tower BridgeGateway
Jeffer
sonBlv
d. On-R
amp
S River Rd.
On-Ramp
9.0
9.1
9.5
9.2
0.1
0.3
0.7
1.1
1.2
1.4
1.8
2.2
3.0
L 0.2
SB Enterprise Blvd. On-RampNB Enterprise Blvd. On-Ramp Enterprise
Off-Ramp I-80 W
BOn
-Ramp I-80 EB
On-Ramp SB Ha
rbor
Blvd. O
n-Ram
p
NB HarborBlvd. On-Ramp
Harbor Blvd
Off-Ramp
Tower
Bridge
Gatew
ay
Jefferson Blvd.On-Ramp
Jefferson Blvd.Off-Ramp
S. River Rd. Off-Ramp
SB I-5 On-RampNB I-5 On-Ramp
- 1- 1
- 2- 1
- 1- 1
- 1- 1
50
80
80
80
County Boundary
Post-mileSOL
YOL
Freeway
Ramp Meter(# of Lanes)
- 1 HOV Bypass(# of Lanes)
FIGURE 8: 2035 HOV Lane Alternative - Lane Configuration and Traffic Control
Mace Blvd.
Off-Ramp
- 2
- 1- 1
- 1- 1
- 2- 1
- 1- 2- 1
Addition fromExisting Conditions
0.0
0.2
0.3
0.4 0.9
2.4
2.9
3.2
5.5
5.8
2.0
2.0
R 44
.5
Restripe LaneAdd Lane
- 1- 1
25
I-80/US 50 Davis to Downtown Sacramento Preliminary Investigation
June, 2014
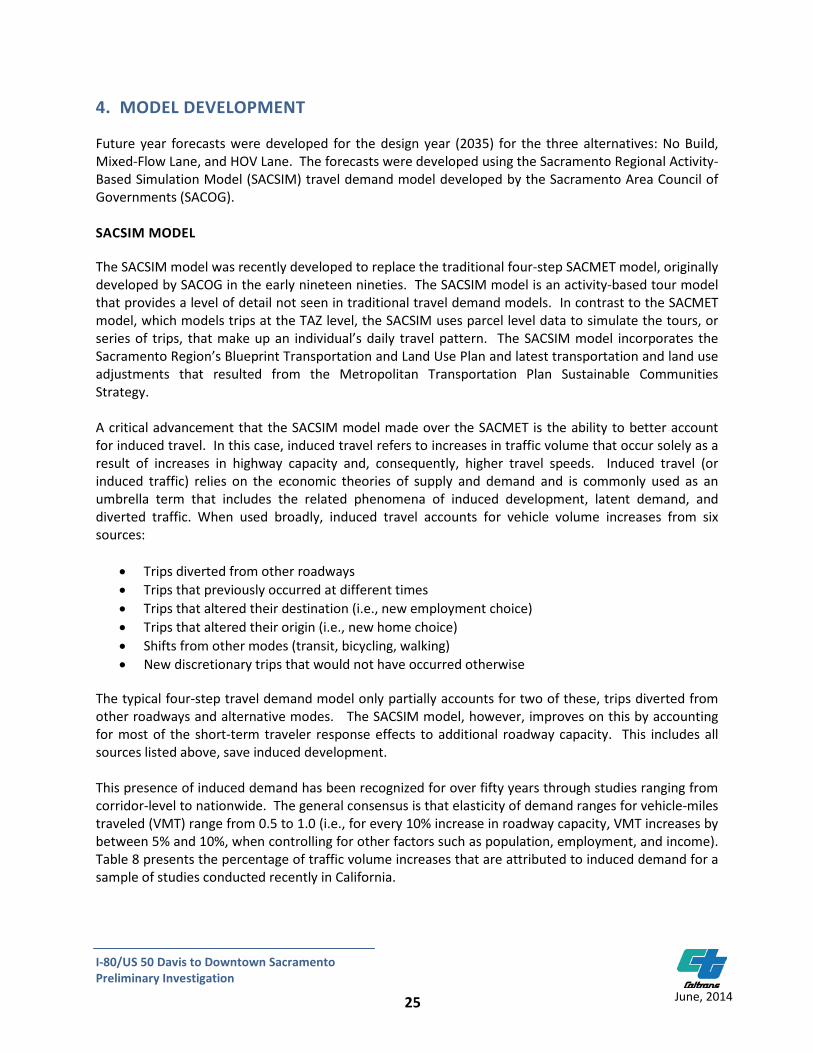
4. MODEL DEVELOPMENT Future year forecasts were developed for the design year (2035) for the three alternatives: No Build, Mixed-Flow Lane, and HOV Lane. The forecasts were developed using the Sacramento Regional Activity-Based Simulation Model (SACSIM) travel demand model developed by the Sacramento Area Council of Governments (SACOG). SACSIM MODEL The SACSIM model was recently developed to replace the traditional four-step SACMET model, originally developed by SACOG in the early nineteen nineties. The SACSIM model is an activity-based tour model that provides a level of detail not seen in traditional travel demand models. In contrast to the SACMET model, which models trips at the TAZ level, the SACSIM uses parcel level data to simulate the tours, or series of trips, that make up an individual’s daily travel pattern. The SACSIM model incorporates the Sacramento Region’s Blueprint Transportation and Land Use Plan and latest transportation and land use adjustments that resulted from the Metropolitan Transportation Plan Sustainable Communities Strategy. A critical advancement that the SACSIM model made over the SACMET is the ability to better account for induced travel. In this case, induced travel refers to increases in traffic volume that occur solely as a result of increases in highway capacity and, consequently, higher travel speeds. Induced travel (or induced traffic) relies on the economic theories of supply and demand and is commonly used as an umbrella term that includes the related phenomena of induced development, latent demand, and diverted traffic. When used broadly, induced travel accounts for vehicle volume increases from six sources:
• Trips diverted from other roadways • Trips that previously occurred at different times • Trips that altered their destination (i.e., new employment choice) • Trips that altered their origin (i.e., new home choice) • Shifts from other modes (transit, bicycling, walking) • New discretionary trips that would not have occurred otherwise
The typical four-step travel demand model only partially accounts for two of these, trips diverted from other roadways and alternative modes. The SACSIM model, however, improves on this by accounting for most of the short-term traveler response effects to additional roadway capacity. This includes all sources listed above, save induced development. This presence of induced demand has been recognized for over fifty years through studies ranging from corridor-level to nationwide. The general consensus is that elasticity of demand ranges for vehicle-miles traveled (VMT) range from 0.5 to 1.0 (i.e., for every 10% increase in roadway capacity, VMT increases by between 5% and 10%, when controlling for other factors such as population, employment, and income). Table 8 presents the percentage of traffic volume increases that are attributed to induced demand for a sample of studies conducted recently in California.
26
I-80/US 50 Davis to Downtown Sacramento Preliminary Investigation
June, 2014
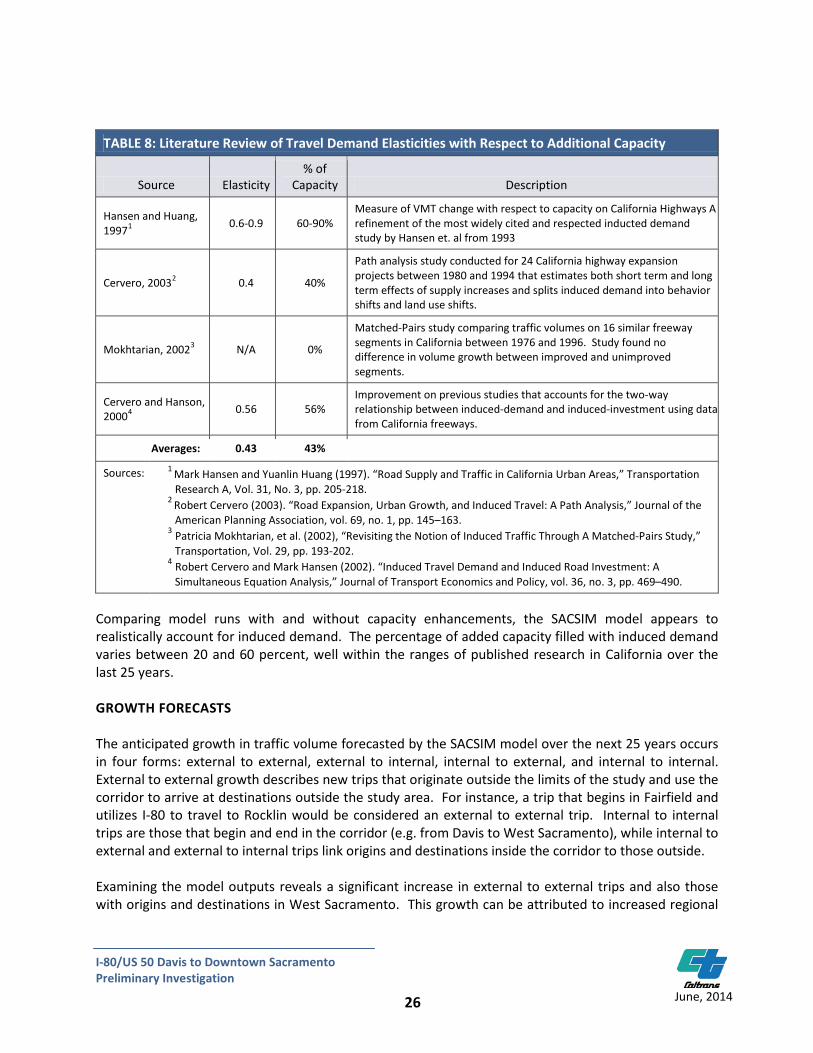
TABLE 8: Literature Review of Travel Demand Elasticities with Respect to Additional Capacity
Source Elasticity % of
Capacity Description
Hansen and Huang, 1997
1 0.6-0.9 60-90% Measure of VMT change with respect to capacity on California Highways A refinement of the most widely cited and respected inducted demand study by Hansen et. al from 1993
Cervero, 2003
2 0.4 40%
Path analysis study conducted for 24 California highway expansion projects between 1980 and 1994 that estimates both short term and long term effects of supply increases and splits induced demand into behavior shifts and land use shifts.
Mokhtarian, 2002
3 N/A 0%
Matched-Pairs study comparing traffic volumes on 16 similar freeway segments in California between 1976 and 1996. Study found no difference in volume growth between improved and unimproved segments.
Cervero and Hanson, 2000
4 0.56 56% Improvement on previous studies that accounts for the two-way relationship between induced-demand and induced-investment using data from California freeways.
Averages: 0.43 43%
Sources:
1 Mark Hansen and Yuanlin Huang (1997). “Road Supply and Traffic in California Urban Areas,” Transportation Research A, Vol. 31, No. 3, pp. 205-218.
2 Robert Cervero (2003). “Road Expansion, Urban Growth, and Induced Travel: A Path Analysis,” Journal of the American Planning Association, vol. 69, no. 1, pp. 145–163.
3 Patricia Mokhtarian, et al. (2002), “Revisiting the Notion of Induced Traffic Through A Matched-Pairs Study,” Transportation, Vol. 29, pp. 193-202.
4 Robert Cervero and Mark Hansen (2002). “Induced Travel Demand and Induced Road Investment: A Simultaneous Equation Analysis,” Journal of Transport Economics and Policy, vol. 36, no. 3, pp. 469–490.
Comparing model runs with and without capacity enhancements, the SACSIM model appears to realistically account for induced demand. The percentage of added capacity filled with induced demand varies between 20 and 60 percent, well within the ranges of published research in California over the last 25 years. GROWTH FORECASTS The anticipated growth in traffic volume forecasted by the SACSIM model over the next 25 years occurs in four forms: external to external, external to internal, internal to external, and internal to internal. External to external growth describes new trips that originate outside the limits of the study and use the corridor to arrive at destinations outside the study area. For instance, a trip that begins in Fairfield and utilizes I-80 to travel to Rocklin would be considered an external to external trip. Internal to internal trips are those that begin and end in the corridor (e.g. from Davis to West Sacramento), while internal to external and external to internal trips link origins and destinations inside the corridor to those outside. Examining the model outputs reveals a significant increase in external to external trips and also those with origins and destinations in West Sacramento. This growth can be attributed to increased regional
27
I-80/US 50 Davis to Downtown Sacramento Preliminary Investigation
June, 2014
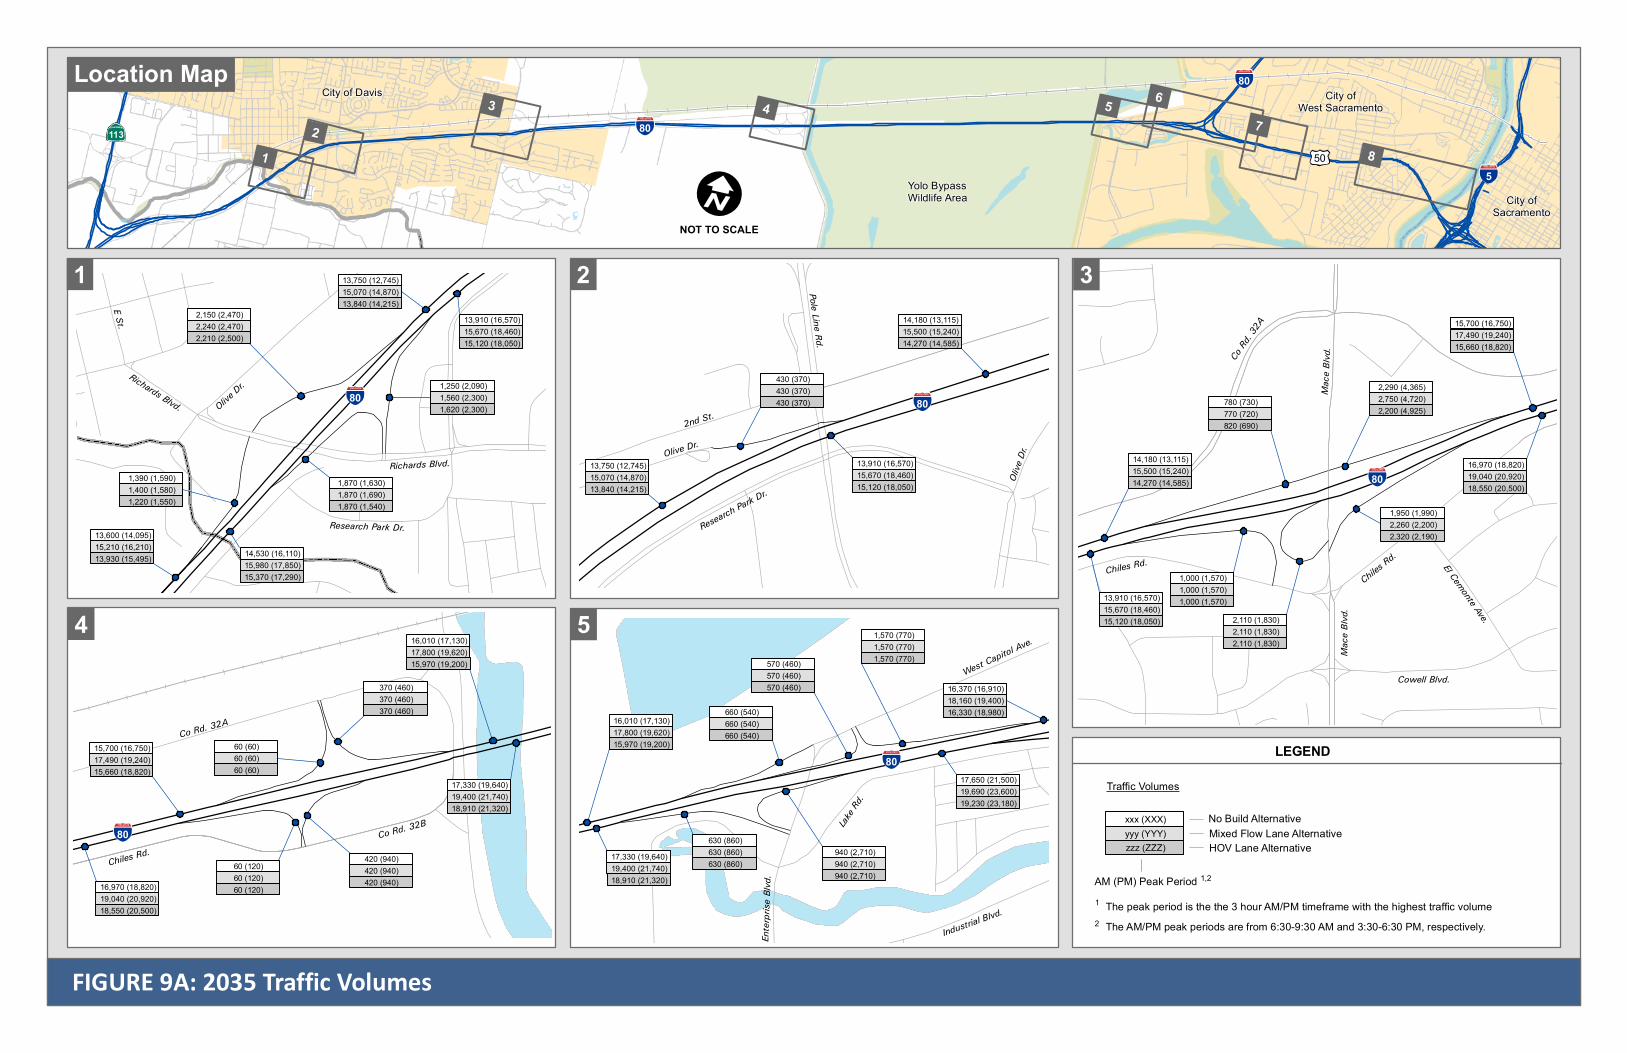
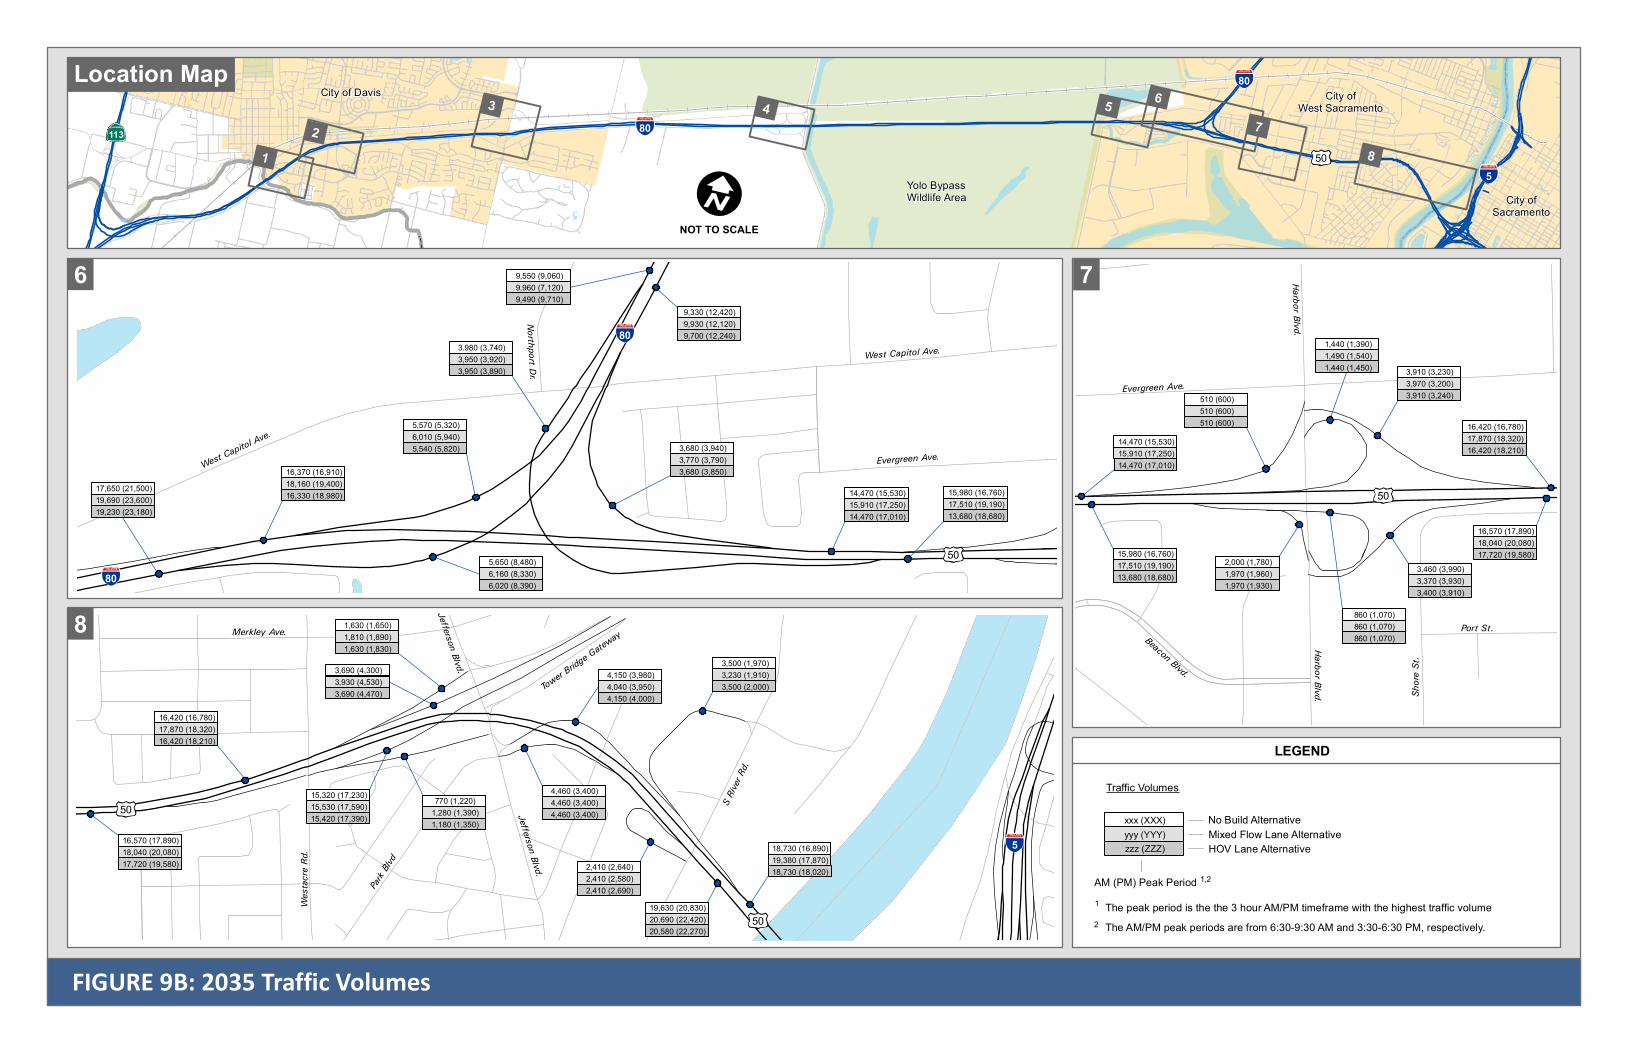
and inter-regional travel demand, and anticipated development along the West Sacramento waterfront and in the Southport Area. TRAVEL DEMAND MODEL ALTERNATIVES Travel demand forecasts were developed for the three future year alternatives: The No Build, Mixed-Flow Lane, and HOV Lane. Each alternative was modeled separately within the SACSIM model. The 2035 SACSIM model, which includes all of the planned transportation projects and projected future land uses contained in the SACOG MTP and Blueprint Plans, was used as the baseline model. The No Build Alternative removed the planned HOV lanes along I-80 between Mace Blvd. and Enterprise Blvd. to simulate No Build conditions. The Mixed-Flow Lane and HOV Lane alternatives added their respective lanes along the entire corridor, traversing I-80/US 50 for the entirety of Yolo County. The peak period volumes for the three alternatives are included in Figures 9A and 9B.
NOT TO SCALE
80113
50
80
5
FIGURE 9A: 2035 Traffic Volumes
1
4
5 2
Location Map
3
80
Co Rd
. 32A
Mac
e Blvd
.
Chiles R
d.Chiles Rd. El Cemonte Ave.
Cowell Blvd.
3
Mac
e Blvd
.
City of Davis City ofWest Sacramento
City ofSacramento
Yolo BypassWildlife Area
Sacram
ento
River
6
80
Richards Blvd.
Olive Dr.
Research Park Dr.
Richards Blvd.
E St.
1
80
Lake R
d.
West Capitol Ave.
Ente
rpris
e Blv
d.
Industrial Blvd.
8 7
5
LEGEND
No Build Alternative
AM (PM) Peak Period 1,2
Traffic Volumes
1 The peak period is the the 3 hour AM/PM timeframe with the highest traffic volume2 The AM/PM peak periods are from 6:30-9:30 AM and 3:30-6:30 PM, respectively.
Mixed Flow Lane AlternativeHOV Lane Alternative
xxx (XXX)yyy (YYY)zzz (ZZZ)
14,530 (16,110)15,980 (17,850)15,370 (17,290)
1,870 (1,630)1,870 (1,690)1,870 (1,540)
1,250 (2,090)1,560 (2,300)1,620 (2,300)
13,910 (16,570)15,670 (18,460)15,120 (18,050)
13,750 (12,745)15,070 (14,870)13,840 (14,215)
2,150 (2,470)2,240 (2,470)2,210 (2,500)
1,390 (1,590)1,400 (1,580)1,220 (1,550)
13,600 (14,095)15,210 (16,210)13,930 (15,495)
2
80
Olive Dr.2nd St.
Pole Line Rd.
Research Park
Dr.
Olive
Dr.
13,750 (12,745)15,070 (14,870)13,840 (14,215)
430 (370)430 (370)430 (370)
13,910 (16,570)15,670 (18,460)15,120 (18,050)
14,180 (13,115)15,500 (15,240)14,270 (14,585)
14,180 (13,115)15,500 (15,240)14,270 (14,585)
780 (730)770 (720)820 (690)
2,290 (4,365)2,750 (4,720)2,200 (4,925)
15,700 (16,750)17,490 (19,240)15,660 (18,820)
13,910 (16,570)15,670 (18,460)15,120 (18,050)
1,000 (1,570)1,000 (1,570)1,000 (1,570)
2,110 (1,830)2,110 (1,830)2,110 (1,830)
1,950 (1,990)2,260 (2,200)2,320 (2,190)
16,970 (18,820)19,040 (20,920)18,550 (20,500)
80
Chiles Rd.
Co Rd. 32A
Co Rd. 32B
15,700 (16,750)17,490 (19,240)15,660 (18,820)
4
16,970 (18,820)19,040 (20,920)18,550 (20,500)
60 (120)60 (120)60 (120)
420 (940)420 (940)420 (940)
17,330 (19,640)19,400 (21,740)18,910 (21,320)
370 (460)370 (460)370 (460)
16,010 (17,130)17,800 (19,620)15,970 (19,200)
60 (60)60 (60)60 (60)
16,010 (17,130)17,800 (19,620)15,970 (19,200)
17,330 (19,640)19,400 (21,740)18,910 (21,320)
630 (860)630 (860)630 (860)
660 (540)660 (540)660 (540)
940 (2,710)940 (2,710)940 (2,710)
570 (460)570 (460)570 (460)
1,570 (770)1,570 (770)1,570 (770)
16,370 (16,910)18,160 (19,400)16,330 (18,980)
17,650 (21,500)19,690 (23,600)19,230 (23,180)
NOT TO SCALE
80113
50
80
5
FIGURE 9B: 2035 Traffic Volumes
1
4
5 2
Location Map 3
City of Davis City ofWest Sacramento
City ofSacramento
Yolo BypassWildlife Area
Sacram
ento
River
5080
80
6
West Capitol Ave.
Evergreen Ave.
Beacon Blvd.
Harbor Blvd.
Port St.
Shor
e St
.
50
5
8
50
West Capitol Ave.
Evergreen Ave.
Northport Dr.
Harbor Blvd.
50
Park B
lvd
Jefferson Blvd.
Tower B
ridge G
ateway
S Rive
r Rd.
Jefferson Blvd.
Merkley Ave.
Wes
tacre
Rd.
7
8
6 7
LEGEND
No Build Alternative
AM (PM) Peak Period 1,2
Traffic Volumes
1 The peak period is the the 3 hour AM/PM timeframe with the highest traffic volume2 The AM/PM peak periods are from 6:30-9:30 AM and 3:30-6:30 PM, respectively.
Mixed Flow Lane AlternativeHOV Lane Alternative
xxx (XXX)yyy (YYY)zzz (ZZZ)
17,650 (21,500)19,690 (23,600)19,230 (23,180)
16,370 (16,910)18,160 (19,400)16,330 (18,980)
5,570 (5,320)6,010 (5,940)5,540 (5,820)
3.980 (3,740)3,950 (3,920)3,950 (3,890)
9,550 (9,060)9,960 (7,120)9,490 (9,710)
9,330 (12,420)9,930 (12,120)9,700 (12,240)
3,680 (3,940)3,770 (3,790)3,680 (3,850)
14,470 (15,530)15,910 (17,250)14,470 (17,010)
15,980 (16,760)17,510 (19,190)13,680 (18,680)
14,470 (15,530)15,910 (17,250)14,470 (17,010)
15,980 (16,760)17,510 (19,190)13,680 (18,680)
510 (600)510 (600)510 (600)
2,000 (1,780)1,970 (1,960)1,970 (1,930)
860 (1,070)860 (1,070)860 (1,070)
3,460 (3,990)3,370 (3,930)3,400 (3,910)
16,570 (17,890)18,040 (20,080)17,720 (19,580)
16,420 (16,780)17,870 (18,320)16,420 (18,210)
3,910 (3,230)3,970 (3,200)3,910 (3,240)
1,440 (1,390)1,490 (1,540)1,440 (1,450)
5,650 (8,480)6,160 (8,330)6,020 (8,390)
16,420 (16,780)17,870 (18,320)16,420 (18,210)
3,690 (4,300)3,930 (4,530)3,690 (4,470)
1,630 (1,650)1,810 (1,890)1,630 (1,830)
16,570 (17,890)18,040 (20,080)17,720 (19,580)
15,320 (17,230)15,530 (17,590)15,420 (17,390)
770 (1,220)1,280 (1,390)1,180 (1,350)
4,460 (3,400)4,460 (3,400)4,460 (3,400)
4,150 (3,980)4,040 (3,950)4,150 (4,000)
3,500 (1,970)3,230 (1,910)3,500 (2,000)
2,410 (2,640)2,410 (2,580)2,410 (2,690)
18,730 (16,890)19,380 (17,870)18,730 (18,020)
19,630 (20,830)20,690 (22,420)20,580 (22,270)
30
I-80/US 50 Davis to Downtown Sacramento Preliminary Investigation
June, 2014
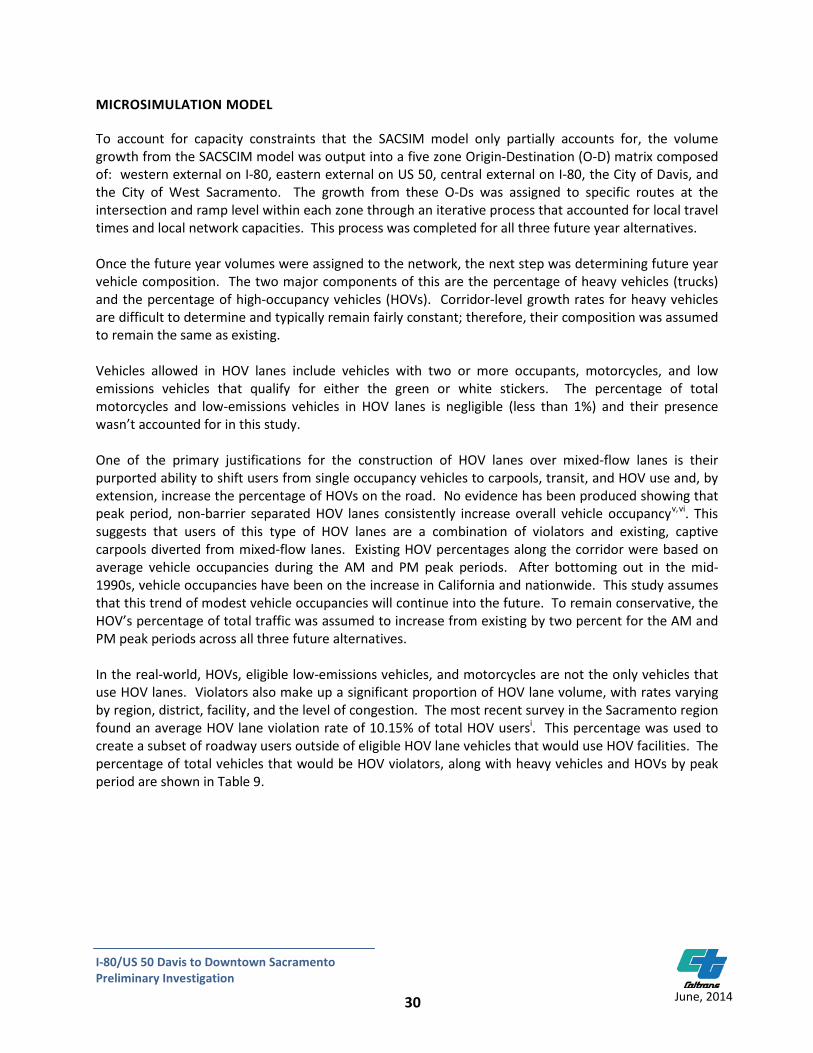
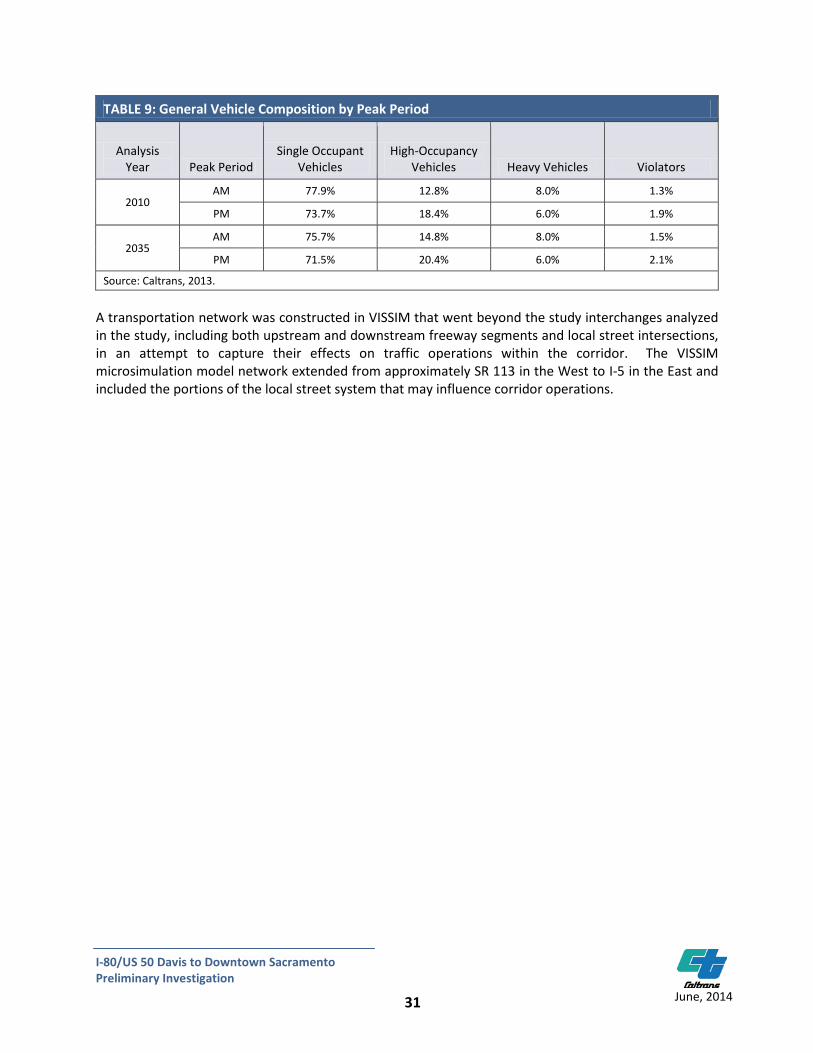
MICROSIMULATION MODEL To account for capacity constraints that the SACSIM model only partially accounts for, the volume growth from the SACSCIM model was output into a five zone Origin-Destination (O-D) matrix composed of: western external on I-80, eastern external on US 50, central external on I-80, the City of Davis, and the City of West Sacramento. The growth from these O-Ds was assigned to specific routes at the intersection and ramp level within each zone through an iterative process that accounted for local travel times and local network capacities. This process was completed for all three future year alternatives. Once the future year volumes were assigned to the network, the next step was determining future year vehicle composition. The two major components of this are the percentage of heavy vehicles (trucks) and the percentage of high-occupancy vehicles (HOVs). Corridor-level growth rates for heavy vehicles are difficult to determine and typically remain fairly constant; therefore, their composition was assumed to remain the same as existing. Vehicles allowed in HOV lanes include vehicles with two or more occupants, motorcycles, and low emissions vehicles that qualify for either the green or white stickers. The percentage of total motorcycles and low-emissions vehicles in HOV lanes is negligible (less than 1%) and their presence wasn’t accounted for in this study. One of the primary justifications for the construction of HOV lanes over mixed-flow lanes is their purported ability to shift users from single occupancy vehicles to carpools, transit, and HOV use and, by extension, increase the percentage of HOVs on the road. No evidence has been produced showing that peak period, non-barrier separated HOV lanes consistently increase overall vehicle occupancyv,vi. This suggests that users of this type of HOV lanes are a combination of violators and existing, captive carpools diverted from mixed-flow lanes. Existing HOV percentages along the corridor were based on average vehicle occupancies during the AM and PM peak periods. After bottoming out in the mid-1990s, vehicle occupancies have been on the increase in California and nationwide. This study assumes that this trend of modest vehicle occupancies will continue into the future. To remain conservative, the HOV’s percentage of total traffic was assumed to increase from existing by two percent for the AM and PM peak periods across all three future alternatives. In the real-world, HOVs, eligible low-emissions vehicles, and motorcycles are not the only vehicles that use HOV lanes. Violators also make up a significant proportion of HOV lane volume, with rates varying by region, district, facility, and the level of congestion. The most recent survey in the Sacramento region found an average HOV lane violation rate of 10.15% of total HOV usersi. This percentage was used to create a subset of roadway users outside of eligible HOV lane vehicles that would use HOV facilities. The percentage of total vehicles that would be HOV violators, along with heavy vehicles and HOVs by peak period are shown in Table 9.
31
I-80/US 50 Davis to Downtown Sacramento Preliminary Investigation
June, 2014
TABLE 9: General Vehicle Composition by Peak Period
Analysis Year Peak Period
Single Occupant Vehicles
High-Occupancy Vehicles Heavy Vehicles Violators
2010 AM 77.9% 12.8% 8.0% 1.3%
PM 73.7% 18.4% 6.0% 1.9%
2035 AM 75.7% 14.8% 8.0% 1.5%
PM 71.5% 20.4% 6.0% 2.1%
Source: Caltrans, 2013.
A transportation network was constructed in VISSIM that went beyond the study interchanges analyzed in the study, including both upstream and downstream freeway segments and local street intersections, in an attempt to capture their effects on traffic operations within the corridor. The VISSIM microsimulation model network extended from approximately SR 113 in the West to I-5 in the East and included the portions of the local street system that may influence corridor operations.
32
I-80/US 50 Davis to Downtown Sacramento Preliminary Investigation
June, 2014
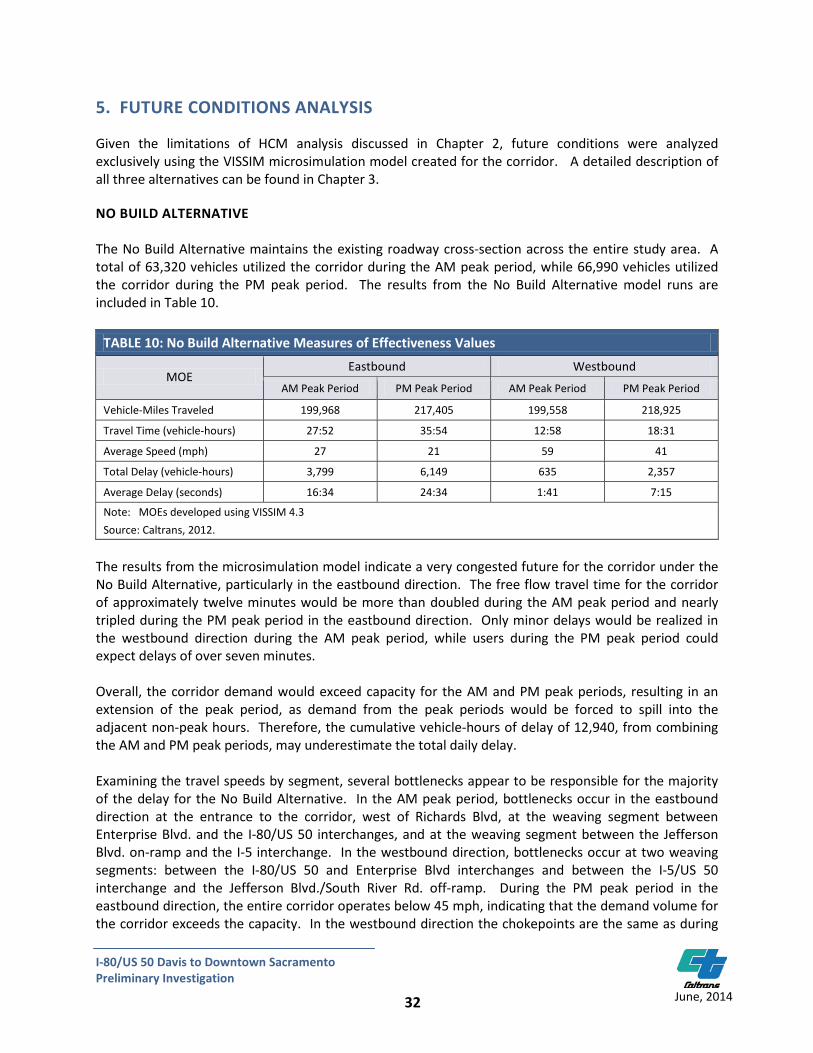
5. FUTURE CONDITIONS ANALYSIS Given the limitations of HCM analysis discussed in Chapter 2, future conditions were analyzed exclusively using the VISSIM microsimulation model created for the corridor. A detailed description of all three alternatives can be found in Chapter 3. NO BUILD ALTERNATIVE The No Build Alternative maintains the existing roadway cross-section across the entire study area. A total of 63,320 vehicles utilized the corridor during the AM peak period, while 66,990 vehicles utilized the corridor during the PM peak period. The results from the No Build Alternative model runs are included in Table 10.
TABLE 10: No Build Alternative Measures of Effectiveness Values
MOE Eastbound Westbound
AM Peak Period PM Peak Period AM Peak Period PM Peak Period
Vehicle-Miles Traveled 199,968 217,405 199,558 218,925
Travel Time (vehicle-hours) 27:52 35:54 12:58 18:31
Average Speed (mph) 27 21 59 41
Total Delay (vehicle-hours) 3,799 6,149 635 2,357
Average Delay (seconds) 16:34 24:34 1:41 7:15
Note: MOEs developed using VISSIM 4.3
Source: Caltrans, 2012.
The results from the microsimulation model indicate a very congested future for the corridor under the No Build Alternative, particularly in the eastbound direction. The free flow travel time for the corridor of approximately twelve minutes would be more than doubled during the AM peak period and nearly tripled during the PM peak period in the eastbound direction. Only minor delays would be realized in the westbound direction during the AM peak period, while users during the PM peak period could expect delays of over seven minutes. Overall, the corridor demand would exceed capacity for the AM and PM peak periods, resulting in an extension of the peak period, as demand from the peak periods would be forced to spill into the adjacent non-peak hours. Therefore, the cumulative vehicle-hours of delay of 12,940, from combining the AM and PM peak periods, may underestimate the total daily delay. Examining the travel speeds by segment, several bottlenecks appear to be responsible for the majority of the delay for the No Build Alternative. In the AM peak period, bottlenecks occur in the eastbound direction at the entrance to the corridor, west of Richards Blvd, at the weaving segment between Enterprise Blvd. and the I-80/US 50 interchanges, and at the weaving segment between the Jefferson Blvd. on-ramp and the I-5 interchange. In the westbound direction, bottlenecks occur at two weaving segments: between the I-80/US 50 and Enterprise Blvd interchanges and between the I-5/US 50 interchange and the Jefferson Blvd./South River Rd. off-ramp. During the PM peak period in the eastbound direction, the entire corridor operates below 45 mph, indicating that the demand volume for the corridor exceeds the capacity. In the westbound direction the chokepoints are the same as during
33
I-80/US 50 Davis to Downtown Sacramento Preliminary Investigation
June, 2014
the AM peak period. Figure 10 illustrates the segmental travel speeds for the No Build Alternative for the AM and PM peak periods.

80
80
80
80
50
50
Under 35 mph35 mph - 45 mph45 mph - 55 mph55 mph - 60 mph60 mph - 65 mph65 mph - 70 mph
Average Vehicle Speed
5
5
1 Mile
Chiles Rd
Enterprise BlvdJefferson Blvd
Mace Blvd
Richards Blvd
I-80/US 50 Interchange
Harbor Blvd
South River Rd
Chiles Rd
Enterprise BlvdJefferson Blvd
Mace Blvd
Richards Blvd
I-80/US 50 Interchange
Harbor Blvd
South River Rd
AM PEAK PERIOD
PM PEAK PERIOD
FIGURE 10: 2035 No Build Alternative - Travel Speed by Segment
City ofWest Sacramento
City ofWest Sacramento
City of Davis
City of Davis
35
I-80/US 50 Davis to Downtown Sacramento Preliminary Investigation
June, 2014
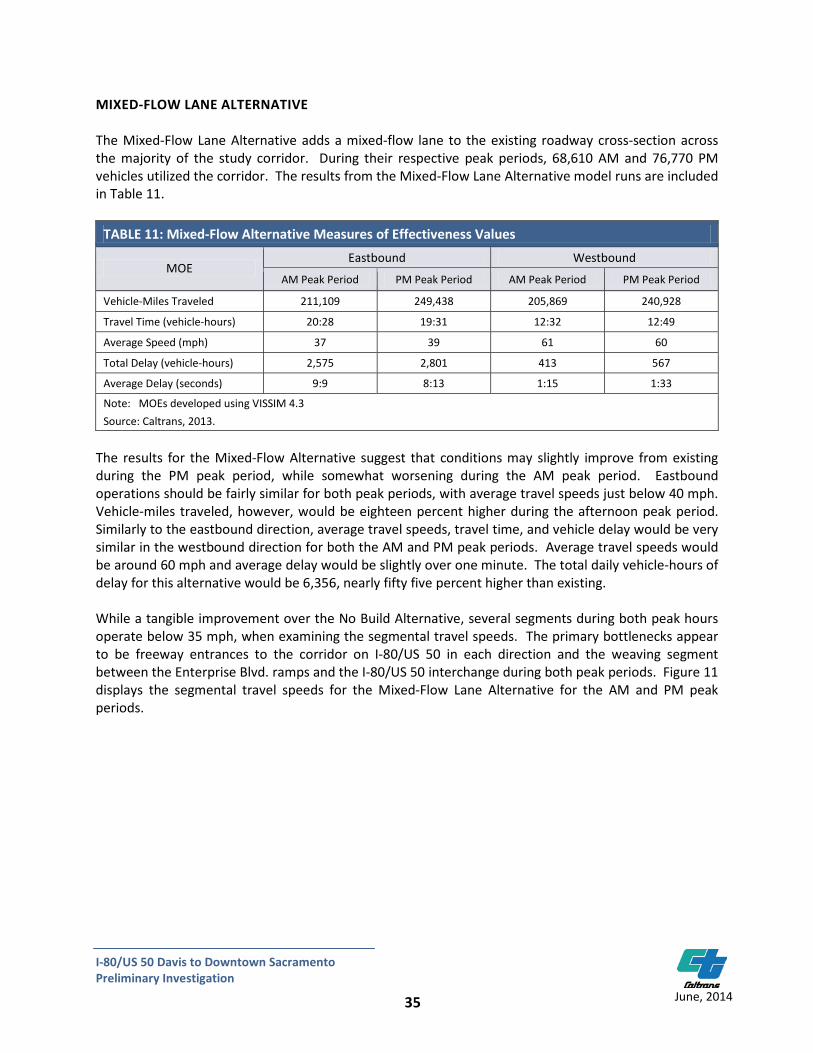
MIXED-FLOW LANE ALTERNATIVE The Mixed-Flow Lane Alternative adds a mixed-flow lane to the existing roadway cross-section across the majority of the study corridor. During their respective peak periods, 68,610 AM and 76,770 PM vehicles utilized the corridor. The results from the Mixed-Flow Lane Alternative model runs are included in Table 11.
TABLE 11: Mixed-Flow Alternative Measures of Effectiveness Values
MOE Eastbound Westbound
AM Peak Period PM Peak Period AM Peak Period PM Peak Period
Vehicle-Miles Traveled 211,109 249,438 205,869 240,928
Travel Time (vehicle-hours) 20:28 19:31 12:32 12:49
Average Speed (mph) 37 39 61 60
Total Delay (vehicle-hours) 2,575 2,801 413 567
Average Delay (seconds) 9:9 8:13 1:15 1:33
Note: MOEs developed using VISSIM 4.3
Source: Caltrans, 2013.
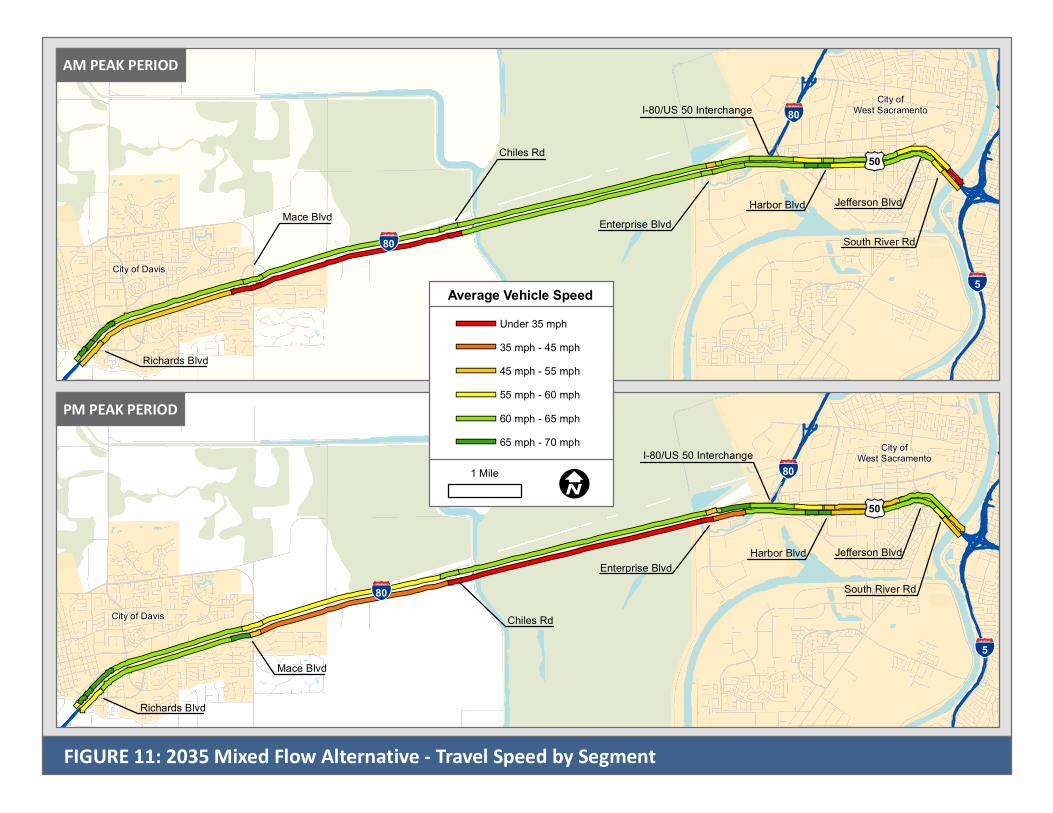
The results for the Mixed-Flow Alternative suggest that conditions may slightly improve from existing during the PM peak period, while somewhat worsening during the AM peak period. Eastbound operations should be fairly similar for both peak periods, with average travel speeds just below 40 mph. Vehicle-miles traveled, however, would be eighteen percent higher during the afternoon peak period. Similarly to the eastbound direction, average travel speeds, travel time, and vehicle delay would be very similar in the westbound direction for both the AM and PM peak periods. Average travel speeds would be around 60 mph and average delay would be slightly over one minute. The total daily vehicle-hours of delay for this alternative would be 6,356, nearly fifty five percent higher than existing. While a tangible improvement over the No Build Alternative, several segments during both peak hours operate below 35 mph, when examining the segmental travel speeds. The primary bottlenecks appear to be freeway entrances to the corridor on I-80/US 50 in each direction and the weaving segment between the Enterprise Blvd. ramps and the I-80/US 50 interchange during both peak periods. Figure 11 displays the segmental travel speeds for the Mixed-Flow Lane Alternative for the AM and PM peak periods.
80
80
80
80
50
50
Under 35 mph35 mph - 45 mph45 mph - 55 mph55 mph - 60 mph60 mph - 65 mph65 mph - 70 mph
Average Vehicle Speed
5
5
1 Mile
Chiles Rd
Enterprise BlvdJefferson Blvd
Mace Blvd
Richards Blvd
I-80/US 50 Interchange
Harbor Blvd
South River Rd
Chiles Rd
Enterprise BlvdJefferson Blvd
Mace Blvd
Richards Blvd
I-80/US 50 Interchange
Harbor Blvd
South River Rd
AM PEAK PERIOD
PM PEAK PERIOD
FIGURE 11: 2035 Mixed Flow Alternative - Travel Speed by Segment
City ofWest Sacramento
City ofWest Sacramento
City of Davis
City of Davis
37
I-80/US 50 Davis to Downtown Sacramento Preliminary Investigation
June, 2014
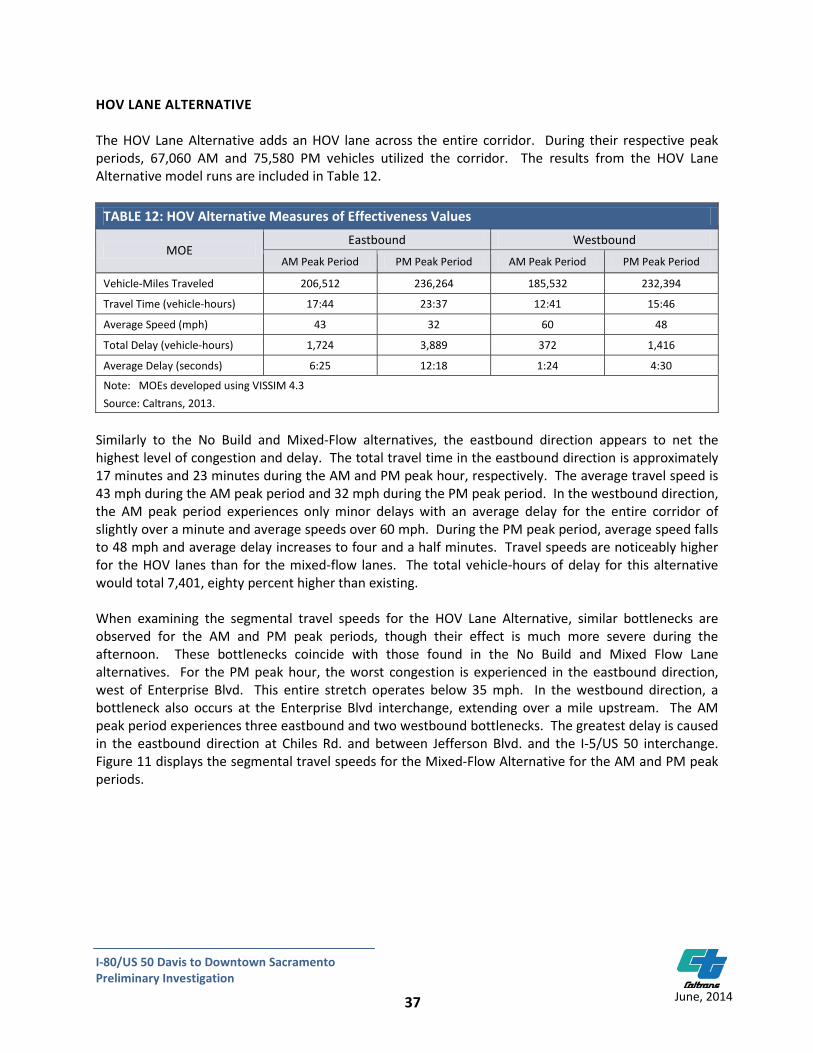
HOV LANE ALTERNATIVE The HOV Lane Alternative adds an HOV lane across the entire corridor. During their respective peak periods, 67,060 AM and 75,580 PM vehicles utilized the corridor. The results from the HOV Lane Alternative model runs are included in Table 12.
TABLE 12: HOV Alternative Measures of Effectiveness Values
MOE Eastbound Westbound
AM Peak Period PM Peak Period AM Peak Period PM Peak Period
Vehicle-Miles Traveled 206,512 236,264 185,532 232,394
Travel Time (vehicle-hours) 17:44 23:37 12:41 15:46
Average Speed (mph) 43 32 60 48
Total Delay (vehicle-hours) 1,724 3,889 372 1,416
Average Delay (seconds) 6:25 12:18 1:24 4:30
Note: MOEs developed using VISSIM 4.3
Source: Caltrans, 2013.
Similarly to the No Build and Mixed-Flow alternatives, the eastbound direction appears to net the highest level of congestion and delay. The total travel time in the eastbound direction is approximately 17 minutes and 23 minutes during the AM and PM peak hour, respectively. The average travel speed is 43 mph during the AM peak period and 32 mph during the PM peak period. In the westbound direction, the AM peak period experiences only minor delays with an average delay for the entire corridor of slightly over a minute and average speeds over 60 mph. During the PM peak period, average speed falls to 48 mph and average delay increases to four and a half minutes. Travel speeds are noticeably higher for the HOV lanes than for the mixed-flow lanes. The total vehicle-hours of delay for this alternative would total 7,401, eighty percent higher than existing. When examining the segmental travel speeds for the HOV Lane Alternative, similar bottlenecks are observed for the AM and PM peak periods, though their effect is much more severe during the afternoon. These bottlenecks coincide with those found in the No Build and Mixed Flow Lane alternatives. For the PM peak hour, the worst congestion is experienced in the eastbound direction, west of Enterprise Blvd. This entire stretch operates below 35 mph. In the westbound direction, a bottleneck also occurs at the Enterprise Blvd interchange, extending over a mile upstream. The AM peak period experiences three eastbound and two westbound bottlenecks. The greatest delay is caused in the eastbound direction at Chiles Rd. and between Jefferson Blvd. and the I-5/US 50 interchange. Figure 11 displays the segmental travel speeds for the Mixed-Flow Alternative for the AM and PM peak periods.
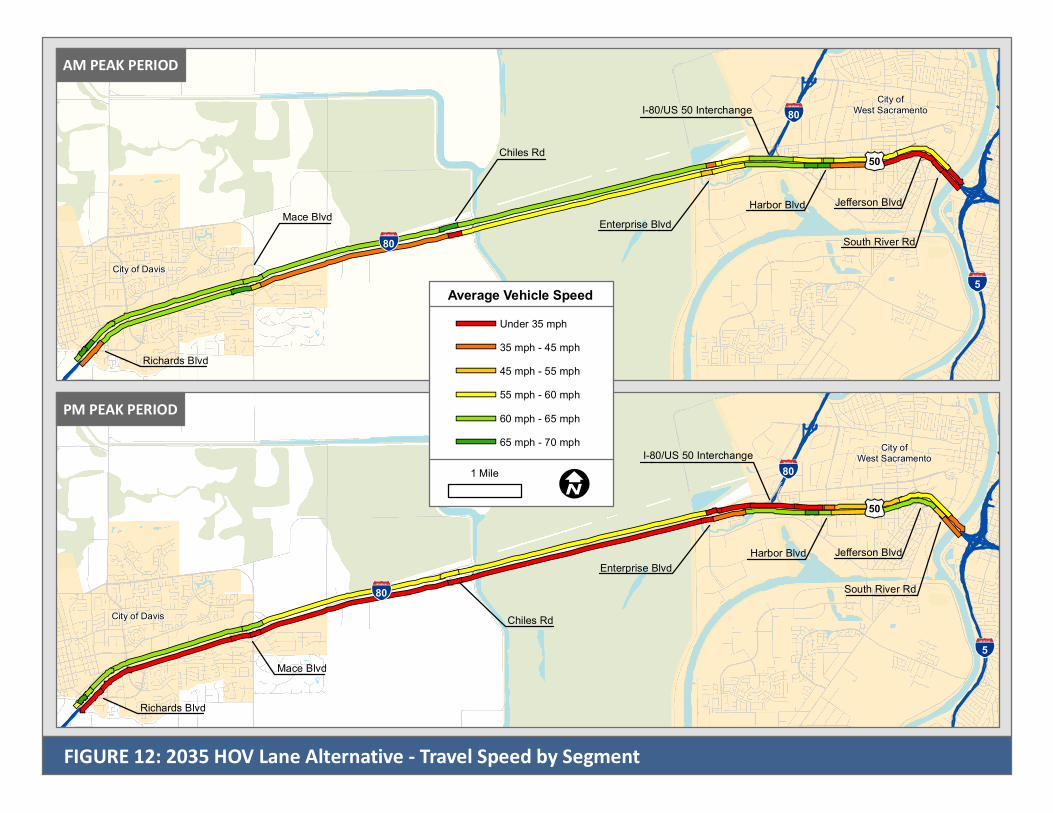
80
80
80
80
50
50
Under 35 mph35 mph - 45 mph45 mph - 55 mph55 mph - 60 mph60 mph - 65 mph65 mph - 70 mph
Average Vehicle Speed
5
5
1 Mile
Chiles Rd
Enterprise BlvdJefferson Blvd
Mace Blvd
Richards Blvd
I-80/US 50 Interchange
Harbor Blvd
South River Rd
Chiles Rd
Enterprise BlvdJefferson Blvd
Mace Blvd
Richards Blvd
I-80/US 50 Interchange
Harbor Blvd
South River Rd
AM PEAK PERIOD
PM PEAK PERIOD
FIGURE 12: 2035 HOV Lane Alternative - Travel Speed by Segment
City ofWest Sacramento
City ofWest Sacramento
City of Davis
City of Davis
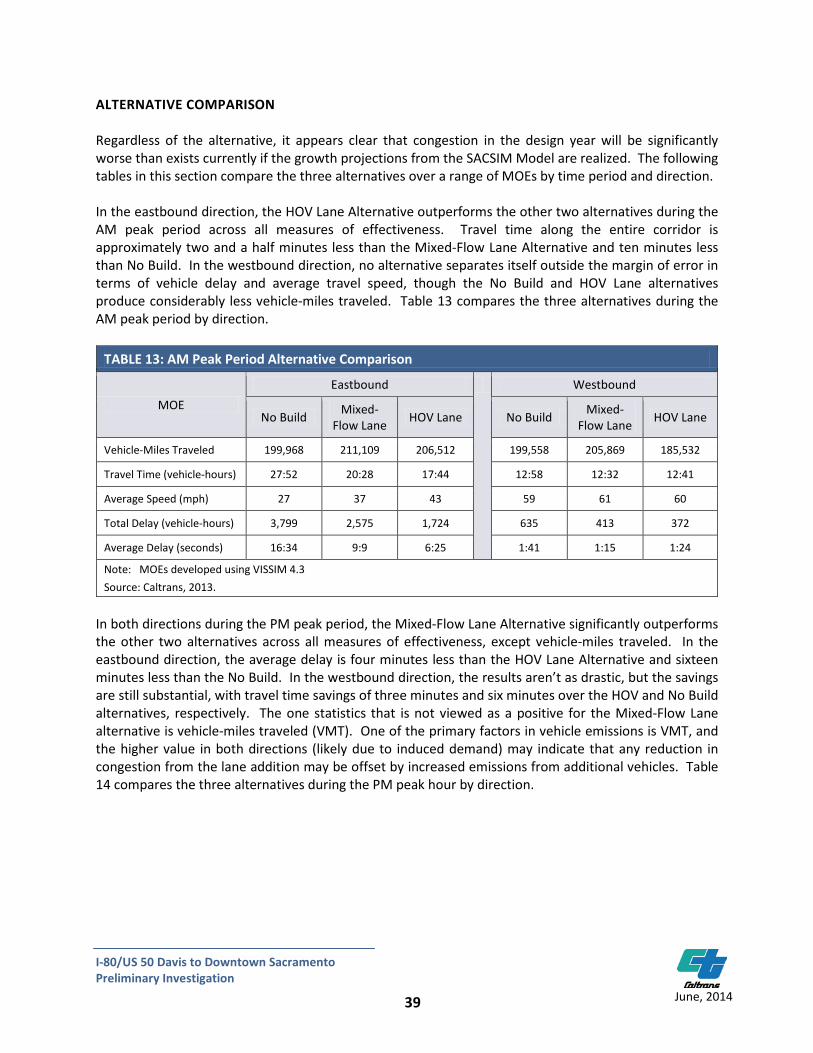
39
I-80/US 50 Davis to Downtown Sacramento Preliminary Investigation
June, 2014
ALTERNATIVE COMPARISON Regardless of the alternative, it appears clear that congestion in the design year will be significantly worse than exists currently if the growth projections from the SACSIM Model are realized. The following tables in this section compare the three alternatives over a range of MOEs by time period and direction. In the eastbound direction, the HOV Lane Alternative outperforms the other two alternatives during the AM peak period across all measures of effectiveness. Travel time along the entire corridor is approximately two and a half minutes less than the Mixed-Flow Lane Alternative and ten minutes less than No Build. In the westbound direction, no alternative separates itself outside the margin of error in terms of vehicle delay and average travel speed, though the No Build and HOV Lane alternatives produce considerably less vehicle-miles traveled. Table 13 compares the three alternatives during the AM peak period by direction.
TABLE 13: AM Peak Period Alternative Comparison
MOE Eastbound Westbound
No Build Mixed-
Flow Lane HOV Lane No Build
Mixed-Flow Lane
HOV Lane
Vehicle-Miles Traveled 199,968 211,109 206,512 199,558 205,869 185,532
Travel Time (vehicle-hours) 27:52 20:28 17:44 12:58 12:32 12:41
Average Speed (mph) 27 37 43 59 61 60
Total Delay (vehicle-hours) 3,799 2,575 1,724 635 413 372
Average Delay (seconds) 16:34 9:9 6:25 1:41 1:15 1:24
Note: MOEs developed using VISSIM 4.3
Source: Caltrans, 2013.
In both directions during the PM peak period, the Mixed-Flow Lane Alternative significantly outperforms the other two alternatives across all measures of effectiveness, except vehicle-miles traveled. In the eastbound direction, the average delay is four minutes less than the HOV Lane Alternative and sixteen minutes less than the No Build. In the westbound direction, the results aren’t as drastic, but the savings are still substantial, with travel time savings of three minutes and six minutes over the HOV and No Build alternatives, respectively. The one statistics that is not viewed as a positive for the Mixed-Flow Lane alternative is vehicle-miles traveled (VMT). One of the primary factors in vehicle emissions is VMT, and the higher value in both directions (likely due to induced demand) may indicate that any reduction in congestion from the lane addition may be offset by increased emissions from additional vehicles. Table 14 compares the three alternatives during the PM peak hour by direction.

40
I-80/US 50 Davis to Downtown Sacramento Preliminary Investigation
June, 2014
TABLE 14: PM Peak Period Alternative Comparison
MOE Eastbound Westbound
No Build Mixed-
Flow Lane HOV Lane No Build
Mixed-Flow Lane
HOV Lane
Vehicle-Miles Traveled 217,405 249,438 236,264 218,925 240,928 232,394
Travel Time (vehicle-hours) 35:54 19:31 23:37 18:31 12:49 15:46
Average Speed (mph) 21 39 32 41 60 48
Total Delay (vehicle-hours) 6,149 2,801 3,889 2,357 567 1,416
Average Delay (seconds) 24:34 8:13 12:18 7:15 1:33 4:30
Note: MOEs developed using VISSIM 4.3
Source: Caltrans, 2013.
The three alternatives were also compared specifically during the worst hour in the morning and afternoon for both travel speed and travel time, these results are shown in Table 15.
TABLE 15: Peak Hour Alternative Comparison
Alternatives Eastbound Westbound
Average Speed (mph)
Travel Time (min:sec)
Average Speed (mph)
Travel Time (min:sec)
No Build AM 28.3 26:56 57.0 13:23
PM 21.5 35:19 38.3 19:58
Mixed-Flow Lane AM 36.4 20:54 60.1 12:43
PM 38.6 19:42 58.6 13:2
HOV Lane AM 40.9 18:36 58.9 12:58
PM 31.8 23:57 43.9 17:25
Note: MOEs developed using VISSIM 4.3
Source: Caltrans, 2013.
When focusing exclusively on the peak hours, the general results and trends are similar to the peak period as a whole. The Mixed-Flow Lane Alternative outperforms the other alternatives during the PM peak hour, while the HOV Lane Alternative has the highest travel speeds and lowest travel time during the AM peak hour. Figure 13 compares the peak hour travel times graphically.
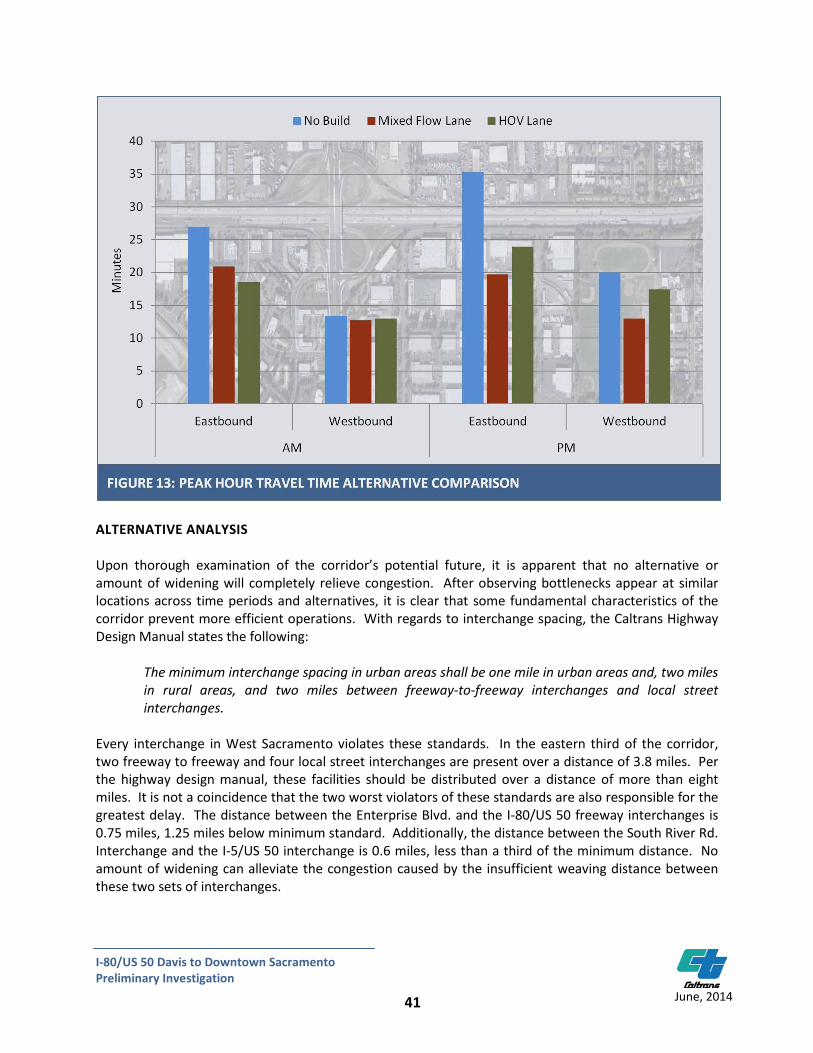
41
I-80/US 50 Davis to Downtown Sacramento Preliminary Investigation
June, 2014
ALTERNATIVE ANALYSIS Upon thorough examination of the corridor’s potential future, it is apparent that no alternative or amount of widening will completely relieve congestion. After observing bottlenecks appear at similar locations across time periods and alternatives, it is clear that some fundamental characteristics of the corridor prevent more efficient operations. With regards to interchange spacing, the Caltrans Highway Design Manual states the following:
The minimum interchange spacing in urban areas shall be one mile in urban areas and, two miles in rural areas, and two miles between freeway-to-freeway interchanges and local street interchanges.
Every interchange in West Sacramento violates these standards. In the eastern third of the corridor, two freeway to freeway and four local street interchanges are present over a distance of 3.8 miles. Per the highway design manual, these facilities should be distributed over a distance of more than eight miles. It is not a coincidence that the two worst violators of these standards are also responsible for the greatest delay. The distance between the Enterprise Blvd. and the I-80/US 50 freeway interchanges is 0.75 miles, 1.25 miles below minimum standard. Additionally, the distance between the South River Rd. Interchange and the I-5/US 50 interchange is 0.6 miles, less than a third of the minimum distance. No amount of widening can alleviate the congestion caused by the insufficient weaving distance between these two sets of interchanges.
42
I-80/US 50 Davis to Downtown Sacramento Preliminary Investigation
June, 2014
Given this limitation, though, both the Mixed-Flow Lane and the HOV Lane alternatives appear to provide benefits over the No Build Alternative. In terms of vehicle delay and travel speed, the HOV Lane Alternative performs marginally better during the AM peak period, while the Mixed-Flow Lane Alternative performs significantly better during the PM peak period. In sum, the Mixed-Flow Lane Alternative results in 5,921 peak period vehicle-hours of delay compared with 7,075 vehicle-hours of delay for the HOV Lane Alternative. Conversely, the HOV Lane Alternative produces 32,440 fewer daily vehicle-miles traveled than the Mixed Flow Lane Alternative. Assuming that a build alternative is selected, it appears that the HOV Lane Alternative is the most likely to move forward. Mixed-flow lane projects are difficult to gain approval due to their inability to pass federal air quality conformity standardsvii, resulting in few urban freeway mixed-flow lane projects being proposed within the Sacramento Region over the next 25 years. HOV lanes for a portion of the study area are listed in the 2035 Metropolitan Transportation Plan for the region and are planned as an ultimate facility over the entire corridor within the Caltrans HOV vision for the Sacramento area. Without a build alternative that performs conclusively better across all MOEs, the HOV Lane Alternative was selected over the Mixed Flow Lane Alternative for further examination based on these outside factors and the existing momentum that their implementation holds within the region.
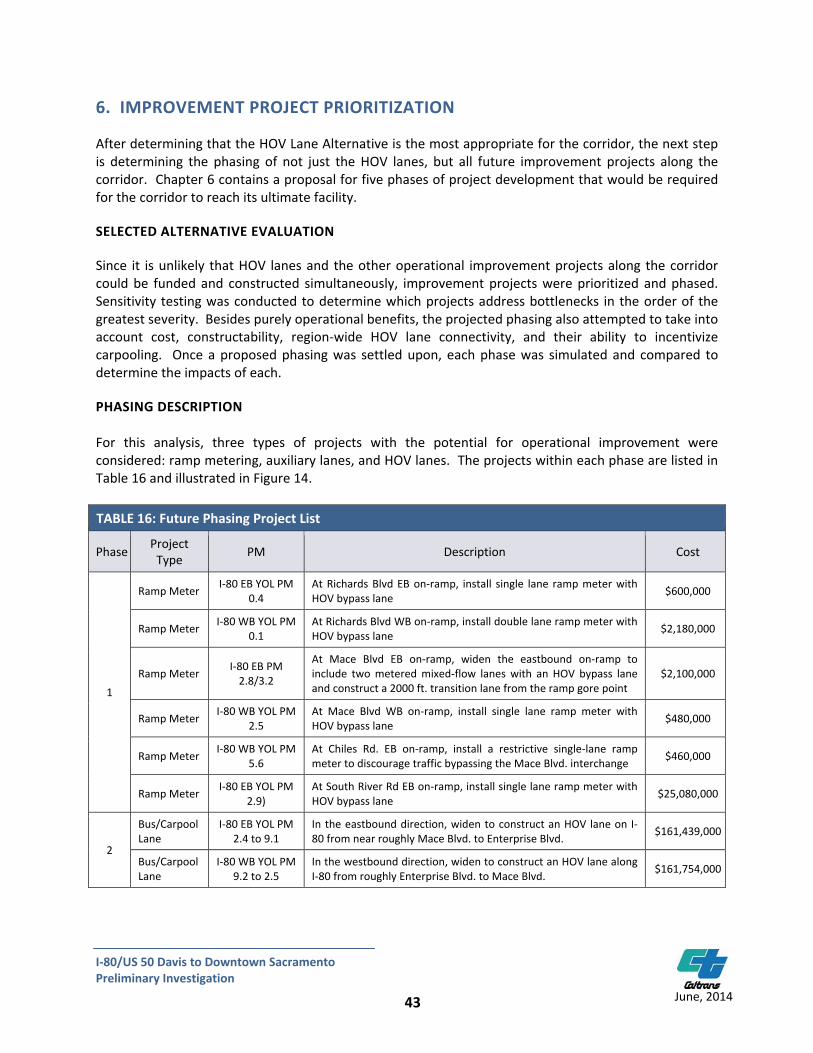
43
I‐80/US 50 Davis to Downtown Sacramento Preliminary Investigation
June, 2014
6. IMPROVEMENT PROJECT PRIORITIZATION After determining that the HOV Lane Alternative is the most appropriate for the corridor, the next step is determining the phasing of not just the HOV lanes, but all future improvement projects along the corridor. Chapter 6 contains a proposal for five phases of project development that would be required for the corridor to reach its ultimate facility. SELECTED ALTERNATIVE EVALUATION Since it is unlikely that HOV lanes and the other operational improvement projects along the corridor could be funded and constructed simultaneously, improvement projects were prioritized and phased. Sensitivity testing was conducted to determine which projects address bottlenecks in the order of the greatest severity. Besides purely operational benefits, the projected phasing also attempted to take into account cost, constructability, region‐wide HOV lane connectivity, and their ability to incentivize carpooling. Once a proposed phasing was settled upon, each phase was simulated and compared to determine the impacts of each. PHASING DESCRIPTION For this analysis, three types of projects with the potential for operational improvement were considered: ramp metering, auxiliary lanes, and HOV lanes. The projects within each phase are listed in Table 16 and illustrated in Figure 14.
TABLE 16: Future Phasing Project List
Phase Project Type PM Description Cost
1
Ramp Meter I‐80 EB YOL PM 0.4
At Richards Blvd EB on‐ramp, install single lane ramp meter with HOV bypass lane $600,000
Ramp Meter I‐80 WB YOL PM 0.1
At Richards Blvd WB on‐ramp, install double lane ramp meter with HOV bypass lane $2,180,000
Ramp Meter I‐80 EB PM 2.8/3.2
At Mace Blvd EB on‐ramp, widen the eastbound on‐ramp to include two metered mixed‐flow lanes with an HOV bypass lane and construct a 2000 ft. transition lane from the ramp gore point
$2,100,000
Ramp Meter I‐80 WB YOL PM 2.5
At Mace Blvd WB on‐ramp, install single lane ramp meter with HOV bypass lane $480,000
Ramp Meter I‐80 WB YOL PM 5.6
At Chiles Rd. EB on‐ramp, install a restrictive single‐lane ramp meter to discourage traffic bypassing the Mace Blvd. interchange $460,000
Ramp Meter I‐80 EB YOL PM 2.9)
At South River Rd EB on‐ramp, install single lane ramp meter with HOV bypass lane $25,080,000
2
Bus/Carpool Lane
I‐80 EB YOL PM 2.4 to 9.1
In the eastbound direction, widen to construct an HOV lane on I‐80 from near roughly Mace Blvd. to Enterprise Blvd. $161,439,000
Bus/Carpool Lane
I‐80 WB YOL PM 9.2 to 2.5
In the westbound direction, widen to construct an HOV lane along I‐80 from roughly Enterprise Blvd. to Mace Blvd. $161,754,000

44
I‐80/US 50 Davis to Downtown Sacramento Preliminary Investigation
June, 2014
TABLE 16: Future Phasing Project List
3
Auxiliary Lane
I‐80 EB SOL PM R 44.6 to YOL
PM 0.1
Extend I‐80 EB outside lane drop from SR 113 at SOL PM R 44.6 approximately 2,000 feet to YOL PM 0.1 to form an auxiliary lane that terminates at Richards Blvd
$1,291,000
Bus/Carpool Lane
I‐80 EB YOL PM 9.1 to US 50 YOL
PM 0.7
In the eastbound direction, restripe outside mixed‐flow lane as HOV lane from near Enterprise Blvd. to the interior of the I‐80/US 50 interchange
$4,646,000
Bus/Carpool Lane
US 50 EB YOL PM 0.7 to 1.4
In the eastbound direction, widen to construct an HOV lane along US 50 from the interior of the I‐80/US 50 interchange to the interior of the Harbor Blvd. interchange
$6,898,000
Bus/Carpool Lane
US 50 YOL PM 1.8 to 0.3
In the westbound direction, restripe outside mixed‐flow lane as HOV lane along US 50 from the beginning of the WB Harbor Blvd. transition lane to the interior of the I‐80/US 50 interchange
$2,100,000
Bus/Carpool Lane
US 50 YOL PM 0.3 to I‐80 YOL
PM 9.2
In the westbound direction, widen to construct an HOV lane along I‐80/US 50 from the interior of the I‐80/US 50 interchange to near Enterprise Blvd.
$28,105,340
4
Bus/Carpool Lane
I‐80 EB SOL PM R 44.6 to YOL
PM 2.4
In the eastbound direction, realign Phase 3 auxiliary lane widening between SR 113 and Richards Blvd to the outside at I‐80 EB SOL PM R 44.6 (eliminating exit‐only lane at Richards Blvd.) and extend as an HOV lane to YOL PM 2.4
$23,185,000
Bus/Carpool Lane
I‐80 WB YOL PM 2.5 to SOL PM
R44.5
In the westbound direction, widen to construct an HOV lane along I‐80 from Mace Blvd. to just past the YOL/SOL county line $24,232,000
5
Auxiliary Lane
US 50 EB YOL PM 2.9 to SAC
PM L 0.2
Construct an auxiliary lane between the South River Rd. on‐ramp and the I‐5 freeway off‐ramp $20,801,000
Auxiliary Lane
US 50 WB SAC PM L 0.2 to YOL
PM 2.6
Construct an auxiliary lane between the I‐5 on‐ramps (US 50 WB SAC PM L 0.2) and the South River Rd./Jefferson Blvd. off‐ramp (US 50 WB YOL PM 3.0); widen ramp to two lanes before the S. River Rd./Jefferson Blvd split, with one lane feeding each ramp; extend a merge area 2,000 feet past the ramp to I‐80 WB YOL PM 2.6
$44,385,000
Bus/Carpool Lane
US 50 WB YOL PM 1.4 to SAC
PM 0.0
In the eastbound direction, widen to construct an HOV lane along US 50 from near Harbor Blvd. to near the junction with I‐5 $157,056,960
Bus/Carpool Lane
US 50 WB SAC PM L 0.2 to YOL
PM 1.8
In the westbound direction, widen to construct an HOV lane along US 50 from near the I‐5 junction to the beginning of the WB Harbor Blvd. transition lane
$155,668,740
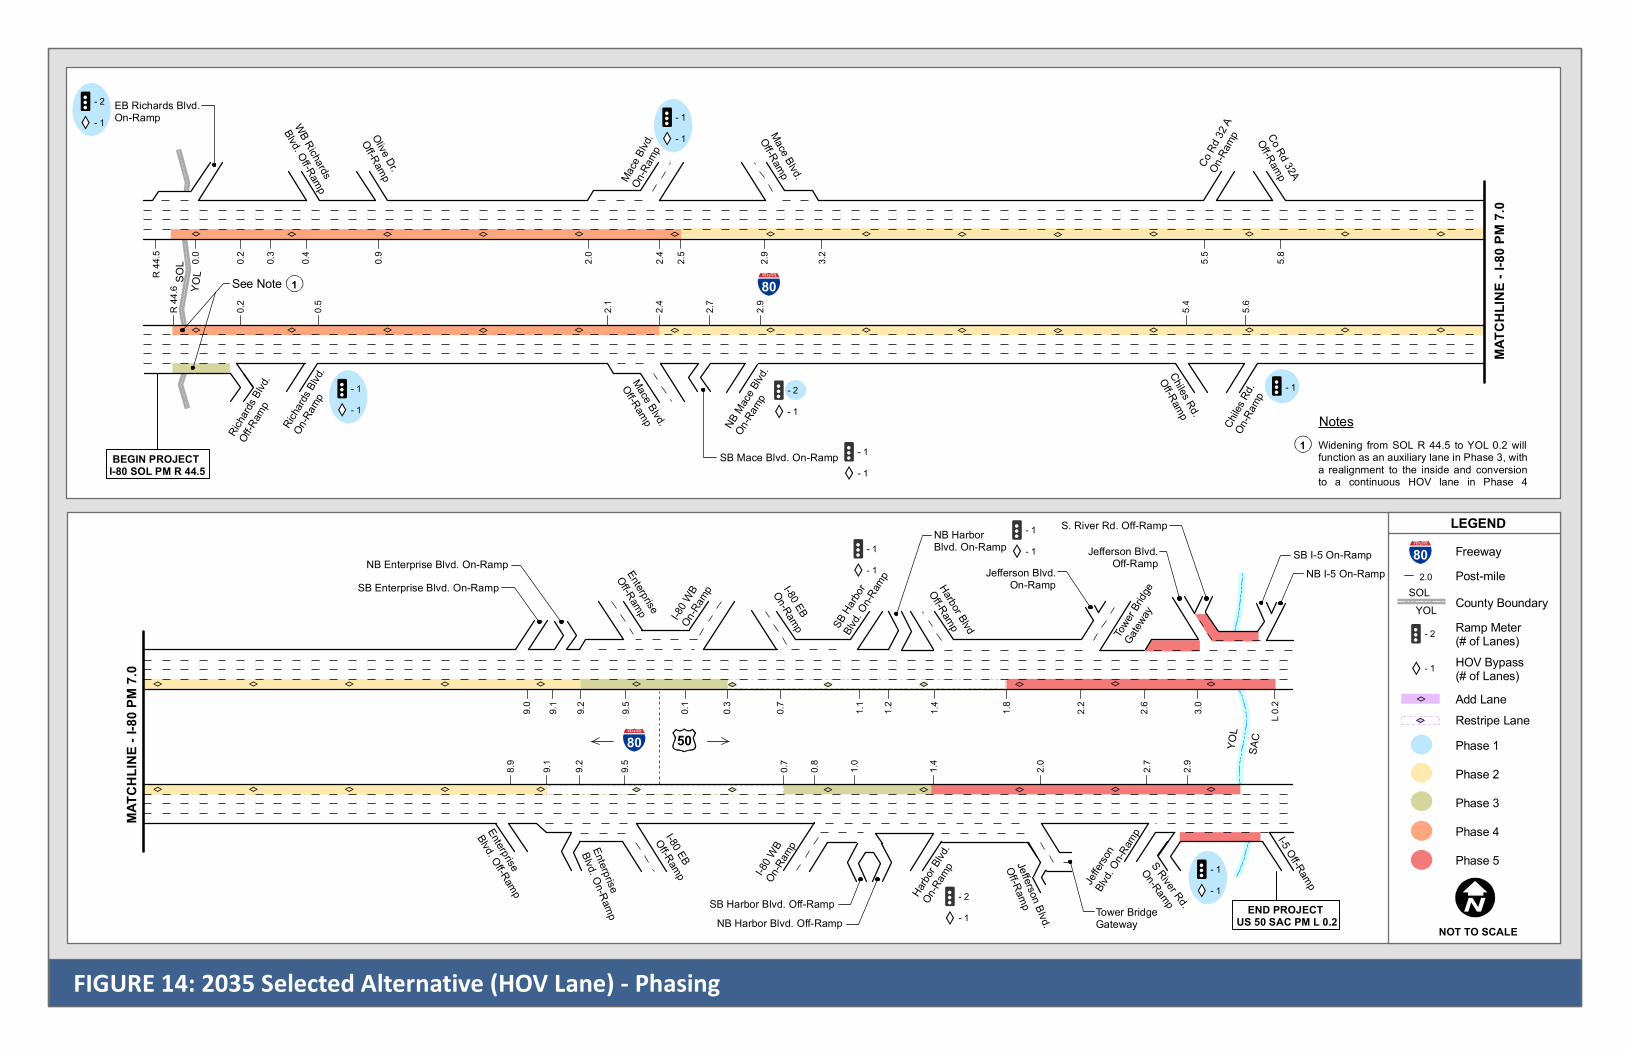
YOL
LEGEND
NOT TO SCALE
MATC
HLIN
E - I-8
0 PM
7.0
MATC
HLIN
E - I-8
0 PM
7.0EB Richards Blvd.On-Ramp WB Richards
Blvd. Off-Ramp
Olive Dr.
Off-Ramp Mace
Blvd.
On-Ra
mp Co Rd
32 A
On-Ra
mp Co Rd 32A
Off-Ramp
YOL
R 44
.6SO
L
BEGIN PROJECT I-80 SOL PM R 44.5
SAC
END PROJECT US 50 SAC PM L 0.2
Richar
ds Blv
d.Off
-Ramp
Richar
ds Blv
d.On
-Ramp
Mace Blvd.
Off-Ramp
SB Mace Blvd. On-Ramp
NB Mace
Blvd.
On-Ra
mp
Chiles
Rd.
On-Ra
mp
Chiles Rd.
Off-Ramp
0.2
0.5
2.1
2.4
2.7
2.9
5.4
5.6
8.9
9.1
9.2
9.5
0.7
0.8
1.0
1.4
2.0
2.7
2.9
Enterprise
Blvd. Off-Ramp
Enterprise
Blvd. On-Ramp
I-80 EB
Off-Ramp I-80 W
BOn
-Ramp
SB Harbor Blvd. Off-RampNB Harbor Blvd. Off-Ramp
Harbo
r Blvd
.On
-Ramp Jefferson Blvd.
Off-Ramp Tower BridgeGateway
Jeffer
sonBlv
d. On-R
amp
S River Rd.
On-Ramp
9.0
9.1
9.5
9.2
0.1
0.3
0.7
1.1
1.2
1.4
1.8
2.2
3.0
L 0.2
SB Enterprise Blvd. On-RampNB Enterprise Blvd. On-Ramp Enterprise
Off-Ramp I-80 W
BOn
-Ramp I-80 EB
On-Ramp SB Ha
rbor
Blvd. O
n-Ram
p
NB HarborBlvd. On-Ramp
Harbor Blvd
Off-Ramp
Tower
Bridge
Gatew
ay
Jefferson Blvd.On-Ramp
Jefferson Blvd.Off-Ramp
S. River Rd. Off-Ramp
SB I-5 On-RampNB I-5 On-Ramp
- 1- 1
- 2- 1
- 1- 1
- 1- 1
50
80
80
80
County BoundaryPost-mile
SOLYOL
Freeway
Ramp Meter(# of Lanes)
- 1 HOV Bypass(# of Lanes)
FIGURE 14: 2035 Selected Alternative (HOV Lane) - Phasing
Mace Blvd.
Off-Ramp
- 2
- 2- 1
- 1- 2- 1
Phase 1
2.0
Phase 2Phase 3Phase 4Phase 5
- 1- 1
- 1- 1
R 44
.5
1See Note
Widening from SOL R 44.5 to YOL 0.2 willfunction as an auxiliary lane in Phase 3, witha realignment to the inside and conversionto a continuous HOV lane in Phase 4
Notes1
Restripe LaneAdd Lane
- 1- 1
0.0
0.2
0.3
0.4 0.9
2.4
2.9
3.2
5.5
5.8
2.0
2.5
I-5 Off-Ramp
2.6
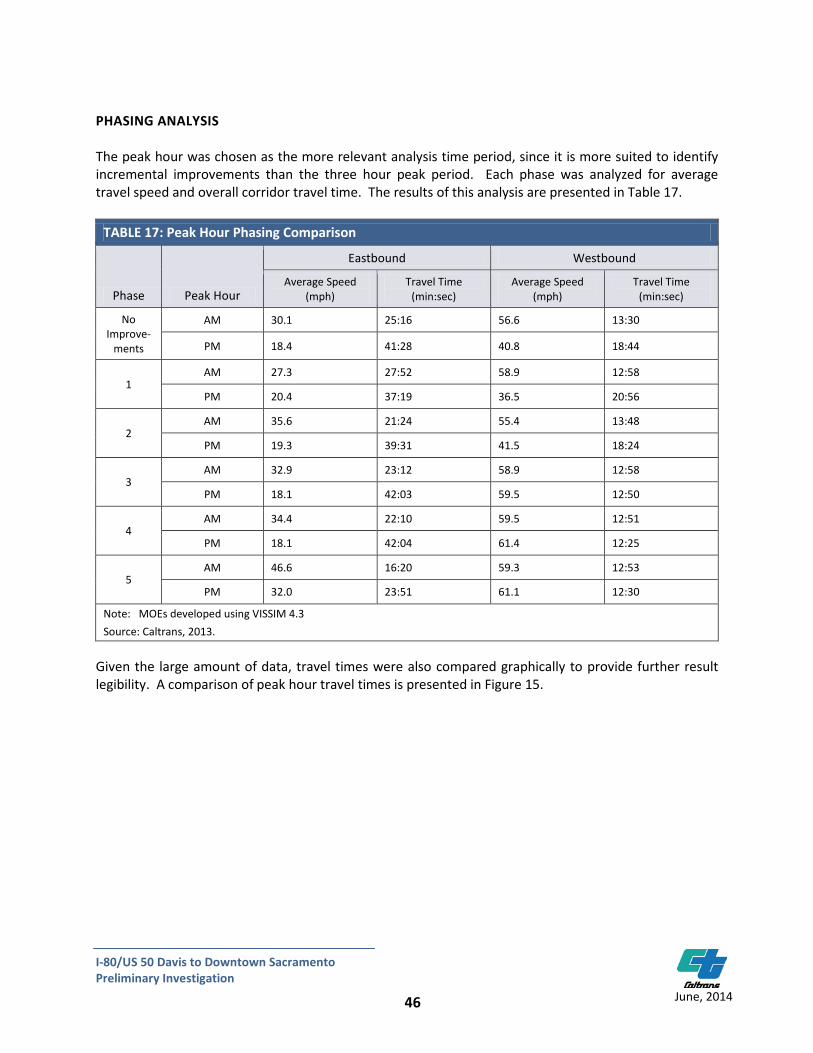
46
I-80/US 50 Davis to Downtown Sacramento Preliminary Investigation
June, 2014
PHASING ANALYSIS The peak hour was chosen as the more relevant analysis time period, since it is more suited to identify incremental improvements than the three hour peak period. Each phase was analyzed for average travel speed and overall corridor travel time. The results of this analysis are presented in Table 17.
TABLE 17: Peak Hour Phasing Comparison
Phase Peak Hour
Eastbound Westbound
Average Speed (mph)
Travel Time (min:sec)
Average Speed (mph)
Travel Time (min:sec)
No Improve-
ments
AM 30.1 25:16 56.6 13:30
PM 18.4 41:28 40.8 18:44
1 AM 27.3 27:52 58.9 12:58
PM 20.4 37:19 36.5 20:56
2 AM 35.6 21:24 55.4 13:48
PM 19.3 39:31 41.5 18:24
3 AM 32.9 23:12 58.9 12:58
PM 18.1 42:03 59.5 12:50
4 AM 34.4 22:10 59.5 12:51
PM 18.1 42:04 61.4 12:25
5 AM 46.6 16:20 59.3 12:53
PM 32.0 23:51 61.1 12:30
Note: MOEs developed using VISSIM 4.3
Source: Caltrans, 2013. Given the large amount of data, travel times were also compared graphically to provide further result legibility. A comparison of peak hour travel times is presented in Figure 15.

47
I-80/US 50 Davis to Downtown Sacramento Preliminary Investigation
June, 2014
With the exception of some minor, counterintuitive travel time increases in the eastbound direction that could be considered to fall within the margin of error of the model, several key findings can be gleaned from the results of the phasing models. These findings include:
• For a corridor with this level of congestion, ramp metering shows little improvement as a stand-alone solution in 2035. The benefits of ramp metering would likely show up in less congestion conditions, such as existing or in 2035 after the addition HOV lanes
• The addition of any improvement project in the westbound direction has little effect on travel times during the AM peak hour.
• In the PM peak hour, improvements in the westbound direction show little benefit until Phase 3, with Phases 4 and 5 having little effect
• In the eastbound direction during both peak hours, only minor operational advantages are realized with Phases 1 through 4, while Phase 5 reduces travel times by 35 percent during the AM peak hour and 43 percent during the PM peak hour from No Build
Based on a segmental travel speed analysis, a bottleneck still occurs at Chiles Rd. (AM peak hour) or Enterprise Blvd (PM Peak Hour) even after Phase 5 improvements. This indicates that little noticeable benefit would be realized from the Phase 5 improvements alone, because the demand would never reach this segment due to upstream bottlenecks. Perhaps the most important finding produced from the phasing analysis is that the corridor will experience little travel time, delay, or speed improvements in the eastbound direction without
48
I-80/US 50 Davis to Downtown Sacramento Preliminary Investigation
June, 2014
construction of all five phases. The HOV lanes envisioned in the SACOG Metropolitan Transportation Plan would provide little net benefit on their own by the year 2035 in alleviating the worst congestion within the study limits. Consequently, a commitment should be made to either construct improvements across the entire corridor by the design year or consider using the funding and resources elsewhere.
49
I-80/US 50 Davis to Downtown Sacramento Preliminary Investigation
June, 2014
7. CONCLUSIONS & RECOMMENDATIONS This report analyzed three future roadway cross-sectional alternatives: No Build (existing), adding a mixed-flow lane, and adding an HOV Lane. The Mixed-Flow Lane and HOV Lane alternatives both provided benefits over No Build and it was determined that the HOV Lane alternative was the most likely to proceed forward due to both the operational benefits and outside factors. The study’s key findings include:
• If the growth within the 2035 SACOG MTP is realized, vehicles volumes and congestion along the corridor will increase overall, irrespective of the alternative selected
• The Mixed-Flow Lane and HOV Lane alternatives, if constructed in their entirety, would both provide tangible operational improvements over the No Build Scenario; however, both would result in significantly higher VMT than No Build
• Interchange spacing issues in West Sacramento will prevent the corridor from operating free from congestion now and into the future, regardless of the number of total lanes, due to short weaving distances
• No improvement in operations in the most congested direction (eastbound) will be realized without full construction of HOV lanes across the entire corridor by the 2035 design year; without a commitment to achieve full build-out of the corridor, the justification for construction of any widening is questionable
Changes to some key assumptions or design characteristics of the project described herein could have a major effect on the results. If a standard ramp meter design is installed at Chiles Rd rather than a special-case, restrictive design, operations along the corridor will be significantly worse and HOV lanes will be significantly less effective. The placement and characteristics of any additional Sacramento River Crossings could considerably alter the traffic volumes entering and exiting the corridor at the westbound gate. Also, the addition of HOV lanes along US 50 and I-80 at the entrances to the corridor and freeway-freeway connectors, providing a seamless link between adjacent facilities, may encourage further HOV use along the corridor. Large amounts of growth in inter-regional and regional travel and new developments within West Sacramento are assumed by the year 2035. Recessionary events, general plan changes, or behavioral shifts in the way people travel over the next 25 years cannot be totally accounted for in long-range planning. If any of these change fundamentally, the future design of the corridor should be re-examined. The projects identified in the US 50/80 PI will take many years to implement and will require several different funding sources to bring to fruition. Caltrans will continue to work with its local and regional partners to plan, program, and construct individual projects and segments as upcoming transportation funding opportunities become available. In addition, Caltrans will continue to remain engaged with the Cities of Sacramento and West Sacramento as developments are proposed which may impact US 50/80. This will allow Caltrans, the City, and the applicant developer to review, analyze, and coordinate the mitigation of direct and cumulative significant impacts to US 50/80 relating to the specific land use proposal and, as appropriate
50
I-80/US 50 Davis to Downtown Sacramento Preliminary Investigation
June, 2014
and indicated by an objective nexus study, provide for developer contributions for the needed improvements to US 50/80. It is hoped that this PI can be used to streamline that process. Prior to programming and constructing the proposed improvement projects, a Project Initiation Document (PID) must be prepared for each project or group of projects to identify the purpose and need, scope, cost, and schedule. As an initial step, Caltrans will begin to include the highest priority projects into the Three-Year PID Work Plan. This allows resources to be allocated for PID development and to compete for funding. During this process, a substantive public and stakeholder outreach dialogue would occur regarding the projects.
i Counts received from Yolo County Transportation District in January, 2012. ii Counts received from Capitol Corridor in January, 2012. iii Highway Capacity Manual (2010). Transportation Research Board, Washington, D.C.. iv Caltrans (2003). “High-Occupancy Vehicle Guidelines”. Retrieved from www.dot.ca.gov/hq/traffops/systemops/hov/files/hov_guidelines/HOV%20Guideline.pdf v May, Adolph (2007). Determining the Effectiveness of HOV Lanes, University of California Berkeley TO 5326 (6326), UCB-ITS-PRR-2007-17, 2007. Retrieved from www.path.berkeley.edu/PATH/Publications/PDF/PRR/2007/PRR-2007-17.pdf vi Kwon, J., Varaiya, P. (2007). Effectiveness of California’s High Occupancy Vehicle (HOV) System, Transportation Research Part C. Retrieved from robotics.eecs.berkeley.edu/~varaiya/papers_ps.dir/TRC_342.pdf vii Caltrans (2003). “High-Occupancy Vehicle Guidelines”. Retrieved from www.dot.ca.gov/hq/traffops/systemops/hov/files/hov_guidelines/HOV%20Guideline.pdf