interstate tehcnology & regulatory council · interstate tehcnology & regulatory council...
TRANSCRIPT

INTERSTATE TEHCNOLOGY & REGULATORY COUNCIL
Warning! This document has
not been amended since
publication. Some content may
be out of date and may no
longer apply.
INTERSTATE TEHCNOLOGY & REGULATORY COUNCIL
Emerging Technologies forEnhanced In Situ Biodenitrification (EISBD)
of Nitrate-Contaminated Ground Water
Prepared byInterstate Technology and Regulatory Cooperation Work Group
Enhanced In Situ Biodenitrification Work Team
June 2000
Fertilizer
AtmosphericNitrogen
AtmosphericNitrogen
Industry
Animal &HumanWaste
N2 Gas
Nitrate
Nitrite
Leaching
Oxidation
Oxidation
Den
itri
fica
tio
n
Water Table
Ammonium
Ammonification
Plant Uptake
Ground Water
Plant DecayNitrogenFixation
Organic nitrogen
Nitrate Contamination
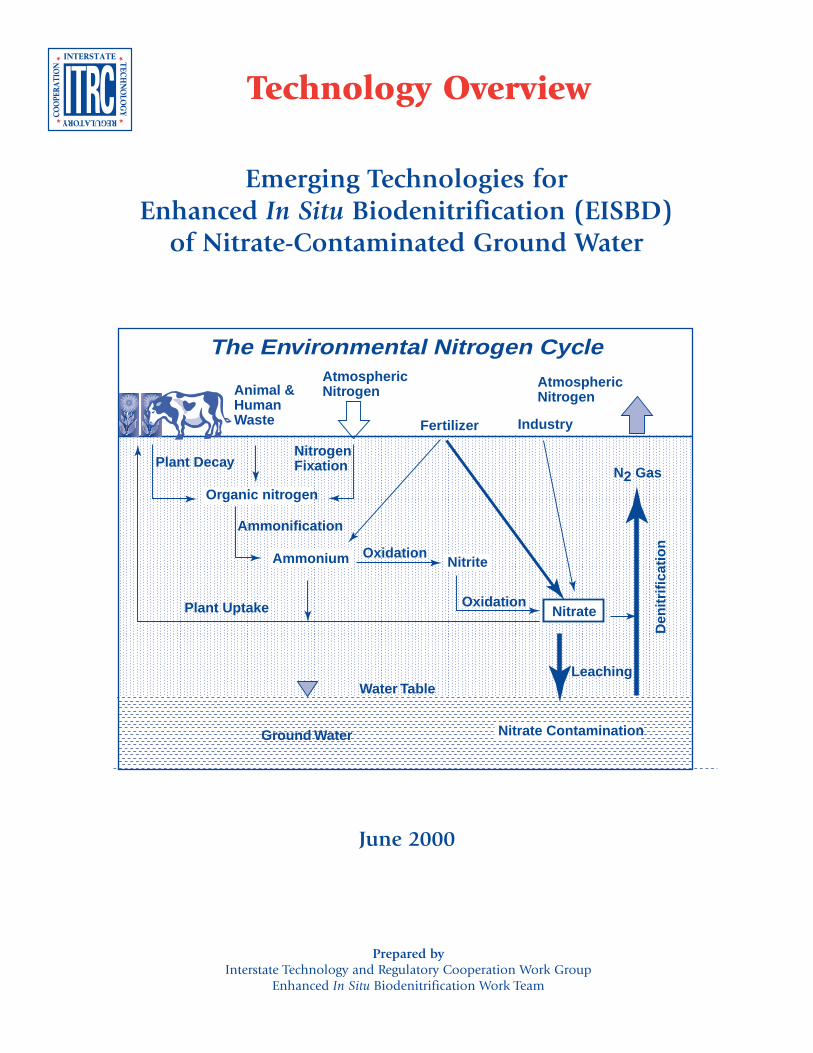
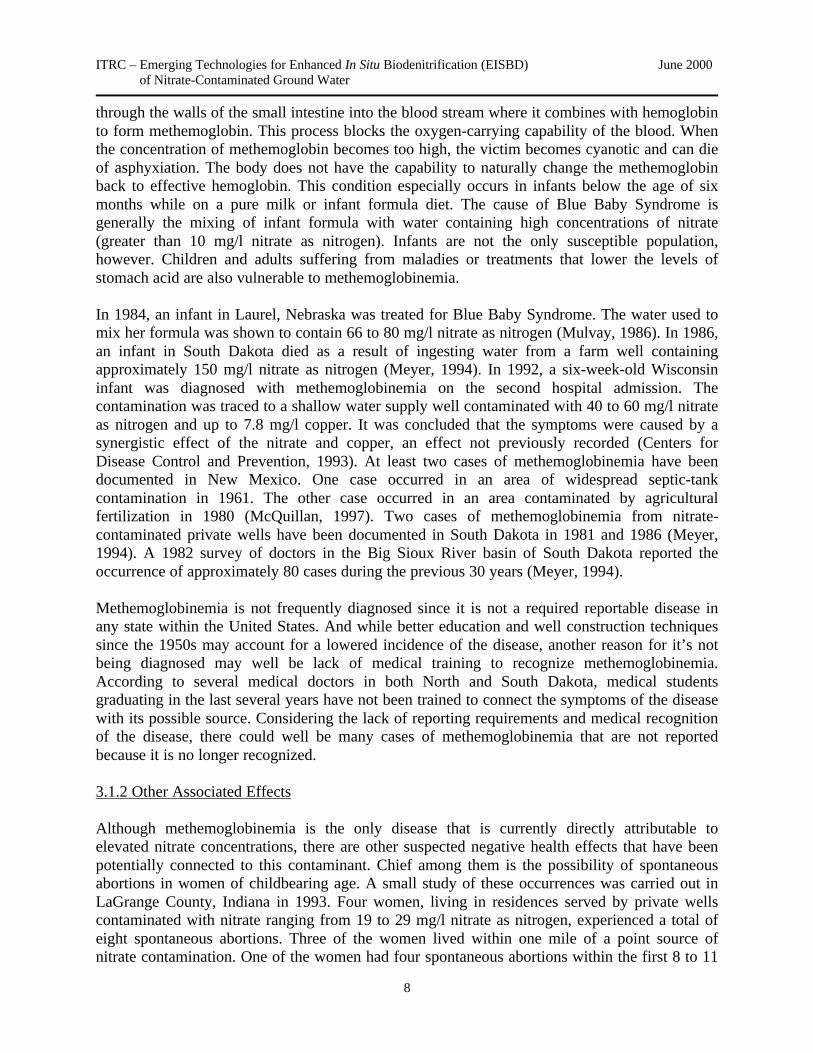
The Environmental Nitrogen Cycle
Technology Overview

ABOUT ITRC Established in 1995, the Interstate Technology & Regulatory Council (ITRC) is a state-led, national coalition of personnel from the environmental regulatory agencies of some 40 states and the District of Columbia; three federal agencies; tribes; and public and industry stakeholders. The organization is devoted to reducing barriers to, and speeding interstate deployment of, better, more cost-effective, innovative environmental techniques. ITRC operates as a committee of the Environmental Research Institute of the States (ERIS), a Section 501(c)(3) public charity that supports the Environmental Council of the States (ECOS) through its educational and research activities aimed at improving the environment in the United States and providing a forum for state environmental policy makers. More information about ITRC and its available products and services can be found on the Internet at www.itrcweb.org. DISCLAIMER This document is designed to help regulators and others develop a consistent approach to their evaluation, regulatory approval, and deployment of specific technologies at specific sites. Although the information in this document is believed to be reliable and accurate, this document and all material set forth herein are provided without warranties of any kind, either express or implied, including but not limited to warranties of the accuracy or completeness of information contained in the document. The technical implications of any information or guidance contained in this document may vary widely based on the specific facts involved and should not be used as a substitute for consultation with professional and competent advisors. Although this document attempts to address what the authors believe to be all relevant points, it is not intended to be an exhaustive treatise on the subject. Interested readers should do their own research, and a list of references may be provided as a starting point. This document does not necessarily address all applicable heath and safety risks and precautions with respect to particular materials, conditions, or procedures in specific applications of any technology. Consequently, ITRC recommends also consulting applicable standards, laws, regulations, suppliers of materials, and material safety data sheets for information concerning safety and health risks and precautions and compliance with then-applicable laws and regulations. The use of this document and the materials set forth herein is at the user’s own risk. ECOS, ERIS, and ITRC shall not be liable for any direct, indirect, incidental, special, consequential, or punitive damages arising out of the use of any information, apparatus, method, or process discussed in this document. This document may be revised or withdrawn at any time without prior notice. ECOS, ERIS, and ITRC do not endorse the use of, nor do they attempt to determine the merits of, any specific technology or technology provider through publication of this guidance document or any other ITRC document. The type of work described in this document should be performed by trained professionals, and federal, state, and municipal laws should be consulted. ECOS, ERIS, and ITRC shall not be liable in the event of any conflict between this guidance document and such laws, regulations, and/or ordinances. Mention of trade names or commercial products does not constitute endorsement or recommendation of use by ECOS, ERIS, or ITRC.
Emerging Technologies forEnhanced In Situ Biodenitrification (EISBD)
of Nitrate-Contaminated Ground Water
June 2000
Prepared byInterstate Technology and Regulatory Cooperation Work Group
Enhanced In Situ Biodenitrification Work Team

i
ACKNOWLEDGMENTS
The members of the ITRC Enhanced In Situ Biodenitrification (EISBD) Work Team wish toacknowledge the individuals, organizations and agencies that contributed to this TechnologyOverview document.
The EISBD Work Team effort, as part of the broader ITRC effort, is funded primarily by theUnited States Department of Energy (DOE). Additional funding and support has been providedby the United States Department of Defense (DOD) and the United States EnvironmentalProtection Agency (EPA). Administrative support for grants is provided by the EnvironmentalResearch Institute of the States (ERIS), a nonprofit educational subsidiary of the EnvironmentalCouncil of the States (ECOS). The Western Governors’ Association and the Southern StatesEnergy Board (SSEB), who previously held secretariat duties for the ITRC, remain involved.
The work team also wishes to recognize the efforts of:
• The New Mexico Environment Department• The Department of Environmental Quality, Nebraska• The Department of Environmental Quality, North Dakota• University of New Mexico, Department of Chemical and Nuclear Engineering• University of Nebraska/Lincoln, School of Natural Resources• Bernalillo County Environmental Health Department, New Mexico• Barbour Communications Inc., Stakeholder Participation
Dr. Eric Nuttall’s research (Section 7.1) was financed in part by the DOE through the NewMexico Waste-management Education and Research Consortium (WERC). The experiments andmeasurements were done at the Center for Radioactive Waste Management (CeRaM) at theUniversity of New Mexico.
Dr. Roy Spalding’s field research (Section 7.2) was conducted in cooperation with the U.S.Bureau of Reclamation and the Central Platte Natural Resource District.
The members of the EISBD Work Team are• Team Lead: Bart Faris, Hydrogeologist, New Mexico Environment Department• Dr. Eric Nuttall, Professor, University of New Mexico, Dept. of Chemical and Nuclear
Engineering• Dr. Roy Spalding, Professor, University of Nebraska-Lincoln• Dick Erhman, Hydrogeologist, Nebraska Dept. of Environmental Quality• Kris Roberts, Hydrogeologist, North Dakota Department of Environmental Quality• Anne Williams Callison, President, Barbour Communications, Inc.• Steve Hill, Coleman Research

iii
EXECUTIVE SUMMARY
Enhanced in situ biodenitrification (EISBD) is a developing technology for in situ reduction ofnitrate in contaminated ground water. One of the most pervasive ground water contaminants inthe U.S. is nitrate. This document focuses on issues related to environmental concerns aboutnitrate and current remediation techniques.
Traditional technologies for the remediation of nitrate-contaminated ground water are generallycostly, lengthy, and often only partly effective. Of the emerging technologies for nitrateremediation, EISBD technologies offer a more cost-effective, timely, and more efficient meansof reducing nitrate contamination to acceptable levels. This document describes two such EISBDtechnologies, their applicability to contaminated sites, and the results of the laboratory and field-testing done to date. Regulatory and stakeholder concerns related to both nitrate contaminationand these two EISBD technologies are also presented.
Since methemoglobinemia (Blue Baby Syndrome) has been reported in several states and isassociated with elevated levels of nitrate in drinking water, nitrate is a federally regulatedcompound. Nitrate contamination is also alleged to cause spontaneous, early-term abortions inhumans and animals and may be related to certain types of cancer and thyroid dysfunction.Because of these issues, nitrate contamination is of concern to public health officials.
Sources of nitrate contamination include fertilizers, human and animal waste, and explosives.The presence of excess nitrate and other nutrients in streams, lakes, and estuaries has devastatedfisheries and caused diminished recreational potential of the resource. One source of nitratecontamination in surface waters is nitrate-contaminated ground water.
Membership on this work team was open to all ITRC members. Participants with expertise orinterest in nitrate treatment technologies in their states elected to join the team and contribute tothe development of this work product. Professors from the University of New Mexico andUniversity of Nebraska-Lincoln also participated and provided research information. ITRCpublic stakeholder representatives provided input regarding public and community concerns onthe issues and remedial technologies.
The EISBD technology being developed at the University of New Mexico involves the injectionof an amendment, usually acetate, through injection wells. These amendments are nontoxic, self-limiting, and promote the conditions optimal for anaerobic, microbial denitrification to occur. Byamendment injection, the rate of denitrification is greatly accelerated, and nitrate is converted tonitrogen gas in a biochemical process. This technology has the potential of remediating sizablenitrate plumes in ground water systems.
The EISBD technology under development at the University of Nebraska-Lincoln is gearedtoward the reduction of nitrate contamination around public and/or domestic well fieldsdedicated to the production of drinking water. Injection of carbon amendments carefullycalculated at controlled rates produce an environment where nonharmful anaerobic, nitrate-reducing microbes proliferate at a safe distance from the wellhead. Microbial denitrificationreduces the nitrate concentrations, again through conversion to nitrogen gas.

v
TABLE OF CONTENTS
ACKNOWLEDGMENTS............................................................................................................i
EXECUTIVE SUMMARY........................................................................................................iii
1.0 INTRODUCTION ..............................................................................................................1
2.0 SOURCES OF NITRATE...................................................................................................2 2.1 Human and Animal Wastes ...........................................................................................3 2.2 Fertilizers ......................................................................................................................4 2.3 Explosives .....................................................................................................................4 2.4 Naturally Occurring Nitrates..........................................................................................6 2.5 Industrial Uses of Nitrate...............................................................................................7
3.0 EFFECTS OF NITRATE ....................................................................................................7 3.1 Human Health Effects ...................................................................................................7 3.2 Human Exposure ...........................................................................................................9 3.3 Animal Health Effects .................................................................................................11 3.4 Environmental Effects .................................................................................................11
4.0 TRADITIONAL NITRATE REMEDIATION OPTIONS .................................................12 4.1 No Action....................................................................................................................12 4.2 Pump with Beneficial Use ...........................................................................................12 4.3 Pump and Treat ...........................................................................................................13 4.4 Pump and Waste..........................................................................................................13 4.5 Phytoremediation.........................................................................................................13
5.0 NEW AND EMERGING REMEDIATION TECHNOLOGIES ........................................14 5.1 Aboveground Denitrification .......................................................................................14 5.2 Permeable Reactive Barriers........................................................................................16 5.3 Denitrification in Combination with Other Contaminants ............................................16
6.0 ENHANCED IN SITU BIODENITRIFICATION..............................................................16 6.1 General........................................................................................................................16 6.2 Current Applications of Enhanced In Situ Biodenitrification........................................17
7.0 RESEARCH AND DEVELOPMENT...............................................................................17 7.1 UNM Professor Eric Nuttall ........................................................................................17 7.2 UNL Professor Roy Spalding ......................................................................................24
8.0 REGULATORY ISSUES..................................................................................................32 8.1 Regulatory Enforcement of Nitrate Contamination ......................................................32 8.2 Issues Specific to Enhanced In Situ Biodenitrification .................................................34

vi
9.0 PERFORMANCE PARAMETERS...................................................................................39 9.1 Cost.............................................................................................................................39 9.2 Time to Completion.....................................................................................................40 9.3 Contaminant Reduction ...............................................................................................40
10.0 PUBLIC AND STAKEHOLDER ACCEPTANCE AND CONCERNS...........................40
11.0 CONCLUSIONS.............................................................................................................41
12.0 REFERENCES ...............................................................................................................43
LIST OF TABLES
TABLE 1-1. Total Nitrogen Source Concentrations ...............................................................7TABLE 3-1. Number of Community Public Drinking Water Systems Found to be
in Violation of the 10 mg/L Nitrate as Nitrogen MCL for the Years 1980 to 1998..........................................................................................10TABLE 5-1. Nitrate Remediation Options............................................................................15TABLE 7-1. Aboveground Denitrification Scale-Up Tests Using Indigenous Ground
Water Bacteria ................................................................................................19TABLE 7-2. Comparison of Average Denitrification Rates Using Acetate and TMP as Amendments...............................................................................................21
LIST OF FIGURES
FIGURE 1-1. The Nitrogen Cycle ...........................................................................................2FIGURE 2-1. Map of Areas with Major Explosives Contamination.........................................5FIGURE 2-2. USGS Nitrate Risk Map ....................................................................................6FIGURE 7-1. Design of an In Situ Denitrification Test at Tri-Tech Site,
Albuquerque’s South Valley ...........................................................................20FIGURE 7-2. Reaction Concentration Curves Resulting from Short-Term Monitoring during an In Situ Denitrification Test............................................21FIGURE 7-3. Reaction Concentration Curves Measured During an In Situ
Biodenitrification Test. ...................................................................................22FIGURE 7-4. Modified Schematic Diagram of Continuous Denitrification Field Test…………………………………………………………………...………...22FIGURE 7-5. Denitrification Results From 4-Inch Monitoring Well Using
YSI 6920 Water Quality Monitor ....................................................................23FIGURE 7-6. Cross-Sectional View of Subsurface Entry Caisson, In Situ Microcosm, and
Multilevel Samplers ........................................................................................24FIGURE 7-7. Concentration vs. Time for Selected Analytes Involved in or
Affected by Microbial Denitrification in a Microcosm Amended with 50 mg C L-1 .............................................................................................25

vii
FIGURE 7-8. Concentration vs. Time for Selected Analytes Involved in or Affected by Microbial Denitrification Following Injection in a Microcosm Amended with 100 mg C L-1 ............................................................................................26FIGURE 7-9. Layout of Daisy Injection System.....................................................................29FIGURE 7-10. Vertical Section of Daisy Injection System.......................................................30FIGURE 7-11. Anion, D.O.C., and D.O. Concentration in Inner Well #3 .................................31FIGURE 7-12. Anion, D.O.C., and D.O. Under Pulse Injection in Extraction Well ..................31
APPENDICES
APPENDIX A AcronymsAPPENDIX B State Nitrate Ground Water StandardsAPPENDIX C Nitrogen Compound Contamination ExamplesAPPENDIX D ITRC Work Team Contacts, ITRC Fact Sheet, ITRC Product List, and
Document Evaluation Survey

EMERGING TECHNOLOGIES FORENHANCED IN SITU BIODENITRIFICATION (EISBD)
OF NITRATE-CONTAMINATED GROUND WATER
1.0 INTRODUCTION
The purpose of ITRC is to improve environmental cleanup by encouraging use of innovativetechnologies, while reducing regulatory paperwork and overall costs. States are collaborating todevelop and facilitate the use of standardized processes for the performance verification of newtechnologies.
The purpose of this document is to describe the pervasiveness of nitrate-contaminated groundwater in the United States, create awareness associated with environmental and health problems,and provide an overview of the developing technology of EISBD. EISBD is an emergingtechnology for remediating nitrate-contaminated ground water and protecting public anddomestic supply wells.
Nitrate is a worldwide water contaminant that can cause health problems in infants and animalsand can lead to cultural eutrophication of natural water bodies (Fennessy and Cronk, 1997). Thefederally regulated Maximum Contaminant Level (MCL) in drinking water is 10 mg/l nitrate-nitrogen. This document describes nitrate in the environment, sources of nitrate, environmentaland health effects of nitrate, current nitrate remediation practices, and the description of EISBD.Furthermore, current regulatory procedures and practices of nitrate-contaminated ground waterand regulatory issues of EISBD will be discussed. Public concerns, issues, and awareness ofnitrate contamination will be presented. Current research on EISBD will be presented along withperformance and cost criteria for EISBD implementation.
The fate of nitrate is complex and includes several physical and biological processes of whichdenitrification plays a major role. There are four major forms of nitrogen in the soil and vadosezone: 1) Nitrogen gas, 2) Organic nitrogen, 3) Ammonia nitrogen bound on clays and aqueous inpore water, and 4) Nitrate. Denitrification results in the reduction of nitrate to nitrogen gas(Figure 1).
Nitrogen may be added to the soil through fertilizer, rain, animal and human waste, organicmatter, and anthropogenic influences such as explosives and chemical wastes. Nitrogen mayundergo chemical transformations before it is transported into ground water. The major divisionsof the nitrogen cycle are mineralization, immobilization, nitrogen fixation, ammonification,nitrification, and denitrification. The conversion of mobile nitrogen species to some organicforms is termed immobilization or microbial and plant assimilation. Mineralization is theconversion of complex organic nitrogen to more simplified inorganic forms. Nitrogen may bepresent in the soil in the form of ammonia (NH4
+). Ammonia may be metabolized by organisms,assimilated by plants, adsorbed by clay minerals and/or organic matter, and oxidized to nitrate(NO3
-). Nitrification is the biochemical oxidation of ammonia to nitrate. In the presence ofspecific bacteria and oxygen, ammonia is enzymatically oxidized in a stepwise process to nitrite(NO2
-) followed by nitrate (refer to equations on following page).

ITRC – Emerging Technologies for Enhanced In Situ Biodenitrification (EISBD) June 2000 of Nitrate-Contaminated Ground Water
2
T h e E n v i r o n m e n t a l N i t ro g e n C y c l e
A t m o s p h e r i cN i t r o g e n
O r g a n ic n i t r o g e n
A m m o n i u m
N i t r o g e nF i x a t i o n
N i t r i t e
N i t r a t e
A m m o n i f i c a t i o n
O x id a t i o n
Den
itri
fica
tio
n
O x i d a t i o n
F e r t i l i z e r
N i t r a t e C o n t a m i n a t i o n
W a t e r T a b l eL e a c h i n g
P l a n t U p t a k e
P l a n t D e c a y
A n im a l &H u m a nW a s t e
N 2 G a s
In d u s t r y
A t m o s p h e r i cN i t r o g e n
G r o u n d W a t e r
Figure 1-1: The Nitrogen Cycle (Deng, 1998)
RNH2 + H2 NH4+ + energy
2NH4 + 3O2 2NO2- + 2H2O + 4H + energy
2NO2- + O2 2NO3
- + energy
5C + 4NO3- + 2H2O 2N2 + 4HCO3 + CO2
*R signifies an organic compound
Nitrification will only occur in oxidizing environments. Secondary parameters affectingnitrification include temperature, moisture content, bacterial population of nitrifiers, and pH.Denitrification is the biochemical reduction of nitrate-nitrogen to nitrogen gas in the absence ofoxygen. EISBD takes advantage of this naturally occurring process to remove nitratecontamination from ground water.
2.0 SOURCES OF NITRATE
Nitrogen losses due to denitrification help to maintain relatively low nitrate concentrations inground and surface waters. In most naturally occurring environments, nitrate concentrations inground water are usually < 3 mg/l (Smith et al., 1987). It should be pointed out thatdenitrification does occur naturally. Due to the Federal Clean Water Act, the EPA has

ITRC – Emerging Technologies for Enhanced In Situ Biodenitrification (EISBD) June 2000 of Nitrate-Contaminated Ground Water
3
established drinking water standards for nitrate at 10 mg/l nitrate-nitrogen. This standard appliesto all public supply systems. Numerous states have established a ground water standard fornitrate (Appendix B). To provide a higher margin of health safety, Germany and South Africahave lowered their nitrate-nitrogen drinking water standards to 4.4 mg/l (Kross et al., 1995).Thailand has established a bottled drinking water standard for nitrate at 4.0 mg/l (Ministry ofPublic Health, 1981). Ground water concentrations of nitrate > 10 mg/l are attributed to variousnitrogen sources. These sources are described below. Figure 2-2 reveals nitrate concentrationtrends across the United States.
2.1 Human and Animal Wastes
Waste produced by humans and animals are important sources of nitrate in any areacharacterized by significant human or animal populations. Nitrates from such waste can exhibitthe characteristics of either point or nonpoint source pollution. Point sources occur at or near theactual waste facility involved and typically exhibit high levels of nitrate or ammonia in a limitedarea. Nonpoint sources are spread over large areas (e.g., in fertilization), and impacted aquifersare often characterized by lower (but still > 10mg/l) levels of nitrate-nitrogen.
Nitrate from human waste originates mostly from individual septic systems or municipalwastewater treatment facilities. According to recent estimates shown on West VirginiaUniversity’s Small Flows Clearinghouse Web site (http://www.nsfc.wvu.edu), approximately25% of the population of the United States is served by individual systems such as septic tanksand cesspools. Typically, the nitrogen content of effluent from such systems is in theneighborhood of 30 to 60 mg/l total nitrogen, with ammonia making up the vast majority of thistotal (Minnesota Extension Service, 1994). The nitrogen content of this effluent varies widelydepending upon the condition of the individual system and the type of waste being introduced.Traditionally, septic systems have served farms and rural businesses and have been of greatestconcern in the more agricultural areas of the country. However, increasing development of non-farm acreage in the countryside bordering cities has resulted in a much greater density of onsitetreatment systems (e.g., tens per square mile) than has historically been the case.
The remaining 75% of the U.S. population are served by municipal wastewater treatmentsystems. Again, nitrogen content of effluent from municipal systems will vary according to thenature of the incoming waste stream and the type and condition of the system. However, afterprimary treatment with activated sludge, the effluent typically still contains about 15 to 35 mg/lof total nitrogen; however, more advanced systems can reduce this to about 2 to 10 mg/l (EPA,1993).
Waste from dairies, open feedlots, confined feeding operations, stockyards, and other facilitiesfor raising and holding animals is also a potential source of nitrate and other forms of nitrogen.Recent public attention has focused on the operation of large hog confinement operations inplaces like North Carolina, Iowa, Colorado, and Nebraska; chicken and poultry farms inArkansas and Missouri; cattle feedlots in Texas, Kansas, and Nebraska; and dairy farms inWisconsin and the upper Midwest. While public concern over animal waste includes such issuesas odor, flies, effects on property values, and surface water impact, these facilities represent amassive source of nitrogen and other nutrient inputs to ground water. For example, theUniversity of Nebraska Cooperative Extension (1998) estimates suggest that waste from stock
ITRC – Emerging Technologies for Enhanced In Situ Biodenitrification (EISBD) June 2000 of Nitrate-Contaminated Ground Water
4
animals typically contains from about 0.045 to 0.18 Kg of nitrogen per pound of animal weight.Typically, total nitrogen concentrations of dairy wastewater range from 150 to 500 mg/l. In NewMexico alone, approximately one third of all dairy operations have contaminated ground waterwith nitrate above state ground water standards. In a study of three dairies in Merced andStanislaus counties in California, maximum nitrate concentrations in ground water monitoringwells were 250 mg/l, and the average nitrate concentrations in ground water were 45 mg/l(Davis, 1995).
2.2 Fertilizers
Nitrogen is the most common element used as a fertilizer supplement for agricultural, turf, andgarden use. Nitrogen fertilizer normally takes one of two forms: commercial fertilizer or animalwaste. Animal waste has been applied to cropland for generations, both as a means offertilization and waste disposal. Commercial fertilizer usage in the United States has becomecommonplace in the last half of the twentieth century with the advent of anhydrous ammonia,liquid nitrogen, and similar formulations that have greatly increased crop yields. In some cases,fertilizer has been over applied, either from a lack of understanding or good information aboutcrop nutrient requirements, or as a relatively inexpensive “insurance policy” againstunpredictable conditions that may leave crops short of nutrients. Nitrate’s high solubility and lowsorptivity allows infiltration beyond the root zone when over applied or over watered. Thus,infiltration via precipitation or irrigation water easily transports nitrate, which is not taken up byplants, downward to ground water. As a result of this process, elevated ground water nitratelevels have occurred in heavily farmed areas. Results of federal, state, and local surveys, withover 200,000 nitrate data points, show large areas where ground water exceeds 10 mg/l in welldrained soils that are dominated by irrigated cropland (Spalding and Exner, 1993). Recentattempts to reduce nonpoint nitrate contamination in ground water have focused on proper timingand reduced applications of fertilizer and irrigation water. Monitoring results from Nebraska andNorth Dakota indicate that such efforts can have a slow but positive effect on ground waternitrate levels.
Use of commercial fertilizers in agricultural areas has increased rapidly over the last threedecades. Along with this explosion in usage went an explosion in the number of fertilizerdistribution facilities. Until recently, commercial fertilizers were not recognized as a potentialground water contaminant. Even surface water scientists did not take seriously the threat offertilizers until the 1970s. In addition, due to the low cost of commercial fertilizers, it has onlybeen recently that distribution and sales facilities became overly concerned with goodhousekeeping practices as it related to fertilizer. Fertilizer sales facilities’ runoff was transportedto ditches and then to surface waters or it infiltrated into the ground water system at thesefacilities in extremely high concentrations.
2.3 Explosives
Nitrogen is a major element in the manufacture of explosives, which primarily utilizesammonium nitrate and diesel fuel. Without proper management and treatment, waste streams thatcontain high concentrations of ammonium nitrate and diesel fuel can cause ground water qualitydegradation. In some instances, this waste stream, along with improper handling of theammonium nitrate, has created nitrate contamination. Presently, most explosive manufacturers

ITRC – Emerging Technologies for Enhanced In Situ Biodenitrification (EISBD) June 2000 of Nitrate-Contaminated Ground Water
5
have taken pollution prevention steps to reduce or eliminate this waste (due to regulations oreconomical savings). Waste streams from explosives manufacture contain nitrogenconcentrations ranging from 200 mg/l to over 1,000 mg/l.
Ordnance testing grounds and weapons manufacturing, loading, packing, and transportation sitesthat were operated by or for DOE or DOD have historically used nitrogen compounds. The majornitrogen compounds that pose an environmental threat are 2,4,6 trinitrotoluene (TNT), 2,3,5-trinitro-1,3,5 triazine (RDX), and oxyhydro 1,3,5,7-tetranitro-1,3,5,7-tetrazocine (HMX),(Townsend and Meyers, 1996). These compounds pose many environmental concerns in additionto nitrate contamination but may contribute to or are the source of nitrate-contaminated groundwater. It is believed that since the manufacturing of these compounds utilize nitrogencompounds, nitrate may be present in high concentrations as residual compounds. Nitrateconcentrations in ground water at these sites may range from 20 mg/l to over 200 mg/l. Figure 2-1 shows explosives sites that have contributed to contamination across the United States.
Sierra
Hawthorne AD
Toole AD
Ft Wingate ADA
Cornhusker AAP
Sunflower AAP
Lake City AAP
Kansas AAP
Longhorn AAP
Lone Star AAP
Louisiana AAP
Alabama AAP
Milan AAPVolunteer AAP
Holston AAP
Radford AAPBlue Grass AD
Ravenna AAP
Indiana AAP
Crane AAA
Joliet AAP
Badger AAP
Iowa AAPSavanna AD
Anniston AD
Garden City AAF
Weldon Spring OW
Nansemond OP
Westover AFB
West Virginia OW
Kentucky OWChickasaw OW
Kingsbury OPPlum Brook OW
Turner AFB
Travis Fd
Clinton-Sherman
Bennett ANGF
Dugway PG
Aberdeen PG
Ft Campbell
Ft McClellan
Newport AAP
Picatinny A
Umatilla AD
Sites with Major Explosives Contamination
Bangor NSB
Figure 2-1. Map of Areas with Major Explosives Contamination(Note: DOD considers some of these sites to have been remediated)

ITRC – Emerging Technologies for Enhanced In Situ Biodenitrification (EISBD) June 2000 of Nitrate-Contaminated Ground Water
6
2.4 Naturally Occurring Nitrates
It is unusual for pristine ground water systems to accumulate more than 3 mg/l nitrate (Madisonand Brunnet, 1985). However, naturally occurring processes may cause nitrate contamination inground water. One example occurred in Texas where the natural range consisted of buffalo grassthat formed a symbiotic relationship with nitrogen-fixing bacteria. When these range lands wereconverted to dry land farming, the organic matter from the buffalo grass was oxidized to nitratecontamination in ground water at concentrations of 100 to 1,000 mg/l (Chapelle, 1993). Thebreaking up of prairie grasslands caused a huge flush of nitrate out of the root zone into groundwater.
Figure 2-2. USGS Nitrate Risk Map,(Nitrate Elimination Co., Inc. Web site, 1999)
During lightning storms, atmospheric nitrogen is converted to nitrate and deposited to the soilthrough rain. In arid conditions, high nitrate concentrations may be caused by evapotranspirationof infiltrating rainwater in the shallow subsurface. During storm events, this high nitrateconcentration may be transported to the shallow aquifer where nitrate concentrations in groundwater are up to 60 mg/l (McQuillan, 1995).
Nitrate concentrations in ground water > 10 mg/l may also be attributed to geologic formations.Sedimentary deposits with high organic matter may release nitrogen. In New Mexico, twolimestone formations have been identified with naturally occurring ground water nitrateconcentrations between 12–15 mg/l (Titus, 1980).
ITRC – Emerging Technologies for Enhanced In Situ Biodenitrification (EISBD) June 2000 of Nitrate-Contaminated Ground Water
7
2.5 Industrial Uses of Nitrate
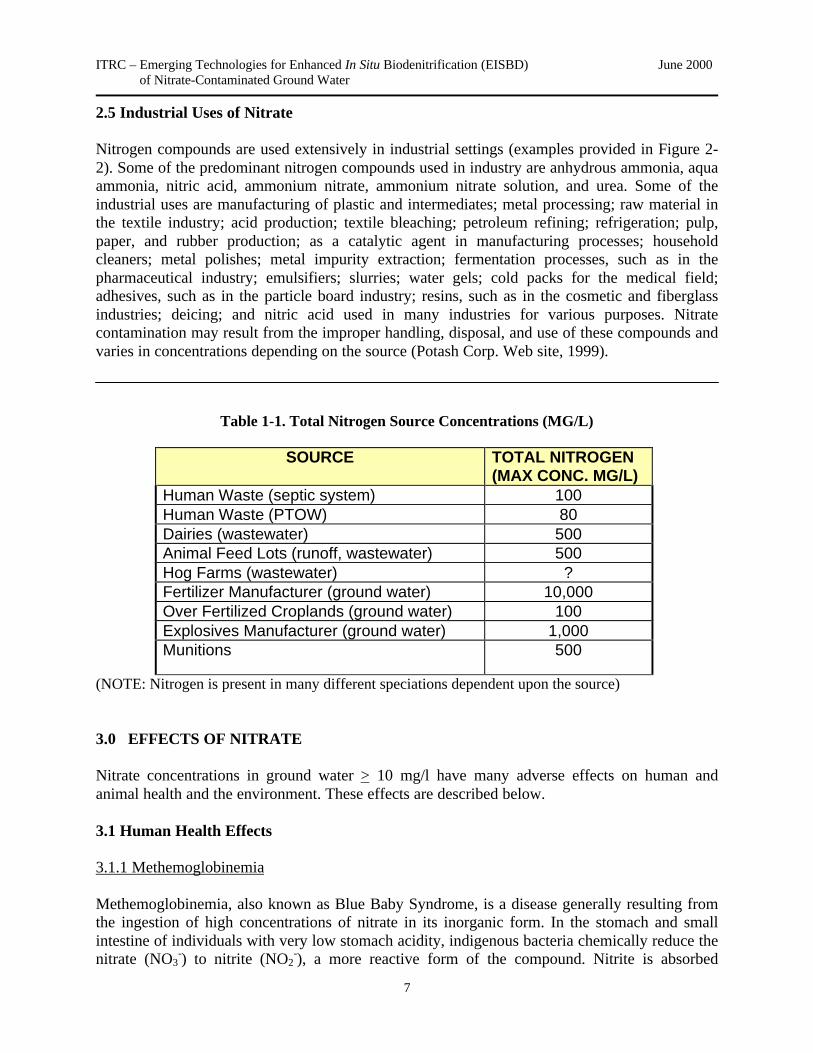
Nitrogen compounds are used extensively in industrial settings (examples provided in Figure 2-2). Some of the predominant nitrogen compounds used in industry are anhydrous ammonia, aquaammonia, nitric acid, ammonium nitrate, ammonium nitrate solution, and urea. Some of theindustrial uses are manufacturing of plastic and intermediates; metal processing; raw material inthe textile industry; acid production; textile bleaching; petroleum refining; refrigeration; pulp,paper, and rubber production; as a catalytic agent in manufacturing processes; householdcleaners; metal polishes; metal impurity extraction; fermentation processes, such as in thepharmaceutical industry; emulsifiers; slurries; water gels; cold packs for the medical field;adhesives, such as in the particle board industry; resins, such as in the cosmetic and fiberglassindustries; deicing; and nitric acid used in many industries for various purposes. Nitratecontamination may result from the improper handling, disposal, and use of these compounds andvaries in concentrations depending on the source (Potash Corp. Web site, 1999).
Table 1-1. Total Nitrogen Source Concentrations (MG/L)
SOURCE TOTAL NITROGEN(MAX CONC. MG/L)
Human Waste (septic system) 100Human Waste (PTOW) 80Dairies (wastewater) 500Animal Feed Lots (runoff, wastewater) 500Hog Farms (wastewater) ?Fertilizer Manufacturer (ground water) 10,000Over Fertilized Croplands (ground water) 100Explosives Manufacturer (ground water) 1,000Munitions 500
(NOTE: Nitrogen is present in many different speciations dependent upon the source)
3.0 EFFECTS OF NITRATE
Nitrate concentrations in ground water > 10 mg/l have many adverse effects on human andanimal health and the environment. These effects are described below.
3.1 Human Health Effects
3.1.1 Methemoglobinemia
Methemoglobinemia, also known as Blue Baby Syndrome, is a disease generally resulting fromthe ingestion of high concentrations of nitrate in its inorganic form. In the stomach and smallintestine of individuals with very low stomach acidity, indigenous bacteria chemically reduce thenitrate (NO3
-) to nitrite (NO2-), a more reactive form of the compound. Nitrite is absorbed
ITRC – Emerging Technologies for Enhanced In Situ Biodenitrification (EISBD) June 2000 of Nitrate-Contaminated Ground Water
8
through the walls of the small intestine into the blood stream where it combines with hemoglobinto form methemoglobin. This process blocks the oxygen-carrying capability of the blood. Whenthe concentration of methemoglobin becomes too high, the victim becomes cyanotic and can dieof asphyxiation. The body does not have the capability to naturally change the methemoglobinback to effective hemoglobin. This condition especially occurs in infants below the age of sixmonths while on a pure milk or infant formula diet. The cause of Blue Baby Syndrome isgenerally the mixing of infant formula with water containing high concentrations of nitrate(greater than 10 mg/l nitrate as nitrogen). Infants are not the only susceptible population,however. Children and adults suffering from maladies or treatments that lower the levels ofstomach acid are also vulnerable to methemoglobinemia.
In 1984, an infant in Laurel, Nebraska was treated for Blue Baby Syndrome. The water used tomix her formula was shown to contain 66 to 80 mg/l nitrate as nitrogen (Mulvay, 1986). In 1986,an infant in South Dakota died as a result of ingesting water from a farm well containingapproximately 150 mg/l nitrate as nitrogen (Meyer, 1994). In 1992, a six-week-old Wisconsininfant was diagnosed with methemoglobinemia on the second hospital admission. Thecontamination was traced to a shallow water supply well contaminated with 40 to 60 mg/l nitrateas nitrogen and up to 7.8 mg/l copper. It was concluded that the symptoms were caused by asynergistic effect of the nitrate and copper, an effect not previously recorded (Centers forDisease Control and Prevention, 1993). At least two cases of methemoglobinemia have beendocumented in New Mexico. One case occurred in an area of widespread septic-tankcontamination in 1961. The other case occurred in an area contaminated by agriculturalfertilization in 1980 (McQuillan, 1997). Two cases of methemoglobinemia from nitrate-contaminated private wells have been documented in South Dakota in 1981 and 1986 (Meyer,1994). A 1982 survey of doctors in the Big Sioux River basin of South Dakota reported theoccurrence of approximately 80 cases during the previous 30 years (Meyer, 1994).
Methemoglobinemia is not frequently diagnosed since it is not a required reportable disease inany state within the United States. And while better education and well construction techniquessince the 1950s may account for a lowered incidence of the disease, another reason for it’s notbeing diagnosed may well be lack of medical training to recognize methemoglobinemia.According to several medical doctors in both North and South Dakota, medical studentsgraduating in the last several years have not been trained to connect the symptoms of the diseasewith its possible source. Considering the lack of reporting requirements and medical recognitionof the disease, there could well be many cases of methemoglobinemia that are not reportedbecause it is no longer recognized.
3.1.2 Other Associated Effects
Although methemoglobinemia is the only disease that is currently directly attributable toelevated nitrate concentrations, there are other suspected negative health effects that have beenpotentially connected to this contaminant. Chief among them is the possibility of spontaneousabortions in women of childbearing age. A small study of these occurrences was carried out inLaGrange County, Indiana in 1993. Four women, living in residences served by private wellscontaminated with nitrate ranging from 19 to 29 mg/l nitrate as nitrogen, experienced a total ofeight spontaneous abortions. Three of the women lived within one mile of a point source ofnitrate contamination. One of the women had four spontaneous abortions within the first 8 to 11

ITRC – Emerging Technologies for Enhanced In Situ Biodenitrification (EISBD) June 2000 of Nitrate-Contaminated Ground Water
9
weeks of her pregnancies. At least one of these women had previously carried a child to term.The fourth woman resided approximately 10 miles from the first three. She had previouslycarried four babies to healthy births but had two spontaneous abortions in 1994. The home’swater supply contained an average nitrate as nitrogen concentration of 29 mg/l. After switchingto nitrate free drinking water, all four women carried babies to term (Centers for Disease Controland Prevention, 1996).
Another health concern, which has been under study for many years, is nitrate-contaminateddrinking water’s link to non-Hodgkin’s lymphoma and stomach cancer. Although this link isvery tenuous and controversial, research and surveys are ongoing in an attempt to document theconnection. A recent article discussed the rise in incidence and mortality rates for non-Hodgkin’slymphoma (Blair et al., 1997). The authors note that the rising trend is seen in all histologic typesand all ages except for the very young. In further support of this potential link, they note that therates are rising faster in rural than in urban areas. They have determined that this upward trendbegan approximately in the 1960s and suggest that this trend points toward environmental factorsas a possible cause. They indicate that the research is hampered due to the poorly understoodetiology of the disease. Several avenues of approach are being pursued. One of the links thathave been found so far is that two specific types of this related cancer are more prevalent infarmers and others who work in close contact with animals and animal products.
Nitrate is identified as a possible cancer risk due to its transformations in the body.Approximately 5% of ingested nitrate is converted to nitrite, which can then combine withorganic compounds to form N-nitroso compounds, which have been shown to be potent animaland human carcinogens (Blair et al., 1997). An ecological study in China was also cited asshowing a possible link between nitrate and leukemia mortality rates (Wu et al., 1993). Anotherstudy in Nebraska (Weisenburger, 1991) showed a slightly positive correlation between highnitrate concentrations in water supplies and non-Hodgkin’s lymphoma.
3.2 Human Exposure
Nitrate is likely the most ubiquitous ground water contaminant in North America. EPA estimatesthat 2.4% of private wells exceed 10 mg/l nitrate concentrations as a national average (EPA,1992). A 1994 study of Midwestern states showed that 13.4% of domestic well samples exceedthe nitrate standard (CDCP, 1998). A study of 268 wells in southeast Nebraska showed 71% ofthe wells exceeded the standard (Meyer, 1994).
In North Dakota, nitrate testing of potable water samples has been ongoing for more than 40years. A database constructed of private water supply samples through the late 1980s showedthat 11% of the samples submitted exceeded the 10 mg/l nitrate as nitrogen standard. Of the25,000 samples in the database, over 1% exceeded 100 mg/l. It is the Department of Health’spractice to contact those people who submitted extremely high nitrate samples, both as a warninggesture and to determine the source of the nitrate contamination in the well. While many of theincidents of high-nitrate contamination can be directly traced to poor well location andconstruction, there are still a sizable number of cases where it has been impossible to determinethe source of nitrate or the pathway of contamination. Many times, the Department of HealthLaboratory reports nitrate concentrations in excess of 200 mg/l nitrate as nitrogen. These

ITRC – Emerging Technologies for Enhanced In Situ Biodenitrification (EISBD) June 2000 of Nitrate-Contaminated Ground Water
10
occurrences are not always in shallow ground water. Properly constructed wells up to 275 feetdeep have been identified with extremely high nitrate concentrations.
The concern of private domestic well contamination has become a public issue in numerousstates. Recently, legislators from New Jersey voted to require testing of private wells before thesale of homes. The bill will also require homes that are leased for longer than one year to betested for bacteria and nitrates (Garden State EnviroNews, 1999).
Nitrate is a major concern for public drinking water systems. The Safe Drinking Water Act of1974 listed nitrate as one of the primary drinking water contaminants of concern andsubsequently set the 10 mg/l nitrate as nitrogen MCL. As the program became organized, recordsbegan to be kept.
Table 3-1. Number of Community Public Drinking Water Systems Found to be in Violationof the 10 mg/L Nitrate as Nitrogen MCL for the Years 1980 to 1998.
Year Community Nitrate MCL Violations Community System TotalsNumber ofIndividualViolations
Number ofSystems inViolation
PopulationAffected
TotalNumber ofReportingSystems
Total PopulationServed
1998 372 188 747,805 54,367 252,530,5741997 361 191 369,327 54,674 248,925,7151996 441 238 576,633 55,420 246,623,7301995 390 234 469,855 55,633 243,566,0001994 534 284 310,403 56,747 243,049,0001993 473 287 639,684 57,561 242,679,0001992 373 227 451,731 58,666 245,183,0001991 375 227 414,575 59,266 232,562,0001990 425 241 472,890 59,182 242,048,0001989 425 262 793,017 59,117 222,581,0001988 502 291 968,883 58,099 218,827,0001987 521 313 776,725 58,908 226,000,0001986 572 304 878,975 58,557 219,000,0001985 564 338 818,721 58,5001984 562 317 806,153 58,3001983 580 286 467,091 58,7001982 532 317 727,318 58,9001981 417 282 1,565,805 58,9191980 367 257 580,347 63,975
The table above lists the number of violations issued in community public drinking watersystems from 1980 through 1998 (Abe Siegel, EPA, Information Services, SDWIS, 1999,personal communication.). While the table is quite straight forward, one thing should be
ITRC – Emerging Technologies for Enhanced In Situ Biodenitrification (EISBD) June 2000 of Nitrate-Contaminated Ground Water
11
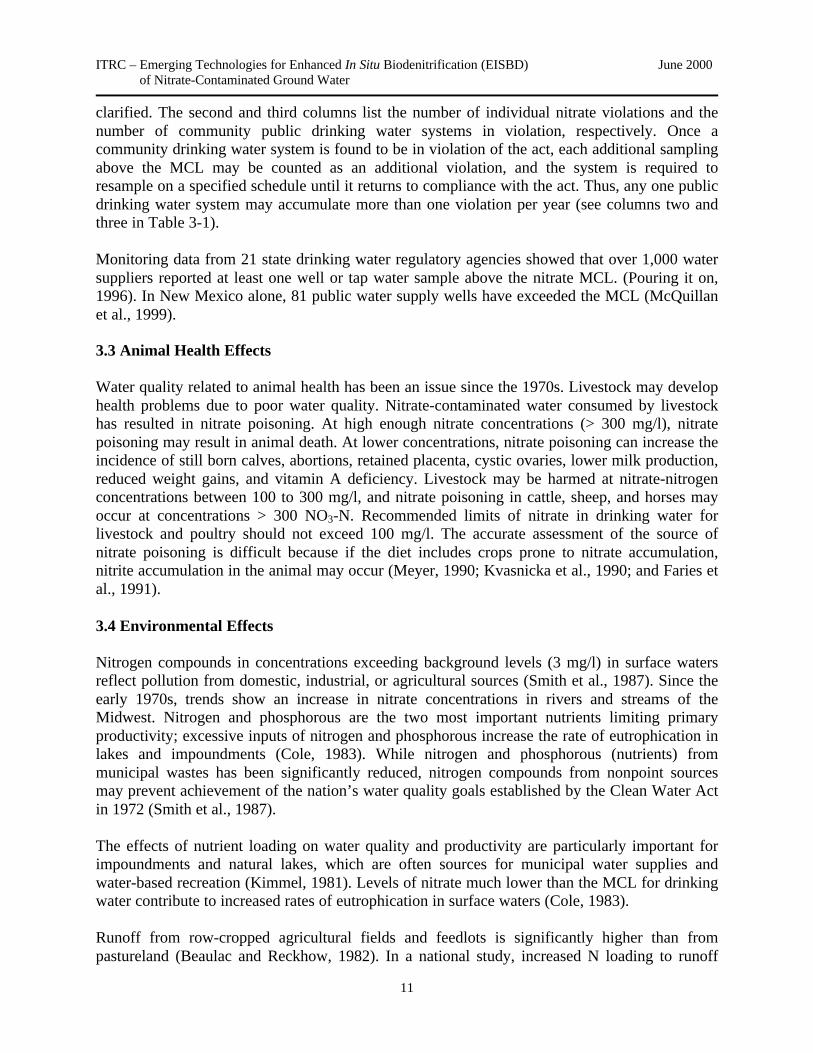
clarified. The second and third columns list the number of individual nitrate violations and thenumber of community public drinking water systems in violation, respectively. Once acommunity drinking water system is found to be in violation of the act, each additional samplingabove the MCL may be counted as an additional violation, and the system is required toresample on a specified schedule until it returns to compliance with the act. Thus, any one publicdrinking water system may accumulate more than one violation per year (see columns two andthree in Table 3-1).
Monitoring data from 21 state drinking water regulatory agencies showed that over 1,000 watersuppliers reported at least one well or tap water sample above the nitrate MCL. (Pouring it on,1996). In New Mexico alone, 81 public water supply wells have exceeded the MCL (McQuillanet al., 1999).
3.3 Animal Health Effects
Water quality related to animal health has been an issue since the 1970s. Livestock may develophealth problems due to poor water quality. Nitrate-contaminated water consumed by livestockhas resulted in nitrate poisoning. At high enough nitrate concentrations (> 300 mg/l), nitratepoisoning may result in animal death. At lower concentrations, nitrate poisoning can increase theincidence of still born calves, abortions, retained placenta, cystic ovaries, lower milk production,reduced weight gains, and vitamin A deficiency. Livestock may be harmed at nitrate-nitrogenconcentrations between 100 to 300 mg/l, and nitrate poisoning in cattle, sheep, and horses mayoccur at concentrations > 300 NO3-N. Recommended limits of nitrate in drinking water forlivestock and poultry should not exceed 100 mg/l. The accurate assessment of the source ofnitrate poisoning is difficult because if the diet includes crops prone to nitrate accumulation,nitrite accumulation in the animal may occur (Meyer, 1990; Kvasnicka et al., 1990; and Faries etal., 1991).
3.4 Environmental Effects
Nitrogen compounds in concentrations exceeding background levels (3 mg/l) in surface watersreflect pollution from domestic, industrial, or agricultural sources (Smith et al., 1987). Since theearly 1970s, trends show an increase in nitrate concentrations in rivers and streams of theMidwest. Nitrogen and phosphorous are the two most important nutrients limiting primaryproductivity; excessive inputs of nitrogen and phosphorous increase the rate of eutrophication inlakes and impoundments (Cole, 1983). While nitrogen and phosphorous (nutrients) frommunicipal wastes has been significantly reduced, nitrogen compounds from nonpoint sourcesmay prevent achievement of the nation’s water quality goals established by the Clean Water Actin 1972 (Smith et al., 1987).
The effects of nutrient loading on water quality and productivity are particularly important forimpoundments and natural lakes, which are often sources for municipal water supplies andwater-based recreation (Kimmel, 1981). Levels of nitrate much lower than the MCL for drinkingwater contribute to increased rates of eutrophication in surface waters (Cole, 1983).
Runoff from row-cropped agricultural fields and feedlots is significantly higher than frompastureland (Beaulac and Reckhow, 1982). In a national study, increased N loading to runoff
ITRC – Emerging Technologies for Enhanced In Situ Biodenitrification (EISBD) June 2000 of Nitrate-Contaminated Ground Water
12
from cropped lands was associated with increased nitrogen fertilization rates, which amounted toa 68% increase from 1970 to 1981 on cultivated lands (Smith et al., 1987). Runoff from animalfeedlots provides high concentrations of nitrate and ammonia (Beaulac and Reckhow, 1982).
Wetlands and forested areas are our prime defenses for trapping and purifying nutrients in runoffbefore they enter streams (Fennessy and Cronk, 1993-1997). If nitrate loading to coastal streamsand rivers occurs, it generally stimulates algal blooms in salt-water estuaries and bays. In theGulf of Mexico, nitrate runoff from the Mississippi River has resulted in up to a 7,032 squaremile hypoxia zone (Rabalais et al., in press). In Chesapeake Bay rivers, animal waste-N isbelieved to be the cause of a deadly Pfisteria bloom in the summer of 1998 (Burkholder andGlasgow Jr., 1997).
4.0 TRADITIONAL NITRATE REMEDIATION OPTIONS
Ground water remediation of nitrate contamination has not received as much attention as knowncarcinogenic contaminants. Remediation of these nitrate plumes has not been as common orextensive as other contaminants of concern. However, when a ground water nitrate plume hasbeen identified, certain corrective remediation activities have been employed. Site-specificinformation has determined which remediation option to employ. The following subsectionsdescribe remediation activities identified by the EISBD Work Team. Note that most remediationoptions involve pumping of contaminated ground water.
4.1 No Action
For various reasons, no remediation action for nitrate-contaminated ground water has been acommon approach and perhaps the option most often chosen. Some reasons for no action arepublic awareness, extent of contamination, inconsistent regulatory enforcement, economicissues, and responsible parties who are unable to pay for remediation. When a supply well isimpacted with nitrate contamination, certain institutional actions are taken to provide clean waterwithout addressing the contamination. Examples of this are deepening the supply well to findclean water, blending the contaminated water with clean water to meet standards, or supplying analternate water supply. If no action is taken, ground water nitrate plumes remain and maycontinue to increase in concentration and size, posing a continued or greater threat.
4.2 Pump with Beneficial Use
Pumping and using nitrate-contaminated ground water has been the most common remediationtechnique employed after no action. This remediation usually entails pumping large volumes ofcontaminated water and directly applying it onto croplands. Crops remove nitrates from the rootzone for growth. The crops are then harvested, and the nitrates are removed from theenvironment. There are numerous disadvantages to this remediation technique:
• Large costs• Considerable engineering and planning to extract and deliver the contaminated water• Possibility of further nitrate contamination• Securing water rights

ITRC – Emerging Technologies for Enhanced In Situ Biodenitrification (EISBD) June 2000 of Nitrate-Contaminated Ground Water
13
• Developing appropriate land use for crop application• Regulatory permitting
In addition, the pump and use of nitrate-contaminated ground water may be employed in otherindustries, such as the construction industry. The contaminated water may also be used as amixer with fertilizers for application on crops.
4.3 Pump and Treat
Pumping and treating nitrate-contaminated ground water is another remediation technique oftenemployed. This option is usually employed at public supply well heads and may not address thenitrate plume. The treatment of the nitrate-contaminated ground water may be throughwastewater treatment plants, construction of a treatment plant, reverse osmosis, ion exchange, orelectrodiolysis. Nitrate-contaminated ground water is pumped and discharged to existingwastewater treatment plants for nitrate removal, or specific treatment plants are constructed toaddress the nitrate contamination. This treatment may be expensive, and existing treatment plansmay not be able to handle the increased volume. Ion exchange involves pumping nitrate-contaminated water through a resin bed containing strong base anion exchange resin, wherebynitrate is exchanged for chloride or bicarbonate. In reverse osmosis, nitrate is removed by forcingthe water across a semipermeable membrane and leaving nitrate and other ions behind. A reverseosmosis waste stream needs to be treated and disposed from this system. In electrodyolisis, ionsare transferred through membranes from a less concentrated to a concentrated solution due to thepassage of a direct electric current. This process is expensive and requires close monitoring(Kappor, 1997).
4.4 Pump and Waste
Pumping nitrate-contaminated ground water to waste has also been employed, although this isusually not encouraged. The nitrate-rich water may be discharged to a contained evaporationsystem or injected into a deep saline aquifer or geologic unit. Ground water resources are lost toevaporation or injection. Disposal of the evaporate may be a problem if improperly managed. Itwould not be prudent to move a contaminant source to a noncontaminated location. The injectionof nitrate-contaminated ground water into a deep geologic unit poses many uncertainties.
4.5 Phytoremediation
Phytoremediation is a means of removing, transforming, or binding contaminants in soil andground water through the use of plants, both as active and passive remediation tools. Plants canremediate contaminants through one or more of four processes: phytotransformation,phytoextraction, phytostabilization, and rhizofiltration (Schnoor, 1997). Of these, phyto-transformation is the process most active in plant removal of nitrogen compounds of interest. Inaddition to their ability to transform nitrogen compounds, some plants transpire great quantitiesof water. Thus, not only can plants remove certain types of contaminants, they can also act asground water extraction and flow control structures. In addition, phytoremediation techniquesgenerally meet with public acceptance due to the ease of understanding and a desire to see livingthings transform a contaminated site.

ITRC – Emerging Technologies for Enhanced In Situ Biodenitrification (EISBD) June 2000 of Nitrate-Contaminated Ground Water
14
In 1987, a University of Iowa team effectively demonstrated the potential of phytoremediationfor nitrate removal. They planted a buffer strip of poplar trees between a stream and a corn fieldfrom which nitrate was leaching into a stream. By 1990, when the trees were three years old,they were effectively reducing nitrate-nitrogen from 35 mg/l to 3 mg/l in ground water leavingthe cornfield (Licht and Schnoor, 1993). Since that time, many fertilizer-contaminated sites haveinitiated phytoremediation, although very little concerning this contaminant remediation hasappeared in the literature. Several fertilizer sales facilities in North and South Dakota(Communication with Gary Haag, SD Dept. of the Environment, 1997) have implementedphytoremediation since then, at least as part of contaminant remediation strategies. Hybridpoplar, cottonwood, and willow tree plantings have figured prominently in some sites. In others,traffic and other restrictions have led to plantings of other high nitrogen and water-consumingplant species, such as alfalfa (even though it also fixes atmospheric nitrogen) and reed canarygrass. Low, deep-rooted hedges have been suggested in other areas where visibility is an issue.
While this technique is a highly effective means of dealing with fertilizer and other nitrogencompound contamination, there are limits to its application. High concentrations of nitrate and/orammonia can result in plant toxicity, either overall or at certain developmental stages of theplant. Alkaline or saline soils may also prove toxic, as may the presence of other contaminants.Depth of contamination may exceed the rooting depth of plants, thus also limiting theapplication, though some sites show that nitrogen uptake and transpiration can dramatically altercontaminant patterns at depths up to 10 meters below ground. Heavy, tight soils may limitrooting depth as well, even with species that are normally deep rooted, as can poorly drained soilconditions. Traffic patterns, property boundaries, right-of-ways, building proximity, and deedrestrictions may also prove to be limiting issues, as can regulatory prejudice. Another potentiallylimiting factor in the decision to employ phytoremediation is the length of time it takes plantingsto mature sufficiently to become effective at significant nitrogen removal. Sites that demandimmediate action to protect drinking water supplies may not be able to wait for maturation of aplanting. While many of these issues can be overcome, there is still a good deal of researchneeded before we will see this technology used to its maximum potential.
5.0 NEW AND EMERGING REMEDIATION TECHNOLOGIES
Remediation of nitrate contamination has recently received renewed interest. The EISBD WorkTeam has identified some of the new and emerging remediation technologies that addressdenitrification. These new technologies are summarized on the next page.
5.1 Aboveground Denitrification
Due to the pervasiveness of nitrate-contaminated ground water and its impact on public supplywells, research has been conducted to biochemically denitrify water aboveground. This processtakes advantage of biodenitrification and is accomplished by pumping nitrate-contaminatedground water into packed tower biofilm columns. Denitrifying bacteria and a carbon source areadded to the columns to stimulate the denitrification process (see Section 6.1). This process hasrecently become commercially available (Silverstein, 1997).

ITRC – Emerging Technologies for Enhanced In Situ Biodenitrification (EISBD) June 2000 of Nitrate-Contaminated Ground Water
15
Table 5-1. Nitrate Remediation Options
RemediationTechnology
Basic Methodology Benefits Concerns
No Action Monitoring of groundwater
• no equipment cost• no clean up cost or efforts• dilution to meet standard
• increase in plume size• impact on receptors• violation of standard
Pump and Use Impacted groundwater pumped andused
• plume containment• mass removal• beneficial use of extracted
water
• long-term• engineering cost• water rights issues• regulatory permitting
Pump and Treat Impacted groundwater pumped andtreated
• plume containment• mass removal• re-use of clean water• injection of clean water
• long-term• engineering cost• water rights issues• treatment system• potentially expensive• hazardous concentrated waste
streamPump and Waste Impacted ground
water pumped andwasted
• plume containment• mass removal
• long-term• considerable engineering cost• potential plume migration• water rights issues• regulatory issues
Phytoremediation Impacted groundwater treated by plantuptake
• plume containment• low cost• aesthetically pleasing
• depth to water is a limitingfactor
• land requirements• property rights• long-term• management of plants
AbovegroundDenitrification
Impacted groundwater pumped tobioreactors, treated,and distributed
• treated to below standards• new ex situ treatment of
nitrate contamination
• size of bioreactors may be afactor
• maintaining stable temperature• treats pumped water and doesn't
address contaminant plume
Denitrification inCombination withOtherContaminants
During anaerobicbioremediation ofother organiccontaminants, nitratesserve as an electronacceptor
• fortuitous nitrate reductionin the presence of otherorganic contaminants
• if nitrate is present in anorganic contaminantplume, and conditions areanaerobic, denitrificationmost likely will occur
• reducing conditions must bepresent
• a carbon source must be present• monitoring to determine
denitrification must beascertained
Enhanced In SituBiodenitrification
Impacted groundwater amended tostimulate biochemicalreaction to convertnitrate to nitrogen gas
• cheap• very fast• natural process• complete plume
remediation• new technology
• impact to geochemistry• regulatory concerns• biomass build up

ITRC – Emerging Technologies for Enhanced In Situ Biodenitrification (EISBD) June 2000 of Nitrate-Contaminated Ground Water
16
5.2 Permeable Reactive Barriers
Permeable reactive barriers (PRBs) are currently being researched for their application todenitrify contaminated ground water. Los Alamos National Laboratory in cooperation with theUniversity of New Mexico is studying the feasibility of denitrifying reactive barriers. ThesePRBs have the potential to contain or remediate a nitrate plume before any receptors are reached.
5.3 Denitrification in Combination with Other Contaminants
As described in the nitrogen cycle, denitrification occurs naturally, however, usually at very lowrates unless an abundant carbon source is present. One example is a grain silo facilitycontaminated with carbon tetrachloride (CT) and nitrate. A gasoline plume commingled with theCT and nitrate. The carbon-containing gasoline compounds created anaerobic conditionswhereby nitrate was the electron acceptor, and the compounds in the gasoline were the electrondonors. The CT was subsequently mineralized with the residual nitrate continuing to serve as anelectron donor (McQuillan et al., 1998). For many documented gasoline plumes in the presenceof a nitrate plume, denitrification occurs along with bioremediation of the gasoline. Theintroduction of nitrate into gasoline plumes has been proposed to encourage anaerobicbioremediation of the gasoline.
6.0 ENHANCED IN SITU BIODENITRIFICATION
6.1 General
The understanding of denitrification is essential for the application of enhanced in situbiodenitrification. The nitrogen cycle describes the processes that involve organic nitrogen. Eachone of these processes is a bacterial biological process. Organic nitrogen is converted toammonia through ammonification; ammonia is converted to nitrate through nitrification in thepresence of oxygen; and nitrate is converted to nitrogen gas through denitrification in theabsence of oxygen. The denitrification process is not a direct conversion to nitrogen gas (g) but amultistep process described below.
NO3 NO2 NO (g) N2O N2 (g)
Microbial populations responsible for bioremediation require a source of carbon, an electrondonor, an electron acceptor, appropriate nutrients, a suitable temperature range, pH, and otherenvironmental conditions. Very often the carbon source serves as the electron donor. Enhancedin situ bioremediation systems stimulate the biodegradation of certain contaminants bymanipulating these requirements in the subsurface.
Nitrate reduction occurs during anaerobic respiration. In the absence of oxygen and the presenceof a carbon source (bacterial food source), bacteria utilize the nitrate as an electron acceptorduring respiration. The nitrate is converted to nitrite, whereby anaerobic respiration continueswith the formation of innocuous nitrogen gas.

ITRC – Emerging Technologies for Enhanced In Situ Biodenitrification (EISBD) June 2000 of Nitrate-Contaminated Ground Water
17
Enhanced in situ biodenitrification is a remediation technology through which a carbon source isintroduced to a nitrate-contaminated aquifer. Since most aquifers are aerobic, indigenous aerobicbacteria utilize the introduced carbon as a carbon source and oxygen as the electron acceptor.Oxygen in the aquifer becomes depleted, forming an anaerobic aquifer. When this occurs and anabundant carbon source is present, indigenous denitrifying bacteria proliferate and reduce nitrateto nitrogen gas through anaerobic respiration (Figure 1-1).
6.2 Current Applications of Enhanced In Situ Biodenitrification
EISBD technologies have until recently not been commercially available. Certain researchprojects and field tests of technologies have been conducted. The University of New Mexico hascompleted laboratory and field pilot tests for remediation of a nitrate plume. Due to UNM’sEISBD success to date, UNM has recently licensed this technology to Key Technologies, Inc. ofAlbuquerque, New Mexico (Dr. Alan Kuhn, President). The University of Nebraska-Lincoln hascompleted laboratory and field pilot tests for protection of public supply wells. Initial researchresults are most promising.
Further research is being conducted for in situ denitrification. The Pacific Northwest NationalLaboratory has been conducting bench-scale testing of vegetable oil as a carbon source inbioreactors and soil columns to denitrify amended water (Fredrickson, 1998). Biodenitrificationmicrocosm studies have been conducted at the University of Nebraska-Lincoln that showedconsiderable nitrate removal (Dahab et al., 1991). A review study conducted in 1992 describednumerous laboratory studies of denitrification rates from aquifer samples (Korom, 1992).Experimental studies conducted in Great Britain using a designed flow-through microcosmapparatus showed that denitrification in a sandstone aquifer material could be increased andcontrolled by supplying a carbon source (Clark et al., 1993-1999). Ongoing research ofautotrophic denitrification indicates that nitrate is reduced to nitrogen gas in the presence of ironand sulfate in anaerobic conditions. Thermodynamic conditions show that nitrate can serve as anelectron acceptor, and reduced inorganic species such as Mn2+, Fe2+, and HS- can serve aselectron donors (Korom, 1992) and (Kappor, 1997). The EISBD Work Team has not completeda comprehensive literature search for all denitrification studies and applications that may beongoing.
7.0 RESEARCH AND DEVELOPMENT
7.1 UNM Professor Eric Nuttall
Abstract: An in situ ground water denitrification process was developed using a series ofincreasingly larger scale tests, starting from microcosm-scale experiments through pilot-scaletests and finally a field demonstration. Indigenous soil and ground water denitrifying bacteriawere stimulated using sodium acetate as a carbon substrate and trimetaphosphate as a nutrient. Insitu denitrification was successfully demonstrated using a push-pull test and a small-scalecontinuous field test at a New Mexico site in Albuquerque’s South Valley. Ground waterparameters of pH, Eh, conductivity, and concentrations of dissolved oxygen, nitrate, nitrite,acetate, sulfate, and bromide were measured. Results showed that the high toxic levels of nitrate(100 mg/l nitrate-nitrogen) were metabolically transformed into harmless nitrogen gas within

ITRC – Emerging Technologies for Enhanced In Situ Biodenitrification (EISBD) June 2000 of Nitrate-Contaminated Ground Water
18
three to five days, and the nitrate concentration was reduced to below 1 mg/l. The final pH, Eh,and conductivity values of ground water were not significantly changed during the process.
Introduction: Nitrate contamination in drinking water poses serious health effects to bothhumans and animals. Infants are most seriously impacted. Blue Baby Syndrome(methemoglobinemia) is potentially fatal when infants (from birth to six months) drinkcontaminated water at nitrate levels above the MCL (10 mg/l nitrate-nitrogen). Other reporteddiseases caused by drinking water polluted with nitrate include cancer, disruption of thyroidfunction, and birth defects. Nitrate contamination in ground water is most commonly caused byoverfertilization of agricultural crops, improper disposal of animal and human waste, andindustrial liquid waste.
Remediation of nitrate-contaminated ground water and soils can occur under certain conditionsby natural bioremediation. Nature has evolved indigenous denitrifying bacteria capable ofconverting nitrates found in subsurface environments, i.e. soils and ground water, into harmlessnitrogen gas (Payne, 1981); however, the process is often very slow, requiring decades orcenturies to complete due to the lack of a carbon energy source for bacterial growth. Enhanced oraccelerated biodenitrification is accomplished by stimulating indigenous denitrifying bacteriathrough the addition of a suitable carbon energy source (McCarty et al., 1969). Carbonsubstrates, such as methanol, ethanol, acetate, and sugar can significantly enhance denitrificationrates by serving as electron donor and energy supply for the indigenous bacteria while nitrate isthe electron acceptor. In the metabolic denitrification process, nitrate is transformed into the finalproduct of nitrogen gas via a multistep chemical reduction: NO3
− → NO2− → NO (g) → N2O (g)
→ N2 (g) (Knowles, 1982). Usually, it is found that nitrite is the most significant intermediatewhile NO and N2O are short-lived. In practice, the dissolved oxygen is also an electron acceptorand must be removed by bacteria prior to denitrification. The stoichiometric chemical reactionfor de-oxygenation is described in equation (1), in which we assume that 30% of carbon isconsumed for the cell synthesis (Deng, 1998). The stoichiometric relation describingdenitrification using acetate was experimentally derived (equation 2) (Lu, 1998) and indicatesthat most of the carbon source (90%) is used to provide energy for the bacteria rather thanbiomass production.
O2 + 0.816 CH3COO−− + 0.103 NO3−− + 0.964 H+ →→ 0.103C5H7O2N + 1.207 CO2 + 1.413 H2O
(1)NO3
− − + 0.712 CH3COO−− →→ 0.485 N2 + 0.03 C5H7O2N + 1.273 HCO3−− + 0.106 H2O + 0.44 OH−−
(2)[Where C5H7O2N represents the cell formula.]
Because enhanced denitrification is rapid and can be applied in situ, it appears likely to be a cost-effective technology for treating ground water and soils. Many denitrification studies(Kappelhof, et al., 1992; Green et al., 1994) have investigated ex situ biodenitrifying reactorsystems; however, only a few studies have investigated in situ biodenitrification (Mercado et al.,1988; Hamon and Fustec, 1991).
Objective: The objective of this study is to determine the feasibility of in situ biologicaldenitrification at a site in New Mexico (Nuttall et al., 1997, Nuttall, 1997, Deng et al., 1998,Abdelouas et al., 1998). The approach was to scale up the process in a series of batch microcosm
ITRC – Emerging Technologies for Enhanced In Situ Biodenitrification (EISBD) June 2000 of Nitrate-Contaminated Ground Water
19
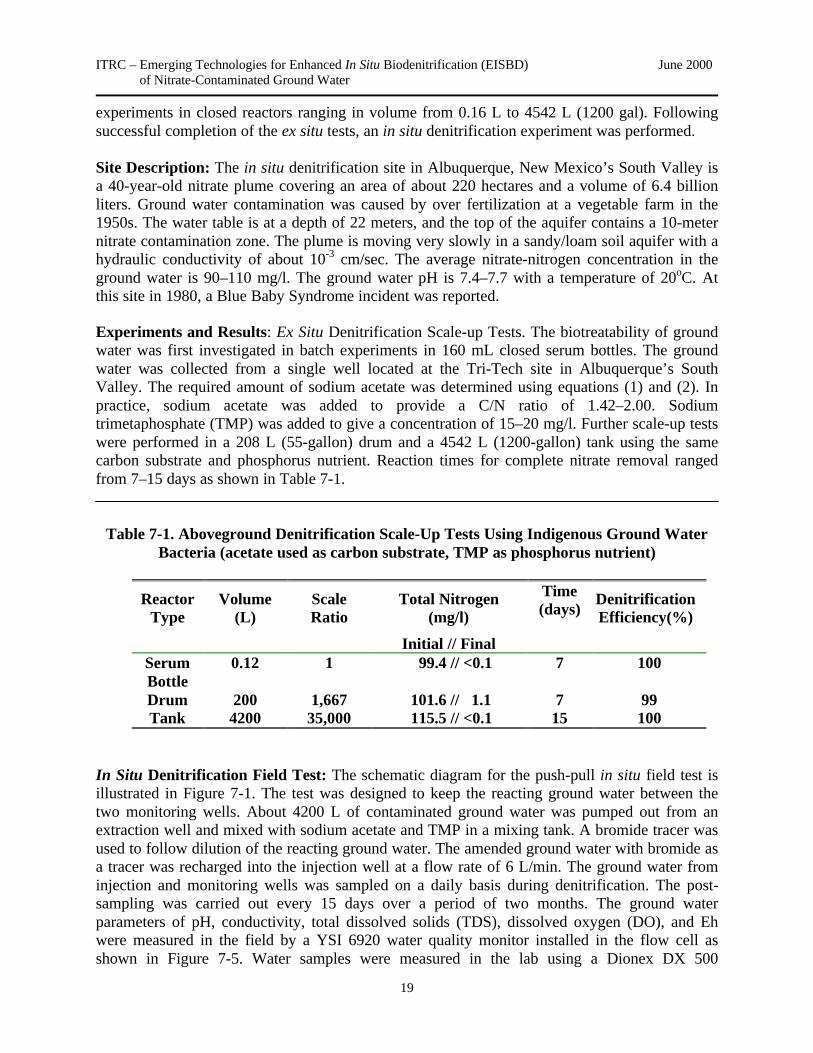
experiments in closed reactors ranging in volume from 0.16 L to 4542 L (1200 gal). Followingsuccessful completion of the ex situ tests, an in situ denitrification experiment was performed.
Site Description: The in situ denitrification site in Albuquerque, New Mexico’s South Valley isa 40-year-old nitrate plume covering an area of about 220 hectares and a volume of 6.4 billionliters. Ground water contamination was caused by over fertilization at a vegetable farm in the1950s. The water table is at a depth of 22 meters, and the top of the aquifer contains a 10-meternitrate contamination zone. The plume is moving very slowly in a sandy/loam soil aquifer with ahydraulic conductivity of about 10-3 cm/sec. The average nitrate-nitrogen concentration in theground water is 90–110 mg/l. The ground water pH is 7.4–7.7 with a temperature of 20oC. Atthis site in 1980, a Blue Baby Syndrome incident was reported.
Experiments and Results: Ex Situ Denitrification Scale-up Tests. The biotreatability of groundwater was first investigated in batch experiments in 160 mL closed serum bottles. The groundwater was collected from a single well located at the Tri-Tech site in Albuquerque’s SouthValley. The required amount of sodium acetate was determined using equations (1) and (2). Inpractice, sodium acetate was added to provide a C/N ratio of 1.42–2.00. Sodiumtrimetaphosphate (TMP) was added to give a concentration of 15–20 mg/l. Further scale-up testswere performed in a 208 L (55-gallon) drum and a 4542 L (1200-gallon) tank using the samecarbon substrate and phosphorus nutrient. Reaction times for complete nitrate removal rangedfrom 7–15 days as shown in Table 7-1.
Table 7-1. Aboveground Denitrification Scale-Up Tests Using Indigenous Ground WaterBacteria (acetate used as carbon substrate, TMP as phosphorus nutrient)
ReactorType
Volume(L)
ScaleRatio
Total Nitrogen(mg/l)
Initial // Final
Time(days)
DenitrificationEfficiency(%)
SerumBottle
0.12 1 99.4 // <0.1 7 100
Drum 200 1,667 101.6 // 1.1 7 99Tank 4200 35,000 115.5 // <0.1 15 100
In Situ Denitrification Field Test: The schematic diagram for the push-pull in situ field test isillustrated in Figure 7-1. The test was designed to keep the reacting ground water between thetwo monitoring wells. About 4200 L of contaminated ground water was pumped out from anextraction well and mixed with sodium acetate and TMP in a mixing tank. A bromide tracer wasused to follow dilution of the reacting ground water. The amended ground water with bromide asa tracer was recharged into the injection well at a flow rate of 6 L/min. The ground water frominjection and monitoring wells was sampled on a daily basis during denitrification. The post-sampling was carried out every 15 days over a period of two months. The ground waterparameters of pH, conductivity, total dissolved solids (TDS), dissolved oxygen (DO), and Ehwere measured in the field by a YSI 6920 water quality monitor installed in the flow cell asshown in Figure 7-5. Water samples were measured in the lab using a Dionex DX 500

ITRC – Emerging Technologies for Enhanced In Situ Biodenitrification (EISBD) June 2000 of Nitrate-Contaminated Ground Water
20
chromatography system for anions: acetate, nitrate, nitrite, and sulfate. The concentration ofbromide was measured using an ATI Orion Model 9635 ionPlus Series Bromide Electrode.
Figure 7-1. Design of an In Situ Denitrification Test at Tri-Tech Site,Albuquerque’s South Valley (not drawn to scale)
Figure 7-2 shows the concentrations of acetate, nitrate, and nitrite versus time for samples takenfrom the injection well during denitrification. All traces of both nitrate and nitrite intermediatewere removed in five days. The nitrate was metabolically transformed to nitrogen gas, and thefinal concentration was less than 1 mg/l.
Table 7-2 shows a comparison of average denitrification rates for three different process scalesindicating that in situ average denitrification is nearly three times the average rate of ex situ tests.The faster in situ denitrification is likely due to the significantly greater bacterial concentration inthe aquifer matrix as compared to the bacteria concentrations in water samples.
Sampling Port
Pump Pump
Extraction Well
Mixing Tank
Amendments
Filter
Sampling Port
Denitrification Zone
MW-West (2” ID) Injection Well (4” ID) MW-East (2” ID)
Filter
GroundSurface
Water
Table
Flow Rate
6 L/min
YSI 6920
Screen
1.52 m 1.52 m
610-DM
Display

ITRC – Emerging Technologies for Enhanced In Situ Biodenitrification (EISBD) June 2000 of Nitrate-Contaminated Ground Water
21
Figure 7-2. Reaction Concentration Curves Resulting from Short-TermMonitoring During an In Situ Denitrification Test
Table 7-2. Comparison of Average Denitrification Rates Using Acetate andTMP as Amendments
Experiments Temperature ( oC ) DenitrificationTime (days)
Average DenitrificationRate (mg N /L/day )
Serum bottle testw/o sand
25 18 5.4
1200 gal tank test 20 15 6.9In situ field test 20 5 19.0
Figure 7-3 shows the concentrations of acetate, nitrate, nitrite, and bromide versus time for watersamples from the injection well over the two-month monitoring period. After the initialdenitrification reaction was completed, the excess acetate was eventually consumed by furtherdenitrification resulting from mixing of the surrounding contaminated ground water. This wasconfirmed by the decrease in bromide tracer. During the second reaction period, the nitrateconcentration remained low until all the excess acetate was consumed.
0 1 2 3 4 5 6 7 8
Time (days)
0
100
200
300
400
500
Beforeinjection
Afterinjection
Acetate
Nitrate
Nitrite
Add. ofAmendments

ITRC – Emerging Technologies for Enhanced In Situ Biodenitrification (EISBD) June 2000 of Nitrate-Contaminated Ground Water
22
Figure 7-3. Reaction Concentration Curves Measured During an In SituBiodenitrification Test
The long-term monitoring of ground water parameters of Eh, pH, conductivity, and dissolvedoxygen were documented in Deng, 1998. Results also indicated that the Eh, pH, and conductivityvalues returned to background levels following the push-pull field demonstration.
As a continuation of this successful batch field test, a small-scale continuous field test wascompleted in April and May 1999 (see Figure 7-4). The results were similar to those from thebatch experiment.
Water table
Ground surface
Injection well (2 inch ID)
Monitoring well (4 inch ID)
Monitoring well (2 inch ID)
Denitrification zone
6.10
m22
.10m
1.52m 1.52m
610-DMdisplay/logger
YSI6920 waterquality monitor
Hand samplingMetering pump
130 ml/min
Extraction well( about 50m from the injection well)
Ominifilter
GPI flow meter1gpm
Faucet
Gas vent
Amendments
55-gallon drum
Figure 7-4. Modified Schematic Diagram of Continuous Denitrification Field Ttest
BeforeInjection
Co
nce
ntr
atio
ns
(mg
/l)
Time (days)
0
100
200
300
400
500
0
5
10
15
20
25
30
Bro
mid
e (m
g/l)
After Injection
Start injection
Bromide
Acetate
Nitrite
Nitrate
Add. C
Natural mixing
0 10 20 30 50 60 70
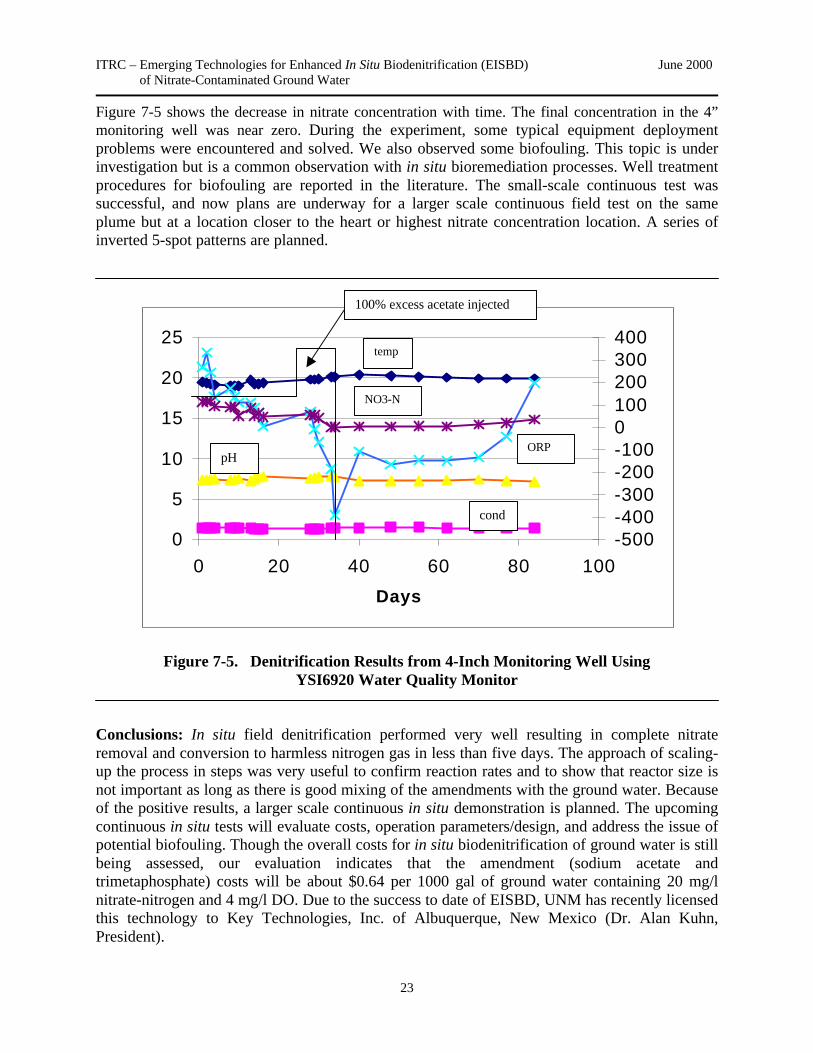
ITRC – Emerging Technologies for Enhanced In Situ Biodenitrification (EISBD) June 2000 of Nitrate-Contaminated Ground Water
23
Figure 7-5 shows the decrease in nitrate concentration with time. The final concentration in the 4”monitoring well was near zero. During the experiment, some typical equipment deploymentproblems were encountered and solved. We also observed some biofouling. This topic is underinvestigation but is a common observation with in situ bioremediation processes. Well treatmentprocedures for biofouling are reported in the literature. The small-scale continuous test wassuccessful, and now plans are underway for a larger scale continuous field test on the sameplume but at a location closer to the heart or highest nitrate concentration location. A series ofinverted 5-spot patterns are planned.
Figure 7-5. Denitrification Results from 4-Inch Monitoring Well UsingYSI6920 Water Quality Monitor
Conclusions: In situ field denitrification performed very well resulting in complete nitrateremoval and conversion to harmless nitrogen gas in less than five days. The approach of scaling-up the process in steps was very useful to confirm reaction rates and to show that reactor size isnot important as long as there is good mixing of the amendments with the ground water. Becauseof the positive results, a larger scale continuous in situ demonstration is planned. The upcomingcontinuous in situ tests will evaluate costs, operation parameters/design, and address the issue ofpotential biofouling. Though the overall costs for in situ biodenitrification of ground water is stillbeing assessed, our evaluation indicates that the amendment (sodium acetate andtrimetaphosphate) costs will be about $0.64 per 1000 gal of ground water containing 20 mg/lnitrate-nitrogen and 4 mg/l DO. Due to the success to date of EISBD, UNM has recently licensedthis technology to Key Technologies, Inc. of Albuquerque, New Mexico (Dr. Alan Kuhn,President).
0
5
10
15
20
25
0 20 40 60 80 100
Days
-500-400-300-200-1000100200300400
100% excess acetate injected
temp
NO3-N
ORPpH
cond

ITRC – Emerging Technologies for Enhanced In Situ Biodenitrification (EISBD) June 2000 of Nitrate-Contaminated Ground Water
24
7.2 UNL Professor Roy Spalding
Ground water denitrification research projects occurred on a private farmstead located about 3km north of Central City in Merrick County, Nebraska. The site is centrally located in a countythat is in the central Platte region of Nebraska. Merrick County has the dubious reputation ofhaving the state’s largest area underlain by nonpoint nitrate-nitrogen concentrations exceedingthe MCL. The aquifer thickness is approximately 40 feet and nitrate-nitrogen concentrations areuniform with depth. Average concentration in the saturated fluvial sands and gravels was 40 mg/lNO3-N L-1. The water table lies about 2 m beneath the site and varies about 0.5 m seasonally.This site was considered an excellent choice for a denitrification field trial for the followingreasons: (1) a willingness on the part of the landowner to allow us to use about 0.11 hectares ofeasily accessible property, (2) high and steady nitrate levels, (3) a relatively homogeneousaquifer matrix, and (4) a short distance to ground water.
Figure 7-6. Cross-Sectional View of Subsurface Entry Caisson, In Situ Microcosm, andMultilevel Samplers (not drawn to scale)
To improve our understanding of the potential for denitrification at the site, access to the shallowaquifer was accomplished by excavating holes and inserting 2.5-m-long X 1.2-m-diametercaissons to depths slightly above the water table (Figure 7-6). A 0.25 m PVC casing was theninserted 0.61 m into the sediments, and the sediments were then removed by hand. Aprefabricated stainless steel microcosm was then pushed into the aquifer (Bates and Spalding,
Main Screen
Drive Point withScreen
2ft.
Test Chamber
2ft.
Open End ofMicrocosm
Caisson
0.5ft.
EquipmentChamber
Tubing Connectedto Screen
Redwood Deck
PVC Casing6ft.
0.5 ft.
Stainless SteelCylinder

ITRC – Emerging Technologies for Enhanced In Situ Biodenitrification (EISBD) June 2000 of Nitrate-Contaminated Ground Water
25
1998). Since the microcosms are open on the bottom, they become filled with aquifer materialand ground water. When filled, each microcosm contains about 11 L, of which approximately 3.7L are ground water.
Several experiments were completed over three years to determine the potential fordenitrification. In each experiment, ground water in the microcosms was removed, amended withethanol and bromide, and returned to the microcosm. The process is accomplished by drawingwater into 10 L glass bottles from the microcosm through flexible tubing clamped on stainlesssteal tubes welded to the top of the microcosm. The retrieved water is amended with the abovesolutions via injection into the bottle, mixed, and pressure injected back into the microcosmthrough the screen. During this process, untreated water in the microcosm was displaced by theamended water and flushed through the open bottom out into the formation. The treated waterwas then monitored by collecting aliquots in 60 ml plastic syringes as the reaction proceeded.Nitrate, nitrite, bromide, bicarbonate, sulfate, chloride, dissolved oxygen, dissolved organiccarbon, and the δ15N values of the nitrate were routinely analyzed.
The results (Figure 7-7) using the ratio of C/N (1.25) are shown in the following genericequation for denitrification:
5C + 4NO3- + 2H2O → 2N2 + 4HCO3
- + CO2
Figure 7-7. Concentration vs. Time for Selected Analytes Involved in or Affected by Microbial Denitrification in a Microcosm Amended with 50-mg C L-1
In general, denitrification was stimulated after ~10 hours (h) when the DO levels were loweredto about 2 mg L-1. Afterwards, the nitrate levels declined to nondetectable levels in about 20 h.As predicted in equation 1, bicarbonate concentrations increased dramatically (~150 mg L-1).

ITRC – Emerging Technologies for Enhanced In Situ Biodenitrification (EISBD) June 2000 of Nitrate-Contaminated Ground Water
26
The slopes representing carbon dioxide respiration versus residual nitrate plus nitrite averagedclose to -1 at -0.88. This suggests that a small but significant portion of the carbon wasassimilated by the bacteria to produce biomass. In the following equation, biomass production isshown to clarify the estimated incorporation of C and N by the bacteria.
97NO3 + 50C2H5OH → 5C2H7NO2 + 75CO2 +84H2O + 46N2 + 97OH-
(McCarty et al., 1969). Residual nitrite-N concentrations in these experiments increased to 10 mgL-1 and persisted after the termination in reduction at 40 h. In these experiments, denitrification(nitrate reduction to nitrogen), by the stepwise enzymatic process in which NO3
- → NO2-→ NO
→ N2O → N2, was incomplete, and nitrite remained at the termination of the reaction. Thebackground level of DOC at 40 h suggested that there was insufficient available carbon tosustain the reduction to completion. The enzymatic reduction of nitrite is rate controlling indenitrification because it takes longer for some species of heterotrophic bacteria to synthesizenitrite reductase than the other reductases.
Figure 7-8. Concentration vs. Time for Selected Analytes Involved in or Affected byMicrobial Denitrification Following Injection in a Microcosm Amended with 100 mg C L-1
Thus, the following experiment was designed to promote complete denitrification by combiningexcess C with a more protracted monitoring period. In later experiments with excess carbon, thenitrite disappeared and complete denitrification occurred in 60 h. Using 100 mg C L-1, a residual

ITRC – Emerging Technologies for Enhanced In Situ Biodenitrification (EISBD) June 2000 of Nitrate-Contaminated Ground Water
27
C level of 38 mg L-1, which is about ten times the background, remained at the termination of thereaction. This confirmed that the initial reaction (50 mg C L-1) was at least 12 mg C L-1 deficientin available C.
Nitrate-nitrogen loss rates during amended denitrification experiments ranged from 18 to 32 mgL-1 d-1. Rates were dependent on temperature and the amount of amended carbon. Cooler groundwater temperatures apparently slowed the reaction as did excess available C. The δ15N values ofnitrate and nitrite are defined by the following equation and determined by isotope massspectrometry.
δ 15N ( ‰ ) =
(15 N / 14N ) sample − (15 N /14 N )standard
(15 N / 14 N )standard
x 1000
For many years, δ15N values of nitrate have been pivotal in determining the sources of nitrate inmany ground waters; however, their utility in determining ground water denitrification zoneswithin the aquifer is somewhat of an emerging science. The application to the in situ microcosmpermitted a very clear picture of the evolution of enriched δ15N values during the denitrificationprocess. As the reduction progressed, the δ15N values increased from +6‰ to > +20‰ in theresidual nitrate plus nitrite. By chromatographically separating the nitrate from the nitrite, theisotopic contribution of each species was determined (Bates et al., 1998). The experimentsindicated that the presence of nitrite resulted in decreased δ15N values for nitrate-N plus nitrite-N. When almost all nitrate and nitrite was denitrified near the completion of the reaction, theδ15N values were close to +40‰.
The in situ microcosm data indicated that the nitrate-contaminated ground water could beremediated within days by the endemic aquifer bacteria without generating any hazardous by-products. Thus, the microcosm results support the application of amended denitrification as atreatment technology for nitrate-contaminated ground water. As an emerging technology, in situdenitrification has several advantages over the common aboveground methods, such as ionicexchange and reverse osmosis. Both methods are nontarget analyte specific and, thus, generatelarge amounts of wastes that are considered hazardous. As such, these wastes must be disposedof in specially operated secure landfills. These aboveground treatments are also expensivebecause they require large initial capital construction outlays, as do aboveground denitrificationplants. In situ is economically and environmentally most attractive because it requires only amodest initial capital outlay, generates no hazardous waste, and is relatively economical tomaintain and operate.
Two distinctly different in situ denitrification procedures were studied at the site in partialfulfillment of Imtiyaz A. Khan’s Ph.D. In the first procedure, denitrification was promoted atshallower depths by injecting water containing known amounts of potassium chloride (KCl),bromide (Br), and ethanol near the surface of ground water perpendicular to the natural groundwater flow. The injection line was 40 feet long and consisted of a ¾-inch-diameter perforatedpolyvinyl chloride (PVC) pipe, which was placed in a 50-foot-long trench to the water tabledepth of 7.5 feet. The reduction of nitrate was monitored by three fences of multilevel samplers(MLS) placed at 20, 40 and 60 feet downgradient from the injection line and vertically screenedat 2-foot intervals. A premixed concentrate of KCl-Br solution and ethanol solution were

ITRC – Emerging Technologies for Enhanced In Situ Biodenitrification (EISBD) June 2000 of Nitrate-Contaminated Ground Water
28
metered into the injection line to yield a final concentration of 500 ppm KCl, 10 ppm Br, and 200ppm-C in the injection water.
The injectate was chilled to 7oC by circulating it through a refrigeration unit. KCl injection andchilling were designed to increase the injectate density (ρ = 1.0008 gm/ml with total dissolvedsolid concentration of 900 mg/l) above that of ambient ground water (ρ = 0.99989 gm/ml withtotal dissolved solid concentration of 400 mg/l). This provided the necessary density gradient andpromoted downward transport of injectate in the aquifer. The results indicated that completedenitrification occurred in a 60 ft X 40 ft area downgradient from the injection main and treatedthe aquifer water to a depth of 20 feet.
Clogging of the infiltration area surrounding the injection main was observed after 14 days ofoperation. The continuous presence of high concentrations of ethanol and nitrate near theinjection main promoted an excessive growth of biomass and resulted in well clogging. Cloggingis the nemesis of in situ denitrification and causes deleterious operational problems. To controlclogging, subsequent experiments employed pulsed injection of carbon in nitrate free water. Thepulsing technique described later alleviated the proliferation of biomass near the perforated mainwithout affecting the performance of the process.
The second set of experiments were directed at nitrate remediation in the deeper portions of theaquifer and required the installation of a daisy well system (Khan and Spalding, 1998; Figure 7-9). The saturated sand and gravels have a thickness of about 40 feet and an average hydraulicconductivity of 250 feet/day. The daisy system creates a radial pattern of enhanced water levelsat the injection wells, which are located along an outer circumference equidistant from acentrally located extraction well. When operating, the water table assumes a three-dimensionalpattern similar to that described by a daisy flower.
The basic design consists of eight 4-inch-diameter outer perimeter wells, eight 2-inch-diameterinner perimeter wells, and a 6-inch-diameter centrally located extraction well (Figure 7-10). Theouter and inner perimeter wells were located at a radial distance of 40 feet and 20 feet,respectively, from the extraction well. The outer perimeter wells were used to inject organiccarbon (ethanol or acetate), thereby, creating a reducing zone in the segment between outer andinner perimeter wells. In this zone, most of the nitrate reduction takes place. The inner perimeterwells were used to inject an oxidant (hydrogen peroxide), which created an oxidized zone in thesegment between the inner wells and the extraction well. In this zone, residual organic carbon,any residual nitrite, and bacterial by-products are oxidized before the denitrified water isremoved from the aquifer.
All the wells were screened in the bottom 10 feet of the aquifer from 38 to 48 feet beneath theland surface (Figure 7-5). The injection wells were equipped with dipole packers for pressureinjection and for circulation of the cleaning solutions into the aquifer matrix adjacent to theslotted intervals. The multilevel samplers were used to monitor the progress of the reaction andthe two dimensional extent of denitrification.

ITRC – Emerging Technologies for Enhanced In Situ Biodenitrification (EISBD) June 2000 of Nitrate-Contaminated Ground Water
29
Figure 7-9. Layout of Daisy Injection System
In the preliminary investigation, the concentrated carbon source (ethanol) was injected directlyinto the nitrate-contaminated water to form a solution with 50 mg C L, and the solution wascontinuously injected into the aquifer at a rate of 37.8 L per minute. The extraction well wasoperated continuously at a rate of 151.2 L per minute to create an induced gradient towards thecenter of the daisy system. The results indicated successful denitrification of the 40 mg NO3-N Lground water in multilevel samplers, located in the zones of denitrification without noticeablenitrite formation. However, there was a loss in specific capacity of the injection well due toaccumulations of biomass at the screen and adjacent formation. Although the specific capacity ofthe injection well was restored with the dipole cleaning technique, it could not be sustained.

ITRC – Emerging Technologies for Enhanced In Situ Biodenitrification (EISBD) June 2000 of Nitrate-Contaminated Ground Water
30
Figure 7-10. Vertical Section of Daisy Injection System.(I Reducing Zone, II Oxidizing Zone, III Treated Water Zone)
To prevent the injection well from clogging, a pulsing technique was developed using four outerperimeter wells. The basic approach of this methodology is to alternately pulse the injection ofnitrate (electron acceptor), contaminated water, and ethanol (electron donor) into the aquifer.Pulsing requires nitrate-free water, which came from an onsite deep (140 ft) bedrock welltapping a five-foot thick limestone lens, to mix the 500 ppm C ethanol pulse. Simultaneouscomputerized injections were performed in a 6-hour cycle in opposite well pairs and then movedto the next well pair. Thus two injection cycles were completed every 24 hours. Each 6-hourcycle was composed of the following sequence of injections: (1) nitrate-free water for 25minutes, (2) 500 ppm C L ethanol pulse for 40 minutes, (3) nitrate-free water for 25 minutes, and(4) 40 mg N/L nitrate-contaminated water for 4.5 hours. Each well rested for 6 hours betweencycles. The results indicated that denitrification was complete in the impacted zones with nonitrite remaining after 9 hours (Figure 7-11).
The system remained free of detectable clogging during the three-week period. Approximately a35% reduction in nitrate-N occurred at the extraction well (Figure 7-12). This reduction was inline with the treatment applied only to the bottom quarter of the aquifer from four of eightinjection wells.

ITRC – Emerging Technologies for Enhanced In Situ Biodenitrification (EISBD) June 2000 of Nitrate-Contaminated Ground Water
31
Figure 7-11. Anion, D.O.C. and D.O. Concentration in Inner Well #3. Complete ReductionOccurs in the Observation Wells Located in the Impacted Zones.
Figure 7-12. Anion, D.O.C., and D.O. under Pulse Injection in Extraction Well. 35% Nitrate is Reduced in the Capture Zone.

ITRC – Emerging Technologies for Enhanced In Situ Biodenitrification (EISBD) June 2000 of Nitrate-Contaminated Ground Water
32
Sulfate reduction occurred in the most impacted aquifer zones. This may have resulted fromexcess ethanol significantly lowering the redox potential and promoting an unwanted bacterialside reaction. Detection of a hydrogen sulfide odor in the extracted water further confirmedsulfate reduction. To prevent undesired sulfate reduction, ethanol was replaced by acetate as thecarbon source in the next experiment because acetate does not easily ferment and containscarbons with a higher oxidation state (“0”), than those in ethanol, which are at “-2”.
A three-month study was conducted to investigate the benefits of using acetate as a carbonsource. The extraction well continuously operated at a rate of 151.2 L per minute. Theexperimental setup of the daisy system was the same as described earlier except only oneinjection cycle of a 6-hour duration was performed simultaneously in the two wells locatedopposite each other. All eight outer perimeter wells were used to inject acetate in a cyclicfashion, and periodically 0.1% hydrogen peroxide injections were made in the inner wells toprevent biofouling of the extraction well and oxidize any residual nitrite and hydrogen sulfide.Again, complete denitrification occurred in the entire perimeter area surrounding the extractionwell throughout the 10-foot injection zone. No evidence of injection well clogging was observed.Residual dissolved organic carbon remained at background levels, and the maximum nitriteconcentration observed was 0.2 mg-N/L, well below the maximum contaminant level (1 mg-N/L). A 45% reduction of nitrate occurred at the extraction well (Figure 7-7) without noticeablesulfide odor or loss of sulfate.
8.0 REGULATORY ISSUES
As previously stated in this document, nitrate contamination is pervasive, and regulatoryenforcement of nitrate plumes has been limited. This section describes regulatory issues relatedto nitrate contamination and further identifies and describes regulatory issues specific to EISBD.
Appendix B contains a table of ground water standards for nitrate-nitrogen by state.
8.1 Regulatory Enforcement of Nitrate Contamination
Most state regulatory agencies have a difficult time dealing with nitrate-contaminated groundwater. State pollution prevention programs are aggressively pursuing “permitting” to preventfurther nitrate contamination in ground water. However, once a site becomes contaminated withnitrates above standards, especially nonpermitted facilities, the application of remediationpractices to deal with nitrate contamination is lacking. There are various reasons for thesephenomena.
8.1.1 Perceived Threat of Nitrate Contamination
Because nitrate-contaminated ground water’s only proven health affect, methemoglobinemia, isnot perceived as a grave health threat compared to contamination by volatile organic compoundsor certain metals, nitrate is not treated as a contaminant of highest concern. It should beemphasized that even if the previous statement is correct, the nitrate standard of 10 mg/l N03-Nmust be enforced according to federal and most state standards. Since the most common solutionto nitrate contamination is to provide an alternate water supply, many regulators view the

ITRC – Emerging Technologies for Enhanced In Situ Biodenitrification (EISBD) June 2000 of Nitrate-Contaminated Ground Water
33
problem as resolved once this is accomplished. This does not deal with the nitrate plume thatmay persist, creating further problems in the future.
8.1.2 No Real Economic Remediation Technology
While pumping nitrate-contaminated ground water and disposing of it in some fashion is thesimplest remediation technology, nitrate in ground water can be dealt with by means oftreatment, such as reverse osmosis or ion exchange. However, the high cost and time involved inthese efforts is a strong deterrence for regulators to require remediation.
Furthermore, most parties responsible for causing nitrate contamination do not have deeppockets. Examples of this would be small population centers that have wastewater treatmentsystems that are improperly constructed or managed and small, privately owned animaloperations. These “mom and pop” operations do not have the financial resources to support along-term pumping remediation system. Those responsible parties that do have greater financialcapabilities rarely pursue nitrate remediation on their own—often because of the low perceptionof threat mentioned above.
Many nitrate-contaminated ground water sites are the result of nonpoint sources. Examples ofthis would be areas in the Midwest where agricultural land has been over fertilized consistently,but no one field is the sole source of the nitrate contamination. Housing developments withseptic tank leach-field treatment systems have also caused regional nonpoint source nitratecontamination. When this occurs, there is no single responsible party for regulators to pursue torequire remediation. This leaves many states with contaminated ground water and no allocated oravailable resources for remediation.
8.1.3 No Voluntary Plume Remediation
Many states have regulations or are in the process of developing regulations that allowresponsible parties to voluntarily remediate ground water contamination. These regulations arefairly recent and provide incentives for responsible parties to adequately deal with theirenvironmental concerns. Prior to these regulations, most responsible parties rarely initiatedcleanup of their problems unless there was some direct benefit. Again, since nitrate is not acontaminant of highest concern, voluntary remediation of nitrate contamination was unheard ofand unexpected. However, with these new voluntary remediation regulations, the situation maychange.
8.1.4 Non-RCRA or CERCLA Constituent
Since nitrate is not a Resource Conservation Recovery Act (RCRA) or ComprehensiveEnvironmental Response, Compensation, and Liability Act (CERCLA) constituent, these federalregulations have not applied to nitrate contamination. Those facilities that fall under RCRA andCERCLA regulations have not been required to deal with nitrate contamination. Only whennitro-aromatic contaminants have been present have RCRA or CERCLA facilities dealt withnitrate contamination. However, the situation may be changing with the new understanding andremediation technology of natural attenuation and the need for an electron acceptor. Nitrates actas an electron acceptor under certain conditions, and nitrate contamination might be addressed
ITRC – Emerging Technologies for Enhanced In Situ Biodenitrification (EISBD) June 2000 of Nitrate-Contaminated Ground Water
34
through natural attenuation of volatile organic compounds. DOE and DOD have shown aninterest in dealing with nitrate contamination at some facilities and are very much interested inEISBD.
8.1.5 Impacts to Public and Domestic Supply Wells
A nationwide survey by EPA in the late 1980s gives a general indication of the extent of nitrateimpact on public and domestic supply wells (EPA, 1992). These estimates are as follows:
• Approximately 30,300,000 people drink ground water from about 9,900,000 domesticwells in the United States. About 450,000 of these individuals are infants under the age ofone year.
• Approximately 136,000,000 people drink ground water from about 94,600 public watersupply wells nationally. About 2,000,000 of these individuals are infants under the age ofone year.
• Of the population that obtains drinking water from domestic wells, approximately1,510,000 are estimated to be consuming water with at least 10 mg/l nitrate-nitrogen. Ofthe people exposed at this level, about 22,500 are estimated to be infants younger thanone year and thus possibly at risk of developing methemoglobinemia.
• Of the population that obtains drinking water from community water supply wells,approximately 2,980,000 individuals are estimated to be consuming water with at least 10mg/l nitrate-nitrogen. Of these, about 43,500 are expected to be infants.
Even though the above statistics show a considerable impact of nitrate on public water supplies,federal and state regulations are designed to help ensure that public supply wells meet standards.As these figures indicate, nitrate contamination has probably impacted more public supply wellsthan any other contaminant. Usually treatment occurs at the wellhead, or a new public supply ofwater is provided. In many cases, regulators are quick to identify and rectify nitratecontamination at public supply wellheads.
Many states do not have any regulatory standards for domestic supply wells. In New Mexicoalone, more than 700 documented domestic supply wells have been impacted with nitratecontamination above standards. For those states that have ground water standards for nitrate,regulations may be in place to address the nitrate contamination. Unfortunately, as previouslymentioned, little can be accomplished to deal with the nitrate plume except to provide a cleanalternate water supply or make recommendations for the domestic well owner. Theserecommendations may include identification of the nitrate source, steps to prevent further nitratecontamination, and suggestions to deepen or move domestic wells beyond the nitratecontamination, if applicable.
8.2 Issues Specific to Enhanced In Situ Biodenitrification
8.2.1 Time of Cleanup
As shown in the data provided in Section 6.0, EISBD is a very fast reaction. To achievecontaminant removal to below standards or detection limits in a contaminated aquifer in anexpeditious manner is highly desirable. Few regulations mandate how quickly a contaminantmust be removed. Many specific site plans approved by regulators contain timeframes for

ITRC – Emerging Technologies for Enhanced In Situ Biodenitrification (EISBD) June 2000 of Nitrate-Contaminated Ground Water
35
contaminant removal. Most regulators would approve of a remediation technology that is faster.Regulators must be aware that for EISBD to be effective, the denitrification process must becompleted to term. That is, nitrate must be reduced to nitrogen gas, or intermediate contaminants,such as nitrite, may be left. Therefore, the responsible party needs to assure that enough carbonand nutrient amendment is supplied in the aquifer over an appropriate time and at appropriateconcentrations.
8.2.2 Not Yet a Proven Technology
Innovative technologies for environmental restoration promise faster, better, and cheaperremediation. Yet, institutional, regulatory, and technical barriers related to the use of innovativetechnologies often arise by virtue of (1) lack of cost and performance data and (2) an inflexibleinstitutional/regulatory framework. These general issues are explained in detail in ITRC's CaseStudies of Regulatory Acceptance: In Situ Bioremediation Technologies. Section 3.3.1 of thisdocument is repeated below.
The risks associated with uncertain performance of innovative technologies include thefollowing:
• Risk aversion. Regulators charged with assuring a safe and effective cleanup, may beunwilling to assume the risk of an innovative remedy that may not prove to be eithersafer or effective. Regulators must be accountable to both their management and thepublic when assuming these risks.
• Desire to expedite cleanup. Remedial site managers (i.e., regulators) must adhere toschedule milestones. Responsible parties benefit from getting the site out of themedia, the public eye, and regulatory scrutiny. Public opinion generally favorsimmediate action. However, the initial delay associated with the study and testing ofthe innovative technology, coupled with the uncertainty of its performance andpossible necessity for follow-up remediation, can give pause to those concerned withexpeditious remediation.
• Desire to maintain a projected budget. Remedial site managers are under pressure tomaintain projected budgets, and responsible parties have a significant incentive tominimize cleanup costs. Yet the study of an innovative technology may drive up costsin the short-term. If the technology should not perform as expected, budgets may beoverrun.
Regulatory drivers also may impede the implementation of innovative technologies. Suchregulatory concerns include the following:
• Regulatory standards. Frequently, regulatory standards can actually impede, ratherthan facilitate a cleanup. Examples include land disposal restrictions that prohibitremoval of contaminated media, treatment, and land disposal if the media containslisted hazardous wastes. Ground water quality standards can inhibit injection ofadditives that accelerate the biodegradation of chemicals in ground water.
ITRC – Emerging Technologies for Enhanced In Situ Biodenitrification (EISBD) June 2000 of Nitrate-Contaminated Ground Water
36
• Permitting procedures. Permitting of innovative technologies is often a lengthyprocess and a process that is unfamiliar to many regulators (e.g. Research,Development and Demonstration permits under the Resource Conservation RecoveryAct). Additionally, there is potential for interagency friction when one agency isready to approve use of an innovative technology, but another agency feels compelledto adhere to its established permitting process.
8.2.3 Long- and Short-Term Regulatory Issues
Long- and short-term regulatory issues deal primarily with monitoring requirements. It goeswithout saying that continued monitoring of ground water quality is required during EISBD.Most states require some type of permit for the injection of water. These permits havemonitoring requirements. Short-term requirements are usually specified in detail in thosepermits. Since EISBD reactions are very fast, short-term ground water monitoring will verify theefficiency of denitrification. Long-term requirements after denitrification also vary betweenstates. New Mexico requires that eight consecutive quarters of below standard ground wateranalysis be conducted prior to closure approval.
8.2.4 Reinjection of Contaminated Ground Water and Amendments
As with many enhanced bioremediation technologies, the same regulatory issues re-emerge.These issues are well explained, and solutions are provided in ITRC’s Technical and RegulatoryRequirements for Enhanced In Situ Bioremediation of Chlorinated Solvents in Groundwater,Appendix E. The following text was taken directly from that document.
“Regulatory Barriers Preventing Deployment of In Situ Bioremediation Technologies”
During the course of development of the Regulatory and Technical Guidance for In SituBioremediation of Chlorinated Solvents in Groundwater, the Enhanced In Situ BioremediationWork Team identified a major regulatory impediment to the deployment of a particular class ofin situ bioremediation. The critical elements of this technology include
• withdrawal of contaminated ground water,• addition of amendments to the ground water, and• injection of the contaminated ground water back into the contaminant plume without
substantially reducing the concentration of contaminants in the injected fluid.Withdrawal and injection results in the establishment of a recirculation cell that helps todistribute the amendments throughout the targeted plume and increases the residence time withinthe treatment zone. Once distributed within the ground water, the amendments stimulatemicrobial biodegradation processes that can significantly reduce the mass of contaminants.
This type of bioremediation system triggers the following RCRA-related regulatory issues:
• Withdrawn ground water may be considered a contaminated media under EPA’s“contained-in” policy (40 CFR 261.33(b)).
• Withdrawal may constitute active management of hazardous waste, thus triggering landdisposal restrictions (RCRA Section 3004 (f), (g), and (m)).

ITRC – Emerging Technologies for Enhanced In Situ Biodenitrification (EISBD) June 2000 of Nitrate-Contaminated Ground Water
37
• Contaminated media is to be treated as hazardous waste until it no longer contains thelisted hazardous waste. The Toxicity Characteristic (40 CFR 261.24, Table 1-1)concentrations have been used to determine the level above which ground water is to betreated as hazardous.
• Injection of hazardous waste into a usable aquifer constitutes land disposal (RCRASection 3004 (f), (g), and (m) and 3020(a)). Because contaminated media under the“contained-in” policy requires treatment as hazardous waste, LDR restrictions couldapply.
RCRA attempted to address the fourth issue by specifically allowing the reinjection of treatedground water for the purposes of remediation in the case of RCRA or CERCLA cleanups (RCRASection 3020(b)). However, this statute has been interpreted to require substantial treatmentresulting in reduction of contaminant levels prior to reinjection. Proponents of this technologymaintain that it is often not economically feasible to clean up the contaminated ground waterprior to reinjection and argue that there are no sound scientific or risk-based justifications fordoing so. Furthermore, there appear to be no federal regulatory mechanisms to allow thereinjection to occur in non-RCRA or non-CERCLA sites.
The following issues should be addressed:
1. Reinjection RCRA 3020(b) Issue: RCRA 3020(b) states that contaminated ground water must be treated to substantiallyreduce hazardous constituents prior to reinjection. It is unclear whether this requires bothtreatment and a reduction of contaminant levels prior to injection, or just substantial treatmentprior to injection with the ultimate result being a reduction in contaminant levels within theaquifer. Solution: Clarify this statute to allow treatment by nutrient addition or bioaugmentation that willconstitute substantial treatment in situ. 2. Non- RCRA or non-CERCLA contaminated sites Issue: If the site cleanup (regarding ground water and related contaminants in this situation) isnot conducted under CERCLA or RCRA Corrective Action authority, then it is unclear whetherCERCLA or RCRA regulatory mechanisms would apply to allow injection (such as RCRA3020b). Solution: Clarify that state remedial and voluntary cleanup programs should have the sameregulatory mechanisms to expedite cleanups as CERCLA and RCRA Corrective Action unlessmore restrictive state regulations supercede the federal regulations. 3. Area of Contamination or Corrective Action Management Unit Issue: A CERCLA–AOC (Area of Contamination, 40 CFR, part 300) or a RCRA–CAMU(Corrective Action Management Unit, 40 CFR, part 264, subpart S) were designed to facilitaterapid and cost-effective site remediation by reduced regulatory requirements as long as waste is

ITRC – Emerging Technologies for Enhanced In Situ Biodenitrification (EISBD) June 2000 of Nitrate-Contaminated Ground Water
38
managed (treated, stored or disposed) within the AOC or CAMU. If managed within the AOC orCAMU, Land Disposal Restrictions (LDRs) treatment standards and minimum technologyrequirements (MTRs) will not be triggered. Solution: Clearly define that an AOC or CAMU can be defined by the aerial extent of the plume,thereby allowing aboveground extraction and reinjection (i.e., a recirculation system) withouttriggering LDR and MTR requirements. 4. OSWER Directive 9380.0-25, 4/29/96
Issue: EPA is encouraging the demonstration and use of promising new technologies, includingthose involving injection of amendments to enhance biodegradation (OSWER Directive 9380.0-25, April 29, 96.)
Solution: Clarify/modify this directive to clearly include the use of amendments added toextracted ground water to enhance in situ bioremediation.
5. Treatability Variance
Issue: When an AOC or CAMU approach cannot be used for any reason, it is unclear whether itwould be appropriate to use a Treatability Variance (40 CFR 268.44) to establish ultimate cleanuplevels. Can a Treatability Variance be obtained to allow extracted ground water to be reinjectedinto the subsurface to enhance in situ biotreatment technologies?
Solution: Clarify that Treatability Variances can be issued to promote the use of amended groundwater injected into the aquifer to accelerate in situ bioremediation.
5. UIC Considerations
Issue: UIC wells: When extracted ground water is to be treated as hazardous waste under the“contained-in” policy, reinjection into a useable aquifer to enhance bioremediation could beconsidered a Class IV injection. This injection would be prohibited for most non-CERCLA ornon-RCRA sites (40 CFR 144.13). This could force unnecessary treatment of amended groundwater prior to reinjection and may result in unacceptable costs for EISB projects.
Solution: Clarify that wells being used for reinjection of amended ground water to enhancebioremediation may be classified as a Class V well rather than Class IV wells.
8.2.5 Residual Amendments
EISBD utilizes a substrate as a carbon source for bioremediation. The addition of a carbonsource raises regulatory concerns. These concerns are based upon any carbon source that mayremain following denitrification. Even if excess carbon is supplied to an aquifer, facultativebacteria will continue to consume this excess carbon until depleted, thereby removing anyresidual amendments. Regulators should be aware that further monitoring of the excess carbonsource should take place if the carbon source amendment is a chemical of concern.

ITRC – Emerging Technologies for Enhanced In Situ Biodenitrification (EISBD) June 2000 of Nitrate-Contaminated Ground Water
39
8.2.6 Resulting Geochemistry in Aquifer
Aquifer geochemistry may be altered from background after EISBD. Excess CO2 and H2O willbe the end products of the added carbon source. The CO2 most likely will increase bicarbonatelevels in the aquifer. Since denitrification occurs in anaerobic conditions with a carbon source,other electron acceptors besides NO3 may be MnO2, FeO3, FE(OH)3, or SO4. Evidence ofmanganese and iron reduction is expected to be seen but not sulfate reduction. The decreasedvalues of Eh during EISBD are not low enough for sulfate reduction to occur. However, oneshould expect an increased dissolved concentration in Mn(II) and Fe(II). During EISBD, anincrease in pH will occur, but subsurface environments probably will be able to buffer the pH.The decrease of pH after denitrification is most likely explained by the precipitation of certaincations, such as the precipitation of calcium carbonate or magnesium carbonate. Major sourcesof nitrate contamination are usually associated with an increase in TDS. After denitrification,TDS concentrations remain similar to TDS concentrations found in the nitrate plume.
8.2.7 Biomass Concentrations
The potential for biomass accumulation with any enhanced bioremediation is a regulatoryconcern. Biomass buildup may prevent even distribution of the carbon source and nutrient intothe aquifer. Uneven distribution may not provide for complete denitrification. Biomassaccumulation may occur in the well or amendment-distributing system, creating clogging andimproper treatment or denitrification. The choice of amendment is critical for minimalassimilation of the carbon by the bacteria. As shown above, acetate is an amendment of choicesince dissimulation occurs with acetate. Regulators should be aware that if bacterialaccumulations are great in the aquifer, their biomass breakdown after completion ofdenitrification might release nitrogen back into the aquifer. However, this release of nitrogen willbe slow, and concentrations may not exceed standards.
9.0 PERFORMANCE PARAMETERS
9.1 Cost
EISBD projects have costs related to chemical amendments and engineered amendment injectionsystems, well construction, system maintenance, and monitoring. Due to the limited availabilityof information on completed projects, little cost data is available. However, cost comparisons canbe made between enhanced bioremediation and typical pump-and-treat systems. DuPont hasdeveloped a method of evaluating technologies that includes a generic, nonsite-specific basisusing a template site. One such comparison was based on a chlorinated solvent site whereenhanced bioremediation cost $1.20 per 3,780 L treated, versus a pump-and-treat cost of $8.90per 3,780 L treated. (Quinton et al., 1997). Cost analysis can be presented for EISBD workcompleted or proposed at this time.
As noted under UNM’s EISBD project, the cost for chemical amendments is $0.64 per 3,780 Ltreated, given concentrations of 20 mg/l nitrate-nitrogen and 4 mg/l dissolved oxygen. Aproposal to remediate the heart of a nitrate plume in New Mexico with concentrations ofapproximately 300 mg/l nitrate-nitrogen should be ongoing. The proposal includes a two-year

ITRC – Emerging Technologies for Enhanced In Situ Biodenitrification (EISBD) June 2000 of Nitrate-Contaminated Ground Water
40
project to assess the center of plume mass, install and operate four inverted five-spotinjection/extraction well patterns, and monitoring of ground water. Project cost estimates areapproximately $106,000 per year. Since this is a joint project between the New MexicoEnvironment Department and UNM, many of the costs are associated with research. Researchcosts indicate a costlier estimate than if this technology were already commercialized.
In ex situ denitrification, the University of Colorado has shown that a complete denitrificationsystem costs approximately $60 per 3,780 L treated (Silverstein, 1997).
9.2 Time to Completion
As described previously, EISBD is a very fast reaction, given the correct conditions. Reductionof nitrate to below detection limits can occur in a matter of days. Given this information, the timeto complete a remediation of a nitrate plume would depend on site concentrations and conditionsand regulatory requirements for closure monitoring. It is conceivable that a site could receiveclosure within six months but most likely would require two years. When EISBD is applied toremediate ground water before it is pumped into a supply well, the time to completion would bedependent on the size of the plume and the life of the supply well.
9.3 Contaminant Reduction
The denitrification work of both UNM and UNL showed that EISBD occurs in days, rangingfrom 5 days to 15 days. Contaminant reduction is very dependent on the initial nitrateconcentration, the ability to disperse substrates evenly through the aquifer, and initial dissolvedoxygen concentrations. In any event, denitrification occurs very rapidly. As compared to mosttreatment systems that require pumping of ground water, EISBD is considerably more desirable.The pumping of ground water to contain and remove nitrates takes years with considerable costs,regulatory oversight, maintenance, and monitoring.
10.0 PUBLIC AND STAKEHOLDER ACCEPTANCE AND CONCERNS
EISBD is an innovative technology that poses some public and stakeholder concerns. Thisdocument shall address concerns that are typical to all remediation technologies and concernsthat are specific to EISBD.
Noise is a concern in any remediation technology implementation. During the initial stages ofimplementation of EISBD injection, extraction and monitoring wells need to be installed.Drilling activities may create noise hazards but are short-lived until well completion. Duringoperation of EISBD projects, noise is very limited since pumping of ground water foramendment addition is the only mechanical process that may create noise.
Prior to initiation of drilling activities, access to properties overlying the nitrate plume have to beobtained. In urban settings, access may be a problem but is dependent on site conditions, publicaccess, and private ownership of the site. During installation of an EISBD project, drillingvehicles will be mobilized and may cause temporary traffic concerns and dust. This concern toois short-lived. During the operation of EISBD projects, extraction wells require electrical pumps.

ITRC – Emerging Technologies for Enhanced In Situ Biodenitrification (EISBD) June 2000 of Nitrate-Contaminated Ground Water
41
Pumping rates are dependent on site conditions such as ground water concentrations, amendmentadditions, and lithology. Pump houses and their exhaust systems may require sound and off-gasmitigation. The same holds for vibration from pump operations.
During active denitrification, nitrogen gas is produced but is innocuous, and the majorityprobably will remain in the soil vapor environment. EISBD principals involve the stimulation ofindigenous bacteria to denitrify ground water, resulting in the proliferation of denitrifiers as theyout compete other microorganisms. Therefore, pathogen proliferation would most likely be at aminimum and would pose very little concern. As with any emerging technology, uncertaintiesmay occur. At least two technology uncertainties are foreseen at this point. One is the potentialfor biomass buildup that may cause biofouling in the injection wells or the saturated zone. Sincethis is the nemesis of any in situ bioremediation technology, this problem has been studied andsolutions are available depending on site conditions. Timely communications with affectedstakeholders on the biofouling testing timetable, results, and solutions are a must for maintainingtrust. The second is the presence of ammonia. As previously stated, ammonia is a major sourceof nitrogen in fertilizers, explosives, and human and animal wastes. In the presence of oxygen,ammonia will easily convert to nitrate and, therefore, must be addressed along with the nitrate.Remediation technologies must address ammonia contamination along with nitrates.
Please refer to Section 8.2.4 concerning reinjection issues. However, since ground water isextracted and reinjected, water table issues may be of concern. The EISBD process is to extractnitrate-contaminated ground water, amend the extract with nutrients and a carbon source, andreinject to allow for in situ denitrification to occur. This will cause water mounding anddrawdown, but the system is designed for hydraulic containment and should only pose minorconcerns. Constant measurement near buildings with basements will ensure a level of comfort.
Overall, this technology is very cost-effective compared to all other remediation technologies. Itis also very environmentally friendly because nontoxic amendments are used, water resourcesare not wasted or consumed, and residual products are innocuous. It must be pointed out that theEISBD process must be carried out to completion. That is, nitrates are denitrified to nitrites, andnitrates are denitrified completely to nitrogen gas. Otherwise if nitrites are left in the groundwater, they will either be converted back to nitrates or may remain as nitrites, which is thecontaminant that can cause the greatest human health risk. To assure that denitrification iscarried out to completion, an ample supply of carbon source has to be present, and monitoringfor the final conversion of nitrate to nitrogen gas must be provided to give assurance to thecommunity that the process is complete.
11.0 CONCLUSIONS
With a growing population and its demands for quality drinking water, the need is urgent toprotect and preserve ground and surface waters as limited natural resources. With potable waterseen as a renewable resource, its protection, preservation and reuse must continue to beappropriately managed. One management tool being studied is the reinjection of potable waterinto an aquifer as a reservoir. This would be hindered if introduced into a nitrate ground waterplume. Pollution prevention of nitrogen sources must continue to help alleviate further nitratecontamination in our drinking water supplies. A review of U.S. and foreign studies indicates a

ITRC – Emerging Technologies for Enhanced In Situ Biodenitrification (EISBD) June 2000 of Nitrate-Contaminated Ground Water
42
need for more peer review of health effects studies of nitrate contamination on humans andanimals. For instance, the many links between the intake of nitrate-contaminated water andadverse health effects, such as miscarriages and cancers, need to be studied and evaluated. Dueto high cost, long-term treatment, and relative ineffectiveness, traditional nitrate remediationtechniques are limited. The application of new and emerging remediation technologies for nitratecontamination is promising. EISBD is one of the most promising emerging technologies toeliminate nitrate contamination. Current research and application of this new technology showthat remediation costs and time are substantially reduced; it is efficient; its applicability isdiverse; and regulatory, public, and commercial acceptance is imminent. Many federal facilities,including those owned by DOD and DOE, have ground water contamination. In some places,this contamination is solely composed of nitrates or other contaminants commingled withnitrates. EISBD may be implemented in association with other in situ bioremediationapplications where these singular or commingled plumes exist. EISBD appears to be one of themost promising of the few emerging technologies to deal with nitrate-contaminated water.

ITRC – Emerging Technologies for Enhanced In Situ Biodenitrification (EISBD) June 2000 of Nitrate-Contaminated Ground Water
43
12.0 REFERENCES
Abdelouas, A., Lu, Y.M., Lutze W., and Nuttall H.E., 1998, “Reduction of U(VI) to U(IV) byindigenous bacteria in contaminated ground water”, J. Contam. Hydrology, 35: 217-233p.
Bates, H.K., Martin, G.E., and Spalding, R.F., 1998, “Kinetic isotope effects in production ofNitrite-N and dinitrogen gas”, Journal of Environmental Quality, 27(1) (Journal Series No.11627): 183-191p.
Bates, H.K. and R.F. Spalding, 1998, “Aquifer denitrification as interpreted from in situmicrocosm experiments”, Journal of Environmental Quality, 27(1) (Journal Series No.11624): 174-182p.
Beaulac, M.N. and Reckhow, K.H., 1982, “An examination of land use-nutrient exportrelationships”, Water Resources Bulletin, 18 (6): 1013-1023p.
Blair, A., Zahm, S.H., Cantor, K. P., and Ward, M. H., 1997, “Occupational and EnvironmentalRisk Factors for Chronic Lymphocytic Leukemia and Non-Hodgkin's Lymphoma”; in 1997USPHS Workshop Proceedings: Determining the Role of Environmental Exposures as RiskFactors for B-Cell Chronic Lymphoproliferative Disorders; http://www.cdc.gov/nceh/programs/lab/flowcyto/pub/1997/html/doc16.htm.
Burkholder, J.M. and Glasgow Jr., H.B., 1997, “Pfisteria piscicida and other Pfiesteria-likedinoflagellates: Behavior, impacts, and environmental controls”, Limnology andOceanograhpy, 42 (5): 1052-75p.
Centers for Disease Control, 1993, “Methemoglobinemia in an Infant—Wisconsin, 1992”,http://www.cdc.gov/epo/mmwr/preview/mmwrhtml/00020077.htm.
Centers for Disease Control, 1996, “Spontaneous Abortions Possibly Related to Ingestion ofNitrate-Contaminated Well Water—LaGrange County, Indiana, 1991-1994”,http://www.cdc.gov/epo/mmwr/preview/mmwrhtml/00042839.htm.
Centers for Disease Control and Prevention, National Center for Environmental Health, 1998, “ASurvey of the Quality of Water Drawn From Domestic Wells in Nine Midwest States”,United States Department of Health and Human Services, 25p.
Chapelle, Francis H.,1993, “Ground-Water Microbiology and Geochemistry”, John Wiley &Sons, Inc., 251-253p.
Clark, L., et al., 1998, “The Feasibility of In Situ Bioremediation of Groundwater Nitrate.Contaminated Soil '98”, Thomas Telford, London, 1117-1118p.
Cole, G.A., 1983, “Textbook of Limnology”, C.V. Mosby Company.
Dahab, M.F., 1991, “Civil Engineering, Center for Infrastructure Research”, University ofNebraska- Lincoln.

ITRC – Emerging Technologies for Enhanced In Situ Biodenitrification (EISBD) June 2000 of Nitrate-Contaminated Ground Water
44
Davis, H., 1995, “Monitoring and Evaluation of Water Quality Under Central Valley DairySites”, California Plant and Soil Conference, Visalia, CA.
Deng, L. J., 1998, “In situ biological denitrification of ground water”, Master Thesis - Universityof New Mexico, Department of Chemical and Nuclear Engineering.
Deng, L., Nuttall, H.E., Abdelouas, A., Lu, Y.M., and Lutze, W., 1998, “In Situ BiologicalDenitrification of Ground water”, WERC.WRHSRC.NMHWMS '98 Joint Conference on theEnvironment Proceedings, 31-36p.
Faries, F.C., Sweeten, J., and Reagor,. J., 1991, “Water Quality: Its Relationship to Livestock,Texas Agricultural Extension Service”, The Texas A&M University System.
Fennessy, M.S. and Cronk, J.K., 1993-1997, “The effectiveness and restoration potential ofriparian ecotones for the management of nonpoint source pollution, particularly nitrate”, InCrit. Rev. Environ. Sci. Technol., CRC Press, 27 (4): 285-317p.
Fredrickson, J.,1998, Pacific Northwest Laboratories, Remedial Technologies Network, LLC.
Garden State EnviroNews 990326, March, 1999.
Green, M., Shnizer, M., Tarre, S., Bogden, B., Shelef, G., and Sorden. C., 1994, “Fluidized bedreactor operation for ground water denitrification”, Wat. Sci. Tech. 29(10/11): 509-515p.
Haag, Gary. 1997, South Dakota Department of Environment, personal communication.
Hamon, M. and Fustec. E., 1991, “Laboratory and field study of an in situ ground waterdenitrification reactor”, Res. J. Water Pollut. Control. Fed. 63(7): 942-949p.
Interstate Technology and Regulatory Cooperation Work Group, 1996, “Case Studies ofRegulatory Acceptance: In Situ Bioremediation Technologies”.
Interstate Technology and Regulatory Cooperation Work Group, 1998, “Technical andRegulatory Requirements for Enhanced In Situ Bioremediation of Chlorinated Solvents inGroundwater”.
Kappelhof, J.W.N.M., van Der Hoek, J.P., and Hijnen, W.A.M.,. 1992, “Experience with fixed-bed denitrification using ethanol as substrate for nitrate removal from ground water”, WaterSupply, 10(3): 91-100p.
Kappor, A., 1997, ‘Nitrate Removal from Drinking Water – Review”, Journal of EnvironmentalEngineering, 123(4): April.
Khan, Imtiyaz A. and Spalding, Roy F., 1998, “Denitrification Using A Daisy Well System”,Presented at National Sanitation Foundation International Symposium, Safe Drinking Waterin Small Systems: Technology, Operations, and Economics. Washington, D.C., May 10-13.

ITRC – Emerging Technologies for Enhanced In Situ Biodenitrification (EISBD) June 2000 of Nitrate-Contaminated Ground Water
45
Kimmel, B.L., 1981, “Land-water interactions: effects of introduced nutrients and soil particleson reservoir productivity”, Oklahoma Water Resources Research Institute, Oklahoma StateUniversity at Stillwater, Technical Completion Report.
Knowles, R. 1982, “Denitrification”, Microbiol., Rev. 46: 43-70p.
Korom, Scott, 1992, “Natural Denitrification in the Saturated Zone: A Review”, WaterResources Research 28(6): June, 1657-1668p.
Kross, 1995, “In Soil amendments: Impacts on biotic systems”, ed. Lewis Publishers, BocaRaton.
Kvasnicka, B., Krysl, L., 1990, “Nitrate Poisoning in Livestock”, Cattle Producers Library CL620, University of Nevada.
Licht, L.A and Schnoor, J.L., 1993, “Tree Buffers Protect Shallow Ground Water atContaminated Sites”; Ground Water Currents, EPA/542/N-93/011, December.
Lu, Y. M. 1998, “Sequential bioremediation of nitrate and uranium in contaminated groundwater”, Ph.D. dissertation - University of New Mexico, Department of Chemical and NuclearEngineering.
Madison, R.J. and Brunnet, J.O., 1985, “Overview of the Occurrence of Nitrate in Ground Waterof the United States”, U.S. Geological Survey Water Supply Paper, 2275p.
McCarty, P.L., Beck, L., and Amant, P. St., 1969, “Biological denitrification of wastewaters byaddition of organic materials”, 1271-1286p., In Proc. 24th Industrial Waste Conf., Lafayette,IN, 6-8 May, Purdue University, Lafayette.
McQuillan, Dennis, 1995, “High Ground-water Nitrate in Tijeras Arroyo, Hells Canyon and AboArroyo: Evidence for a Natural Geologic Origin”, New Mexico Geology 17(2): May.
McQuillan, D., 1997, “Investigation of Elevated Nitrate Levels in Private Well Water”, NewMexico Environment Department.
McQuillan, et al., 1998, “Intrinsic Cometabolism of Carbon Tetrachloride with Gasoline:Regulatory Site-Closure, First International Conference on Remediation of Chlorinated andRecalcitrant Compounds”, Battelle Press, Monterey, California, May 18-21.
McQuillan, et al.,, 1999, “In situ Ground Water Bio-Denitrification”, NMED.Mercado, A., Libhaber, M., and Soares, M.I.M., 1988, “In situ biological ground water
denitrification: concepts and preliminary field tests”, Wat. Sci. Tech. 20(3): 197-209p.
Meyer, K., 1990, “Water Quality for Animals”, The Alabama Cooperative Extension Service,Auburn University, September.

ITRC – Emerging Technologies for Enhanced In Situ Biodenitrification (EISBD) June 2000 of Nitrate-Contaminated Ground Water
46
Meyer, M., 1994, "How Common is Methemoglobinemia from Nitrate Contaminated Wells? - ASouth Dakota Perspective", in Proceedings of the 39th Annual Midwest Ground-WaterConference, October 16-18, Bismarck, ND.
Ministry of Public Health: Notification, No. 61, B.F., 2524 (1981). Thailand
Minnesota Extension Service, 1994, “Onsite Sewage Treatment Manual: University ofMinnesota, Cooperative Extension Service”, 10 sections plus appendices.
Mulvay, M, 1986, "Blue Baby Onset Can be Sudden, Severe", The Lincoln Star and LincolnJournal, February 11.
Nitrate Elimination Co., Inc. (NECi) web site, 1999, www.nitrate.com/map1.htm.
Nuttall, H.E., Lutze, W., Barton L.L., and Wolfram, J., 1997, “In situ bioremediation ofcontaminated ground water at an UMTRA Site.” International Symposium In Situ and OnSite Bioreclamation Proceedings, 1: 435–440p.
Nuttall, H.E., 1997, “Biodenitrification of New Mexico Ground water”, New Mexico Journal ofScience, 37: 64-73p.
Payne, W. J., 1981, “Denitrification”, Wiley, New York.
Potash Corporation of Saskatchewan, Internet Web Site, Nitrogen Products, 1999,http://www.potashcorp.com/nitrogen.htm.
“Pouring It On: Health Effects of Nitrate Exposure”, 1996, Environmental Working Groupwebsite: http://www.ewg.org/pub/home/Reports/Nitrate/NitrateHealth.html.
Quinton, G., Buchanan Jr., R., Ellis, D., and Shoemaker, S., 1997, “A Method to CompareGroundwater Cleanup Technologies”, Remediation.
Rabalais, N.N., Turner, E., and Wiseman, W.J., 1999 - in press, “Hypoxia in Gulf of Mexico”, J.Environ. Qual.
Schnoor, J.L., 1997, “Phytoremediation; Ground-Water Remediation Technologies AnalysisCenter”, TE-98-01, GWRTAC -E- Series Technical Evaluation Report athttp://www.gwrtac.org.
Sigel, Abe. 1999, EPA, Information Services, SDWIS, personal communication.
Silverstein, 1997, JoAnn, Department of Civil, Environmental and Architectural Engineering,University of Colorado, Boulder, CO.
Smith, R.A., Alexander, R.B., and Wolman, M.G., 1987, “Water-Quality Trends in the Nation’sRivers”, Science 235: 1607-1615p.

ITRC – Emerging Technologies for Enhanced In Situ Biodenitrification (EISBD) June 2000 of Nitrate-Contaminated Ground Water
47
Spalding, R., and Exner, M., July – September. 1993, “Occurrence of Nitrate in Ground Water”,Journal of Environmental Quality 22(3), Maddison, WI.
Titus, F.B., Jr., 1980, “Ground Water in the Sandia and Northern Manzano Mountains”, NewMexico, Socorro, New Mexico Bureau of Mines and Mineral Resources Hydrologic Report5.
Townsend, Dan M. and Myers, and Tommy E., 1996, “Recent Developments in FormulatingModel Descriptors of Subsurface Transformation and Sorption of TNT, RDX, and HMX”,U.S. Army Corp of Engineers Technical Report IRRP-96-1, 1p.
United States Environmental Protection Agency, 1992, “Another Look: National Survey ofPesticides in Drinking Water Wells”, Phase 2 Report, EPA Office of Water Publication #EPA 570/9-91-020, 166 plus appendices.
United States Environmental Protection Agency, 1993, “Nitrogen Control”, EPA PublicationEPA/625/R-93/010 (ORW/OW), 311p.
University of Nebraska Cooperative Extension, 1998, “Managing Irrigation and Nitrogen toProtect Water Quality”, University of Nebraska Cooperative Extension Publication EC98-786-S, 62p.
Weisenburger, DD., 1991, “Potential health consequences of ground-water contamination bynitrates in Nebraska”, In Nitrate Contamination, Bogardi I., Kuzelka R.D. (eds), NATO ASSeries, Vol. G 30, Berlin: Springer-Verlag, 309-315p.
Wu Y., Chen J., Oshima H. et al., 1993, “Geographic association between urinary excretion ofN-nitroso compounds and esophageal cancer mortality in China”, International Journal ofCancer 54: 713-719p.

APPENDIX A
Acronyms

A-1
Acronyms
AOC Area of ContainmentCAMU Corrective Action Management UnitCDCP Center for Disease Control and PreventionCeRaM Center for Radioactive Waste ManagementCERCLA Comprehensive Environmental Response, Compensation, and Liability
ActCFR Code of Federal RegulationsCT carbon tetrachlorideDO dissolved oxygenDOC dissolved organic carbonDOD U.S. Department of DefenseDOE U.S. Department of EnergyECOS Environmental Council of StatesEISBD enhanced in situ biodenitrificationEPA U.S. Environmental Protection AgencyERIS Environmental Research Institute of StatesHMX oxyhydro 1,3,5,7-tetranitro-1,3,5,7-triazineITRC Interstate Technology and Regulatory Cooperation Work GroupKCl potassium chlorideLDR land disposal restrictionsLLC limited liability corporationMCL maximum contaminant levelMLS multilevel samplersMTR minimum technology requirement(s)MOU Memorandum of UnderstandingOSWER Office of Solid Waste and Emergency ResponsePRB permeable reactive barrierPVC polyvinyl chlorideRCRA Resource Conservation Recovery ActRDX 2,3,5-trinitro-1,3,5 triazineSD South DakotaTDS total dissolved solidsTMP sodium trimetaphosphateTNT 2,4,6 trinitrotolueneUIC underground injection controlUNL University of Nebraska-LincolnUNM University of New MexicoWERC Waste-management Education and Research ConsortiumWI Wisconsin

APPENDIX B
State Nitrate Ground Water Standards
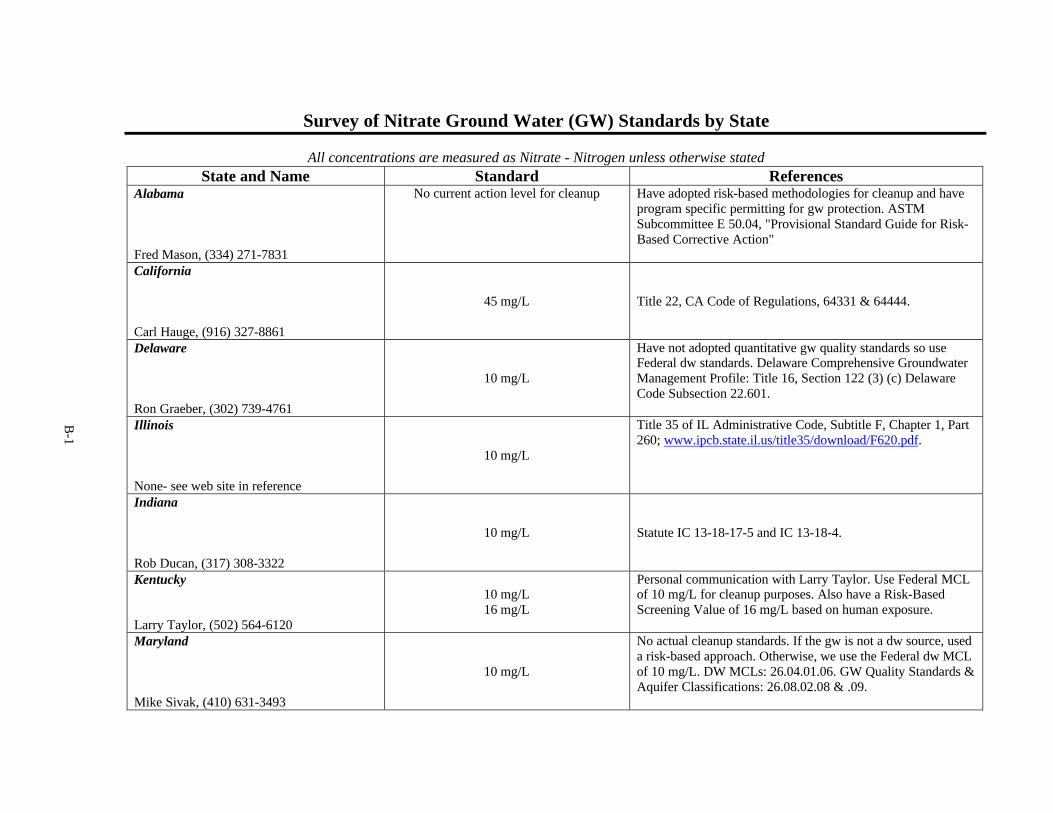
Survey of Nitrate Ground Water (GW) Standards by State
All concentrations are measured as Nitrate - Nitrogen unless otherwise statedState and Name Standard References
Alabama
Fred Mason, (334) 271-7831
No current action level for cleanup Have adopted risk-based methodologies for cleanup and haveprogram specific permitting for gw protection. ASTMSubcommittee E 50.04, "Provisional Standard Guide for Risk-Based Corrective Action"
California
Carl Hauge, (916) 327-8861
45 mg/L Title 22, CA Code of Regulations, 64331 & 64444.
Delaware
Ron Graeber, (302) 739-4761
10 mg/L
Have not adopted quantitative gw quality standards so useFederal dw standards. Delaware Comprehensive GroundwaterManagement Profile: Title 16, Section 122 (3) (c) DelawareCode Subsection 22.601.
Illinois
None- see web site in reference
10 mg/L
Title 35 of IL Administrative Code, Subtitle F, Chapter 1, Part260; www.ipcb.state.il.us/title35/download/F620.pdf.
Indiana
Rob Ducan, (317) 308-3322
10 mg/L Statute IC 13-18-17-5 and IC 13-18-4.
Kentucky
Larry Taylor, (502) 564-6120
10 mg/L16 mg/L
Personal communication with Larry Taylor. Use Federal MCLof 10 mg/L for cleanup purposes. Also have a Risk-BasedScreening Value of 16 mg/L based on human exposure.
Maryland
Mike Sivak, (410) 631-3493
10 mg/L
No actual cleanup standards. If the gw is not a dw source, useda risk-based approach. Otherwise, we use the Federal dw MCLof 10 mg/L. DW MCLs: 26.04.01.06. GW Quality Standards &Aquifer Classifications: 26.08.02.08 & .09.
B-1

Survey of Nitrate Ground Water (GW) Standards by State
All concentrations are measured as Nitrate - Nitrogen unless otherwise statedState and Name Standard References
Mississippi
James Crawford, (601) 961-5354
10 mg/L
Same as Federal dw MCLs. Currently trying toupdate/change their gw standards, "GroundwaterQuality Standards."
New Hampshire
None- see web site in reference
10 mg/L
New Hampshire's ambient gw quality standards areequivalent to Federal MCLs. Title 50: Watermanagement and Protection, Chapter 485C, Section485-C:6. http://199.92.250.14/rsa/50/485-6-6.htm .
New Jersey
None- see web site in reference
10 mg/L
"Groundwater Quality Standards" (NJ A.C. 7:9-6).http://www.state.nj.us/dep/dwq/pdf/njac79-6.pdf .
New Mexico
Bart Faris, (505) 841-9466
10 mg/l
New Mexico Water Quality Act, NMSA Chapter 74Article 6, Water Quality Control CommissionRegulations, Standards for Ground Water
New York
John Zambrano, (518) 457-6997
10 mg/L
"NY State Ambient Water Quality Standards &Guidance Values & Groundwater EffluentLimitations."
Ohio
None- see web site in reference
10 mg/L
Rule 3745-300-08: "Generic Unrestricted Potable UseStandards" in accordance with Rule 3745-300-10 ofthe Administrative Code.http://www.epa.ohio.gov/derr/derrmain.html .
Oregon
Kari Salis, (503) 731-4312
10 mg/L Drinking water and gw standards are the same -10mg/L
B-2

Survey of Nitrate Ground Water (GW) Standards by State
All concentrations are measured as Nitrate - Nitrogen unless otherwise statedState and Name Standard References
Pennsylvania
Stuart Reese, (717) 772-4018
10 mg/L
Land Recycling & Environmental RemediationStandards Act. Subchapter C, Section 250.30 (3) (4) -MSCs for groundwater.http://www.dep.state.pa.us/dep/deputate/airwaste/wm/landrecycling/MANUAL/Manual.htm .
Rhode Island
Ernie Panciera, (401) 222-3961
10 mg/L
5 mg/L
For gw classified as dw (90% of the state), the MCLis 10 mg/L. There is also a preventive action limit of 5mg/L. "Rules and Regulations for GroundwaterQuality", Regulation 12-100-006.
South Carolina
Tom Knight, (803) 898-4251
10 mg/L
GW and dw are the same. "State Primary DrinkingWater Regulations"; R.61-58.
Tennessee
Tom Moss, (615) 532-0170
10 mg/L
Same as Federal dw standards; no separate gwstandards. "Maximum Contaminant Levels Under theTennessee Safe Drinking Water Act" , Rule 1200-5-1et al.
Vermont
David Allerton, (802) 241-3408
10 mg/L
Gw and dw standards are the same, which is the sameas the Federal MCL - 10 mg/L.
Virginia
Allen Hammer, (804) 786-1766
Applicable by Physiographic Province: 0.5 or 5 mg/L "Water Quality Standards" (9 VAC 25-260-5 et seq.).
B-3

APPENDIX C
Nitrogen Compound Contamination Examples

C-1
Nitrogen Compound Contamination Examples
State Arizona
City Contaminant Source Sample NO3 NH3 Total N Conc (ppm)
Ground Water Explosives 360
Ground Water Electronics 680
Surface Water Explosives Stream, Lake, 1100 Pond
Waste Explosives Waste 3470
State California
City Contaminant Source Sample NO3 NH3 Total N Conc (ppm)
Ground Water Unknown 1320
Ground Water Fertilizer Private Well 59
Ground Water Military Monitoring 140Well
Ground Water Unknown Monitoring 17Well
Ground Water Military 14
Soil Military 731
State Colorado
City Contaminant Source Sample NO3 NH3 Total N Conc (ppm)
Ground Water Chemical Monitoring 16Supplier Well
Ground Water Explosives Private Well 1500
State Florida
City Contaminant Source Sample NO3 NH3 Total N Conc (ppm)
Waste Landfill Waste 90
State Illinois
City Contaminant Source Sample NO3 NH3 Total N Conc (ppm)
Ground Water Landfill Private Well 12
Surface Water Nuclear Stream, Lake, 230 Pond
Surface Water Nuclear Stream, Lake, 70 Pond
Waste Nuclear Other Liquids 1980
State Iowa
City Contaminant Source Sample NO3 NH3 Total N Conc (ppm)
Ground Water Fertilizer Public/Munici 128pal Well
Ground Water Unknown Monitoring 353Well
Ground Water Landfill Monitoring 120Well

C-2
State Iowa (CONTINUED)City Contaminant Source Sample NO3 NH3 Total N Conc (ppm)
Site 1 Ground Water Fertilizer Monitoring 8200Sales Well
Site 1 Soil Fertilizer Soil Samples 570 850 1420Sales
Site 2 Ground Water Fertilizer Monitoring 460 1 461Sales Well
Site 2 Soil Fertilizer Soil Samples 1400 730 2130Sales
Site 3 Ground Water Fertilizer Monitoring 1100Sales Well
Site 3 Soil Fertilizer Soil Samples 680 1 681Sales
Site 4 Ground Water Fertilizer Monitoring 510 1600 2110Sales Well
Site 4 Soil Fertilizer Soil Samples 110 850 1960Sales
Site 5 Ground Water Fertilizer Monitoring 1390 5260 6650Sales Well
State Kansas
City Contaminant Source Sample NO3 NH3 Total N Conc (ppm)
Ground Water Unknown Monitoring 344Well
Ground Water Unknown Private Well 40
State Louisiana
City Contaminant Source Sample NO3 NH3 Total N Conc (ppm)
Ground Water Mining MonitoringWell
Surface Water Explosives Stream, Lake, Pond
State Michigan
City Contaminant Source Sample NO3 NH3 Total N Conc (ppm)
Ground Water Manufactur Monitoring 1250Well
State Minnesota
City Contaminant Source Sample NO3 NH3 Total N Conc (ppm)
Ground Water Education 18
State Montana
City Contaminant Source Sample NO3 NH3 Total N Conc (ppm)
Ground Water Unknown Private Well 31

C-3
State Nebraska
City Contaminant Source Sample NO3 NH3 Total N Conc (ppm)
Ground Water Medical 25Supply
Doniphan Ground Water Fertilizer Monitoring 1350 880 6950Sales Well
Doniphan Soil Fertilizer Soil Samples 19300 20000 79800Sales
Mitchell Ground Water Fertilizer Monitoring 3550 3950 7500Sales Well
Mitchell Soil Fertilizer Soil Samples 6600 13000 19600Sales
State New Jersey
City Contaminant Source Sample NO3 NH3 Total N Conc (ppm)
Ground Water Aerospace MonitoringWell
Waste Landfill Leachate 404
State New Mexico
City Contaminant Source Sample NO3 NH3 Total N Conc (ppm)
Ground Water Nuclear 219
Ground Water Mining 33
Surface Water Nuclear Stream, Lake, 35 Pond
Albuquerque Ground Residential/ Private Well 25Water Dairy
Albuquerque Ground Water Fertilizer Private Well 500Application
Fort Gallup Ground Water Munitions Monitoring 150Well
Hobbs Ground Water Explosives Monitoring 800 1100Well
Vado Ground Water Dairy Private Well 250 252
State New York
City Contaminant Source Sample NO3 NH3 Total N Conc (ppm)
Ground Water Landfill 14
Ground Water Landfill Monitoring 16Well
Ground Water Military Private Well 17
State North Dakota
City Contaminant Source Sample NO3 NH3 Total N Conc (ppm)
Bismarck Ground Water Agrichemical Monitoring 17400 17800 35200Supply Well
Enderlin Ground Water Agrichemical Monitoring 691 510Supply Well
Lidgerwood Ground Water Agrichemical Monitoring 476 109 585Supply Well
Lisbon Ground Water Agrichemical Monitoring 700Supply Well

C-4
State North Dakota (CONTINUED)City Contaminant Source Sample NO3 NH3 Total N Conc (ppm)
Oakes Ground Water Irrigation Lysimeters 150Impacts
Walhalla Ground Water Agrichemical Monitoring 1030 1380 2410Supply Well
State Ohio
City Contaminant Source Sample NO3 NH3 Total N Conc (ppm)
Ground Water Unknown 135
State Pennsylvania
City Contaminant Source Sample NO3 NH3 Total N Conc (ppm)
Ground Water Unknown Monitoring 524Well
State South Carolina
City Contaminant Source Sample NO3 NH3 Total N Conc (ppm)
Ground Water Manufactu- 40ing
Surface Water Chemical Stream, Lake, 80Supplier Pond
State South Dakota
City Contaminant Source Sample NO3 NH3 Total N Conc (ppm)
Ground Water Transpor- Private Well 99tation
State Texas
City Contaminant Source Sample NO3 NH3 Total N Conc (ppm)
Ground Water Explosives
State Utah
City Contaminant Source Sample NO3 NH3 Total N Conc (ppm)
Ground Water Military 31
Ground Water Smelter MonitoringWell
Ground Water Nuclear Monitoring 198Well
Ground Water Military 18
Surface Water Smelter Stream, Lake, Pond

C-5
State Washington
City Contaminant Source Sample NO3 NH3 Total N Conc (ppm)
Ground Water Nuclear Monitoring 559Well
Ground Water Mining Monitoring 121Well
State Wisconsin
City Contaminant Source Sample NO3 NH3 Total N Conc (ppm)
Ground Water Landfill Monitoring 1001Well

APPENDIX D
ITRC Work Team Contacts, ITRC Fact Sheet,ITRC Product List, and Document Evaluation Survey
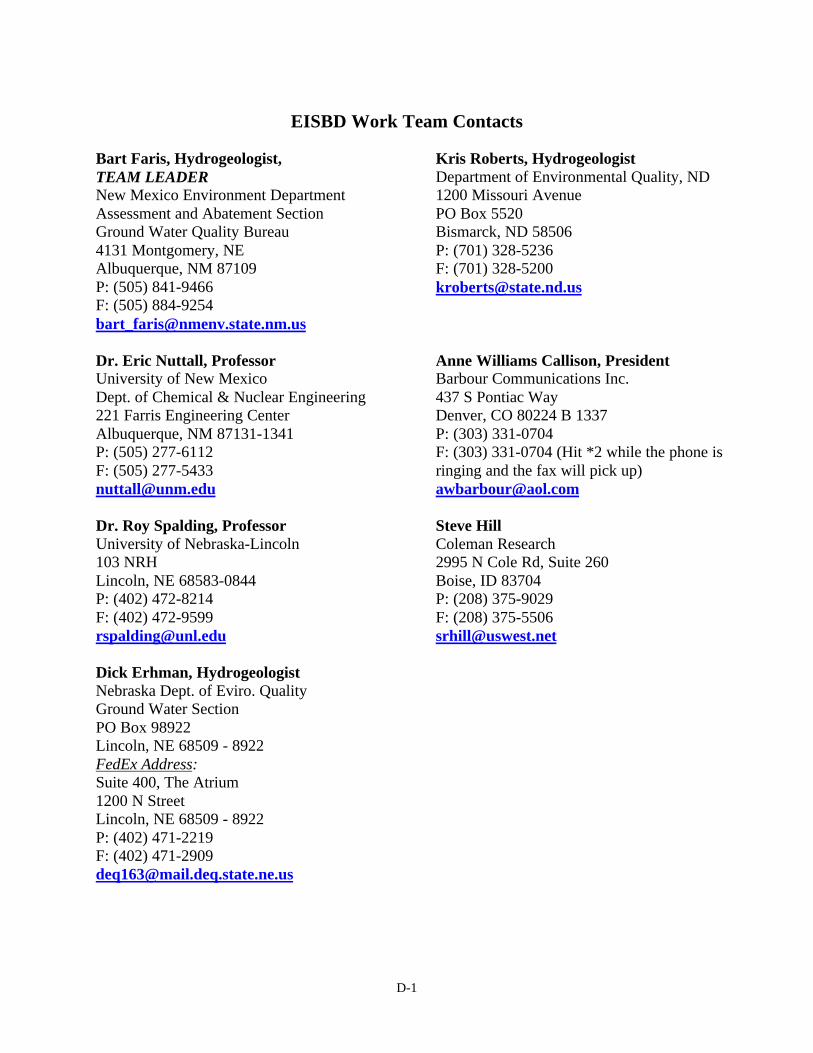
D-1
EISBD Work Team Contacts
Bart Faris, Hydrogeologist,TEAM LEADERNew Mexico Environment DepartmentAssessment and Abatement SectionGround Water Quality Bureau4131 Montgomery, NEAlbuquerque, NM 87109P: (505) 841-9466F: (505) [email protected]
Dr. Eric Nuttall, ProfessorUniversity of New MexicoDept. of Chemical & Nuclear Engineering221 Farris Engineering CenterAlbuquerque, NM 87131-1341P: (505) 277-6112F: (505) [email protected]
Dr. Roy Spalding, ProfessorUniversity of Nebraska-Lincoln103 NRHLincoln, NE 68583-0844P: (402) 472-8214F: (402) [email protected]
Dick Erhman, HydrogeologistNebraska Dept. of Eviro. QualityGround Water SectionPO Box 98922Lincoln, NE 68509 - 8922FedEx Address:Suite 400, The Atrium1200 N StreetLincoln, NE 68509 - 8922P: (402) 471-2219F: (402) [email protected]
Kris Roberts, HydrogeologistDepartment of Environmental Quality, ND1200 Missouri AvenuePO Box 5520Bismarck, ND 58506P: (701) 328-5236F: (701) [email protected]
Anne Williams Callison, PresidentBarbour Communications Inc.437 S Pontiac WayDenver, CO 80224 B 1337P: (303) 331-0704F: (303) 331-0704 (Hit *2 while the phone isringing and the fax will pick up)[email protected]
Steve HillColeman Research2995 N Cole Rd, Suite 260Boise, ID 83704P: (208) 375-9029F: (208) [email protected]