intra-eu labour mobility at a glance
TRANSCRIPT
Social Europe
Intra-EU Labour Mobility
at a glanceMain findings of the Annual Report on Intra-EU Labour Mobility 2020
ISSN 2600-2604
PDF ISBN 978-92-76-25494-2 ISSN 2600-2604 doi:10.2767/47577 KE-CB-20-001-EN-N
The reuse policy of European Commission documents is implemented by the Commission Decision 2011/833/EU of 12 December 2011 on the reuse of Commission documents (OJ L 330, 14.12.2011, p. 39). Except otherwise noted, the reuse of this document is authorised under a Creative Commons Attribution 4.0 International (CC-BY 4.0) licence (https://creativecommons.org/licenses/by/4.0/). This means that reuse is allowed provided appropriate credit is given and any changes are indicated.
For any use or reproduction of elements that are not owned by the European Union, permission may need to be sought directly from the respective rightholders.
cover: © Shutterstock
LEGAL NOTICE
The information and views set out in this document are those of the authors and do not necessarily reflect the official opinion of the European Union. Neither the European Union institutions and bodies nor any person acting on their behalf may be held responsible for the use which may be made of the information contained therein. More information on the European Union is available on the Internet (http://www.europa.eu).
Manuscript completed in December 2020
The European Commission is not liable for any consequence stemming from the reuse of this
publication. Luxembourg: Publications Office of the European Union, 2021
© European Union, 2021

Cata
logue n
um
ber

3
Context
The Commission publishes each year a Report on the intra-EU labour mobility which
provides updated information on labour mobility trends in EU and EFTA countries1.
The analysis covers the mobility of all working age EU citizens (20-64 years) as well
as the mobility of the EU citizens in this age group who are active (employed and
unemployed)2. The report also looks at indicators of economic integration of mobile citizens,
such as employment and unemployment rates, and occupations.
The two main data sources used are Eurostat population and migration statistics –
for mobility of all citizens – and the European Labour Force Survey (EU-LFS) for the
analysis of mobility of active citizens and economic integration. The most recent data
available is used, mainly from 2019 and in some cases 2018.
This document summarises the most relevant figures of labour mobility from the
2020 Report on intra-EU labour mobility. In line with the two specific chapters of this
year’s Report, it also contains findings on the “mobility of high-skilled workers” and on
“mobility and demographic change”. The impact of the COVID-19 pandemic on
labour mobility is not reflected in this report, since the data sources are from
2019/2018.
As the United Kingdom was a Member State of the European Union during the reporting
period, it is still included in the annual analysis. In addition, for key indicators, the values
for EU-27 are also provided.
Intra-EU mobility still rising, but at moderate pace
In 2019 intra-EU mobility continued to grow but at a slower pace than in the
previous years.
Composition of intra-EU mobility, 2019
Type of mobility 2019
EU-28
2018
EU-28
EU-28
change
2018/19
2019
from EU-28
to EU-27
2019
from EU-27
to EU-27
1. Long-term movers
according to Eurostat
demography statistics
all ages 17.9
million
17.5
million 1.8% 14.2
million
13.2
million
working age (20-64
years) 13
million
12.9
million 1.2% 10.4
million na
working age movers as
share of total working-
age population
4.3% 4.2% 0.1pps 3.9%
1 https://ec.europa.eu/social/main.jsp?catId=1282&langId=en 2 If not specifically mentioned as excluded the 2019/2018 figures also include UK movers

4
Type of mobility 2019
EU-28
2018
EU-28
EU-28
change
2018/19
2019
from EU-28
to EU-27
2019
from EU-27
to EU-27
2. Long-term movers
according to EU-LFS
working age (20-64
years) 11.9
million
11.6
million 2.4% 9.3
million
8.9
million
…of which active
movers (employed or
looking for work)
9.9
million
9.6
million 2.9% 7.6
million
7.3
million
active movers as share
of total labour force 4.2% 4.1% 0.1pps 3.7% 3.6%
3. Cross-border workers
(20-64 years) 1.5
million
1.5
million -0.6% 1.4
million
1.3
million
(as share of total employed
EU-28 citizens in the EU-
28)
0.6% 0.7% -0.1 0.7%
4. Number of postings (of
employed and self-
employed), all ages (no. of
PDs A1)
4.6
million
3
million
1.6
million na na
…equals approximate
number of persons 3.06
million
1.9
million
1.16
million na na
5. Annual return mobility
(20-64 years)3 738 000 723 000 2.1% 677 506 na
(as ratio to EU-28 nationals
leaving their country of
origin in the same year)
65% 72% -7pps 66% na
Mobility of EU citizens up by 1.2%
In 2019, there were 17.9 million EU-28 movers in the EU, out of which 13 million EU
movers of working age (20-64 years), according to Eurostat population statistics.
The stock of EU movers of working-age grew by 1.2% in 2018 - 2019, which is
substantially less than the 3.4% in 2017 - 2018.
3 Latest data available on flows is from 2018

5
EU-28 movers in EU-28 and EFTA countries in absolute numbers (1 000s) and as percentage of the total working-age population, 2019
SOURCE: EUROSTAT DATA ON POPULATION BY CITIZENSHIP AND AGE GROUP [MIGR_POP1CTZ] (EXTRACTED MAY 2020), MILIEU
CALCULATIONS.
The distribution of women and men among EU-28 movers remained at 51% women and
49% men, as in the previous two years.
The largest proportions of female movers are found in Greece (72%) and Italy (59%), while
males constitute the majority in Finland (65%), Sweden, and Czechia (55% for both).
Gender distribution of working age EU-28 movers, by country of destination (EU and EFTA), 2019
Source: EU-LFS 2019, special extractions provided by EUROSTAT, Milieu calculations.
0%
10%
20%
30%
40%
50%
60%
70%
80%
90%
100%
Males Females
6
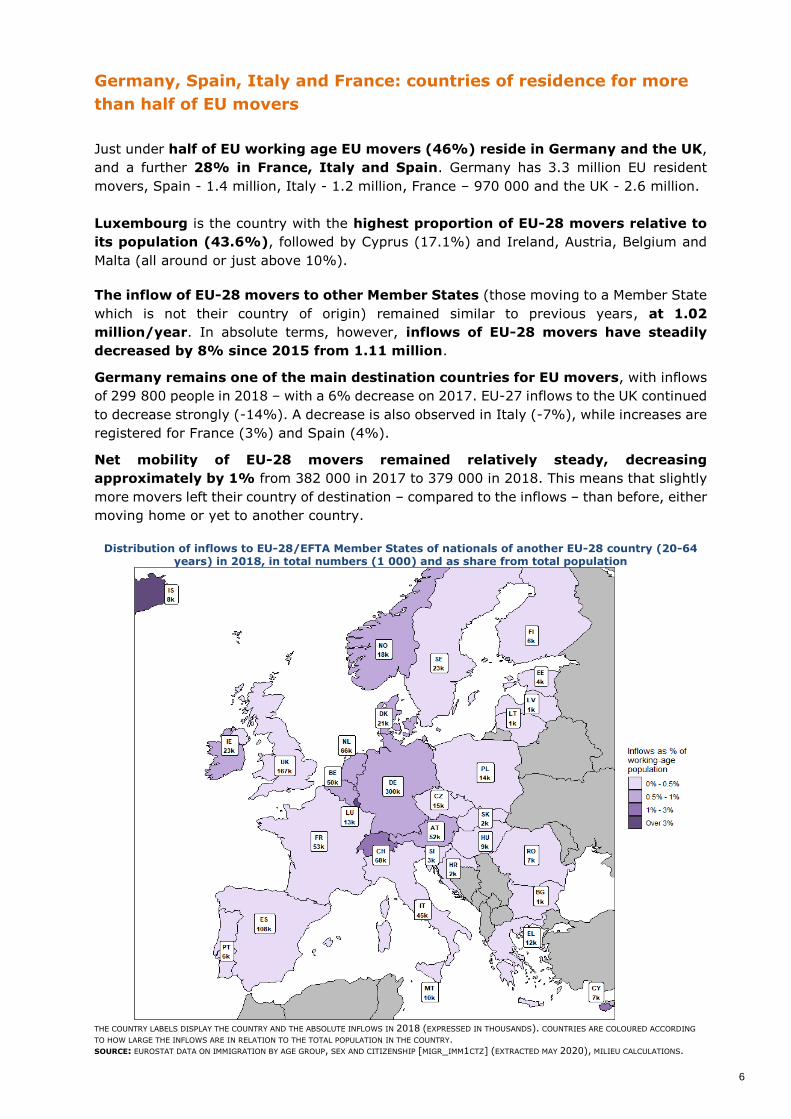
Germany, Spain, Italy and France: countries of residence for more
than half of EU movers
Just under half of EU working age EU movers (46%) reside in Germany and the UK,
and a further 28% in France, Italy and Spain. Germany has 3.3 million EU resident
movers, Spain - 1.4 million, Italy - 1.2 million, France – 970 000 and the UK - 2.6 million.
Luxembourg is the country with the highest proportion of EU-28 movers relative to
its population (43.6%), followed by Cyprus (17.1%) and Ireland, Austria, Belgium and
Malta (all around or just above 10%).
The inflow of EU-28 movers to other Member States (those moving to a Member State
which is not their country of origin) remained similar to previous years, at 1.02
million/year. In absolute terms, however, inflows of EU-28 movers have steadily
decreased by 8% since 2015 from 1.11 million.
Germany remains one of the main destination countries for EU movers, with inflows
of 299 800 people in 2018 – with a 6% decrease on 2017. EU-27 inflows to the UK continued
to decrease strongly (-14%). A decrease is also observed in Italy (-7%), while increases are
registered for France (3%) and Spain (4%).
Net mobility of EU-28 movers remained relatively steady, decreasing
approximately by 1% from 382 000 in 2017 to 379 000 in 2018. This means that slightly
more movers left their country of destination – compared to the inflows – than before, either
moving home or yet to another country.
Distribution of inflows to EU-28/EFTA Member States of nationals of another EU-28 country (20-64 years) in 2018, in total numbers (1 000) and as share from total population
THE COUNTRY LABELS DISPLAY THE COUNTRY AND THE ABSOLUTE INFLOWS IN 2018 (EXPRESSED IN THOUSANDS). COUNTRIES ARE COLOURED ACCORDING
TO HOW LARGE THE INFLOWS ARE IN RELATION TO THE TOTAL POPULATION IN THE COUNTRY. SOURCE: EUROSTAT DATA ON IMMIGRATION BY AGE GROUP, SEX AND CITIZENSHIP [MIGR_IMM1CTZ] (EXTRACTED MAY 2020), MILIEU CALCULATIONS.

7
Romania, Poland, Italy, Portugal and Bulgaria: countries of origin
for more than half of the EU movers
In 2019, over 50% of EU movers were Romanian, Polish, Italian, Portuguese or
Bulgarian citizens. Together they accounted for 6.9 million out of 11.9 million movers of
working age.
Looking at the 930 000 persons who moved in 2017 – 2018, the countries that saw most
nationals leave were Romania (163 000), Germany (161 000), UK (110 000), Poland
(106 000) and Italy (89 000). Of these, Romania and Poland’s outflows decreased most
compared to 2017 (-6% and -17%, respectively). Both countries already saw declining
outflows in 2017 compared to 2016, and the further decline in 2018 is another indicator for
the overall slow-down in growth of mobility.
Breakdown by citizenship of EU-28 movers (20-64 years) in EU-28, EFTA and in the top six countries of residence, 2019
SOURCE: EU-LFS 2019, SPECIAL EXTRACTIONS PROVIDED BY EUROSTAT, MILIEU CALCULATIONS.
The annual outflow rate for EU-28 citizens was at 0.3%, meaning that 3 out of 1 000 working
age citizens left their country of citizenship in 2018. However, outflow rates ranged from
less than 0.1% in Slovakia and Czechia to 1.4% in Romania and 1.3% in Lithuania.
BG
BG
BG
BG
BG
BG
DE
DE
DE
DE
DE
DE
DE
EL
FR
FR
FR
FR
FR
FR
FR
HR
IE
IT
IT
IT
IT
IT
IT
IT
IT
PL
PL
PL
PL
PL
PL
PL
PL
PL
PT
PT
PT
PT
PT
PT
PT
PT
RO
RO
RO
RO
RO
RO
RO
Others
Others
Others
Others
Others
Others
Others
Others
0% 10% 20% 30% 40% 50% 60% 70% 80% 90% 100%
CH
DE
ES
FR
IT
UK
EFTA
EU-27
EU-28

8
Outflow rate of nationals as a percentage of the population in their country of origin, by country of citizenship, 2018
SOURCE: EUROSTAT DATA ON EMIGRATION BY AGE GROUP, SEX AND CITIZENSHIP [MIGR_EMI1CTZ] (EXTRACTED MAY 2020), AND
DATA ON POPULATION ON 1 JANUARY BY AGE GROUP, SEX AND CITIZENSHIP [MIGR_POP1CTZ] (EXTRACTED MAY 2020), MILIEU
CALCULATIONS.
Net intra-EU mobility combines the flows of EU-28 and EFTA movers and nationals, so it
shows flows of EU citizens in general4. Germany, although also being an important country
of origin, still has the largest absolute net incoming mobility, followed by the Netherlands
and Spain. Spain has evolved from being a net sending country (in 2014) to become a net
destination country (in 2017).
For the UK and Italy, despite their importance as destination countries, large outflows of
nationals mean that their net mobility is either very low (UK) or negative (Italy). Note that
the UK saw a strong decrease in net mobility since 2015, when it had the second largest net
mobility after Germany. Poland and Romania are unsurprisingly net sending countries
(together with Italy).
Return mobility: for every three persons who leave, two return
The total number of returnees in 2018 was around 738 000, up 2.1% from the
previous year, and continuing a pattern of annual proportional increases since 2011.
In Romania (83%), Lithuania (56%) and Bulgaria (52%) return mobility
accounted for more than 50% of total inflows.
The share of those who returned compared to those who left in 2018 is 65%, meaning that
for every three persons who leave, two return.
4 However, it also includes the movement of EU citizens to and from third countries.
0,0%
0,5%
1,0%
1,5%
RO LT
HR
LV
IS
IE
EE
BG
LU
PL
CH SI
HU
BE
EFTA
NL
DE
EU
-27
DK
EU
-28 FI
UK
SE
MT
IT
ES
AT
NO
CZ
SK

9
Net mobility for nationals remained negative5 in most EU countries with the only exceptions
in 2018 being Malta, Hungary, Denmark, Estonia and Ireland.
Return mobility (inflows of nationals), 20-64 years, 2009-2018 (thousands)
2009 2010
2011
2012 2013 2014 2015 2016 2017 2018
EU-28
Total 627.7 607.3 596.1 642.8 617.3 640.9 622.7 663.5 722.6 738.5
Annual Δ -3.3% -1.8% 7.8% -4.0% 3.8% -2.8% 6.6% 8.9% 2.2%
EU-13
Total 266.7 236.2 239.0 292.0 268.4 265.1 228.5 240.3 267.8 256.6
Annual Δ -11.4%
1.2% 22.1% -8.1% -1.3% -13.8%
5.2% 11.5% -4.2%
EU-15
Total 361.0 371.1 357.0 350.8 348.8 375.9 394.2 423.2 454.7 481.8
Annual Δ 2.8% -3.8% -1.7% -0.6% 7.7% 4.9% 7.4% 7.4% 6.0%
SOURCE: EUROSTAT DATA ON IMMIGRATION BY AGE GROUP, SEX AND CITIZENSHIP [MIGR_IMM1CTZ] (EXTRACTED MAY 2020), MILIEU CALCULATIONS.
UK withdrawal from the EU has an impact on the figures on intra-
EU labour mobility
One event that will affect the shape and nature of intra-EU labour mobility in the near future
is that the freedom of movement of workers between the UK and the EU-27 will cease on
31 December 2020. The rights of the EU 27 citizens who already live and work in UK
and those UK citizens who live and work in EU 27 will be further protected, in line
with the provisions of the Withdrawal Agreement.
However, mobility to the UK has steadily decreased since the vote to leave the EU
in 2016, even with free movement still in place.
For the time being the UK is still a major destination country for EU-mobile workers. With
2.6 million mobile EU-27 workers, 1.2 million of them high-skilled, the UK is still the
country which ranges second in terms of welcoming mobile EU workers.
5 More nationals leave their country of origin than return to it.

10
Labour market integration of EU mobile workers further improves
The European Union Labour Force Survey indicates a figure of 11.97 million EU movers
of working age, out of which 9.9 million active movers in 2019 - an increase of 3% from
2018.
The active movers represent 4.2% of the total labour force in the EU-28 Member
States.
The main countries of residence of active movers were the same as those of all
movers, namely, Germany and the UK, with just over 2 million each, Spain and Italy, with
around 1 million each, and France, with around 600 000 active EU-28 movers. These five
Member States hosted close to 80% of active movers in 2019.
The Netherlands (8.8%), Spain (7.7%) and Austria (5.3%) saw significant growth
in stocks of active movers for the period 2018 - 2019.
Romania and Poland remained the most important countries of origin of active EU-
28 movers, together accounting for 39%.
Most common countries of origin of working age EU-28 active movers, 2019
FIRST NUMBER: SHARE FROM ALL ACTIVE MOVERS IN 2019; SECOND NUMBER: PERCENTAGE CHANGE FROM 2018) SOURCE: EU-LFS 2019, SPECIFIC EXTRACTIONS PROVIDED BY EUROSTAT, MILIEU CALCULATIONS.
EU movers are more likely to be employed than local citizens. In 2019, the
employment rate of EU-movers was 78%, compared to 75% for nationals.
However, EU-28 movers also had a slightly higher unemployment rate (7%) than
nationals (6%). The gap was particularly large in Italy (EU-28 movers: 14%; nationals:
9%) where unemployment among EU-28 movers was the second highest EU-wide. It was
by far the highest in Greece, both among EU-28 movers (25%) and nationals (17%).
PT 7%;(-1%)
IT 8%;(+6%)
PL 16%;(+4%)
RO 23%;(+5%)
Other 27%;(+3%)
EU-28 total (100%):
9.9 million

11
Trend in employment (ER) and unemployment rates (UR) for EU-28 movers and nationals, 2011-2019
SOURCE: EU-LFS 2019, SPECIFIC EXTRACTIONS PROVIDED BY EUROSTAT, MILIEU CALCULATIONS.
The main sectors of economic activity for EU-movers in 2019 were manufacturing
and wholesale and retail trade, employing 15% and 12% of EU-28 movers, respectively,
and 16% and 13% of nationals. Among EU-28 movers, manufacturing has retained that
position since 2008.
Sectors that, over the past 10 years, have seen the most changes in employment of EU-28
movers are construction and activities of households as employers – both decreased in
importance, although construction remains the third largest sector, employing 10% of
movers. Transport and storage continuously increased in importance since 2012 and in 2019
employed 7% of movers.
Sectors of activity among EU-28 movers and nationals (20-64 years), EU-28 aggregate, as shares of all sectors, 2019
SOURCE: EU-LFS 2019, SPECIFIC EXTRACTIONS PROVIDED BY EUROSTAT, MILIEU CALCULATIONS.
TOTALS EXCLUDE MOVERS BORN IN THEIR COUNTRY OF RESIDENCE.
0%
2%
4%
6%
8%
10%
12%
14%
16%
64%
66%
68%
70%
72%
74%
76%
78%
80%
2011 2012 2013 2014 2015 2016 2017 2018 2019
ER: Nationals
ER: EU-28 (excl. born incountry)
UR: Nationals
UR: EU-28 (excl. born incountry)
0% 5% 10% 15% 20%
Manufacturing
Wholesale and retail trade
Construction
Accomodation and food service activities
Human health and social work activities
Administrative and support service activities
Transportation and storage
Professional, scientific and technical activities
Education
Information and communication
Activities of households as employers
Other service activities
Agriculture
Financial and insurance activities
Arts
Public administration and defence
EU-28 Nationals

12
Slightly less cross-border workers in 2019 than in 2018
The number of cross-border workers in EU and EFTA countries increased by 0.9% between
2018 and 2019 and reached 1.89 million. Nevertheless, the cross-border mobility between
EU-28 countries - 1.5 million in 2018 - decreased by 0.6% between 2018 and 2019.
The decrease was slightly larger in the EU-27, with 0.8% fewer than in 2018. This was
largely due to a decrease of 3% in cross-border workers working in Germany, the
largest country of work.
(National) Cross-border workers and EU-28 movers as % of all employed nationals, by country of origin, 2019
SOURCE: EU-LFS 2019, SPECIFIC EXTRACTIONS PROVIDED BY EUROSTAT, MILIEU
The main countries of residence of cross-border workers working either in another EU
Member State or an EFTA country were: France (398 000), Germany (234 000) and Poland
(222 000).
The main countries of work were Germany (396 000) and Switzerland (381 000),
Luxembourg (190 000), Austria (177 000) and the Netherlands (116 000).
Increased mobility of high-skilled workers
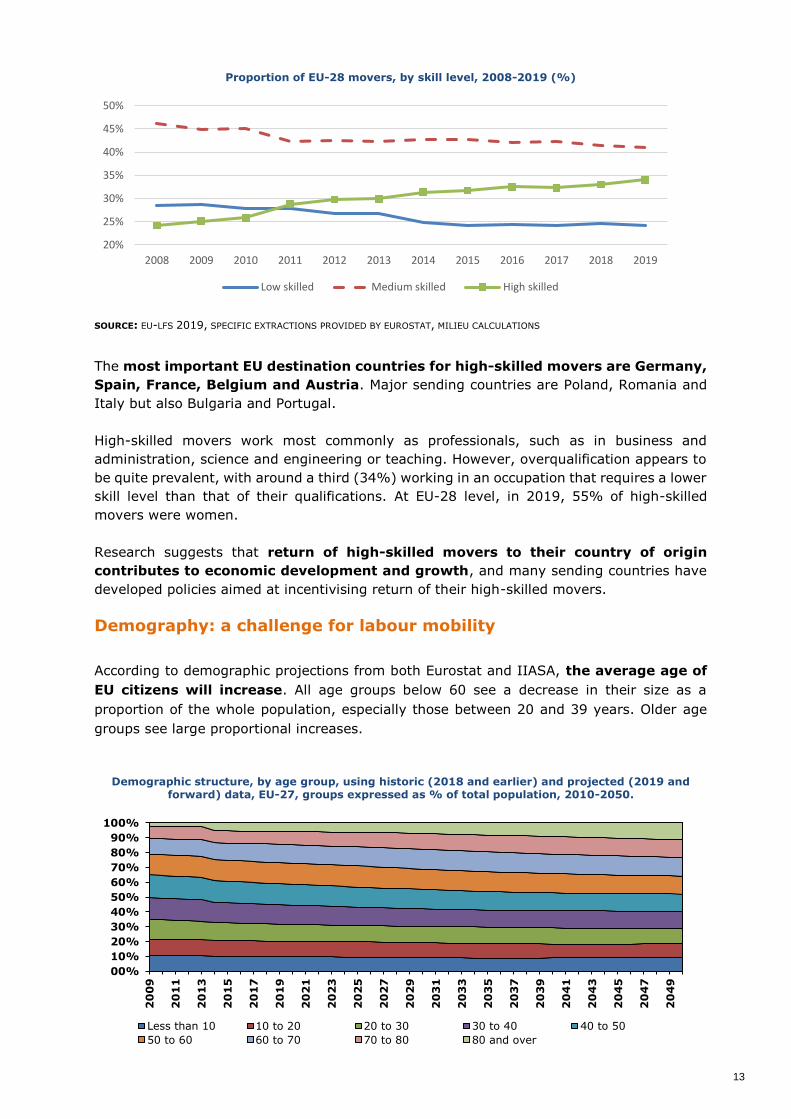
The share of highly educated movers increased by 4 percentage points between 2011
and 2019, so that by now more than a third of the movers are highly educated, whereas the
share of low educated decreased by 4 percentage points, to below a quarter of all movers.
Medium educated movers remained the largest group with more than 40% of all movers.
The share of movers with a high education level increased in most destination Member
States for which reliable data are available, except Germany and Portugal. Italy remained
the country with substantially the lowest share of highly educated movers, who make up
only 13%. Portugal had the EU’s highest share of low-educated movers (37%).
Mobility of high-skilled persons is associated with the circulation of knowledge and
contributes to the EU’s objective of the development of the knowledge-based economy.
0%
2%
4%
6%
8%
10%
12%
14%
16%
18%
20%
EU-28 movers Cross-border workers
13
Proportion of EU-28 movers, by skill level, 2008-2019 (%)
SOURCE: EU-LFS 2019, SPECIFIC EXTRACTIONS PROVIDED BY EUROSTAT, MILIEU CALCULATIONS
The most important EU destination countries for high-skilled movers are Germany,
Spain, France, Belgium and Austria. Major sending countries are Poland, Romania and
Italy but also Bulgaria and Portugal.
High-skilled movers work most commonly as professionals, such as in business and
administration, science and engineering or teaching. However, overqualification appears to
be quite prevalent, with around a third (34%) working in an occupation that requires a lower
skill level than that of their qualifications. At EU-28 level, in 2019, 55% of high-skilled
movers were women.
Research suggests that return of high-skilled movers to their country of origin
contributes to economic development and growth, and many sending countries have
developed policies aimed at incentivising return of their high-skilled movers.
Demography: a challenge for labour mobility
According to demographic projections from both Eurostat and IIASA, the average age of
EU citizens will increase. All age groups below 60 see a decrease in their size as a
proportion of the whole population, especially those between 20 and 39 years. Older age
groups see large proportional increases.
Demographic structure, by age group, using historic (2018 and earlier) and projected (2019 and forward) data, EU-27, groups expressed as % of total population, 2010-2050.
20%
25%
30%
35%
40%
45%
50%
2008 2009 2010 2011 2012 2013 2014 2015 2016 2017 2018 2019
Low skilled Medium skilled High skilled
00%
10%
20%
30%
40%
50%
60%
70%
80%
90%
100%
20
09
20
11
20
13
20
15
20
17
20
19
20
21
20
23
20
25
20
27
20
29
20
31
20
33
20
35
20
37
20
39
20
41
20
43
20
45
20
47
20
49
Less than 10 10 to 20 20 to 30 30 to 40 40 to 50
50 to 60 60 to 70 70 to 80 80 and over

14
BOTH HISTORIC AND PROJECTED POPULATIONS INCLUDE TCNS. AS EUROSTAT PROJECTIONS CANNOT BE FILTERED BY CITIZENSHIP, THESE ARE ALSO INCLUDED IN PRE-2019 DATA TO FACILITATE COMPARISON.
SOURCE: EUROSTAT (EXTRACTED JUNE 2020), MILIEU CALCULATIONS.
Persons are most likely to move at the beginning of their careers, and the
likelihood of moving decreases with age. Throughout the past decade, in all major
sending countries, people aged 20 to 29 and 30 to 39 have had higher annual outflow rates
than other age groups. Among those who strongly intend to move, 75% are below 35 years
old.
With the younger population also declining in sending countries, this could imply a decrease
in mobility flows. However, population ageing may have effects on important drivers on
EU mobility, such as adverse effects on economic convergence, increased demand in the
healthcare sector and for a female workforce, which may counteract this decrease in mobility
flows.

GETTING IN TOUCH WITH THE EU
In person
All over the European Union there are hundreds of Europe Direct information centres. You can find the address of the centre nearest you at: https://europa.eu/european-union/contact_en
On the phone or by email
Europe Direct is a service that answers your questions about the European Union. You can contact this service:
– y freephone: 00 800 6 7 8 9 10 11 (certain operators may charge for these calls),
– at the ollowing standard number: +32 22999696 or
– y email via: https://europa.eu/european-union/contact_en
FINDING INFORMATION ABOUT THE EU
Online
Information about the European Union in all the official languages of the EU is available on the Europa website at: https://europa.eu/european-union/index_en
EU publications
You can download or order free and priced EU publications at: https://publications.europa.eu/en/publications. Multiple copies of free publications may be obtained by contacting Europe Direct or your local information centre (see https://europa.eu/european-union/contact_en).
EU law and related documents
For access to legal information from the EU, including all EU law since 1952 in all the official language versions, go to EUR-Lex at: http://eur-lex.europa.eu
Open data from the EU
The EU Open Data Portal (http://data.europa.eu/euodp/en) provides access to datasets from the EU. Data can be downloaded and reused for free, both for commercial and non-commer-cial purposes.
