intragenerational deliberation and intergenerational …intragenerational deliberation is known to...
TRANSCRIPT
Social Design Engineering Series SDES-2019-14
Intragenerational deliberation and intergenerational sus-tainability dilemma
Raja R TimilsinaResearch Institute for Future Design, Kochi University of Technology
Koji KotaniSchool of Economics and Management, Kochi University of TechnologyResearch Institute for Future Design, Kochi University of Technology
Yoshinori NakagawaSchool of Economics and Management, Kochi University of TechnologyResearch Institute for Future Design, Kochi University of Technology
Tatsuyoshi SaijoResearch Institute for Humanity and NatureSchool of Economics and Management, Kochi University of TechnologyResearch Institute for Future Design, Kochi University of Technology
13th December, 2019
School of Economics and ManagementResearch Institute for Future DesignKochi University of Technology

KUT-SDE working papers are preliminary research documents published by the School of Economics and Management jointly with the ResearchCenter for Social Design Engineering at Kochi University of Technology. To facilitate prompt distribution, they have not been formally reviewedand edited. They are circulated in order to stimulate discussion and critical comment and may be revised. The views and interpretations expressedin these papers are those of the author(s). It is expected that most working papers will be published in some other form.
Intragenerational deliberation and intergenerationalsustainability dilemma
Raja R Timilsina*,† Koji Kotani*,†,‡,§,¶ Yoshinori Nakagawa*,†
Tatsuyoshi Saijo*,†,‡,||
December 12, 2019
Abstract
Many environmental problems have occurred because the current generation affects futuregenerations, but the opposite is not true. This one-way nature induces the current generationto take advantage of resources without considering future generations, which we call “inter-generational sustainability dilemma (ISD).” While deliberation is known to bring a changein individual opinions and lead to a better decision in some intragenerational problems, littleis known about how “intragenerational deliberation” affects individual opinions and collec-tive decisions for “intergenerational problems such as ISD” in societies. To this end, an ISDgame (ISDG) along with interviews and questionnaires are instituted in rural and urban ar-eas of Nepalese societies. In ISDG, a sequence of six generations, each of which consists ofthree people, is organized, and each generation chooses either to maintain intergenerationalsustainability (sustainable option) or to maximize her own generation’s payoff by irreversiblyimposing a cost on future generations (unsustainable option) under intragenerational “deliber-ative” process. Our result demonstrates that urban subjects have a wider variety of individualinitial opinions and support an unsustainable option more often than do rural subjects. It alsoshows that individual opinions change through deliberation when subjects in a generation donot share the same initial opinion, reflecting that more urban subjects change opinions; suchopinion changes are identified not to work in the direction to enhance intergenerational sustain-ability for the urban generations. Overall, our experiment suggests that a closely-knit societysuch as rural areas in Nepal is a hope, and intragenerational deliberation neither effectivelyaffect individual opinions for intergeneration sustainability nor resolve ISD.
Key Words: Intergenerational sustainability dilemma; deliberative process; opinion change
*Research Institute for Future Design, Kochi University of Technology†School of Economics and Management, Kochi University of Technology‡Urban Institute, Kyusyu University§College of Business, Rikkyo University¶Corresponding author, E-mail: [email protected]||Research Institute for Humanity and Nature
1
ContentsNomenclature 2
1 Introduction 3
2 Methods and materials 72.1 Study areas . . . . . . . . . . . . . . . . . . . . . . . . . . . . . . . . . . . . . . 72.2 Experimental setup . . . . . . . . . . . . . . . . . . . . . . . . . . . . . . . . . . 82.3 Experimental procedure . . . . . . . . . . . . . . . . . . . . . . . . . . . . . . . . 13
3 Results 16
4 Discussion and conclusion 23
5 References 27
List of Figures 34
List of Tables 38
NomenclatureIFG Imaginary future generation
ISD Intergenerational sustainability dilemma
ISDG Intergenerational sustainability dilemma game
NPR Napalese rupee
SVO Social value orientation
VDC Village development committee
2
1 Introduction1
What the current generation does affects future generations, but the opposite is not true. This2
one-way nature induces the current generation to take advantage of resources without fully con-3
sidering future generations, which we call the “intergenerational sustainability dilemma (ISD),”4
and it is claimed to be a cause of many important problems (Kamijo et al., 2017, Shahrier et al.,5
2017, Nakagawa et al., 2019). Intergenerational problems have occurred, such as climate change,6
resource depletion, biodiversity loss and long-term governmental debts. However, neither market7
nor democracy is known to be future-oriented, and it has been pointed out that these institutions8
favor the current generation maximizing her benefits (Pigou, 1952, Krutilla, 1967, Garri, 2010,9
Thompson, 2010). Intragenerational deliberation is known to bring changes in individual opin-10
ions and to lead to a better decision in some setting of intragenerational problems (Joseph, 1994,11
Ostrom, 1990, Ghate et al., 2013, Konrad and Thum, 2018). However, little is known about how12
“intragenerational deliberation” can be effective to affect individual opinions and collective deci-13
sions for solving “intergenerational problems” such as ISD in societies.14
The fundamental nature of the sustainability problems can be characterized by ISD. Economic15
literature defines sustainability as a minimum condition to be satisfied, that is, maintaining the16
welfare of successive generations, as compared with the current generation (Dasgupta and Mitra,17
1983, Howarth and Norgaard, 1993, Weitzman, 1997). However, many significant social problems18
have occurred because societies violate the minimum condition of sustainability in which the cur-19
rent generation prioritizes her benefit and leave more burdens on future generations. There is a20
severe threat of global climate change and outstanding governments’ debts in some countries that21
takes more than 100 years to repay (Hansen and Imrohoroglu, 2016). The coastal communities are22
predicted to suffer from a sea-level rise of 2m by 2100, and it is reported that the rise is due to high23
greenhouse gas emission the current generation cast, leaving huge burdens on many unseen future24
generations (Bamber et al., 2019). Such intergenerational problems can be well represented to oc-25
cur among non-overlapping generations in a long-run perspective.1 Therefore, this paper addresses26
1Schotter and Sopher (2003, 2006, 2007), Chaudhuri and Paichayontvijit (2006) and Chaudhuri et al. (2009) use
3

the ISD problem under non-overlapping generations by conducting framed field experiments.27
Over the last decade, several studies have used an experimental approach to examine people’s28
preferences and behaviors regarding intergenerational sustainability. Fisher et al. (2004) show that29
people become less motivated to exploit resources owing to the existence of an “intergenerational30
link” in an intergenerational common pool experiment. Hauser et al. (2014) demonstrate that31
democracy or majority voting tends to promote sustainability of intergenerational goods when a32
majority of people are prosocial. Sherstyuk et al. (2016) analyze the level of difficulties in main-33
taining dynamic externality by implementing laboratory experiments of a dynamic game under34
two types of settings: (i) infinitely living decision makers and (ii) multiple generations. They find35
that strategic uncertainty makes it difficult to retain dynamic externalities. Kamijo et al. (2017) de-36
sign and implement a laboratory experiment of ISD game (ISDG) with a subject pool of university37
students by introducing the treatment of “imaginary future generation (IFG)” as negotiators for38
future generations, claiming that the negotiators improve intergenerational sustainability. Shahrier39
et al. (2017) conduct ISDG field experiments with the subject pool of general people and analyze40
generation decisions in urban and rural areas of Bangladesh. They find that rural people are more41
prosocial and choose a sustainable option more often than urban people.2 Fochmann et al. (2018)42
find that subjects are prudent and fair for an intrageneration allocation, but show fewer concerns for43
intergenerational fairness in a laboratory experiment. They also claim that the current generation44
maximizes her payoff through shifting the burden of debts to future generations.45
Many political scientists and psychologists have studied deliberation to understand processes of46
collective decisions making (Rawls, 1993, Chambers, 2003, Niemeyer and Dryzek, 2007).3 Several47
experimental games in which the current generation is incentivized to give advice to subsequent generations for theirbetter choices and the possibility of Pareto improvement mostly exists. More specifically, the current generation’s pay-off depends on subsequent generations’ actions (or performances) as if the relation is between parents and children.Schotter and Sopher (2003, 2006, 2007), Chaudhuri and Paichayontvijit (2006) and Chaudhuri et al. (2009) refer thistype of overlapping generational situations to as “intergenerational setting,” and address the roles of social learningthrough advice over generations. However, in ISD, our focus is on addressing sustainability for long-run relation-ship across generations as if they are non-overlapping, and such long-run sustainability problems are exemplified byemergence of global climate change, various environmental problems and government debts as mentioned earlier.
2Shahrier et al. (2017) also seek to confirm whether or not the IFG proposed by Kamijo et al. (2017) enhancesintergenerational sustainability, demonstrating that the IFG is not effective.
3The popular decision-making mechanisms by groups in experiments are majority voting and unanimity (See, e.g.,Denant-Boomont et al., 2017). An exception is Gerardi and Yariv (2007) that implement a “deliberative majority
4
experimental studies, such as Simon and Sulkin (2002), have analyzed the role of deliberation in48
relation to equity and sociodemographic backgrounds, concluding that deliberative discussion can49
bring about fair and equitable outcomes for intragroup members. Goeree and Yariv (2011) also50
conduct deliberation experiments under different institutions of majority and unanimity, reporting51
that deliberation promotes fair outcomes across the institutions. Ban et al. (2012) use field data52
from south India, suggesting that, even in heterogeneous societies, deliberation is important in that53
it can induce long-term agreement about priorities of providing several public goods. List et al.54
(2013) analyze deliberative data, showing that deliberation can help resolve the salient issues.55
Overall, theories and empirical studies suggest that deliberation is effective in many collective56
decision environments.57
Group behaviors have been intensively studied to understand how communication influences58
people’s behaviors through social interactions (Dawes et al., 1977, Isaac and Walker, 1988, Born-59
stein and Ben-Yossef, 1994, Kugler et al., 2012, Charness and Sutter, 2012, Cooper and Kuhn,60
2016, Meub and Proeger, 2017, Crawford and Harris, 2018, Carbone et al., 2019, Vollstadt and61
Bohm, 2019). Intragroup communication makes groups more competitive and self-regarding in62
a socioeconomic context such as market competition, tournament and bargaining (Kugler et al.,63
2012, Charness and Sutter, 2012). Cason and Mui (1997) use a dictator game allowing for intra-64
group face-to-face communication in a non-competitive and non-strategic environment, and claim65
that such communication induces intergroup fairness. On the other hand, Luhan et al. (2009) con-66
duct a dictator game to re-examine group behaviors by letting subjects to make not only individual67
but also group decisions using electronic chats as a medium of communication. They find that68
groups are more selfish than individuals, and the most selfish group member has the strongest69
influence on group decisions.4 Overall, how intragroup (intrageneration) face-to-face communica-70
tion (deliberation) affects intergroup (intergenerational) fairness in economic decision-making is71
voting” rule to understand coordination in a group decision. They identify that it eliminates some possible outcomesand does not necessarily lead to a better decision.
4Numerous experimental studies have used simple distribution games or dictator games to confirm an existence ofpeople’s concerns toward others, such as altruism, empathy and fairness, finding that people do not selfishly behaveby giving a substantial share to others in such games (Fehr, 1999, Fehr and Gachter, 2000, Fischbacher et al., 2001,Charness and Rabin, 2002, Engelmann and Strobel, 2004).
5
an important area to be explored and analyzed.572
Irrespective of types of governance, institutions and societies, whether people care about oth-73
ers or future generations depends on the degrees of prosociality, trust and fairness, which are74
affected by the cultural and economic environment (Ockenfels and Weimann, 1999, Henrich et al.,75
2005, Wilson et al., 2009, Henrich et al., 2010a, Brosig-Koch et al., 2011, Leibbrandt et al., 2013,76
Shahrier et al., 2017). Furthermore, as societies become more capitalistic and competitive, the77
current generation tends to become more proself, compromising sustainability (Fisher et al., 2004,78
Shahrier et al., 2016, 2017, Timilsina et al., 2017). Although social devices such as communica-79
tion, discussion and deliberation in collective decision-making are demonstrated to resolve some80
class of intragenerational problems on not only social but also economic issues, such as prisoner’s81
dilemma, public goods provision and common pool resource utilization (Cardenas, 2000, Cardenas82
et al., 2000, Cason et al., 2012, Ghate et al., 2013), little is known about how “intragenerational83
deliberation” affects individual opinions and collective decisions for “intergenerational problems”84
such as ISD in societies.85
We design and institute a series of new procedures for the ISDG field experiments to examine86
whether and how deliberation changes individual opinions and hence resolves ISD in fields. In87
ISDG, we organize a sequence of six generations, each of which consists of three subjects, and88
each generation is asked to decide between maintaining intergenerational sustainability (sustain-89
able option) and maximizing its own generation’s payoff by irreversibly imposing a cost on future90
generations (unsustainable option) through deliberative discussion. As a new element of our ISDG91
experimental design, we conduct individual interviews after subjects finish making their genera-92
tion’s decision. In the interviews, we elicit each subject’s “individual initial opinion” about which93
option she supported before and “individual final opinion” after her generation’s deliberation as a94
personal opinion, respectively. This interview process enables us to clarify whether each subject95
5An important area of investigation in economics is how intragroup interactions affect intergroup economic out-comes to resolve some dilemmas and it has a long-term impact (Hauge et al., 2019, Brandon et al., 2019, Kotchen andSegerson, 2019, Tilman et al., 2019). The past literature has shown that social interactions influence group choices.Building upon these studies, our ISDG experiments are designed for the purpose of understanding and exploring howintragroup (intragenerational) face-to-face communication can be effective for intergroup (intergenerational) fairnessas discussed in Engelmann and Strobel (2004).
6
changes her opinions over a course of deliberation. To generalize and better characterize the role96
of deliberation on ISD in real fields, we conduct our experiment along with a questionnaire sur-97
vey for sociodemographic and psychological information in both rural and urban areas of Nepal.698
With this approach, this paper seeks to answer the following open questions: (i) Does intragenera-99
tional deliberation change individual opinions of rural and urban subjects for an intergenerational100
problem such as ISD in a different manner? (ii) Do such changes in individual opinions induce101
generations to resolve ISD in each society?102
2 Methods and materials103
2.1 Study areas104
We conduct the experiments in two kinds of Nepalese fields: (i) urban areas, such as Kath-105
mandu, Lalitpur, Bhaktapur and Pokhara city, and (ii) rural areas of several traditional villages106
from Prabhat and Chitwan districts. Both areas are almost homogeneous in terms of culture, lan-107
guage and religion. The urban areas usually have the highest human development index (HDI)108
on the basis of UNDP (2014), and the population density is high. For instance, Kathmandu has109
a population density of 4416 people per km2 (Central Bureau of Statistics, 2011) and is the most110
crowded city, with 24.3% of the total urban population in Nepal. Big cities such as Kathmandu111
and Pokhara are the centers for businesses and services. The rural areas consist of different vil-112
lages of the Western Hills and Central Terai, such as the Prabhat and Chitwan districts (figure 1).113
The population densities of Chitwan and Prabhat are 261 people per km2 and 297 people per km2,114
respectively (Central Bureau of Statistics, 2011). All of these villages are agrarian societies, and115
the dwellers engage in farming generation after generation. A limited number of businesses and116
services, typically small-scale ones, are available.117
6Henrich et al. (2001) and Fehr and Leibbrandt (2011) demonstrate that observations of any economic decision inexperiments tend to reflect naturally occurring situations or vice versa. In this sense, this experimental framework inrural and urban areas can be considered a useful building block to understand and clarify whether there are differencesacross people’s opinions regarding ISD in various societies.
7

[Figure 1 about here.]118
2.2 Experimental setup119
We conduct an intergenerational sustainability dilemma game (ISDG), an individual interview,120
a social value orientation (SVO) game and questionnaire surveys to obtain critical thinking dispo-121
sition and sociodemographic data in the field.122
Intergenerational sustainability dilemma game and deliberation123
The ISDG is implemented following the laboratory and field experiments in Kamijo et al.124
(2017) and Shahrier et al. (2017). Building upon these previous ISDG experiments, we add a125
new element of individual interviews to the experimental design, the details of which shall be126
discussed later. Three subjects in a group are called a generation, and each generation needs to127
choose between options A and B. The generation receives a payoff of X by choosing option A128
and the payoff X − 300 by choosing option B. After making a choice between options A and129
B, the generation is asked to split the payoff associated with the option they choose among the130
generation members. Each of the subject’s payoffs in ISDG is the sum of their generation share131
plus the initial experimental endowment of 300. For instance, by choosing A, the generation earns132
1200 experimental points (X = 1200), whereas by choosing B, the generation earns 900 points133
(= X − 300 = 1200− 300). Consequently, if members of this generation split the payoff equally134
among them, each member earns 400 by choosing A and 300 by choosing B as a generation share.135
Therefore, the total payoff of each subject with generation choice A becomes 700 (= 400 + 300),136
whereas it becomes 600 (= 300 + 300) with generation choice B.137
Each generation is allowed to deliberate over the decision between options A and B as well as138
how to split the generation payoff up to 10 minutes of discussion. However, when the decisions139
cannot be made within 10 minutes, the following rules have been applied, (1) if the generation share140
the group receives is positive, each member receives an initial endowment of 300 only, (2) if the141
8
generation share the group receives is negative, say, −Z, each member equally splits −Z by three142
and receives the payment of −Z/3 plus an initial endowment of 300 (See a supplementary material143
of experimental instructions for the details). After the generation decision between A and B, each144
subject undergoes an individual interview in which she is asked to state her “individual initial145
opinion” and “individual final opinion” regarding supporting A or B. This individual interview is146
a new element compared to the preexisting ISDG experiments in Kamijo et al. (2017) and Shahrier147
et al. (2017), clarifying how an individual opinion changes over a course of deliberation and the148
role of deliberation for affecting individual opinions.149
Each session consists of 18 ∼ 24 subjects, organizing a sequence of 6 ∼ 8 generations. Each150
generation is randomly assigned to one of the 1st, 2nd, . . . and 6th generations. When the num-151
ber of subjects that participated in a session are 21 or 24, we organize 7th and even 8th genera-152
tions. However, they are assigned as 1st and 2nd in another sequence of generations as indicated153
in figure 3. One generation’s decision affects the subsequent generations such that subsequent154
generations’ payoffs decreases uniformly by 300 when the current generation chooses option A,155
otherwise not. For instance, suppose that X = 1200 and the 1st generation chooses A. Then,156
the 2nd generation will face a game in which they can receive 900 and 600 by choosing A and157
B, respectively. However, if the 1st generation chooses B, the next generation can have the same158
decision environment as the 1st generation faced. That is, when the 1st generation chooses B,159
the 2nd generation can have the game in which they can receive 1200 and 900 by choosing A and160
B, respectively. Following the same rule, the game continues for the rest of the subsequent two161
generations (i.e., between ith and i+ 1th generations). Hence, option B can be considered a “sus-162
tainable option,” whereas option A is the choice that compromises intergenerational sustainability163
and can be considered as an “unsustainable option.” In each session, the 1st generation starts ISDG164
with X = 1200, implying that the 5th and 6th generations may face the game in which options165
A and B are associated with payoffs of zero and −300, respectively, when previous generations166
keep choosing option A.7 In ISDG, the subjects are paid 550NPR (≈ 5.50USD) at maximum and167
7When the 5th and 6th generations face the game in which options A and B are associated with zero or a negativepayoff of −300, the generation members can refund themselves equally from their initial endowment of 300 to make
9
350NPR (≈ 3.50USD) on average (The NPR stands for Nepalese rupees).168
Individual interviews169
An individual interview is conducted for each subject after her generation decides between170
options A and B in ISDG. In this interview, we investigate the patterns of the shift in individual171
opinions to have supported A, B or to have been ambivalent (no ideas) coded as N as her “individ-172
ual initial opinion” and “individual final opinion” before and after the deliberation, respectively.173
Each subject is asked to answer whether she supported A, B or N and the associated reasons “be-174
fore and after” a course of deliberation. The interviewers ask questions such as (1) “your personal175
opinion might have been different from the group decision. At the moment of the group decision,176
what did you really want to support as your personal opinion?” for her “individual final opinion”177
and the corresponding reasons and (2) “Before the group deliberation started, what did you re-178
ally support as your personal opinion?” for her “individual initial opinion” and the corresponding179
reasons.180
The individual interviews successfully identify whether each subject changes her individual181
opinion to have supported A, B and/or N through deliberation. For instance, some subject is182
recognized to have supported A as her “individual initial opinion” before deliberation but to have183
ended up supportingB as her “individual final opinion” after deliberation. In this case, her opinion184
change is coded as AB, where the first letter represents her initial personal support for A before185
deliberation and the second letter does her final personal support for B after deliberation. In the186
same manner, we identify and code subjects’ opinion changes through individual interviews, and187
the possible combinations of opinion changes areAA,AB,AN,BA,BB,BN,NA,NB andNN .188
With this information about individual opinion changes before and after deliberation, we can also189
identify whether each generation has a unanimous opinion agreement to decide between options A190
and B before and after deliberation.8191
the individual payoff be at least zero.8An alternative way to collect the same data of individual opinions is to incentivize or to ask each subject to
reveal their opinions to support A, B and N in a timely manner, i.e., each subject is asked to reveal an “individualinitial opinion” before deliberation and again asked to reveal an “individual final opinion” after deliberation. However,
10

Social value orientation (SVO) games192
An SVO experiment of the “slider method” is conducted to identify subjects’ social preferences193
as prosocial or proself in urban and rural areas, following Murphy et al. (2011). Figure 2 shows194
six items of the slider measure that assign numbers to represent outcomes for oneself and for195
the other in a pair of persons, where the other is unknown to the subject. Subjects are asked to196
make one choice among the nine options for each item. Each subject chooses her allocation by197
marking a line at the point that defines her most preferred distribution between oneself and the198
other (See figure 2). The mean allocation for oneself As and the mean allocation for the other Ao199
are computed from all six items (See figure 2). Then, 50 is subtracted from As and Ao to shift the200
base of the resulting angle to the center of the circle (50, 50). The index of a subject’s SVO is given201
by SVO = arctan (Ao)−50
(As)−50. Depending on the values generated from the test, social preferences202
are categorized as follows: 1. altruist: SVO > 57.15◦, 2. prosocial: 22.45◦ < SVO < 57.15◦, 3.203
individualist: −12.04◦ < SVO < 22.45◦ and 4. competitive: SVO < −12.04◦.204
[Figure 2 about here.]205
The SVO framework assumes that people have different motivations and goals for evaluating206
resource allocations between oneself and others. Also, the SVOs or social preferences are estab-207
lished to be stable for a long time (See, e.g., Van Lange et al., 2007, Brosig-Koch et al., 2011).208
Responses that are yielded from six primary items give complete categories of social preferences.209
Major reasons for using six primary slider measures developed by Murphy et al. (2011) are its sim-210
plicity and it is easy to implement in the Nepalese context. It is intuitive for subjects to understand211
this timely-manner procedure does not reflect the process of real-world deliberative group decisions, and it is alsoreported to induce subjects to have unnecessarily strong priming and anchoring effects on individual opinions thatinfluence group deliberations and decisions (Kahneman, 2011, Kotani et al., 2014). Qualitative behavioral researchestablishes that individual opinions and ideas can be truthfully elicited by individual interviews after the incidencesof interest (Brinkmann, 2014). In addition, in our pilot experiment with 48 subjects, we confirm that individual initialand final opinions elicited by our interview procedure are consistent with group deliberations and decisions. Subjectsmight show active misrepresentation of intentions in experiments when there is a strategic interaction to gain extrabenefits (Crawford, 2003, Crawford and Harris, 2018). Following this line of research, we have used an interviewmethod and this interview was conducted after the intragenerational deliberation where subjects have no intentions tolie. Specifically, we collect individual opinions through individual interviews “after” generations’ decisions betweenoptions A and B are made. The main results in our research regarding individual opinions and generation decisionsthat will be presented later are consistent with one another.
11

even with a limited level of education. As is often done in psychology, we further simplify the four212
categories of social preferences into two categories of prosocial and proself types: “altruist” and213
“prosocial” types are categorized as “prosocial” subjects, whereas “individualistic” and “competi-214
tive” types are categorized as “proself” subjects (See Murphy et al., 2011). Subjects are informed215
that the units represented in this game are points and that more points mean he/she will earn more216
real money (See the SVO instruction in figure 2).217
In this game, the subject receives 150NPR (NPR = Nepalese rupees) after applying some218
exchange rate to the points she obtains (≈ 1.5USD) at maximum and 100NPR (≈ 1.0USD)219
on average. Subjects are instructed not to talk or discuss and the decision for SVO is made in220
private. To compute the payoff of the subjects from this game, we collect the answer sheets from221
all subjects, then we randomly match one subject with another subject as a pair. The experimental222
payoff in this SVO game is the summation of points from 6 selections by herself for oneself and 6223
selection by the partner for the other. We also explain the methods of random matching and payoff224
calculation with the exchange rate for the real money incentive to subjects.225
Critical thinking disposition226
Critical thinking is defined as a cognitive process that consist of many different skills such as227
analysis, evaluation, inference, and inquisitiveness that is used appropriately for making a logical228
solution to a problem or a valid conclusion to an argument (Dwyer and Hogan, 2014). The logical229
thinking subscale of the critical thinking disposition scale was adopted in the questionnaire sur-230
veys, following Nakagawa (2015). This subscale consists of 13 items, which could be translated231
into English as follows: (1) “I am good at thinking about complex problems in an orderly fashion,”232
(2) “I am good at collecting my thoughts,” (3) “I am confident in thinking about things precisely,”233
(4) “I am good at making persuasive arguments,” (5) “I am confused when thinking about complex234
problems” (reversed item), (6) “I am usually the one to make decisions because my peers believe I235
can make fair judgments,” (7) “I can concentrate on grappling with problems,” (8) “I can continue236
working on a difficult problem that is not straightforward,” (9) “I can think about things coher-237
12
ently,” (10) “One of my shortcomings is that I am easily distracted” (reversed item), (11) “When238
I think about a solution, I am unable to think about other alternatives” (reversed item), (12) “I can239
inquire into things carefully,” and (13) “I am constructive in proposing alternatives.” Items were240
rated from 1 (strongly disagree) to 5 (strongly agree). The summation of rates from 1 to 5 over 13241
items is the scale of critical thinking disposition, and the theoretical range is 13-65.242
2.3 Experimental procedure243
The experiments involve hiring local supporting staffs and research assistants (the first author244
is a chief administrator for the experiment). The experimental procedures are the same between245
urban and rural areas except for recruitment of subjects. In rural areas, subjects are informed in246
advance (a week ago) and asked to show up at the village schools and/or government agricul-247
tural community halls at a given date and time. To collect subjects, we are supported by local248
government offices known as village development committees (VDCs) and randomly select the249
households from the list of residents in rural areas (Central Bureau of Statistics, 2011). Based on250
the random selection, we send an invitation letter to the selected households and one member in251
a household is invited to participate in our experiments. The participation rate is approximately252
95% which becomes high due to proper incentives provided in this experiment.253
In urban areas, we conduct occupation-based randomization by taking the desired number of254
subjects from each occupation such as banking, government, health, education, business, trans-255
portation and entertainment (Central Bureau of Statistics, 2011).9 The experiment is conducted at256
district health organization training halls in urban areas that are in the center of the cities consisting257
of many rooms. We send an invitation letter to different offices requesting people to participate in258
our experiment. One week prior to the experiment, the letters are dispatched to the selected orga-259
nizations. We conduct experiments on the weekend and, due to proper incentives, the participation260
rate is high that is 80%. On an average, we paid 550NPR (≈ 5.00USD) to each subject including261
a fixed participation fee of 100NPR (≈ 1.0USD) in rural and urban areas.262
9Occupation-based randomization is done to have a representative urban sample in our experiments.
13
[Figure 3 about here.]263
Upon arriving at the locations, subjects are gathered in one hall and they are given experi-264
mental instructions in their native language (Nepali). Once everybody is present in a room, an265
experimenter (the first author) also gives subjects a verbal explanation about experimental rules.266
To maintain anonymity across generations, first, we confirm that subjects have fully understood267
the rules, and second, they are asked to proceed toward a door one by one and pick up a chip out268
of a bag that contains their generation ID and individual ID.10 According to the IDs, each subject269
goes to and sits in a specific room. In the end, we place the generations in separate rooms by270
their generation IDs. In this way, each subject can not observe and identify which person belong271
to a specific generation in a sequence (she knows only the members of her generation), however,272
they can realize that they are assigned to one generation within a sequence. However, they are not273
informed of which generation is the last within a sequence of generations.274
The research assistants distribute questionnaires and explain the experimental procedures once275
again to subjects and keep them engage. In ISDG, the 1st generation makes deliberation up to276
10 minutes where it is recorded and their generation decision is confirmed. Once a generation277
finishes making her decision after the deliberation, the members are asked to move to an individual278
interview room, one person by one person. This process is necessary to assure anonymity and279
privacy among subjects in a generations or across generations regarding how they answer in each280
interview. After the the 1st generation decision and individual interviews, we proceed to the 2nd281
generation with the same procedures. A series of these routines are applied to the rest of the next282
generations from 3rd to 6th ones.283
The previous generations’ decisions are passed to the subsequent generations and they can see284
them if they are other than the 1st generation.11 Each subject in a generation is asked to confirm285
10Several quizzes are administered to check subject’s understanding of the game. We proceed with the experimentafter confirming that all subjects answer the quizzes correctly.
11Note that we use more than 6 rooms in a session depending on the days, locations and the number of subjects,and prepare a separate room for each generation to keep anonymity among generation in a sequence (figure 3). Thisexperimental environment is important to avoid a situation where the subjects have any “observer effect.” In this way,we sought to avoid the “observer effect.” On the other hand, some literature has concluded that the “observer effect”is mostly insignificant in many allocation games such as bargaining, dictator and ultimatum ones under laboratory
14
which generation they belong to in a sequence and the payoffs associated with options A and B.286
With this information, each generation deliberates and decides between intergenerational unsus-287
tainable option A and sustainable option B in an ascending order from the 1st generation to 6th288
generation. After the generation decision, each subject gets interviewed to state her “individual289
initial opinion” and “individual final opinion” to have supported A, B or N before and after delib-290
eration. After the ISDG game and individual interviews, the SVO game follows. Finally, we ask291
subjects to finish questionnaire surveys for their sociodemographic and psychological information292
at the end of a session.293
In ISD situations, there is no possibility of Pareto improvement across generations, all pos-294
sible decisions are Pareto efficient, and rational agents & generations in standard economic the-295
ory are predicted to support and choose option A. In behavioral economics, Charness and Rabin296
(2002) and Engelmann and Strobel (2004) suggest some models of social preferences, social-297
efficiency and maximin preferences. Considering ISD as a simple distribution experiment among298
non-overlapping generations, these models suggest that a generation is likely to choose option299
B, when more members possess preferences for prosociality, social-efficiency, maximin and/or a300
combination of these preferences. All of these predictions are qualitatively valid when we reason-301
ably assume that deliberation induces a generation to decide between options A and B, reflecting302
the preferences of the majority in a generation.303
Our hypothesis in this experiment is that intragenerational deliberation induces individual opin-304
ions and collective decisions to support intergenerational sustainability in ISD (Brandon et al.,305
2019, Hauge et al., 2019). Theory of deliberative process establishes that deliberation can bring a306
change in individual opinions and resolve important problems in collective decision environments307
(see, e.g., Simon and Sulkin, 2002, Goeree and Yariv, 2011, Ban et al., 2012, List et al., 2013).308
Given this state of affairs, this research is considered to provide an experimental and analytical309
framework to explore how intragenerational deliberation induces a change in individual opinions,310
leading generations to resolve ISD. However, the patterns of such changes in individual opinions311
settings (Bolton and Zwick, 1995, Laury et al., 1995, Roth, 1995).
15
may depend on the types of societies due to a difference of human nature, economic environment312
and characteristics between rural and urban areas, leading to a distinct outcome of generation de-313
cisions in ISDG (Cason and Mui, 1998, Engel, 2011, Fehr and Leibbrandt, 2011, Crawford and314
Harris, 2018). Specifically, this paper seeks to explore the following open questions: (i) Does315
intragenerational deliberation change individual opinions of rural and urban subjects for an in-316
tergenerational problem such as ISD in a different manner? (ii) Do such changes in individual317
opinions induce generations to resolve ISD in each society?318
3 Results319
Summary statistics about subjects’ sociodemographic and psychological variables collected320
through questionnaire surveys are presented in table 1. In rural areas, 44% of the subjects are321
male, while, in urban areas, 66% of them are male. This fact reflects that a considerable portion of322
household heads are working away from home in rural areas (Massey et al., 2010). With respect to323
education, subjects in rural areas only possess 10 years of schooling on an average, whereas more324
than 50% of the subjects in urban areas have an undergraduate degree with 16 years of schooling.325
With respect to employment, 88% of the rural subjects engage in farming and forestry as their326
main activities, whereas only 37% of urban subjects do so. The household income is lower in327
rural areas than in urban areas, and the percentages of a single family structure in rural and urban328
areas are, respectively, 47% and 62%. The average family size does not differ between urban329
and rural areas. The critical thinking disposition is slightly lower in rural areas than in urban330
areas. With respect to social value orientation, 62% and 47% of subjects are prosocial in rural331
and urban areas, respectively. Overall, the summary statistics regarding the sociodemographic and332
psychological variables presented in table 1 suggest that there are some differences between these333
two areas.334
[Table 1 about here.]335
16
[Table 2 about here.]336
Generation choices for the intergenerational unsustainable option A and sustainable option B337
in ISDG are presented in table 2. It indicates that from a total of 121 generations (62 and 59338
generations are in rural and urban areas, respectively), 90 (74.38%) generations choose sustain-339
able option B and 31 (25.62%) generations choose unsustainable option A. Furthermore, in rural340
areas, from 62 generations, 52 (83.87%) generations choose option B and 10 (16.13%) gener-341
ations choose option A. In urban areas, from 59 generations, 38 (64.41%) generations choose342
option B and 21 (35.59%) generations choose option A. We perform a chi-squared test with the343
null hypothesis that the distributions over generation choices between options A and B across the344
two areas are the same. The result rejects the null hypothesis at a statistical significance of 5%345
(χ2 = 6.01, p = 0.014). In summary, generations in urban areas more often choose the intergener-346
ational unsustainable option A than generations in rural areas.347
[Table 3 about here.]348
The frequency and percentage of generation choices between options A and B with respect to349
the number of prosocial members in each generation are presented in table 3. In both rural and350
urban areas, the choices of sustainable option B increase with the number of prosocial members351
in a generation. Another interesting fact is that a majority of generations choose B in rural areas352
when at least one subject in a generation is prosocial. In contrast, in urban areas, a majority of353
generations do not necessarily choose B even when one subject in a generation is prosocial. These354
facts illustrate that in addition to prosociality in a generation, there may be other factors, such355
as an area effect, that affect generation choices between unsustainable option A and sustainable356
option B. For this purpose, we perform a logistic regression to characterize a generation choice357
with respect to prosociality, areas and other independent variables. Table 5 presents the marginal358
effects of an independent variable on the probability for a generation to choose option B, taking359
the generation choice of option A as the base group for the dependent variable in the logistic360
regression. In model 1, we include an area dummy and the number of prosocial members in each361
17
generation as independent variables. To check the robustness of the result in model 1, we add362
other sociodemographic and psychological variables such as gender, education, monthly income,363
single family type, critical thinking disposition, agricultural involvement, the previous generations’364
decision and the percentage of choosing option B in sequence history at a generational level in365
model 2 (see table 4 for the definitions).366
[Table 4 about here.]367
Model 1 in table 5 shows that the area dummy and a number of prosocial subjects in a gen-368
eration are economically and statistically significant, demonstrating that generations in rural areas369
have a 14.2% greater probability of choosing sustainable option B compared with generations in370
urban areas. Furthermore, an increase in a number of prosocial members per generation leads to a371
21.5% increase in the probability of choosing B. These two findings are statistically significant at372
the 5% and 1% levels, respectively. In model 2 of table 5, gender, education, monthly income, sin-373
gle family type, critical thinking disposition, agricultural involvement, the previous generations’374
decision and the percentage of choosing option B in sequence history as explanatory variables375
have no effect on generation choices.12 Overall, the analysis suggests that the number of prosocial376
members per generation and the area dummy are consistently significant and robust, irrespective377
of the regression specifications and they are important determinants for generation decisions.378
[Table 5 about here.]379
Table 6 presents the frequency and percentage of “individual initial opinion” to have supported380
A, B or to have been ambivalent (or no ideas) as N before deliberation and the “individual final381
opinion” after deliberation. When there are no individual opinion changes from initial to final382
12To check the robustness for the main result in table 5, we run additional models of logit regression. We consider(i) the previous generations’ choices within a sequence history and (ii) some sociodemographic variables at the gen-erational level as independent variables, building upon the base model 1. Table 5 presents the marginal effects of theindependent variables, confirming that the percentage of choosing option B by previous generations within a sequencehistory as well as the sociodemographic variables are not significant in model 2. We have also tried some interac-tion terms between area dummy and the percentage of choosing option B in history (sociodemographic variables),however, none of them are significant. We have consistently found the same tendency that the number of prosocialmembers and the area dummy remain significant 1% and 10% level.
18
opinions, such situations are coded asAA,BB orNN , where the first (second) letter represents the383
individual opinions before (after) deliberation. The other combinations of the two letters represent384
a situation in which a subject changes her individual opinions over a course of deliberation. For385
instance, AB describes a situation in which the subject initially had her initial opinion to support386
A before deliberation, but changed her final opinion to support B after deliberation. Subjects who387
do not change their opinions to support sustainable option B (i.e., subjects with BB) account388
for 78.49% and 55.93% in rural and urban areas, respectively (See table 6). Subjects who do not389
change their opinions to support unsustainable optionA (i.e., subjects withAA) account for 9.14%390
and 16.95% in rural and urban areas, respectively. This result implies that a majority of subjects391
in rural areas have a consistent opinion of BB, whereas approximately half of subjects in urban392
areas exhibit variation in their opinions other than BB through deliberation.13393
Table 6 also shows that individual opinion changes occur much more often in urban areas than394
in rural areas. These results are in line with the fact that more prosocial subjects are found in rural395
areas than in urban areas (see table 1). In fact, we identify that a majority of rural subjects are396
prosocial, expressing their opinions to support BB in their interviews. To identify the variation397
in initial and final opinions, we apply the coefficient of “unalikeability” as a concept of variability398
for an unordered categorical variable (Gordon, 1986, Kader and Perry, 2007, Frankfort-Nachmias399
and Leon-Guerrero, 2017).14 We have identified that the coefficients of “unalikeability” in initial400
(final) opinions are 0.24 (0.32) and 0.46 (0.52) for rural and urban areas, respectively, confirming401
that urban subjects have a wider variety of initial and final opinions than rural subjects.402
[Table 6 about here.]403
The previous literature has suggested that deliberation leads to collective decisions with una-404
nimity (Gerardi and Yariv, 2007, Neilson and Winter, 2008, Gillet et al., 2009, Ruth and Danziger,405
13Subjects changing their opinions from A (N ) to B, as AB (NB). 1.08% (2.15%) and 6.78% (1.13%) of subjectsare classified as AB (NB) in rural and urban areas, respectively. These percentages are not necessarily high comparedwith those of other opinion shifts, such as BA or BN . For instance, 2.15% (5.38%) and 6.21% (5.08%) of subjectsare classified as BA (BN ) in rural and urban areas, respectively.
14The coefficient of “unalikeability” measures how often observations differ from one another within a same treat-ment group, and it is measured on a scale from 0 to 1 and higher the value is, the more unalike or variable the dataare.
19

2016). With the data regarding individual opinion changes, we examine whether the aforemen-406
tioned claim is true in ISDG. To this end, we introduce some terminologies to classify various cases407
of unanimity that can arise in ISDG. When all members in a generation have the same “individual408
initial opinion” of A, B or N before the deliberation, we call such a generation as a generation409
with “unanimity before deliberation;” otherwise, it is called a generation with “nonunanimity be-410
fore deliberation.” Similarly, when all the members in a generation have the same “individual final411
opinion” of A, B or N , it is called a generation with “unanimity after deliberation;” otherwise, it412
is called a generation with “nonunanimity after deliberation.” With these definitions, all the gen-413
erations fall into one of the following unanimity categories: 1. Unanimity and 2. Nonunanimity414
before and after deliberation.415
Table 7 presents that, out of a total of 121 generations, 91 generations (39 and 52 in urban and416
rural areas) have unanimity before deliberation but only 75 generations (32 and 43 in urban and417
rural areas) are identified to have unanimity after deliberation. Thus, the number of generations418
that reached unanimity decline from 91 to 75 through deliberation. Furthermore, to statistically419
establish our result, we run a chi-squared test with the null hypothesis that the distributions of420
generations that reach unanimity before and after deliberations are the same. The result rejects421
the null hypothesis at 5% significance level (χ2 = 4.73, p = 0.029), implying that deliberation422
in ISDG does not necessarily induce generations to reach unanimity. The previous literature has423
suggested that “deliberation leads to collective decisions with unanimity” (Gerardi and Yariv, 2007,424
Neilson and Winter, 2008, Gillet et al., 2009, Ruth and Danziger, 2016). However, in ISDG, such425
a claim is unlikely to be true.426
[Table 7 about here.]427
Next, we statistically analyze the factors that cause individual opinion changes through delib-428
eration. For identifying such factors, we run logit regression taking an individual opinion change429
through deliberation as a dependent variable. The dependent variable is a dummy variable that430
takes a value of 1 when a subject changes her opinion to support A, B or N before and after de-431
liberation, such as AB,AN,BA,BN,NA and NB. The independent variables include the area432
20

dummy, critical thinking disposition, preunanimity, minority dummy, social value orientation and433
sociodemographic factors such as gender, age, education, monthly income, family size and agri-434
cultural involvement. The definitions of all the variables are summarized as “variables at individual435
level” in table 4. Table 8 presents the marginal effects of an independent variable on the proba-436
bility for a subject to have an opinion change in models 1 and 2. In model 1, we do not control437
for sociodemographic variables, while we include sociodemographic variables in model 2 for a438
robustness check.439
The area dummy, critical thinking disposition and preunanimity dummy have a negative ef-440
fect on an individual opinion change, while the minority dummy has a positive effect on opinion441
changes through the deliberation in both models 1 and 2. On the other hand, the sociodemographic442
variables in model 2 do not exhibit any effect.15 The area dummy is statistically significant in that443
rural subjects are 10.1% less likely to change their opinions through the deliberation, compared to444
urban subjects. This rural-area effect is considered strong because a high portion of rural subjects445
(78.49%) consistently chose sustainable option B (See table 6). In summary, it appears that there446
are less variation in individual opinions and less chances in opinion changes among rural people,447
because they usually have homogeneous culture and ways of thinking that come from similar so-448
cial learning and experiences from generation to generation through social interactions (Hooper449
et al., 2015, Schniter et al., 2015).450
[Table 8 about here.]451
The results in model 1 show that a critical thinking and unanimity before deliberation are neg-452
atively associated for a member of a generation to change his/her opinions through deliberation.16453
However, the magnitude of the effect of critical thinking on opinion changes could be considered454
rather small. Subjects with higher critical thinking abilities should be able to judge and understand455
the quality of arguments with a logical validity in deliberation. Therefore, they are less likely to456
15We have also tried different specifications of regressions in addition to models 1 and 2, but the qualitativelyidentical results have been obtained.
16One-unit-scale increase in critical thinking disposition leads to a decrease of 1% in the probability for a memberof a generation to change his/her opinions through deliberation at 1% significance level.
21
change their opinion, being qualitatively consistent with previous researches (Nakagawa, 2015,457
Howarth et al., 2016). Furthermore, when generations have unanimity before deliberation (or pre-458
unanimity in the regression), the probability for their members to change their opinions decreases459
by 10.1% at 5% significance level, compared with generations without the unanimity. Overall,460
whether or not members in a generation have the same opinion, i.e., “unanimity before deliber-461
ation,” is identified to be a key factor for determining whether subjects in the generation change462
their opinions. Finally, the results also demonstrate that a subject with a minority of her initial463
opinion in a generation is 16.2% more likely to change her opinion, compared with non-minority464
subjects, at 1% significance level. In summary, we have identified that area dummy, critical think-465
ing disposition, preunanimity dummy and minority dummy are identified to be the major factors466
related to individual opinion changes.467
The experimental results demonstrate that rural subjects choose sustainable option B more468
often than do urban subjects and the number of prosocial members per generation is a key factor.469
Next, urban subjects are identified to have a wider variety of individual initial opinions than rural470
subjects, and the individual opinions change through deliberation when subjects in a generation do471
not share the same initial opinion, reflecting that urban subjects change opinions as compared with472
rural ones. Consequently, urban (subjects) generations (support) choose an unsustainable option473
more often than do rural ones. Overall, tables 6 to 8 illustrate that intragenerational deliberation is474
not successful at inducing individuals and generations to support and choose sustainable opinion475
B, respectively. Now, with these results, we can answer the two open questions posed at the end476
of introduction section and section 2.3: (i) Does intragenerational deliberation change individual477
opinions of rural and urban subjects for an intergenerational problem such as ISD in a different478
manner? Our answer to the question is that urban subjects change their opinions more often than479
do rural subjects through intragenerational deliberation, and (ii) Do such changes in individual480
opinions induce generations to resolve ISD in each society? Our answer to the question is that the481
individual opinion changes that mainly occur in urban areas do not work in the direction to enhance482
intergenerational sustainability. In summary, our results suggest that intragenerational deliberation483
22
is not effective at resolving intergenerational sustainability.484
4 Discussion and conclusion485
This research has examined how intragenerational deliberation changes individual opinions486
and can be a resolution for intergenerational sustainability dilemma (ISD) in societies by conduct-487
ing the framed field experiment in two Nepalese contexts (urban and rural areas). Our results488
demonstrate that the majority of the generations in both societies support a sustainable option B489
and the findings are different from Shahrier et al. (2017) where the majority have chosen option A490
in an urban city, Dhaka. The possible explanation is that life in Dhaka is much more competitive491
to live than in Kathmandu and a majority of urban Bangladeshi people are found to be proself,492
reflecting the fact that Dhaka is the world’s most densely populated city (Shahrier et al., 2016,493
Bangladesh Bureau of Statistics, 2017). Cason and Mui (1997) claim that intragroup face-to-face494
communication does not always lead groups to make rational and self-regarding decisions, fol-495
lowing standard economic theory. However, some studies have found that group behaviors can be496
more self-regarding and rational than individual behaviors in the same settings (Dawes et al., 1977,497
Isaac and Walker, 1988, Bornstein and Ben-Yossef, 1994, Kugler et al., 2012, Charness and Sut-498
ter, 2012, Cooper and Kuhn, 2016, Meub and Proeger, 2017, Crawford and Harris, 2018, Carbone499
et al., 2019, Vollstadt and Bohm, 2019). This study shows that how intragenerational delibera-500
tion affects intergeneration behaviors shall be depending on socioeconomic contexts, cultures and501
norms in people’s daily life (Henrich et al., 2005, 2010b, Fehr and Leibbrandt, 2011).502
Urban subjects have a wider variety of individual initial opinions and support unsustainable503
options more often than do rural subjects. This result can be compared with the findings of Cason504
and Mui (1998), Luhan et al. (2009) and Crawford and Harris (2018) showing that social inter-505
action influences group decisions in the way that self-regarding individuals are influential. Our506
findings show that individual opinions change through deliberation when subjects in a genera-507
tion do not share the same initial opinion, reflecting that more urban subjects change opinions.508
23
However, we identify that such changes do not necessarily work in the direction to enhance in-509
tergenerational sustainability, because some people in the group might have strong self-regarding510
preferences influencing generation decisions. Fischbacher et al. (2001), Chaudhuri (2011) and511
Hauser et al. (2014) show that cooperation among group members increases when they are aware512
of the presence of conditional cooperators. Given these findings, one way to interpret our result is513
that urban generations are likely to identify at least one self-regarding member, but less likely to514
spot (conditional) cooperators through intragenerational deliberation, choosing an unsustainable515
option.516
A novelty of our experimental design as compared with Kamijo et al. (2017) and Shahrier et al.517
(2017) is conducting interviews to identify individual opinion changes over the course of delib-518
eration. The interviews reveal that there is a fundamental difference in terms of how deliberation519
affects individual opinions between rural and urban areas in ISDG. In rural areas, approximately520
80% of subjects consistently support sustainable option B without any opinion change during de-521
liberation, whereas about half of the urban subjects change their opinions. Gachter and Thoni522
(2005) find that cooperation among like mindset people in a group tends to be higher and more523
stable than that among different mindset people in a group. Being consistent with the result in524
Gachter and Thoni (2005), we find that urban generations consist of people with a wider variety of525
individual initial opinions, changing their individual opinions and choosing an unsustainable op-526
tion more often than rural ones. It can be interpreted that urban subjects with a variety of opinions527
face conflicts of interest during intragenerational deliberation and, thus, the deliberation takes long528
as compared to rural subjects. As a result, deliberation does not successfully induce urban subjects529
and generations to support sustainable option B.530
This study demonstrates that people’s social preferences such as prosociality are key factors531
to characterize intergenerational sustainability. Prosocial preferences directly affect people’s deci-532
sions about how to live, such as unplugging cell phones, using public transport to commute work533
and/or installing a solar panel on a roof for energy (Van Lange et al., 2007). The higher proportion534
of prosocial people are found in rural areas than in urban ones, and there are significant differences535
24
between these areas in terms of their environment, uses of technologies and social interactions536
among people. In many cases, basic city life in urban areas such as Kathmandu and Pokhara does537
not require people to have human interactions or intimacy even with their colleagues. In contrast,538
people in rural areas have close interactions and intimacy with their neighbors owing to their direct539
dependency on ecology and agriculture-based activities, and a closely-knit rural society such as ru-540
ral areas in Nepal can be considered a hope for resolving ISD. With these realities, we believe that541
the difference in how people interact with others affects social preferences and behaviors (Char-542
ness and Rabin, 2002, Engelmann and Strobel, 2004, Shahrier et al., 2017). Therefore, practices of543
shared values through education and social interactions shall be one possible approach to enhance544
intergeneration sustainability through creating a close-knit society such as permaculture movement545
in some parts of the world (Akhtar et al., 2016, Maye, 2016, Ulbrich and Pahl-Wostl, 2019).546
Literature has suggested that deliberation leads to fair collective decisions in some class of547
intragenerational problems, particularly when they have an chance to reach Pareto improvement548
(Cardenas, 2000, Cardenas et al., 2000, Blume and Ortmann, 2007, Gerardi and Yariv, 2007, Neil-549
son and Winter, 2008, Gillet et al., 2009, Cason et al., 2012, Ghate et al., 2013, Ruth and Danziger,550
2016). In this research, it is demonstrated that intragenerational deliberation is not effective at551
assuring intergenerational sustainability in ISDG where there is no room for Pareto improvement.552
Fochmann et al. (2018) observe that subjects are more concerned about fairness in intragenera-553
tional distributional problems than in intergenerational ones. With the result, it is so intuitive that554
intragenerational deliberation cannot resolve intergenerational problems such as ISD. In reality,555
people in contemporary societies have failed in resolving some important intergenerational prob-556
lems, such as climate change, through intragenerational deliberation over time. Therefore, our557
results imply that some new social mechanisms in addition to or other than intragenerational delib-558
eration must be designed and instituted if we really want to resolve intergenerational sustainability559
problems.560
We note some limitations of the study and directions for future research. First, our experiment561
is instituted under nonoverlapping generations to focus only on the ISD problems. In reality, how-562
25
ever, generations are overlapping in societies. Future research should be able to be reorganized for563
addressing ISD with overlapping generations. Second, although we find that deliberation does not564
resolve ISD, future research may be able to find a new type of social mechanisms, potentially with565
deliberative processes, for resolving ISD. Finally, this research does not fully utilize the contents of566
generations’ discussions for analyzing why individual opinion changes occur in deliberation along567
with generation decisions. Future research should be able to characterize the detailed dynamic pro-568
cesses for individual opinion changes and generation decisions via qualitative deliberative analysis569
of discussion contents, as is done in psychology and political science (Brinkmann, 2014).570
26
5 ReferencesAkhtar, F., Lodhi, S. A., Khan, S. S., and Sarwar, F. (2016). Incorporating permaculture and strate-
gic management for sustainable ecological resource management. Journal of environmentalmanagement, 179:31–37.
Bamber, J. L., Oppenheimer, M., Kopp, R. E., Aspinall, W. P., and Cooke, R. M. (2019). Icesheet contributions to future sea-level rise from structured expert judgment. Proceedings of theNational Academy of Sciences of the United States of America, 116:11195–11200.
Ban, R., Jha, S., and Rao, V. (2012). Who has voice in a deliberative democracy? Evidence fromtranscripts of village parliaments in south India. Journal of development economics, 99:428 –438.
Bangladesh Bureau of Statistics (2017). Bangladesh statistics. Technical report, Bangladesh Bu-reau of Statistics.
Blume, A. and Ortmann, A. (2007). The effects of costless pre-play communication: Experimentalevidence from games with Pareto-ranked equilibria. Journal of economic theory, 132:274–290.
Bolton, G. and Zwick, R. (1995). Anonymity versus punishment in ultimatum bargaining. Gamesand economic behavior, 10:95–121.
Bornstein, G. and Ben-Yossef, M. (1994). Cooperation in inter group and single group socialdilemmas. Journal of experimental social psychology, 30:52–67.
Brandon, A., List, J. A., Metcalfe, R. D., Price, M. K., and Rundhammer, F. (2019). Testingfor crowd out in social nudges: Evidence from a natural field experiment in the market forelectricity. Proceedings of the National Academy of Sciences of the United States of America,116:5293–5298.
Brinkmann, S. (2014). Unstructured and semi-structured interviewing. In Leavy, P., editor, TheOxford handbook of qualitative research, chapter 3, pages 277–299. Oxford University press.
Brosig-Koch, J., Helbach, C., Ockenfels, A., and Weimann, J. (2011). Still different after all theseyears: Solidarity behavior in East and West Germany. Journal of public economics, 95:1373–1376.
Carbone, E., Georgalos, K., and Infante, G. (2019). Individual vs. group decision-making: Anexperiment on dynamic choice under risk and ambiguity. Theory and decision, 87:87–122.
Cardenas, J. (2000). How do groups solve local commons dilemmas? Environment, developmentand sustainability, 2:305–322.
Cardenas, J., Stranlund, J. K., and Willis, C. E. (2000). Local environmental control and institu-tional crowding-out. World development, 28:1719–1733.
Cason, T. and Mui, V. (1997). A laboratory study of group polarisation in the team dictator game.Economic journal, 107:1465–1483.
27
Cason, T. and Mui, V. (1998). Social influence in the sequential dictator game. Journal of mathe-matical psychology, 42:248–265.
Cason, T., Sheremeta, R. M., and Zhang, J. (2012). Communication and efficiency in competitivecoordination games. Games and economic behavior, 76:26–43.
Central Bureau of Statistics (2011). Population Census. Nepal.
Chambers, S. (2003). Deliberative democratic theory. Annual review of political science, 6:307–326.
Charness, G. and Rabin, M. (2002). Understanding social preferences with simple tests. Quarterlyjournal of economics, 117:817–869.
Charness, G. and Sutter, M. (2012). Groups make better self-interested decisions. Journal ofeconomic perspectives, 26:157–176.
Chaudhuri, A. (2011). Sustaining cooperation in laboratory public goods experiments: A selectivesurvey of the literature. Experimental economics, 14:47–83.
Chaudhuri, A. and Paichayontvijit, T. (2006). Conditional cooperation and voluntary contributionsto a public good. Economics bulletin, 3:1–14.
Chaudhuri, A., Schotter, A., and Sopher, B. (2009). Talking ourselves to efficiency: Coordinationin inter-generational minimum effort games with private, almost common and common knowl-edge of advice. Economic journal, 119:91–122.
Cooper, D. J. and Kuhn, K. (2016). Communication and cooperation: A methodological study.Southern economic journal, 82:1167–1185.
Crawford, I. and Harris, D. (2018). Social interactions and the influence of “extremists”. Journalof economic behavior and organization, 153:238–266.
Crawford, V. P. (2003). Lying for strategic advantage: Rational and boundedly rational misrepre-sentation of intentions. American economic review, 93:133–149.
Dasgupta, S. and Mitra, T. (1983). Intergenerational equity and efficient allocation of exhaustibleresources. International economic review, 24:133–153.
Dawes, R. M., Tavish, J. M., and Shaklee, H. (1977). Behavior, communication, and assumptionsabout other people's behavior in a commons dilemma situation. Journal of personality and socialpsychology, 35:1–11.
Denant-Boomont, L., Diecidue, E., and l'Haridon, O. (2017). Patience and time consistency incollective decisions. Experimental economics, 20:181–208.
Dwyer, C. P. and Hogan, M. J. (2014). An integrated critical thinking framework for the 21stcentury. Thinking skills and creativity, 12:43–52.
Engel, C. (2011). Dictator games: A meta study. Experimental economics, 14:583–610.
28
Engelmann, D. and Strobel, M. (2004). Inequality aversion, efficiency, and maximin preferencesin simple distribution experiments. American economic review, 94:857–869.
Fehr, E. (1999). A theory of fairness, competition and cooperation. Quarterly journal of eco-nomics, 114:817–868.
Fehr, E. and Gachter, S. (2000). Fairness and retaliation: The economics of reciprocity. Journal ofeconomic perspectives, 14:159–181.
Fehr, E. and Leibbrandt, A. (2011). A field study on cooperativeness and impatience in the tragedyof the commons. Journal of public economics, 95:1144–1155.
Fischbacher, U., Gachter, S., and Fehr, E. (2001). Are people conditionally cooperative? Evidencefrom a public goods experiment. Economics letters, 71:397– 404.
Fisher, M., Irlenbusch, B., and Sadrieh, A. (2004). An intergenerational common pool resourceexperiment. Journal of environmental economics and management, 48:811–836.
Fochmann, M., Sachs, F., Sadrieh, A., and Weimann, J. (2018). The two sides of public debt:Intergenerational altruism and burden shifting. PLoS ONE, 13:e0202963.
Frankfort-Nachmias, C. and Leon-Guerrero, A. (2017). Social statistics for a diverse society. Sagepublications, 8 edition.
Gachter, S. and Thoni, C. (2005). Social learning and voluntary cooperation among like-mindedpeople. Journal of the European economic association, 3:303–314.
Garri, I. (2010). Political short-termism: A possible explanation. Public choice, 145:197–211.
Gerardi, D. and Yariv, L. (2007). Deliberative voting. Journal of economic theory, 134:317–338.
Ghate, R., Ghate, S., and Ostrom, E. (2013). Cultural norms, cooperation, and communication:Taking experiments to the field in indigenous communities. International journal of the com-mons, 7:498–520.
Gillet, J., Schram, A., and Sonnemans, J. (2009). The tragedy of the commons revisited: Theimportance of group decision-making. Journal of public economics, 93:785–797.
Goeree, J. K. and Yariv, L. (2011). An experimental study of collective deliberation. Econometrica,79:893–921.
Gordon, T. (1986). Is the standard deviation tied to the mean? Teaching statistics, 8:40–2.
Hansen, G. D. and Imrohoroglu, S. (2016). Fiscal reform and government debt in Japan: A neo-classical perspective. Review of economic dynamics, 21:201–224.
Hauge, K. E., Brekke, K. A., Nyborg, K., and Lind, J. T. (2019). Sustaining cooperation throughself-sorting: The good, the bad, and the conditional. Proceedings of the National Academy ofSciences of the United States of America, 116:5299–5304.
29

Hauser, O. P., Rand, D. G., Peysakhovich, A., and Nowak, M. A. (2014). Cooperating with thefuture. Nature, 511:220–223.
Henrich, J., Boyd, R., Bowles, S., Camerer, C., Fehr, E., Gintis, H., and McElreath, R. (2001).In search of homo economicus: Behavioral experiments in 15 small-scale societies. Americaneconomic review, 91:73–78.
Henrich, J., Ensminger, J., McElreath, R., Barr, A., Barrett, C., Bolyanatz, A., Cardenas, J. C.,Gurven, M., Gwako, E., Henrich, N., Lesorogol, C., Marlowe, F., Tracer, D., and Ziker, J.(2010a). Markets, religion, community size, and the evolution of fairness and punishment.Science, 327:1480–1484.
Henrich, J., Heine, S. J., and Norenzayan, A. (2010b). The weirdest people in the world? Behav-ioral and brain sciences, 33:61–83.
Henrich, J., R., Bowles, S., Camerer, C. F., Fehr, E., Gintis, H., McElreath, R., Alvard, M., Barr, A.,Ensminger, J., Heinrich, N. S., Hill, K., Gil-White, F., Gurven, M., Marlowe, F. W., Patton, J. Q.,and Tracer, D. (2005). “Economic man” in cross-cultural perspective: Behavioral experimentsin 15 small-scale soceities. Behavioral and brain sciences, 28:795–855.
Hooper, P. L., Gurven, M., Winking, J., and Kaplan, H. S. (2015). Inclusive fitness and differentialproductivity across the life course determine intergenrational transfers in a small-scale humansociety. Proceedings of royal society B: Biological sciences, 282:20142808.
Howarth, R. B. and Norgaard, R. B. (1993). Intergenerational transfers and the social discountrate. Environmental and resource economics, 3:337 – 358.
Howarth, S., Handley, S. J., and Walsh, C. (2016). The logic-bias effect: The role of effortfulprocessing in the resolution of belief-logic conflict. Memory and cognition, 44:330–349.
Isaac, R. M. and Walker, J. M. (1988). Communication and free riding behavior: The voluntarycontributions mechanism. Economic inquiry, 26:585–608.
Joseph, B. (1994). The mild voice of reason: Deliberative democracy and American nationalgovernment. Chicago Press.
Kader, G. and Perry, M. (2007). Variability for categorical variables. Journal of statistics educa-tion, 15:1–17.
Kahneman, D. (2011). Thinking, fast and slow. Farrar, Straus, and Giroux.
Kamijo, Y., Komiya, A., Mifune, N., and Saijo, T. (2017). Negotiating with the future: Incorpo-rating imaginary future generations into negotiations. Sustainability science, 11:409–420.
Konrad, K. and Thum, M. (2018). Does a clean development mechanism facilitate internationalenvironmental agreements? Environmental and resource economics, 69:837–851.
Kotani, K., Tanaka, K., and Managi, S. (2014). Cooperative choice and its framing effect underthreshold uncertainty in a provision point mechanism. Economics of governance, 15:329–353.
30
Kotchen, M. J. and Segerson, K. (2019). On the use of group performance and rights for environ-mental protection and resource management. Proceedings of the National Academy of Sciencesof the United States of America, 116:5285–5292.
Krutilla, J. V. (1967). Conservation reconsidered. American economic review, 57:777–786.
Kugler, T., Kausel, E. E., and Kocher, M. G. (2012). Are groups more rational than individuals?A review of interactive decision making in groups. Wiley interdisciplinary reviews: Cognitivescience, 3:471–482.
Laury, S. K., Walker, J. M., and Williams, A. W. (1995). Anonymity and the voluntary provisionof public goods. Journal of economic behavior and organization, 27:365–380.
Leibbrandt, A., Gneezy, U., and List, J. A. (2013). Rise and fall of competitiveness in individual-istic and collectivistic societies. Proceedings of the National Academy of Sciences of the UnitedStates of America, 110:9305–9308.
List, C., Luskin, R., Fishkin, J. S., and McLean, I. (2013). Deliberation, single-peakedness, andthe possibility of meaningful democracy: Evidence from deliberative polls. Journal of politics,75:80–95.
Luhan, W. J., Kocher, M. G., and Sutter, M. (2009). Group polarization in the team dictator gamereconsidered. Experimental economics, 12:26–41.
Massey, D., Axinn, W., and Ghimire, D. (2010). Environmental change and out-migration: Evi-dence from Nepal. Population and environment, 32:109–136.
Maye, D. (2016). Examining innovation for sustainability from the bottom up: An analysis of thepermaculture community in England. Sociologia ruralis, 58:331–350.
Meub, L. and Proeger, T. (2017). The impact of communication regimes and cognitive abilitieson group rationality: Experimental evidence. Journal of economic behavior and organization,135:229–238.
Murphy, R. O., Ackermann, K. A., and Handgraaf, M. J. (2011). Measuring social value orienta-tion. Judgment and decision making, 6:771–781.
Nakagawa, Y. (2015). Effect of critical thinking disposition on household earthquake preparedness.Natural hazards, 81:807–828.
Nakagawa, Y., Kotani, K., Matsumoto, M., and Saijo, T. (2019). Intergenerational retrospectiveviewpoints and individual policy preferences for future: A deliberative experiment for forestmanagement. Futures, 105:40–53.
Neilson, W. S. and Winter, H. (2008). Votes based on protracted deliberations. Journal of economicbehavior and organization, 67:308–321.
Niemeyer, S. and Dryzek, J. S. (2007). The ends of deliberation: Meta-consensus and inter-subjective rationality as ideal outcomes. Swiss political science review, 13:497–526.
31
Ockenfels, A. and Weimann, J. (1999). Types and patterns: An experimental East-West-Germancomparison of cooperation and solidarity. Journal of public economics, 71:275–287.
Ostrom, E. (1990). Governing the commons: The evolution of instituions for collective actions.Cambridge university press.
Pigou, A. C. (1952). Alfred Marshall and current thought. Macmillan and Co.
Rawls, J. (1993). Political liberalism. Columbia university press.
Roth, A. (1995). Bargaining experiments. In Roth, A. and Kagel, J., editors, Handbook of experi-mental economics, chapter 4, pages 253–348. Princeton University Press.
Ruth, B. and Danziger, L. (2016). The unanimity rule and extremely asymmetric committees.Journal of mathematical economics, 64:107–112.
Schniter, E., Gurven, M., Kaplan, H. S., Wilcox, N. T., and Hooper, P. L. (2015). Skill ontogenyamong Tsimane forager-horticulturalists. American journal of physical anthropology, 158:3–18.
Schotter, A. and Sopher, B. (2003). Social learning and coordination conventations in intergener-ational games: An experimental study. Journal of political economy, 111:498–529.
Schotter, A. and Sopher, B. (2006). Trust and trustworthiness in games: An experimental study ofintergenerational advice. Experimental economics, 9:123–145.
Schotter, A. and Sopher, B. (2007). Advice and behavior in intergenerational ultimatum games:An experimental approach. Games and economic behavior, 58:365–393.
Shahrier, S., Kotani, K., and Kakinaka, M. (2016). Social value orientation and capitalism insocieties. PLoS ONE, 11:e0165067.
Shahrier, S., Kotani, K., and Saijo, T. (2017). Intergenerational sustainability dilemma and thedegree of capitalism in societies: A field experiment. Sustainability science, 12:957–967.
Sherstyuk, K., Tarui, N., Ravago, M. L. V., and Saijo, T. (2016). Intergenerational games with dy-namic externalities and climate change experiments. Journal of the association of environmentaland resource economists, 3:247–281.
Simon, A. F. and Sulkin, T. (2002). Discussion’s impact on political allocations: An experimentalapproach. Political analysis, 10:403–412.
Thompson, D. F. (2010). Representing future generations: Political presentism and democratictrusteeship. Critical review of international social and political philosophy, 13:17–37.
Tilman, A. R., Dixit, A. K., and Levin, S. A. (2019). Localized prosocial preferences, publicgoods, and common-pool resources. Proceedings of the National Academy of Sciences of theUnited States of America, 116:5305–5310.
Timilsina, R., Kotani, K., and Kamijo, Y. (2017). Sustainability of common pool resources. PLoSONE, 12:e0170981.
32
Ulbrich, R. and Pahl-Wostl, C. (2019). The German permaculture community from a communityof practice perspective. Sustainability, 11:1241.
UNDP (2014). Nepal human development report 2014: Beyond geography unlocking humanpotential. Technical report, UNDP.
Van Lange, P. A., Bekkers, R., Shuyt, T. N., and Vugt, M. V. (2007). From games to giving:Social value orientation predicts donation to noble causes. Basic and applied social psychology,29:375–384.
Vollstadt, U. and Bohm, R. (2019). Are groups more competitive, more selfish-rational or moreprosocial bargainers? Journal of behavioral and experimental economics, 78:146–159.
Weitzman, M. L. (1997). Sustainability and technical progress. Scandinavian journal of eco-nomics, 99:1–13.
Wilson, D. S., O’Brien, D. T., and Sesma, A. (2009). Human prosociality from an evolutionaryperspective: Variation and correlations at a city-wide scale. Evolution and human behavior,30:190–200.
33

List of Figures1 Study regions: Urban and rural areas of Nepal . . . . . . . . . . . . . . . . . . . . 352 Instructions for the “slider method” to measuring social value orientation . . . . . 363 A flow chart of procedure for the ISDG experiment and questionnaire survey per
session. In the ISDG experiment, each room has two-digit ID with one letter of al-phabets and a number, such as G1 or K1. The alphabet letter represents a sequenceID, while the number does the generation ID within the sequence . . . . . . . . . . 37
34
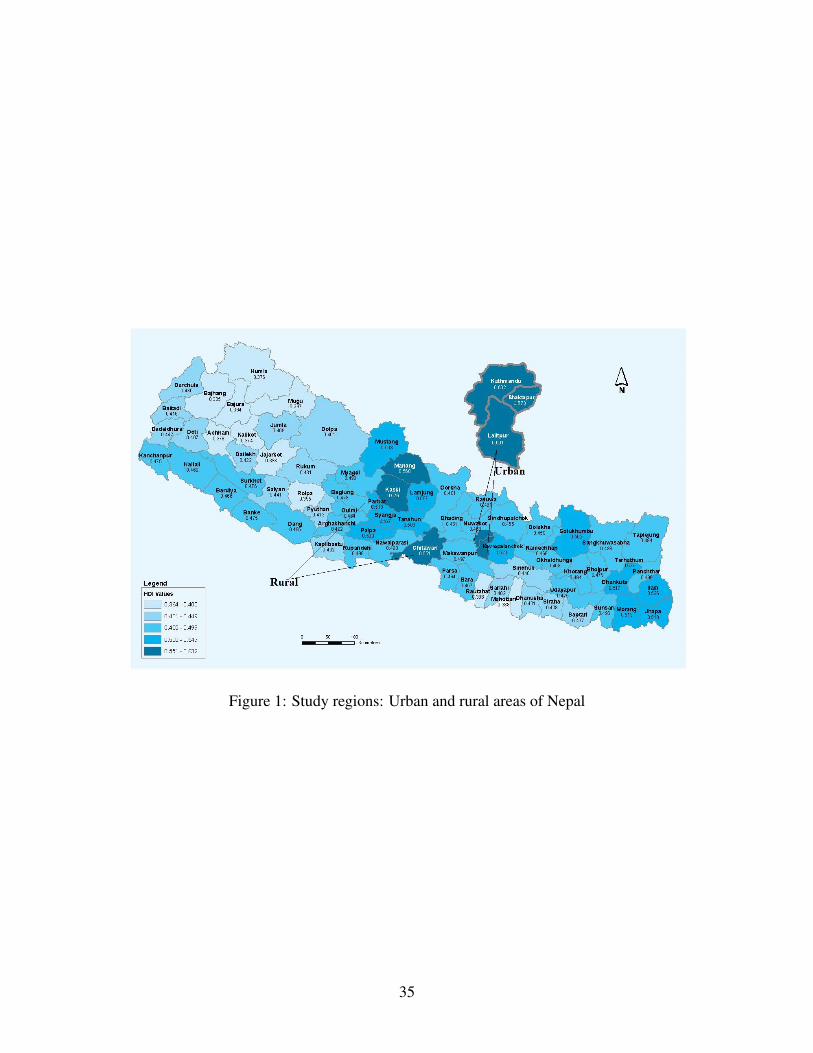
Figure 1: Study regions: Urban and rural areas of Nepal
35

Figure 2: Instructions for the “slider method” to measuring social value orientation
1
2
3
4
5
6
You
Other
You
Other
You
Other
You
Other
You
Other
You
Other
50
100
54 59 63 68 72 76 81 85
96 94 93 91 89 87 8598
You receive
Other receives
50
100
56636975818894100
88817569635650 94
You receive
Other receives
50
100
54 59 63 68 72 76 81 85
79 68 58 47 36 26 1589
You receive
Other receives
85
85
87899193949698100
76726863595450 81
You receive
Other receives
85
85
85 85 85 85 85 85 85 85
68 59 50 41 33 24 1576
You receive
Other receives
100
50
9896949391898785
41373328241915 46
You receive
Other receives
In this task you have been randomly paired with another person, whom we will refer to as the other. This other person is someone you do not know and will remain mutually anonymous. All of your choices are completely confidential. You will be making a series of decisions about allocating resources between you and this other person. For each of the following questions, please indicate the distribution you prefer most by marking the respective position along the midline. You can only make one mark for each question.
Your decisions will yield money for both yourself and the other person. In the example below, a person has chosen to distribute money so that he/she receives 50 dollars, while the anonymous other person receives 40 dollars.
There are no right or wrong answers, this is all about personal preferences. After you have made your decision, write the resulting distribution of money on the spaces on the right. As you can see, your choices will influence both the amount of money you receive as well as the amount of money the other receives.
Example:
Instructions
30
80
35 40 45 50 55 60 65 70
60 50 40 30 20 10 070
You receive
Other receives 40
50You
Other
a
36
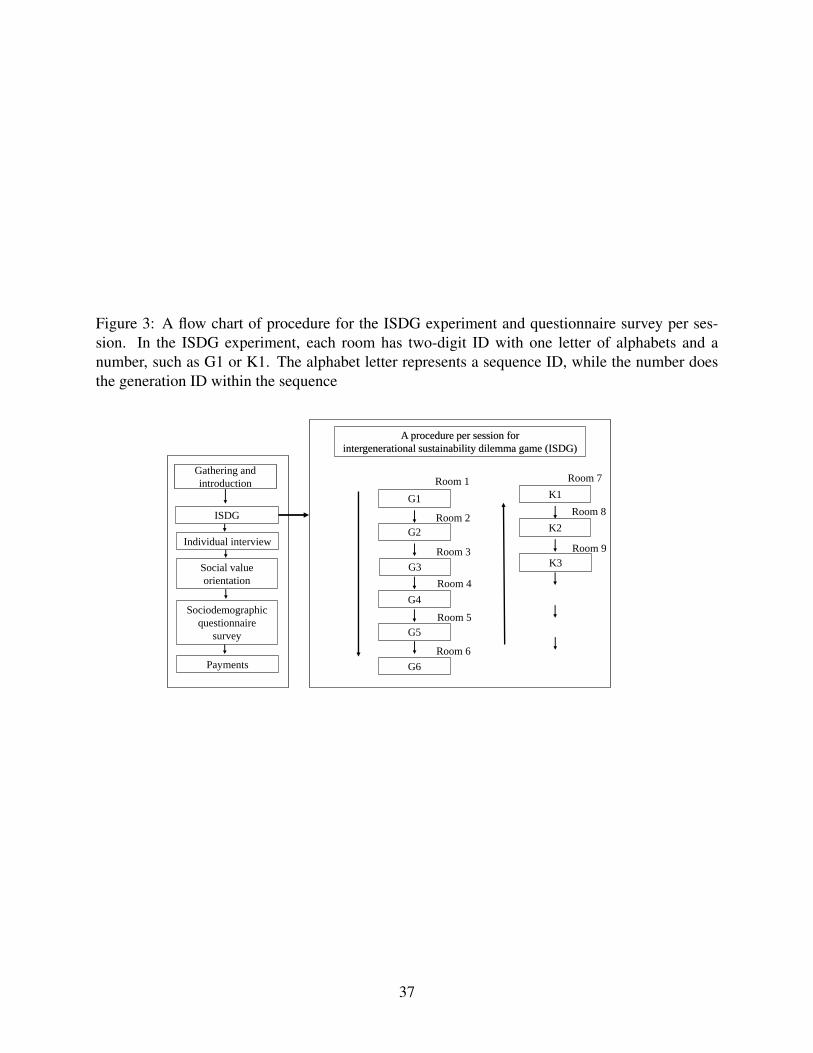
Figure 3: A flow chart of procedure for the ISDG experiment and questionnaire survey per ses-sion. In the ISDG experiment, each room has two-digit ID with one letter of alphabets and anumber, such as G1 or K1. The alphabet letter represents a sequence ID, while the number doesthe generation ID within the sequence
G1
G2
G3
G4
G5
G6
A procedure per session for
intergenerational sustainability dilemma game (ISDG)
ISDG
Social value
orientation
Payments
Gathering and
introduction Room 1
Room 2
Room 3
Room 4
Room 5
Room 6
Room 7
K1
K2
K3
Room 8
Room 9
Sociodemographic
questionnaire
survey
Individual interview
37

List of Tables1 Summary statistics . . . . . . . . . . . . . . . . . . . . . . . . . . . . . . . . . . 392 The frequency and percentage of generation choices between options A and B
(percentage in parenthesis) . . . . . . . . . . . . . . . . . . . . . . . . . . . . . . 403 The frequency and percentage of generation choices between optionsA andB with
respect to the number of prosocial members in each generation . . . . . . . . . . . 414 Definitions of the variables included in the regressions . . . . . . . . . . . . . . . 425 Marginal effects of independent variables in the logit regression for generation
choices between options A and B where the dependent variable of generationchoices takes the value 1 with option B, otherwise 0. . . . . . . . . . . . . . . . . 43
6 The frequency and percentage of change in individual opinions for supporting op-tion “A,” “B,” or “N” ambivalent/no ideas before and after the deliberation (per-centage in parenthesis) . . . . . . . . . . . . . . . . . . . . . . . . . . . . . . . . 44
7 The number of generations with unanimity before and after the deliberation . . . . 458 Models 1 and 2: Marginal effects of independent variables in the logit regression
for individual opinion change . . . . . . . . . . . . . . . . . . . . . . . . . . . . . 46
38
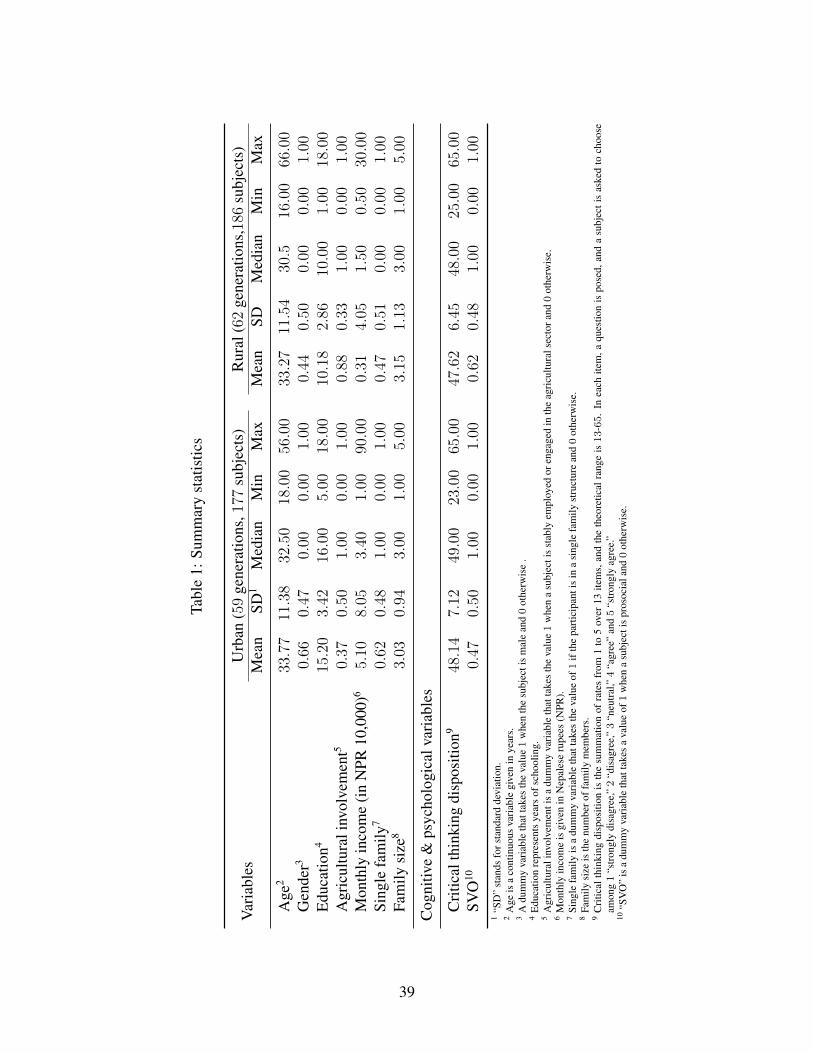
Tabl
e1:
Sum
mar
yst
atis
tics
Var
iabl
esU
rban
(59
gene
ratio
ns,177
subj
ects
)R
ural
(62
gene
ratio
ns,186
subj
ects
)M
ean
SD1
Med
ian
Min
Max
Mea
nSD
Med
ian
Min
Max
Age
233.77
11.38
32.50
18.00
56.00
33.27
11.54
30.5
16.00
66.00
Gen
der3
0.66
0.47
0.00
0.00
1.00
0.44
0.50
0.00
0.00
1.00
Edu
catio
n415.20
3.42
16.00
5.00
18.00
10.18
2.86
10.00
1.00
18.00
Agr
icul
tura
linv
olve
men
t50.37
0.50
1.00
0.00
1.00
0.88
0.33
1.00
0.00
1.00
Mon
thly
inco
me
(in
NPR
10,0
00)6
5.10
8.05
3.40
1.00
90.00
0.31
4.05
1.50
0.50
30.00
Sing
lefa
mily
70.62
0.48
1.00
0.00
1.00
0.47
0.51
0.00
0.00
1.00
Fam
ilysi
ze8
3.03
0.94
3.00
1.00
5.00
3.15
1.13
3.00
1.00
5.00
Cog
nitiv
e&
psyc
holo
gica
lvar
iabl
es
Cri
tical
thin
king
disp
ositi
on9
48.14
7.12
49.00
23.00
65.00
47.62
6.45
48.00
25.00
65.00
SVO
100.47
0.50
1.00
0.00
1.00
0.62
0.48
1.00
0.00
1.00
1“S
D”
stan
dsfo
rsta
ndar
dde
viat
ion.
2A
geis
aco
ntin
uous
vari
able
give
nin
year
s.3
Adu
mm
yva
riab
leth
atta
kes
the
valu
e1
whe
nth
esu
bjec
tis
mal
ean
d0
othe
rwis
e.
4E
duca
tion
repr
esen
tsye
ars
ofsc
hool
ing.
5A
gric
ultu
rali
nvol
vem
enti
sa
dum
my
vari
able
that
take
sth
eva
lue1
whe
na
subj
ecti
sst
ably
empl
oyed
oren
gage
din
the
agri
cultu
rals
ecto
rand
0ot
herw
ise.
6M
onth
lyin
com
eis
give
nin
Nep
ales
eru
pees
(NPR
).7
Sing
lefa
mily
isa
dum
my
vari
able
that
take
sth
eva
lue
of1
ifth
epa
rtic
ipan
tis
ina
sing
lefa
mily
stru
ctur
ean
d0
othe
rwis
e.8
Fam
ilysi
zeis
the
num
bero
ffam
ilym
embe
rs.
9C
ritic
alth
inki
ngdi
spos
ition
isth
esu
mm
atio
nof
rate
sfr
om1
to5
over
13ite
ms,
and
the
theo
retic
alra
nge
is13
-65
.In
each
item
,aqu
estio
nis
pose
d,an
da
subj
ecti
sas
ked
toch
oose
amon
g1
“str
ongl
ydi
sagr
ee,”2
“dis
agre
e,”3
“neu
tral
,”4
“agr
ee”
and5
“str
ongl
yag
ree.
”10
“SV
O”
isa
dum
my
vari
able
that
take
sa
valu
eof
1w
hen
asu
bjec
tis
pros
ocia
land
0ot
herw
ise.
39

Tabl
e2:
The
freq
uenc
yan
dpe
rcen
tage
ofge
nera
tion
choi
ces
betw
een
optio
nsA
andB
(per
cent
age
inpa
rent
hesi
s)
Gen
erat
ion
choi
ces
betw
een
optio
nsA
andB
Are
aTo
tal
Urb
anR
ural
A21
(35.59
%)
10(16.13
%)
31(25.62
%)
B38
(64.41
%)
52(83.87
%)
90(74.38
%)
Tota
l59
(100.00%
)62
(100.00%
)121
(100.00%
)
40
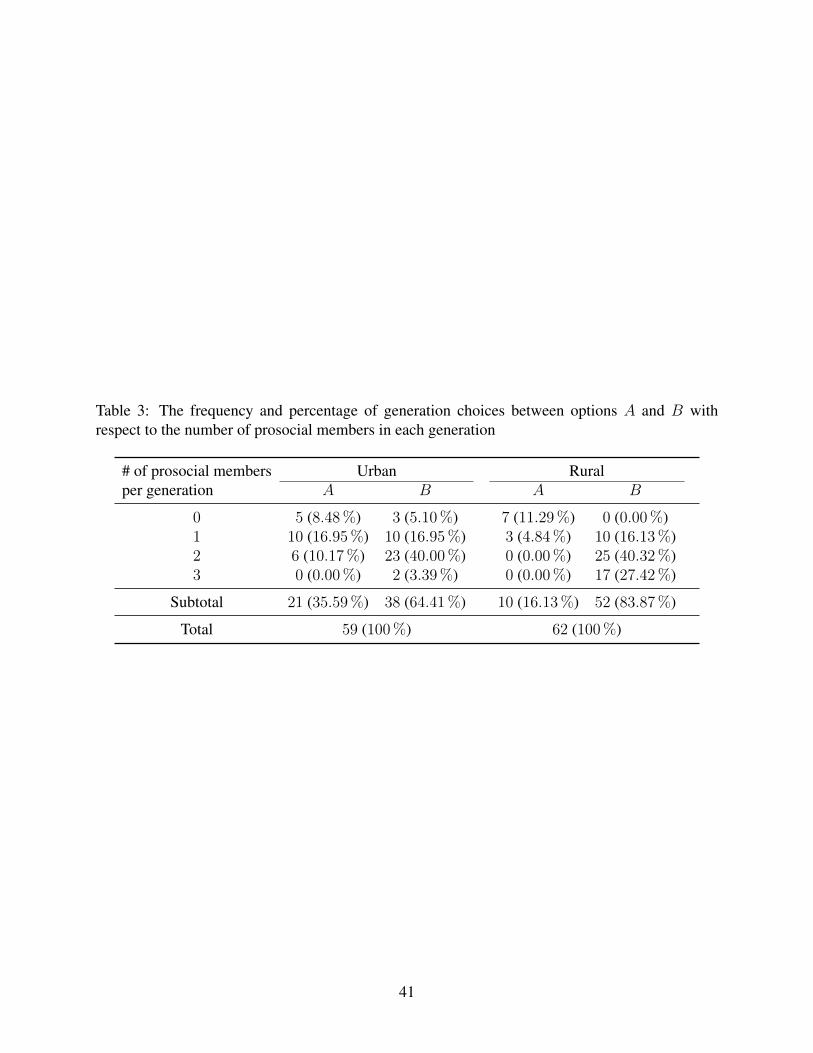
Table 3: The frequency and percentage of generation choices between options A and B withrespect to the number of prosocial members in each generation
# of prosocial membersper generation
Urban RuralA B A B
0 5 (8.48%) 3 (5.10%) 7 (11.29%) 0 (0.00%)1 10 (16.95%) 10 (16.95%) 3 (4.84%) 10 (16.13%)2 6 (10.17%) 23 (40.00%) 0 (0.00%) 25 (40.32%)3 0 (0.00%) 2 (3.39%) 0 (0.00%) 17 (27.42%)
Subtotal 21 (35.59%) 38 (64.41%) 10 (16.13%) 52 (83.87%)
Total 59 (100%) 62 (100%)
41

Tabl
e4:
Defi
nitio
nsof
the
vari
able
sin
clud
edin
the
regr
essi
ons
Var
iabl
esD
efini
tions
ofva
riab
les
incl
uded
inre
gres
sion
s
Var
iabl
esat
gene
ratio
nle
vel
Gen
erat
ion
choi
ces
betw
een
optio
nsA
andB
Adu
mm
yva
riab
leth
atta
kes1
ifth
ege
nera
tion
choo
seop
tionB
,oth
erw
ise0
.
#of
pros
ocia
lmem
bers
ina
gene
ratio
nA
num
bero
fpro
soci
alm
embe
rsin
each
gene
ratio
n.
Are
adu
mm
yA
dum
my
vari
able
that
take
s1
ifth
ege
nera
tion
isfr
omth
eru
rala
rea,
othe
rwis
e0
.G
ende
rA
vari
able
that
repr
esen
tsth
enu
mbe
rofm
ales
inea
chge
nera
tion.
Edu
catio
nA
vari
able
that
repr
esen
tsav
erag
eye
ars
ofsc
hool
ing
over
thre
esu
bjec
tsin
each
gene
ratio
n.M
onth
lyin
com
eA
vari
able
that
repr
esen
tsan
aver
age
hous
ehol
din
com
eof
thre
esu
bjec
tsin
each
gene
ratio
n.Si
ngle
fam
ilyA
vari
able
that
repr
esen
tsa
num
bero
fmem
bers
ina
gene
ratio
nth
atha
vea
sing
lefa
mily
stru
ctur
e.A
gric
ultu
rali
nvol
vem
ent
Ava
riab
leth
atre
pres
ents
anu
mbe
rofm
embe
rsin
age
nera
tion
who
enga
gein
agri
cultu
re.
Prev
ious
gene
ratio
nde
cisi
onA
dum
my
vari
able
that
take
s1
ifth
epr
evio
usge
nera
tion
choo
ses
optio
nB
,oth
erw
ise0.
Perc
enta
geof
choo
sing
optio
nB
inse
quen
cehi
stor
yA
vari
able
that
repr
esen
tsth
epe
rcen
tage
ofpr
evio
usge
nera
tions
that
chos
eop
tionB
ina
sequ
ence
.
Var
iabl
esat
indi
vidu
alle
vel
Indi
vidu
alop
inio
nch
ange
Adu
mm
yva
riab
leth
atta
kes
1w
hen
asu
bjec
tcha
nges
heri
ndiv
idua
lopi
nion
tosu
ppor
tA,B
orN
befo
rean
daf
terd
elib
erat
ion
orov
era
cour
seof
delib
erat
ion.
Cri
tical
thin
king
disp
ositi
onA
vari
able
that
repr
esen
tsth
esu
mm
atio
nof
rate
sfr
om1
to5
over
13ite
ms
ofqu
estio
nsea
chsu
bjec
tans
wer
sin
herq
uest
ionn
aire
and
the
theo
retic
alra
nge
is13
-65
.
Preu
nani
mity
Adu
mm
yva
riab
leth
atta
kes1
whe
nth
esu
bjec
tbel
ongs
toth
ege
nera
tion
inw
hich
allm
embe
rssu
ppor
ted
the
sam
eop
tion
befo
rede
liber
atio
n,ot
herw
ise0
.M
inor
ityA
dum
my
vari
able
that
take
s1
whe
nth
esu
bjec
thav
ea
diff
eren
top
inio
nfr
omot
hert
wo
mem
bers
ina
gene
ratio
n,ot
herw
ise0.
SVO
Adu
mm
yva
riab
leth
atta
kes1
whe
nth
esu
bjec
tis
iden
tified
aspr
osoc
ial,
othe
rwis
e0.
Gen
der
Adu
mm
yva
riab
leth
atta
kes1
whe
nth
esu
bjec
tis
mal
e,ot
herw
ise0
.A
gric
ultu
rali
nvol
vem
ent
Adu
mm
yva
riab
leth
atta
kes1
whe
nth
esu
bjec
teng
ages
inag
ricu
lture
sect
orot
herw
ise0.
Edu
catio
nA
vari
able
that
repr
esen
tsth
esu
bjec
t’sye
ars
ofsc
hool
ing.
Sing
lefa
mily
Adu
mm
yva
riab
leth
atta
kes1
ifth
esu
bjec
thas
asi
ngle
fam
ily,o
ther
wis
e0.
Mon
thly
inco
me
Ava
riab
leth
atre
pres
ents
mon
thly
hous
ehol
din
com
e.
42
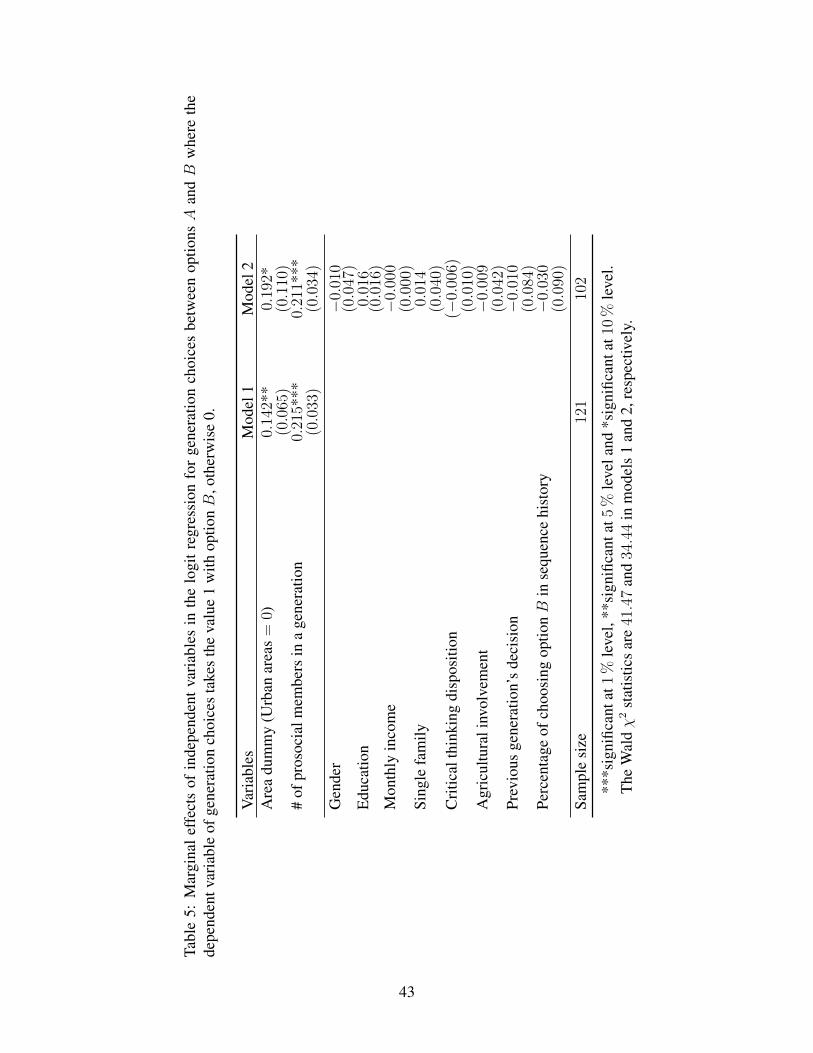
Tabl
e5:
Mar
gina
leff
ects
ofin
depe
nden
tvar
iabl
esin
the
logi
treg
ress
ion
for
gene
ratio
nch
oice
sbe
twee
nop
tionsA
andB
whe
reth
ede
pend
entv
aria
ble
ofge
nera
tion
choi
ces
take
sth
eva
lue
1w
ithop
tionB
,oth
erw
ise
0.
Var
iabl
esM
odel
1M
odel
2A
rea
dum
my
(Urb
anar
eas=
0)0.142*
*0.192*
(0.065)
(0.110)
#of
pros
ocia
lmem
bers
ina
gene
ratio
n0.215*
**0.211*
**(0.033)
(0.034)
Gen
der
−0.010
(0.047)
Edu
catio
n0.016
(0.016)
Mon
thly
inco
me
−0.000
(0.000)
Sing
lefa
mily
0.014
(0.040)
Cri
tical
thin
king
disp
ositi
on(−
0.006)
(0.010)
Agr
icul
tura
linv
olve
men
t−0.009
(0.042)
Prev
ious
gene
ratio
n’s
deci
sion
−0.010
(0.084)
Perc
enta
geof
choo
sing
optio
nB
inse
quen
cehi
stor
y−0.030
(0.090)
Sam
ple
size
121
102
***s
igni
fican
tat1
%le
vel,
**si
gnifi
cant
at5%
leve
land
*sig
nific
anta
t10%
leve
l.T
heW
aldχ2
stat
istic
sar
e41.47
and34.44
inm
odel
s1
and
2,re
spec
tivel
y.
43

Table 6: The frequency and percentage of change in individual opinions for supporting option “A,”“B,” or “N” ambivalent/no ideas before and after the deliberation (percentage in parenthesis)
Individual opinion changeAreas
Urban Rural
AA 30 (16.95%) 17 (9.14%)AB 12 (6.78%) 2 (1.08%)AN 9 (5.08%) 2 (1.08%)BB 99 (55.93%) 146 (78.49%)BA 11 (6.21%) 4 (2.15%)BN 9 (5.08%) 10 (5.38%)NN 2 (1.13%) 0 (0.00%)NA 3 (1.69%) 1 (0.54%)NB 2 (1.13%) 4 (2.15%)
Total 177 (100.00%) 186 (100.00%)
44

Tabl
e7:
The
num
bero
fgen
erat
ions
with
unan
imity
befo
rean
daf
tert
hede
liber
atio
n
Del
iber
atio
nU
nani
mity
Non
-una
nim
ityTo
tal
Bef
ore
9130
121
Aft
er75
46121
39ge
nera
tion
outo
f59
gene
ratio
nha
veun
anim
itybe
fore
delib
erat
ion
inur
ban,
whe
reas
52ou
tof6
2ge
nera
tion
inru
rala
reas
.
45

Tabl
e8:
Mod
els
1an
d2:
Mar
gina
leff
ects
ofin
depe
nden
tvar
iabl
esin
the
logi
treg
ress
ion
fori
ndiv
idua
lopi
nion
chan
ge
Var
iabl
esM
odel
1M
odel
2A
rea
dum
my
(Urb
anar
eas=
0)−0.101*
*−0.108*
(0.040)
(0.060)
Cri
tical
thin
king
disp
ositi
on−0.010*
**−0.010*
**(0.003)
(0.003)
Preu
nani
mity
−0.101*
*−0.105*
*(0.045)
(0.049)
Min
ority
0.162*
**0.141*
*(0.060)
(0.065)
Incl
udin
got
hers
ocio
-dem
ogra
phic
vari
able
sin
mod
el2
SVO
dum
my
(Pro
self=
0)−0.020
(−0.042)
Gen
der(
Bas
egr
oup=
fem
ale)
0.063
(0.046)
Age
−0.001
(−0.002)
Edu
catio
n(Y
ears
ofsc
hool
ing)
−0.010
(0.007)
Mon
thly
inco
me
0.000
(0.000)
Fam
ilysi
ze−0.014
(0.021)
Agr
icul
tura
linv
olve
men
t0.015
(0.051)
Sam
ple
size
363
331
***s
igni
fican
tat1
%le
vel;
**si
gnifi
cant
at5%
leve
l;*s
igni
fican
tat1
0%
leve
l.T
heW
aldχ2
stat
istic
sar
e43.06
and42.28
inm
odel
s1
and
2,re
spec
tivel
y,an
dth
eyar
esi
gnifi
-ca
ntat1%
leve
l.
46