introducing microsoft project 2007
DESCRIPTION
This is a very simple Training Material on using MS Project 2007TRANSCRIPT

0
Memo No (972)
Introducing Microsoft Project 2007
by
Dr. Abdalla ElDaoushy
Feb, 2009 Dec, 2009

1
1
Contents Page Exploring Microsoft Project Environment . . . 4 MS Project 2007 Screen . . . . . . 4 Standard Toolbar . . . . . . . 4 Formatting Toolbar . . . . . . . 6 View Bar . . . . . . . . 7
Creating a New Project . . . . . . 7 Create New Blank Project . . . . . . 7 Create a New Project based on a Template . . . . 7 Setting Up a Project Calendar . . . . . . 11
o Create a New Calendar . . . . . 12 o Set Up a Working Time Exception . . . . 14 o Global Calendar . . . . . . 17
Create MileStone Tasks . . . . . . 20 Change the Date Format . . . . . . 20 Setting Schedule Options . . . . . . 20 Saving Project Files . . . . . . . 21 Saving Files as Templates . . . . . . 21 Protecting Files . . . . . . . 22 Entering Tasks . . . . . . . 23 Creating Summary Tasks . . . . . . 25 Displaying and Hiding Tasks . . . . . . 26 Project Summary Task . . . . . . 26 Using Recurring Tasks . . . . . . 27 Recurring Tasks: Application . . . . . . 36 Task Notes . . . . . . . . 41
Manipulating Tasks & Constraints . . . . 42 Using Deadline Dates . . . . . . . 43 Adding Constraints . . . . . . . 45 Editing Tasks . . . . . . . . 47 Deleting Tasks . . . . . . . 47 Moving Tasks . . . . . . . . 47
Tasks Relationships (Dependences) . . . . 49

2
2
Page Resources . . . . . . . . . 52 What are Resources . . . . . . . 52 Creating Resource List (Example) . . . . . 52 Working Time for Resources . . . . . . 53 Rates for Resources . . . . . . . 55 Resource Notes . . . . . . . 56 Assigning Resources (Example) . . . . . 57
View Information . . . . . . . 61 Gantt Chart View . . . . . . . 62 Calendar View . . . . . . . 64 Task Usage View . . . . . . . 65 Resource Graph View . . . . . . . 68 Resource Sheet View . . . . . . . 69 Resource Usage View . . . . . . . 70
Quick Viewing & Printing Reports . . . . 71 Using “Print Preview”. . . . . . . 71
Reports . . . . . . . . . 72 Overview Reports . . . . . . . 73 Current Activity Reports . . . . . . 74 Costs Reports . . . . . . . . 75 Workload Reports . . . . . . . 76 Assignment Reports . . . . . . . 76 Visual Reports . . . . . . . . 77
Case Studies . . . . . . . . 79 Case Study No 1 . . . . . . . 80
o Basic Data . . . . . . . 80 o Resources: Standard Rate & Overtime Rate . . . 81 o Working Steps . . . . . . . 82

3
3
Page
Case Study No 2 (Arabic) . . . . . 97 o Background . . . . . . . 97 o Working Steps . . . . . . . 99
1. Create New Project . . . . . 99 2. Change the Start Date & Current Date of the Project . 99 3. Create a New Calendar . . . . . 100 4. Assign the New Calendar to the Project . . . 101 5. Make New Calendar as a “Global Calendar” . . 101 6. Enter Tasks, Durations & Relationships . . . 101 7. Coding & Organization . . . . . 106 8. Record the Resources in the “Resource Sheet” . . 113 9. Assign different Resources to different Tasks . . 116 10. Project’s Resources . . . . . 120 11. Design and Display the different Reports . . . 127
Case Study No 2 (English) . . . . . 128
Tracking (Follow Up) . . . . . . 175
Understanding Tracking . . . . . . 175 Updating Form . . . . . . . 175 Tracking Process . . . . . . . 179
1. Setting BaseLine . . . . . . 180 2. Tracking Progress . . . . . . 183 3. Status Date . . . . . . . 187 4. Reviewing Progress & Progress Line . . . . 188 5. Reschedule Uncompleted Work (F9 in P3e) . . . 190 6. Reviewing Progress . . . . . . 191 7. Group . . . . . . . . 191 8. Filter . . . . . . . . 193 9. View . . . . . . . . 196 10. Reporting on Project’s Progress . . . . 197
Coordinating Multiple Projects & Sharing Resources Among Projects . . . . . . . . . 198 References . . . . . . . . 203

4
4
Exploring Microsoft Project Environment MS Project 2007 Screen:
Standard Toolbar: New Open Save Print Search Print Preview Spelling Cut Copy Paste Format Painter Undo & Redo Hyperlink

5
5
Link Tasks Unlink Tasks Split Task Task Information Task Notes Task Drivers Assign Resources Publish All Information Group by Zoom IN Zoom Out Go to Selected Task Copy Picture Microsoft Project Help

6
6
Formatting Toolbar: (View/Toolbars…/Formatting) Outdent Indent Show Subtasks Hide Subtasks Hide Assignments Show
o Font o Bold o Italic o Underline o Align Left o Center o Align Right o Filter o Gantt Chart Wizard

7
7
View Bar: (View/View Bar)
Creating a New Project: Create New Blank Project:
o Click on the “New” icon.
Create a New Project based on a Template: o Click “File/New”, the New Project Task Pane displays
towards the left edge of the window:

8
8
o To use a Template that is already installed on the computer’s hard disk, click on the “On Computer…” link, the “Templates” window appears:

9
9
o Click on the “Project Templates” tab, a range of templates appears:
o Select and double-click the desired Template and continue modifying and adding activities as we will explain later on.
Inputting Start & Finish Dates:
o Click “Project/Project Information…”, the “Project Information” window appears:

10
10
o Use the drop-down calendar in the “Start date:” to select the Start date of the Project (for example 1/1/2010).
o Use the drop-down calendar in the “Current date:” to change
the date to for example 1/1/2010.
11
11
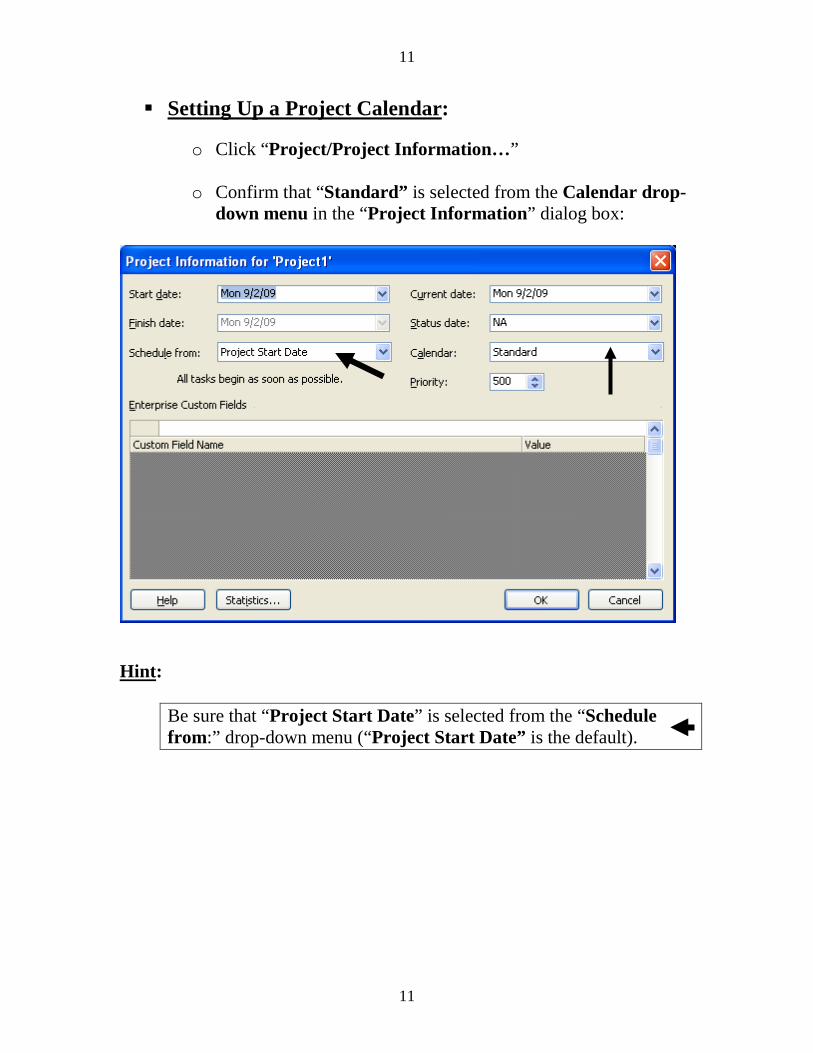
Setting Up a Project Calendar:
o Click “Project/Project Information…” o Confirm that “Standard” is selected from the Calendar drop-
down menu in the “Project Information” dialog box:
Hint:
Be sure that “Project Start Date” is selected from the “Schedule from:” drop-down menu (“Project Start Date” is the default).

12
12
To Create a New Calendar:
o Click “Tools/Change Working Time” o Click on the “Create New Calendar…” button, the “Create
New Base Calendar” dialog box appears:

13
13
o Enter a name (for example My Calendar) for the new calendar in the “Name” field.
o Press OK.

14
14
To Set Up a Working Time Exception:
1. Use “Exception” & “Work Weeks” tabs to determine the holidays (from “Exception” tab) & exceptions for default holidays to become working days (from “Work Weeks” tab).
2. In the “Name” column on the “Exception” tab, type a name that helps you remembers the purpose of the exception (holidays/non-default workdays).
3. In the “Start” column, select the date on which the
exception starts. 4. In the “Finish” column, select the date on which the
exception ends. Project sets every day between the starting and ending dates as an exception on the calendar, and the “Details” button and the “Delete” button become available.
5. Click the “Details” button. Project displays the details
dialog box. Use this dialog box to define the working time exception.
6. In the top section of the dialog box, click the “Working
Times” option button and then set the working times. 7. To repeat this working time pattern every Wednesday for
example, click “Weekly” in the “Recurrence pattern” section and check the “Wednesday check box.
8. In the “Range of recurrence” section, Project set the
starting and ending dates for the working time exception using the dates you supplied in steps 2 and 3. You can change these dates if you want.
9. Click OK. When Project redisplays the “Change
Working Time” dialog box, every “Wednesday” between the beginning and ending dates you specified appears as an exception on the calendar.

15
15
To Create a New Calendar Example: Create a new calendar called “Egypt Calendar” with the
following specification:
o It will be a Global Calendar. o Weekly working days will be from SUN to THU. o It has the following Holidays:
7 January --- (repeated) 1 May --- (repeated) 23 July --- (repeated) 6 October --- (repeated)
(Use “Details” tab after assigning in the “Exceptions”)
Now, 1. Create a new Project. 2. Click “Tools/ Change Working Time…/Create New Calendar…”,
the “Create New Base Calendar” window appears. 3. Enter the Calendar Name: Egypt Calendar 4. Choose the option: Create New Base Calendar. 5. Press OK, the “Change Working Time” window appears. 6. Click “Options…” tab. 7. Choose “Week starts on: Sunday & Press OK 8. Choose “Work Weeks” tab & Press “Details…” button, the “Details
for [Default]” window appears.
a. Adjust the working & nonworking days in this window.

16
16
9. Choose “Exceptions” tab. a. Highlight 7 of January b. Write in the Exception Name: “7 January” and click in the
“Start” column, the highlighted day becomes a nonworking-day with nonworking-color.
c. Press “Details…” button, the [Details for “7 January”]
window appears. d. To make this day repeated holiday for 10 years as an example;
in the “Recurrence pattern” section, choose “Yearly”. e. Choose “End after” radio-button and write 10 occurrences.
10. Repeat for “1 May”, “23 July”, & “6 October”. 11. The “Egypt Calendar” looks like this:

17
17
12. To make this Calendar a “Global” Calendar:
a. Choose “Tools/ Organizer…”, the “Organizer” window appears.
b. Click the “Calendar” tab, the window will looks like this:

18
18
c. Highlight “Egypt Calendar” and press “<<Copy”, the window will looks like the following window which means that the “Egypt Calendar” become Global and will be available for any project the same way as the “Standard Calendar”.
Hint: This is the place where you can delete any Calendar except the “Standard” one . . .

19
19
Applying (Assigning) the new calendar called “Egypt Calendar” to the Project:
o Click “Project/Project Information…” o Click on the “Calendar” down arrow. o Click on “Egypt Calendar” to select it. o Click OK.
Dates Format: Date format comes from Windows Setting as follows: Start / Setting / Control Panel
o “Regional Option” tab / Customize “Date” tab
• Short date format: dd-Mon-yy for example… • OK • Apply • OK

20
20
To Create Milestones Tasks:
o Milestones Tasks are tasks that usually have zero duration. o The symbol for a milestone on the “Gantt Chart” view is a
diamond shape.
o A Task does not have to have zero duration to be a milestone; you can mark any task as a milestone. On the “Advanced” tab of the “Task Information” dialog box, place a check mark in the “Mark Task As Milestone” check box. In this case, the task duration does not change to zero. However, the element that represents the task in the “Gantt Chart” changes from a bar, reflecting the task’s duration, to a milestone diamond symbol, representing the task as a moment in time. Hint: Check with 3 Sequential Activities: A (10 days & milestone), B (8 days), and C (2days) and see the result….
To Change the Date Format:
o Click “Tools/Options/View/Date Format”
Setting Schedule Options:
o “Tools/Options/Schedule” Show assignment units as a : Decimal (for example), Duration is entered in: days (for example), Work is entered in: days (for example), Default Task Type: Fixed Duration.
21
21
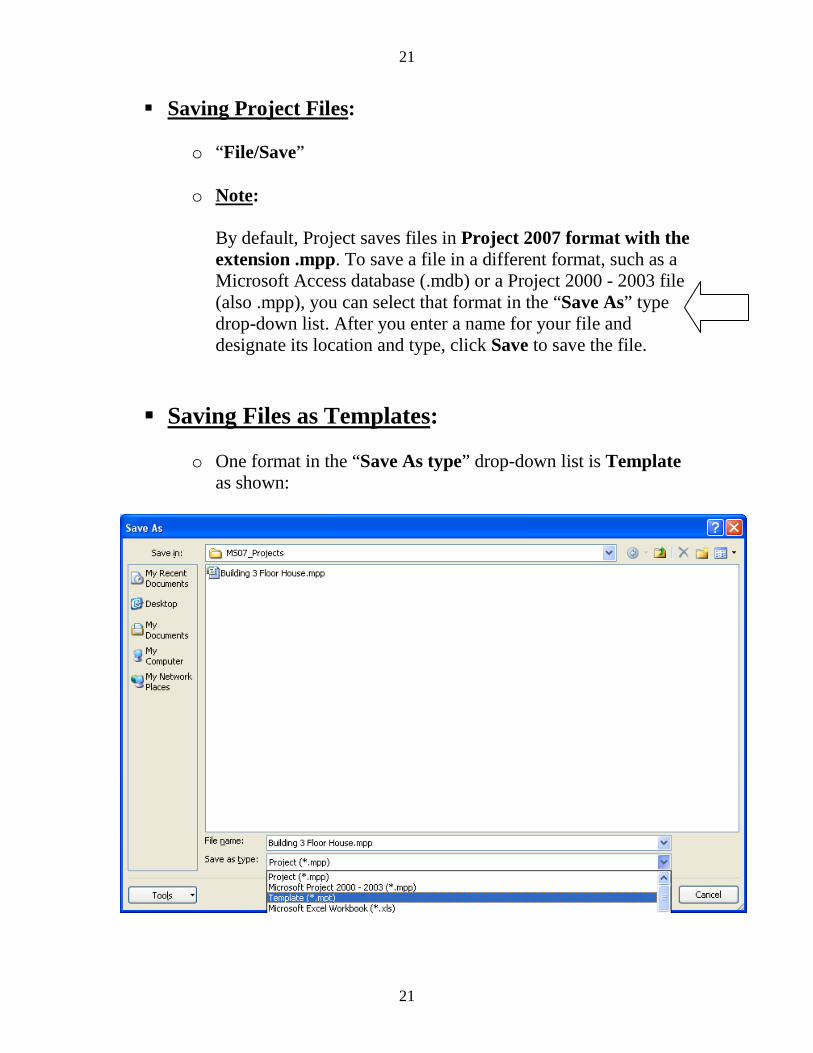
Saving Project Files:
o “File/Save” o Note:
By default, Project saves files in Project 2007 format with the extension .mpp. To save a file in a different format, such as a Microsoft Access database (.mdb) or a Project 2000 - 2003 file (also .mpp), you can select that format in the “Save As” type drop-down list. After you enter a name for your file and designate its location and type, click Save to save the file.
Saving Files as Templates:
o One format in the “Save As type” drop-down list is Template
as shown:

22
22
Protecting Files:
o “File/Save As” & “Tools” button as shown:

23
Entering Tasks:
o Create a new Project called “New Product Brochure_1” o Enter Tasks as shown:

24

25
Creating Summary Tasks: o Highlight row 1 and press “Ins” on the Keyboard; then type
“Write Brochure”. o Highlight rows 2, 3, 4, and 5 and press “Indent” button as
shown on the next page. o Repeat for the rest of activities as shown:

26

26
Displaying and Hiding Tasks (expanding or collapsing the Summary Tasks):
o The outline structure enables you to view your project at
different levels of detail by expanding or collapsing the summary tasks.
Project Summary Task:
o “Tools/Options/View tab” o Check “Show Project Summary Task”

27
27
Using Recurring Tasks:
Projects often have tasks that occur on a regular basis. For example, the following tasks:
o Weekly Staff Meetings. o Quarterly Reports, o Monthly Budget Reviews
may occur 20 or so weekly over the life of a 5-month project. Use the Project’s Feature that enables you to create the meeting
task, for example. Just once and assign a frequency and timing to it
Follow these steps to Create a Recurring Task:
1. Because Project inserts tasks above the selected task, select the
task that you want to appear below the recurring task and choose “Insert/Recurring Task” to open the “Recurring Task Information” dialog box, as shown:
4.8

28
28
2. Type the recurring task name in the “Task Name” field. 3. Set the task duration in the “Duration” field. For example, does
the meeting run for two hours, or does a report take a day to write? 4. Set the occurrence of the task by selecting one of the “Recurrence
Pattern” option buttons:
Daily, Weekly, Monthly, or Yearly.
5. Select the appropriate settings for the recurrence frequency. For a Weekly setting, place a check mark next to the day(s)
of the week on which you want the task to occur. For example, the task may occur every Tuesday.
For the Monthly or Yearly setting, select the day of the
month on which you want the task to occur. For example, the task occurs on Day 12 of every month.
For a daily task, you have only one choice: whether you
want it to occur every day or only on scheduled workdays. For example, to schedule a computer backup for every day of the week—regardless of whether anyone is at work—you can have the task occur every day. (Ask your IT department how to automate the process so that it occurs even when nobody is at work.)
6. Set the “Range of recurrence”, the period during which the task
should recur by entering “Start” and “End after” or “End by” dates. If you need to repeat a test weekly for only one month of your ten-month project, you can set “Start” and “End after” or “End by” dates that designate a month of time.
If you set the “End after” number of “occurrences”, Project calculates the date range that is required to complete that many occurrences of the recurring task and automatically displays the ending date in the “End by” box. This method can be useful if one of these events falls on a holiday:

29
29
If one of the occurrences falls on a holiday, Project displays a box that allows you to skip the occurrence or to schedule it on the next working day.
For a weekly staff meeting, you can skip that meeting or
schedule it on a different day.
On the other hand, if you must repeat a test 16 times during the project cycle, you can schedule the test to occur on the next working day to compensate for the holiday.
Therefore, set the number of occurrences rather than the
time range.
7. Click OK to create the task. Project creates the appropriate number of tasks and displays them as subtasks under a summary task with the name that you supplied in Step 2. FIGURE 4.10 Task bars appear for each occurrence of the recurring task in the “Gantt Chart”.
Returning back to our example called “New Product Brochure_1”:

30

31
Select row 10 and click “Insert/Recurring Task”, the “Recurring
Task Information” dialog box appears:
Enter “Team Meeting” in the “Task Name” box. Enter 1h in the “Duration” box. Select the “Daily” button in the “Recurrence pattern” area. Select the “Workdays” button.

32
32
In the “Range of recurrence” section, select the “End after” button
and write 3.
Click OK button to return back to the “Gantt Chart” view. Your
screen will now look like this:

33

34
Click on the “Outdent” button on the “Formatting” toolbar.

35
Expand the “Team Meeting” task by clicking on the “+” symbol.

36
Recurring Tasks: Application….. Suppose we would like to construct a Training Programs Plan for
the Year 2010. We have limited Training Classes & many Training Programs. We used to use a Class for two courses. Each course used to be held
for 3 days a week. For example, a class can be used for Windows Training Program to be held on SUN, TUE, and THU for two weeks & Word Training Program will be held at the same Class for SAT, MON, and WED for two weeks also.
After finishing of any of these Training Programs, another Training
Programs like Excel & Access will be held. In summary:
Class 1:
Course Title
Days
Working Days
1 Windows 6 SUN TUE THU . . . . . . 2 Word 6 SAT MON WED . . . . . . 3 Excel 9 SUN TUE THU After
Windows. 4 Access 12 SAT MON WED After Word

37
37
We have to do the following:
Create a new Calendar “Training Programs Calendar”: 6 Days/Week & Week Start on: SAT
Project Name: Class 1 Schedule Assign Calendar to Project Create the following Recurrence Tasks according to the above
information:
1. “Windows Program” Task 2. “Word Program” Task 3. "Excel Program” Task (Starts after “Windows Program”) 4. “Access Program” Task (Starts after “Word Program”)

38
38
Hint: Instead of writing the start date above, you can set the “Predecessor| for the “Excel Program 1” task (which is the “Windows Program 6”
task. Repeat for the rest of Tasks… Anyhow, this is not practical procedure….

39
39
Hint: Instead of writing the start date above, you can set the “Predecessor| for the “Access Program 1” task (which is the “Windows Program
6” task. Repeat for the rest of Tasks… Anyhow, this is not practical procedure….

40
40

41
Task Notes: Notes can be attached to a Task to quickly display information relating to that Task. Double-click on the “Print Brochure” Task; the “Task
Information” window appears. Select the “Notes” tab.
Type “Remember to ask Kate for recommended Printers”
Click OK.
Notice the symbol in the “Indicator” column.

42
42
Manipulating Tasks & Constraints: A Constraint is a restriction placed upon a task which limits the
Start or Finish Dates of that task. By default, the “As Soon as Possible” constraint is applied to every
task. The following represents a list of all of the Constraint Types:
o “As Soon As Possible”: Schedules the task to start as soon as
the beginning of the Project. o “As Late As Possible”: Schedules the task to end no later than
the end of the Project.
o “Finish No Earlier Than” or “Finish No Later Than”: Schedules the task to end no later or sooner than a specific date.
o “Must Finish On” or “Must Start On”: Schedules the task to
finish on or start on a specific date. o “Start No Earlier Than” or “Start No Later Than”:
Schedules the task to start no earlier than or later than a specific date.
Hint: Constraints come from “Task Information/Advanced tab”

43
43
Using Deadline Dates:
o You also can establish a deadline date for a task. The deadline date differs from a constraint in that Project doesn’t use the deadline date when calculating a project’s schedule. Instead, the deadline date behaves as a visual cue (sign) to notify you with a deadline dates. If you place your mouse over the deadline indicator, Project displays the deadline information. If the task finishes after the deadline date, you also see a symbol in the Indicators column. Be aware that you won’t see an indicator if you complete the task prior to the deadline date.
Deadline Field:
Description: The Deadline field shows the date you enter as a deadline for the task. A deadline is a target date indicating when you want a task to be completed. If the deadline date passes and the task is not completed, Microsoft Office Project displays an indicator. A deadline is also shown as an arrow in the “Gantt Chart” view.
Best Uses: Apply a deadline to a task when you want to track a deadline for a specific task but don't want to lock your schedule by setting an inflexible constraint such as Must Finish On or Finish No Later Than. Such constraints affect scheduling while the Deadline field simply causes an indicator to show if a task has not been completed by its deadline. Add the Deadline field to a task sheet when you want to enter, view, or change the deadlines of tasks in your project. You can also use the Deadline field for sorting, filtering, and grouping by deadline date.
Hint: A Deadline Date comes from “Task Information/Advanced tab”

44
44
Example:
Certain tasks in your project should finish by specific target dates. However, you don't want these dates to actually affect how Project schedules the tasks; you just want to be alerted if the tasks are not completed by these dates. Add the Deadline field to the Entry Table of the “Gantt Chart” view, and set the deadline dates for these tasks.
Remarks:
You can also enter a task deadline in the “Task Information” dialog box. Click “Task Information” and then click the “Advanced” tab. Click the date in the “Deadline” box.
If you do want Project to schedule tasks according to a specific finish date, apply either a Finish No Later Than, Finish No Earlier Than, or Must Finish On constraint. You can set task constraints on the “Advanced” tab of the “Task Information” dialog box.

45
45
Adding Constraints: Double-click the “Print Brochure” Task; the “Task Information”
dialog box appears. Click “Advanced” tab. Select “Start No Earlier Than” from the “Constraint type” drop-
down menu. Type 7/1/2004 in the “Constraint date” field Click OK. Notice how the “Print Brochure” tasks have been moved
in the “Gantt Chart” view.

46
47
Editing Tasks:
Tasks can be edited through their “Task Information” dialog box Double-click the “Teem Meeting 1” task to open its “Task
Information” dialog box. Change the “Duration” to 2h. Click OK.
Deleting Tasks:
Highlight the Task(s) in the “Gantt Chart” view and Press the “Del” key.
Undo the deletion by clicking on the “Undo” button in the “Toolbar”.
Moving Tasks:
Move the mouse-pointer over the “ID” number of the Task until the mouse-pointer changes to the shape of a “Move Cursor”.
Click and hold the mouse button. Drag the mouse-pointer until the “horizontal grey stripe” is above the row where the moved Task will be.

48

49
Tasks Relationships (Dependences):
There are two types of Tasks in a Relationship.
o A Predecessor Task must occur before another Task. o A Successor Task must occur after another Task.
Finish-to-Start (FS) Relationships:
It is the most common type of relationship. The start of one Task
begins as soon as its Predecessor Task finishes. The Successor Task can not start until the Predecessor Task finishes.
Start-to-Start (SS) Relationships: In the SS relationship, the Successor Task can not start until the
Predecessor Task starts. The Tasks can happen simultaneously, but the Predecessor Task needs to have started in order for the Successor Task to start.
Start-to-Finish (SF) Relationships: In a SF relationship, the Successor Task is completed after its
Predecessor Task starts. In other words, the Successor Task can not finish until the Predecessor Task starts. The SF relationship is rarely used.
Finish-to-Finish (FF) Relationships: In the FF relationship, the Successor Task can not finish until the
Predecessor Task finishes. For example; you finish installing computers at the same time that you finish moving employees into the building so that the employees can begin using the computers right away.

50
50
Hint: You can create Tasks Relationships from:
o “Task Information/Predecessor tab”, o “Window/Split”, or o Adding Predecessor/Successor column in the “Gant Chart”
Now, it is the time to create the Tasks Relationship in our example “New Product Brochure” using the following information:
Task
Predecessor
Type
Research New Product --- Create an Outline Research New Product Write a Rough Draft Create an Outline Edit Rough Draft Write a Rough Draft Prepare through Desktop Edit Rough Draft Get Quotes from Printer Prepare through Desktop Get Printed Get Quotes from Printer Create Mailing List Get Printed SS Do Mass Mail Out Create Mailing List

51
51

52
52
Resources
What are Resources:
Resources are People, Equipments, and Materials (Supplies) used to accomplish tasks and goals of the project.
Creating Resource List (Example):
Click “View/Resource Sheet”.
Click in the 1st row of the “Resource Name” column. Type “Jane Doe” and press “Return”.
Repeat for “Katie Aiko” & “Postage”.
For the resource “Postage”, select “Material” from the drop-down-list in the “Type” column.
Enter “Stamps” as a “unit of measurement” in the “Material Label” column.
Click “Save” in the “Toolbar” to save your work.

53
53
Working Time for Resources:
The “Base Calendar” which you choose for a resource determines its availability.
You can customize a resource’s calendar if necessary (i.e., blocking off vacation time for specific resource).
Double-click on “Jane Doe” in the “Resource Name” column. This will open the “Resource Information” dialog box. If necessary, click on the “General” tab.
Click on the “Change Working Time…” button, the “Change Working Time” window appears:

54
54
In the above screen, you can change the “Base calendar” and you can customize the Calendar from the “Exception” & Work Weeks” tabs.

55
55
Rates for Resources:
It is important to enter rates for a resource, as this allows MS-Project to calculate the overall cost of a project.
The resource’s cost may increase or decrease during the life of the project, and you need to be able to reflect these changes.
MS-Project allows entering up to 125 different cost rates for a resource and specifying the date at which the new rates takes effect.
In the “Resource Sheet” view, enter the following rates information for the different resources as shown:

56
56
Resource Notes:
You use Resource Notes in much the same way as Task Notes.
For example, double-click the “Jane Doe” resource which will display the “Resource Information” dialog box. Select the “Notes” tab.
Type “Send reminder regarding Team Meeting” in the “Notes” area:
Click OK button to save and attach the note to the resource.
Notice the “note symbol” in the “Indicator” column of the “Resource Sheet” view. Move your mouse cursor over it to display the note.

57
57
Assigning Resources (Example):
Open the “Gantt Chart” view.
Double-click on the “Team Meeting 1” Task; the “Task Information” dialog box appears. Click on the “Resources” tab:
In “Resource Name” column, select “Jane Doe” & “Kati Aiko” resources for this Task as shown:

58
58
Click OK button to close the dialog box.
Now, assign the following Tasks to “Jane Doe” using the “Resource Names” column in the “Gantt Chart”.
o Research New Product o Create an Outline o Write a Rough Draft
Assign the resource “Katie Aiko” to the following Tasks:
o Edit Rough Draft o Prepare through Desktop Publishing o Create Mailing List
Double-click on the “Do Mass Mail Out” Task to open its “Task Information” dialog box. Assign resources & units as shown:
Hint: “Assignment Owner” is a new feature in MS Project 2007. In this field, assign the Individual who is responsible for entering actual work or reporting progress against an assignment (MS Project 2007 Bible, page 510)

59
59
Save your Project.
The Gantt Chart view will look like this”

60
60

61
61
View Information:
You can use most views to enter and edit information, although some views can only display information.
All views are made up of 3 basic components:
o Chart or Graph: Information is represented by pictures.
o Sheet: Information is represented in a table format, similar to a worksheet.
o Form: Information about a single item is represented as it might be on a paper form.

62
62
Gantt Chart View: “View/Gantt Chart”
It is useful for entering task information and viewing the timing and relationship between tasks.
The “Gantt Chart” view is the default view within MS-Project. It consists of the Gantt Table & Gantt Chart.
The Timescale at the top of the “Gantt Chart” is set to show weeks (in the middle tier) and days (in the bottom tier) as the default.
However, you can adjust it to show any Timescale you wish:
o Double-click on the Timescale. This will display the “Timescale” dialog box:
o You can format any tier on the Timescale.

63
63
o Select Days (for example) instead of Weeks for the middle tier. A preview of changes is shown in the bottom portion of the dialog box:

64
64
o The “Gantt Chart” will now look like this:
o You can zoom in or out to view larger or smaller time increments in the Gantt Chart using the “Zoom In” and “Zoom Out” buttons in the “Toolbar”.
o You can also use “View/Zoom”. Experiment with using different levels of Zoom.
Calendar View:
The Calendar View is useful for a general overview of what needs to be done on a specific day. It uses a monthly format to show scheduled tasks.
To display the “Calendar View”, just click “Calendar” icon on the “View Bar” or “View/Calendar”.

65
65
Task Usage View: “View/Task Usage”
This View is useful for showing and organizing assigned Resources for each Task:

66
66
By default, the “Task Usage” table is shown in the left pane. To choose a different table, click on the “Select All” button (at the top-left-corner of the table).
Right-click and select the view you wish to see.
Work is shown in the “Details” section in the right pane. To select different options for the “Details” section, click on the “Select All” button and right-click. This gives you access to the “Timescale”, “Zoon”, and “Change Working Time” dialog boxes.
Right-click on “Work” in the “Details” column of the “Task Usage” chart, and select “Cost”.

67
67
Notice that now both “Work” & “Cost” are listed in the “Task Usage Chart”. The cost is displayed in the table.

68
68
Resource Graph View: “View/Resource Graph”
Click on the “Resource Graph” icon within the “View Bar”; or click “View/Resource Graph”:
Note: If the Resources are not visible, use the scroll bar at the bottom of the Graph Pane to navigate to the dates in which the project fall.
Notice how a red color represents Over-Allocations
Hint:
If there is no red color appears in the “Resource Graph” above, make the relationship between “Research New Product” & “Create an Outline” Tasks as of “SS” Type.

69
69
Resource Sheet View:”View/Resource Sheet”
This view is very useful for viewing, entering, and editing resource information. It contains detailed resource information in a worksheet format.
If an over-allocation exists, a warning flag is displayed in the “Indicator” column. In addition, the resource appears in red color.

70
70
Resource Usage View: “View/Resource Usage”
This view is useful for seeing each resource and the tasks assigned to that resource.
This view can be used for entering and editing resource information, or assigning tasks. To assign or reassign a task, drag and drop between resources.

71
71
Quick Viewing & Printing Reports:
Not all information is relevant to everyone, so it is important to be able to present the appropriate data to the right people.
Using “Print Preview”:
Returning back to our example “New Product Brochure.mpp”.
Display the “Print Preview” window, the screen will now look like this:
Note that “Print Preview” has its own toolbar; so Use this toolbar & “File/Page Setup” to arrange for the desired obtained report.

72
72
Reports:
Click on the “Report/Reports…”, the “Reports” dialog box displays:

73
73
Overview Reports:
Click “Overview…” report and then click “Select” button. You will see the following “Overview Reports” window:
There are 5 types of “Overview Reports”:
o Project Summary o Top-Level Tasks o Critical Tasks o Milestones o Working Days
Experiment the different types of reports, by choosing each of the options and clicking on the “Select” button.
Close the “Reports” dialog box.

74
74
Current Activity Reports:
There are 6 types of “Current Activity Reports”:
o Unstarted Tasks o Tasks Starting Soon o Tasks In Progress o Completed Tasks o Should Have Started Tasks o Slipping Tasks
Experiment the different types of reports, by choosing each of the options and clicking on the “Select” button.
Close the “Reports” dialog box.

75
75
Cost Reports: “Reports/Reports…/Costs”
Click “Reports/Reports…/Costs/Select”, the following “Cost Reports” window appears:
Experiment the different types of reports, by choosing each of the options and clicking on the “Select” button.
Close the “Reports” dialog box.

76
76
Workload Reports: “Reports/Reports…/Workload…”
Assignment Reports: “Reports/Reports…/Assignments…”

77
77
Visual Reports: “Reports/Visual Reports”
This allows taking the data from within a MS-Project, formatting that data, and then exporting that data to a different application as MS Excel or MS Visio.
Click “Report/Visual Reports…”, the “Visual Reports” dialog box appears:

78
78
Notice that at the top of the dialog box, by default, templates are shown that involve both “MS Excel” & “MS Visio”.
If you do not have “MS Visio” installed on computer, then you can remove the tick next to this option, so that only “MS Excel” templates are used.
Spend a little time experimenting with the Visual Reports feature.

79
79
Case Studies

80
80
Case Study No 1: Project Name: Case_1
Starting Date: 1/1/2010 Project Calendar: 5 days/Week [SUN]
The Resource “Trainer” is working one Overtime hour every day
Basic Data:
No Task Predecessor Rel. Type
OD (Day)
Resources (Work/ Equipment)
Max Units
Material Cost (Expenses)
1 Introduction --- --- 1 Trainer 1 $200 Project Manager 1 CAD Operator 1 Facilitator 1 Computers 10 Data Show 1
2 MS Project Introduction FS 1 Trainer 1 $20 CAD Operator 1 Computers 10 Data Show 1
3 Data Entry MS Project FS 1 Trainer 1 $20 CAD Operator 1 Computers 10 Data Show 1
4 Logical Relations
MS Project FS 2 Trainer 1 Data Entry SS CAD Operator 10 Computers 1 Data Show 1
5 Constraints Logical Relations
FF 1 Trainer 1 $20
CAD Operator 1 Computers 10 Data Show 1
6 Improvements Constraints FS 1 Trainer 1 $300 Project Manager 1 CAD Operator 1 Facilitator 1 Computers 10 Data Show 1

81
81
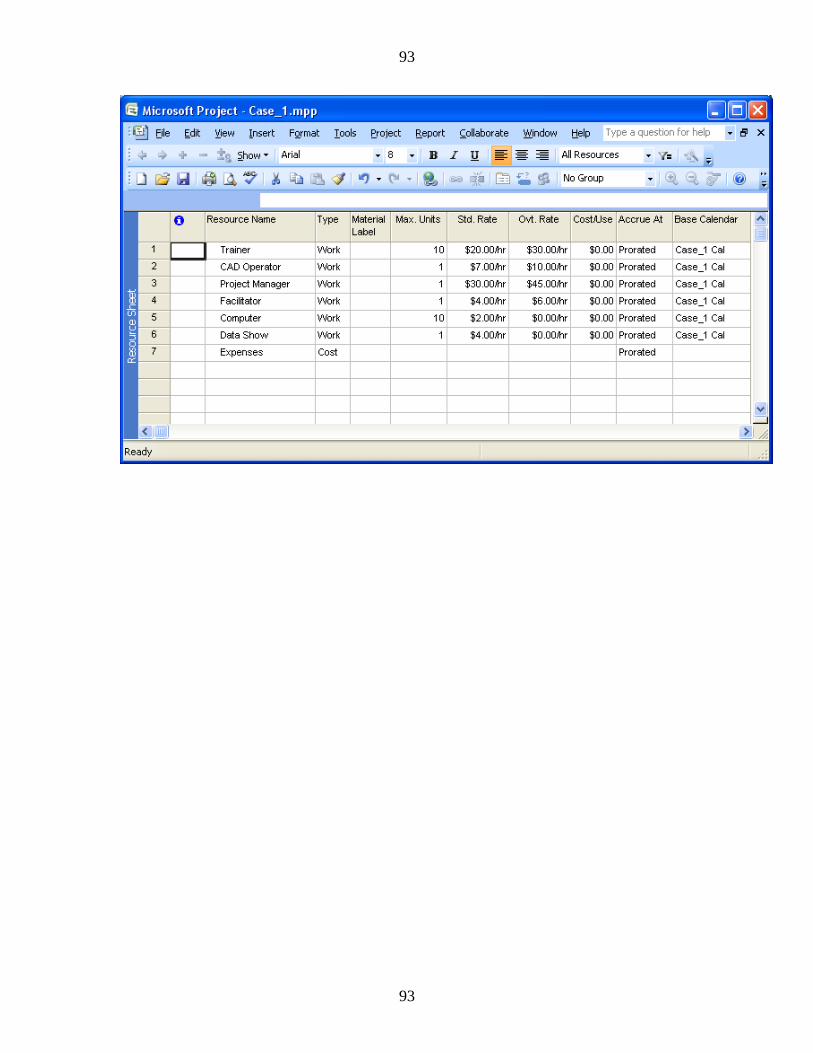
Resources: Standard Rate & Overtime Rate: No Resource Name Resource
Type Std Rate Overtime
Rate 1
Trainer Work $20/hr $30/hr
2
CAD Operator Work $7/hr $10/hr
3
Project Manager Work $30/hr $45/hr
4
Facilitator Work $4/hr $6/hr
5
Computer Equipment $2/hr ---
6
Data Show Equipment $4/hr ---
7
Expenses Cost --- ---

82
82
Working Steps: 1. Create a New Project called “Case_1”
2. Change the Start Date & Current Date of the Project to “1/1/2010”.
a. “Project/Project Information” b. Start date: 1/1/2010
c. Current date: 1/1/2010
3. Create a New Calendar: “Case_1 Cal”.
a. “Tools/Change Working Time” b. “Create New Calendar…”

83
83
c. Name: Case_1 Cal

84
84
d. Press “Options”
e. Week Starts on: Sunday f. Press OK g. Press “Work Weeks” tab on the “Change Working Time”
window, the “Details…” button becomes active.
h. Press “Details…” button.

85
85
i. Change the “Sunday” to Working day j. Change “Friday” to Non-working day
k. Press OK. 4. Assign “Case_1 Cal” to “Case_1” Project.
a. “Project/Project Information” b. Calendar: Case_1 Cal.

86
86

87
87
5. Enter Tasks, Durations & Relationships.
a. Sometimes, the Calendar in the “Bar-Chart” area does not coincide with the Project Calendar especially for the non-working days.
b. To resolve this problem, click in the “Bar-Chart” area and right-click to choose “Nonworking Time…”
c. Choose “Case_1 Cal” for “Calendar:” field, then the Gantt-Chart will look like the one above.

88
88
6. Record the Resources in the “Resource Sheet”.
a. “View/Resource Sheet”

89
89
7. Resource Assignment --- Assign different Resources to different Tasks:
a. Before Assigning Resources, It will be useful to change the
Task Types to “Fixed Duration” Tasks & Change the “Effort Driven” to “No”.
b. To facilitate this process, insert two columns as shown above
the make the necessary changes.
c. Now, assign the Resources.
i. Highlight the 1st activity and click the “Assign Resources” icon on the “Tool Bar” shown in the window above, the “Assign Resources” window appears:

90
90
ii. Choose the different resources to the specified task as shown:
Hint: “R/D” above means Request/Demand…
iii. Repeat with the other Tasks.

91
91
8. To check Resource Allocation, Click “Resource Sheet”:
9. Notice the Resource with red color. This means that there is an over-
allocation for this Resource.
10. Resolve Resource Over-Allocation: a. “Tools/ Level Resources”, the “Resource Leveling” window
appears:

92
92
b. Press “Level Now”. the result will be shown as follows:
c. Return back to the “Resource Sheet” and notice that there is a
problem with the “Trainer” Resource. To resolve this problem, assign a “Max. Units” of 10 Trainers; otherwise, the problem will exist.
93
93

94
94
11. Using Overtime:
Overtime work does not represent additional work on a Task;
instead, it represents the amount of time that is spent on a Task outside regular hours.
To Enter Overtime:
1. Display the “Gantt Chart” View (“View/Gantt Chart”) 2. Choose “Window/Split” to reveal the “Task Form” in the bottom
pane. 3. Click the “Task Form” to make it the active pane. 4. Choose “Format/Details/Resource Work”. Project adds the “Ovt.
Work” column to the “Task Form”:
5. Move to the top pane, and select the task to which you want to assign overtime.

95
95
6. Move to the bottom pane and fill in the “Overtime Work” for the appropriate Resource.
7. Click OK, Project adjusts the schedule. 8. You can adjust the “top pane” of the “Gant Chart” so that you
can display the “Overtime Work” & “Overtime Cost” columns as shown:

96
96
12. Design and Display the different Reports

97
97
Case Study No 2 (Arabic): Background:
1. You have been assigned the responsibility for scheduling and monitoring the progress of Building the 2nd Floor of a Villa.
2. Major Engineering Design tasks have been completed.
3. The Project consists of 28 major Activities (Tasks). The
following list of Project Activities includes the basic information which you need to schedule and track the principle Activities in the Project.
4. While you are in charge of the scheduling and implementation
of the overall Project, you will receive monthly reports of Project Implementation Progress from the Construction Site Supervisors.
5. On the basis of monthly reports from the Project Site, you will
monitor the progress of Project Execution.
6. In carrying out your assignment, you are aware that the OWNER is anxious to open the Project as early as possible.

98
98
This Case Study will cover the following points:
1. Project Calendar(s), 2. Work Breakdown Structure (WBS) with Responsible
Managers Assignment. 3. Entering Project Activities with their Duration and
Relationships.
4. Scheduling & Assigning Constraints. 5. Establishing Project & Activity Codes which may determine
Responsibilities and Type of Work. 6. Establishing Roles & Resources Dictionaries and Assign
them to Activities as needed to execute the Project which may be Labor, nonlabor (Equipment) [Work], Material, and Money (Expenses - Cost/Use).
7. Analyze Project Resources, Optimize the Project Plan,
Baselining the Project Plan, Execute, and Control (Update). 8. Producing different set of Reports, for example:
Tabular Schedules,
Bar Charts,
Time-Scaled Logic Diagrams,
Project Network Diagrams,
Resource and Cost Reports:
o Project Labor, Nonlabor (Equipment), Material,
and Expenses Costs,
o Project Cash-Flow, etc….

99
99
Now, Project Name: Case_2 Project Start Date: 1 Jan 2010 Project Current Date: 1 Jan 2010 Project Calendar: Case_2 Cal
Holidays:
o 7 January (Christmas --- repeated)
o 1 May (Workers Day --- repeated)
o 23 July (July Revolution --- repeated)
o 6 October (Vector Day --- repeated)
Working Steps:
1. Create New Project called “Case_2.1”
2. Change the Start Date & Current Date of the Project to “1/1/2010”.
b. “Project/Project Information”
c. Start date: 1/1/2010 d. Current date: 1/1/2010

100
100
3. Create a New Calendar: “Cae_2 Cal”.
a. “Tools/Change Working Time”
b. “Create New Calendar…”
i. Name: Case_2 Cal
ii. Press “Options”
iii. Week Starts on: Sunday
iv. Press OK
v. Press “Workweek” tab on the “Change Working Time” window.
vi. Change the “Sunday” to working day
vii. Change Friday to Non-working Day
viii. Press OK.
ix. Create the Calendar Holidays as mentioned above.

101
101
4. Assign “Case_2 Cal” to “Case_2.1” Project.
a. “Project/Project Information” b. Calendar: Case_2 Cal.
c. Press OK.
5. Make “Case_2 Cal” as a “Global Calendar”. 6. Enter Tasks, Durations & Relationships.
a. Look at the Gantt-Chart Area and notice the non-working days which contradicts the Project Calendar named “Case_2 Cal”.
b. To resolve this problem, click in the Bar-Chart Area and right-click to choose “Nonworking Time…”
c. Choose “Case_2 Cal” for “Calendar:” field.
d. Enter the Project Tasks & Relationships:

102
102

103
103

104
104

105
105

106
106
7. Coding & Organization:
a. Create two Fields from “Custom Fields” named “Responsibility” & “Type of Work” to represent just Codes for the Project Activities.
b. This can be done by creating “Custom Fields” as follows:
c. Click “Tools/Customize/Fields…”, the “Custom Fields”
window appears:
d. Write the field name “Responsibility” as Text1

107
107
e. Press “Lookup…” button to enter the different values for the
custom field as shown:
f. In the “Gantt Chart” view, insert a new column and choose “Responsibility” Custom Field.
g. Fill in and assign the Responsible for each Task in the Project.

108
108
h. Now, you can organize by “Responsibility” as follows:
i. Click “Project / Group by / Customize Group By…”, the following “Customize Group By” Window appears:
ii. Choose the Custom Field “Responsibility” as shown above.
iii. Press OK, the following Layout appears:

109
109

110
110
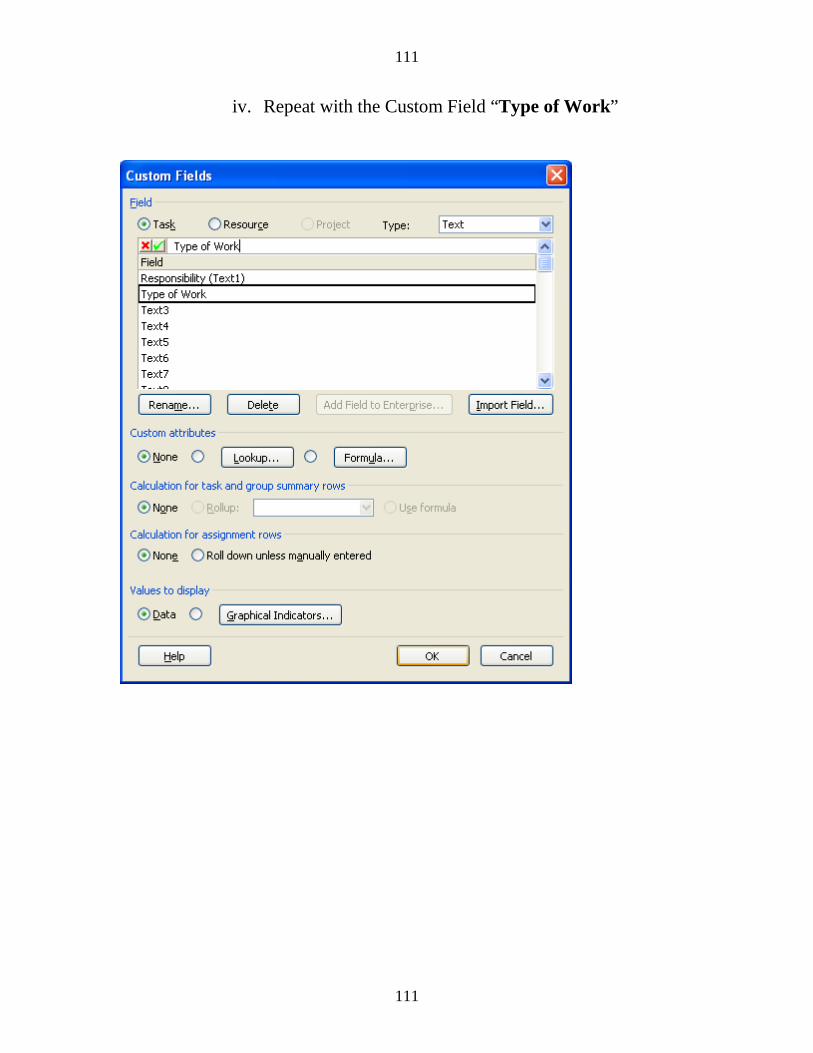
111
111
iv. Repeat with the Custom Field “Type of Work”

112
112

113
113
8. Record the Resources in the “Resource Sheet”:
a. “View/Resource Sheet” b. Fill in the Resources as shown:

114
114
Units of Measurements

115
115

116
116
9. Assign different Resources to different Tasks.
a. Before Assigning Resources, It will be useful to change the Task Types to “Fixed Duration” Tasks & Change the “Effort Driven to “No”.
b. To facilitate this process, insert two columns as shown:

117
117

118
118
c. You can also do the following at the beginning of Creating the Project:
“Tools/Options/Schedule”
• Duration is entered in: Days • Work is entered in: Days • Default Task Type: Fixed Duration

119
119
d. Now, assign the Resources:
i. Display the “Gantt Chart” and Split the Window.
ii. Display “Resource Work” in the bottom window
1. Right-click & choose “Resource Work”
2. Highlight the 1st activity and click on the bottom pane to Assign Resources.
3. Use the following “Table of Project’s Resources”

120
120
PROJECT’s RESOURCES (Activities are sorted by ES and TF)
ID Act. ID
Task
OD
Resource
Label UOM
Units
BQ (Work)
01
STA2 Start 2nd floor activities التجهيز لبدء العمل
01 0.00 0.00
02
CO22C100 2nd floor form work columns أعمال شد النجارة لألعمدة
07 CARPENTR نجار مسلح
6.00 42.00
03-1 CO22C200 2nd floor R.F.T columns رص الحديد لألعمدة
04 R.F.T حديد تسليح
TON 3.00 12.00
03-2
CO22C200 2nd floor R.F.T columns رص الحديد لألعمدة
04 STEELMEN حداد مسلح
3.00 12.00
04-1 CO22C300 2nd floor cast in place concrete columns صب الخرسانة المسلحة لألعمدة
03 CONC.MIX الخالطة الخرسانية
DAY 1.00 3.00
04-2 CO22C300 2nd floor cast in place concrete columns صب الخرسانة المسلحة لألعمدة
03 CON.LABR طقم الطبلية
1.00 3.00
04-3 CO22C300 2nd floor cast in place concrete columns صب الخرسانة المسلحة لألعمدة
03 CEMENT األسمنت
TON 10.00 30.00
04-4 CO22C300 2nd floor cast in place concrete columns صب الخرسانة المسلحة لألعمدة
03 SAND الرمل
CM 11.67 35.00
04-5
CO22C300
2nd floor cast in place concrete columns صب الخرسانة المسلحة لألعمدة
03 GRAVEL الزلط
CM 23.33 70.00
05-1 CO22C400 2nd floor curing time for columns فك الشدة الخشبية + أعمال المعالجة
05 WATERPRI ثمن المياه
CM 1.60 8.00

121
121
05-2
CO22C400 2nd floor curing time for columns فك الشدة الخشبية+ أعمال المعالجة
05 LABOUR 1.00 5.00
06
CO22S100 2nd floor (slabs+stairs) form work شد النجارة المسلحة لألسقف والساللم
11 CARPENTR نجار مسلح
10.00 110.00
07-1 CO22S200 2nd floor (slabs+stairs) R.F.T رص الحديد لألسقف والساللم
07 STEELMEN حداد مسلح
2.29 16.00
07-2
CO22S200 2nd floor (slabs+stairs) R.F.T رص الحديد لألسقف والساللم
07 R.F.T حديد تسليح
TON 3.71 26.00
08-1 CO22S300 2nd floor (slabs+stairs) cast in place صب الخرسانة المسلحة لألسقف والساللم
03 CON.LABR طقم الطبلية
2.00 6.00
08-2 CO22S300 2nd floor (slabs+stairs) cast in place صب الخرسانة المسلحة لألسقف والساللم
03 CONC.MIX الخالطة الخرسانية
DAY 2.00 6.00
08-3 CO22S300 2nd floor (slabs+stairs) cast in place صب الخرسانة المسلحة لألسقف والساللم
03 CEMENT األسمنت
TON 25.00 76.00
08-4 CO22S300 2nd floor (slabs+stairs) cast in place صب الخرسانة المسلحة لألسقف والساللم
03 SAND الرمل
CM 29.00 87.00
08-5
CO22S300 2nd floor (slabs+stairs) cast in place 03 GRAVEL الزلط
CM 58.00 174.00
09-1 CO22S400 2nd floor (curing time+removal of form work) slab
لألسقف والساللم فك الشدة الخشبية+ أعمال المعالجة
10 LABOUR عمالة عادية
1.00 10.00
09-2
CO22S400 2nd floor (curing time+removal of form work) slab
لألسقف والساللم فك الشدة الخشبية+ أعمال المعالجة
10 WATERPRI ثمن المياه
CM 2.00 20.00
10-1 BLO2 100 2nd floor block work thick 25 cm سم 25أعمال مباني
12 BRIC.LAY بنا
3.00 36.00
10-2 BLO2 100 2nd floor block work thick 25 cm سم 25أعمال مباني
12 CEMENT األسمنت
TON 1.75 21.00

122
122
10-3
BLO2 100 2nd floor block work thick 25 cm سم 25عمال مباني أ
12 BRICKMAT سم 25طوب
SM 180.00 2160.00
11-1 BLO2 200 2nd floor block work thick 12 cm سم 12أعمال مباني
04 BRIC.LAY بنا
2.00 8.00
11-2 BLO2 200 2nd floor block work thick 12 cm سم 12أعمال مباني
04 BRICKMAT سم 12طوب
SM 79.50 318.00
11-3
BLO2 200 2nd floor block work thick 12 cm سم 12أعمال مباني
04 CEMENT األسمنت
TON 0.75 3.00
12
WOD2 100 2nd floor (windows+doors) sub frames تركيب حلوق األبواب والشبابيك
07 DOORCARP نجار باب وشباك
4.00 28.00
13-1 ELE2 100 2nd floor electrical conduits تركيب مواسير الكهرباء في الحوائط
07 0.00 0.00
13-2
ELE2 100 2nd floor electrical conduits تركيب مواسير الكهرباء في الحوائط
07 0.00 0.00
14-1 INP2 100 2nd floor internal plastering for (walls+slabs) البياض الداخلي لألسقف والحوائط
20 PLAS.MEN صص بياض متخ
5.00 100.00
14-2 INP2 100 2nd floor internal plastering for (walls+slabs) البياض الداخلي لألسقف والحوائط
20 CEMENT األسمنت
TON 1.15 23.00
14-3
INP2 100 2nd floor internal plastering for (walls+slabs) البياض الداخلي لألسقف والحوائط
20 SAND الرمل
CM 5.55 111.00
14-4
INP2 100 2nd floor internal plastering for (walls+slabs) البياض الداخلي لألسقف والحوائط
20 GUYPSUM جيبس
TON 0.10 2.00
15-1 SAN2 100 2nd floor sanitary pipes تركيب مواسير الذهر
20 PLUMBER سباك
3.00 60.00
15-2
SAN2 100
2nd floor sanitary pipes تركيب مواسير الذهر
20 SAN.PIPE مواسير الصرف
الصحي
LM 7.50 150.00

123
123
16-1 INP2 200 2nd floor TRATZO plastering م عادة ما يكون في الممرات 2سفل بأرتفاع
08 PLAS.MEN متخصص بياض
3.00 24.00
16-2 INP2 200 2nd floor TRATZO plastering م عادة ما يكون في الممرات 2سفل بأرتفاع
08 CEMENT األسمنت
TON 1.25 10.00
16-3 INP2 200 2nd floor TRATZO plastering م عادة ما يكون في الممرات 2سفل بأرتفاع
08 SAND الرمل
CM 29.38 235.00
16-4 INP2 200 2nd floor TRATZO plastering م عادة ما يكون في الممرات 2سفل بأرتفاع
08 GUYPSUM جيبس
TON 0.13 1.00
16-5
INP2 200 2nd floor TRATZO plastering م عادة ما يكون في الممرات 2سفل بأرتفاع
08 WHITECEN أسنت أبيض
TON 0.38 3.00
17-1 SAN2 200 2nd floor potable water piping circuits سباكة تركيب مواسير الشرب -
09 PLUMBER سباك
3.00 27.00
17-2
SAN2 200 2nd floor potable water piping circuits سباكة تركيب مواسير الشرب -
09 IRON.PIP مواسير حديد
LM 21.11 190.00
18-1 ELE2 200 2nd floor electrical wires أدخال األسالك في المواسير الكهربية
14 0.00 0.00
18-2
ELE2 200 2nd floor electrical wires أدخال األسالك في المواسير الكهربية
14 0.00 0.00
19-1 FLO2 100 2nd floor mosaic tiles dim 40*40 cm سم 40*40تركيب بالط
10 MOSAIC سيراميك
SM 125.00 1250.00
19-2 FLO2 100 2nd floor mosaic tiles dim 40*40 cm سم 40*40تركيب بالط
10 TILE.MEN مبلط
2.00 20.00
19-3 FLO2 100 2nd floor mosaic tiles dim 40*40 cm سم 40*40تركيب بالط
10 SAND الرمل
CM 5.00 50.00
19-4
FLO2 100 2nd floor mosaic tiles dim 40*40 cm سم 40*40تركيب بالط
10 CEMENT األسمنت
TON 0.80 8.00
20-1 ISO2 100 2nd floor bathrooms proofing مال العزل للحمامات أع
02 ISO.MEN متخصص عزل
1.00 2.00

124
124
20-2
ISO2 100 2nd floor bathrooms proofing أعمال العزل للحمامات
02 INSULATI مادة عازلة
SM 100.00 200.00
21-1 CER2 100 2nd floor ceramic (walls+slabs) تركيب السيراميك للحمامات
04 CERAMIC سيراميك
SM 50.00 200.00
21-2 CER2 100 2nd floor ceramic (walls+slabs) تركيب السيراميك للحمامات
04 CER.MEN متخصص تركيب
سيراميك
2.00 8.00
21-3
CER2 100 2nd floor ceramic (walls+slabs) تركيب السيراميك للحمامات
04 SAND الرمل
CM 2.25 9.00
22-1 PAI2 100 2nd floor painting preparation layers أعمال البطانة للدهانات
06 PAINTMEN بياض متخصص
2.00 12.00
22-2
PAI2 100 2nd floor painting preparation layers أعمال البطانة للدهانات
06 PAINTMAT مواد الدهانات
SM 308.33 1850.00
23-1 FRP2 100 2nd floor frontal plastering بياض الواجهات
21 FRON.PLA مبيض محارة -
واجهات
4.00 84.00
23-2 FRP2 100 2nd floor frontal plastering بياض الواجهات
21 CEMENT األسمنت
TON 1.48 31.00
23-3 FRP2 100 2nd floor frontal plastering بياض الواجهات
21 SAND الرمل
CM 4.05 85.00
23-4 FRP2 100 2nd floor frontal plastering بياض الواجهات
21 GUYPSUM متخصص بياض
TON 0.05 1.00
23-5
FRP2 100 2nd floor frontal plastering بياض الواجهات
21 WHITECEN TON 0.14 3.00
24-1 SAN2 300 2nd floor install of sanitary fixtures سباكة تركيب األحواض والحنفيات -
06 PLUMBER سباك
2.00 12.00
24-2
SAN2 300 2nd floor install of sanitary fixtures سباكة تركيب األحواض والحنفيات -
06 SAN.FIXT صيني
PART 2.00 12.00

125
125
25-1 WOD 2200 2nd floor install (doors+windows) تركيب األبواب والشبابيك
10 DOORCARP نجار باب وشباك
7.20 72.00
25-2
WOD 2200 2nd floor install (doors+windows) تركيب األبواب والشبابيك
10 MOS.DOOR أبواب وشبابيك
موسكي
PART 7.20 72.00
26-1 PAI2 200 2nd floor final painting layers أعمال الدهانات النهائية
12 PAINTMAT مواد الدهانات
SM 308.33 3700.00
26-2
PAI2 200 2nd floor final painting layers أعمال الدهانات النهائية
12 PAINTMEN نقاش
2.00 24.00
27-1 ELE2 300 2nd floor electrical switches lighting fix تركيبات كهربائية نهائية
14 LIG.FIXT تركيبات كهربية
PART 17.86 250.00
27-2
ELE2 300 2nd floor electrical switches lighting fix هربائية نهائيةتركيبات ك
14 0.00 0.00
28
END2 2nd floor hand over activities تسليم المشروع
01 0.00 0.00

126
126
Work = Budget Quantity

127
127
10. Design and Display the different Reports

128
128
Case Study No 2 (English): Project Name: Case_2 Project Start date: 1 Jan 2010 Calendar: Case_2 Cal Holidays:
o 7 January (repeated) o 1 May (repeated) o 23 July (repeated) o 6 October (repeated)
Working Steps:
1. Create New Project called “Case_2.1 Basic Data”. 2. Change the Start Date of the Project to “1/1/2010”.
a. “Project/Project Information”
b. Start date: 1/1/2010
3. Create a New Calendar: “Case_2 Cal”.
a. Click “Tools/Change Working Time…” b. Click “Create New Calendar…”
i. Name: Case_2 Cal ii. Press “Options”
iii. Week Starts on: Sunday iv. Press OK v. Press “Work Weeks” tab on the “Change Working
Time” window. vi. Change the “Sunday” to working day
vii. Change Friday to Non-working day viii. Press OK.
ix. Create the Calendar Holidays as mentioned above.

129
129
4. Assign “Case_2 Cal” to “Case_2.1 Basic Data”.
a. Click “Project/Project Information” b. Calendar: Case_2 Cal.
c. Press OK.
5. Make “Case_2 C al” as a “Global Calendar”. 6. Enter Tasks, Durations & Relationships.
a. Do the following before Entering Tasks, Duration, & Relationship:
“Tools/Options/Schedule”
• Duration is entered in: Days • Work is entered in: Days • Default Task Type: Fixed Duration

130
130

131
131
b. Look at the Gantt-Chart area and notice the non-working days which contradicts the Project Calendar named “Case_2 al”.
c. To resolve this problem, click in the Bar-Chart area and right-click to choose “Nonworking Time…”
d. Choose “Case_2 Cal” for “Calendar:” field.
e. Enter the Project Tasks & Relationships:

132
132
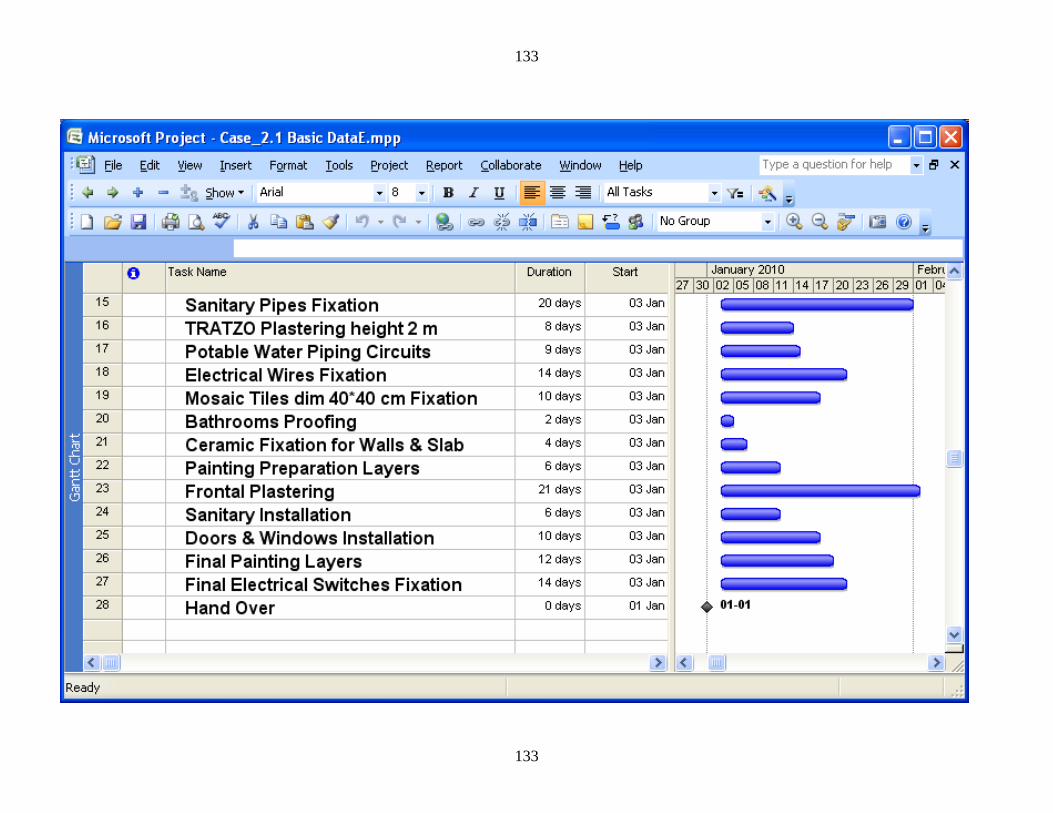
133
133

134
134

135
135

136
136
7. Coding & Organization:
a. Create two Custom Fields from “Tools / Custom Fields…” named “Responsibility” & “Type of Work” to represent just Codes for the Tasks of Project.
b. This can be done by creating “Custom Field” as follows:

137
137
c. Press “Lookup…” button to enter the different values for the custom field as shown:
d. In the “Gantt Chart” view, insert a new column and choose “Responsibility.
e. Fill in and assign the responsibility value for each task in the
Project. f. Now, you can organize by “Responsibility” as follows:

138
138
i. “Project / Group by: No Group / Customize Group By…”, the following window appears:
ii. Choose “Responsibility” in the “Field Name” of “Group By” as shown above.
iii. Press OK, the following Layout appears:

139
139

140
140

141
141
Coding & Organization:
In the previous Project “Case_2 Arabic”, we exercised the Project
Organization using the Task Code called “Responsibility”.
Now, let us create a Custom Field named “Type of Work” to represent just another Task Code in the Project.
This can be done by clicking “Tools / Customize / Fields…”, the Custom Fields window appears:

142
142
Write the name “Type of Work” as Text3:
Press “Lookup…” button to enter the different values for the Custom Field as shown:

143
143
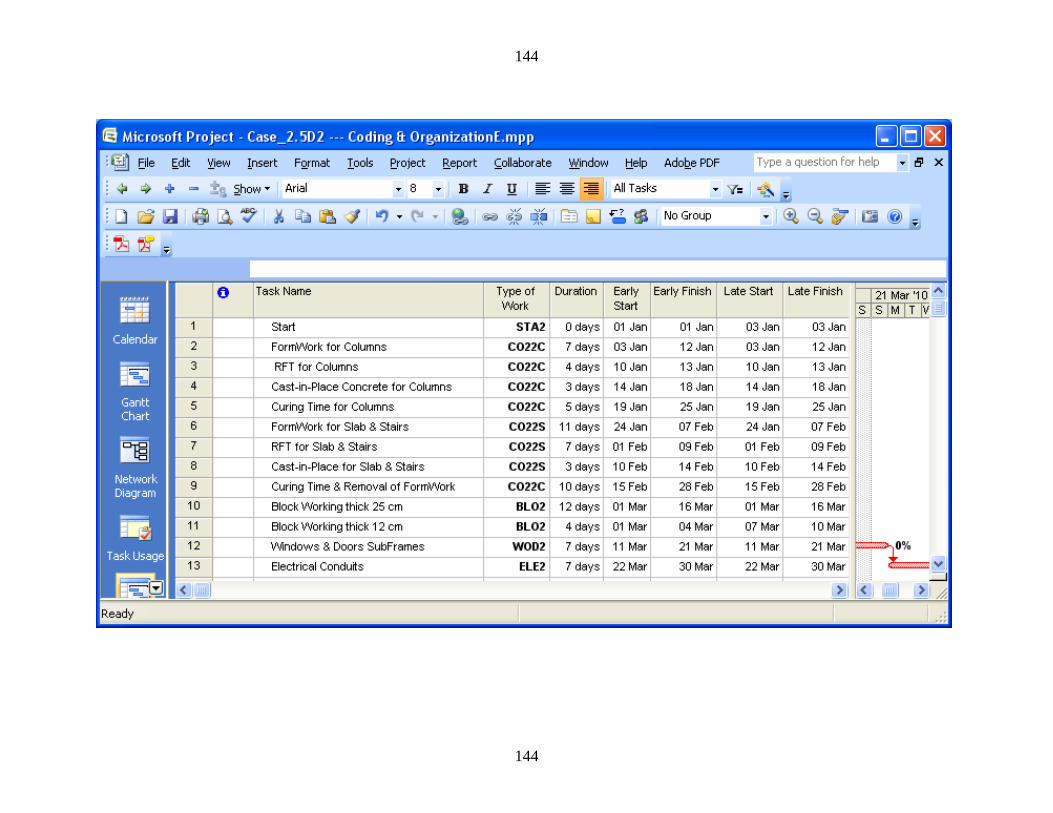
In the “Gantt Chart” View, insert a new column and choose “Type
of Work”.
Assign the specific Value corresponding to each Task as shown:
144
144

145
145
Now, Let us ask a Question Like this: Display All Tasks of Concrete for Columns.
To answer this Question, make a Filter using:
o “Project / Filtered for / More Filters… / New…”, the following window appears:
Press “New…”, the following window appears:

146
146
Fill in as shown:
Press OK, the following Layout including only the requested Tasks
appears:

147
147

148
148
In the same manner, you can display what you want.
Exercise you self and try to answer any question concerning this
Project.

149
149
8. Record the Resources in the “Resource Sheet”: a. “View/Resource Sheet” b. Fill in the Resources as shown:
Units of Measurements

150
150

151
151
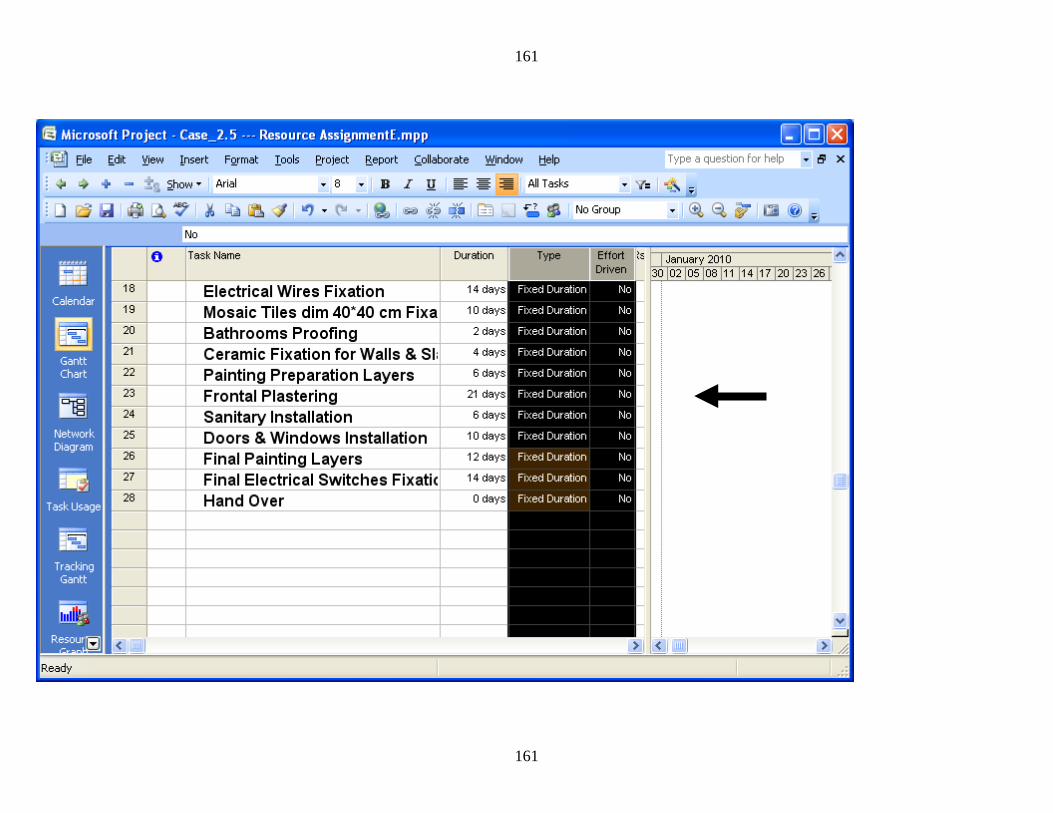
9. Assign different Resources to different Tasks. a. Before Assigning Resources, It will be useful to change the
Task Types to “Fixed Duration” Tasks & Change the “Effort Driven to “No”.
[Default: Task Type—Fixed Units & Effort Driven=Yes] b. To facilitate this process, insert two columns as shown:
c. You can also do the following:
i. “Tools/Options/Schedule”
• Duration is entered in: Days • Work is entered in: Days • Default Task Type: Fixed Duration

152
152
Task Types (Fixed Duration, Fixed Units, Fixed Work): The way MS Project uses Work, Duration, and Resources to schedule Tasks is called effort-driven scheduling, which is the default scheduling method. With effort-driven scheduling, the more Resources you assign to a Task, the shorter the Duration becomes. To have MS Project schedule a Task exactly the way you want it, you need to know how these factors do that. Changing the Task Type:
The Duration of each Task is determined by Resource Availability
and (most important) by the formula:
Duration = Work ÷ Resource Units or
Work = Duration * Resource Units If you assign Resources, MS Project uses this formula as the basis for
all its scheduling.
A Task Type (Fixed Duration, Fixed Units, or Fixed Work) is a method MS Project uses to calculate the Work, Duration, and Resource Units for a Task. You can choose the method you want MS Project to use on a Task-by-Task Basis.

153
153
Fixed-Units Tasks: Example, say you assign 2 full-time Painters to paint the walls
in 4 days. If you assign 2 more full-time Painters, MS Project reduces the duration to 2 days.

154
154
If you assign 2 more Painters, MS Project reduces the Duration to 2 days:

155
155
Fixed-Work Tasks:
When you set a Task to Fixed-Work, MS Project does not calculate the Work for the Tasks or Resources. Instead, as you change Resource Assignments, MS Project calculates Duration. For example, if you assign 2 Painters full-time to paint the walls in 4 days, and then you assign 2 more full-time Painters to the Task, MS Project reduces the Duration to 2 days.

156
156
Fixed-Duration Tasks:
When Duration is fixed, it remains at whatever value you enter and MS Project calculates Resource Units as you change Assignments. For example, say you assign 2 Painter full-time to paint the walls in 4 days:

157
157
Later, you assign 2 more full-time Painters. MS Project set the units for each Painter to %50 because 4 Painters need to work only half-time to complete the walls in 4 days: How ! ! !

158
158
Effort-Driven Tasks: Fixed-Work Tasks are always Effort-Driven Task.
For Fixed-Duration and Fixed-Units Tasks, you can tell MS Project
to modify the % of Total Work that is allocated to each Resource based on the number of Assigned Resources if the number of Resources changes.

159
159
In summary: Task Type: Fixed Units Effort Driven: Checked Task Duration Resource
(Units) New Duration
Work
A 10 1 10 10d 2 5 10d 5 2 10d Task Type: Fixed Duration Effort Driven: Checked/Unchecked Task Duration Resource
(Units) New Duration
Work
A 10 1 10 10d 2 10 10d 5 10 50d Task Type: Fixed Work Effort Driven: Checked by Default Task Duration Resource
(Units) New Duration
Work
A 10 1 10 10d 2 5 10d 5 2 10d Recommendation: It is better to set Fixed-Duration & No Effort-Driven in the normal and most common cases.

160
160
161
161

162
162
d. Now, Assign the Resources:
i. Display the “Gantt Chart” and Split the Window.
ii. Display “Resource Work” in the bottom window o right-click & choose “Resource Work”
iii. Highlight the 1st activity and click down to Assign
Resources.
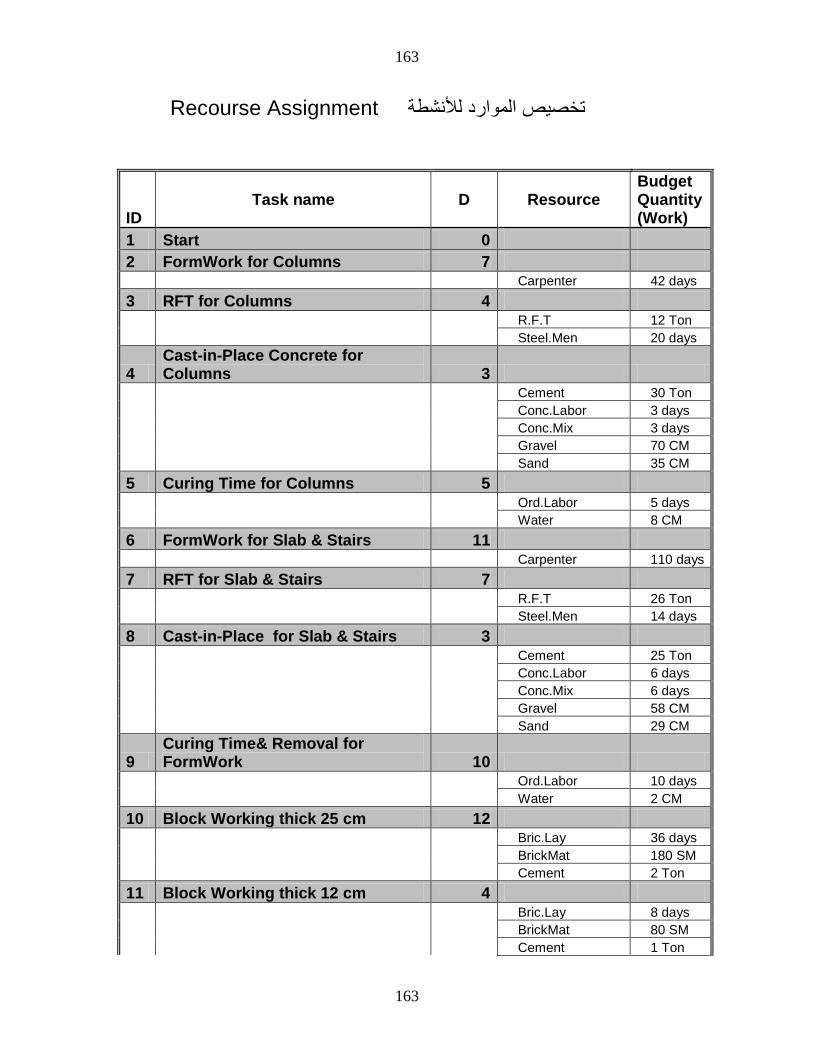
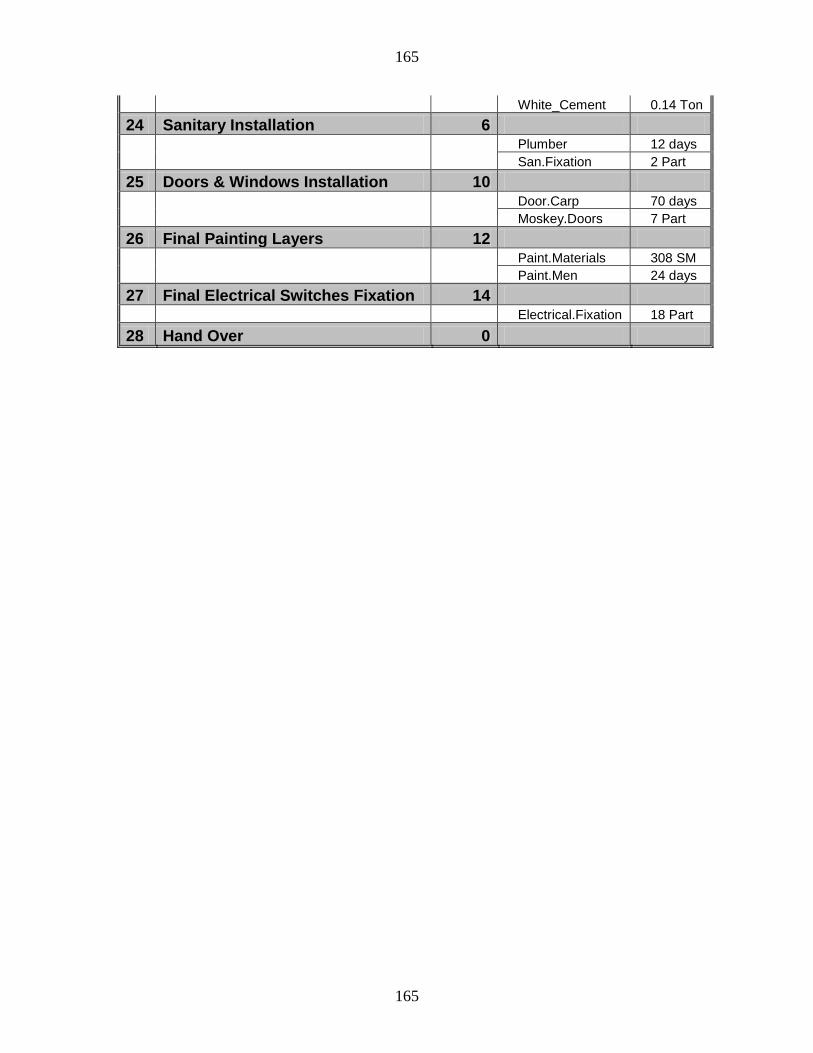
iv. Use the following sheet to assign Resources to different Activities.
163
163
Recourse Assignment تخصيص الموارد لألنشطة
ID Task name
D
Resource
Budget Quantity (Work)
1 Start 0 2 FormWork for Columns 7
Carpenter 42 days 3 RFT for Columns 4
R.F.T 12 Ton Steel.Men 20 days
4 Cast-in-Place Concrete for Columns 3
Cement 30 Ton Conc.Labor 3 days Conc.Mix 3 days Gravel 70 CM Sand 35 CM
5 Curing Time for Columns 5 Ord.Labor 5 days Water 8 CM
6 FormWork for Slab & Stairs 11 Carpenter 110 days
7 RFT for Slab & Stairs 7 R.F.T 26 Ton Steel.Men 14 days
8 Cast-in-Place for Slab & Stairs 3 Cement 25 Ton Conc.Labor 6 days Conc.Mix 6 days Gravel 58 CM Sand 29 CM
9 Curing Time& Removal for FormWork 10
Ord.Labor 10 days Water 2 CM
10 Block Working thick 25 cm 12 Bric.Lay 36 days BrickMat 180 SM Cement 2 Ton
11 Block Working thick 12 cm 4 Bric.Lay 8 days BrickMat 80 SM Cement 1 Ton

164
164
12 Windows & Doors SubFrames 7 Door.Carp 28 days
13 Electrical Conduits 7
14 Internal Plastering for Walls & Slab 20
Cement 1 Ton Gypsum 0.1 Ton Plast.Men 100 days Sand 6 CM
15 Sanitary Pipes Fixation 20 Plumber 60 days Iron.Pipes 7.5 LM
16 TRATZO Plastering height 2 m 8 Cement 1.25 Ton Guypsum 0.13 Ton Sand 29 CM TRATZO.Plasters 24 days White_Cement 0.38 Ton
17 Potable Water Piping Circuits 9 Plumber 27 days Iron.Pipes 21 LM
18 Electrical Wires Fixation 14
19 Mosaic Tiles dim 40*40 cm Fixation 10
Cement 0.8 Ton Mosaic 125 SM Sand 5 CM Tiles.Men 20 days
20 Bathrooms Proofing 2 IsolationMaterial 100 SM Iso.Men 2 days
21 Ceramic Fixation for Walls & Slab
4 Cer.Men 8 days Ceramic 50 SM Sand 2 CM
22 Painting Preparation Layers 6 Paint.Materials 308 SM
Paint.Men 12 days 23 Frontal Plastering 21
Cement 1.48 Ton Front.Plaster 84 days Gypsum 0.05 Ton Sand 4 CM
165
165
White_Cement 0.14 Ton 24 Sanitary Installation 6
Plumber 12 days San.Fixation 2 Part
25 Doors & Windows Installation 10 Door.Carp 70 days Moskey.Doors 7 Part
26 Final Painting Layers 12 Paint.Materials 308 SM Paint.Men 24 days
27 Final Electrical Switches Fixation 14 Electrical.Fixation 18 Part
28 Hand Over 0

166
166

167
167
Task Usage View:
This View is useful for showing and organizing Assigned Resources under each Task:
Hint:
o By default, the Task Usage Table is shown in the Left-Pane.
To choose a different Table, click on the “Select All” button (at the top-left-corner of the Table
o Right-click and select the View you wish to see…..
o Right-click on “Work” in the “Details” column of the “Task Usage Chart”, and select “Cost”. Notice that both the “Work” & “Cost” are listed in the “Task Usage Chart”.

168
168
Resource Graph (Histogram) View:
Click on the “Resource Graph” icon within the “View Bar”.
Hint:
o If the Resources are not visible, use the “Scroll Bar” at the bottom
of the “Graph Pane” to navigate to the Dates in which the Project fall.
o Notice how a red column represents “Over-Allocations”.

169
169
Resource Sheet View: This View is useful for viewing, entering, and editing information. It
contains detailed Resource Information in a Worksheet Format.
This View is very helpful in determining which Group, a Resource belongs to.
If an “Over-Allocation” exists, a warning flag is displayed in the “Indicator” column. In addition, the Resource appears in red color.

170
170

171
171
Resource Usage View: This View is useful for seeing each Resource and the Tasks assigned
to that Resource..
The View can be used for entering and editing Resource Information, or Assigning Tasks.
To Assign or Re-Assign a Task, drag-and-drop between Resources.
A warning flag appears in the “Indicator” column if an “Over-
Allocation” exists.

172
172

173
173
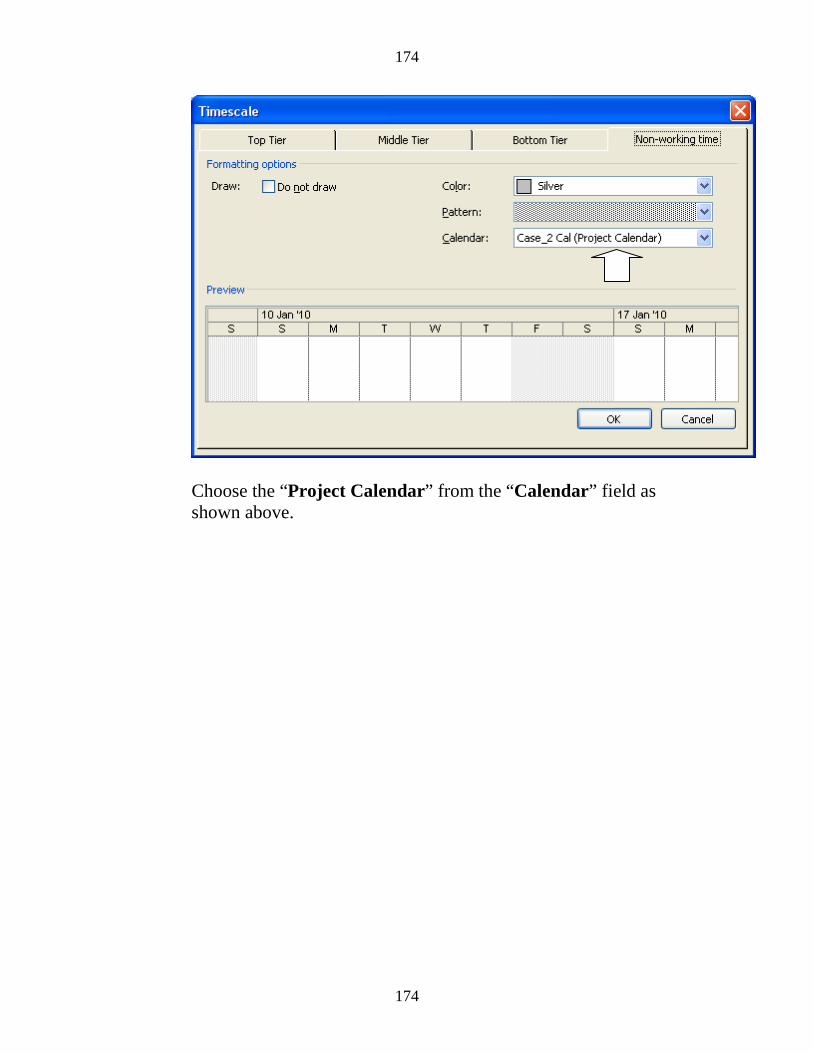
Hint: Sometime, the Gant-Chart Pane did not coincide with the Project
Calendar.
If this is the case, do the following:
o Double-click on the “Timescale”, the “Timescale” window appears:
o Click on the “Non-working time” tab as shown:
174
174
Choose the “Project Calendar” from the “Calendar” field as shown above.

175
175
Tracking (Follow Up) Understanding Tracking: Up to this point, you have been in the Planning Phase (Building a
Project Schedule, Entering Tasks, Adding Resources, and Resolving Resource Conflicts).
A good Plan is only half way. How you execute that Plan is the Key.
You now have a Workable, Good-Looking Project in hand --- and
now, you are ready to start the Project. Updating Form: If your organization has forms and processes to capture actual and
status information, use those forms and processes as much as possible.
You may want to create a form for participants to use for their regular reports. These reports should provide the information that you need to update your project plan in MS-Project. You may be able to use one of the reports in MS-Project (or customize one of the Project’s Reports) to provide the necessary information.
Create New Table as follows:
o Click “View/Table/More Tables/New…”
o Choose:
ID Name Duration

176
176
o Insert Blank columns (Text3) with the following Titles:
AS --- Actual Start AF --- Actual Finish AD --- Actual Duration RD --- Remaining Duration % --- Percent Complete AC --- Actual Cost AW --- Actual Work Notes --- Notes

177
177
o Click OK & Apply, the following Table appears.
o You can distribute it on the Engineers at the Site to fill in and make feedback.

178
178

179
179
Tracking Process:
First of all, Record the Start & Finish Date before tracking. In our case, these Dates are shown as follows:
Now,

180
180
1. Setting BaseLine:
o Click “Tools/Tracking/Set Baseline” o Press OK. This saves Baseline and displays it in the Gantt-
Chart area
o The following shows the Gantt-Chart before and after the Baseline:

181
181

182
182

183
183
2. Tracking Progress:
o Click “View/Table/Tracking”, the Tracking Table displays:

184
184

185
185
Updating Tasks to Reflect Actual Information: o Record Actual Information for the Project by filling in the
following fields for each Task that tracks the Progress of the Project (Actual Data from the Site):
ID
Task Name Dur AS AF PCT
1
Start 0 1/1/2010 1/1/2010
2 FormWork for Columns
7 4/1/2010 11/1/2010
3 RFT for Columns
4 8/1/2010 12/1/2010
4 Cast-in-Place Concrete for Columns
3 13/1/2010 16/1/2010
5 Curing Time for Columns
5 19/1/2010 25/1/2010
6 FormWork for Slab & Stairs
11 24/1/2010 10/2/2010
7 RFT for Slab & Stairs
7 30/1/2010 … 80.0
o Notice the AF of Task of ID=6; the Act Dur becomes 14
days instead of 11 days…..

186
186

187
187
3. Status Date: You can find the Project’s Status Date (Data Date) in the “Project
Information” dialog box. If the Status Date is not set, Project uses the Current Date.

188
188
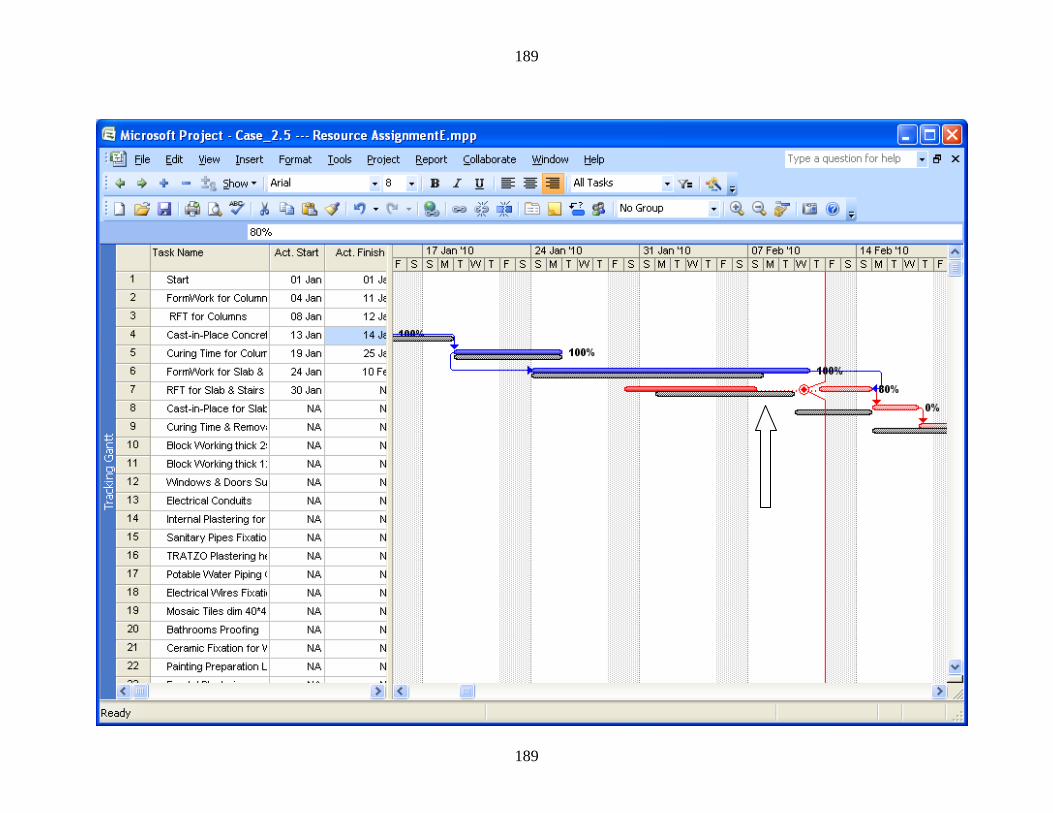
4. Reviewing Progress & Progress Line
a. Progress Line:
Click “Tools/Tracking/Progress Lines…”
189
189

190
190
5. Reschedule Uncompleted Work (F9 in P3e):
a. Click “Tools/Tracking/Update Project…”
b. Fill in the above window as shown above. That is, choose the option shown. Note that “11 feb” was the Status Date (Data Date --- Date of calculation for remaining tasks…)
c. Press OK. d. Now, notice the new Finish Date from the “Project
Information” as shown:
e. Notice that the Project delays 6 days. Before Updating, it was 2 September.

191
191
6. Reviewing Progress:
This phase needs to create the following:
1. Group, 2. Filter, 3. View including Screen, Table, Group, and Filter
7. Group: Click “Project/Group by/More Groups…/New…”, the following
window appears:
Fill in as shown above. Then, Click OK & Apply to check if it works.

192
192

193
193
8. Filter: Create a Dynamic Filter as follows:
o Click “Project/Filtered for/More Filters…/New…” o Name: Case_2 Dynamic Filter o Low Value <= Early Start <= High Value o Check “Show in menu” o Click OK & Apply:
Press OK & Apply, the following window appears

194
194
Fill in ,for example, as follows:
Press OK, another window appears for “High Value”. Fill it as
follows:
The following window appears. Notice the “Indicator”. The symbol
“√” appears for Completed Tasks:

195
195

196
196
9. Views:
Beside the Predefined Views discussed earlier, you can customize
your Views by clicking “View/More View…/New”.

197
197
10. Reporting on Project’s Progress:
Refer to Chapter 13, Microsoft Office Project 2007, Elaine Marmel, Reference No 2.

198
198
Coordinating Multiple Projects &
Sharing Resources Among Projects Example: Create a Project “S1”:
ID Task D Pred. 1 A1 5 2 A2 3 A1 3 A3 7 A2
Create a Project “S2”:
ID Task D Pred. 1 B1 5 2 B2 3 B1 3 B3 7 B2
Create a Project “S3”:
ID Task D Pred. 1 C1 5 2 C2 3 C1 3 C3 7 C2

199
199
Linking Tasks Across Projects:
To create a link between Tasks in different Projects, type the Project Name, a backslash, and then the Predecessor ID Number. For example: c:\MyProject.mmp\10. If the Predecessor Information is too long, use the “Task Information” dialog box.
o Now, open the 3 Projects at the same time to see the Task IDs
with their updating WBS Codes o Press “Window/Arrange All” o Double-click B1. Its predecessor will be: S1\1 [or S1.mmp\1]
(1 means ID of Task A1 or A1’s WBS Code).
o Double-click C1. Its predecessor will be: S2\1 (1 means ID of Task B1 or B1’s new WBS Code).
o Notice the dummy Activities due to relationships between
subprojects:

200
200
201
201
Create Resource Pool Project named RP.mmp o “View/Resource Sheet” o Enter the following Resources:
Resource Max. Units Rate Plumber 3 200/day Carpenter 5 150/day
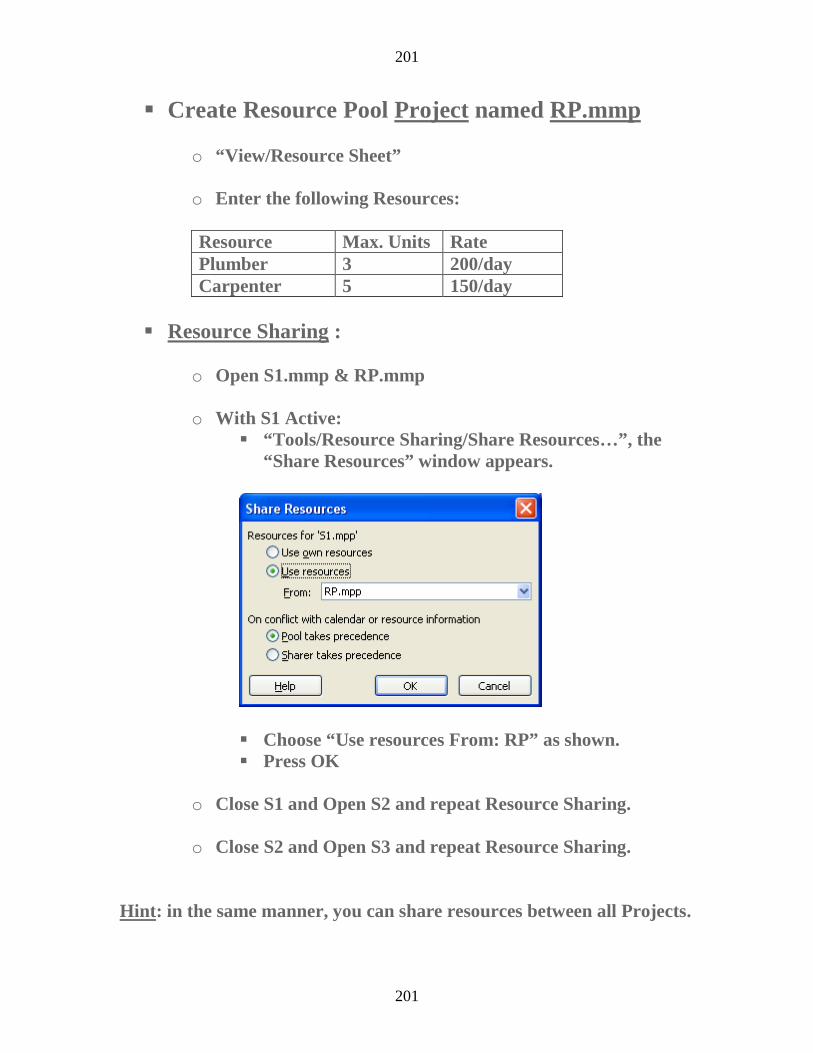
Resource Sharing :
o Open S1.mmp & RP.mmp o With S1 Active:
“Tools/Resource Sharing/Share Resources…”, the “Share Resources” window appears.
Choose “Use resources From: RP” as shown. Press OK
o Close S1 and Open S2 and repeat Resource Sharing. o Close S2 and Open S3 and repeat Resource Sharing.
Hint: in the same manner, you can share resources between all Projects.

202
202
Create a Main Project called “Main.mmp”: o Insert the 3 Projects. o Assign Resources to different Tasks . . .
o Notice the “Over-Allocation” of Resources . . .

203
203
References
1. CHELTENHAM Courseware
Microsoft Project 2007 Manual – Foundation Level USA / Canada Email: [email protected] Web: www.cheltenhamcourseware.com
2. Elaine Marmel, Microsoft Office Project 2007 Bible_Hendoone
3. Abdalla ElDaoushy, Projects Time Management & Controlling using Project Management Software, Memo No (971), Institute of National Planning, Cairo, Egypt
4. Abdalla ElDaoushy, Projects Cost Management (Computer Software Oriented), Memo No (973), Institute of National Planning, Cairo, Egypt