introduction and background - coorong district … b... · demonstrate a low risk to groundwater...
TRANSCRIPT

‘making water work’
AUSTRALIAN GROUNDWATER TECHNOLOGIES
ABN 97 110 928 928
GPO Box 2645, ADELAIDE SA 5001
Tel: (08) 8212 5622
Fax : (08) 8231 5399
www.agwt.com.au
20/1/2017
Jim Quinn
Manager Development and Environmental Services
Coorong District Council
PO Box 399
Tailem Bend, SA, 5260
our ref: 1597-16-DAI
Dear Jim
RE: Wellington East Groundwater Desktop Study.
Please find the following groundwater desktop study for Wellington East land development. The results
demonstrate a low risk to groundwater receptors from nutrient seepages including the River Murray
channel. Groundwater is interpreted to discharge to the adjacent floodplain rather than the River itself. This
negates the need for groundwater modelling, a water balance study and detailed risk assessment.
1. INTRODUCTION AND BACKGROUND
The Coorong District Council (CDC) own land on the Highland at Wellington East. This land has been
owned since the 1800’s and is currently being released for residential development. The land parcels are
located on the eastern side of the River Murray downstream from Lock 1. Up to 223 allotments will be sold
and developed over the coming years (i.e. next 10-20 years). The allotments are situated on the highland
above the 1956 flood level. The general location and specific details on the allotments are presented in
Figures 1 and 2.
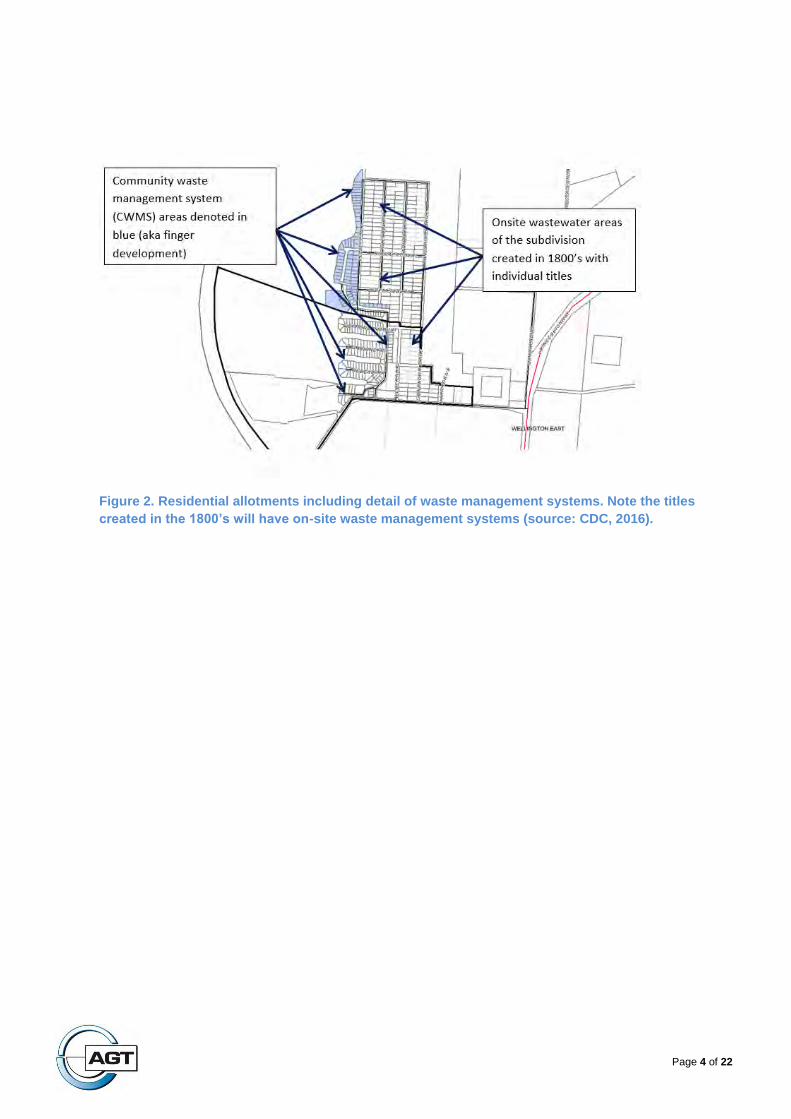
As part of the development Council have developed a community waste management system (CWMS) for
the western part of the development (Figure 2 – “finger allotments”). However most of the land parcels
incorporating the “1800’s allotments” will have on-site waste management systems. These systems will
received residential waste water including sewage and grey water. There is potential for these systems to
be converted to a CWMS once a critical mass of allotments are developed. This is expected to occur in 10-
15 years (J. Quinn, pers comm., 2017).
Given the proximity to the River Murray and Floodplain i.e. the River Murray Protection Area, the
Environmental Protection Authority (EPA) have requested that additional work be undertaken to
demonstrate that seepage from on-site waste systems will not affect water quality, in particular whether
seepage could:
Impact water quality in the River Murray.
Impact environmental receptors on the River Murray Floodplain.
Limit the availability of groundwater to 3rd party users.
This request was provided as a response to the Statement of Intent (SOI) submitted by the CDC. The EPA
response is presented in Attachment 1. To respond to the EPA the CDC engaged Australian Groundwater
Technologies to undertake a groundwater desktop study, gauge the level of risk from on-site management
systems and outline the next steps.

Page 2 of 22
2. SCOPE OF WORK
As agreed in the proposal dated 28/11/2016, the scope of work included:
Characterising baseline groundwater conditions within 3 km of the development. This included
review of the geology, hydro-stratigraphy, groundwater levels and salinity.
If sufficient information is available develop groundwater flow paths through the generation of
groundwater elevation contours.
Construct an east-west cross section detailing the conceptual hydrogeology. This was required to
understand how aquifers on the highland interact with the floodplain, and their relationship to the
River Murray and Lower Lakes.
Discuss the level of risk to groundwater receptors from the proposed development, and if required
develop mitigation strategies.
Outline the next steps.
3. DATA REVIEW
The groundwater data review involved downloading well data within 3 km of the allotments and review of
available hydrogeological literature. The following data sources were utilised as part of the review:
Surface geology and stratigraphic descriptions available from the Department of State
Development (SARIG, 2017) and Geoscience Australia Stratigraphic database (GA, 2017).
Hydrogeological Map of the Adelaide-Barker area published by the Murray Darling Basin
Commission (1994).
Groundwater and stage river level data available on WaterConnect (DEWNR, 2017).
Various technical reports on the lower River Murray published by the EPA and Murray Darling
Basin Authority (MDBA).
Geotechnical investigations conducted at Wellington East (Coffey, 2005).
Information provided by CDC.
The results of the data review are presented below.

WELLINGTON
TAILEM BEND
JERVOIS
WELLINGTON EAST
Source: Esri, DigitalGlobe, GeoEye, Earthstar Geographics, CNES/Airbus DS, USDA, USGS,
AeroGRID, IGN, and the GIS User Community
350000 352000 354000 356000 35800060
90
00
060
92
00
060
94
00
0
BRINKLEYTAILEM BEND
JERVOIS
WELLINGTON
Figure 1 | Site location map - Wellington East.
GDA 1994 | MGA Zone 54°0 2
Kilometres
1:40,000
Australian Groundwater Technologies does notwarrant that this documentis definitive nor free of error and does not accept liabilityfor any loss caused or arising from reliance uponinformation provided herein.
A4
Project Allottments - Wellington East
Page 4 of 22
Figure 2. Residential allotments including detail of waste management systems. Note the titles
created in the 1800’s will have on-site waste management systems (source: CDC, 2016).

Page 5 of 22
4. GEOLOGY
4.1 Surface Geology
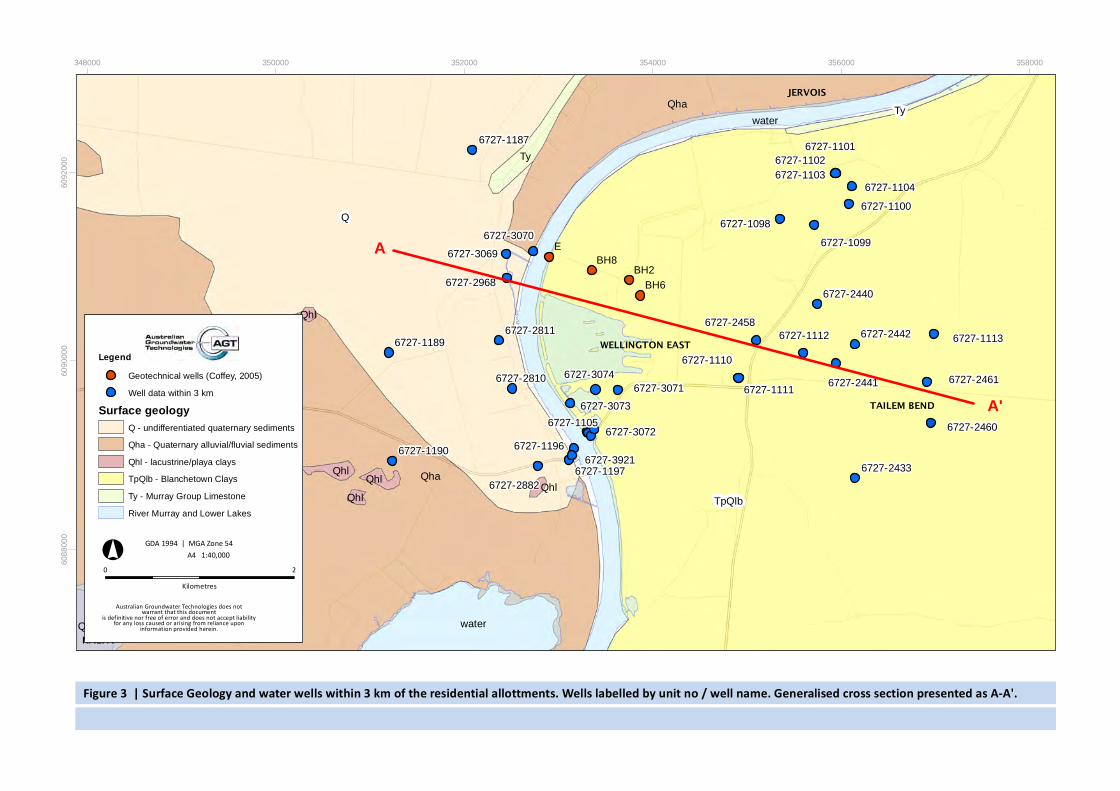
The surface geology (Figure 3, SARIG 2017) outlines that to the west of the River Murray the surface
geology is dominated by Quaternary Rocks commonly deposited in alluvial/fluvial (river) and playa lake
environments. To the east of the River Murray the Blanchetown Clay is the dominant Highland feature, with
small sections of Murray Group Limestone outcropping near Jervois. A summary of the surface geological
units is presented in Table 1.
Table 1. Descriptions of surface geology in the general area. See Figure 1 for locations.
Map Symbol Strat Name Description
Q Unnamed undifferentiated Quaternary Rock -Pleistocene to Holocene
Quaternary Rocks -Marine to intertidal shelly sand and clay, locally calcarenited at top. Calcreted foredunes of medium to coarse-grained skeletal carbonate sand.
Qha Unnamed undifferentiated Holocene Alluvial
Alluvial/Alluvial sediments (deposited in river environments).
Qhl Unnamed undifferentiated Holocene Lacustrine
Lacustrine/ Playa sediments
TpQlb Blancetown Clay Clay, greenish grey, interbedded with thin limestone and quartz sand; Clay green grey, mottled sandy.
Ty Murray Group Limestone Limestone -Consolidated well bedded pale grey, yellow, white, cream, highly fossiliferous skeletal calcarenite, calcareous cemented quartz sandstone, bioclastic limestone interbedded with minor carbonaceous clay and silt
4.2 Sub-surface Geology
WaterConnect (DEWNR, 2017) was interrogated to obtain stratigraphic logs of the sub-surface. Of
particular interest are two stratigraphic drillholes on the banks of the Murray adjacent to the Wellington
Road Ferry crossing. A summary of these logs is presented in Table 2.
The logs report that the Coonambidgal Formation extends to > 25 m depth in the Wellington area. This unit
is of particular importance due to it’s low-permeability. Unlike other locations where the Murray River
channel is directly underlain by permeable Monoman Formation sand (e.g. the Riverland), the
Coonambidgal Formation acts as a hydraulic barrier, reducing infiltration between the River and adjacent
limestone aquifers. This is discussed further in Section 5 and presented in the Hydrogeological cross
section (Figure 9).
Lithology on the highland differs somewhat to the floodplain, as shallow sediments are dominated by wind
blown sands which are further underlain by clay and limestone. Lithology logs obtained from WaterConnect
and used in the cross section (Figure 9) are presented in Appendix 2. Coupled with interpretations from the
Adelaide-Barker Hydrogeological Map (MDBC, 1994), the Limestone units to the east of the River are
Quaternary in age (Coomandook Formation), while to the west the Murray Group Limestone is present
(Tertiary Limestone). The transition between the two Limestone units is unclear as the drillholes do not
extend to sufficient depth below the River Channel.

Page 6 of 22
Table 2. Stratigraphic logs at the Wellington Road River Crossing.
Unit Number Depth from (m)
Depth to (m)
Map Symbol
Stratigraphic name
Unit Description
6727-1105 0 45 Qhac Coonambidgal Formation
Alluvial flood plain and fan deposits, channel sands and clay playettes
45
Qam Monoman Formation
Fine to coarse sands and gravels, channel sands.
6727-1196 3.5 22.25 Qhac Coonambidgal Formation
Alluvial flood plain and fan deposits, channel sands and clay playettes
22.25
Qam Monoman Formation
Fine to coarse sands and gravels, channel sands.
6727-2460
6727-1101
6727-3921
6727-3074
6727-30736727-3072
6727-3071
6727-30706727-3069
6727-2968
6727-2882
6727-2811
6727-2810
6727-2458
6727-2461
6727-2442
6727-2441
6727-2440
6727-24336727-11976727-11966727-1190
6727-1189
6727-1187
6727-11136727-1112
6727-1111
6727-1110
6727-1105
6727-11046727-11036727-1102
6727-1100
6727-10996727-1098Q
TpQlb
Qha
Qha
water
water
Ty
Qhl
Qhl
Qhl
Ty
Qhl
Qhl
Qhl
Qhl
QhlQhl
Qhl
Qhl
Qhl
E
BH6
BH2BH8
WELLINGTON
TAILEM BEND
WELLINGTON EAST
JERVOIS
NALPA
348000 350000 352000 354000 356000 35800060
88
00
060
90
00
060
92
00
0
Figure 3 | Surface Geology and water wells within 3 km of the residential allottments. Wells labelled by unit no / well name. Generalised cross section presented as A-A'.
GDA 1994 | MGA Zone 54°0 2
Kilometres
1:40,000
Australian Groundwater Technologies does notwarrant that this documentis definitive nor free of error and does not accept liabilityfor any loss caused or arising from reliance uponinformation provided herein.
A4
LegendGeotechnical wells (Coffey, 2005)
Well data within 3 km
Surface geologyQ - undifferentiated quaternary sediments
Qha - Quaternary alluvial/fluvial sediments
Qhl - lacustrine/playa clays
TpQlb - Blanchetown Clays
Ty - Murray Group Limestone
River Murray and Lower Lakes
A
A'

Page 8 of 22
5. HYDROGEOLOGY
The following section describes the hydrogeology of the area in more detail. Information has been derived
from DEWNR WaterConnect (2017) and the MDBC hydrogeological map sheet (Adelaide-Barker
Hydrogeological Map, 1994).
5.1 Groundwater salinity and yield.
Salinity can be used to infer the potential uses and value of groundwater in the general area. Groundwater
that is fresh will have a high value as it can be used for multiple purposes including drinking water, stock
and irrigation. On the other hand if groundwater is brackish (1,500-3000 mg/L) or saline (>3,000 mg/L),
uses are restricted for stock, salt tolerant irrigation (e.g. Lucerne) or for industrial purposes only.
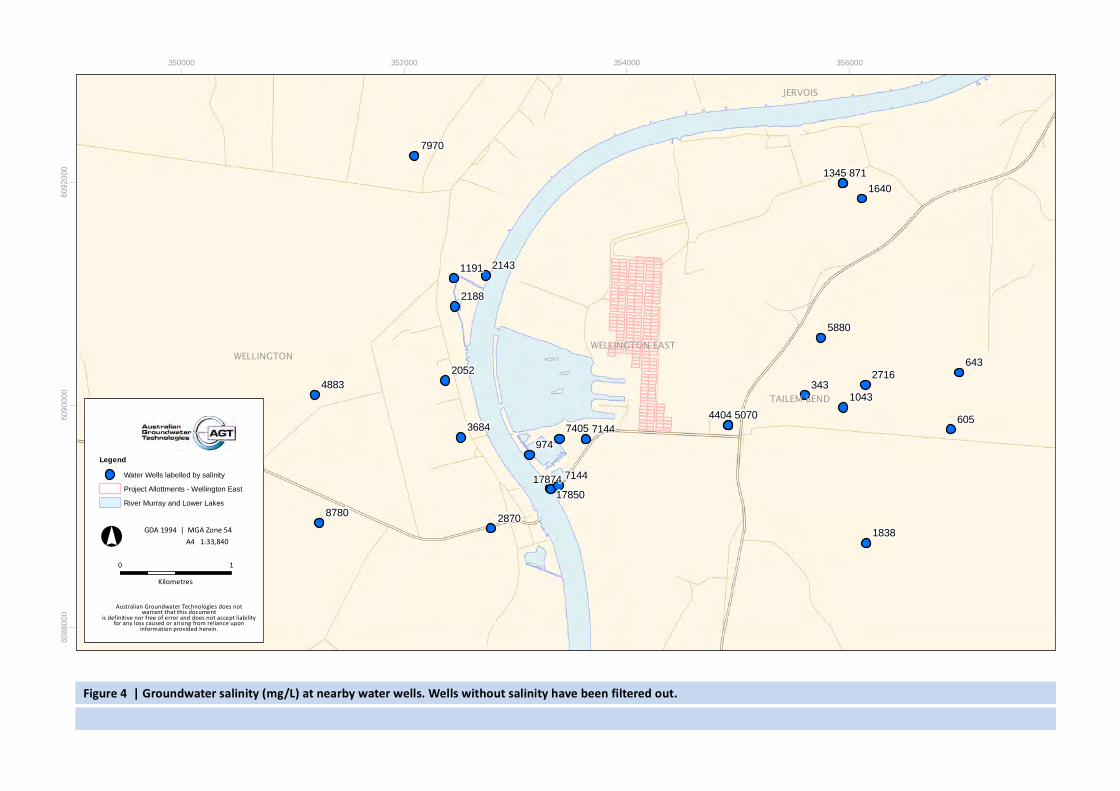
Figure 4 provides groundwater salinity at wells within 3 km of the Project. The results demonstrate a high
level of variability, with salinities ranging between 343 mg/L (fresh) and 17,874 mg/L (saline). There is no
specific trend on the eastern side of the River, and in this area salinities show the greatest variation.
To the west of the River salinity is more consistent, reporting above 2000 mg/L to a maximum of
8,780 mg/L. This salinity range is classed as brackish to saline and is suitable for stock or industrial
purposes only.
5.1.1 MDBC Hydrogeological Mapping
The hydrogeological map for the study region (Adelaide-Barker Map Sheet – MDBC 1994) confirms that
groundwater salinities on the eastern side of the River range between 3000-7000 mg/L, with yields ranging
between 5 and 50 L/s. This corresponds with the Quaternary Limestone Aquifer, presumably the
Coomandook Formation (S Barnett pers comm., 2017). On the western side of the River salinity is mapped
between 7000-14,000 mg/L and corresponds to the Murray Group limestone. These salinities are at the
upper limits for stock (nominally 10,000 mg/L) and more suited to industrial purposes (e.g. road
maintenance). Yields are reported between 5-50 L/s (MDBC, 1994).
Generally speaking mapping undertaken by MDBC is consistent with findings from Figure 4, and
demonstrates that aquifers are brackish to saline. Some wells report fresh water, but it is not clear if they
remain fresh as they were drilled in the 1950’s / 1960’s and may now be saline.
5.2 Depth to groundwater (m below ground level).
Depth to water provides an indication of how close groundwater levels are to the land surface. This
information can be used to infer how seepage (if any) from on-site waste systems could influence or modify
the water table over time.
Figure 5 displays depth to water at available water wells within 3 km of the Project Site. The results confirm
that groundwater generally resides within 10 m of the land surface, with groundwater on the Floodplain
(immediately west of the allotments) very shallow, ranging between 0.29 and 1.1 m below ground.
Groundwater to the east of the site is generally higher and is reported up to 18.6 m below ground level. The
deeper groundwater at these locations is likely a reflection of ground elevation (being on the highland),
although pumping from stock wells could also be a factor (thereby lowering groundwater levels).

Page 9 of 22
5.3 Groundwater Elevations (m Australian Height Datum) and flow direction.
Groundwater elevations referenced to a common datum are important for interpreting groundwater flow
direction. Groundwater levels need to be referenced to metres Australian height datum (mAHD) so water
levels can be compared “like for like”. Once levels have been “geo-rectified” groundwater flow paths can be
broadly predicted. This is because groundwater moves from high groundwater elevation to low groundwater
elevation.
Available groundwater elevations (mAHD) were obtained from WaterConnect (DEWNR, 2017), while
geotechnical holes drilled by Coffey (2005) were referenced to mAHD using the Geoscience Australia
digital elevation model (GA, 2011). The spatial distribution of these levels is presented in Figure 7.
The results demonstrate that groundwater elevations (mAHD) are highest in the Highland areas reporting
between 0.8 and 13.30 mAHD, while groundwater elevations are lowest in the floodplain immediately west
of the Project (reported at -0.8 mAHD). Levels below the floodplain are particularly interesting as elevations
are reported below sea level. The suggest potential for groundwater discharge to the floodplain (see further
discussion below).
5.4 Stage River Levels below Lock 1.
Stage River levels below Lock 1 were obtained from WaterConnect from real-time monitoring station
(A4261159). The results over the period 2012-2016 demonstrate that River levels vary seasonally with flow,
but generally range between 0.15 and 1.5 m AHD (Figure 7). The only exception is the late 2000’s
(Figure 8) when River levels dropped to below sea level (< 0 mAHD). This is attributed to the hydrological
drought caused by widespread rainfall reduction in upstream catchments. Also to note on Figure 8 is the
red line which indicates the 0.4 mAHD River level. This is the level required to enable irrigation from the
Murray and Lower Lakes (Moseley et al., 2013).
5.5 Implications of Groundwater Elevations and Stage River levels for groundwater seepage.
The findings from Section 5.3 and 5.4 have relevance for the residential development. Groundwater and
River elevations confirm that groundwater moves from the highland and discharge to the floodplain. The
results also confirm that flows are likely to move from the River to the floodplain. Thus the floodplain
adjacent residential allotments is a “groundwater sink” and would capture any seepages derived from the
development. This would avoid potential water quality impacts from nutrient waste or discharge to the River
created by mounding.
The only exception to this would be in periods of exceptionally low River flow where channels levels
dropped below 0 mAHD. In extreme cases such as this groundwater may have potential to discharge to the
River, although this would need to occur through very low permeability Coonambidgal Clay and would
occur at a very slow rate (See section 6).
.
974605
643343
871
7405
7144
7144
21431191
2188
2870
2052
3684
27161043
5880
18388780
4883
7970
50704404
16401345
1787417850
WELLINGTON
TAILEM BEND
WELLINGTON EAST
JERVOIS
350000 352000 354000 35600060
88
00
060
90
00
060
92
00
0
Figure 4 | Groundwater salinity (mg/L) at nearby water wells. Wells without salinity have been filtered out.
GDA 1994 | MGA Zone 54°0 1
Kilometres
1:33,840
Australian Groundwater Technologies does notwarrant that this documentis definitive nor free of error and does not accept liabilityfor any loss caused or arising from reliance uponinformation provided herein.
A4
LegendWater Wells labelled by salinity
Project Allottments - Wellington East
River Murray and Lower Lakes

!(
!(!(
!(
5
5.3
1.1
13
6.5
7.1
5.2
0.630.43
0.85
0.29
0.831.37
0.67
0.91
2.44
8.71
6.095.49
1.982.03
16.4518.59
17.0717.07
17.6716.74
WELLINGTON
TAILEM BEND
WELLINGTON EAST
JERVOIS
350000 352000 354000 35600060
88
00
060
90
00
060
92
00
0
Figure 5 | Depth to water at available wells (m bgl).
GDA 1994 | MGA Zone 54°0 1
Kilometres
1:33,858
Australian Groundwater Technologies does notwarrant that this documentis definitive nor free of error and does not accept liabilityfor any loss caused or arising from reliance uponinformation provided herein.
A4
Legend!( Geotechnical wells (Coffey, 2005)
Depth to water (mbgl)
Project Allottments - Wellington East
River Murray and Lower Lakes

3
1
-1
-0.8
5
2.3
0.78
0.06
0.03
0.790.52
4.28
3.943.58
0.88
2.092.69
13.3
0.29
13.25
WELLINGTON
TAILEM BEND
WELLINGTON EAST
JERVOIS
350000 352000 354000 35600060
88
00
060
90
00
060
92
00
0
Figure 6 | Groundwater elevations referenced to sea level (mAHD). Data derived from WaterConnect and Coffey, 2005. Land surface elevations derived from DEM, 2011.
GDA 1994 | MGA Zone 54°0 1
Kilometres
1:33,840
Australian Groundwater Technologies does notwarrant that this documentis definitive nor free of error and does not accept liabilityfor any loss caused or arising from reliance uponinformation provided herein.
A4
LegendGeotechnical wells (Coffey, 2005)
Groundwater elevations (mAHD)
Project Allottments - Wellington East
River Murray and Lower Lakes

Page 13 of 22
Figure 7. Stage River Heights below Lock 1 (mAHD) – Station A4261159 (source: DEWNR, 2016).
Figure 8. Historical stage River Levels below Lock 1 – Station A4261159. The red line indicates the
level below which irrigation cannot occur. Source: DEWNR, as cited in Moseley et al., 2013.

Page 14 of 22
6. CONCEPTUAL HYDROGEOLOGICAL MODEL
Based on the data review a conceptual hydrogeological model has been developed for the site. This is
presented in Figure 9 and confirms:
The surface geology comprise shallow wind-blown sands while the floodplain comprise low
permeability clay (Coonambidgal Clay).
To the east and west in the Highland areas wells typically target a limestone aquifer. These rocks
are invariably covered by 5-10 m of Quaternary Sediments (sands and clays).
To the east of the River the dominant aquifer is the Quaternary Limestone (Coomandook
Formation), while to the west they target the Tertiary Murray Group Limestone.
Deep wells drilled adjacent to the River channel report thick sequences of Coonambidgal Clay. This
unit is known to be highly impermeable and locally act as an aquitard i.e. inhibit groundwater flow
between the highland areas and River channel.
Below the floodplain, Monoman Formation sands (channel sands) are noticeably absent in the
upper 20 m. This suggests that connection between the River and adjacent aquifers is limited.
Groundwater elevation are highest in the highland and lowest in the floodplain. River stage heights
are consistently above floodplain groundwater levels. This confirms potential for groundwater and
surface water to move towards the floodplain.
Levee banks have been constructed on the edge of the River to keep the channel artificially high.
Coupled with controls from Lock 1 (and barrages in the Lower Lakes) this explains why the River
Channel levels are consistently higher than the floodplain groundwater elevation. Levee Banks are
common in the lower reaches of the Murray, and support irrigation and the diary industry.
The floodplain immediately west of the development is a “groundwater sink”, driven by evaporative
discharge and concentration of salts in the upper soil profile. This is confirmed by salt scalding
seen in aerial imagery (see Figure 10).
For the above reason water from the River Murray and the highland regions immediately east is
directed to the floodplain. The shallow depth to water allows for evaporation and consistent
lowering of the water table, thereby maintaining groundwater discharge (see arrows in Figure 9).
Based on the above any seepage from the residential development is likely to discharge to the floodplain.
This immediately averts a risk to River Murray water quality should nutrient seepages be sufficiently high.

4000
Figure 9 |East-west Cross Section and conceptual hydrogeological model. Cross section line presented in Figure 3.
P:\(FAE)_Frankston_Golf_Course\Project\1469-16-FAE ASR Phase 2\Graphics
30
20
10
0
-10
-20
0 1000 2000 3000 5000
-30
-40
6000 7000
Quaternary Sand Clay Tertiary LimestoneQuaternary Limestone Bore
8000
6727-24606727-2461
BH 6
BH 8
6727-1189
Groundwater Level (mAHD)
WELLINGTON
EAST PROJECT
SITE
MAIN CHANNEL –
MURRAY RIVER
FLOODPLAIN
GROUNDWATER
ELEVATION
<0 mAHD
6727-2458
6727-2441
6727-3069
6727-3070
BH 2
LEVEE
BANK
Groundwater flow Evaporative discharge

Page 16 of 22
7. DISCUSSION
This work has been commissioned to outline baseline groundwater conditions in proximity to a residential
development at Wellington East, with the purpose to gauge the level of risk imposed by on-site waste
systems from 223 allotments.
The findings suggest that any seepage to shallow aquifers derived from the development will flow down
“hydraulic gradient” towards the River Murray, but will most likely discharge at the groundwater floodplain
adjacent to the the River, rather than to the River itself. This is because River channel levels are artificially
raised above 0.15 mAHD on a semi-permanent basis. This occurs by regulating structures including Lower
Lake barrages and levees banks constructed parallel to the River. This finding is supported by real-time
River level data, groundwater elevation data (referenced to mAHD), and aerial imagery confirming salt
scalding at the floodplain (Figure 10). By nature salt scalding within the floodplain suggests a high level of
evapotranspiration and groundwater discharge. It is also supported by geological information that confirms
that Clay beneath the Floodplain is particularly deep (>25 m for the Coonambidgal Formation). This clay
layer is of low permeability and acts to retard groundwater flow. Therefore, any seepages derived from the
development would take a long time to reach the floodplain, allowing adequate time to discharge at the
surface (prior to entering the River).
Figure 10. Salt scalding observed on the floodplain west of the development. This confirms
discharge of groundwater from shallow aquifers.
Shallow GW
discharge and
Salt scalding
Levee banks
Levee banks
Development
area with onsite
waste systems

Page 17 of 22
Nonetheless, should all the allotments be developed in the next 10 years there is potential for some
seepage to occur to shallow Quaternary aquifers (shallow sands in the upper 10 m). This would occur if
water use was sufficiently high and significant volumes were discharged to underground waste systems.
It is understood that water supply for the new allotments will utilise rainwater tanks rather than reticulated
systems. This suggests that a typical household may only use 120 kilolitres for domestic usage.
Approximately 50% of this use would be used internal to the house (bathroom, washing, drinking water)
while approximately 50% would be used for gardens (SA Water usage data as cited in Bureau of statistics,
2011). Water use internal to the house would be directed to the on-site waste system while discharge to the
ground surface for gardens would be diffuse in nature. Thus there may be potential for approximately 60
kL/annum to seep to the aquifer. This is likely an upper estimate as:
1) Residential properties will not be permanently occupied.
2) Not all properties will be developed in the next 10 years.
3) Water usage of 120 kL/annum per household is an upper estimate. Ultimately the level of usage is
dictated by size of rainwater tanks and individual water use habits.
Assuming a development level of 50% and an occupancy rate of 40%, an upper estimate of seepage would
be:
Total seepage per household = seepage/annum x occupancy rate = 60 kL x 40% = 24 kL/annum.
Assuming only 50% of allotments are developed in the next 10 years this equates to total seepage potential
of 2,676 kL/annum or 7,300 litres per day. Spread across the area (~1500 m x 500 m) these point source
seepages are very small (65 L/household/day). At the local to regional level these seepages may not be
detectable over a 10 year time frame.
7.1 Factors that could change the above assessment.
The above assessment assumes a 50% occupancy rate and water use derived from rainwater tanks only.
Should the development be fitted with reticulated Mains water and have higher occupancy rate potential for
seepage would be enhanced. Coorong District Council have indicated that on-site waste management
systems are a temporary control, and once the development reaches an occupancy threshold the intention
is to convert the entire development to a CWMS (J. Quin., pers comm., 2017). This confirms that seepages
will not occur in the long term as on-site waste systems will only be used for 10-15 years.
7.2 Need for groundwater modelling
Based on the conceptual model developed for the site it is considered that impacts to water quality will be
low and for this reason groundwater modelling or detailed seepage assessments are not required. Any
seepage from the site will be detained by the floodplain and in time be eliminated after upgrading allotments
to a CWMS.
8. CONCLUSIONS AND NEXT STEPS.
The following conclusions can be drawn from the study:
The allotments will be developed systematically over the next 10-15 years, but are unlikely to be
occupied on a full time basis.
Seepages per household are likely to be small, only averaging 24 kL/year.

Page 18 of 22
Any seepages to the groundwater system will move towards the floodplain and will not reach the
Murray due to the presence of levee banks and raised River channel levels (>0.15 mAHD
compared to groundwater elevation below floodplain of -0.8 mAHD). This suggests a low level or
risk to River water quality or aquatic ecosystems.
Groundwater in the area is brackish to saline with the nearest 3rd party well located ~1 km to the
east. Its status is unknown, however any seepages from the development are unlikely to impact
this user.
At this stage of the development the need for additional modelling does not seem warranted. As a
worst case some shallow monitoring wells could be constructed to detect groundwater level
changes. These could be used as “leading indicator wells” and if significant groundwater level
changes were detected additional work could be undertaken to gauge potential risks.
Council intends to convert on-site waste management systems to CWMS over a 10-15 year period
(J. Quinn pers comm., 2017). This will avoid ongoing seepages in the medium to long term.
Thank you for the opportunity to conduct this assessment. If you have any queries please contact the AGT
office on 8212 5622.
Regards
Paul Magarey
Senior Hydrogeologist
Australian Groundwater Technologies.

Page 19 of 22
9. REFERENCES
Barnett, S. pers comm. (2016). Personal communications Dec 2016. Principal Hydrogeologist, Department
of Environment, Water and Natural Resources.
DEWNR (2017). Groundwater Data application accessed via WaterConnect.
https://www.waterconnect.sa.gov.au/Systems/GD/Pages/default.aspx#Unit Number
MDBC (1994). Murray Darling Basin Hydrogeological Map Sheet – Adelaide-Barker. Hard copy map.
Moseley, L., Palmer., D., Mettam, P/, Cummings, C., and Leyden, E., (2011). Lower Murray Reclaimed Irrigation Area (MLRIA) Acid Drainage Project: final summary report 2013. Environmental Protection
Authority.
Quinn, J., (2017). Personal communications January 2017. Manager Development and Environmental
Services, Coorong District Council.
SARIG (2017). South Australian Resource Information Geoserver. Department of State Development.
https://sarig.pir.sa.gov.au/Map

Page 20 of 22
APPENDIX 1 – EPA COMMENTS ON COORING DISTRICT COUNCILS
STATEMENT OF INTENT.
EPA comments on the SOI
EPA is concerned that this SOI foreshadows modification of policy to enable treatment systems at
Wellington East. While it is acknowledged that the 223 allotments of approximately 2,000 square
metres were created in the 1800s, it is noted that Policy Area 10 is located within the River Murray
Protection Area (River Murray Act 2003) and the River Murray Water Protection Area (Environment Protection Act 1993). The Land is in close proximity to the River Murray flood plain. The surrounding
environment is therefore sensitive to cumulative actions affecting water quality.
The EPA supports the existing Coorong District Council Development Plan policy for Wellington
East Residential Policy Area 10 to the extent that it promotes the protection of water quality. The
existing Development Plan policy encourages:
future development to be Linked to the construction of wetlands that will play a role in
improving water quality
residential development that will be linked to the provision of adequate water and effluent
disposal infrastructure, and
connection to a community wastewater management scheme.
The EPA recommends that detailed investigations be undertaken at Wellington East to determine
the potential risk to water quality arising from envisaged development. More specifically these
investigations should model the likely nutrient and water balances for the fully developed 223
(2,000m2) allotment township and document the impacts of offsite movement of wastewater onto
the floodplain, the downslope wetlands and the River Murray.
The EPA recommends that the following investigations be included in the SOl:
Investigate the capacity of existing CWMS and mains sewer systems to ensure they are
able to manage the additional community wastewater that will result from the increased
development.
Undertake a full evaluation of onsite wastewater disposal system constraints and
capabilities (including modelling the likely nutrient and water balances) of the affected land
at Wellington East to determine if the Land is suitable for on−site disposal of wastewater.

Page 21 of 22
APPENDIX 2 – LITHOLOGY LOGS USED IN CROSS SECTION.
Sequence W to E
Unit Number / Borehole name
Ground elevation
SWL (bgl)
From depth(bgl)
To(bgl) Lithology
1 6727-1189
4.74 2.44 0 1 Topsoil
1 3.05 Sand
2 6727-3069
1.89 1.37 0 0.5 Fill
0.5 1 Sandy clay
1 1.25 Clay grey stiff clay
1.25 2 Clay grey moderately hard
2 4 Sand grey fine to medium grained quartz sand
3 6727-3070
1.62 0.83 0 0.75 Road fill
0.75 1.5 Clay grey plastic, soft
1.5 2 Clay grey green, plastic soft
2 3 Sandy clay grey green
3 4 Clayey sand grey green, clayey fine grained quartz sand
4 4.5 Clayey sand grey, clayey fine grained quartz sand
4.5 6 Clayey sand fine grained quartz sand
River Murray
4 BH8
0.3 0 0.5 Clay medium to high platicity black brown
0.5 2.2 Clay high plasticity
5 BH2
0 1.5 Sand fine to coarse Brown
1.5 2 Sandy clay low plasticity calcareous fine to coarse sand
2 3.8 SANDY CLAY medium plasticity grey brown red mottling
6 BH6
0 1.8 Sand fine to coarse light brown
1.8 2.6 Sandy gravel fine to medium angular to rounded fine to coarse white calcrete

Page 22 of 22
Sequence W to E
Unit Number / Borehole name
Ground elevation
SWL (bgl)
From depth(bgl)
To(bgl) Lithology
2.6 4 Sand fine to coarse yellow.
7 6727-2458
13.6 8.1 0 0.5 Topsoil
0.5 1.1 Limestone
1.1 5.3 Clay
5.3 10 Sand
10 14.5 Sand
14.5 15.2 Clay
8 6727-2440
13 8 0 0.5 Limestone Cap
0.5 2 Soft limestone
2 9.7 Red Clay
9.7 11.9 Rubbly Limestone
11.9 12 Hard Limestone
9 6727-2441
14.3 9.3 0 1 Limestone Cap
1 6 Red Sandy clay
6 10.3 Yellow sandy clay
10.3 14 Hard Limestone
10 6727-2461
12.4 7.4 0 0.8 Hard white limestone
0.8 6 Soft Limestone, sandy with depth
6 7.5 Very soft sandy Limestone
7.5 14 Brown sandy nodular Limestone
14 14.5 Clayey Limestone
11 6727-2460
15.5 0 1.5 Top soil
1.5 1.8 Limestone
1.8 2.5 Yellow clay
2.5 5.4 Silty white limestone
5.4 6.6 Brown Clay
6.6 12.6 Brown clay ,sand
12.6 16 Grey Clay
16 17 Yellow sandy clay
17 19 Yellow fine sand(flowing)
19 24 Silty WHITE CLAY