introduction and review of literature -...
TRANSCRIPT

1
1. ______________________________________________________________________
Introduction and Review of Literature ______________________________________________________________________
History of learning about population by using sampling methods could
be traced out to even very early stages of primitive life of mankind. The
development of statistical methodology used in survey sampling, to a large
extent, is aimed at estimation of the mean or the total of the population
characteristics under study with high precision or least cost.
The earlier development in the theory of estimation and statistical
inferences was based on the simples of selection procedure, namely random
sampling. It was Kiaer (1895), who introduced the concept of random sampling
to study socio-economic problems with a view to replace the usual approach of
complete count. Bowley (1906) introduced the idea of probability sampling.
Deming (1950) “Sampling is not a mere substitution of a partial
coverage for a total coverage. Sampling is the science and the art of controlling
and measuring reliability of useful statistical information the theory of
probability”.
Many strategies can be used to create a probability sample each start
with a sampling frame which can be thought of as a list of all elements in the
population of interest (e.g. names of individuals, telephone numbers, house
addresses, and census tracts). The sampling frame operationally defines the
target population from which the sample is drawn and to which the sample data
will be generalized. Simple random sampling is probably the simplest method
for obtaining a good sample. A simple random sample of say N is chosen from

2
the population in such a way that every random set of n items from the
population has an equal chance of being chosen as sample. Thus simple
random sampling not only avoids bias in the choice of individual item but also
gives every possible sample an equal chance.
When the population is heterogeneous, Bowley introduced the idea of
stratification to increase the precision of the sample estimates. Bowley
introduced the idea of stratification to increase the precision of the sample
estimate. In this procedure population is divided in to a pre-assigned number of
non-overlapping sub-population or groups called “strata” before selection of
the sample. Here sample of pre-determined size are drawn independently from
strata. Stratification is more effective when there are extreme values in the
population, which can be segregated into separate within each stratum is drawn
with random sampling procedure, the design is known as stratified random
sampling.
The work of Bowley (1926) and Neyman (1934) laid the foundations of
modern sampling theory; works of R.A Fisher during twenties provided a
scientific basis for selecting a random sample. Many research papers relating to
sampling theory and methods have been written for setting up new directions
and trends of development which provide sound theoretical support to what
was in practice.
1.1 Concepts and Definitions
In this section, we present the basic concepts and definitions to be used
in this work.
An elementary units or a unit is an element or a group of elements, on
which observations can be made or from which the required statistical
information can be ascertained according to a well defined procedure. The
collection of all units of a specified type in a given region at a particular point
or period of time termed a population.

3
A collection of N (given) well defined, distinct, identifiable and
observable objects
under consideration about which certain valid conclusions are to be
drawn, is called a finite population. The objects ( i=1, 2…., N) are called
sampling units or elements. The number of units in the population denoted by
N is called the size of the population and the list of all sampling units with
identification number 1,2,…….,N is called sampling frame.
A variate (character) y is a real-valued function defined on U such that
=y ( ) (i=1,2,…..,N) is the value of the character y associated with the units
of the population. Let and let denotes the
space described by which may be the N- dimensional Euclidean space or a
subspace of it. may be referred to as parametric space of y and
is called parametric vector of y.
A parameter (or parametric function) , of a character y, is a real-
valued function of .The parameters of particular interest are
population mean, population total and population variance which are
respectively defined as
Population Mean of y: =
Population Total of y: Y = N =
Population Variance of y: =
The general problem is to make some inferences about or the
parameters on the basis of the information contained in a sample (or
samples) from the population U. One may be interested in the problem of point
estimation or the problem of interval estimation or the problem of testing of
hypothesis about an unknown parameter .
4
In the present work, we shall confirm ourselves to point estimation type
problems. The main problem of estimation in case of finite populations may be
specified as to obtain optimum sampling strategies that are to obtain optimum
sampling designs as well as optimum estimators for unknown parameter .
For drawing inferences about finite population survey statistician search for a
suitable sampling procedure (sampling, scheme, sampling technique) and
suitable estimation procedure (method of estimation). Since we are interested
in estimating a parameter , such as and we shall call y as the variate
under study or the study variable. When the information on a variable
is also used in estimation of , we call as an
auxiliary variable. In this case knowledge on a parameter which may be a
function of y or x, is used in estimating , we call as an auxiliary or
auxiliary parameter.
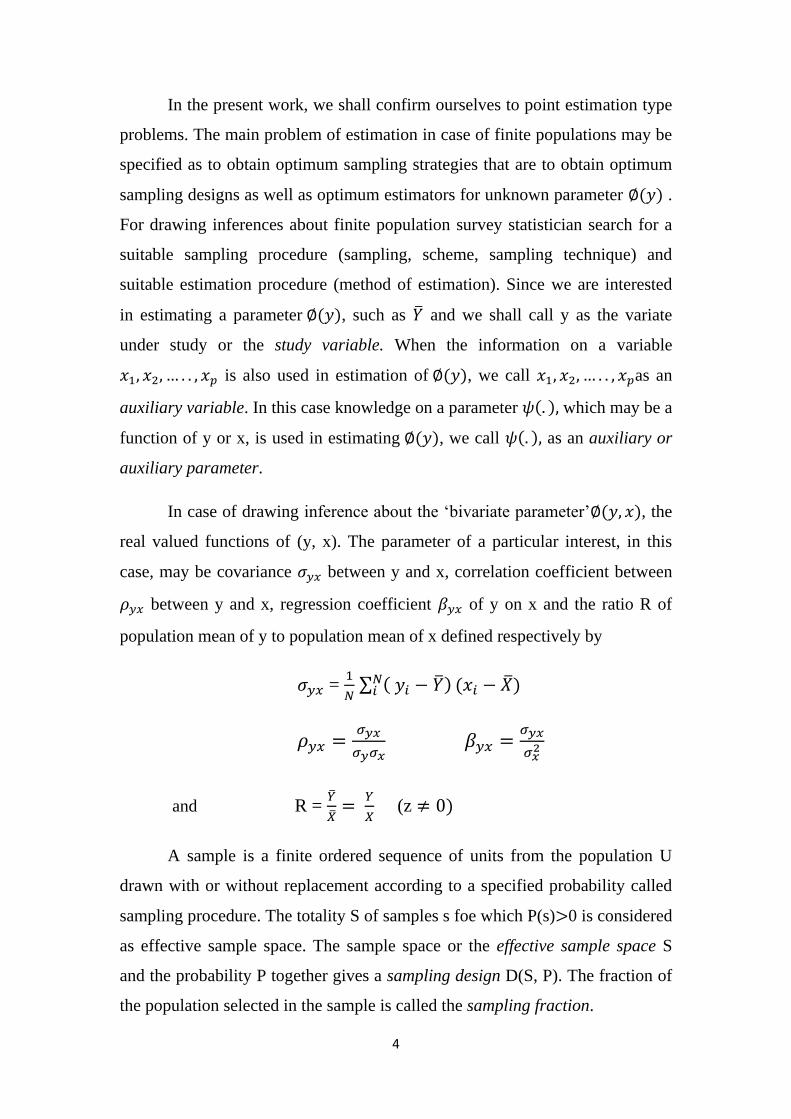
In case of drawing inference about the ‘bivariate parameter’ , the
real valued functions of (y, x). The parameter of a particular interest, in this
case, may be covariance between y and x, correlation coefficient between
between y and x, regression coefficient of y on x and the ratio R of
population mean of y to population mean of x defined respectively by
=
and R =
(z
A sample is a finite ordered sequence of units from the population U
drawn with or without replacement according to a specified probability called
sampling procedure. The totality S of samples s foe which P(s) 0 is considered
as effective sample space. The sample space or the effective sample space S
and the probability P together gives a sampling design D(S, P). The fraction of
the population selected in the sample is called the sampling fraction.
5
A sample in which every unit has the equal probability of selection is
called a random sample. A sample is considered as random or probability
sample. If the selected (sampled units) are replaced in the population and
sampling is done, in that case it is called simple random sampling with
replacement (SRSWR) and if the sampled units are not replaced i.e. repetitions
are not allowed then we say simple random sampling without replacement
(SRSWOR).
When the sample is taken as every unit, it is called systematic
sampling. If the units appear in the sample with different probabilities,
sampling is said to be with unequal probabilities. When the probabilities are
based on some measure of size of the units, it is sampling with probability
proportionate to size (pps). When the population is divided into groups
(homogeneous) and a sample is selected from each group, the groups are called
strata. If the same fraction is taken into the sample from each stratum the
sampling is said to be done with proportionate allocation or with fixed
sampling fraction otherwise it is a variable sampling fraction plan.
The sample is usually selected in clusters or groups of the elementary
units since frames listing elementary units are rarely available. When clusters
are large it is difficult to enumerate them completely. We may further select a
sample from each of the selected cluster. This procedure is called sub-sampling
or two-stage sampling. Sometimes the first phase of the enquiry is limited to
the collection of auxiliary information and this information is used in the
second phase for stratification, ratio or regression estimation. This is called the
double sampling method.
A statistic is a function defined on the sample space. An estimator d(s)
is a real valued function of { }, j =1,2,…..,n(s); n(s) being the number of
units in the sample, j s, s S and an estimate the value of an estimator for a
given sample s.
An estimator d for is said to be unbiased
6
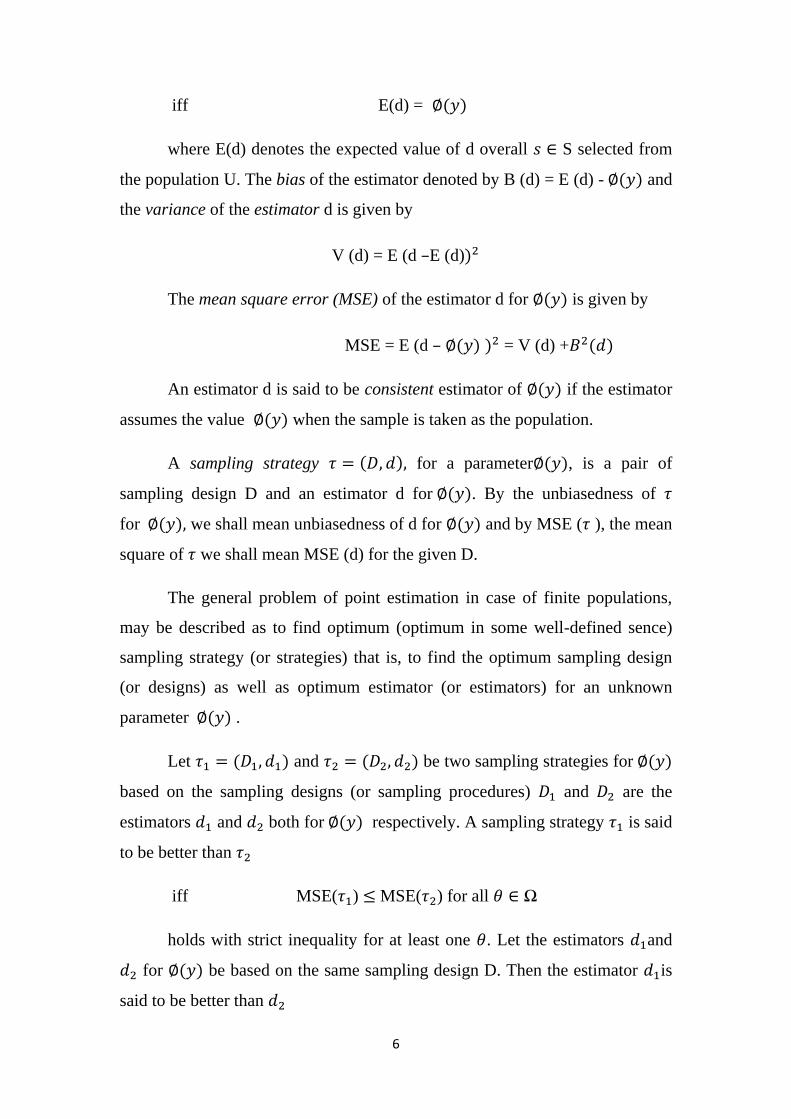
iff E(d) =
where E(d) denotes the expected value of d overall S selected from
the population U. The bias of the estimator denoted by B (d) = E (d) - and
the variance of the estimator d is given by
V (d) = E (d –E (d)
The mean square error (MSE) of the estimator d for is given by
MSE = E (d – = V (d) +
An estimator d is said to be consistent estimator of if the estimator
assumes the value when the sample is taken as the population.
A sampling strategy for a parameter , is a pair of
sampling design D and an estimator d for . By the unbiasedness of
for we shall mean unbiasedness of d for and by MSE ( ), the mean
square of we shall mean MSE (d) for the given D.
The general problem of point estimation in case of finite populations,
may be described as to find optimum (optimum in some well-defined sence)
sampling strategy (or strategies) that is, to find the optimum sampling design
(or designs) as well as optimum estimator (or estimators) for an unknown
parameter .
Let and be two sampling strategies for
based on the sampling designs (or sampling procedures) and are the
estimators and both for respectively. A sampling strategy is said
to be better than
iff MSE( ) MSE( ) for all
holds with strict inequality for at least one . Let the estimators and
for be based on the same sampling design D. Then the estimator is
said to be better than

7
iff MSE( ) MSE( ) for all
holds with strict inequality for at least one
The per cent relative efficiency of a sampling strategy
over is defined by 100
.
1.2 Review of Literature
In order to make effective use of available sources various sampling
technique have been developed from time to time which provide estimators of
population characteristics of interest with high precision, reduced cost and
above all will have the operational feasibility and practical applicability. In this
section a review of the work done by various authors related to work in this
thesis is presented.
1.2.1 Use of Auxiliary Information in Sample Survey
Information on variables correlated with the main variable under study
is popularly known as auxiliary information which may be fruitfully utilized
either at planning stage or at designing stage or at the information stage to
arrive at improved estimator compared to those, not utilizing auxiliary
information. The concept of multi-auxiliary information is well known in
sampling theory. Its use of paramount importance in sample surveys as it leads
to increased precision of estimators for population parameters.
The origin of utilizing auxiliary information in sample surveys can be
traced back to the origin of sampling theory itself. It has been a general view of
the survey statisticians for last five decades that the usual methods for
estimating population mean (or total) of a variable of interest, say y. It may
lead to much improvement in precision of estimation if the information on the
closely related variable (auxiliary information) is utilized judiciously in the
estimation procedure.
8
It most of the surveys situations, the auxiliary information is always
available in one form or the other or can be made available by diverting for this
purpose a part of the survey resources at moderate cost. In whatever form the
auxiliary information is available, one may always utilize it to devise sampling
strategies which are better (if not uniformly then at least in a part of parametric
space) than those in which no auxiliary information is used. The method of
utilizing auxiliary information depends on the form in which it is available.
In sample surveys the auxiliary information on or more variables may be
utilized in three basic ways which has been already been discussed by Tripathi
(1970, 1976).
(1) At the pre-selection stage or the designing stage i.e. the
information may be used in stratifying the population.
(2) At the selection stage i.e. in selecting the units for sample with or
without replacement and with varying probabilities proportional to some
suitable measure of size.
(3) At the post-selection stage or at the estimation stage i.e. through
defining ratio, regression, difference and product estimators based on the
auxiliary information.
The auxiliary information may also be used in mixed ways as well as by
combining any two or the entire above situation.
Usually measurements on the auxiliary characters are available for every
unit of the population or at least the population totals or mean of auxiliary
characters are known in advance. However, when such information is not
available, it is obtained by taking a large preliminary sample in which only
those auxiliary characters are measured which lacks such information. The
purpose of this sample is to furnish a good estimate of the population mean or
total of the auxiliary characteristic or its frequency distribution. The technique
of double sampling or two phase sampling is thus used to make such
information available in surveys.

9
In case , the population mean of an auxiliary character x, is known, a
large number of estimators for are available in sample survey literature.
Laplace (1820) was the first to use the auxiliary information in ratio type
estimator. The works of Bowley (1906) and Neyman (1934, 1938) can be
referred to as the initial efforts to utilize the auxiliary information in sampling
theory. However, Watson (1937) and Cochran (1940, 1942) initiated the use of
auxiliary information in dividing estimation procedures aimed at improvement
in the precision of estimation. Hansen and Hurwitz (1943) were the first to use
auxiliary information in selecting the units with varying probabilities.
The univariate ratio and regression estimators proposed by Cochran
(1940, 1942), difference estimator Hansen et al. (1953) and product estimators
by Robson (1957) , Murthy (1964) for population mean of a variable y based
on the knowledge of population mean of an auxiliary character x are quite
well known in sampling theory, and for detailed study in case of simple random
sampling without replacement (SRSWOR) and stratified sampling one may
refer to the books by Cochran (1977), Sukhatme et al. (1976), Raj (1968),
Murthy (1967), Kish (1965) and others. Das and Tripathi (1980), Das (1988),
Khare (1988) gave classes of estimators for population mean and extended the
classes of estimators, defined by Srivastava (1971, 1980), for any general
sampling design, several authors like Reddy (1974), Agarwal et al. (1980),
Gupta (1978), Ray et al. (1980), Srivenkataramana et al.(1976,1979), Kaur
(1983), Singh et al. (1983), Chaudey et al. (1984) defined estimators for
using knowledge on . Using the technique of bias correction Hartley and Ross
(1954) considered an unbiased estimator and Murthy et al. (1959) considered
almost unbiased estimators for in case of SRSWOR. Another technique well
known as Jack-Knife technique for obtaining unbiased or almost unbiased
estimators was given by Quenouille (1956) and generalized by Grey et al.
(1972). The properties of ratio, ratio-type estimators have been studied among
others, by Rao (1979) and Schucany et al. (1971). Almost unbiased ratio

10
estimators (AURES) have also been considered by Rao (1966), Sahoo et al.
(1989), Pandey et al. (1989) and Singh et al. (1989).
A general class of estimators of population means using auxiliary
information has been considered by Naik and Gupta (1991). An unbiased class
of product type estimators for has been considered by Tripathi and Singh
(1988) using some transformation and estimators discussed by Gupta and
Adhavarya (1982), Kushwaha and Singh (1988) are particular members of this
class. Deng and Chikara (1991) has defined asymptotically design unbiased
estimators of population mean. Rao et al. (1990) has used auxiliary information
for estimating distribution functions and quartiles and Rao et al. (1990) have
described optimal designs for estimators. Singh (1989) has taken the problem
of estimation in case of incomplete frames. Yadav and Singh (1984) suggested
proportional allocation for simple random sampling scheme and Singh et. al.
(1985) used auxiliary information for non response. Further Chaudhary et.al.
(1989) have described the efficiency of the ratio estimators and Sampath
(1989) obtained optimal choices of unknown in ratio estimators. Further
PPSWR Tripathi (1970), Singh (1980), Bansel and Singh (1985), Gupta (1990)
have suggested estimators for population mean.
In case the required auxiliary information is not readily available the
ratio, regression, difference and product type estimators for , based on double
sampling procedure are well known in sample survey literature and have been
considered by Tripathi (1976) for general sampling designs. A class of
difference cum ratio and product estimators based on double sampling was
discussed by Ray and Singh (1979). Further Srivastava (1981), Singh et al.
(1983), Kapadia and Gupta (1984) considered the special cases of the estimator
discussed by Singh (1969). Some unbiased estimators using double sampling
and Jackknife technique have been discussed by Sengupta (1981), Singh et al.
(1985) and Shah and Gupta (1987).

11
When information on p-auxiliary variables is available
and are known then Olkin (1958) was the first to deal with the
problem of estimating the mean of a survey variable when auxiliary
information are made available. He suggested the use of information on more
than one supplementary characteristic, positively correlated with study
variable, considering a linear combination of ratio estimators based on each
auxiliary variable separately. The coefficients of the linear combination were
determined so as to minimize the variance of the estimator. Analogously to
Olkin, Singh (1967 a) gave a multivariate expression of Murthy’s (1964)
product estimator, while Raj (1965) suggested a method for using multi-
auxiliary variables through a linear combination of single difference estimators.
Moreover Singh (1967b) considered the extension of the ratio cum product
estimators to multi-supplementary variables, While Rao and Mudholkar (1967)
proposed a multivariate estimator based on a weighted sum of single ratio and
product estimators. An alternative weighting system for defining weighted
ratio, regression and difference estimators has been considered by Tripathi
(1978). Srivastava and Jhajj (1983) defined the class of estimators using multi-
auxiliary information. In case where the population means are
unknown, Khan and Tripathi (1967) discussed the ratio estimator and multiple
regression estimators. Adhvaryu (1978) considered ratio-cum product estimator
in double sampling using multi-auxiliary information. Further Srivastava et al.
(1990) suggested a generalized class based on multi-auxiliary
information.Sahoo et al. (1989), Bansal and Singh (1989), Kumar and Hozel
(1988), Kothwala and Gupta (1989), Srivenkataraman and Tracy (1989) have
considered the different estimators for estimation of population mean using
auxiliary information in various sampling designs. Use of multivariate auxiliary
information for selecting units with PPSWR was considered by Maiti and
Tripathi (1976) and Agrawal et.al. (1980).
Further, an improvement over the customary estimator suggested by
Singh (1965, 67) through knowledge of . Using two auxiliary character

12
and , Rao & Pereira (1968)suggested the estimator for R when the
population means of p- auxiliary characters are known. The
class of estimators of R was extended by Tripathi et al. (1979). In case in
unknown Tripathi (1970) gave a general class of estimators for R. Further
Singh (1982) and Khara (1983, 87) extended these classes to the case of p-
auxiliary character. Maiti and Tripathi (1979) also studied class of estimators
for R based on double sampling.
Further, different estimators for the estimation of population proportions
using auxiliary information were suggested by Hyett and Mckenzie (1977),
Rao (1977) and Das (1982). A ratio test for the equality of proportions has been
suggested by Chou and Owen (1991).
Many other contributions are present in sampling literature and recently,
some new estimators appeared. Deng and Chhikara (1991) have defined
asymptotically design unbiased estimators of population mean. A general class
of estimators of population means using auxiliary information has been
considered by Naik and Gupta (1991). Rabionson (1994) proposed a regression
estimator ignoring some of the assumptions usually adopted in the literature of
Srivastava. Ceccon and Diana (1996) provided a multivariate extension of
the Naik and Gupta univariate class of estimatos. Tracy et al. (1996) proposed
an alternative to Singh’s ratio-cum product estimators, when two auxiliary
variables are available. Agrawal et al. (1997) illustrated a new approach to
from a multivariate difference estimator which does not require the knowledge
of any population parameters. Abu- Dayyeh et al. (2003) introduced two
estimators which are definitely members of the class proposed by Srivastava,
while Kadilar and Cingi (2004, 2005) analyzed combinations of regression type
estimators in case of two auxiliary variables. In the same situation, Perri (2005)
proposed some new estimatiors obtain from Singh’s estimators. Pradhan (2005)
suggested a chain regression estimator for two-phase sampling using three
auxiliary variables when the population mean of one auxiliary variable is
unknown and other auxiliary population means are known.

13
1.2.2 Double Sampling for Stratification
The procedure of double sampling (or two phase sampling) for
stratification was first given by Neyman (1938) and is well available in the
literature Hassen et al. (1953), Kish (1965), Raj (1968), Konijn (1973),
Cochran (1977) and Dayal (1979). In case sampling frames for strata are not
available, the usual (ordinary or prior) stratified sampling cannot be used but
PPS can be used provided strata weights are known exactly. However in
many situations, may not known exactly as they become out dated with the
passage of time and thus post stratification sampling cannot be used.
Further, the information on stratification variable x may not be readily
available but could be made available by diverting a part of the survey budget.
Under these circumstances, the technique of double sampling for stratification
(DSS) comes to our rescue as a powerful tool.
In the usual procedure of DSS, at first a preliminary sample of size is
selected and observed for x alone, which is used for stratifying the sample
giving as units falling in stratum h (
) and then a subsample with
units is selected from stratum h (h = 1,2,….L) and is observed for the main
variable y, Following Raj (1968) and Sukhatme and Sukhatme (1970) the
expression of variance of unbiased estimator of is given by Rao (1973),
Cochran (1977) in case the samples of size are random subsample from
units of the first sample in stratum h (h = 1,2,….L) as would also be a
random variable in this case. However, in the literature, the subsample of size
from stratum h (h=1,2,,…,L) used to be assumed, implicitly, non-random,
Singh and Singh (1983) pointed out that this assumption is inconsistent with
the sampling procedure. They proposed three consistent sub-sampling
procedures which treat the sub-sample size within each stratum as a random
variable:

14
(i) The subsample within each stratum is selected with replacement
and all units are used in the estimator.
(ii) as in (i) but only distinct units used
(iii) sub-sampling is without replacement, the size being min ( , )
where may be predetermined.
Rao (1973) pointed out that although the procedures adopted by Singh
and Singh are free of inconsistency; procedure (i) and (ii) lead to the loss in
efficiency and further the procedure (ii ) gives rise to a variance formula which
is not suitable for the optimal determination of and for a fixed cost.
Furthermore, Rao proposed a simple procedure of double sampling for
stratification which is also free from inconsistency.
Hansen and Hurwitz (1946), Rao (1968), Srinath (1971) developed the
theory of double sampling for stratification for handling the estimation of in
the presence of non-response. Realizing the importance of analytical study of
survey data, Sedransk (1965) made empirical studies based on double sampling
for stratification.
In the discussion on DSS by various authors, the use of auxiliary
information { ) collected on the first sample is made only for
stratifying the sample. Ige and Triapthi (1987) used this information collected
on the first sample not only for stratifying the sample but also at estimation
stage and use of multi-auxiliary variable in unistage design has been proposed
by Triapthi and Bahl (1991) for improving the precision of estimation. The
multivariate auxiliary information has not been used so far and our attempt is to
use this multivariate auxiliary information at the designing as well as at the
estimation stage in two-stage design to obtain better sampling strategies.
1.2.3 Two Stage Sampling
With a view to reduce cost and/or to concentrate the field operations
around selected points and at the same time obtain precise estimates, sampling

15
is sometimes carried out in stages. The procedure of first selecting large sized
units and then choosing a specified number of sub-units from the selected large
units is known as sub-sampling. The large units are called ‘first stage units’ and
the sub-units the ‘second stage units’. The procedure can be easily generalized
to three stage or multistage samples. For example, the sampling of a forest area
may be done in three stages, firstly by selecting a sample of compartments as
first stage units, secondly, by choosing a sample of topographical sections in
each selected compartment and lastly, by taking a number of sample plots of a
specified size and shape in each selected topographical section.
A sampling procedure pre-supposes the division of the population into a
finite number of distinct and identifiable units called the sampling units. The
smallest units into which the population can be divided are called the elements
of the population and groups of elements, the clusters. When a list of elements
is not available using an element as the sampling unit is clearly not feasible. In
that case the method of cluster sampling is used. A necessary condition for the
validity of the procedure is that every unit of the population under study must
correspond to one and only one unit of the cluster so that the total number of
sampling units in the list(frame) will cover all the units of the population under
study with no omission on duplication otherwise biases are introduced.
Mahalanobis (1940, 1942, 1944) has considered in detail the question of
determining the optimum cluster size in case of crop surveys. Further Smith
(1938), Hasen and Hurwitz (1942), Jessen (1942) Sukhatme (1947, 1950) and
Seng (1951) have also studied the question of sampling efficiency of cluster
sampling.
In cluster sampling all the elements of the selected cluster are
enumerated. The large the cluster, the less efficiency it is usually relative to the
elements the sampling units. It is, therefore, logical to expect that for a given
number of elements, greater precision will be attained by distributing them over
large number of clusters than by taking a small number of clusters and
sampling a large number of elements from each of them or completely

16
enumerating them. The procedure of first selecting the clusters and then
choosing a specified number of elements from each of selected cluster is
known as sub-sampling or two-stage sampling. The clusters that form the units
of sampling at the first stage are called first stage units or primary units and the
elements or groups of elements within clusters which form the units of
sampling at the second stage are called sub-units or second stage units. Hence
the procedure is generalized to three or more stages and is then termed multi-
stage sampling.
Use of multistage sampling using various sampling procedures is well
known in literature.
Raj (1968), Durbin (1967), Hansen and Hurwitz (1943), Horvitz and
Thompson (1952), Hartley and Rao (1962), Murthy and Sethi (1959,1961), Rao
(1962), Rao, Harttley and Cochran (1962), Rao (1975), Sukhatme and Koshal
(1959), Sukhatme (1962,1950). Mahalanobis (1940) used this sampling
procedure in crop surveys. Ganguli (1941), Cochran (1939) and Hansen and
Hurwitz (1943) have considered the use of this procedure in agricultural and
population surveys respectively. Lahiri (1954) has discussed the use of
multistage sampling in the Indian National Sample Survey, Rao (1957) and
Singh (1958) have considered the estimation of variance components for this
sampling scheme.
Various authors Singh and Srivastava (1973), Sahoo (1987),) and Arnab
(1991) so far have made use of auxiliary information on one variable whether it
is available or collected through the preliminary sample in multistage designs
for estimation of population mean, population total, population ratio and
proportion. Mahajan and Singh (1996) proposed an estimator of population
total in two stage sampling. Ye, A Zhong (1997) extended the multistage
sampling with unequal probability. Ye, A Zhong (1998) proposed an allocation
of the sample sizes in three or four stage sampling. Goswami and Sukhatama
(1965) extended the result of Sukhatame and Koshal (1959) to several auxiliary
variables with unknown mean for a three stage design and these results can be

17
extended to design with any number of stages. Chatterjee (1968, 1972)
discussed the multivariate stratified surveys and optimum allocation in
multivariate stratified surveys. Garg and Pillai (1975) has developed two ratio-
type estimator of the population mean in the case of two stage sampling when
the auxiliary information in not available for all the units in the populations.
Using cost function, the optimum allocations of sample units for attaining a
given precision, the total cost of the survey being fixed, have been worked out
when two phase sampling in multistage adopted. Jain (1981) discussed a
rotation scheme for a stratified multistage sampling to satisfy the condition (i)
there is a constraints on the number of units that can be replaced in each round
and (ii) it is relatively inexpensive to increase the sample size gradually. He
derived estimators of the population proportion of elements of specified
characteristics. Ruiz Espezo (1991) proposed a minimum allocation in stratified
sampling with highly correlated variable of interest and auxiliary variable. Yi
Neng (1996) extended the mean precision of a ratio type estimator in two stage
sampling. Okafor (1996) proposed a double sampling for stratification with sub
sampling for the non-respondents. Our aim in the present work is to devise
methods of using multivariate auxiliary information, is collected through the
preliminary sample, for the estimation of population parameters in the two-
stage designs.
1.2.4 Probability Proportional to Size Sampling
In many instances, the sampling units vary considerably in size and
simple random sampling may not be effective in such cases as it does not take
into account the possible importance of the larger units in the population. In
such cases, it has been found that auxiliary information about the size of the
units can be gainfully utilized in selecting the sample so as to get a more
efficient estimator of the population parameters. One such method is to assign
unequal probabilities for selection to different units of the population. For
example, villages with larger geographical area are likely to have larger area
under food crops and in estimating the production; it would be desirable to
18
adopt a sampling scheme in which villages are selected with probability
proportional to geographical area. When units vary in their size and the
variable under study is directly related with the size of the unit, the
probabilities may be assigned proportional to the size of the unit. This type of
sampling where the probability of selection is proportion to the size of the unit
is known as ‘PPS Sampling’.
In sampling from a finite population often the values of some auxiliary
character x closely related to main character y of interest are available for all
the units of the population. The variable x suitably taken as a measure of size of
unit. For example in socio economic surveys, the data on the size of population
which may be available from some previous census may measure the size of
villages, in a survey of industries, x may be number of workers, in agriculture
survey for estimating the yield of crops the data on area under the crop if
available, may provide the size of the farm. In such cases instead of sampling
the units with equal probability with replacement or without replacements one
may sample the units with probability proportional to size measure x (pps) with
replacement or without replacement.
Since a unit with value of x is expected to contribute more to the
population total of y than those with smaller size, one may expect that a
selection procedure which gives higher selection probability to bigger units
than to smaller units should be more efficient than SRS.
The technique of PPS sampling was first put forward by Mahalanobis
(1938) wild sampling plots for a crop survey and its details worked out by
Hansen and Hurwitz (1943, 1949) initiated the use of auxiliary information in
selecting the units with probabilities proportional to size (PPS).They introduced
the method of selecting units of finite population with probability proportional
to a given size measure (pps) and demonstrated its efficiency over the simple
random sampling method and discussed the problem of choosing selection
probability optimally. The Cumulative total method for selection of units which
requires data on the size variable for all the units before-hand, was found to be
19
unsuitable when the population are large as well as when the sizes of some
units are missing or not available.
The method of pps selection was familiar to Mahalanobis even as early
as 1937. He realized that, in agricultural surveys it would be necessary to select
plots using the cumulative totals of their areas since the vary considerably
(Mahalanobis (1938)).
Under the initial guidance of Prof. Mahalanobis, using the 1941 census
list of villages as frame, National Sample Survey (NSS) in their first three
rounds, selected the first stage units (fsu’s)using a pps with replacement (wr)
method, size being the village population (where available) or village area
(where population is not available). With the availability of 1951 census,
tehsils as fsu’s and villages as second stage units (ssu’s) were selecting using
ppswr from fourth round onwards. The use of pps selection continued in the
later rounds as well except for a few rounds where equal probability and
circular systematic sampling were resorted to, for economy in conducting the
surveys. To eliminate repetitions, pps systematic sampling was also widely
used in the rural as well as urban design. While Hansen and Hurwitz developed
the theory of pps sampling based on one fsu per stratum Midzuno (1950, 1952)
considered selection of a combination of n elements with probability of
selection proportional to the aggregate size measure.
In addition to obtaining better estimators the use of PPS sampling has
also been made to obtain unbiased ratio estimators. Lahiri (1951) showed that
the ratio estimator = ( ) , which is biased in equal probability sampling,
would became unbiased for if the probability of selecting a samples from U
is made proportionate to its mean or total size. Horvitz and Thompson (1952)
generalized the theory to pps sampling without replacement (wor) and defined
three classes of linear estimators noting the ‘identifiable’ nature of the finite
population. It may be noted that Narain (1951) independently discussed
varying probability sampling technique and also gave comparison between wor

20
and wr methods. Raj (1954 a) considered variance and an unbiased variance
estimator of the ratio estimator in case of a multistage design where the sample
of first stage units is selected with PPS. Raj (1954 b) investigated about the
superiority of PPS sampling over the equal probability sampling.
For ppswor Raj (1956) developed a simple estimator for the population
total depends on the order of selection of units while Murthy (1957) obtained a
summarized version of this estimator. Fellegi (1963) developed a sampling
design for rotating and non rotating samples which is practically suitable if the
units in sample have to be rotated as in the case of repetitive surveys. An
alternative estimator in PPS sampling for multiple characteristic was developed
by Rao (1966) and Durbin (1967) describes an estimator for estimating the
sampling error in multistage sampling survey. Rao and Bayless (1969) put
forward an empirical study of the stabilities of the estimates and variance
estimators in unequal probability sampling of two units per stratum.
Ramakrishnan (1971) generalized the Yates and Grundy estimates.
Mukhopadhya (1972,80), Sinha (1973), Haezel (1986) considered
constructions of sampling designs which realize pre-assigned sets of inclusion
probabilities of first two orders. Recently, Srivenkataramana and Tracy
(1986) reviewed transformations which can be used after the sample is selected
for ratio, product methods and for pps sampling. Use of transformations for
reduction in variance in sampling with ppswr and wor was discussed in detail
by Stuart (1986).
Use of multiple auxiliary variables for obtaining a suitable composite
size measure was also made by Singh, Kumar and Chandak (1983) and Tripathi
and Chaudey (1990). In large scale sample surveys, where one is interested in
estimating parameters relating to several characteristics, it is sometimes
observed that some of the study variable poorly correlated with selection
probabilities while pps sampling adopted. J.N.K. Rao (1966) has suggested
alternative estimator with ppswr scheme which is shown to be better than the
conventional unbiased estimator, though biased. Singh and Horn (1998)

21
showed empirically that their estimator becomes more efficient than
conventional estimator proposed by Kumar and Agarwal (1997) for varying
probability sampling scheme. Arnab (2003) uses the auxiliary information for
the finite population related to a study variable plays eminent role for selection
of sample with varying probabilities to get the efficient estimator.
1.2.5 Predictive Estimators
In sample surveys, supplementary population information is often used
at the estimation stage to increase the precision of estimators of a population
mean or total. It is common practice to use auxiliary information on a character
x in the estimation of the finite population mean or total of a character under
study. A variety of approaches are available to construct more efficient
estimators for the population mean and total, including design based and model
based methods. The model-based approach is based on super population
models, which assume that the population under study is a realization of super-
population random variables having a super population model ξ. This super
population model ξ formalizes our prior knowledge about the population and is
used to predict the nonsampled values of the population, and hence finite
population quantities Y or total Y. Some advantages of this approach are as
follows:
1. Prediction theory for sampling surveys (or model- based theory)
can be considered as a general framework for statistical inferences on the
character of finite population. Well-known estimators of population totals
encounter in the classical theory, as expansion, ratio, regression, another
estimators, can be predictors is a general prediction theory, under some special
model.
2. This approach is aligned with mainline statistics approachs in
other application areas.
3. In large samples and with certain distribution, results can parallel
those from design-based inference.

22
4. Model-based estimators often have a smaller variance than their
design-based competitors.
In a predictive approach a model is specified for the population values
and is used to predict the non sampled values.
Predictive approach advocated by Basu (1971) is adopted for estimating
the mean of a finite population; it is observed that the use of mean per unit
estimator, regression estimator and ratio estimator as a predictor for the mean
of unobserved units in the population results in the corresponding customary
estimators of the mean of the whole population. Royall (1970) extended the
predictive approach to the case where information on auxiliary characters is not
available, this approach is essentially model based. Srivastava (1983)
suggested, if the product estimator is used as a predictor for the mean of
unobserved units in the population, the resulting estimator of the mean of the
whole population is different from the customary product estimator. Srivastava
et al. (1988) proposed a double sampling based approach. Sahoo et al. (1995)
proposed two unbiased ratio estimators of the population mean and study their
efficiencies under a linear model. Hossian et al. (2001) suggested a class of
predictive estimator for a two stage sampling with unequal first stage units
using unequal first stage units using auxiliary information, ratio, regression and
product estimators were proposed, minimum mean square of these estimators
are obtained. Ahmed et al. (2003) gave a class of predictive estimators in
multistage sampling using auxiliary information. Further Ahmed (2004)
proposed some estimators for a finite population mean under two stage
sampling using multivariate auxiliary information. Sud et al. (2007) proposed a
estimating population mean square through predictive approach when auxiliary
character is estimated. Sahoo et al. (2009) introduced a new class of estimators
for the finite population mean availing information on two auxiliary variables
in two stage sampling.

23
1.3 Thesis at Glance
It was during the first half of this century that a majority of the basic
sampling techniques, now in vogue, were developed. During the subsequent
period practical use, on a large scale, was made of these techniques in a variety
of fields like agriculture, socio-economic industry, medicine etc. These
applications threw up a number of problems, which required basic research, the
efforts on which resulted in more recent development enriching the sampling
theory. The present thesis is an effort in that direction.
The research work included in this thesis consists of investigation in
multistage design using double sampling technique and auxiliary information.
The present work included in this thesis has been divided into six chapters.
In the first chapter, we have discussed the necessary background and
introduced the problems considered in this thesis. This chapter gives a general
sampling concepts and its development over time. A review of whole work
done in auxiliary information, double sampling for stratification, two stage
sampling, PPS sampling and predictive estimators are mentioned in this
chapter.
In Chapter – II we propose difference and ratio type estimators for
estimating the population mean of the study variable when the auxiliary
information is not available in two stage design, but is collected through a large
preliminary sample and we use this information at selection stage as well as
estimation stage. The estimators have been proposed in two different ways:
a. When the information is collected at fsu level and after the
collection of auxiliary information further sample of fsu’s is selected with
PPSWR sampling.
b. When the information is collected at ssu level then after the
collection of auxiliary information sample of ssu’s is selected with PPSWR
sampling.

24
The mean, variance, bias and mean square error of these (proposed)
estimators have been obtained. These estimators are compared for their
precision with usual two stage design using on auxiliary information and the
estimators using auxiliary information are found to be more efficient as
compare usual two stage design. An empirical comparison of proposed
estimators based on census data is made to observe the relative behavior of
sampling scheme proposed by us compared to usual two stage design when
there is no use of auxiliary information.
In Chapter – III we developed difference and ratio estimators for
estimating the population mean in two stage design using multi-auxiliary
information which is collected for fsu and ssu level separately. We use this
information at selection stage as well as estimation stage for the estimation of
population mean. The estimators have been proposed in two different ways:
a. When the information is collected at fsu level and after the
collection of auxiliary information further sample of fsu’s is selected with
PPSWR sampling.
b. When the information is collected at ssu level then after the
collection of auxiliary information sample of ssu’s is selected with PPSWR
sampling.
We study their general properties and also find optimum estimators for
both levels separately. We compare the estimators using auxiliary information
at selection stage as well as estimation stage with respect to the estimator using
auxiliary information at selection stage only and after comparison we conclude
that the former estimators are found to be more efficient than latter. An
empirical study is made to compare the relative performance of the proposed
estimators.
In Chapter- IV we propose multivariate difference and ratio estimators
based on Double Sampling for Stratification (DSS) using multi-auxiliary
information, at FSU level, for constructing strata as well as constructing

25
estimators for population mean . We study their general properties and
obtain optimum estimators. Their comparison with corresponding estimator
based on Unstratified Double Sampling is made and under the moderate
conditions the estimators using DSS are more efficient with respect to USDS.
An empirical study is made to observe the efficiency of the proposed
estimators.
In Chapter- V we propose multivariate difference and ratio estimators
based on Double Sampling for Stratification (DSS) using multi-auxiliary
information, at SSU level for constructing strata as well as constructing
estimators for population mean . We study their general properties and
obtain optimum estimators. Their comparison with corresponding estimators in
Unstratified Double Sampling is made and these estimators are better than the
estimators based on Unstratified Double Sampling in two stage design. An
empirical study, using census data is made to compare the relative performance
of the proposed estimator.
In Chapter- VI we propose a class of predictive estimators based on a
two-stage design for the estimation of population parameter. The proposed
class consists of two different types of estimators namely ratio and regression.
The Mean square error (MSE) and minimum mean square error of this class
have been derived. We compare the efficiency of predictive estimators in two-
stage design with respect to two stage design using double sampling. An
empirical study is made to compare the relative performance of the proposed
estimators
The results presented in this thesis are mainly theoretical. Applications
of the results obtained are demonstrated through empirical studies.
In the end we propose the possible areas for further extension of the
research work contained in this thesis.
........o……..