introduction anova mike tucker school of psychology b209 portland square university of plymouth...
TRANSCRIPT

Introduction ANOVA
Mike TuckerSchool of PsychologyB209 Portland SquareUniversity of PlymouthDrake CircusPlymouth, PL4 8AATel: +44 (0)1752 584860Email: [email protected]__________________________________

Relation to other Stats
Correlational• Collect data and
describe relationships.
• Can’t say much about causal relations.
Experimental• Manipulate conditions
and infer something about their causal effects.
• Can infer cause and effect relations.

Relation to other Stats
• ANOVA is typically used to analyse data from experimental research where conditions are explicitly manipulated -allowing causal inferences to be made.
• However bear in mind that what determines whether it is legitimate to draw causal inferences is how the data is obtained – not which test is used to analyse it.

Simple & Factorial ANOVA
• Simple ANOVA designs: extension of T-Test to more than two conditions.
• Factorial ANOVA: conditions are created that are the result of crossing the levels of two or more FACTORS.

Factors and Factor Levels
• A Factor is a property or dimension of the experimental situation that is manipulated.
• The Levels of a factor are the particular settings of the Factor used in the experiment.

Factors and their Levels
• Factors:• Stimulus Duration• Sex• Treatment
• Age Group
• Levels:• 100 ms, 200 ms …• Male, Female..• CBT, Drug,
Psychoanalytic• 18-25, 26-40, one foot
in the grave

Typical Experimental Design
• An Exp. to determine differences in three antihistamine drugs on driving performance.
• Performance measured in a driving simulator under two difficulty levels (Hard & Easy).

Design
• 3 x Drugs • 2 x Difficulty Level
= 6 Drug by Difficulty combinations:
Benadryl + Hard
Benadryl + Easy
Tylenol + Hard
….etc
•Factor 1 = Drug•Factor 1 Levels =
Benadryl, Tylenol, Chlortrimeton
Factor 2 = Task Difficulty
Factor 2 Levels =
Hard, Easy.

Design
• This an example of a 2 x 3 design.
• Sometimes written in results sections as:“…The data was subjected to a 3 x 2 between
subjects ANOVA with the factors Drug (Benadryl, Tylenol, Chlortrimeton) and Task Difficulty (Easy, Hard)….”

LayoutTask Difficulty
Easy Hard
Drug
Benadryl 10 subs 10 subs
Tylenol 10 subs 10 subs
Chlortrimeton 10 subs 10 subs
Sixty adult drivers selected at random.Each one randomly assigned to one of the six experimental conditions (Between Subjects Design)

Between vs. Within Subjects
Between Subjects• Each participant only
undergoes testing in one of the experimental conditions (Factor combinations)
• Avoids contaminating effects but requires more participants and design more noisy (e.g. individual differences)
Within Subjects• AKA repeated Measures• Each participant
undergoes testing at all levels of one or more of the factors.
• More sensitive as individual differences controlled for but not always possible (e.g. Carry Over effects).

Between vs. Within
• Drug / Driving Simulation manipulations:
Classic case for a between subjects manipulation:• Carry over effect from drugs• Practice / order effects from driving simulation
• Case could be made for a within subjects manipulation of the Driving Task (e.g. – each subject given only one drug but tested under both driving difficulty levels). This would depend on, for example, the time course of the drug’s effects and the duration of the driving task.

How does ANOVA work?
• Recall the independent groups T-test:
(This a special case of the more general ANOVA design where you have a single factor with 2 levels – e.g. you are just comparing 2 means, level 1 vs. level 2.)

How does ANOVA work?Relation to T-test
• Two experimental conditions yield 2 samples of data (scores).
• Each has a mean x and variance s2
• The variance is just a measure of the ‘average difference between data points’.
• Main question: does the observed difference between the two sample means reflect a real difference (statistically significant difference).

Mean and Variance
• Mean • Easy to understand – just
the average score.• = Sum of all scores
divided by the number of scores:
X / n
• Variance• Just a measure of the
average spread or variation of the scores.
• The ‘average’ of the squared distances of the individual scores from the mean. (The squaring is simply to stop the negative and positive distances cancelling out):
(X-X)2 / n

How it works -3 samples of 4 (red dots) taken from 3 populationsThe 3 sample means are the orange dots.H0 True H0 False
POPULATIONS
Distribution of SAMPLE MEANS OF SIZE N drawn from the 3 populations
H0 – all drawn from same population Vs. H1 – some drawn from different populations
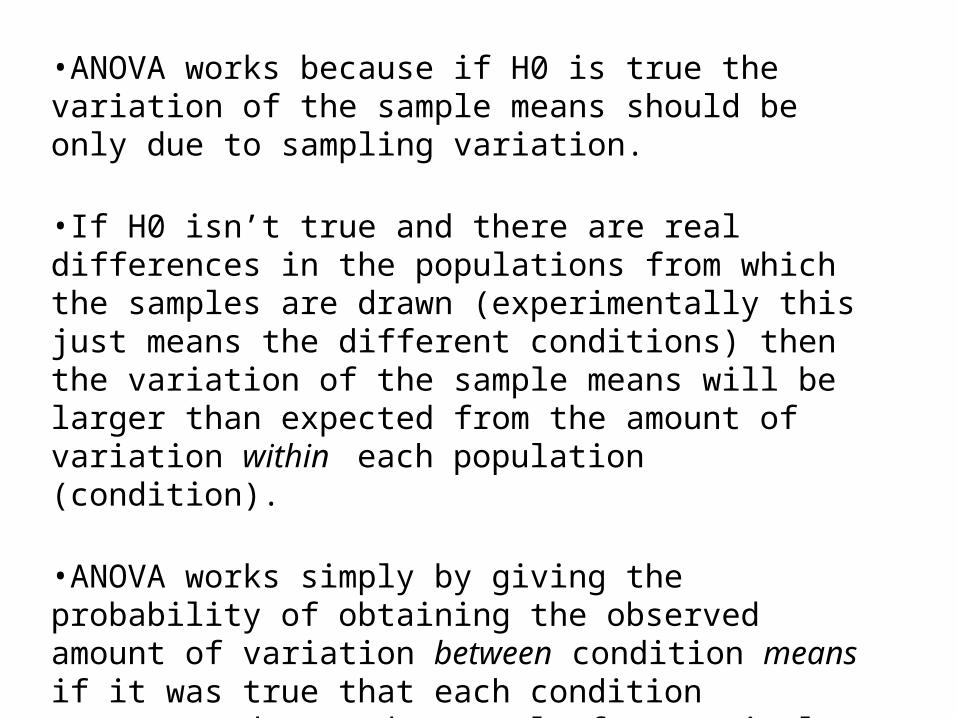
•ANOVA works because if H0 is true the variation of the sample means should be only due to sampling variation.
•If H0 isn’t true and there are real differences in the populations from which the samples are drawn (experimentally this just means the different conditions) then the variation of the sample means will be larger than expected from the amount of variation within each population (condition).
•ANOVA works simply by giving the probability of obtaining the observed amount of variation between condition means if it was true that each condition represented a random sample from a single parent ‘population’.

• A good estimate of the variation of individual scores within the ‘parent population’ can be obtained simply by using an average the variance within each condition.

What is the variance within a condition?
Suppose we have data from an experiment with 3 conditions:
The red vertical lines represent the condition averages
The red horizontal lines represent the deviations of individual scores from their associated condition means. The variance of the scores within a condition is the sum of these values (after squaring) divided by the number of observations in the condition minus 1 (the condition D.F.)
+23
-18

This estimate isn’t affected by real differences between conditions
However the variation between condition means is affected.

5’5”
4’0” 7’0”
Raw scores SD= 7”
Samples of size 10SD of the sample means = 7/sqrt(10)= 7/3.16 = 2.2
7”
2.2”
Recall: Can also work out the SD of the raw scores from the SD of the sample means = 2.2 x sqrt(10) =7
4’0” 7’0”
5’5”

Two estimates of the population variance
• They both agree if and only if there is no real difference between conditions
• In ANOVA the F ratio is used to compare these two estimates of the population variance.
• The F ratio is just the estimate based on the variation between the condition means (MSBetween) divided by the estimate based on the variation of the data within each condition (MSwithin)
Note MS = mean square and is just another term used in ANOVA for a variance

F Ratio in ANOVA
• If the two estimates agree then this F ratio should be approximately 1. If there are real differences between conditions (i.e. the ‘parent populations’ from which they are drawn are not the same) then this estimate will be larger than 1.
• If it is larger than 1 by a sufficient amount the p value will be <.05 and you conclude that there is evidence for real differences between thee conditions.

LayoutTask Difficulty
Easy Hard
Drug
Benadryl 10 subs 10 subs
Tylenol 10 subs 10 subs
Chlortrimeton 10 subs 10 subs
Sixty adult drivers selected at random.Each one randomly assigned to one of the six experimental conditions (Between Subjects Design)

Main effects and Interactions
• In factorial designs you can test for main effects of Factors and Interactions between them.
• A significant main effect of drug would indicate that there are genuine differences between the three drug groups (ignoring or averaging across task difficulty)

Drug Main effect
Task Difficulty
Easy Hard
Drug
Benadryl 10 subs 10 subs
Tylenol 10 subs 10 subs
Chlortrimeton 10 subs 10 subs

Main effect plot for Drug
0
5
10
15
20
25
Benadryl Tylenol Chlortrimeton
Drug
Series1

Task Main effect
Task Difficulty
Easy Hard
Drug
Benadryl 10 subs 10 subs
Tylenol 10 subs 10 subs
Chlortrimeton 10 subs 10 subs

Main effect plot for Task Difficulty
0
2
4
6
8
10
12
14
Easy Difficult
Series1

0
5
10
15
20
25
Benadryl Tylenol Chlortrimeton
Easy
Hard
Interaction plot– Drug by Task DifficultyNo Interaction just drug main effect

Interaction plot – Drug by Task DifficultyInteraction no main effects
0
5
10
15
20
25
Benadryl Tylenol Chlortrimeton
Easy
Hard

0
10
20
30
40
50
60
Benadryl Tylenol Chlortrimeton
Easy
Hard
Interaction plot – Drug by Task DifficultyInteraction and main effect of Task but no main effect of drug