introduction - cloud object storage | store & retrieve ... · should not be construed as a...
TRANSCRIPT
User Manual
Introduction
The Autochartist Interface
Our Favourites (A)
Trading Opportunities (B)
Event Impact Analysis (C)
Performance Statistics (D)
Messaging & Alerts (E)
Trading Community (F)
Search Pane (G)
Pattern Display (H)
Price Movement Pane (Volatility Analysis) (I)
Sound Switch (J)
Results Filter (K)
Active Trading Opportunities (L)
Expired Trading Opportunities (M)
Creating and Editing a Search
Basic Search
Search Name
Advanced Search Filters
Advanced Filters: Chart Patterns
Advanced Filters: Fibonacci Patterns
Advanced Filters: Key Levels
Emerging vs Complete Results
Emerging Chart Patterns
Emerging Fibonacci Patterns
Support
Disclaimer
The Autochartist service includes chart pattern identification in respect of foreign currencies, commodities,
equities and stocks. There are potential risks relating to investing and trading. You must be aware of such
risks and familiarize yourself in regard to such risks and to seek independent advice relating thereto. You
should not trade with money that you cannot afford to lose. The Autochartist service and its content
should not be construed as a solicitation to invest and/or trade. You should seek independent advice in
this regard. Past performance is not indicative of future performance. No representation is being made
that any results discussed within the service and its related media content will be achieved. All opinions,
news, research, analyses, prices or other information is provided as general market commentary and not
as investment advice. Autochartist, MDIO Software, their members, shareholders, employees, agents,
representatives and resellers do not warrant the completeness, accuracy or timeliness of the information
supplied, and they shall not be liable for any loss or damages, consequential or otherwise, which may
arise from the use or reliance of the Autochartist service and its content.
Chapter 1
INTRODUCTION
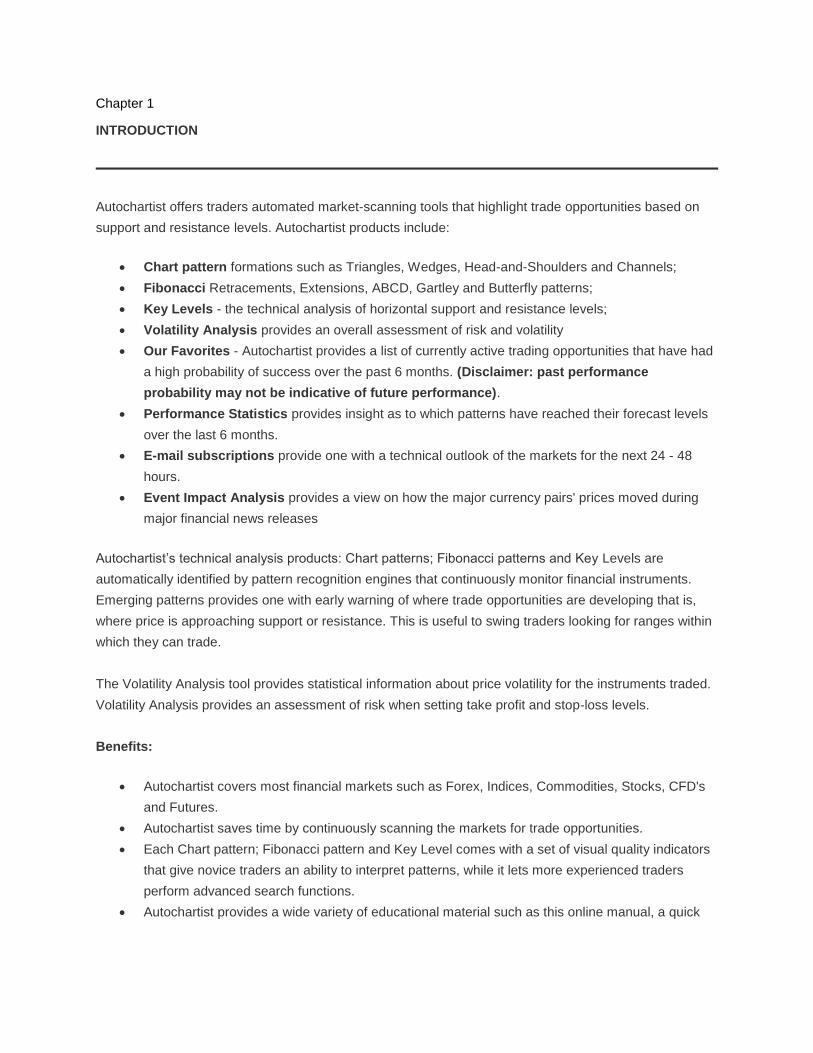
Autochartist offers traders automated market-scanning tools that highlight trade opportunities based on
support and resistance levels. Autochartist products include:
Chart pattern formations such as Triangles, Wedges, Head-and-Shoulders and Channels;
Fibonacci Retracements, Extensions, ABCD, Gartley and Butterfly patterns;
Key Levels - the technical analysis of horizontal support and resistance levels;
Volatility Analysis provides an overall assessment of risk and volatility
Our Favorites - Autochartist provides a list of currently active trading opportunities that have had
a high probability of success over the past 6 months. (Disclaimer: past performance
probability may not be indicative of future performance).
Performance Statistics provides insight as to which patterns have reached their forecast levels
over the last 6 months.
E-mail subscriptions provide one with a technical outlook of the markets for the next 24 - 48
hours.
Event Impact Analysis provides a view on how the major currency pairs' prices moved during
major financial news releases
Autochartist’s technical analysis products: Chart patterns; Fibonacci patterns and Key Levels are
automatically identified by pattern recognition engines that continuously monitor financial instruments.
Emerging patterns provides one with early warning of where trade opportunities are developing that is,
where price is approaching support or resistance. This is useful to swing traders looking for ranges within
which they can trade.
The Volatility Analysis tool provides statistical information about price volatility for the instruments traded.
Volatility Analysis provides an assessment of risk when setting take profit and stop-loss levels.
Benefits:
Autochartist covers most financial markets such as Forex, Indices, Commodities, Stocks, CFD's
and Futures.
Autochartist saves time by continuously scanning the markets for trade opportunities.
Each Chart pattern; Fibonacci pattern and Key Level comes with a set of visual quality indicators
that give novice traders an ability to interpret patterns, while it lets more experienced traders
perform advanced search functions.
Autochartist provides a wide variety of educational material such as this online manual, a quick

start guide, videos, eBooks and free webinars.
Chapter 2
AUTOCHARTIST WEB INTERFACE
Upon first sign in to the Autochartist web application the interface will display information that has been
loaded by default
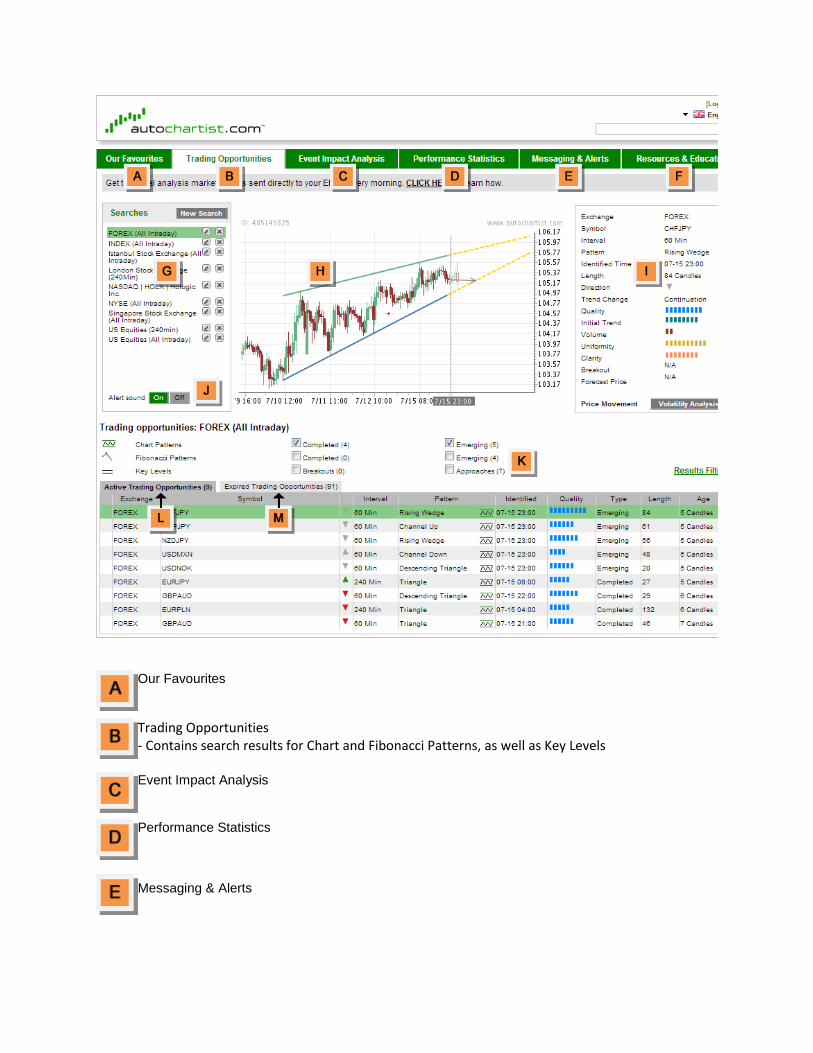
Our Favourites
Trading Opportunities - Contains search results for Chart and Fibonacci Patterns, as well as Key Levels Event Impact Analysis
Performance Statistics
Messaging & Alerts
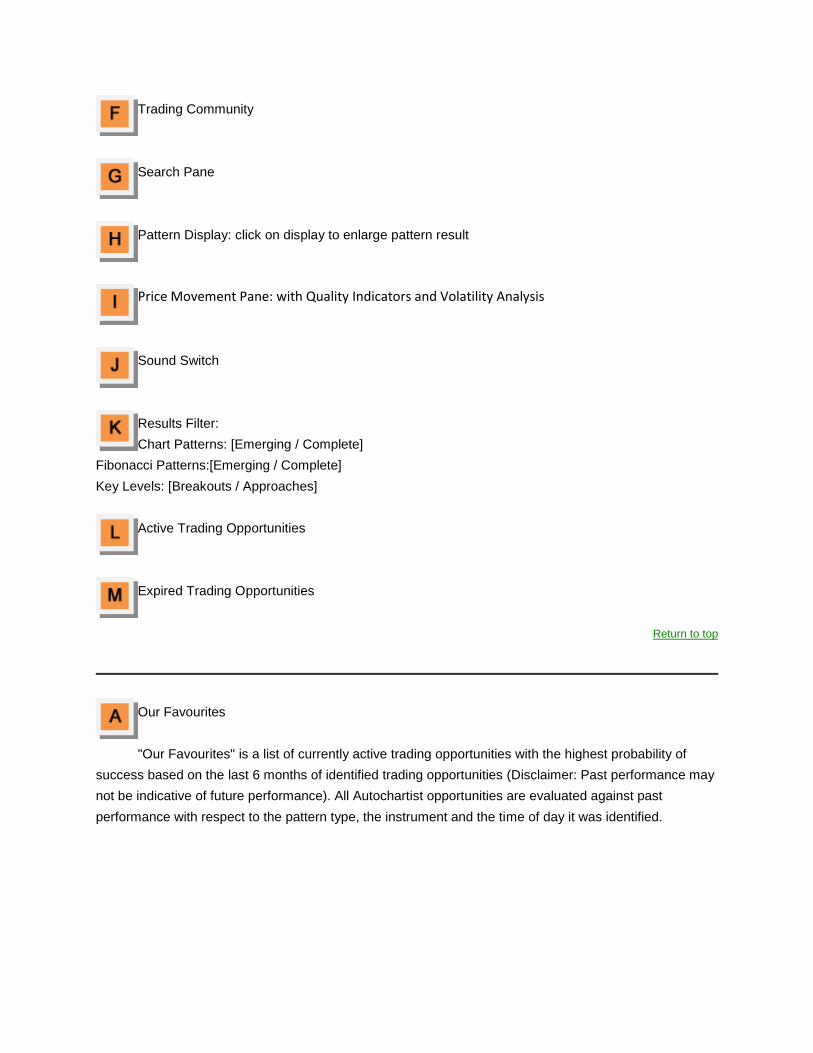
Trading Community
Search Pane
Pattern Display: click on display to enlarge pattern result
Price Movement Pane: with Quality Indicators and Volatility Analysis
Sound Switch
Results Filter:
Chart Patterns: [Emerging / Complete]
Fibonacci Patterns:[Emerging / Complete]
Key Levels: [Breakouts / Approaches]
Active Trading Opportunities
Expired Trading Opportunities
Return to top
Our Favourites
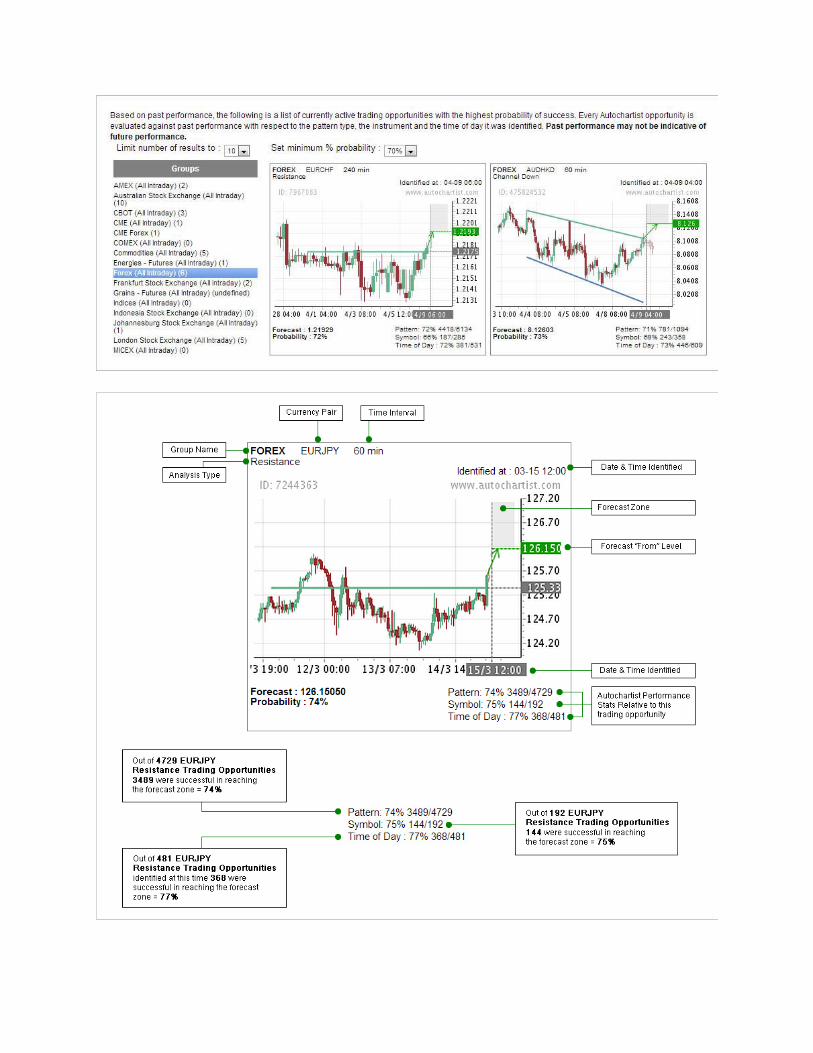
"Our Favourites" is a list of currently active trading opportunities with the highest probability of
success based on the last 6 months of identified trading opportunities (Disclaimer: Past performance may
not be indicative of future performance). All Autochartist opportunities are evaluated against past
performance with respect to the pattern type, the instrument and the time of day it was identified.
Return to top
Trading Opportunities Search for Chart Patterns; Fibonacci Patterns, as well as Key Levels trade opportunities from
the Trading Opportunities Tab. The Results Filter refines one's preferences by including or excluding some or all of the trade opportunities available.
Return to top
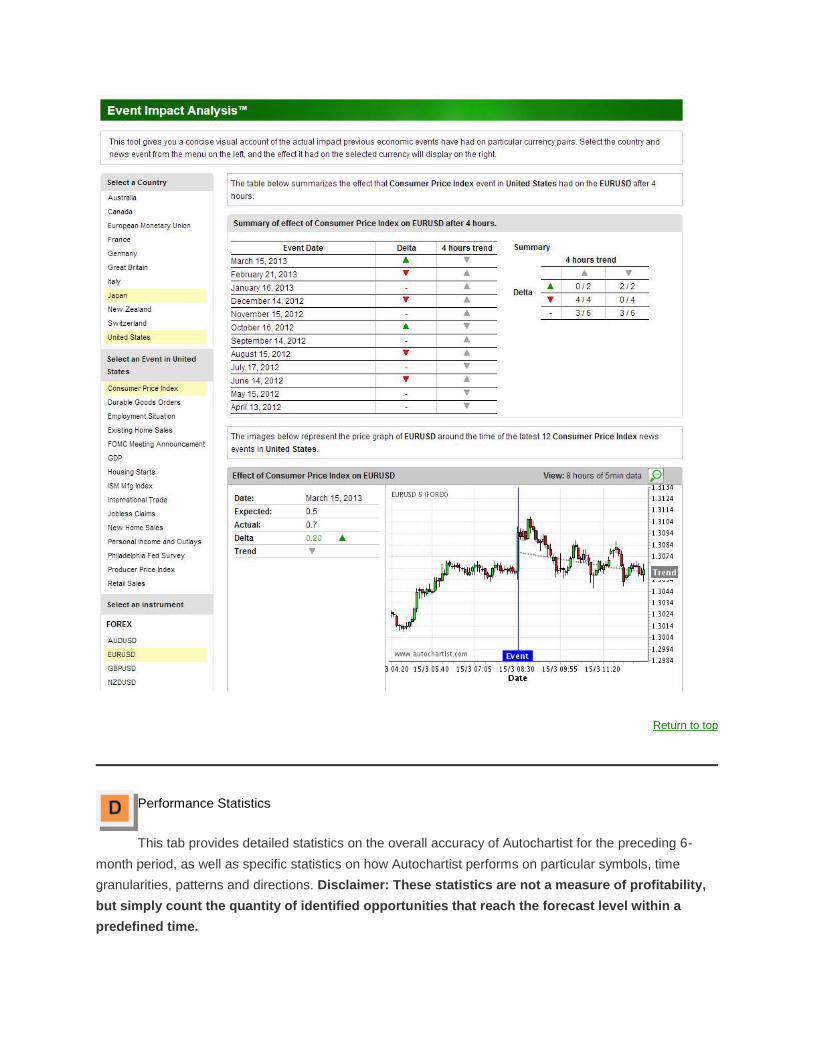
Event Impact Analysis
This tool provides a concise visual account of the impact previous economic events have had on a
particular currency pair. Select the country and news event from the menu on the left, and the effect it had
on the selected currency will display on the right.
Return to top
Performance Statistics
This tab provides detailed statistics on the overall accuracy of Autochartist for the preceding 6-
month period, as well as specific statistics on how Autochartist performs on particular symbols, time
granularities, patterns and directions. Disclaimer: These statistics are not a measure of profitability,
but simply count the quantity of identified opportunities that reach the forecast level within a
predefined time.
Return to top
Messaging & Alerts Tab (Market Reports)
E-mail subscriptions provide one with a report on the technical outlook of the markets for the next
few days. Subscribe to receive e-mails up to three times per day for markets such as Forex and
Commodities, or once per day for stock exchanges such as the Tokyo Stock Exchange, London Stock
Exchange and the New York Stock Exchange.
To subscribe, one should log into the Autochartist platform, click on ‘Messaging & Alerts, select
preferred market, select preferred language and the preferred time. Then to receive the email, one
should enter an email address and click on submit. . Note: to ensure receipt of Autochartist’s daily e-
mail alerts one should please add [email protected] to an address book or contact list.
Return to top
Trading Community
This section provides access to education and product support documentation, as well as
downloads and install instructions of Autochartist's MT4; MT5 and JForex plugin. In addition, one can
follow live intraday trading using Autochartist. Subscribe to receive e-mail alerts of new trades placed.
Return to top
Search Pane When logging in for the first time, the search pane contains a default list of populated searches.
Each search contains a set of criteria defined by the individual which specifies which symbolsto include in the search. The symbols can be included by: 1. Selecting from predefined groups such as exchanges or instrument types;, or 2. By selecting individual symbols.
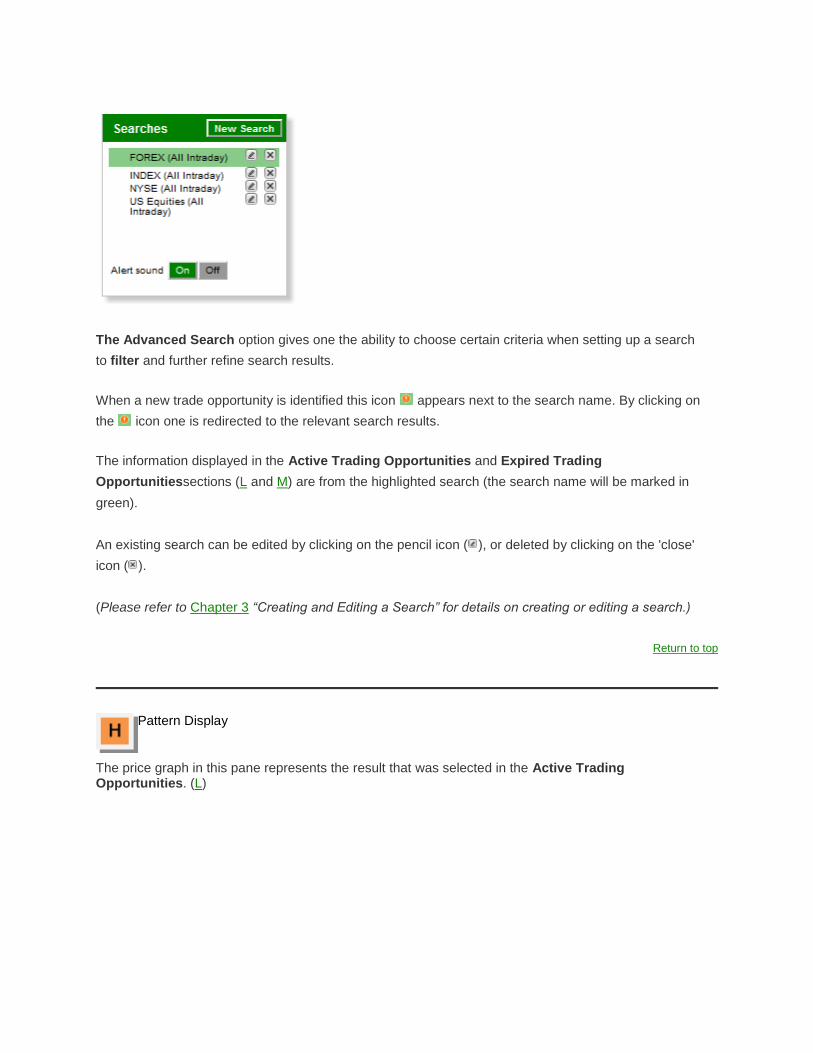
The Advanced Search option gives one the ability to choose certain criteria when setting up a search
to filter and further refine search results.
When a new trade opportunity is identified this icon appears next to the search name. By clicking on
the icon one is redirected to the relevant search results.
The information displayed in the Active Trading Opportunities and Expired Trading
Opportunitiessections (L and M) are from the highlighted search (the search name will be marked in
green).
An existing search can be edited by clicking on the pencil icon ( ), or deleted by clicking on the 'close'
icon ( ).
(Please refer to Chapter 3 “Creating and Editing a Search” for details on creating or editing a search.)
Return to top
Pattern Display
The price graph in this pane represents the result that was selected in the Active Trading Opportunities. (L)
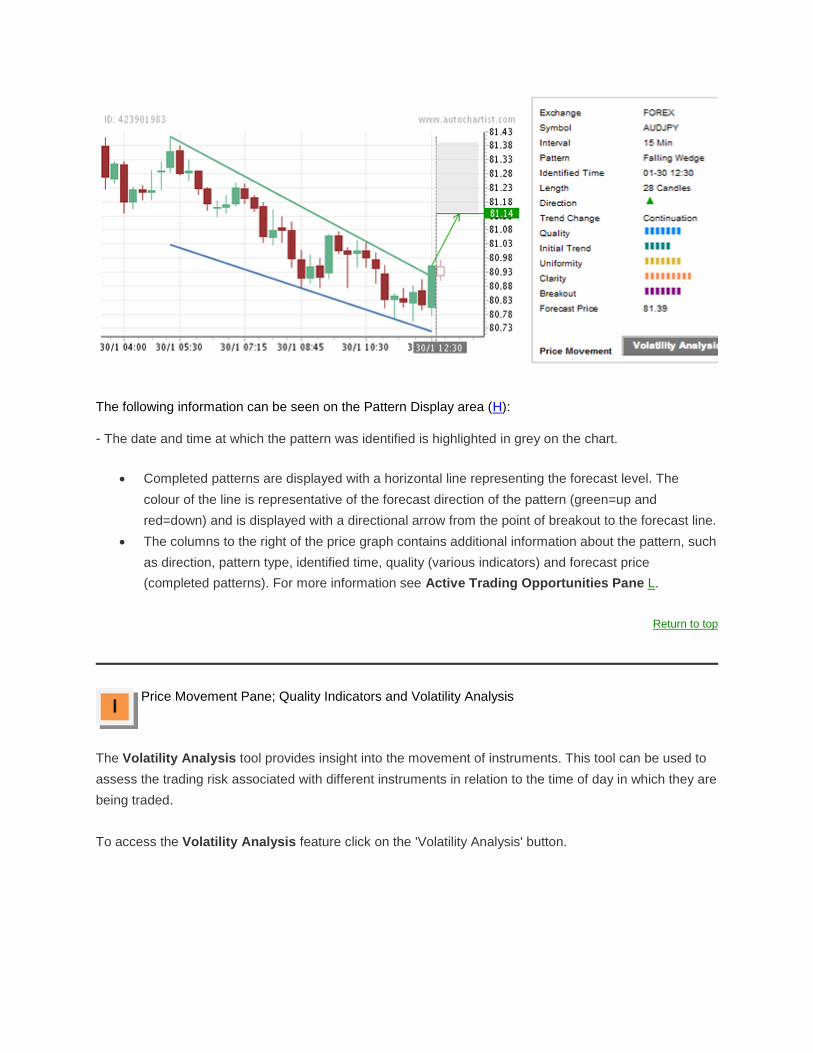
The following information can be seen on the Pattern Display area (H):
- The date and time at which the pattern was identified is highlighted in grey on the chart.
Completed patterns are displayed with a horizontal line representing the forecast level. The
colour of the line is representative of the forecast direction of the pattern (green=up and
red=down) and is displayed with a directional arrow from the point of breakout to the forecast line.
The columns to the right of the price graph contains additional information about the pattern, such
as direction, pattern type, identified time, quality (various indicators) and forecast price
(completed patterns). For more information see Active Trading Opportunities Pane L.
Return to top
Price Movement Pane; Quality Indicators and Volatility Analysis
The Volatility Analysis tool provides insight into the movement of instruments. This tool can be used to
assess the trading risk associated with different instruments in relation to the time of day in which they are
being traded.
To access the Volatility Analysis feature click on the 'Volatility Analysis' button.
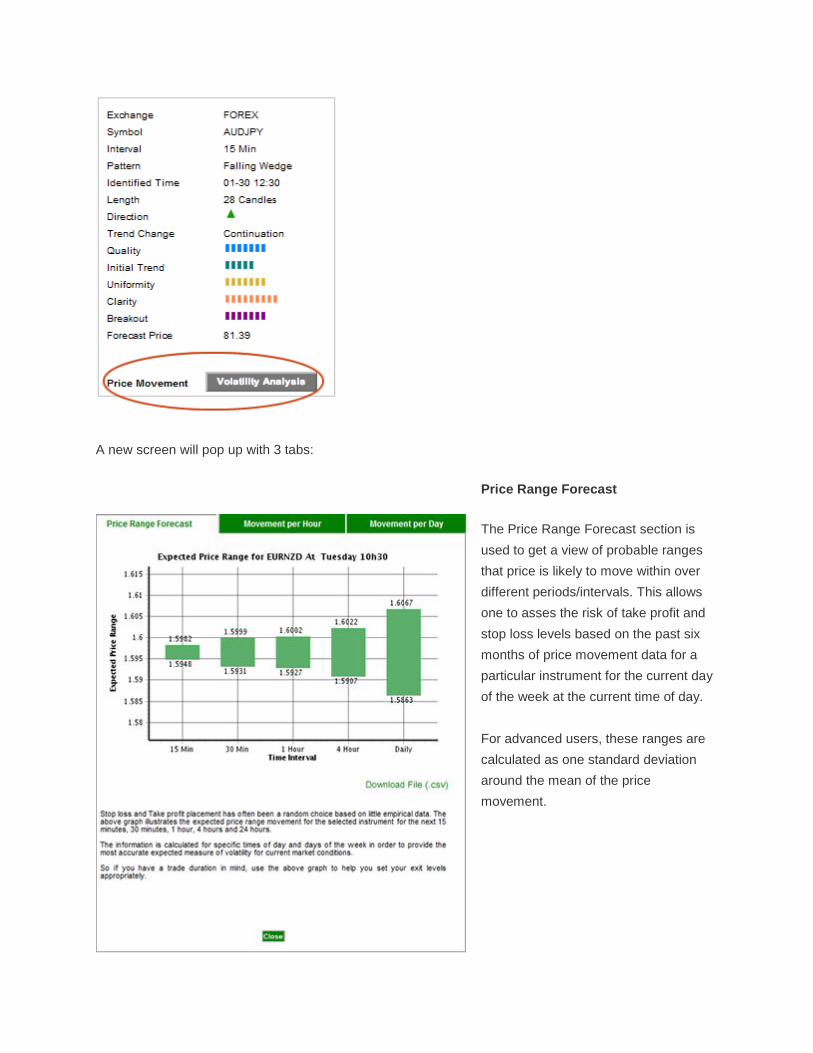
A new screen will pop up with 3 tabs:
Price Range Forecast
The Price Range Forecast section is
used to get a view of probable ranges
that price is likely to move within over
different periods/intervals. This allows
one to asses the risk of take profit and
stop loss levels based on the past six
months of price movement data for a
particular instrument for the current day
of the week at the current time of day.
For advanced users, these ranges are
calculated as one standard deviation
around the mean of the price
movement.
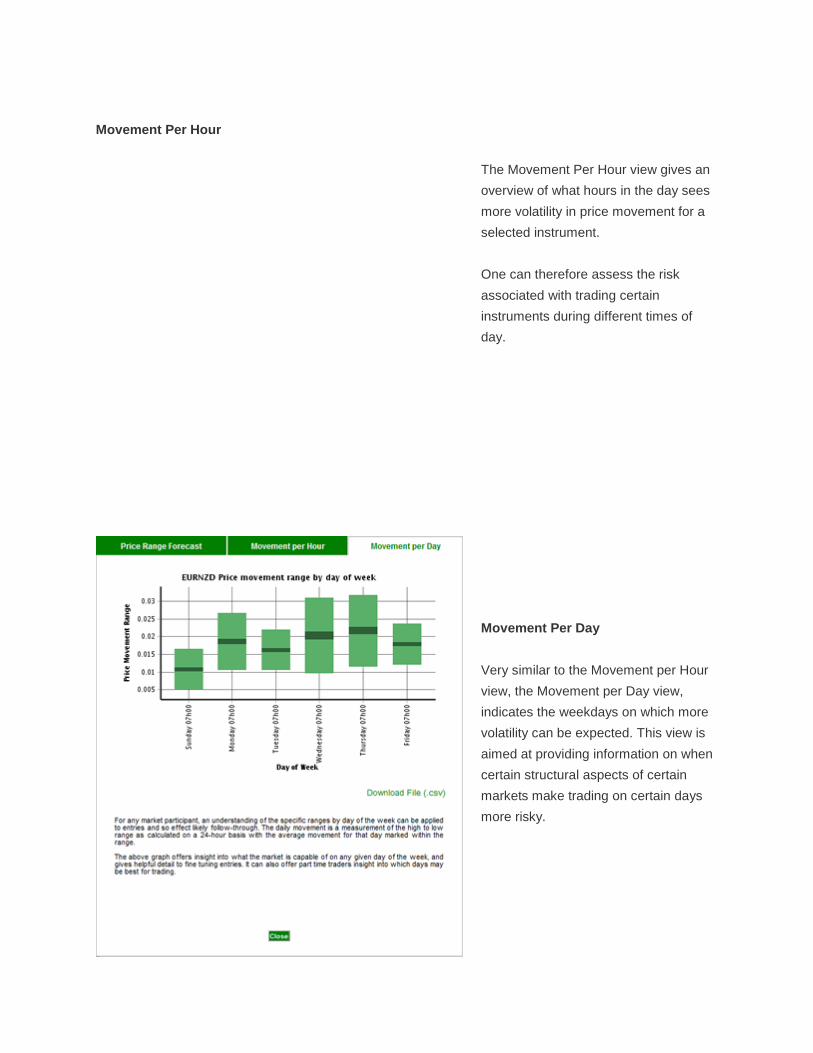
Movement Per Hour
The Movement Per Hour view gives an
overview of what hours in the day sees
more volatility in price movement for a
selected instrument.
One can therefore assess the risk
associated with trading certain
instruments during different times of
day.
Movement Per Day
Very similar to the Movement per Hour
view, the Movement per Day view,
indicates the weekdays on which more
volatility can be expected. This view is
aimed at providing information on when
certain structural aspects of certain
markets make trading on certain days
more risky.
Return to top
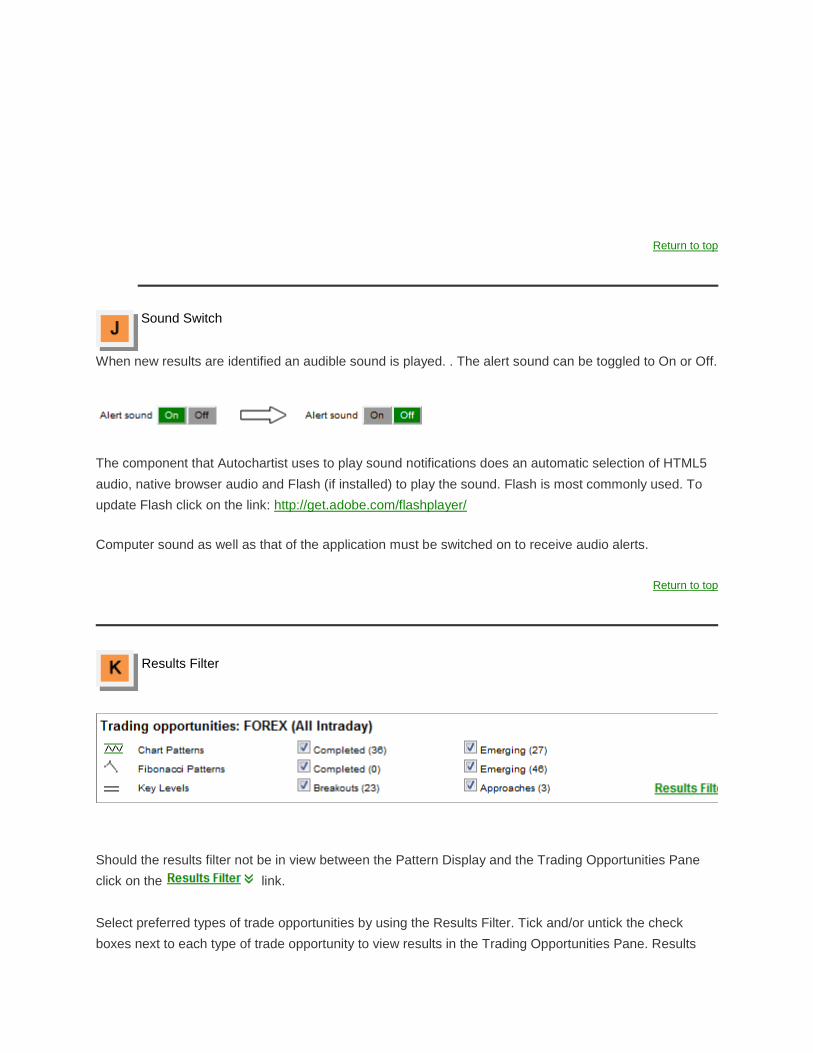
Sound Switch
When new results are identified an audible sound is played. . The alert sound can be toggled to On or Off.
The component that Autochartist uses to play sound notifications does an automatic selection of HTML5
audio, native browser audio and Flash (if installed) to play the sound. Flash is most commonly used. To
update Flash click on the link: http://get.adobe.com/flashplayer/
Computer sound as well as that of the application must be switched on to receive audio alerts.
Return to top
Results Filter
Should the results filter not be in view between the Pattern Display and the Trading Opportunities Pane
click on the link.
Select preferred types of trade opportunities by using the Results Filter. Tick and/or untick the check
boxes next to each type of trade opportunity to view results in the Trading Opportunities Pane. Results
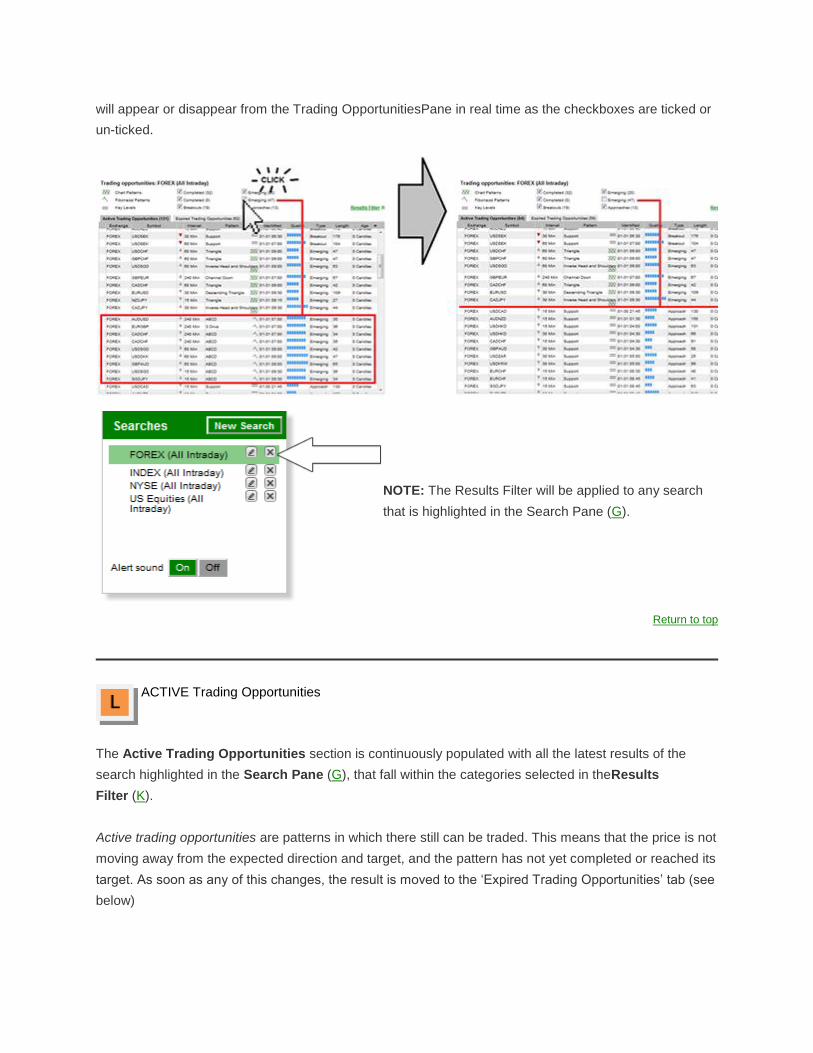
will appear or disappear from the Trading OpportunitiesPane in real time as the checkboxes are ticked or
un-ticked.
NOTE: The Results Filter will be applied to any search
that is highlighted in the Search Pane (G).
Return to top
ACTIVE Trading Opportunities
The Active Trading Opportunities section is continuously populated with all the latest results of the
search highlighted in the Search Pane (G), that fall within the categories selected in theResults
Filter (K).
Active trading opportunities are patterns in which there still can be traded. This means that the price is not
moving away from the expected direction and target, and the pattern has not yet completed or reached its
target. As soon as any of this changes, the result is moved to the ‘Expired Trading Opportunities’ tab (see
below)
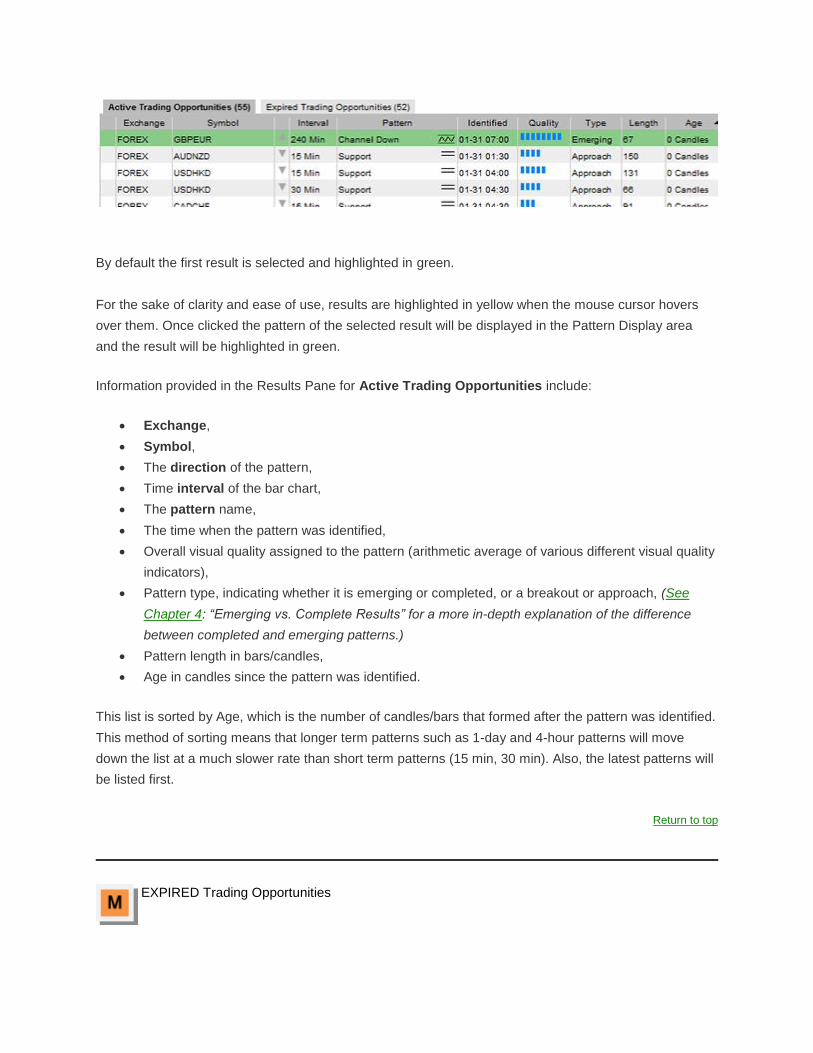
By default the first result is selected and highlighted in green.
For the sake of clarity and ease of use, results are highlighted in yellow when the mouse cursor hovers
over them. Once clicked the pattern of the selected result will be displayed in the Pattern Display area
and the result will be highlighted in green.
Information provided in the Results Pane for Active Trading Opportunities include:
Exchange,
Symbol,
The direction of the pattern,
Time interval of the bar chart,
The pattern name,
The time when the pattern was identified,
Overall visual quality assigned to the pattern (arithmetic average of various different visual quality
indicators),
Pattern type, indicating whether it is emerging or completed, or a breakout or approach, (See
Chapter 4: “Emerging vs. Complete Results” for a more in-depth explanation of the difference
between completed and emerging patterns.)
Pattern length in bars/candles,
Age in candles since the pattern was identified.
This list is sorted by Age, which is the number of candles/bars that formed after the pattern was identified.
This method of sorting means that longer term patterns such as 1-day and 4-hour patterns will move
down the list at a much slower rate than short term patterns (15 min, 30 min). Also, the latest patterns will
be listed first.
Return to top
EXPIRED Trading Opportunities
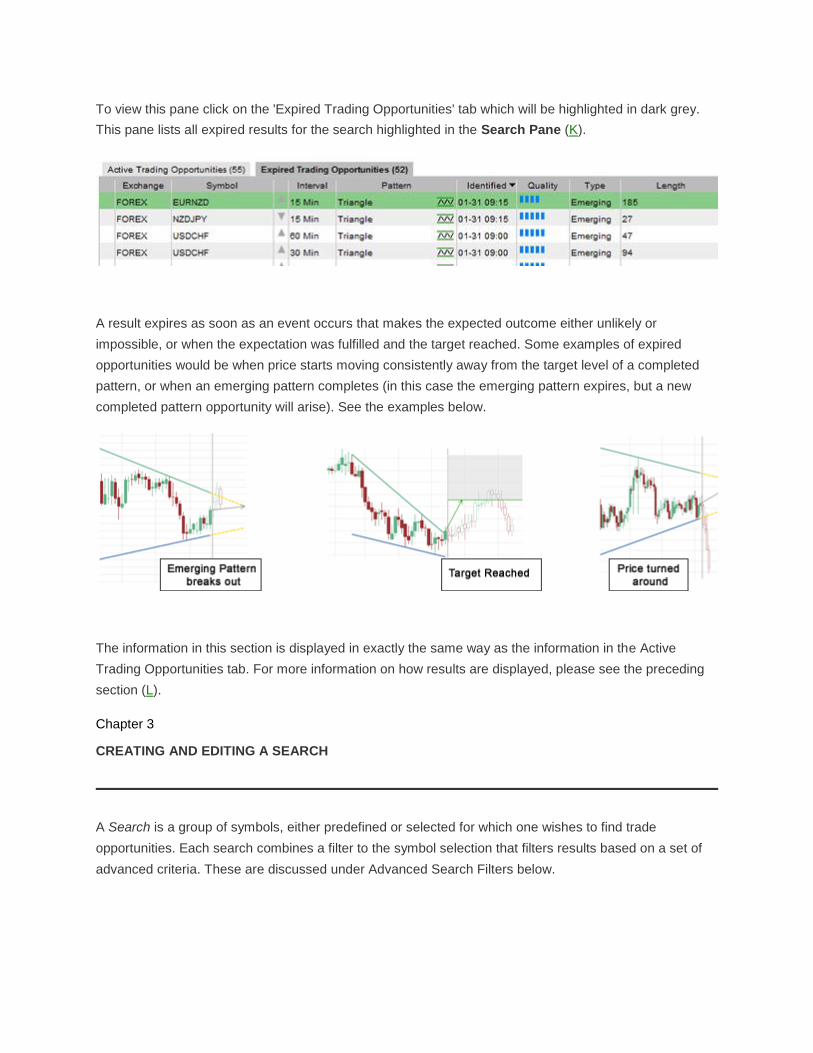
To view this pane click on the 'Expired Trading Opportunities' tab which will be highlighted in dark grey.
This pane lists all expired results for the search highlighted in the Search Pane (K).
A result expires as soon as an event occurs that makes the expected outcome either unlikely or
impossible, or when the expectation was fulfilled and the target reached. Some examples of expired
opportunities would be when price starts moving consistently away from the target level of a completed
pattern, or when an emerging pattern completes (in this case the emerging pattern expires, but a new
completed pattern opportunity will arise). See the examples below.
The information in this section is displayed in exactly the same way as the information in the Active
Trading Opportunities tab. For more information on how results are displayed, please see the preceding
section (L).
Chapter 3
CREATING AND EDITING A SEARCH
A Search is a group of symbols, either predefined or selected for which one wishes to find trade
opportunities. Each search combines a filter to the symbol selection that filters results based on a set of
advanced criteria. These are discussed under Advanced Search Filters below.
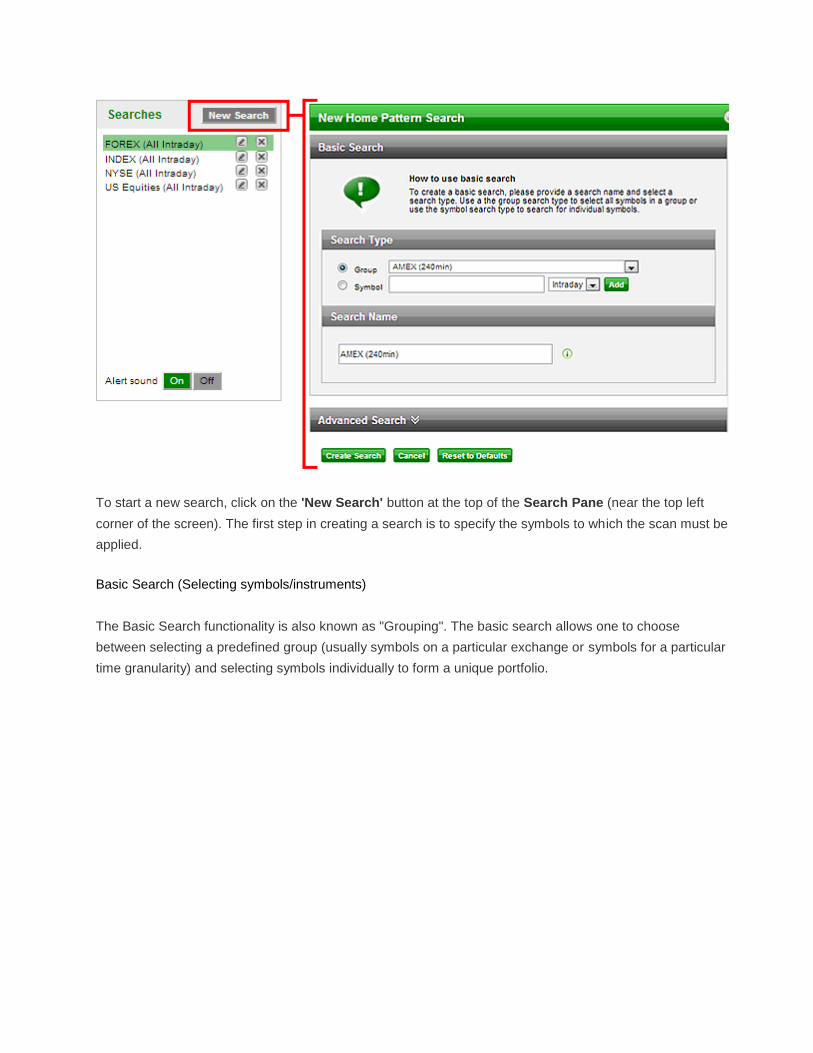
To start a new search, click on the 'New Search' button at the top of the Search Pane (near the top left
corner of the screen). The first step in creating a search is to specify the symbols to which the scan must be
applied.
Basic Search (Selecting symbols/instruments)
The Basic Search functionality is also known as "Grouping". The basic search allows one to choose
between selecting a predefined group (usually symbols on a particular exchange or symbols for a particular
time granularity) and selecting symbols individually to form a unique portfolio.
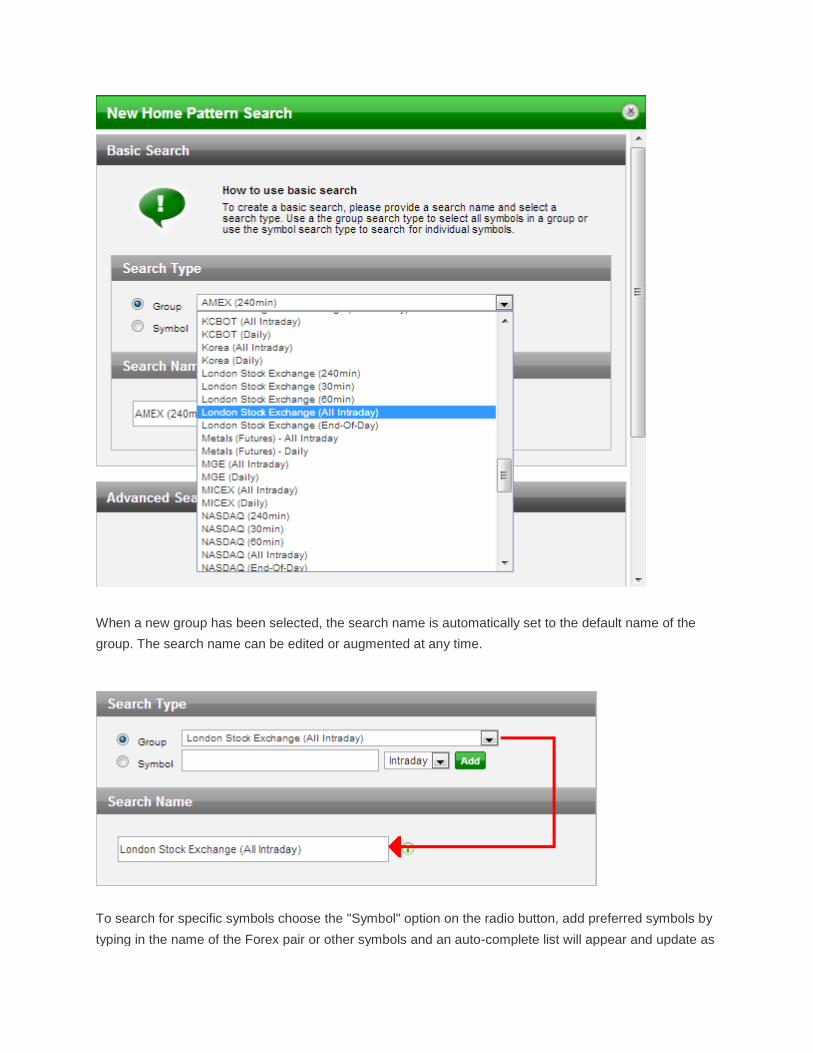
When a new group has been selected, the search name is automatically set to the default name of the
group. The search name can be edited or augmented at any time.
To search for specific symbols choose the "Symbol" option on the radio button, add preferred symbols by
typing in the name of the Forex pair or other symbols and an auto-complete list will appear and update as
one types.
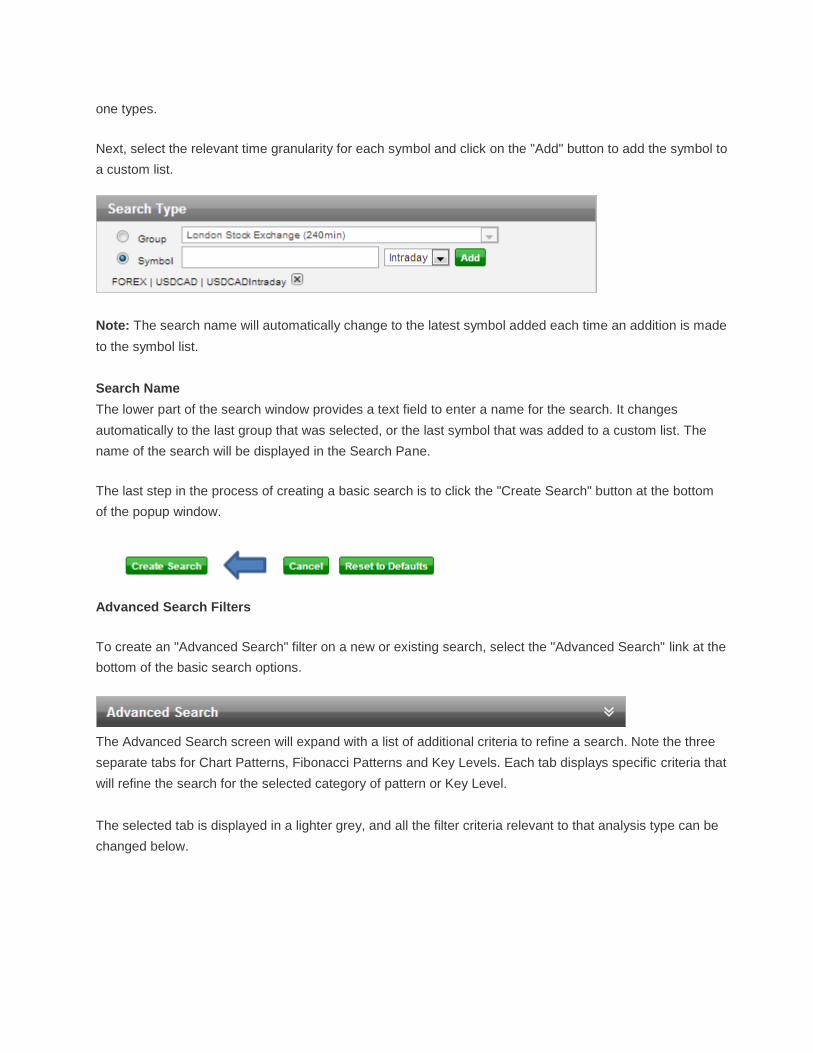
Next, select the relevant time granularity for each symbol and click on the "Add" button to add the symbol to
a custom list.
Note: The search name will automatically change to the latest symbol added each time an addition is made
to the symbol list.
Search Name
The lower part of the search window provides a text field to enter a name for the search. It changes
automatically to the last group that was selected, or the last symbol that was added to a custom list. The
name of the search will be displayed in the Search Pane.
The last step in the process of creating a basic search is to click the "Create Search" button at the bottom
of the popup window.
Advanced Search Filters
To create an "Advanced Search" filter on a new or existing search, select the "Advanced Search" link at the
bottom of the basic search options.
The Advanced Search screen will expand with a list of additional criteria to refine a search. Note the three
separate tabs for Chart Patterns, Fibonacci Patterns and Key Levels. Each tab displays specific criteria that
will refine the search for the selected category of pattern or Key Level.
The selected tab is displayed in a lighter grey, and all the filter criteria relevant to that analysis type can be
changed below.
NOTE: Beware not to make the advanced filter criteria too restrictive. It can easily happen that two or three
criteria can be made too restrictive and cause the search to end up with an empty result set and message
"No Patterns Found "in the Results Pane.
Each set of search criteria will be discussed in separate sections below.
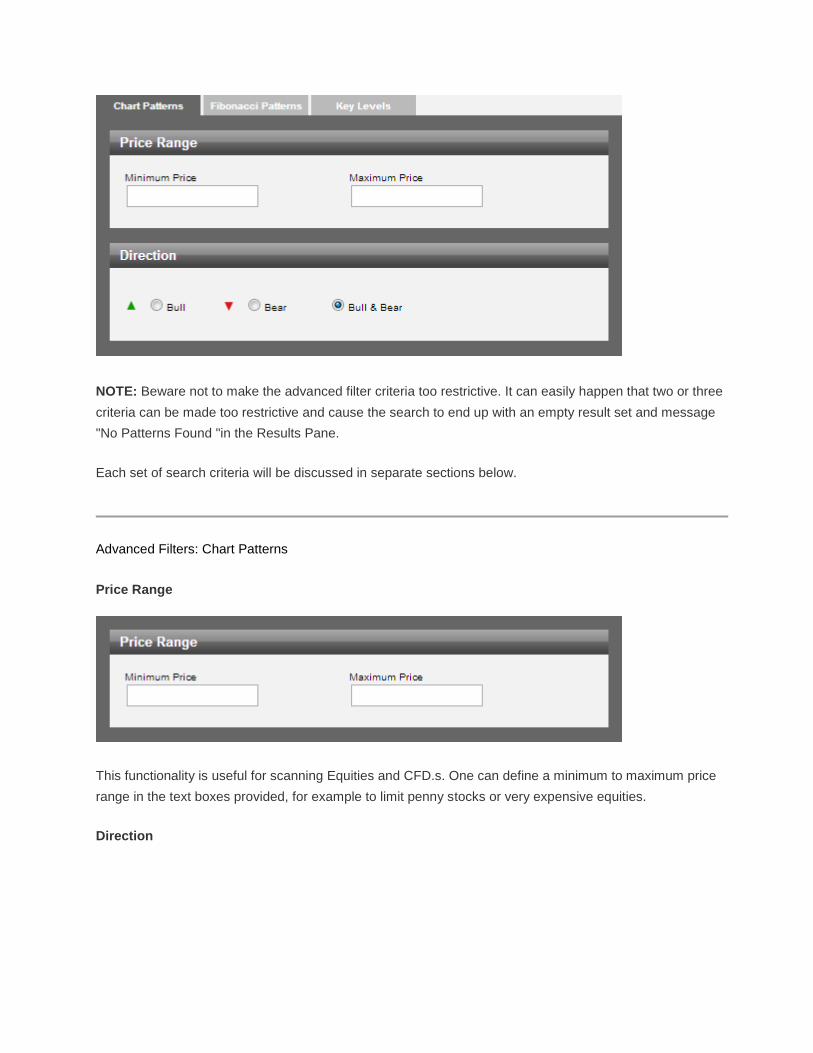
Advanced Filters: Chart Patterns
Price Range
This functionality is useful for scanning Equities and CFD.s. One can define a minimum to maximum price
range in the text boxes provided, for example to limit penny stocks or very expensive equities.
Direction
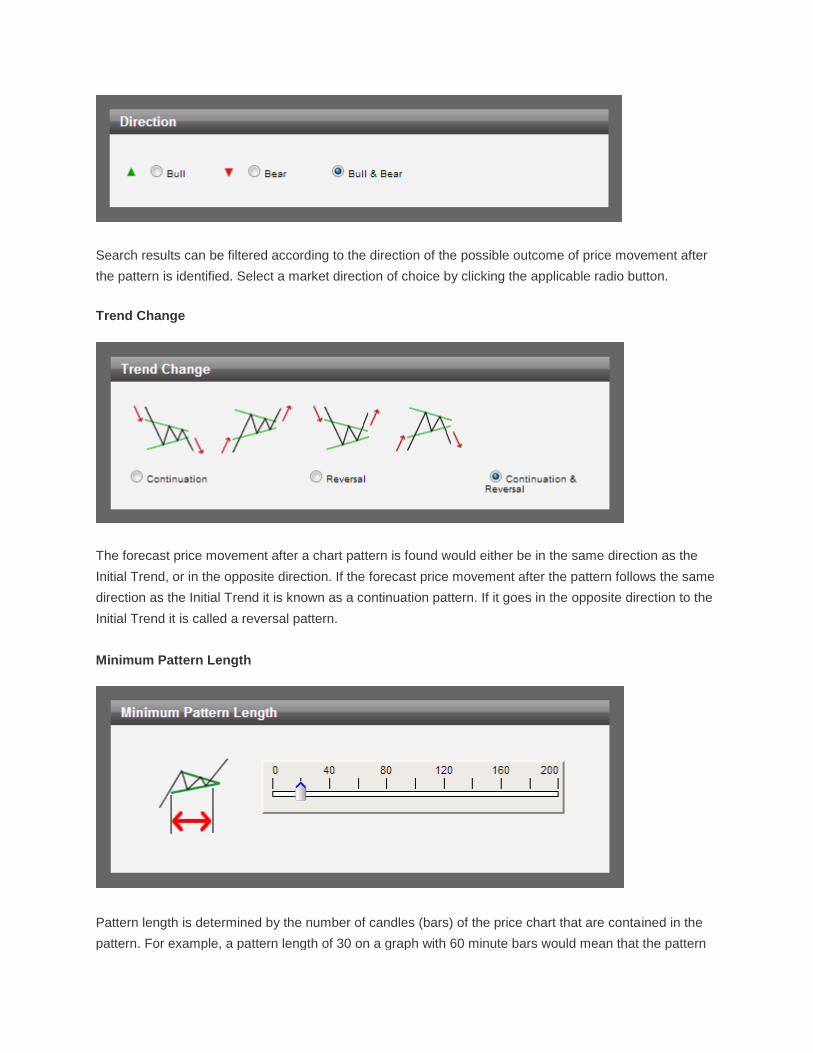
Search results can be filtered according to the direction of the possible outcome of price movement after
the pattern is identified. Select a market direction of choice by clicking the applicable radio button.
Trend Change
The forecast price movement after a chart pattern is found would either be in the same direction as the
Initial Trend, or in the opposite direction. If the forecast price movement after the pattern follows the same
direction as the Initial Trend it is known as a continuation pattern. If it goes in the opposite direction to the
Initial Trend it is called a reversal pattern.
Minimum Pattern Length
Pattern length is determined by the number of candles (bars) of the price chart that are contained in the
pattern. For example, a pattern length of 30 on a graph with 60 minute bars would mean that the pattern

was formed over 30 hours.
Chart Pattern Quality Indicators
Autochartist automatically rates 5 objective indicators to measure the visual quality of Chart patterns:
Clarity; Initial Trend; Volume; Uniformity and Breakout strength. (Disclaimer: Visual Quality is not an
assessment of the efficacy of the Chart Pattern, nor the possible profit or loss one can realize from
specific trading opportunities)
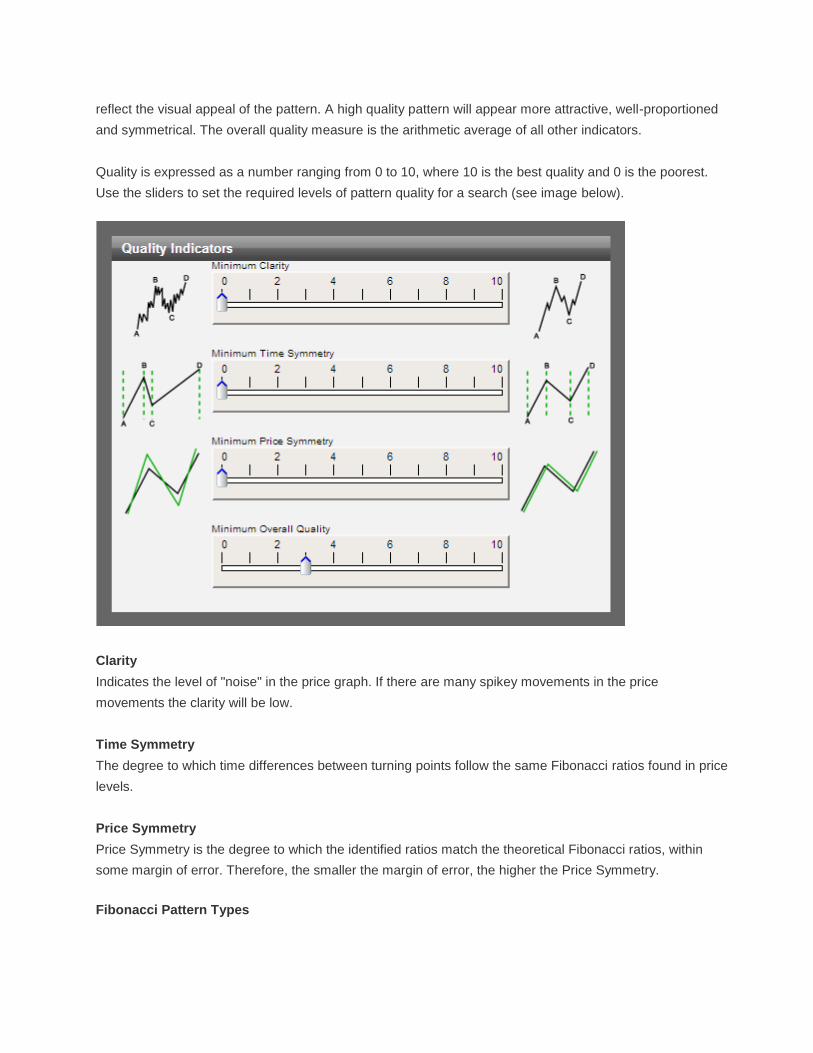
Quality indicators reflect the visual appeal of the pattern. A high quality pattern will appear more attractive,
well-proportioned and symmetrical. The overall quality measure is the arithmetic average of all other
indicators.
Quality is expressed as a number ranging from 0 to 10, where 10 is the best quality and 0 is the poorest.
Use the sliders to set the required levels of pattern quality for a search (see image below).
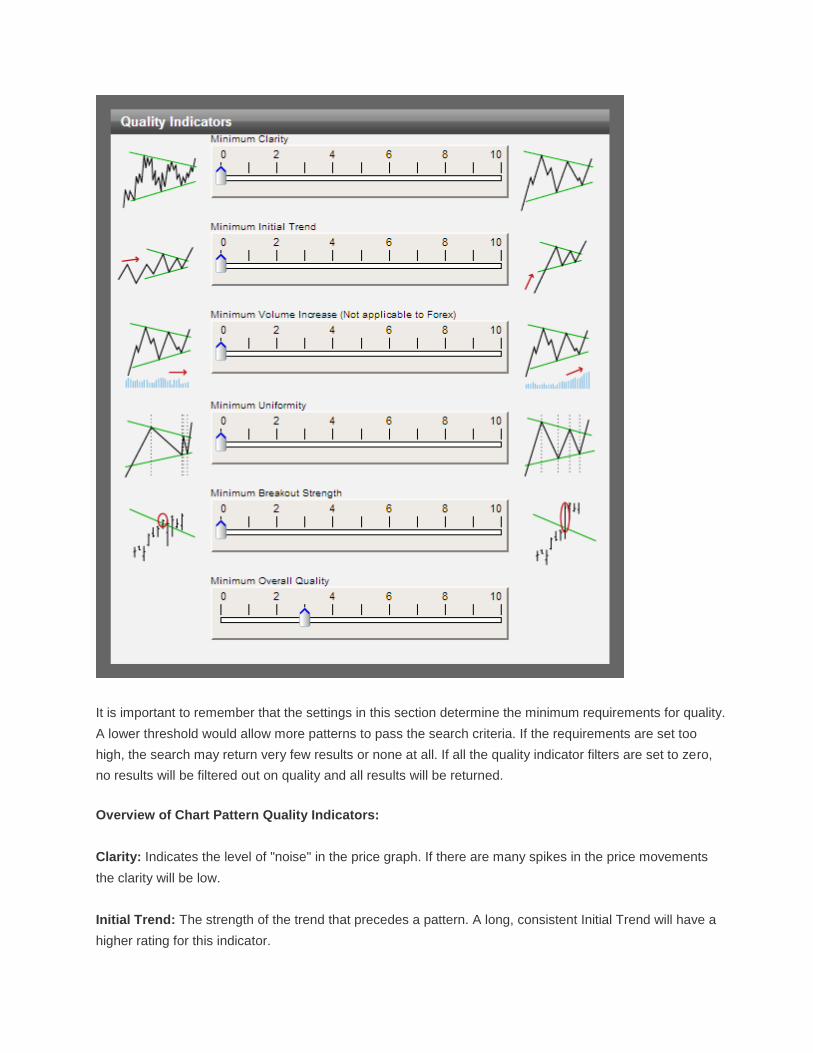
It is important to remember that the settings in this section determine the minimum requirements for quality.
A lower threshold would allow more patterns to pass the search criteria. If the requirements are set too
high, the search may return very few results or none at all. If all the quality indicator filters are set to zero,
no results will be filtered out on quality and all results will be returned.
Overview of Chart Pattern Quality Indicators:
Clarity: Indicates the level of "noise" in the price graph. If there are many spikes in the price movements
the clarity will be low.
Initial Trend: The strength of the trend that precedes a pattern. A long, consistent Initial Trend will have a
higher rating for this indicator.

Volume: An important indicator that measures the increase in volume during the breakout of a price
through support/resistance. Volume is only applicable to exchange-traded instruments (equities, ETFs).
Uniformity: If the points touching the support and resistance lines are more evenly spaced over time, the
pattern will have a better Uniformity rating.
Breakout Strength: The size of the candle with which the price breaks through a support or resistance
level
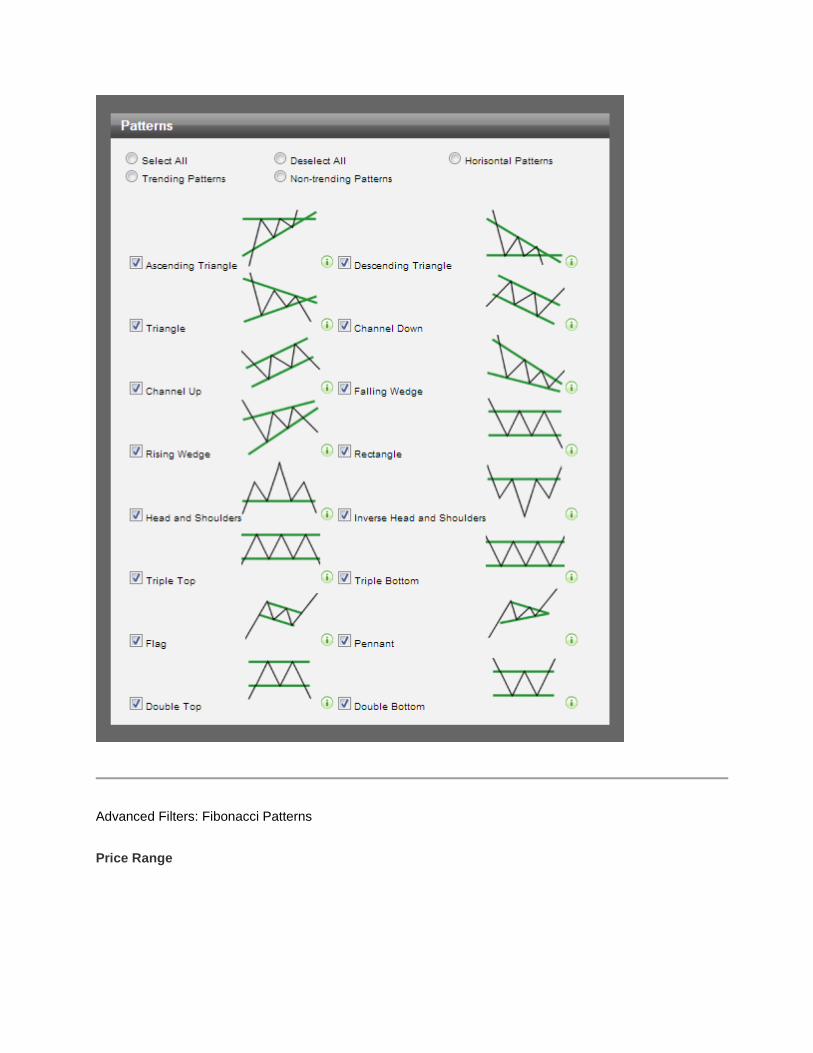
Types of Chart Patterns
Autochartist identifies 16 different Chart Patterns. Any of these can be filtered out in the Advanced Filter
section of a search. For descriptions of each of these patterns, click on the icon next to the pattern.
Advanced Filters: Fibonacci Patterns
Price Range
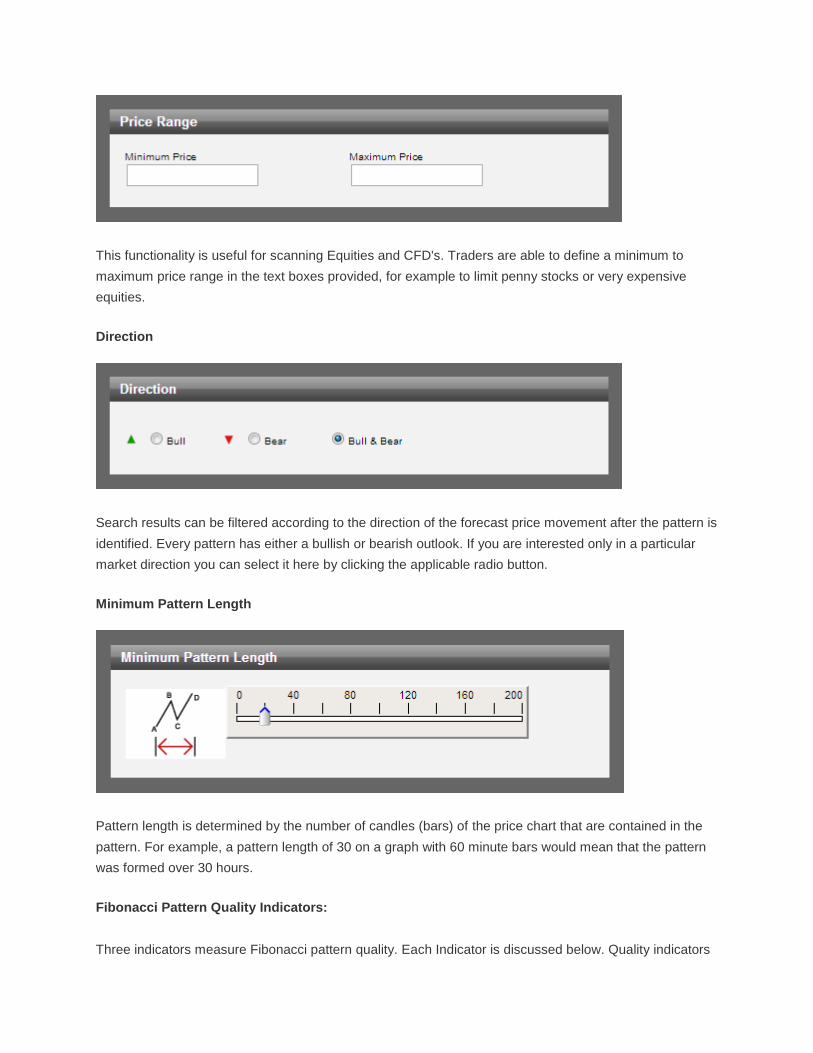
This functionality is useful for scanning Equities and CFD's. Traders are able to define a minimum to
maximum price range in the text boxes provided, for example to limit penny stocks or very expensive
equities.
Direction
Search results can be filtered according to the direction of the forecast price movement after the pattern is
identified. Every pattern has either a bullish or bearish outlook. If you are interested only in a particular
market direction you can select it here by clicking the applicable radio button.
Minimum Pattern Length
Pattern length is determined by the number of candles (bars) of the price chart that are contained in the
pattern. For example, a pattern length of 30 on a graph with 60 minute bars would mean that the pattern
was formed over 30 hours.
Fibonacci Pattern Quality Indicators:
Three indicators measure Fibonacci pattern quality. Each Indicator is discussed below. Quality indicators
reflect the visual appeal of the pattern. A high quality pattern will appear more attractive, well-proportioned
and symmetrical. The overall quality measure is the arithmetic average of all other indicators.
Quality is expressed as a number ranging from 0 to 10, where 10 is the best quality and 0 is the poorest.
Use the sliders to set the required levels of pattern quality for a search (see image below).
Clarity
Indicates the level of "noise" in the price graph. If there are many spikey movements in the price
movements the clarity will be low.
Time Symmetry
The degree to which time differences between turning points follow the same Fibonacci ratios found in price
levels.
Price Symmetry
Price Symmetry is the degree to which the identified ratios match the theoretical Fibonacci ratios, within
some margin of error. Therefore, the smaller the margin of error, the higher the Price Symmetry.
Fibonacci Pattern Types
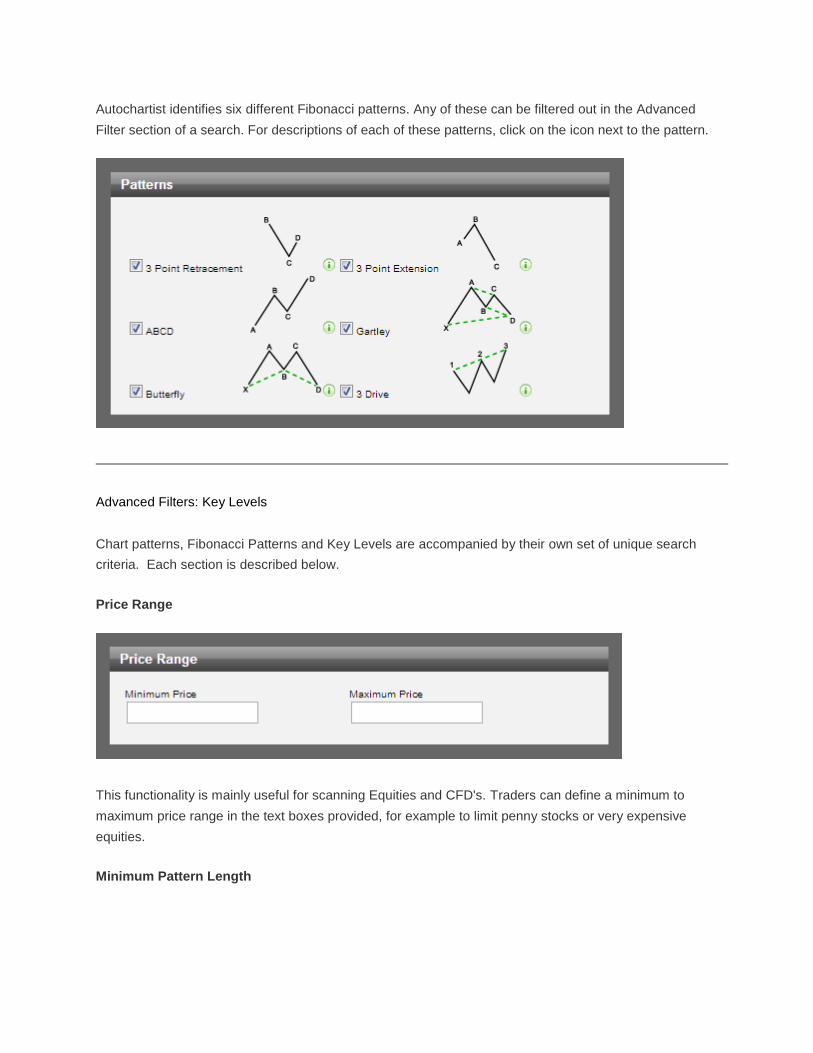
Autochartist identifies six different Fibonacci patterns. Any of these can be filtered out in the Advanced
Filter section of a search. For descriptions of each of these patterns, click on the icon next to the pattern.
Advanced Filters: Key Levels
Chart patterns, Fibonacci Patterns and Key Levels are accompanied by their own set of unique search
criteria. Each section is described below.
Price Range
This functionality is mainly useful for scanning Equities and CFD's. Traders can define a minimum to
maximum price range in the text boxes provided, for example to limit penny stocks or very expensive
equities.
Minimum Pattern Length
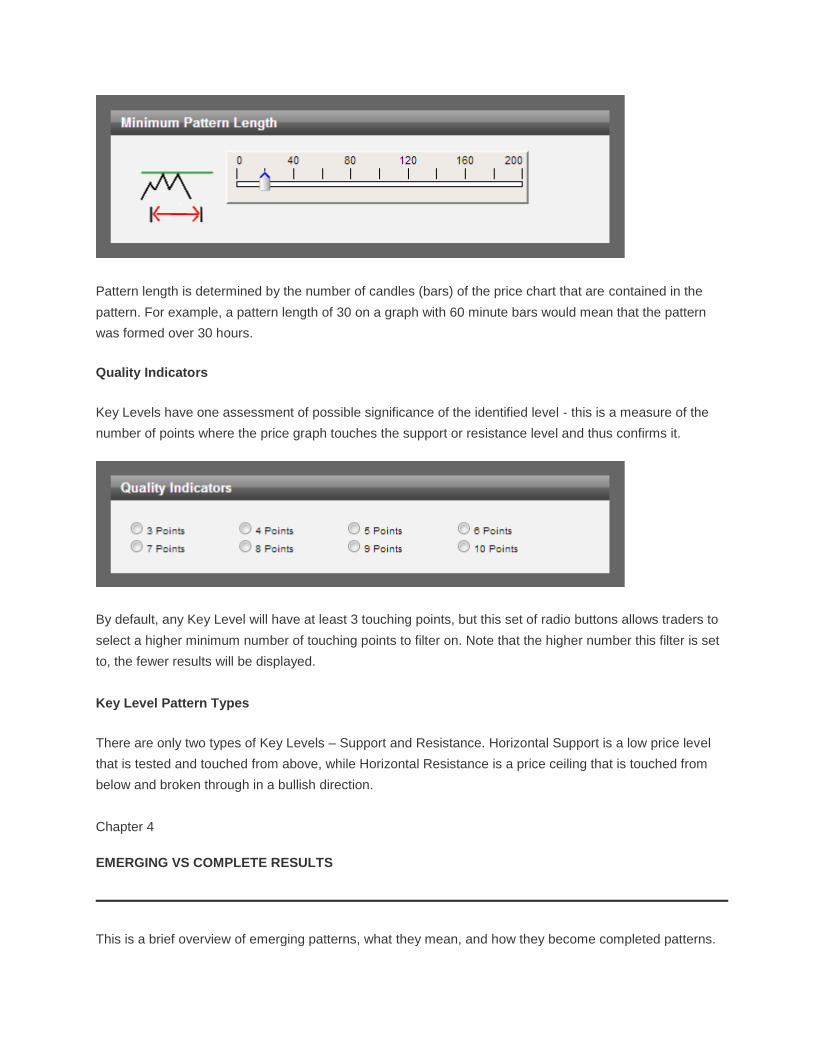
Pattern length is determined by the number of candles (bars) of the price chart that are contained in the
pattern. For example, a pattern length of 30 on a graph with 60 minute bars would mean that the pattern
was formed over 30 hours.
Quality Indicators
Key Levels have one assessment of possible significance of the identified level - this is a measure of the
number of points where the price graph touches the support or resistance level and thus confirms it.
By default, any Key Level will have at least 3 touching points, but this set of radio buttons allows traders to
select a higher minimum number of touching points to filter on. Note that the higher number this filter is set
to, the fewer results will be displayed.
Key Level Pattern Types
There are only two types of Key Levels – Support and Resistance. Horizontal Support is a low price level
that is tested and touched from above, while Horizontal Resistance is a price ceiling that is touched from
below and broken through in a bullish direction.
Chapter 4
EMERGING VS COMPLETE RESULTS
This is a brief overview of emerging patterns, what they mean, and how they become completed patterns.
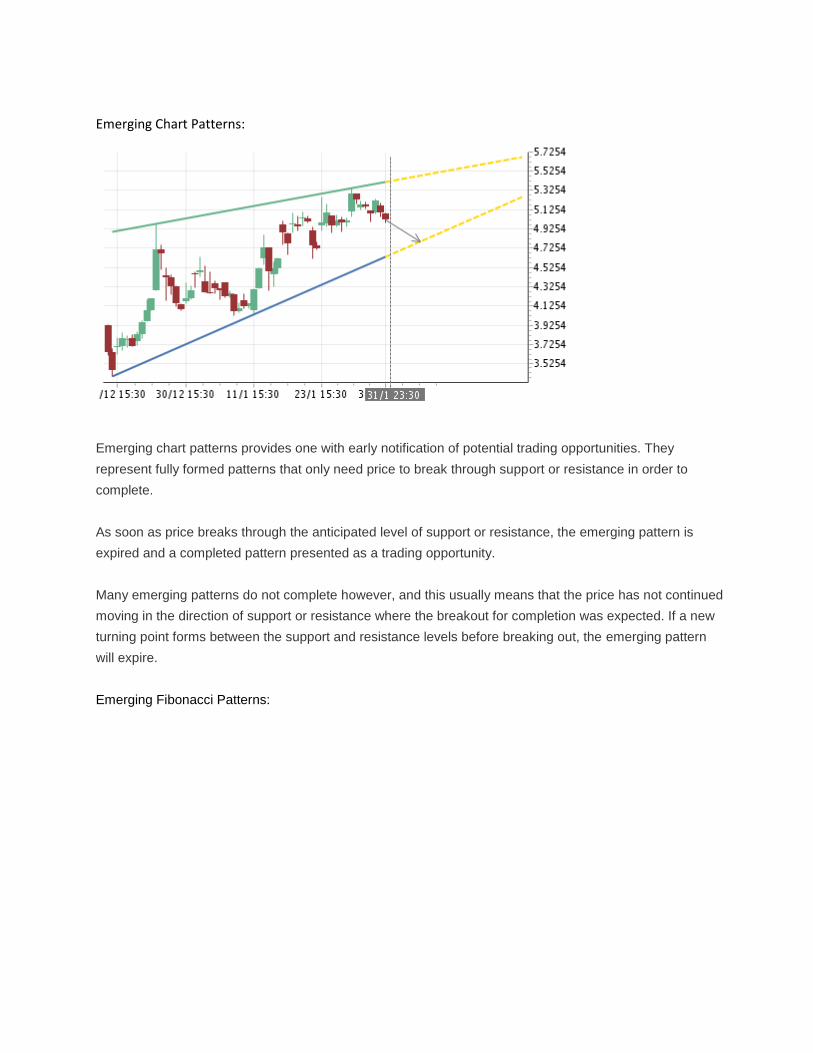
Emerging Chart Patterns:
Emerging chart patterns provides one with early notification of potential trading opportunities. They
represent fully formed patterns that only need price to break through support or resistance in order to
complete.
As soon as price breaks through the anticipated level of support or resistance, the emerging pattern is
expired and a completed pattern presented as a trading opportunity.
Many emerging patterns do not complete however, and this usually means that the price has not continued
moving in the direction of support or resistance where the breakout for completion was expected. If a new
turning point forms between the support and resistance levels before breaking out, the emerging pattern
will expire.
Emerging Fibonacci Patterns:
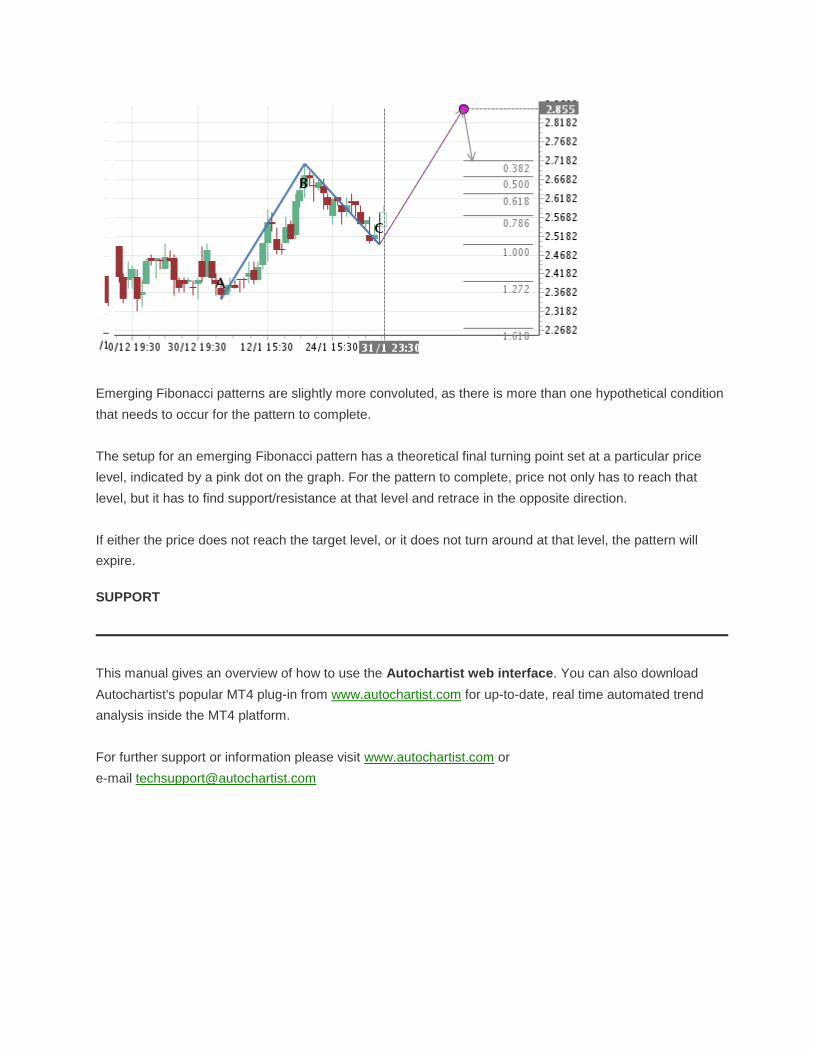
Emerging Fibonacci patterns are slightly more convoluted, as there is more than one hypothetical condition
that needs to occur for the pattern to complete.
The setup for an emerging Fibonacci pattern has a theoretical final turning point set at a particular price
level, indicated by a pink dot on the graph. For the pattern to complete, price not only has to reach that
level, but it has to find support/resistance at that level and retrace in the opposite direction.
If either the price does not reach the target level, or it does not turn around at that level, the pattern will
expire.
SUPPORT
This manual gives an overview of how to use the Autochartist web interface. You can also download
Autochartist's popular MT4 plug-in from www.autochartist.com for up-to-date, real time automated trend
analysis inside the MT4 platform.
For further support or information please visit www.autochartist.com or
e-mail [email protected]