introduction - crown point community school … · introduction • description of ... a sustained...
TRANSCRIPT

1
Introduction • Description of the school community and the educational programs and location of
curriculum (page 2). • Titles and descriptions of assessment instruments used (page 6).
2
DESCRIPTION OF THE SCHOOL, COMMUNITY, EDUCATIONAL PROGRAMS
AND LOCATION OF THE CURRICULUM Crown Point is a city located in Lake County, Indiana and is known as the Hub of Lake
County. It is part of the Gary/Chicago Metropolitan Statistical area and enjoys all the benefits of a major metropolitan area without most big city problems. As of the 2000 census, the city had a total population of 19,806. The city is the county seat of Lake County and was incorporated in 1868. The stately Court House, which dominates the center of town, is known as the ‘Grand Old Lady’ and was added to the National Register of Historic Places in 1973. There are a variety of employment opportunities available: small business, commercial business, manufacturing, and industrial. Vocational training facilities, colleges, and universities support the area. Crown Point has ten schools that serve the needs of K-12 students who live in the City of Crown Point, the Town of Cedar Lake, Winfield, and the Community of Lakes of the Four Seasons. The student population is 7,004. Taft has made academic yearly progress each year from 2002 to 2006, except for 2005, and achieved commendable status for the 2006-07 school year. For many years, one middle school, Robert A. Taft Middle School, serviced the entire community. However, in August 2007, Colonel John Wheeler opened and services approximately one half of the district’s sixth, seventh and eighth grade students. Crown Point High School graduates 93% of its students with 81% pursuing a college education. Taft Middle School has an enrollment of 854 students in grades six, seven, and eight. Taft has approximately 45 teachers making for class sizes of approximately 30. The student population is serviced by two counselors who have case loads of approximately 450 students each. Special Education students are serviced in the areas of Learning Disabilities, Emotionally Handicapped, Mildly Mentally Handicapped, and Speech. LRE services are implemented as indicated on individual student IEPS. Students with English language deficiencies are serviced by an ELL teacher. Taft Middle School adheres to a middle school philosophy by meeting the needs of students through a varied curriculum. Curriculum has been aligned to the Indiana State Academic Standards, and is housed in the offices of the principal and department chairpersons. Departments met with the curriculum director and established areas such as depth of learning, suggested assessments, suggested instructional methods, and resources needed as well as professional development that would be needed. The curriculum consists of core classes in English, math, science and social studies with honors classes provided for the seventh and eighth grade English and math students. The enrichment program for the sixth grade students includes a pull out session for language arts once a week and a daily self-contained enriched math class. Encore subjects that are available to seventh and eighth grade students are Art, Exploring Music, Industrial Technology, Family and Consumer Science, and Health and Physical Education. Sixth grade students are enrolled in Art, Music, Computers, Health and Physical Education. Students may choose as an elective, Band, Choir or Orchestra. The curriculum also includes Skill Enhancement/Advisory and Reading Essentials (sustained silent
3
reading). Skill Enhancement focuses on our school improvement plan in the areas of reading, writing, and critical thinking. Skill Enhancement includes activities such as Skills Tutor for seventh and eighth grade students and also the opportunity for all grade level students to receive extra assistance from core teachers. Advisory is also part of the Skill Enhancement class and provides opportunities for students to participate in activities that focus on Bullying, Careers, Harassment, Anger Management and Developing Friendships. Extra curricular options include sports, National Junior Honor Society, Spell Bowl, Academic Super Bowl, Student Council, CASS, Science Olympiad, Yearbook, Newspaper, Drama Club and a Literary Magazine . Since the writing of the Taft School Improvement Plan in 2002, the focus has been on reading comprehension, writing, and critical thinking/problem solving not only in each subject area but also school wide. A review of Taft Middle School’s Plan is as follows:
To encourage a school-wide commitment to improving reading comprehension, all students were involved in completing activities in the Comprehensive Reading & Writing Assessment book that focused on making predictions, drawing conclusions, and reading for information during team-designated time. The Comprehensive Reading & Writing Assessment book was used one to two days a week throughout the school year. The book is comprised of two testing sessions: A and B. Each session has reading and writing sections. All sessions include multiple choice, short answer, and extended response questions. Reading sessions focus on strategies such as drawing conclusions, determining the main idea/supporting details, identifying genre, and making predictions. Writing sessions included expository, descriptive, and narrative writing. The book has a testing section and a reproduction of each test. In the reproduced sections, students learned why the multiple-choice answers for each question are correct or incorrect and strategies and tips for improving and organizing their short answers and extended responses such as using graphic organizers, outlining and organizing. There was also a listening section in which the teacher read a selection and students took notes and then worked through various activities. The schedule of the book was optional; teachers had the option to work through one portion of a section and then review it in the reproduced section, or teachers could work through the entire session and then do the review. All students worked through the testing sessions individually while teachers assisted students in the reproduced section via discussion and review. This section also included Try It activities where students practiced what they had learned. In addition, each subject area focused on reading a variety of written materials that emphasized skill development in making predictions, drawing conclusions, and using pertinent information. Classroom assessments were completed through individual written responses, project presentations, critiques, self reflections and written responses. Prior to implementing the Accelerated Reader Program school-wide, selected teams at the eighth grade level piloted the program for two years. Both professional training and the actual implementation of the program aided staff considerably in implementing a school-wide program that we feel is helping us to address our student needs.
4
As a result, a sustained silent reading program was established for all teams whereby all students read daily 20-30 minutes from their Accelerated Reader book. Student progress was monitored by students completing a summary of their book as they read and the use of reading logs that were signed by parents and staff members. Students took an Accelerated Reading test upon the completion of each book. Reading levels were assessed at the beginning, middle, and end of the school year through the Star Reader Program. When the writing goal was initially written, the two intervention strategies formulated for the writing goal centered on students demonstrating writing as a process rather than a product, and having students participate in the 6+1 Trait Writing Program. Students, through daily participation in their language arts class, receive instruction in the steps of the writing process: Pre-Writing, Drafting, Revising, Editing, and Publishing. In specifically designed writing activities across departments, students demonstrate these steps in the writing process in the various assigned writing activities. Formalized application of this process is also evidenced two times during the school year when all students respond to grade level writing prompts. Their writing is assessed using a writing rubric from the 6+1 Trait Writing Program. Students have their essays placed in their writing portfolio which was passed on to teachers at the next grade level. In order to guide staff members in understanding the writing process, in-services were dedicated to acquainting teachers with the process and providing them with activities that allowed them to learn and practice what they would be required to do with students in their classrooms. Language arts teachers served as facilitators in this process. As staff moved into the implementation of this writing intervention, it was determined that the rating scale (rubric) used to assess responses to the universal writing prompt was not useful to many departments when assessing the writing activities assigned in their subject areas. As a result, time was spent developing department rubrics for these writing activities. Language arts teachers again assisted the other departments in this endeavor. Once developed, the rubric was reviewed and formalized into a standard form for that department. While working with students on the writing process, a writing manual for teachers was developed by three members of the language arts department. The writing manual, Wild Over Writing, shows in a step-by-step fashion how: ideas from a graphic organizer can became a topic sentence for a five-sentence paragraph; through the addition of details, this five-sentence paragraph can be expanded to an eight-sentence paragraph; this eight-sentence paragraph can be developed into a five-paragraph essay. Templates for each of the paragraphs are presented and can be given to students to use. Staff members have reported this writing manual is very useful to them. A variety of student activities were formulated in each of the curriculum areas that focused on problem solving skills, and critical thinking skills. A variety of assessments have been developed that included written labs, a self critique, check lists, written assessments and evaluations, discussion/written presentation and rating scales.
Although we teach the problem solving process to students, we have come to realize that students have difficulty in identifying the steps and applying them on their own (without teacher direction). Additionally, the quality (depth) of their thinking process is at the surface level. Students are frustrated if they don’t get the “correct” answer the first time. We feel that students can be
5
instructed and assessed in a manner that rewards and encourages independent thinking, acceptance of trial and error and identifying multiple steps in getting to the “answer”.
6
TITLES AND DESCRIPTION S OF ASSESSMENT INSTRUMENTS USED
Indiana Statewide Testing for Educational Progress Assessment: Indiana Statewide Testing for Educational Progress (ISTEP+) ISTEP+ is the Indiana statewide testing program for educational progress. At the individual student level, ISTEP+ results are used to identify students’ strengths and weaknesses in English and mathematics. On building and corporation levels, the reports are used to evaluate local curriculum choices and the instructional strategies that are employed by teachers in classrooms. CTBS/ Terra Nova The CTBS/ Terra Nova is a standardized assessment that offers norm referenced, criterion referenced and performance level data. The CTBS/ Terra Nova is given to all students in the sixth and eighth grade for the purpose of providing information regarding: 1) Student achievement and mastery levels 2) Data for instructional planning and improvement 3) CSI scores that reflect the academic aptitude for students. Star Reader Star Reader is a test administered to students to determine their Zone of Proximal Development, or ZPD, which provides individual reading ranges. Students take the Star Reader three times a year. Assessment is determined by measuring progress/improvement between testing sessions. Individual growth and diagnostic reports provide teachers with feedback that helps determine if a ZPD needs to be adjusted or if there is evidence of improvement. Comprehensive Reading Assessment The Comprehensive Reading Assessment book is used two to five days a week throughout the school year. The book is comprised of two testing sessions; A and B. Each session is comprised of various reading selections. All sessions include multiple choice and short answer questions. Reading sessions focus on strategies such as drawing conclusions, determining the main idea/supporting details, identifying genre, and making predictions. The book has a testing section and reproduction of each test. In the reproduced section, students learn why the multiple-choice answers for each question are correct or incorrect and strategies and tips for improving and organizing their short answers. This section also includes Try It questions where students practice what they have learned. The schedule is as follows: students take the 16 question pre-test, review it in the reproduced section, and then take the 16 question post-test.

7
Statement of Vision, Mission, and Beliefs (page 8).
8
Robert A. Taft Middle School
Vision Statement
Robert A. Taft Middle School is a Four Star school dedicated to providing a strong educational program and a safe learning environment for students. All students have an opportunity to achieve to their maximum potential as they are challenged by a rigorous curriculum provided through sound instructional strategies. Students take ownership and responsibility for their learning and work toward becoming contributing members of society.
Mission Statement
The mission of Taft Middle School is to provide a nurturing environment in which appropriate and productive experiences promote independent thinking, self-discipline academic achievement, and learning as a lifelong process.
Beliefs
o Individual student needs are a priority. o The educational process is a shared responsibility among school personnel, students, parents,
and community. o Curriculum and instruction match the unique developmental characteristics of middle level
students. Students are given the opportunity to develop critical thinking skills. o Students are provided the tools to grow academically, socially, and emotionally, and to
participate in an active, healthy lifestyle. o Students are provided an opportunity to develop a positive attitude toward themselves, their
world, country, and society.

9
Description of Students • Characteristics Ethnicity (page 10). Gender (page 11). Free and reduced lunch (page 12). • Participation in special programs (page 13).
10
29 16 55 11
773
0100200300400500600700800
Number of Students
Multiracial Hispanic White
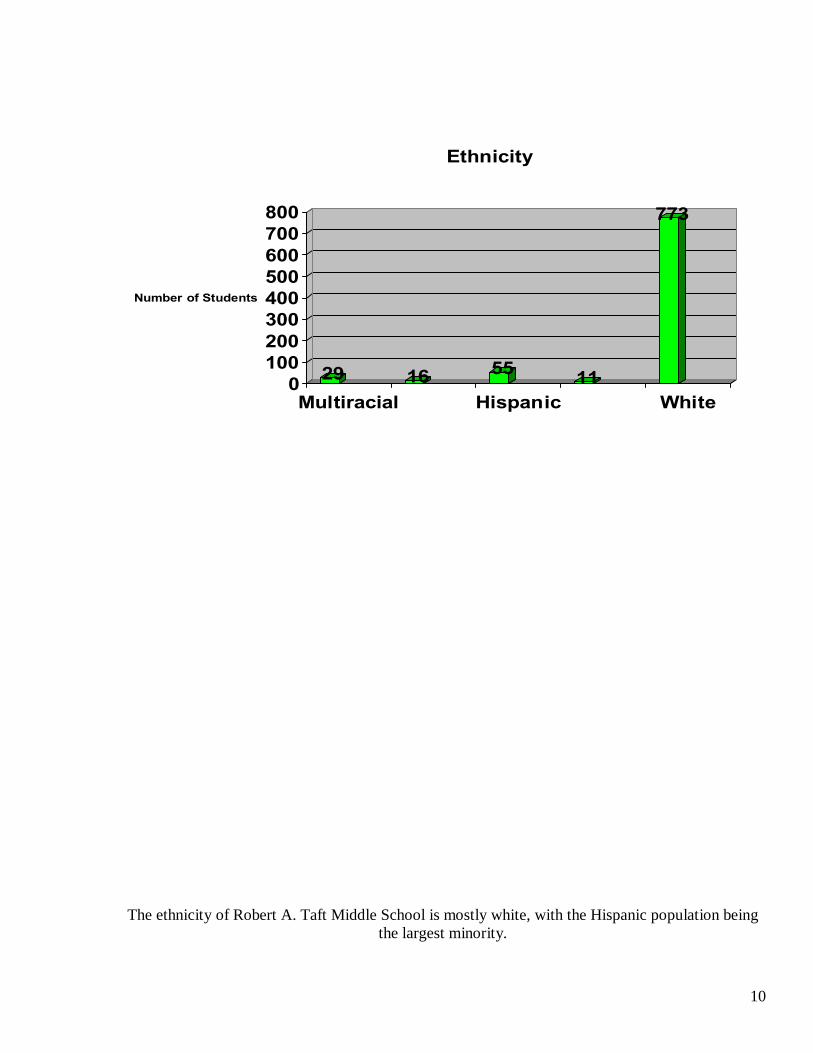
Ethnicity
The ethnicity of Robert A. Taft Middle School is mostly white, with the Hispanic population being
the largest minority.
11
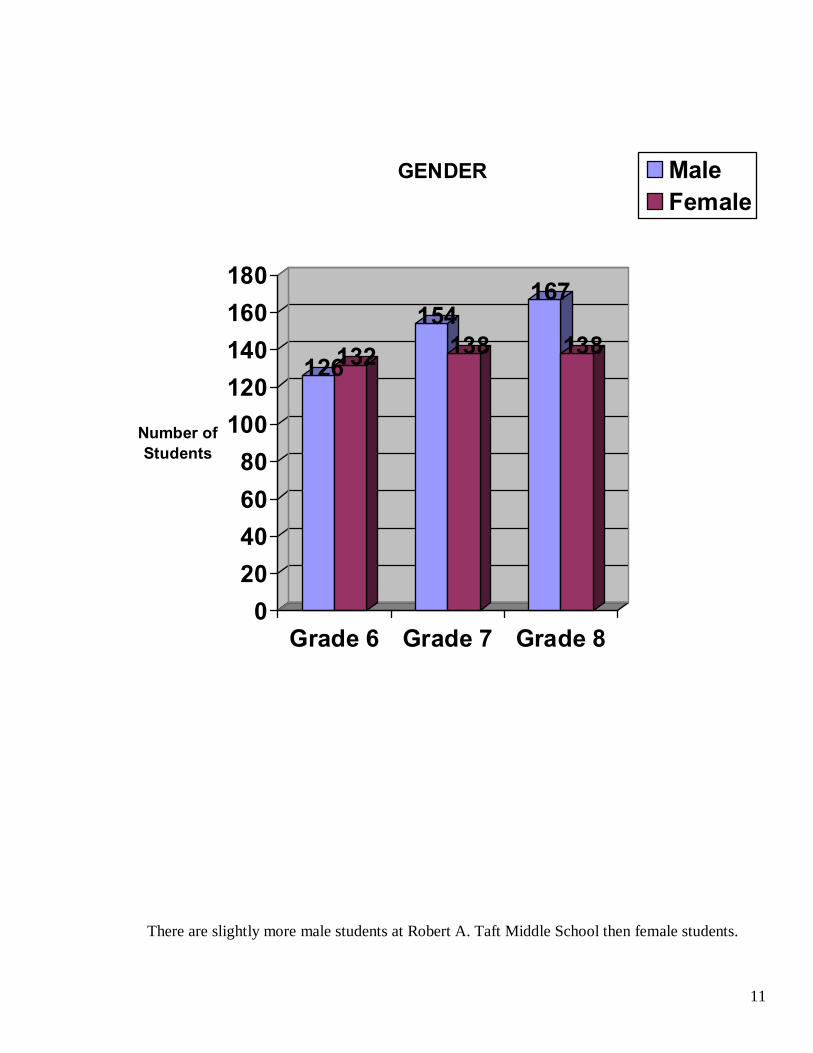
126132154
138
167
138
020406080
100120140160180
Number of Students
Grade 6 Grade 7 Grade 8
GENDER MaleFemale
There are slightly more male students at Robert A. Taft Middle School then female students.
12
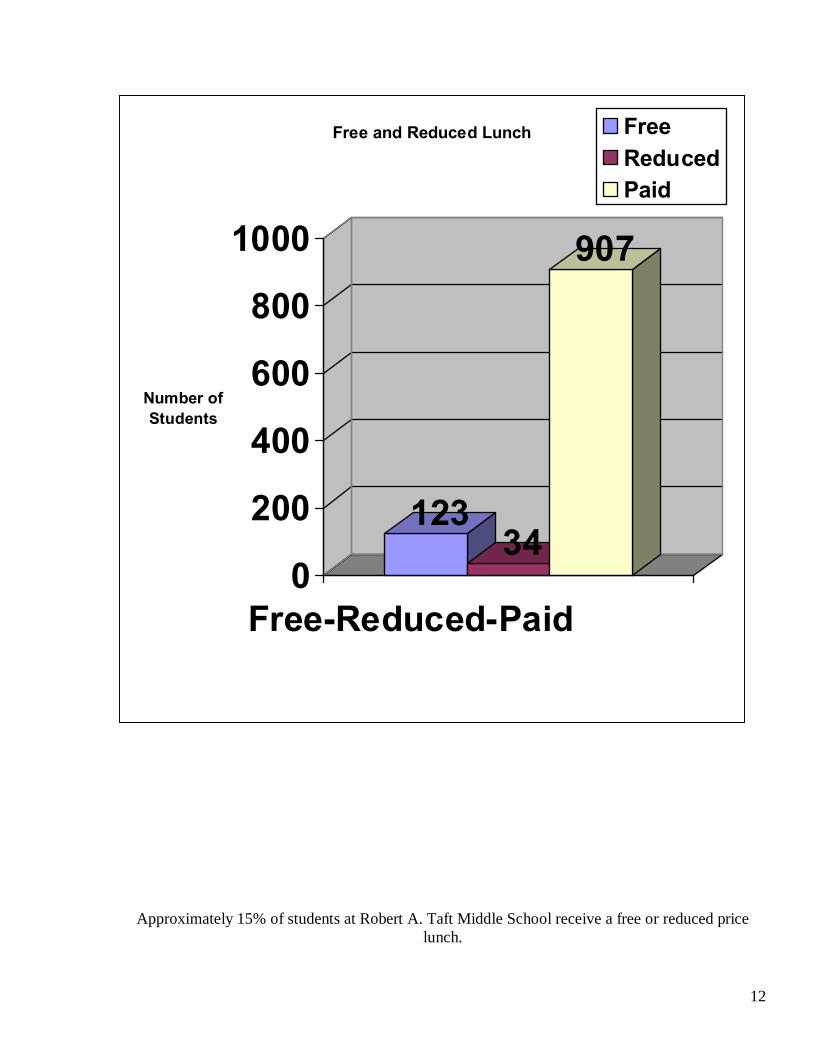
Approximately 15% of students at Robert A. Taft Middle School receive a free or reduced price lunch.
12334
907
0
200
400
600
800
1000
Number of Students
Free-Reduced-Paid
Free and Reduced Lunch FreeReducedPaid
13
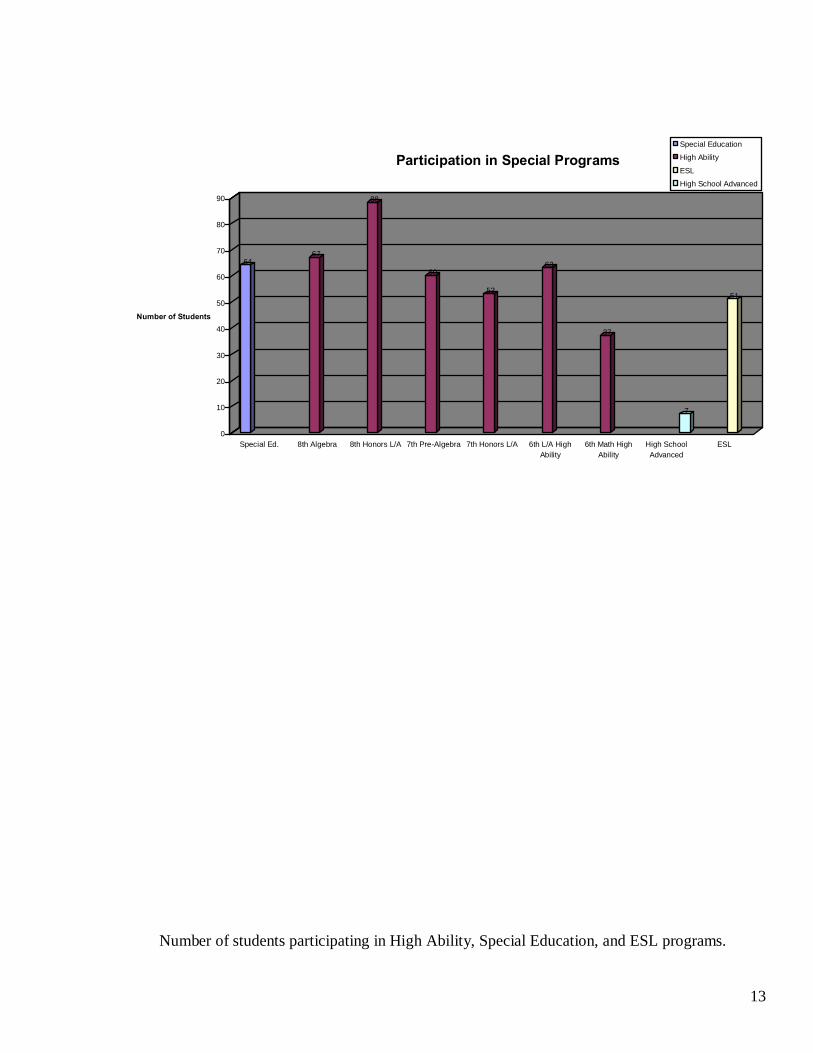
6467
88
60
53
63
37
7
51
0
10
20
30
40
50
60
70
80
90
Number of Students
Special Ed. 8th Algebra 8th Honors L/A 7th Pre-Algebra 7th Honors L/A 6th L/A HighAbility
6th Math HighAbility
High SchoolAdvanced
ESL
Participation in Special ProgramsSpecial Education
High Ability
ESL
High School Advanced
Number of students participating in High Ability, Special Education, and ESL programs.
14
Student Performance Data • Absenteeism (page 15). • Assignments and retentions (page 16). • Grading reports (page17). • Yearly Performance-Students scoring below standard (page 19). • Student performance data compared to comparable schools in the league of school
corporations (page 21). • Student performance data achievement scores: ISTEP+ scores (page 27). ISTEP+ Applied Skills scores (2007) (page 57). ISTEP+/PASS+ scores (2004-2007) (page 66). CTBS-Terra Nova scores (2003-2006) (page 69). Local Assessment-Reading and Writing scores (Spring 2004-2007) (page 74).
Key
For all graphs: • “Comparison group”- the first group of students with the same data categories
as the students in “Your group” • “Your group” – the most recent group of students with the same data
categories as the students in the “Comparison group”
15
ABSENTEEISM As reported in the 2001-2002 NCA School Profile, the attendance rate at Taft had averaged 95% for the previous four years. The 95% average attendance rate has been maintained through the 2006-2007 school year. Many strategies are implemented to encourage attendance at Taft, such as phone calls home to parents when students are not in attendance, parent notification by mail explaining the attendance policy, and recognition of students who exhibit good attendance.
16
ASSIGNMENTS AND RETENTIONS In the 2005-2006 school year, the following number of students were recommended for assignment and retention at Taft Middle School. Assigned to the 8th grade – 56 students Assigned to the 9th grade – 33 students Retained in the 7th grade – 8 students Retained in the 8th grade – 7 students In the 2006-2007 school year, the following number of students were recommended for assignment and retention. Assigned to 8th grade – 37 students Assigned to 9th grade – 63 students Retained in the 7th grade – 12 students Retained in the 8th grade – 3 students
17
GRADING REPORTS
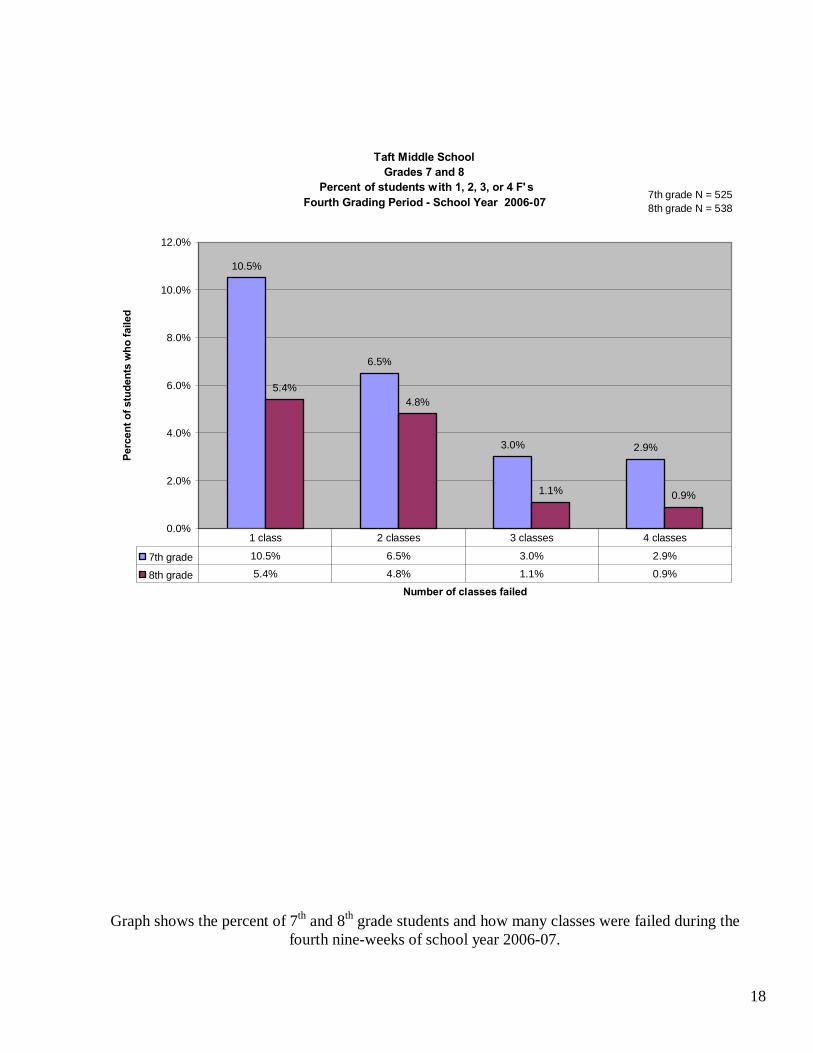
The grades for the fourth grading period of the 2006-2007 school year indicated nearly one fourth of Taft’s seventh graders received F’s in 1, 2, 3, or 4 classes. Approximately one tenth of Taft’s eighth grade students failed 1, 2, 3, or 4 classes. Of those who failed the fourth grading period, approximately three times as many seventh grade students than eighth grade students failed four classes. The primary reasons given for student failures are: required work not complete, incomplete homework, and no effort. (page 18).
18
Taft Middle SchoolGrades 7 and 8
Percent of students with 1, 2, 3, or 4 F' sFourth Grading Period - School Year 2006-07
10.5%
6.5%
3.0% 2.9%
5.4%4.8%
1.1% 0.9%
0.0%
2.0%
4.0%
6.0%
8.0%
10.0%
12.0%
Number of classes failed
Perc
ent o
f stu
dent
s w
ho fa
iled
7th grade 10.5% 6.5% 3.0% 2.9%
8th grade 5.4% 4.8% 1.1% 0.9%
1 class 2 classes 3 classes 4 classes
7th grade N = 5258th grade N = 538
Graph shows the percent of 7th and 8th grade students and how many classes were failed during the fourth nine-weeks of school year 2006-07.
19
YEARLY PERFORMANCE-STUDENTS SCORING BELOW STANDARD
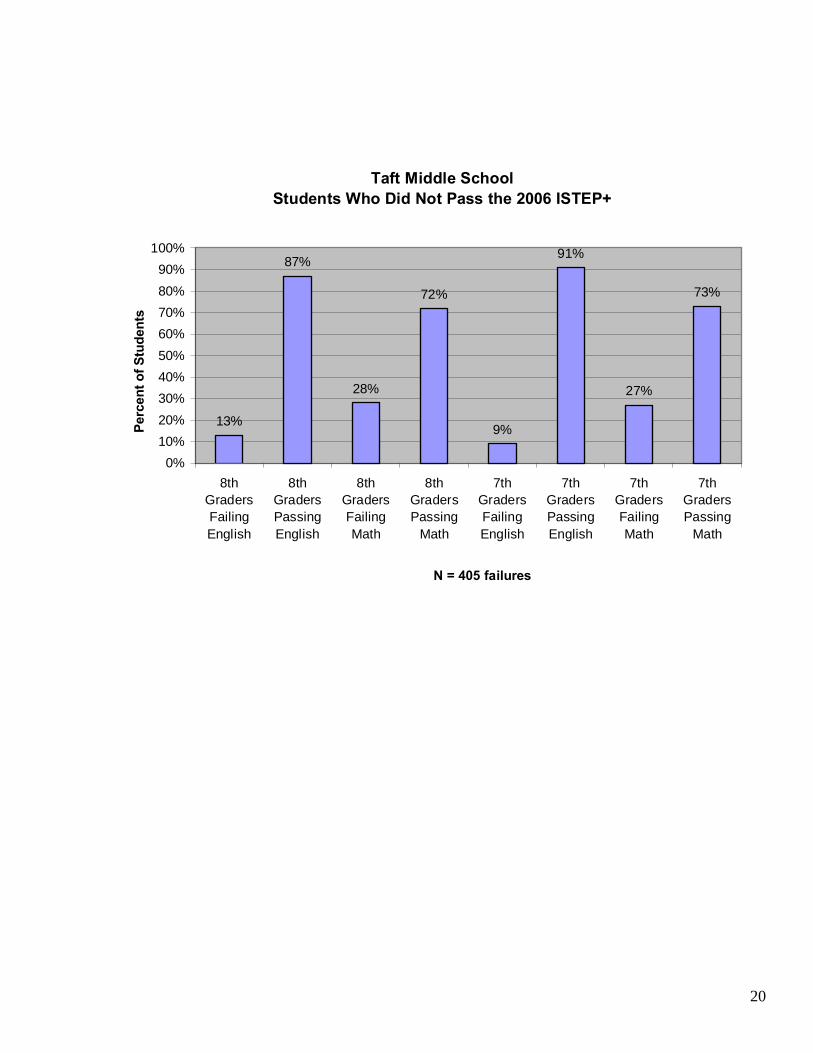
Of the eighth students who did not pass math on the 2006 ISTEP+, 28% failed math for the
year. Of those who did not pass English, 13% failed English for the year.
Of the seventh grade students who did not pass math on the 2006 ISTEP+, 27% failed math for the year. Of those who did not pass English, 9% failed English for the year.
Failure for the year constitutes three or more F’s in one subject area (page 20).
20
Taft Middle SchoolStudents Who Did Not Pass the 2006 ISTEP+
13%
87%
28%
72%
9%
91%
27%
73%
0%10%20%30%40%50%60%70%80%90%
100%
8thGradersFailingEnglish
8thGradersPassingEnglish
8thGradersFailingMath
8thGradersPassing
Math
7thGradersFailingEnglish
7thGradersPassingEnglish
7thGradersFailingMath
7thGradersPassing
Math
N = 405 failures
Perc
ent o
f Stu
dent
s
21
English/Language Arts PASS+ and PASSLeague Schools Grade 7
Fall 2005, 2006, 2007
78%69%66%
70%69%71%63%64%62%
66%65%64% 66%65%68%76%75%
71% 69%64%
68% 69%69%63% 66%
70%73%
9%7%
10%
15%10%12%
19%
9%16%
16%17%16%
8%12%15%
13%22%14%16%18%
24%13%
13%13%
7%
11%7%
0%
10%
20%
30%
40%
50%
60%
70%
80%
90%
100%
2005
2006
2007
2005
2006
2007
2005
2006
2007
2005
2006
2007
2005
2006
2007
2005
2006
2007
2005
2006
2007
2005
2006
2007
2005
2006
2007
Taft Avon BrownsburgWest
Chesterton Noblesville Carroll Schmucker BenFranklin
Westfield
League Schools
Perc
ent
PASS+PASS
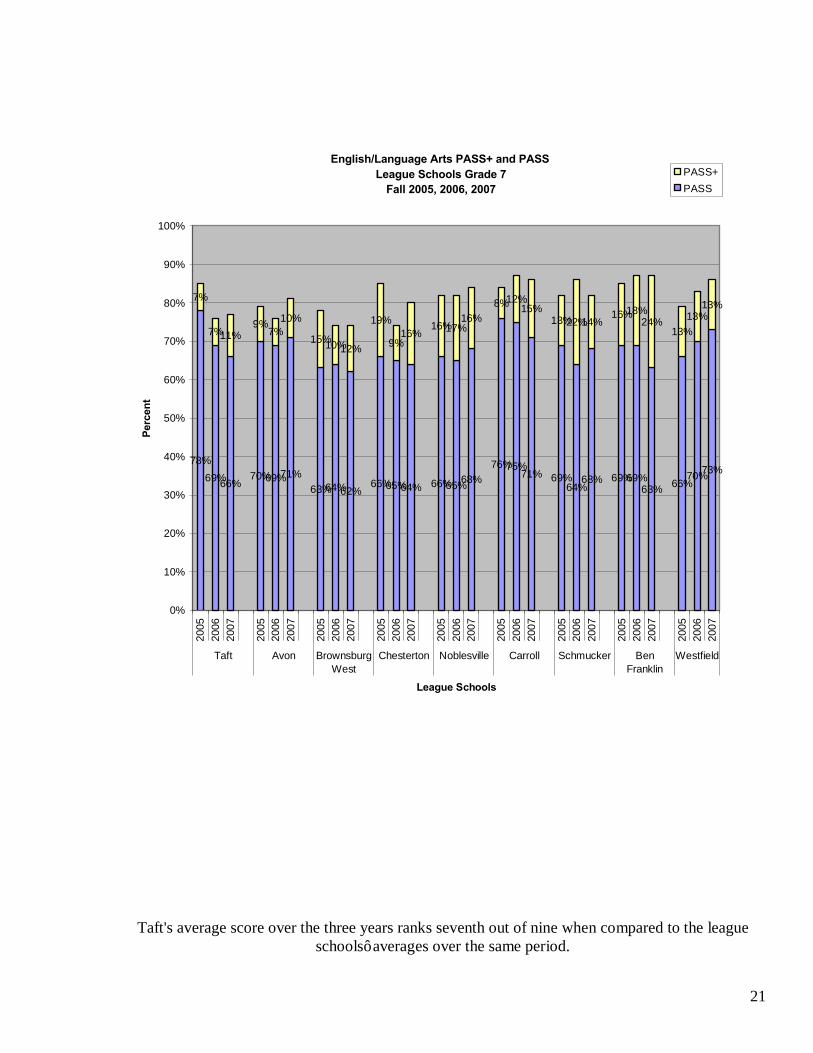
Taft's average score over the three years ranks seventh out of nine when compared to the league schools’ averages over the same period.
22
Mathematics PASS+ and PassLeague Schools Grade 7
Fall 2005, 2006, 2007
70%65%
60%65%
60%65%
54%
66%62% 60%59%59% 57%59%62%70%
61%65%
58%52%
59%63%62%
58% 60%55%59%
19%20%26%
24%
24%20%
34%
21%23% 30%29%30%
27%28%24%
22%
30%28%
30%40%31% 23%27%
29% 23%34%31%
0%
10%
20%
30%
40%
50%
60%
70%
80%
90%
100%
2005
2006
2007
2005
2006
2007
2005
2006
2007
2005
2006
2007
2005
2006
2007
2005
2006
2007
2005
2006
2007
2005
2006
2007
2005
2006
2007
Taft Avon BrownsburgWest
Chesterton Noblesville Carroll Schmucker BenFranklin
Westfield
League Schools
Perc
ent
PASS+PASS
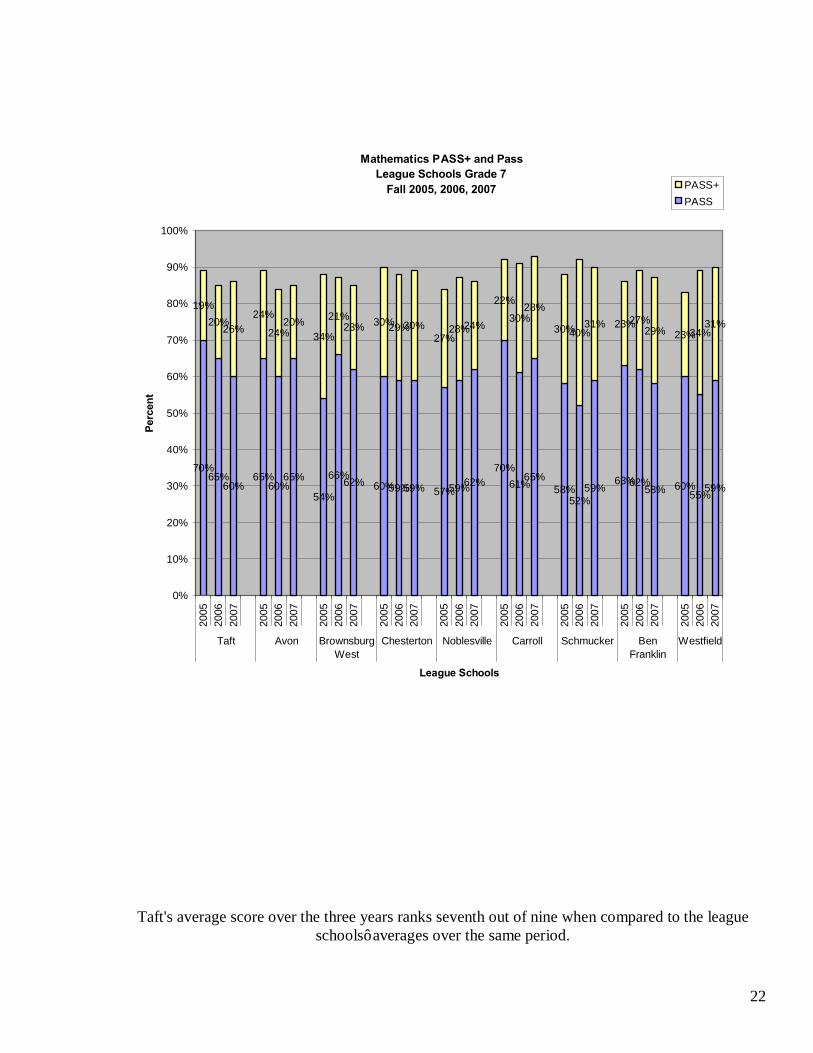
Taft's average score over the three years ranks seventh out of nine when compared to the league schools’ averages over the same period.
23
English/Language Arts PASS+ and PASSLeague Schools Grade 8
Fall 2005, 2006, 2007
73%71%70%66%66%
71% 68%67%65% 65%71%
59%63%
68%70% 70%76%
59%
71%70%67%72%72%75% 75%73%75%
8%7%6% 15%
10%8% 15%
13%12% 15%
13%
20%18%10%9%
13%10%
32%13%16%
16% 9%12%13%
7%11%10%
0%
10%
20%
30%
40%
50%
60%
70%
80%
90%
100%
2005
2006
2007
2005
2006
2007
2005
2006
2007
2005
2006
2007
2005
2006
2007
2005
2006
2007
2005
2006
2007
2005
2006
2007
2005
2006
2007
Taft Avon BrownsburgWest
Chesterton Noblesville Carroll Schmucker BenFranklin
Westfield
League Schools
Perc
ent
Pass+PASS
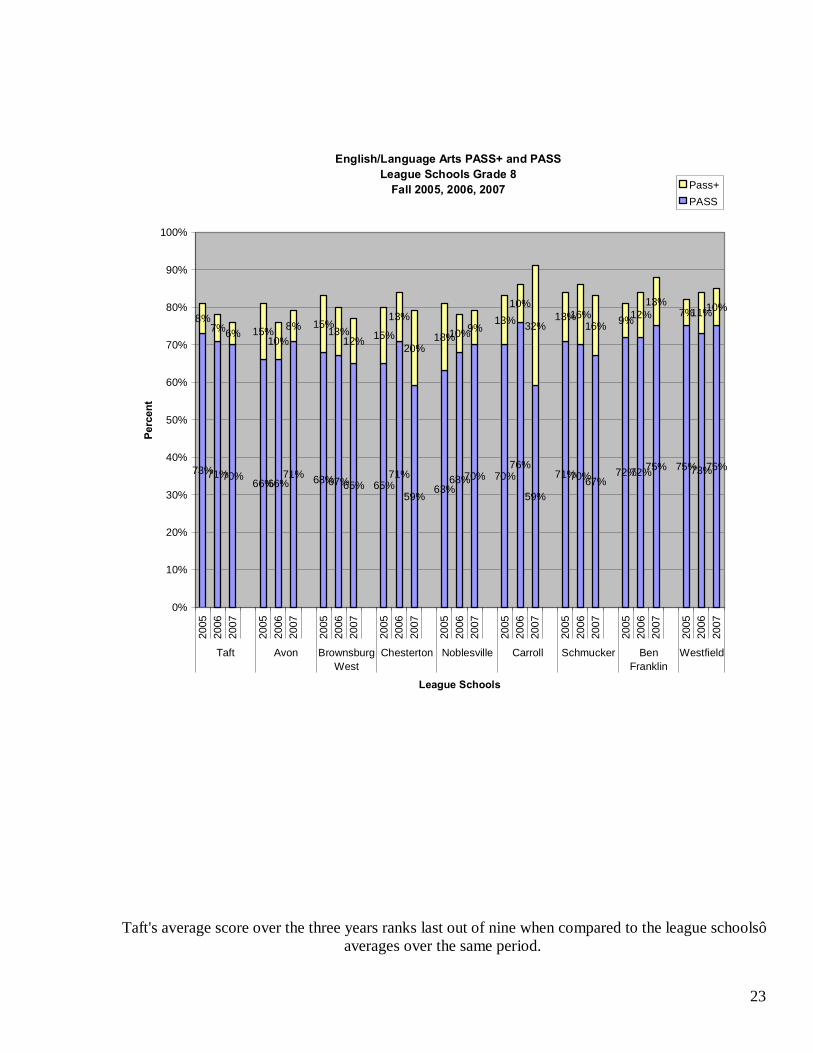
Taft's average score over the three years ranks last out of nine when compared to the league schools’ averages over the same period.
24
Mathematics PASS+ and PASSLeague Schools Grade 8
Fall 2005, 2006, 2007
60%63%65%58%56%56%
60%59%61% 63%64%59%
48%52%53%
62%63%59% 56%59%
50% 52%57%
52%
63%57%
52%
23%21%
21%28%
28%28%25%24%17%
22%22%
20% 39%34%34%
26%26%32%31%28%
30% 28%
28%38%22%
30%38%
0%
10%
20%
30%
40%
50%
60%
70%
80%
90%
100%
2005
2006
2007
2005
2006
2007
2005
2006
2007
2005
2006
2007
2005
2006
2007
2005
2006
2007
2005
2006
2007
2005
2006
2007
2005
2006
2007
Taft Avon BrownsburgWest
Chesterton Noblesville Carroll Schmucker BenFranklin
Westfield
League Schools
Perc
ent
PASS+PASS
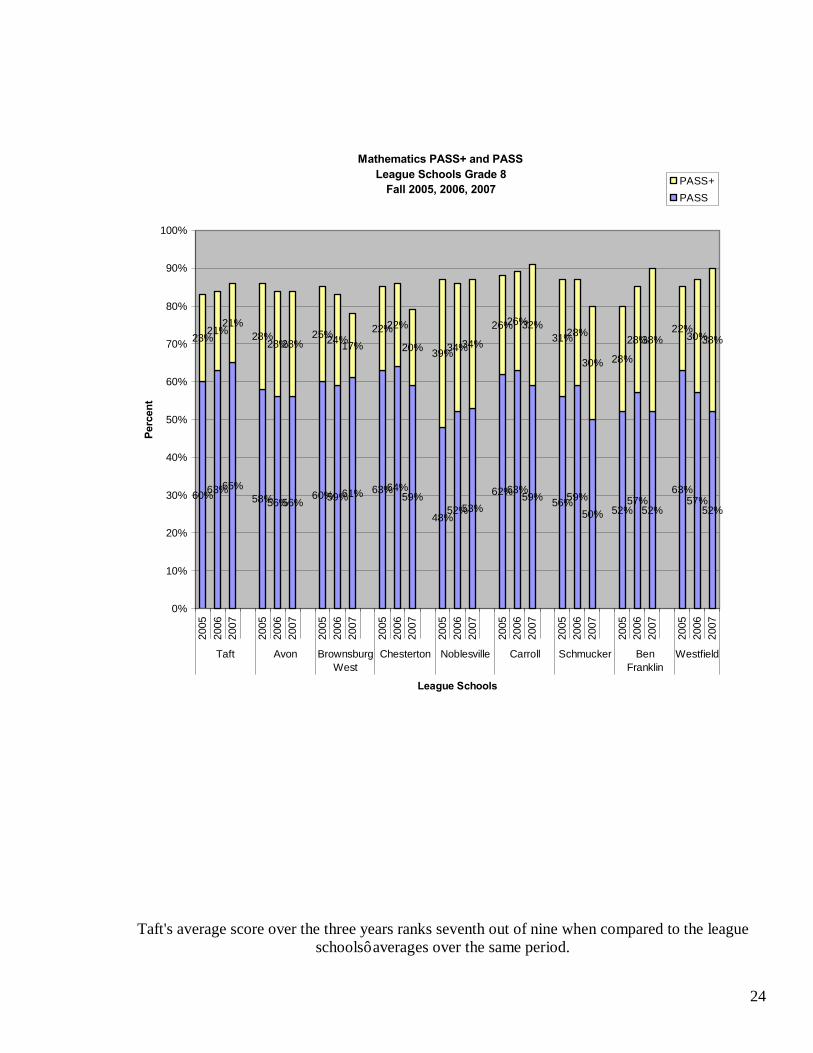
Taft's average score over the three years ranks seventh out of nine when compared to the league schools’ averages over the same period.

25
English/Language Arts PASS+ and PASSLeague Schools Grade 9
Fall 2005, 2006, 2007
76%76%73% 72%71%69%74%72%71% 71%
65%71% 70%71%71% 73%76%77% 75%74%73% 74%
69%71%79%
71%69%
6%7%9% 10%10%
8%
8%6%10% 6%
11%
11%9%
13%8%
8%
12%11% 12%10%13% 8%16%10%
9%
9%11%
0%
10%
20%
30%
40%
50%
60%
70%
80%
90%
100%
2005
2006
2007
2005
2006
2007
2005
2006
2007
2005
2006
2007
2005
2006
2007
2005
2006
2007
2005
2006
2007
2005
2006
2007
2005
2006
2007
Crown Point Avon Brownsburg Chesterton Noblesville NW Allen Penn-Harris-
Valparaiso Westfield
League Schools
Perc
ent
PASS+PASS
Taft's average score over the three years ranks fifth out of nine when compared to the league
schools’ averages over the same period.
26
Mathematics PASS+ and PASSLeague Schools Grade 9
Fall 2005, 2006, 2007
69%61%64% 62%
57%58% 56%58%55%60%
54%
65%
53%48%
56%62%64%
68%
48%53%55% 58%
50%
60% 64%60%57%
16%
19%18% 22%
22%23% 29%27%32%17%
17%
16% 39%42%
33%25%
26%25%
39%31%33% 28%
34%
25%22%
20%26%
0%
10%
20%
30%
40%
50%
60%
70%
80%
90%
100%
2005
2006
2007
2005
2006
2007
2005
2006
2007
2005
2006
2007
2005
2006
2007
2005
2006
2007
2005
2006
2007
2005
2006
2007
2005
2006
2007
Crown Point Avon Brownsburg Chesterton Noblesville NW Allen Penn-Harris-
Valparaiso Westfield
League Schools
Perc
ent
PASS+PASS
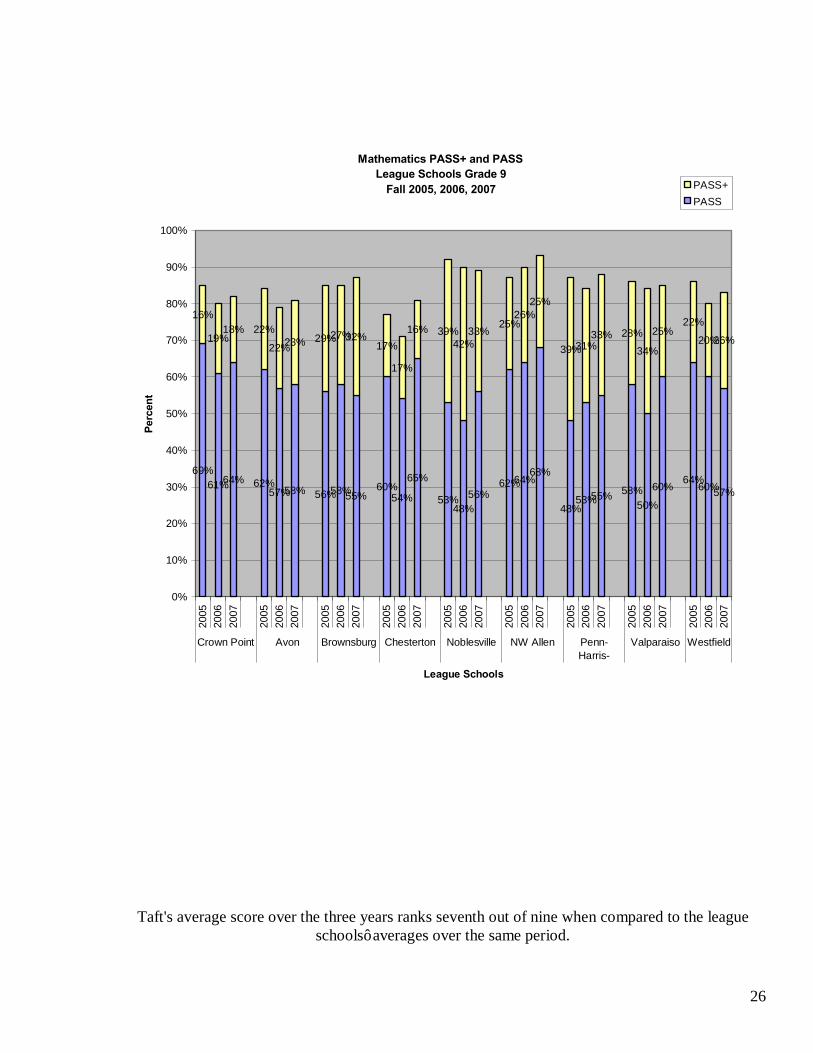
Taft's average score over the three years ranks seventh out of nine when compared to the league schools’ averages over the same period.
27
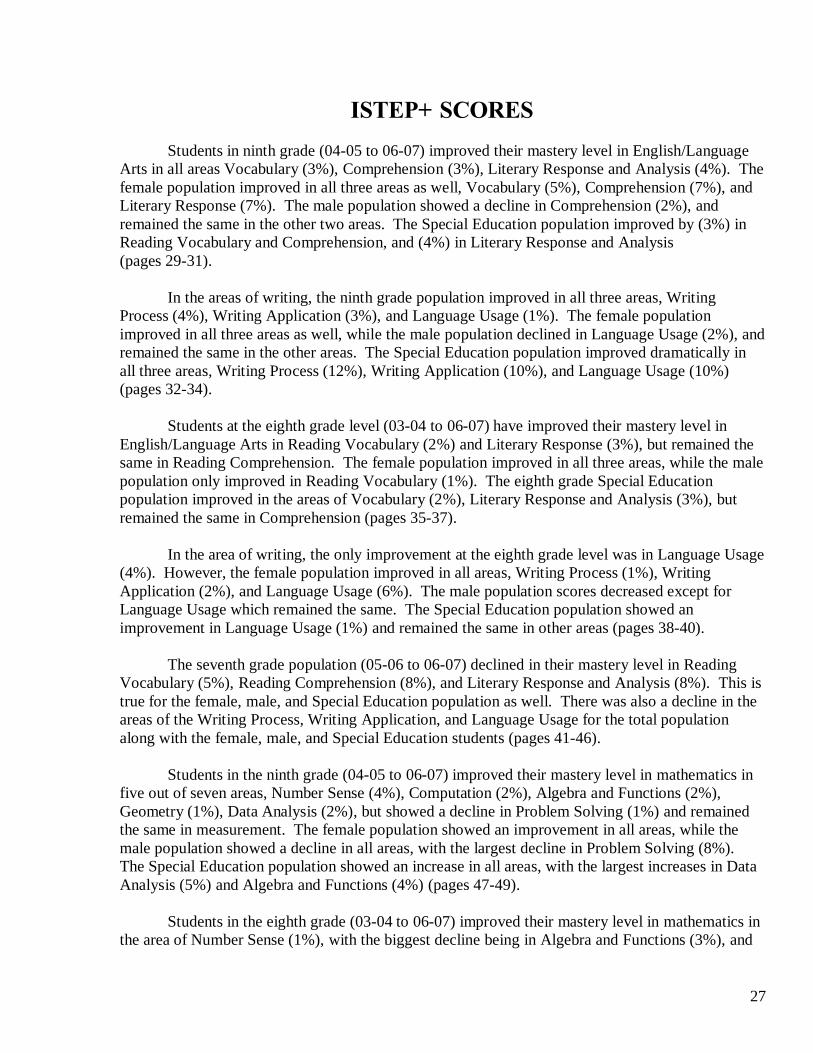
ISTEP+ SCORES Students in ninth grade (04-05 to 06-07) improved their mastery level in English/Language Arts in all areas Vocabulary (3%), Comprehension (3%), Literary Response and Analysis (4%). The female population improved in all three areas as well, Vocabulary (5%), Comprehension (7%), and Literary Response (7%). The male population showed a decline in Comprehension (2%), and remained the same in the other two areas. The Special Education population improved by (3%) in Reading Vocabulary and Comprehension, and (4%) in Literary Response and Analysis (pages 29-31). In the areas of writing, the ninth grade population improved in all three areas, Writing Process (4%), Writing Application (3%), and Language Usage (1%). The female population improved in all three areas as well, while the male population declined in Language Usage (2%), and remained the same in the other areas. The Special Education population improved dramatically in all three areas, Writing Process (12%), Writing Application (10%), and Language Usage (10%) (pages 32-34). Students at the eighth grade level (03-04 to 06-07) have improved their mastery level in English/Language Arts in Reading Vocabulary (2%) and Literary Response (3%), but remained the same in Reading Comprehension. The female population improved in all three areas, while the male population only improved in Reading Vocabulary (1%). The eighth grade Special Education population improved in the areas of Vocabulary (2%), Literary Response and Analysis (3%), but remained the same in Comprehension (pages 35-37). In the area of writing, the only improvement at the eighth grade level was in Language Usage (4%). However, the female population improved in all areas, Writing Process (1%), Writing Application (2%), and Language Usage (6%). The male population scores decreased except for Language Usage which remained the same. The Special Education population showed an improvement in Language Usage (1%) and remained the same in other areas (pages 38-40). The seventh grade population (05-06 to 06-07) declined in their mastery level in Reading Vocabulary (5%), Reading Comprehension (8%), and Literary Response and Analysis (8%). This is true for the female, male, and Special Education population as well. There was also a decline in the areas of the Writing Process, Writing Application, and Language Usage for the total population along with the female, male, and Special Education students (pages 41-46). Students in the ninth grade (04-05 to 06-07) improved their mastery level in mathematics in five out of seven areas, Number Sense (4%), Computation (2%), Algebra and Functions (2%), Geometry (1%), Data Analysis (2%), but showed a decline in Problem Solving (1%) and remained the same in measurement. The female population showed an improvement in all areas, while the male population showed a decline in all areas, with the largest decline in Problem Solving (8%). The Special Education population showed an increase in all areas, with the largest increases in Data Analysis (5%) and Algebra and Functions (4%) (pages 47-49). Students in the eighth grade (03-04 to 06-07) improved their mastery level in mathematics in the area of Number Sense (1%), with the biggest decline being in Algebra and Functions (3%), and
28
Problem Solving (3%). The female population improved in four areas but also declined in Algebra and Functions (1%), and Problem Solving (3%). The male population declined in all areas with the largest decline in Geometry (3%), Algebra and Functions (5%) and Problem Solving (3%). The Special Education population showed a decrease in all areas, with the largest declines in Algebra and Functions (12%), Number Sense (9%) and Problem Solving (8%) (pages 50-52). Students in the seventh grade (05-06 to 06-07) did not improve their mastery level in any of the seven math areas. The greatest declines were in Data Analysis (6%), and Computation (5%). These declines were also present in the female, male, and Special Education population as well (pages 53-55). The Science portion of the ISTEP+ was administered only to seventh grade students (05-06 to 06-07). The mastery level for these students remained the same in all categories, but declined in Scientific Thinking (2%) (page 56).
29
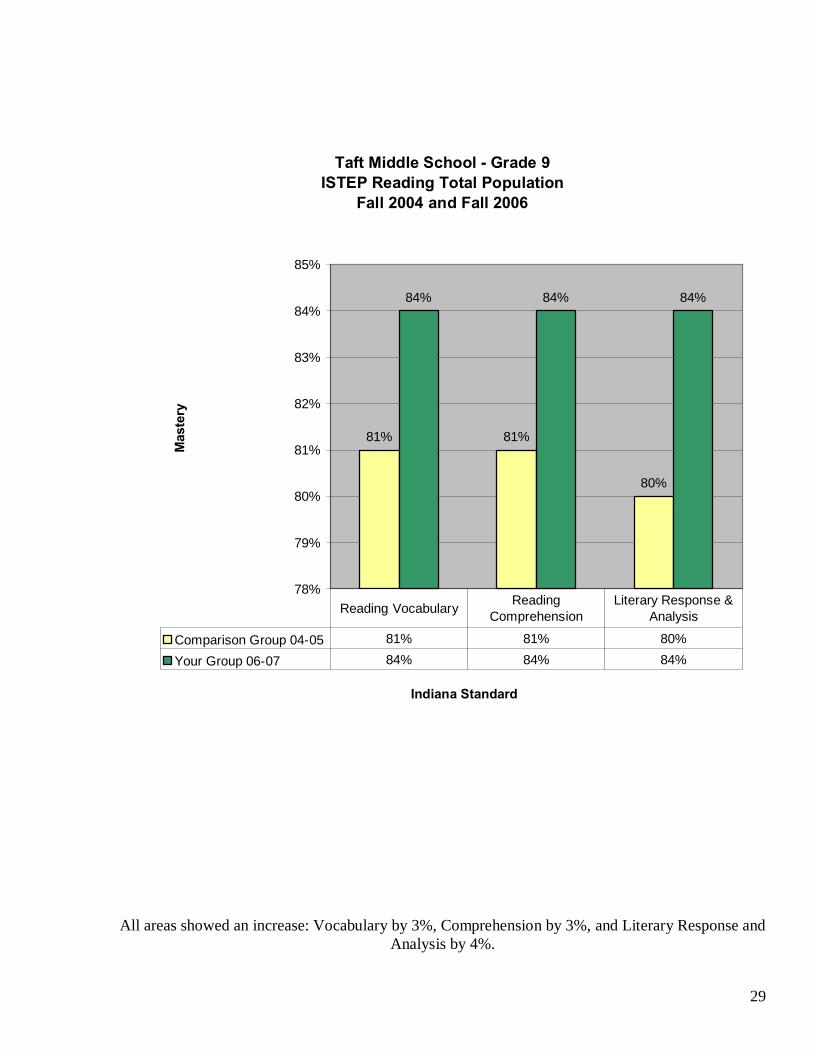
Taft Middle School - Grade 9ISTEP Reading Total Population
Fall 2004 and Fall 2006
81% 81%
80%
84% 84% 84%
78%
79%
80%
81%
82%
83%
84%
85%
Indiana Standard
Mas
tery
Comparison Group 04-05 81% 81% 80%
Your Group 06-07 84% 84% 84%
Reading Vocabulary Reading Comprehension
Literary Response & Analysis
All areas showed an increase: Vocabulary by 3%, Comprehension by 3%, and Literary Response and Analysis by 4%.
30
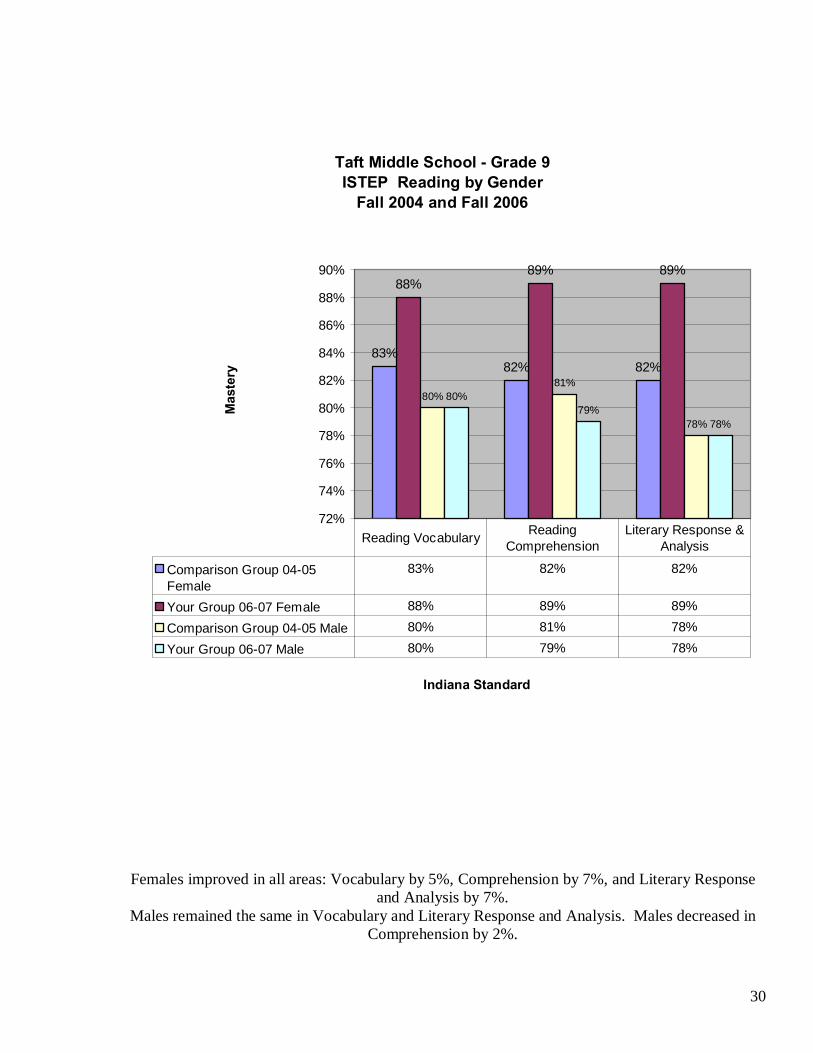
Taft Middle School - Grade 9ISTEP Reading by Gender
Fall 2004 and Fall 2006
83%82% 82%
88%89% 89%
80%81%
78%
80%79%
78%
72%
74%
76%
78%
80%
82%
84%
86%
88%
90%
Indiana Standard
Mas
tery
Comparison Group 04-05Female
83% 82% 82%
Your Group 06-07 Female 88% 89% 89%
Comparison Group 04-05 Male 80% 81% 78%
Your Group 06-07 Male 80% 79% 78%
Reading Vocabulary Reading Comprehension
Literary Response & Analysis
Females improved in all areas: Vocabulary by 5%, Comprehension by 7%, and Literary Response and Analysis by 7%.
Males remained the same in Vocabulary and Literary Response and Analysis. Males decreased in Comprehension by 2%.
31
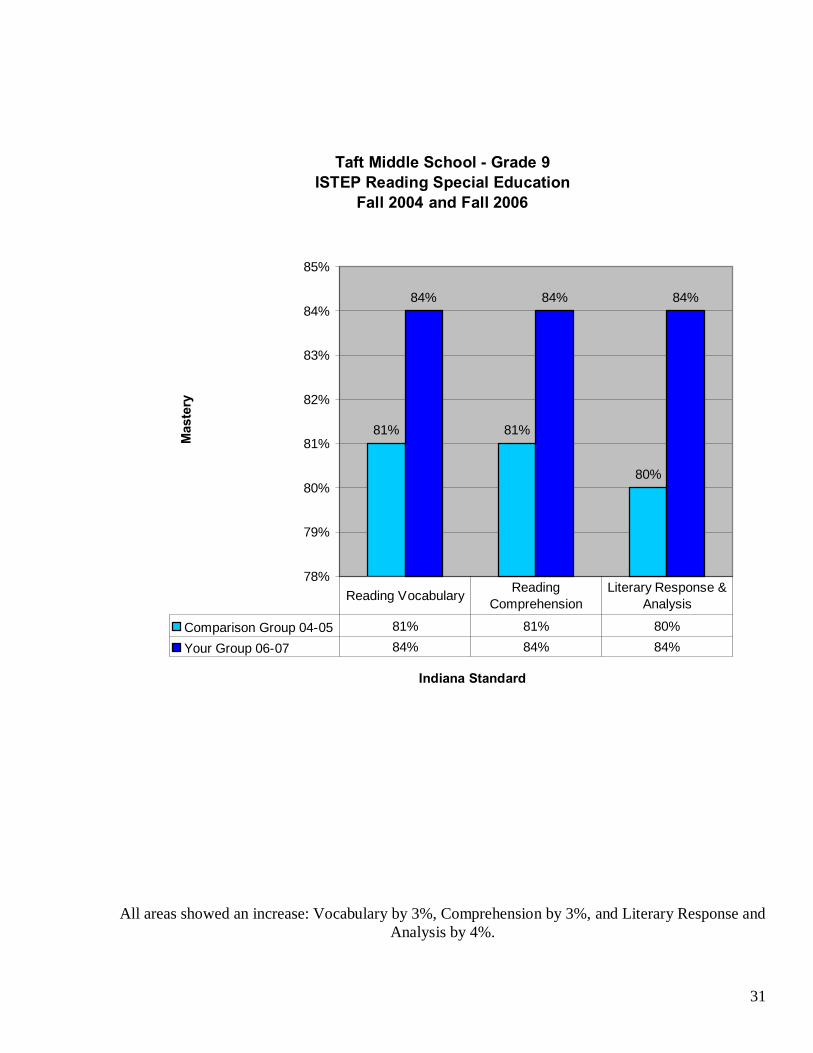
Taft Middle School - Grade 9ISTEP Reading Special Education
Fall 2004 and Fall 2006
81% 81%
80%
84% 84% 84%
78%
79%
80%
81%
82%
83%
84%
85%
Indiana Standard
Mas
tery
Comparison Group 04-05 81% 81% 80%
Your Group 06-07 84% 84% 84%
Reading Vocabulary Reading Comprehension
Literary Response & Analysis
All areas showed an increase: Vocabulary by 3%, Comprehension by 3%, and Literary Response and Analysis by 4%.
32
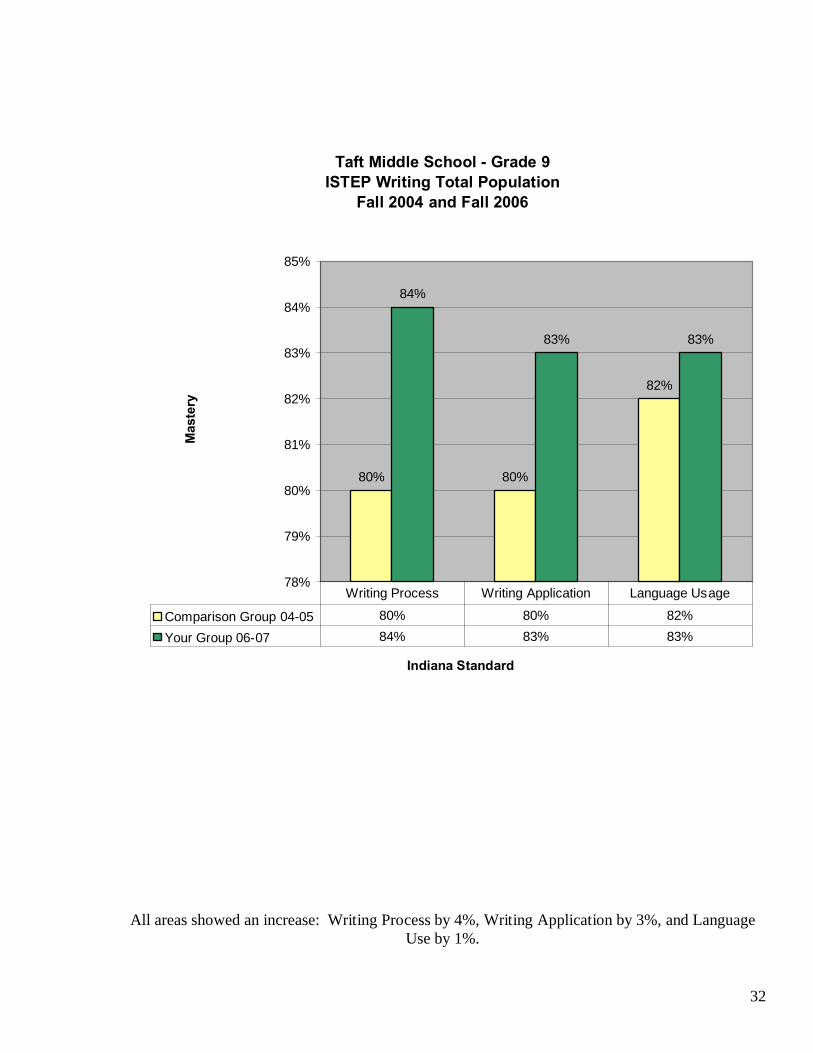
Taft Middle School - Grade 9ISTEP Writing Total Population
Fall 2004 and Fall 2006
80% 80%
82%
84%
83% 83%
78%
79%
80%
81%
82%
83%
84%
85%
Indiana Standard
Mas
tery
Comparison Group 04-05 80% 80% 82%
Your Group 06-07 84% 83% 83%
Writing Process Writing Application Language Usage
All areas showed an increase: Writing Process by 4%, Writing Application by 3%, and Language Use by 1%.
33
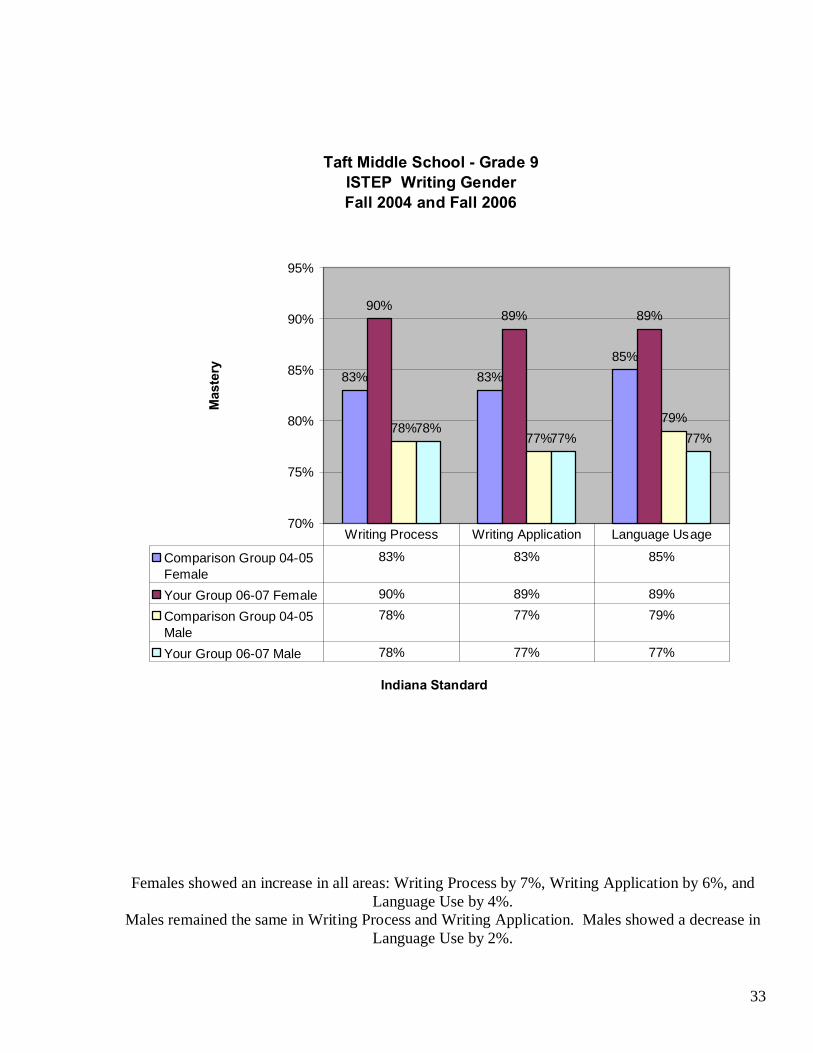
Taft Middle School - Grade 9ISTEP Writing GenderFall 2004 and Fall 2006
83% 83%85%
90%89% 89%
78%77%
79%78%
77% 77%
70%
75%
80%
85%
90%
95%
Indiana Standard
Mas
tery
Comparison Group 04-05Female
83% 83% 85%
Your Group 06-07 Female 90% 89% 89%
Comparison Group 04-05Male
78% 77% 79%
Your Group 06-07 Male 78% 77% 77%
Writing Process Writing Application Language Usage
Females showed an increase in all areas: Writing Process by 7%, Writing Application by 6%, and Language Use by 4%.
Males remained the same in Writing Process and Writing Application. Males showed a decrease in Language Use by 2%.
34
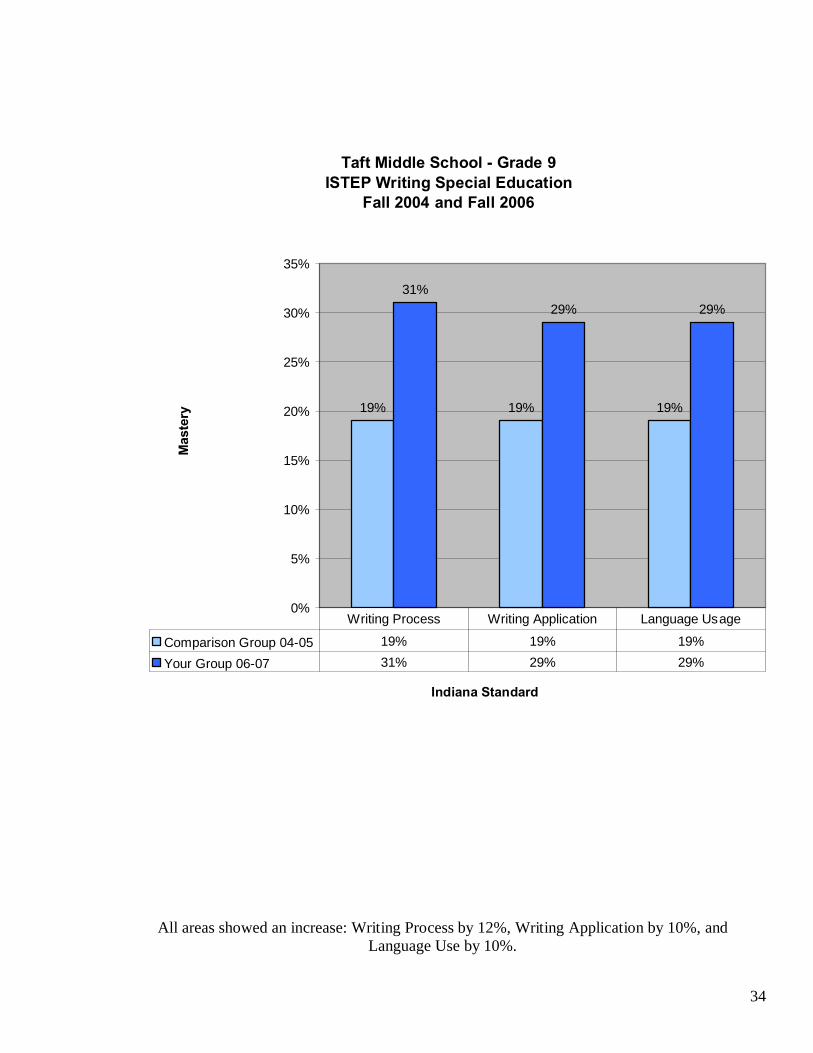
Taft Middle School - Grade 9ISTEP Writing Special Education
Fall 2004 and Fall 2006
19% 19% 19%
31%29% 29%
0%
5%
10%
15%
20%
25%
30%
35%
Indiana Standard
Mas
tery
Comparison Group 04-05 19% 19% 19%
Your Group 06-07 31% 29% 29%
Writing Process Writing Application Language Usage
All areas showed an increase: Writing Process by 12%, Writing Application by 10%, and Language Use by 10%.
35
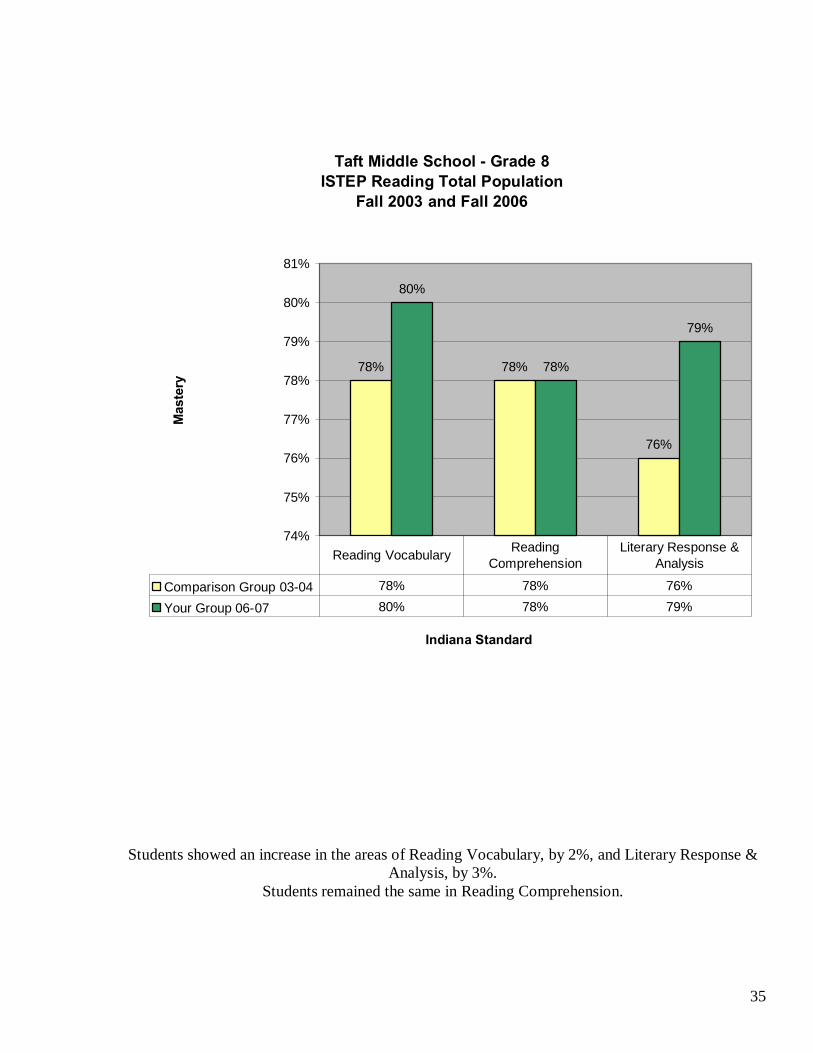
Taft Middle School - Grade 8ISTEP Reading Total Population
Fall 2003 and Fall 2006
78% 78%
76%
80%
78%
79%
74%
75%
76%
77%
78%
79%
80%
81%
Indiana Standard
Mas
tery
Comparison Group 03-04 78% 78% 76%
Your Group 06-07 80% 78% 79%
Reading Vocabulary Reading Comprehension
Literary Response & Analysis
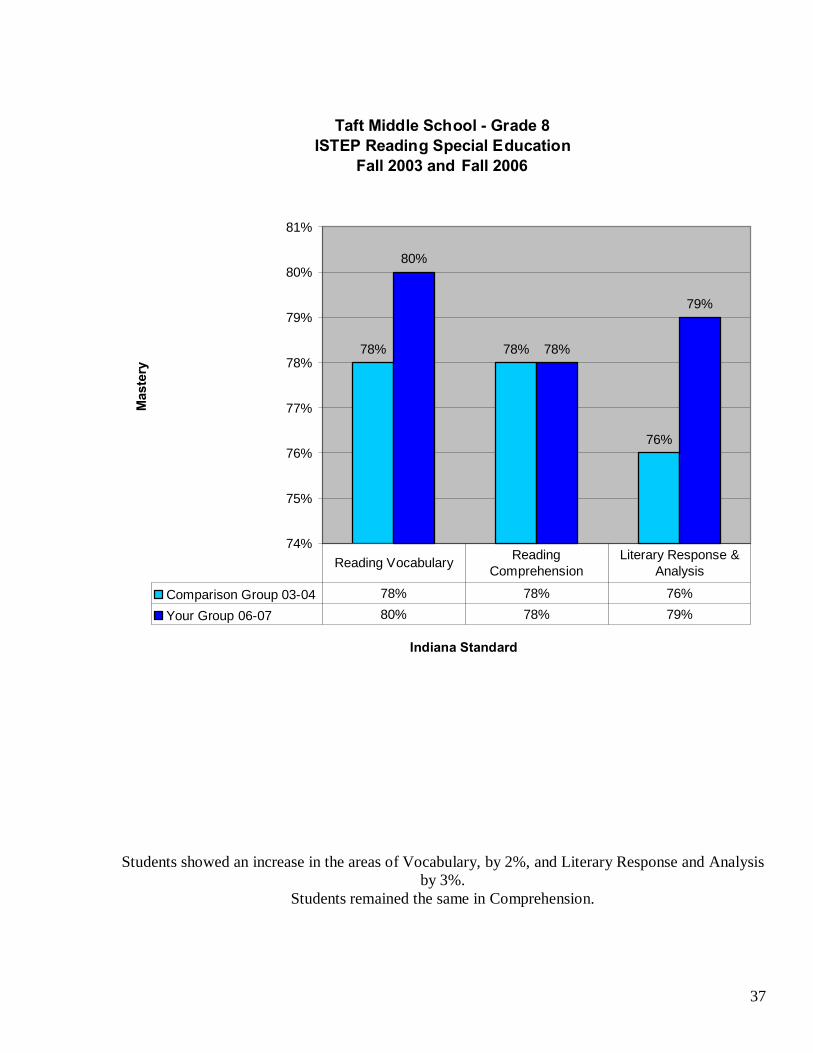
Students showed an increase in the areas of Reading Vocabulary, by 2%, and Literary Response & Analysis, by 3%.
Students remained the same in Reading Comprehension.
36
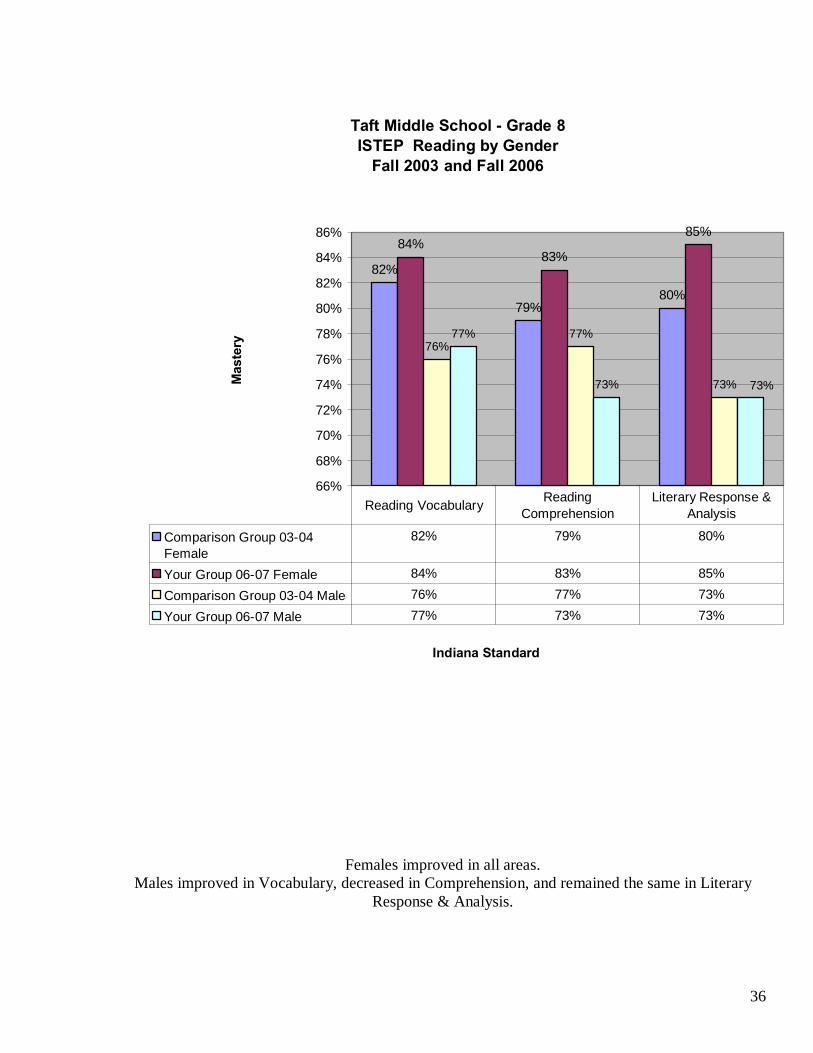
Taft Middle School - Grade 8ISTEP Reading by Gender
Fall 2003 and Fall 2006
82%
79%80%
84%83%
85%
76%77%
73%
77%
73% 73%
66%
68%
70%
72%
74%
76%
78%
80%
82%
84%
86%
Indiana Standard
Mas
tery
Comparison Group 03-04Female
82% 79% 80%
Your Group 06-07 Female 84% 83% 85%
Comparison Group 03-04 Male 76% 77% 73%
Your Group 06-07 Male 77% 73% 73%
Reading Vocabulary Reading Comprehension
Literary Response & Analysis
Females improved in all areas. Males improved in Vocabulary, decreased in Comprehension, and remained the same in Literary
Response & Analysis.
37
Taft Middle School - Grade 8ISTEP Reading Special Education
Fall 2003 and Fall 2006
78% 78%
76%
80%
78%
79%
74%
75%
76%
77%
78%
79%
80%
81%
Indiana Standard
Mas
tery
Comparison Group 03-04 78% 78% 76%
Your Group 06-07 80% 78% 79%
Reading Vocabulary Reading Comprehension
Literary Response & Analysis
Students showed an increase in the areas of Vocabulary, by 2%, and Literary Response and Analysis by 3%.
Students remained the same in Comprehension.
38
Taft Middle School - Grade 8ISTEP Writing Total Population
Fall 2003 and Fall 2006
79%
78%
75%
79%
78%
79%
73%
74%
75%
76%
77%
78%
79%
80%
Indiana Standard
Mas
tery
Comparison Group 03-04 79% 78% 75%
Your Group 06-07 79% 78% 79%
Writing Process Writing Application Language Usage
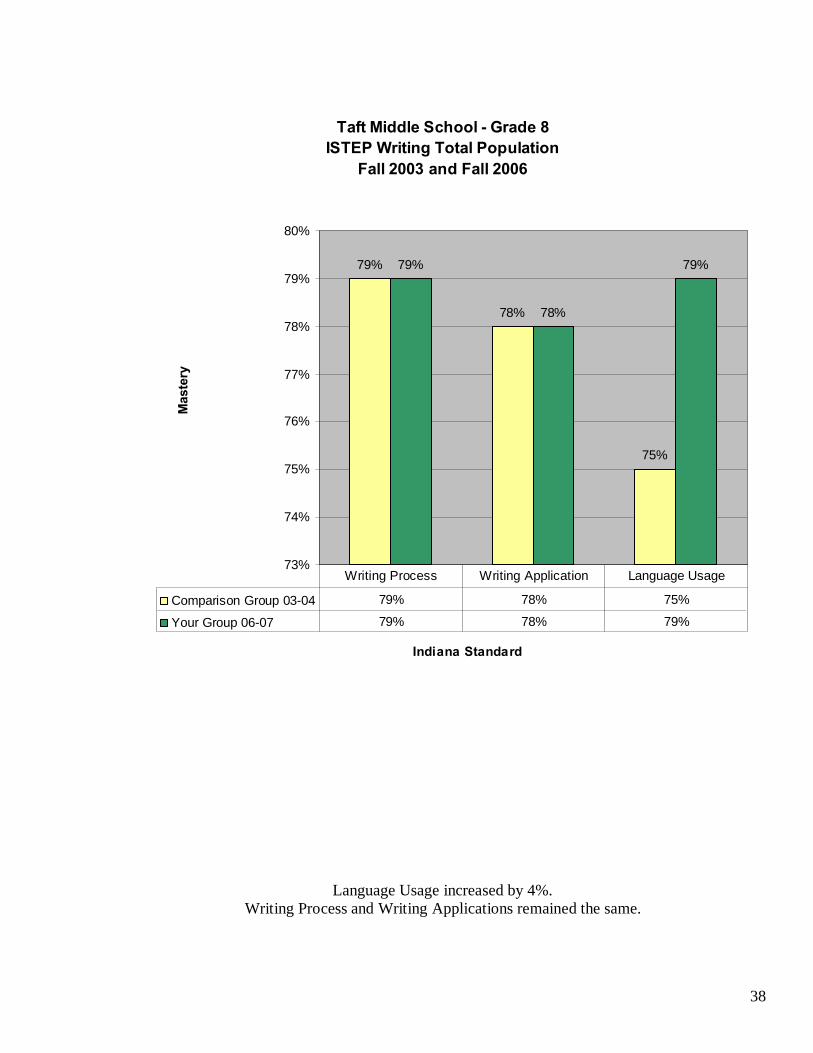
Language Usage increased by 4%. Writing Process and Writing Applications remained the same.
39
Taft Middle School - Grade 8ISTEP Writing GenderFall 2003 and Fall 2006
82%83%
79%
83%85% 85%
77% 77%
73%
76%
72%73%
65%
70%
75%
80%
85%
90%
Indiana Standard
Mas
tery
Comparison Group 03-04Female
82% 83% 79%
Your Group 06-07 Female 83% 85% 85%
Comparison Group 03-04 Male 77% 77% 73%
Your Group 06-07 Male 76% 72% 73%
Writing Process Writing Application Language Usage
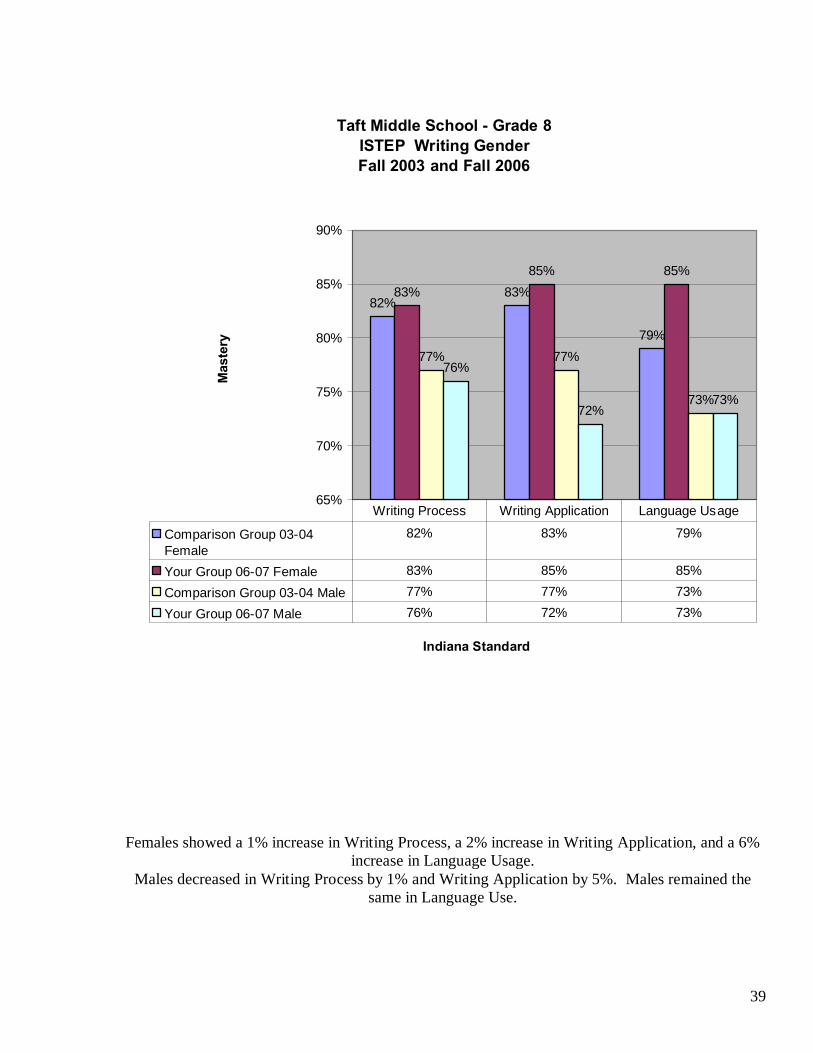
Females showed a 1% increase in Writing Process, a 2% increase in Writing Application, and a 6% increase in Language Usage.
Males decreased in Writing Process by 1% and Writing Application by 5%. Males remained the same in Language Use.
40
Taft Middle School - Grade 8ISTEP Writing Special Education
Fall 2003 and Fall 2006
33%
26%
21%
25%
19%
22%
0%
5%
10%
15%
20%
25%
30%
35%
Indiana Standard
Mas
tery
Comparison Group 03-04 33% 26% 21%
Your Group 06-07 25% 19% 22%
Writing Process Writing Application Language Usage
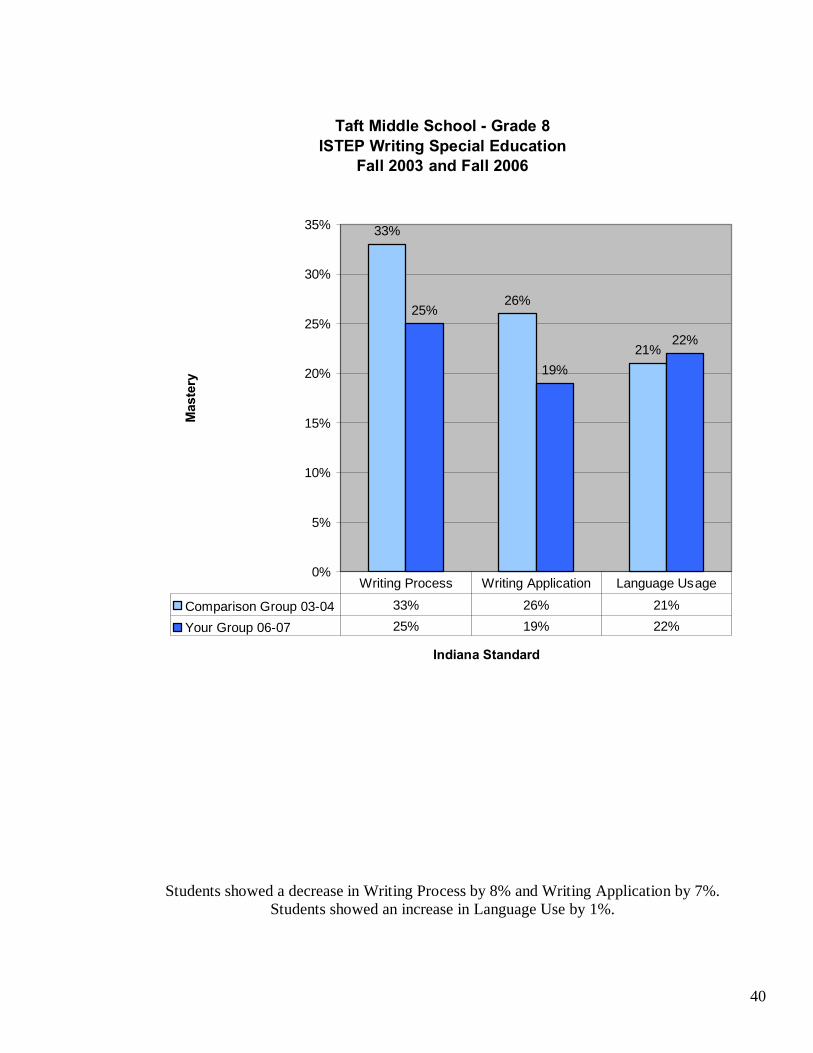
Students showed a decrease in Writing Process by 8% and Writing Application by 7%. Students showed an increase in Language Use by 1%.
41
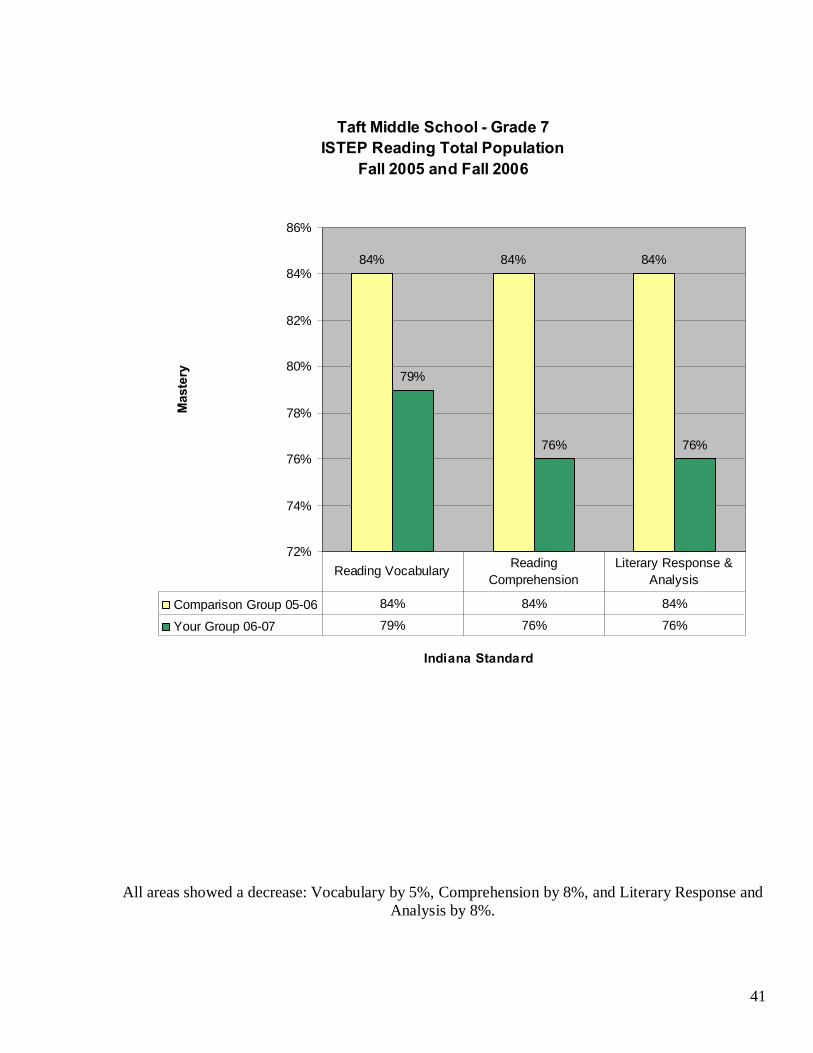
Taft Middle School - Grade 7ISTEP Reading Total Population
Fall 2005 and Fall 2006
84% 84% 84%
79%
76% 76%
72%
74%
76%
78%
80%
82%
84%
86%
Indiana Standard
Mas
tery
Comparison Group 05-06 84% 84% 84%
Your Group 06-07 79% 76% 76%
Reading Vocabulary Reading Comprehension
Literary Response & Analysis
All areas showed a decrease: Vocabulary by 5%, Comprehension by 8%, and Literary Response and Analysis by 8%.
42
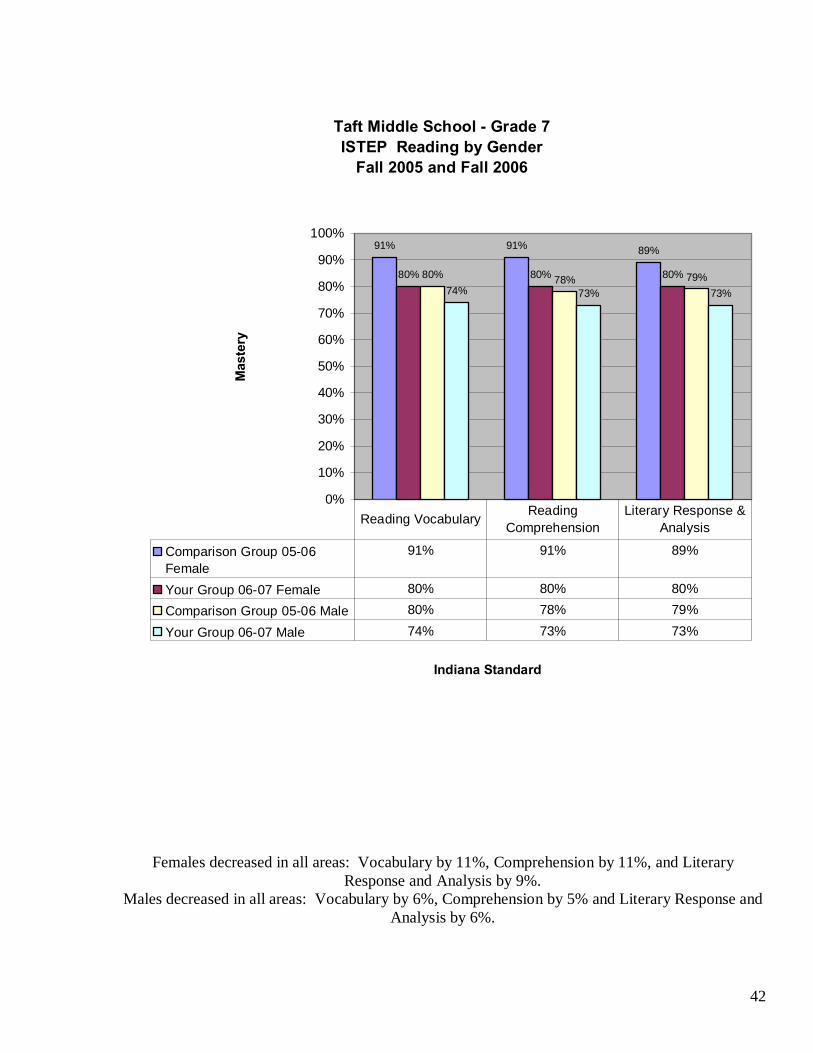
Taft Middle School - Grade 7ISTEP Reading by Gender
Fall 2005 and Fall 2006
91% 91% 89%
80% 80% 80%80% 78% 79%74% 73% 73%
0%
10%
20%
30%
40%
50%
60%
70%
80%
90%
100%
Indiana Standard
Mas
tery
Comparison Group 05-06Female
91% 91% 89%
Your Group 06-07 Female 80% 80% 80%
Comparison Group 05-06 Male 80% 78% 79%
Your Group 06-07 Male 74% 73% 73%
Reading Vocabulary Reading Comprehension
Literary Response & Analysis
Females decreased in all areas: Vocabulary by 11%, Comprehension by 11%, and Literary Response and Analysis by 9%.
Males decreased in all areas: Vocabulary by 6%, Comprehension by 5% and Literary Response and Analysis by 6%.
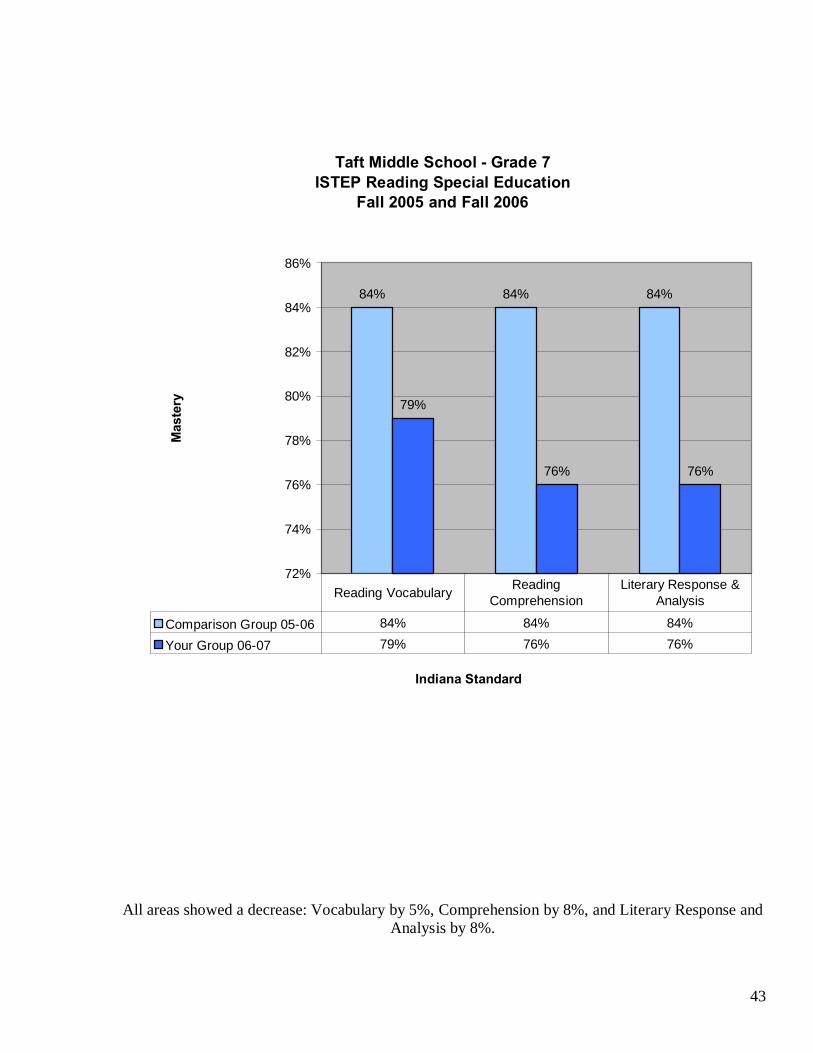
43
Taft Middle School - Grade 7ISTEP Reading Special Education
Fall 2005 and Fall 2006
84% 84% 84%
79%
76% 76%
72%
74%
76%
78%
80%
82%
84%
86%
Indiana Standard
Mas
tery
Comparison Group 05-06 84% 84% 84%
Your Group 06-07 79% 76% 76%
Reading Vocabulary Reading Comprehension
Literary Response & Analysis
All areas showed a decrease: Vocabulary by 5%, Comprehension by 8%, and Literary Response and Analysis by 8%.
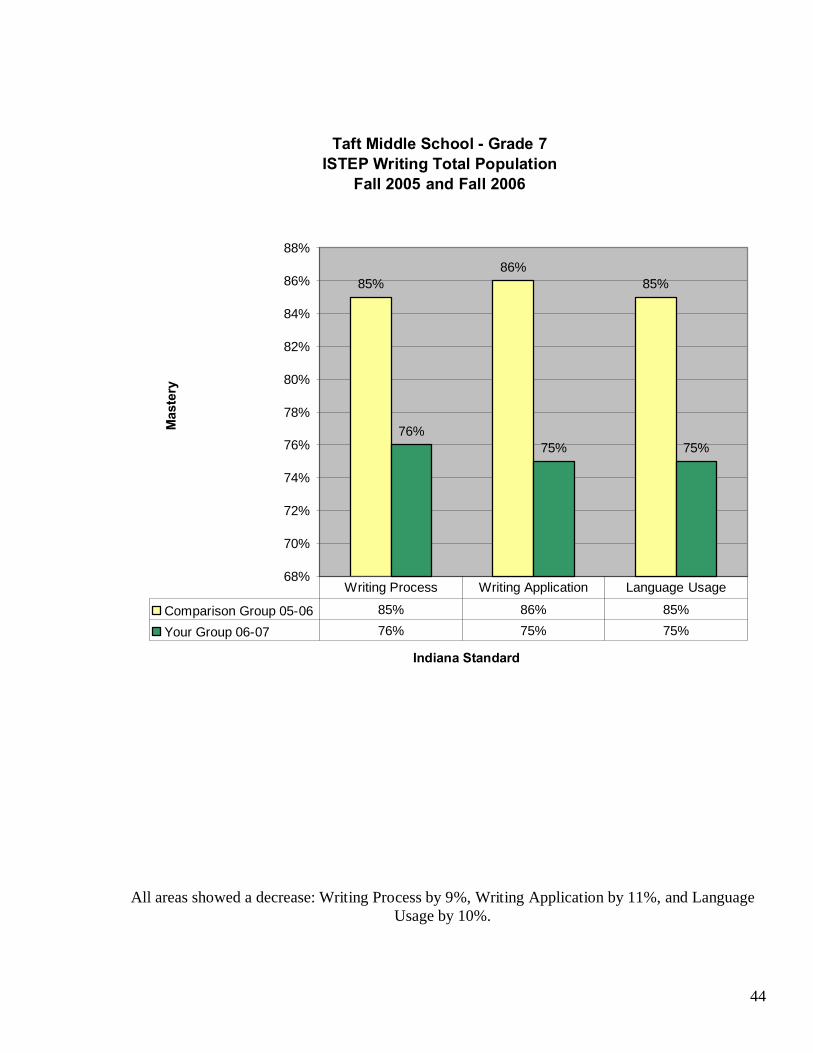
44
Taft Middle School - Grade 7ISTEP Writing Total Population
Fall 2005 and Fall 2006
85%86%
85%
76%75% 75%
68%
70%
72%
74%
76%
78%
80%
82%
84%
86%
88%
Indiana Standard
Mas
tery
Comparison Group 05-06 85% 86% 85%
Your Group 06-07 76% 75% 75%
Writing Process Writing Application Language Usage
All areas showed a decrease: Writing Process by 9%, Writing Application by 11%, and Language Usage by 10%.
45
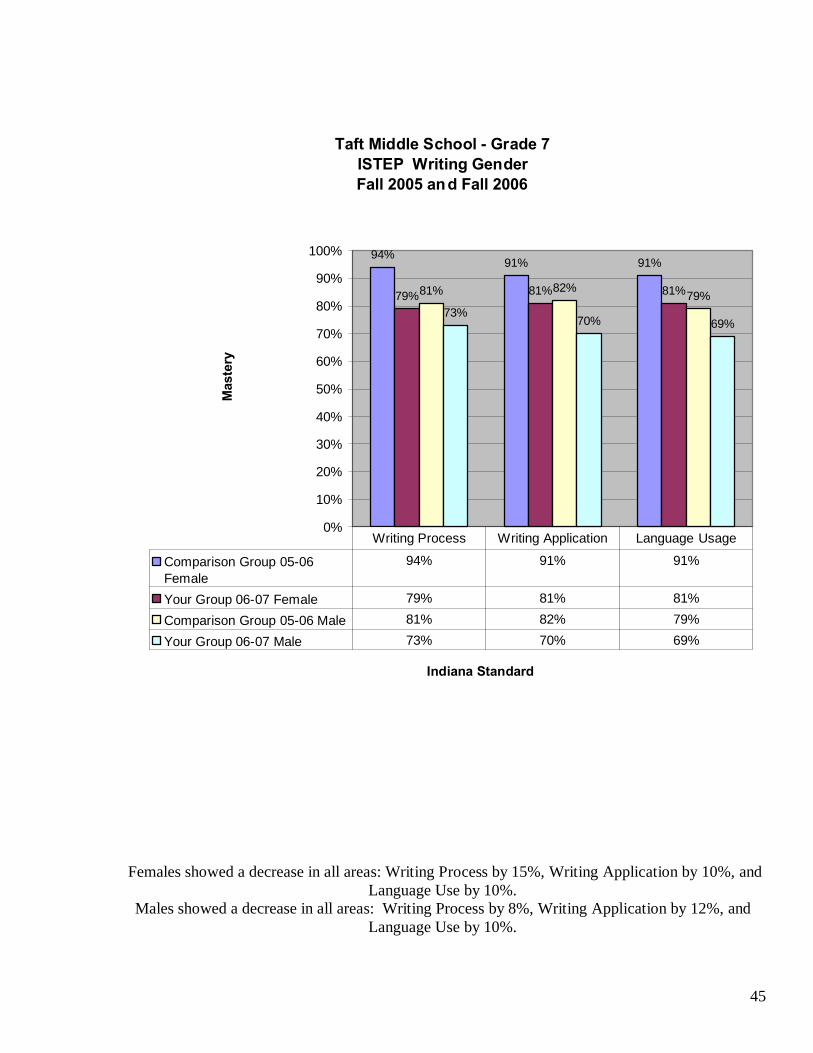
Taft Middle School - Grade 7ISTEP Writing GenderFall 2005 an d Fall 2006
94%91% 91%
79% 81% 81%81% 82%79%
73%70% 69%
0%
10%
20%
30%
40%
50%
60%
70%
80%
90%
100%
Indiana Standard
Mas
tery
Comparison Group 05-06Female
94% 91% 91%
Your Group 06-07 Female 79% 81% 81%
Comparison Group 05-06 Male 81% 82% 79%
Your Group 06-07 Male 73% 70% 69%
Writing Process Writing Application Language Usage
Females showed a decrease in all areas: Writing Process by 15%, Writing Application by 10%, and Language Use by 10%.
Males showed a decrease in all areas: Writing Process by 8%, Writing Application by 12%, and Language Use by 10%.
46
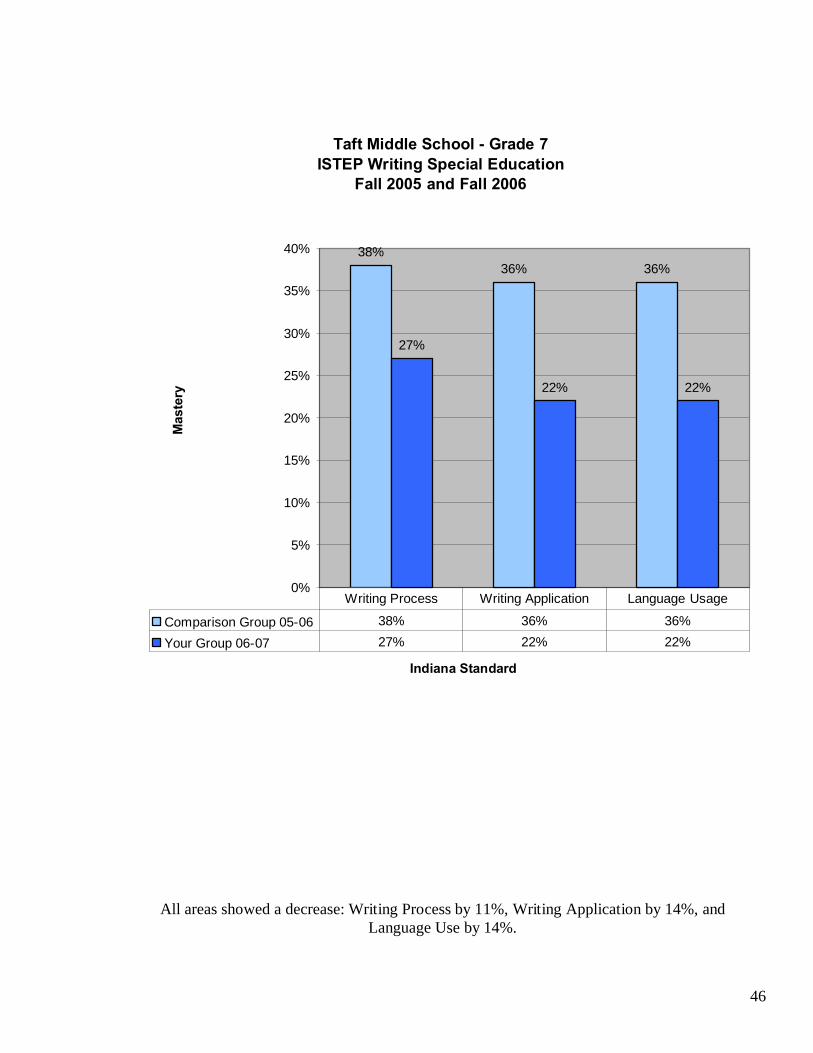
Taft Middle School - Grade 7ISTEP Writing Special Education
Fall 2005 and Fall 2006
38%36% 36%
27%
22% 22%
0%
5%
10%
15%
20%
25%
30%
35%
40%
Indiana Standard
Mas
tery
Comparison Group 05-06 38% 36% 36%
Your Group 06-07 27% 22% 22%
Writing Process Writing Application Language Usage
All areas showed a decrease: Writing Process by 11%, Writing Application by 14%, and Language Use by 14%.
47
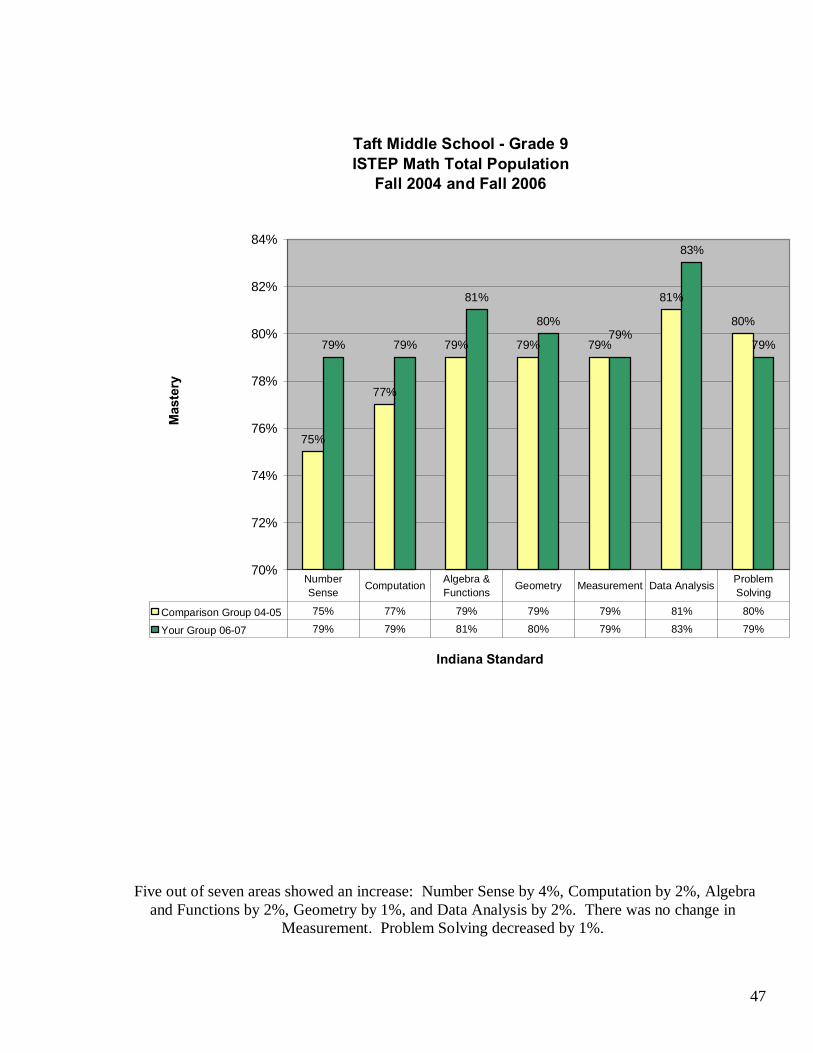
Taft Middle School - Grade 9ISTEP Math Total Population
Fall 2004 and Fall 2006
75%
77%
79% 79% 79%
81%
80%
79% 79%
81%
80%
83%
79%79%
70%
72%
74%
76%
78%
80%
82%
84%
Indiana Standard
Mas
tery
Comparison Group 04-05 75% 77% 79% 79% 79% 81% 80%
Your Group 06-07 79% 79% 81% 80% 79% 83% 79%
Number Sense Computation Algebra &
Functions Geometry Measurement Data Analysis Problem Solving
Five out of seven areas showed an increase: Number Sense by 4%, Computation by 2%, Algebra and Functions by 2%, Geometry by 1%, and Data Analysis by 2%. There was no change in
Measurement. Problem Solving decreased by 1%.
48
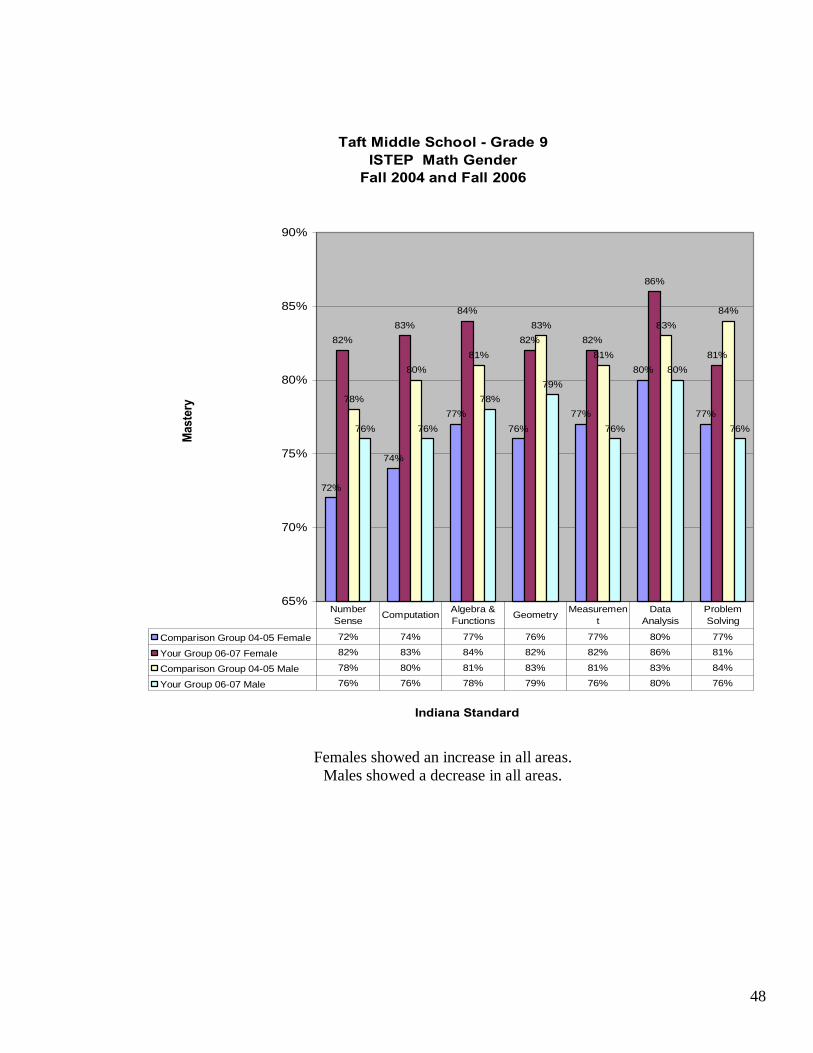
Taft Middle School - Grade 9ISTEP Math Gender
Fall 2004 and Fall 2006
72%
74%
77%76%
77%
80%
77%
82%83%
84%
82% 82%
86%
81%
78%
80%81%
83%
81%
83%84%
76% 76%
78%79%
76%
80%
76%
65%
70%
75%
80%
85%
90%
Indiana Standard
Mas
tery
Comparison Group 04-05 Female 72% 74% 77% 76% 77% 80% 77%
Your Group 06-07 Female 82% 83% 84% 82% 82% 86% 81%
Comparison Group 04-05 Male 78% 80% 81% 83% 81% 83% 84%
Your Group 06-07 Male 76% 76% 78% 79% 76% 80% 76%
Number Sense Computation Algebra &
Functions Geometry Measurement
Data Analysis
Problem Solving
Females showed an increase in all areas. Males showed a decrease in all areas.
49
Taft Middle School - Grade 9ISTEP Math Special Education
Fall 2004 and Fall 2006
35%
32%30%
37%
33% 33% 33%
37%
33%34%
38%36%
38%
34%
0%
5%
10%
15%
20%
25%
30%
35%
40%
Indiana Standard
Mas
tery
Comparison Group 04-05 35% 32% 30% 37% 33% 33% 33%
Your Group 06-07 37% 33% 34% 38% 36% 38% 34%
Number Sense Computation Algebra &
Functions Geometry Measurement
Data Analysis
Problem Solving
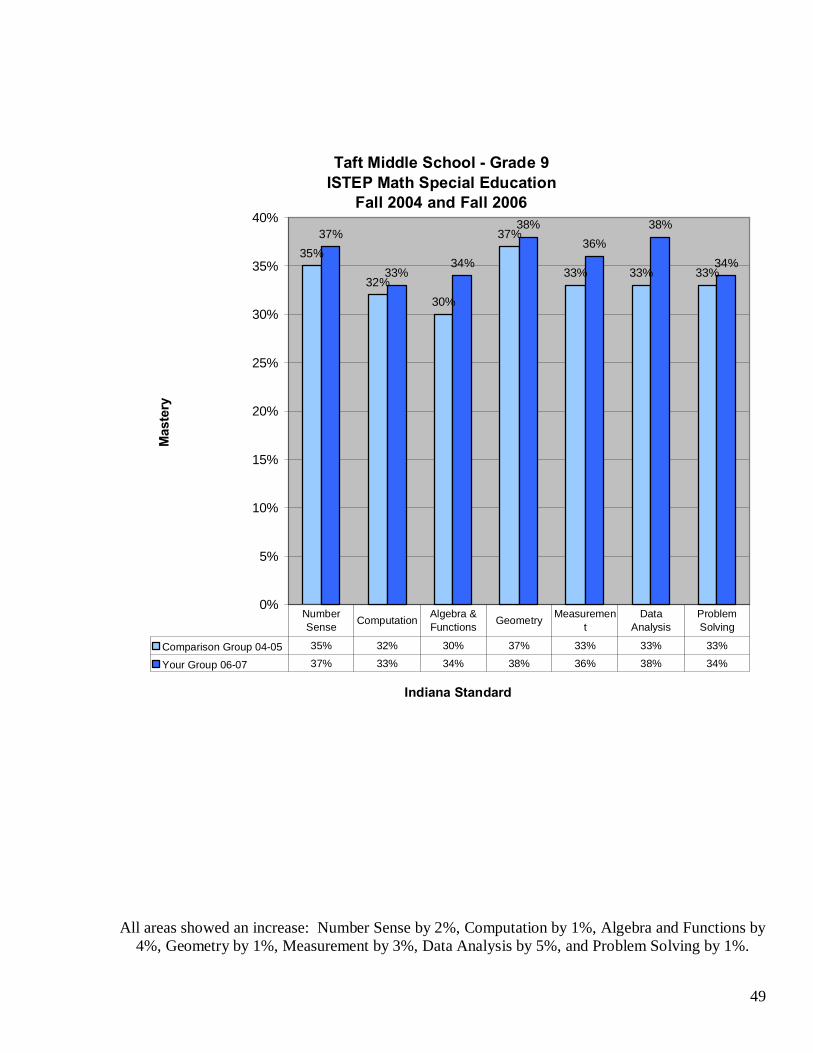
All areas showed an increase: Number Sense by 2%, Computation by 1%, Algebra and Functions by
4%, Geometry by 1%, Measurement by 3%, Data Analysis by 5%, and Problem Solving by 1%.
50
Taft Middle School - Grade 8ISTEP Math Total Population
Fall 2003 and Fall 2006
81%
85%
82%
83%
84% 84%
85%
82%
84%
79%
82%
84%
83%
82%
76%
77%
78%
79%
80%
81%
82%
83%
84%
85%
86%
Indiana Standard
Mas
tery
Comparison Group 03-04 81% 85% 82% 83% 84% 84% 85%
Your Group 06-07 82% 84% 79% 82% 84% 83% 82%
Number Sense
Computation Algebra & Functions
Geometry Measurement
Data Analysis
Problem Solving
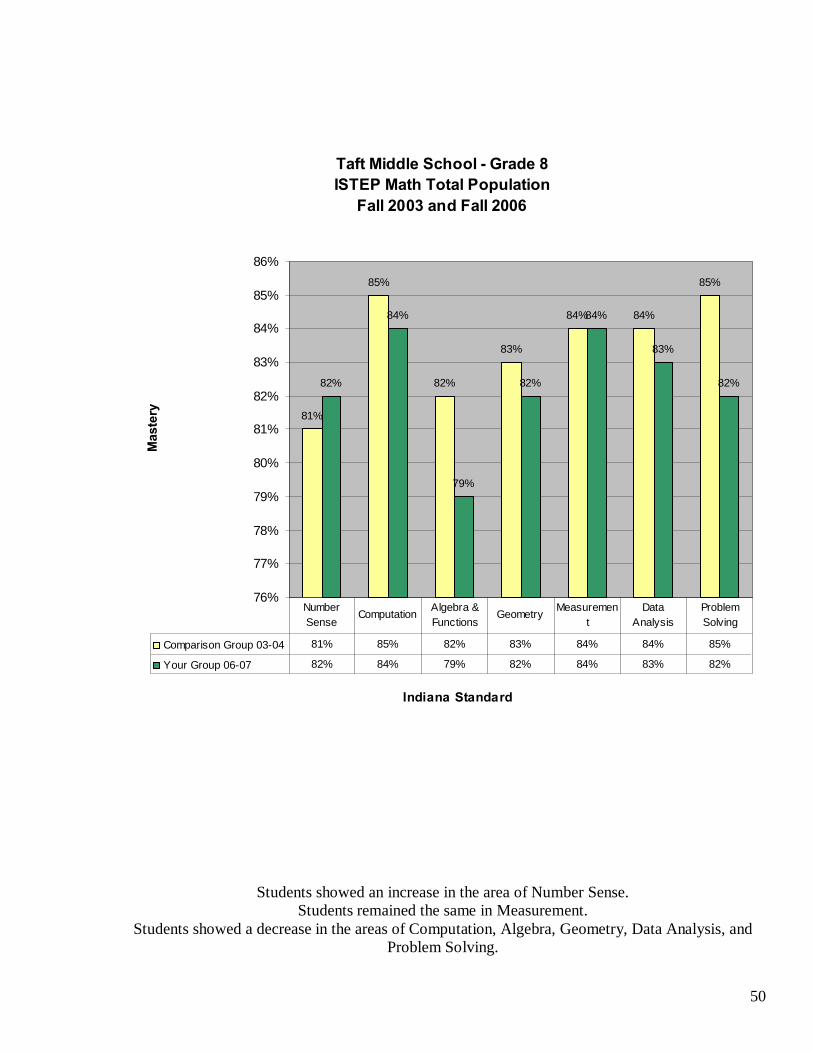
Students showed an increase in the area of Number Sense. Students remained the same in Measurement.
Students showed a decrease in the areas of Computation, Algebra, Geometry, Data Analysis, and Problem Solving.
51
Taft Middle School - Grade 8ISTEP Math Gender
Fall 2003 and Fall 2006
77%
82%
79%80%
81% 81%82%
81%
78%
81%82% 82%
79%
84%
87%
84%
86%87% 87% 87%
83%
86%
79%
83%
86%85%
84%
82%
72%
74%
76%
78%
80%
82%
84%
86%
88%
Indiana Standard
Mas
tery
Comparison Group 03-04 Female 77% 82% 79% 80% 81% 81% 82%
Your Group 06-07 Female 81% 82% 78% 81% 82% 82% 79%
Comparison Group 03-04 Male 84% 87% 84% 86% 87% 87% 87%
Your Group 06-07 Male 83% 86% 79% 83% 86% 85% 84%
Number Sense
Computation
Algebra & Functions
Geometry Measurement
Data Analysis
Problem Solving
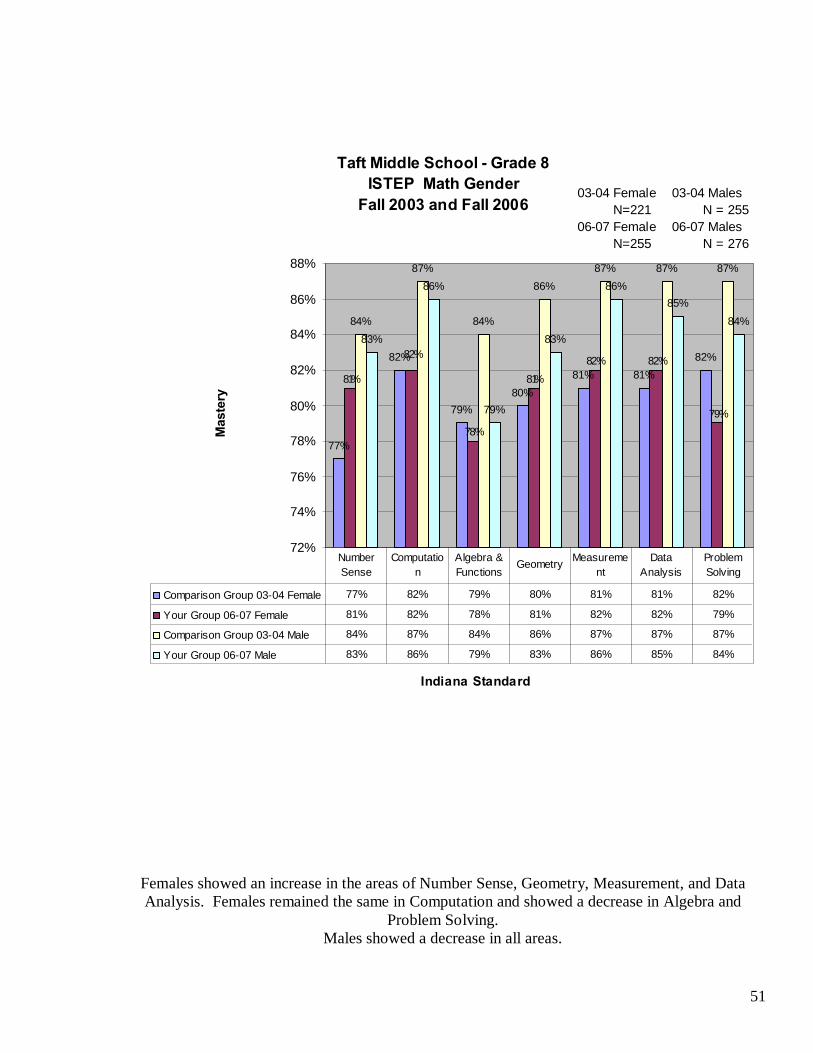
03-04 Female 03-04 Males N=221 N = 25506-07 Female 06-07 Males N=255 N = 276
Females showed an increase in the areas of Number Sense, Geometry, Measurement, and Data Analysis. Females remained the same in Computation and showed a decrease in Algebra and
Problem Solving. Males showed a decrease in all areas.
52
Taft Middle School - Grade 8ISTEP Math Special Education
Fall 2003 and Fall 2006
43%46% 46% 46% 46% 46%
49%
34%
44%
34%
41% 41% 41% 41%
0%
10%
20%
30%
40%
50%
60%
Indiana Standard
Mas
tery
Comparison Group 03-04 43% 46% 46% 46% 46% 46% 49%
Your Group 06-07 34% 44% 34% 41% 41% 41% 41%
Number Sense Computation Algebra &
Functions Geometry Measurement
Data Analysis
Problem Solving
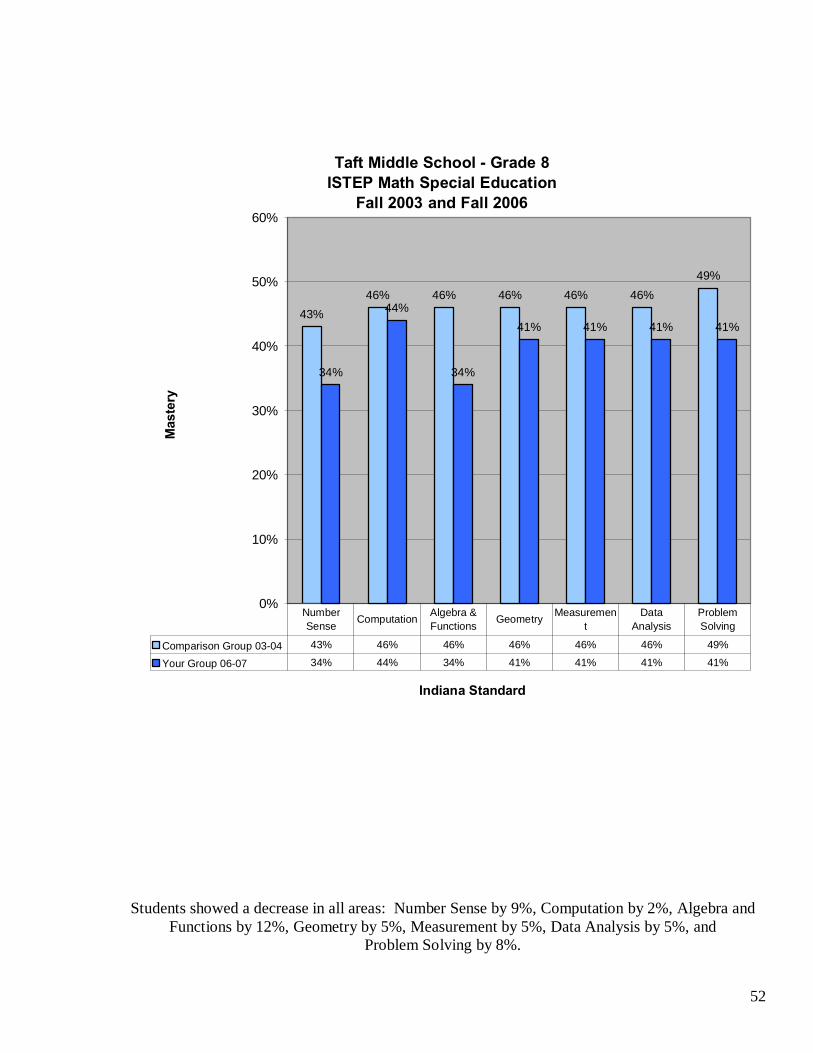
Students showed a decrease in all areas: Number Sense by 9%, Computation by 2%, Algebra and Functions by 12%, Geometry by 5%, Measurement by 5%, Data Analysis by 5%, and
Problem Solving by 8%.
53
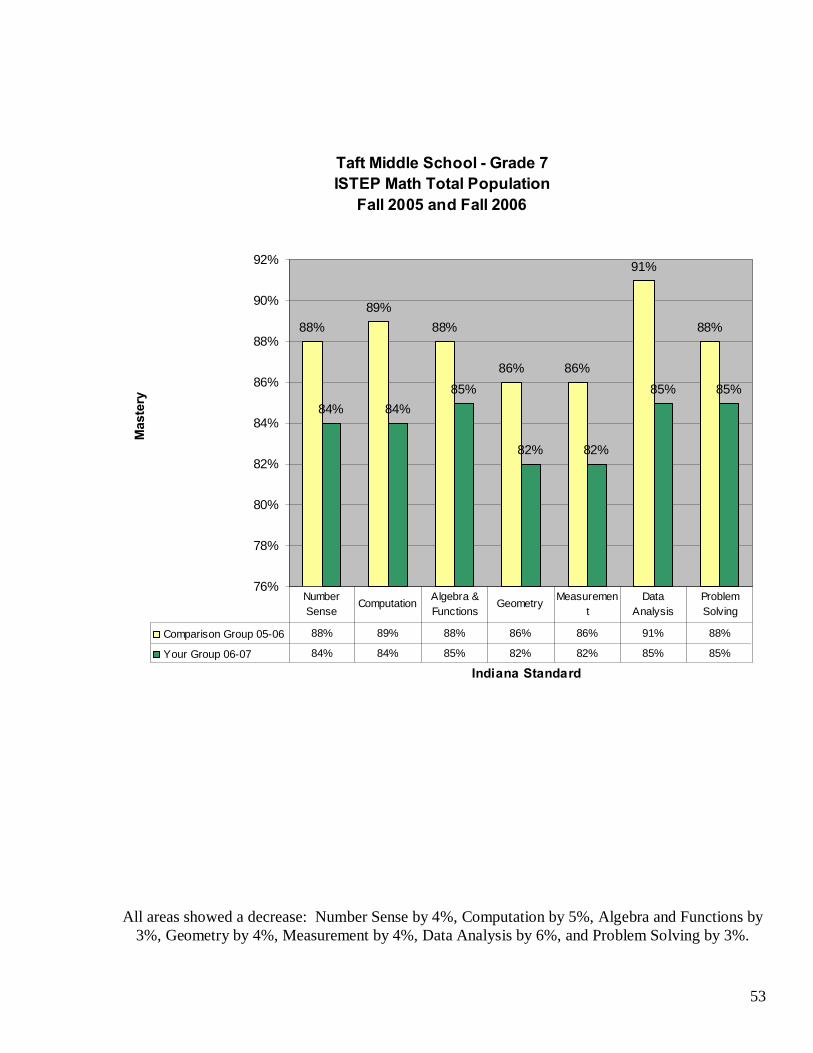
Taft Middle School - Grade 7ISTEP Math Total Population
Fall 2005 and Fall 2006
88%89%
88%
86% 86%
91%
88%
84% 84%85%
82% 82%
85% 85%
76%
78%
80%
82%
84%
86%
88%
90%
92%
Indiana Standard
Mas
tery
Comparison Group 05-06 88% 89% 88% 86% 86% 91% 88%
Your Group 06-07 84% 84% 85% 82% 82% 85% 85%
Number Sense
Computation Algebra & Functions
Geometry Measurement
Data Analysis
Problem Solving
All areas showed a decrease: Number Sense by 4%, Computation by 5%, Algebra and Functions by
3%, Geometry by 4%, Measurement by 4%, Data Analysis by 6%, and Problem Solving by 3%.
54
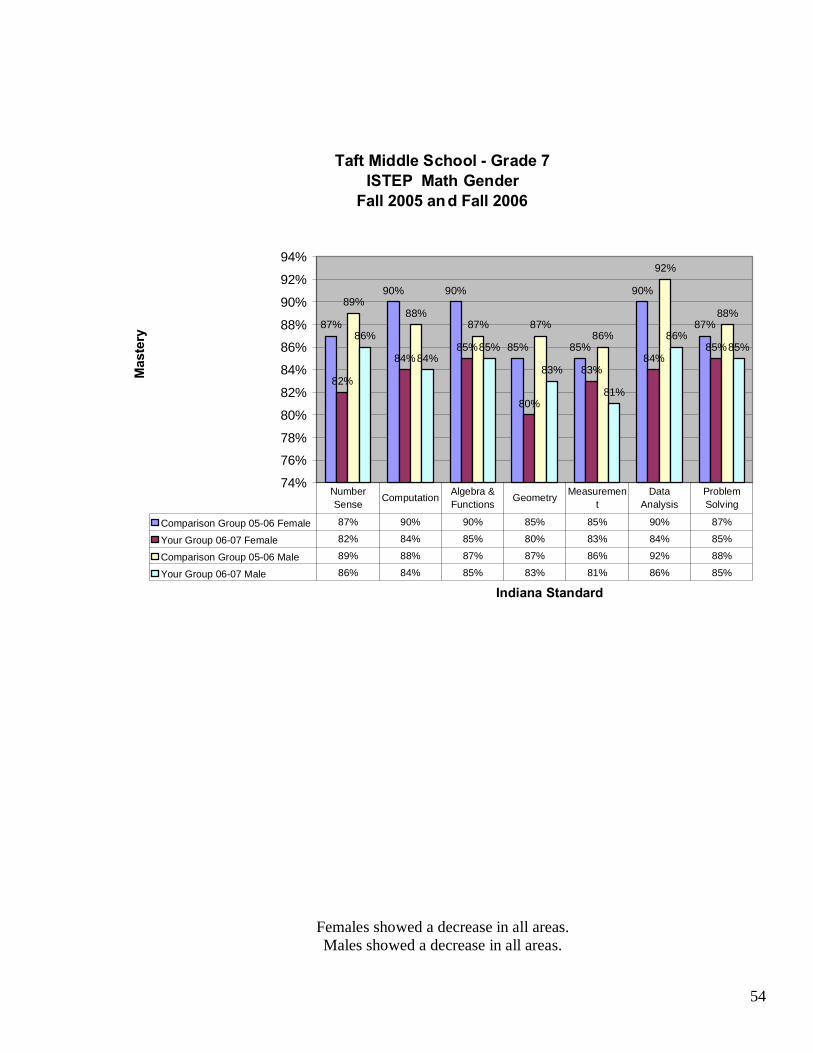
Taft Middle School - Grade 7ISTEP Math Gender
Fall 2005 an d Fall 2006
87%
90% 90%
85% 85%
90%
87%
82%
84%85%
80%
83%84%
85%
89%88%
87% 87%86%
92%
88%
86%
84%85%
83%
81%
86%85%
74%
76%
78%
80%
82%
84%
86%
88%
90%
92%
94%
Indiana Standard
Mas
tery
Comparison Group 05-06 Female 87% 90% 90% 85% 85% 90% 87%
Your Group 06-07 Female 82% 84% 85% 80% 83% 84% 85%
Comparison Group 05-06 Male 89% 88% 87% 87% 86% 92% 88%
Your Group 06-07 Male 86% 84% 85% 83% 81% 86% 85%
Number Sense
Computation Algebra & Functions
Geometry Measurement
Data Analysis
Problem Solving
Females showed a decrease in all areas. Males showed a decrease in all areas.
55
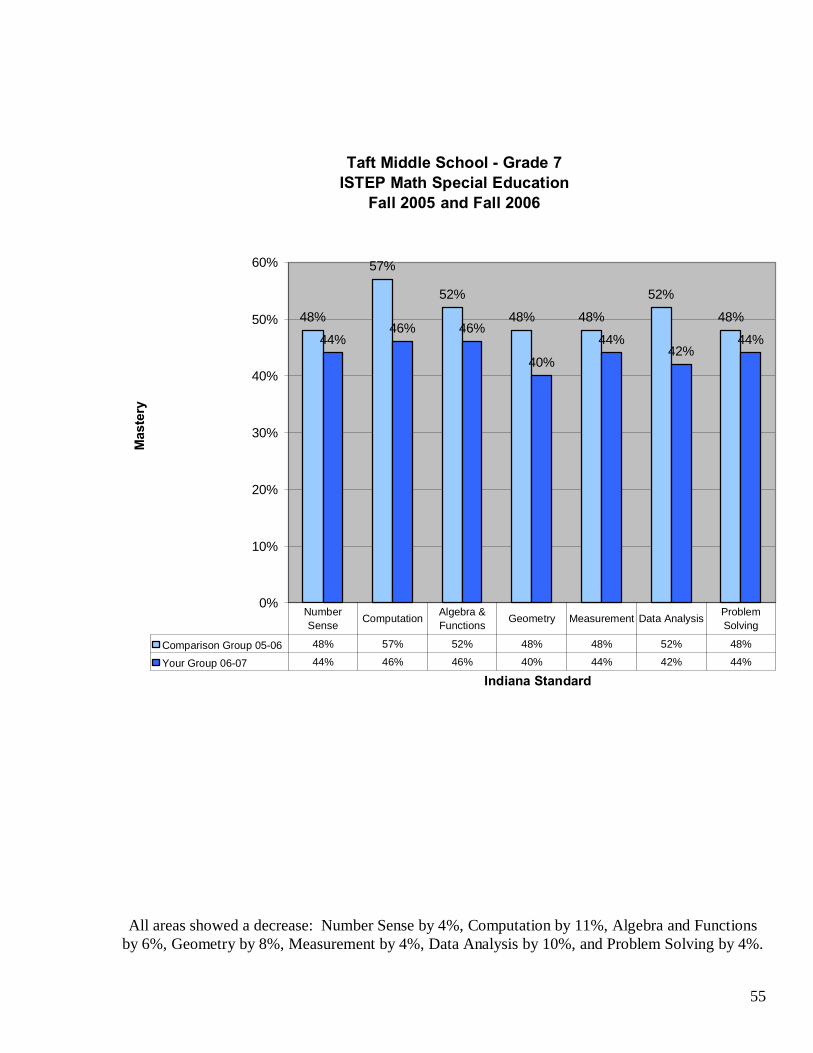
Taft Middle School - Grade 7ISTEP Math Special Education
Fall 2005 and Fall 2006
48%
57%
52%
48% 48%
52%
48%
44%46% 46%
40%
44%42%
44%
0%
10%
20%
30%
40%
50%
60%
Indiana Standard
Mas
tery
Comparison Group 05-06 48% 57% 52% 48% 48% 52% 48%
Your Group 06-07 44% 46% 46% 40% 44% 42% 44%
Number Sense Computation Algebra &
Functions Geometry Measurement Data Analysis Problem Solving
All areas showed a decrease: Number Sense by 4%, Computation by 11%, Algebra and Functions by 6%, Geometry by 8%, Measurement by 4%, Data Analysis by 10%, and Problem Solving by 4%.
56
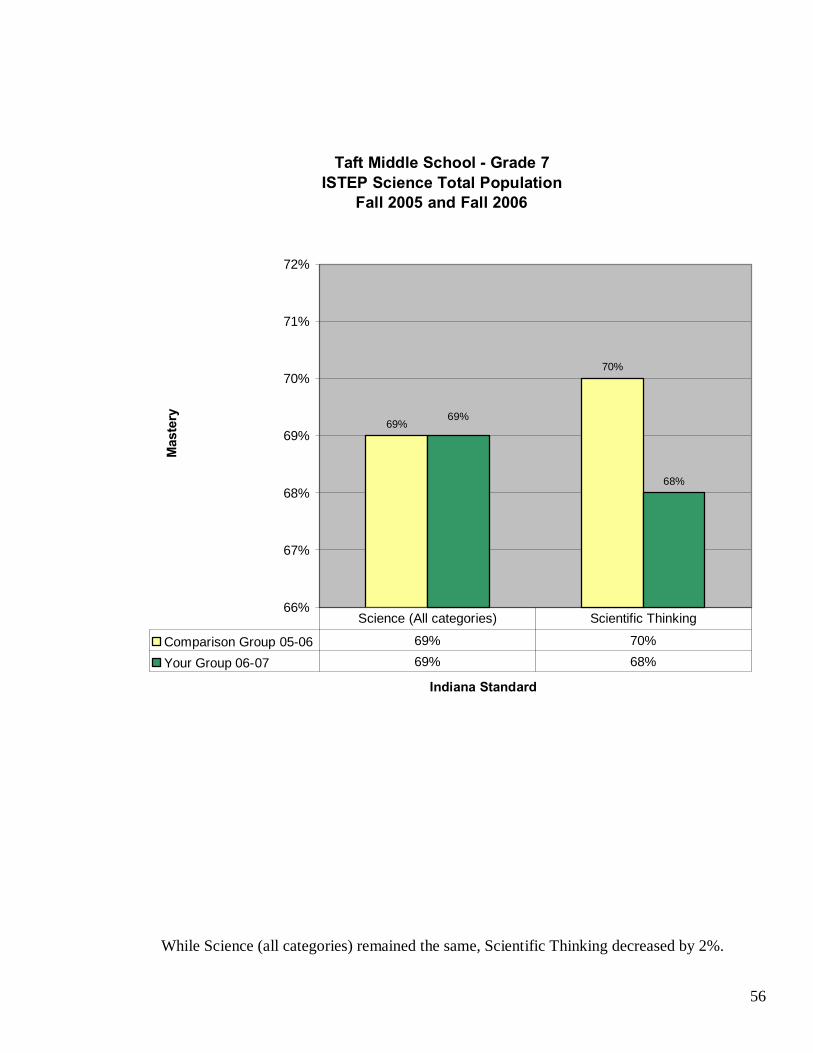
Taft Middle School - Grade 7ISTEP Science Total Population
Fall 2005 and Fall 2006
69%
70%
68%
69%
66%
67%
68%
69%
70%
71%
72%
Indiana Standard
Mas
tery
Comparison Group 05-06 69% 70%
Your Group 06-07 69% 68%
Science (All categories) Scientific Thinking
While Science (all categories) remained the same, Scientific Thinking decreased by 2%.
57
ISTEP+ APPLIED SKILL SCORES 2007
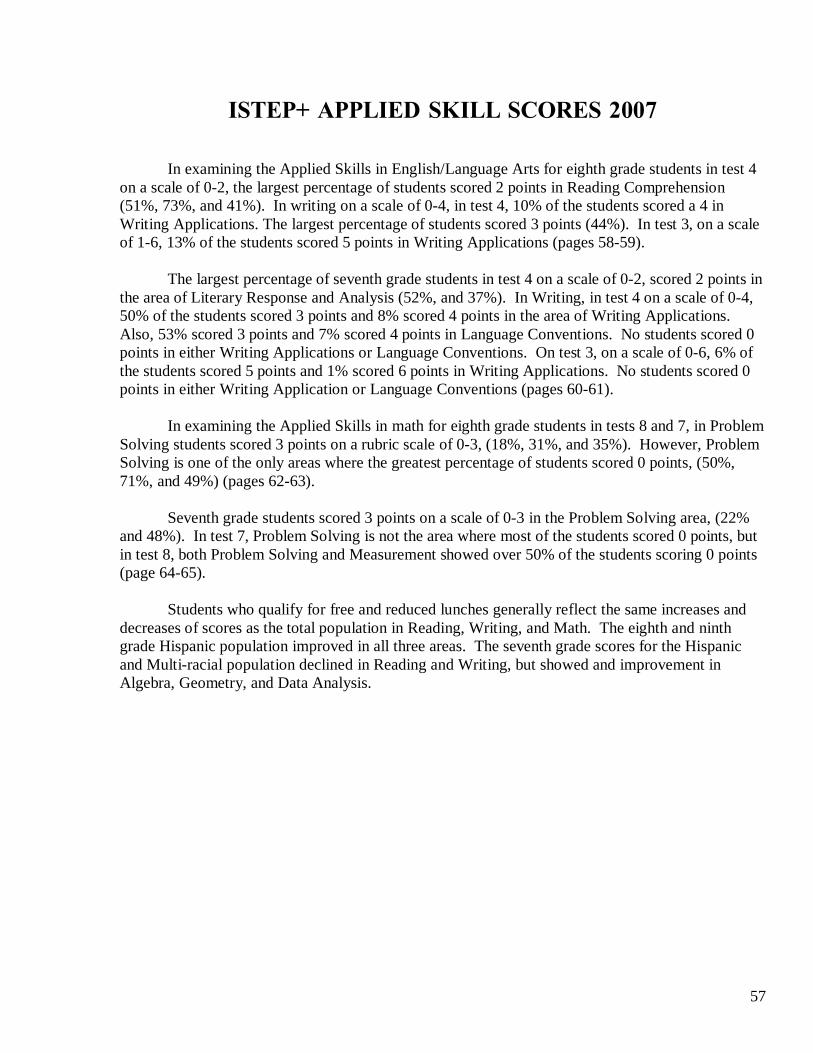
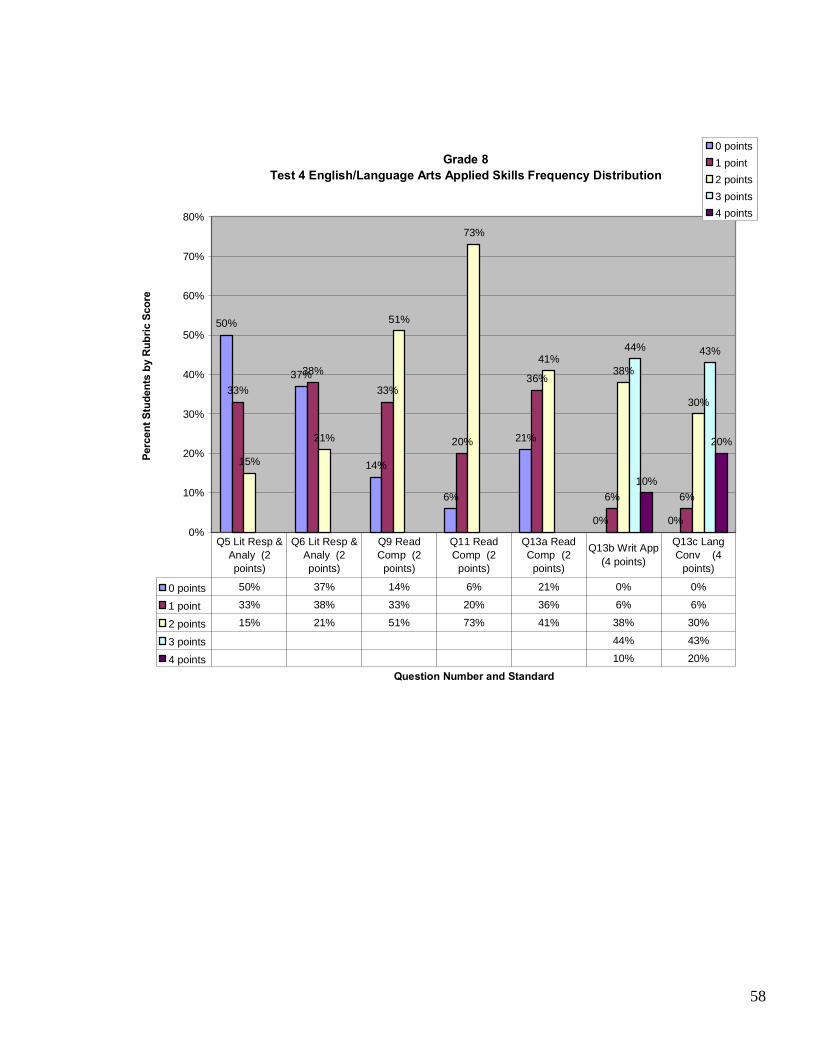
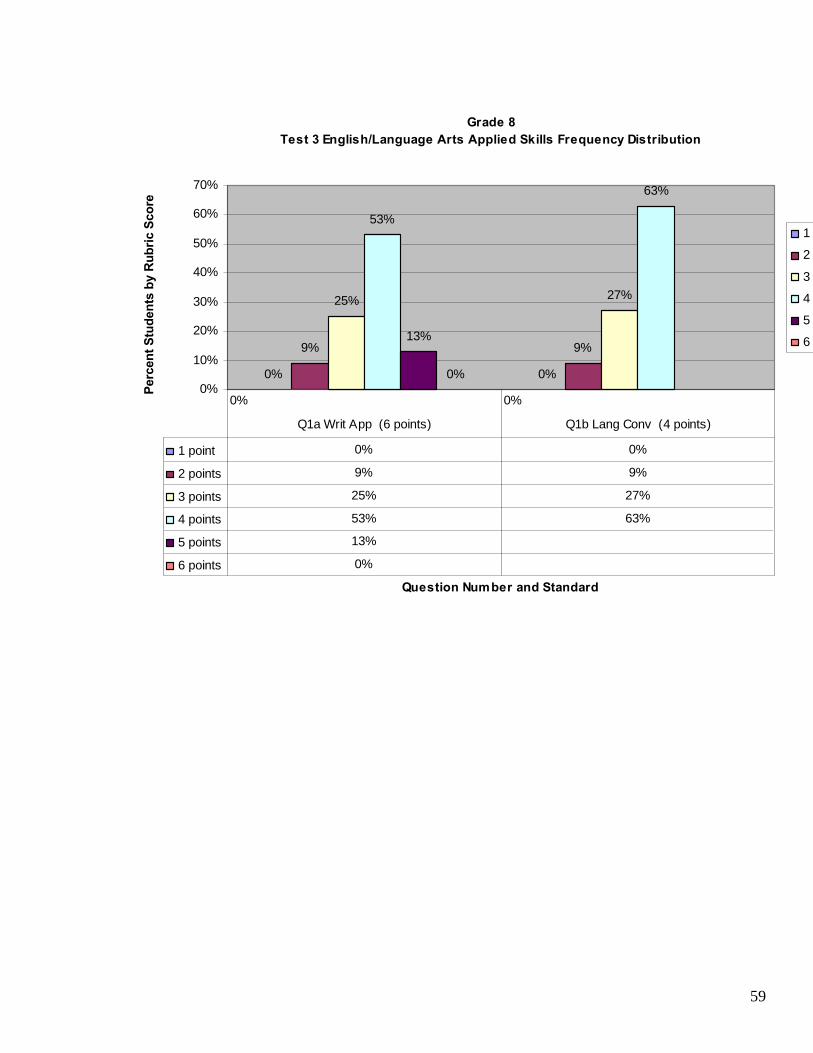
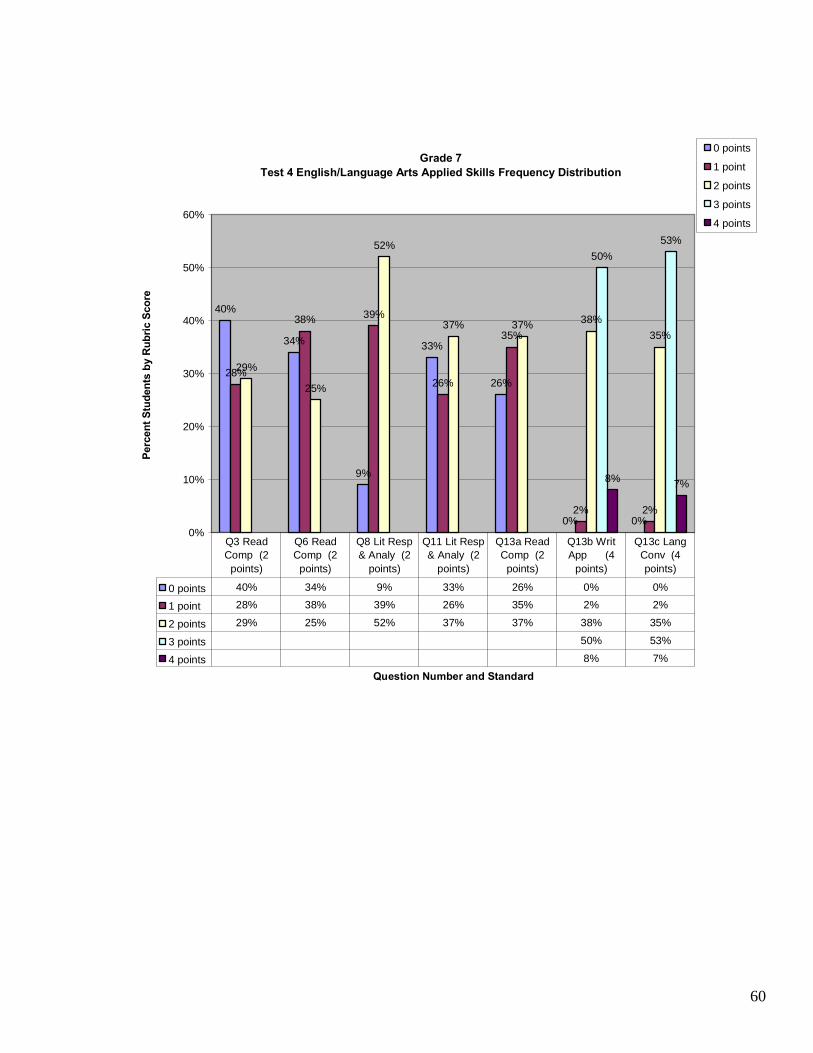
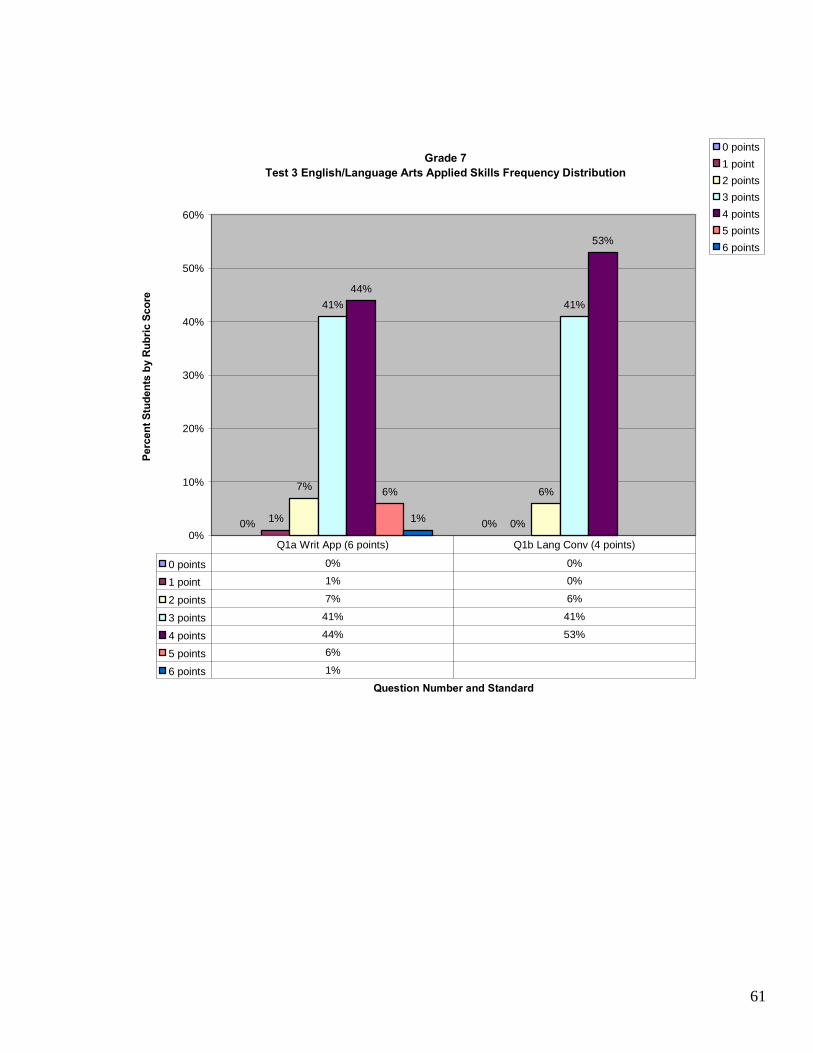
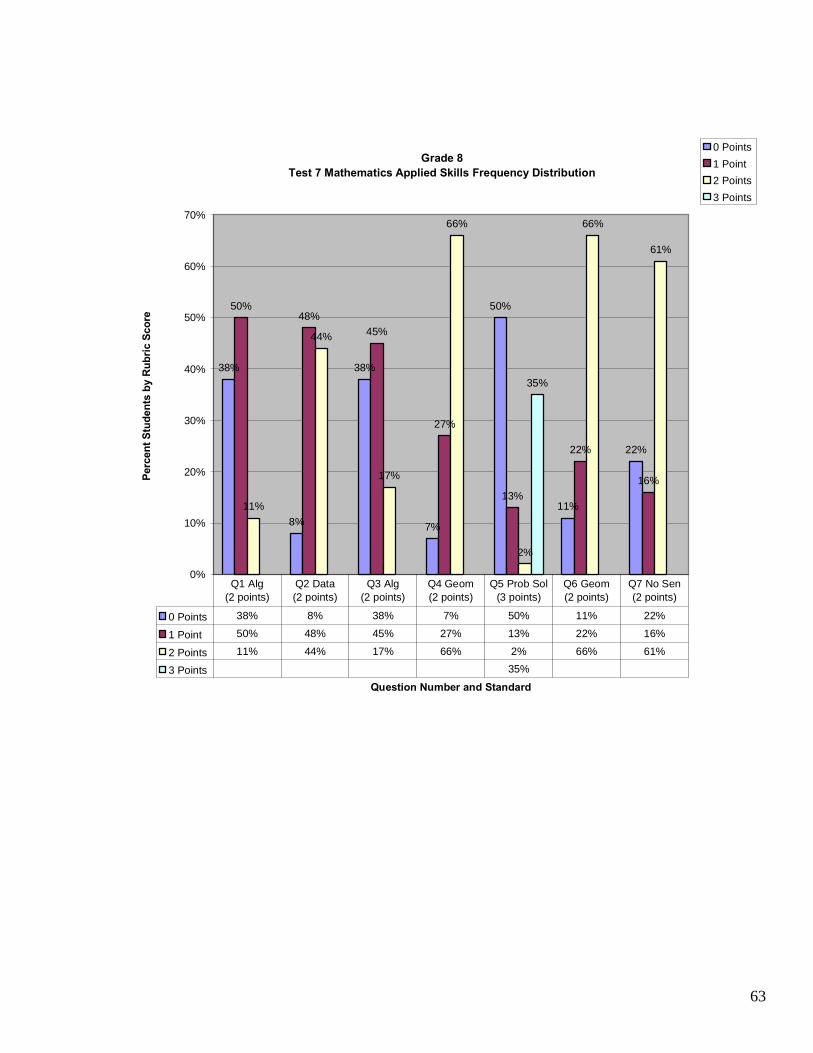
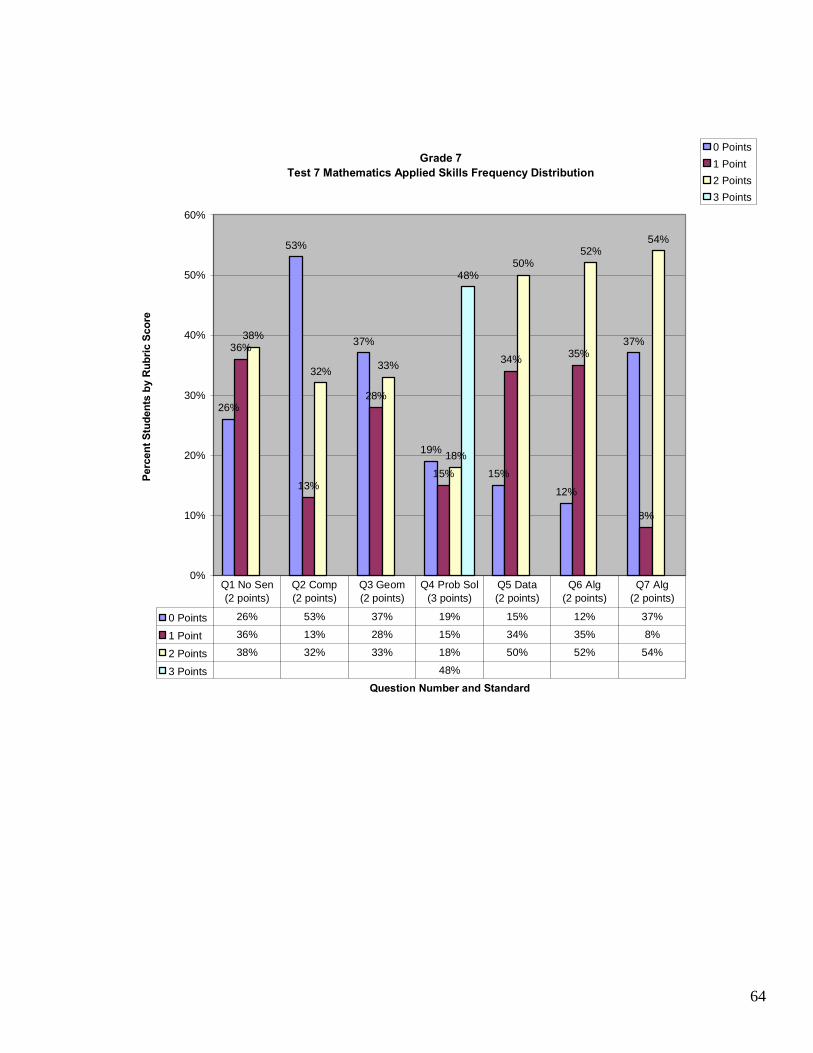
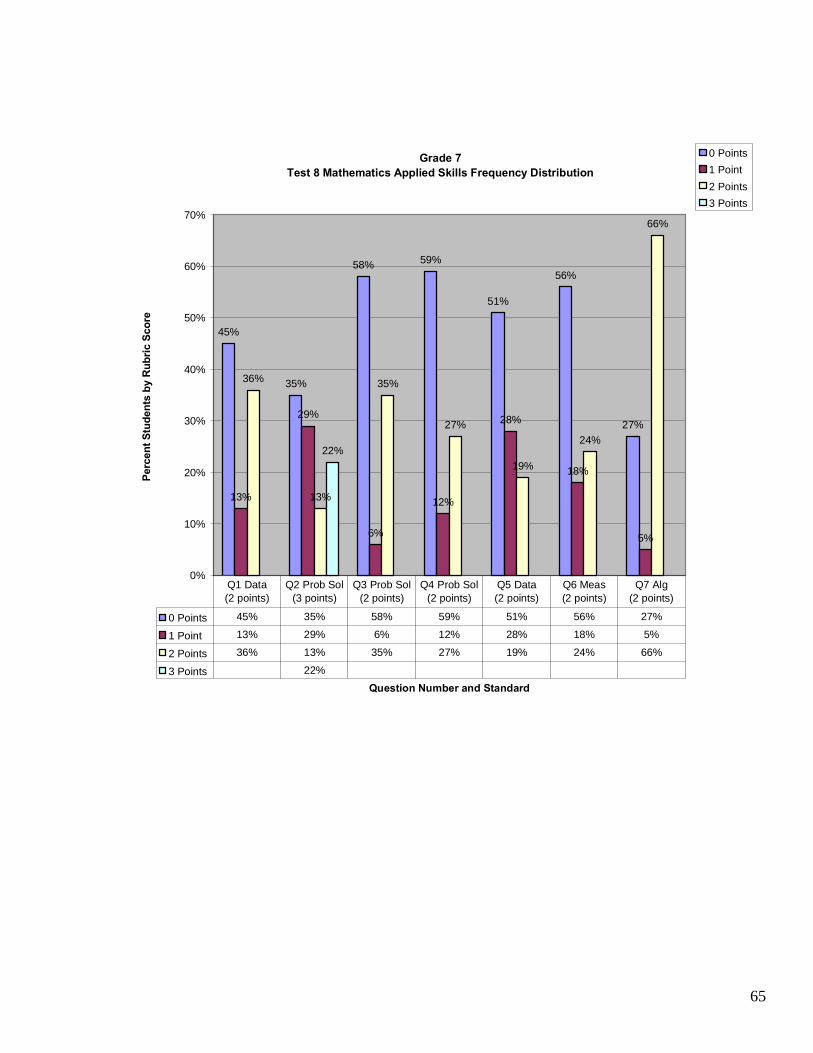
In examining the Applied Skills in English/Language Arts for eighth grade students in test 4 on a scale of 0-2, the largest percentage of students scored 2 points in Reading Comprehension (51%, 73%, and 41%). In writing on a scale of 0-4, in test 4, 10% of the students scored a 4 in Writing Applications. The largest percentage of students scored 3 points (44%). In test 3, on a scale of 1-6, 13% of the students scored 5 points in Writing Applications (pages 58-59). The largest percentage of seventh grade students in test 4 on a scale of 0-2, scored 2 points in the area of Literary Response and Analysis (52%, and 37%). In Writing, in test 4 on a scale of 0-4, 50% of the students scored 3 points and 8% scored 4 points in the area of Writing Applications. Also, 53% scored 3 points and 7% scored 4 points in Language Conventions. No students scored 0 points in either Writing Applications or Language Conventions. On test 3, on a scale of 0-6, 6% of the students scored 5 points and 1% scored 6 points in Writing Applications. No students scored 0 points in either Writing Application or Language Conventions (pages 60-61). In examining the Applied Skills in math for eighth grade students in tests 8 and 7, in Problem Solving students scored 3 points on a rubric scale of 0-3, (18%, 31%, and 35%). However, Problem Solving is one of the only areas where the greatest percentage of students scored 0 points, (50%, 71%, and 49%) (pages 62-63). Seventh grade students scored 3 points on a scale of 0-3 in the Problem Solving area, (22% and 48%). In test 7, Problem Solving is not the area where most of the students scored 0 points, but in test 8, both Problem Solving and Measurement showed over 50% of the students scoring 0 points (page 64-65). Students who qualify for free and reduced lunches generally reflect the same increases and decreases of scores as the total population in Reading, Writing, and Math. The eighth and ninth grade Hispanic population improved in all three areas. The seventh grade scores for the Hispanic and Multi-racial population declined in Reading and Writing, but showed and improvement in Algebra, Geometry, and Data Analysis.
58
Grade 8Test 4 English/Language Arts Applied Skills Frequency Distribution
50%
37%
14%
6%
21%
0% 0%
33%
38%
33%
20%
36%
6% 6%
15%
21%
51%
73%
41%38%
30%
44% 43%
10%
20%
0%
10%
20%
30%
40%
50%
60%
70%
80%
Question Number and Standard
Perc
ent S
tude
nts
by R
ubric
Sco
re0 points1 point2 points3 points4 points
0 points 50% 37% 14% 6% 21% 0% 0%
1 point 33% 38% 33% 20% 36% 6% 6%
2 points 15% 21% 51% 73% 41% 38% 30%
3 points 44% 43%
4 points 10% 20%
Q5 Lit Resp & Analy (2 points)
Q6 Lit Resp & Analy (2 points)
Q9 Read Comp (2
points)
Q11 Read Comp (2
points)
Q13a Read Comp (2
points)
Q13b Writ App (4 points)
Q13c Lang Conv (4
points)
59
Grade 8Test 3 English/Language Arts Applied Skills Frequency Distribution
0% 0%
9% 9%
25% 27%
53%
63%
13%
0%0%
10%
20%
30%
40%
50%
60%
70%
Question Num ber and Standard
Perc
ent S
tude
nts
by R
ubric
Sco
re
1 point
2 points
3 points
4 points
5 points
6 points
1 point 0% 0%
2 points 9% 9%
3 points 25% 27%
4 points 53% 63%
5 points 13%
6 points 0%
0% 0%
Q1a Writ App (6 points) Q1b Lang Conv (4 points)
60
Grade 7Test 4 English/Language Arts Applied Skills Frequency Distribution
40%
34%
9%
33%
26%
0% 0%
28%
38% 39%
26%
35%
2% 2%
29%
25%
52%
37% 37% 38%35%
50%53%
8% 7%
0%
10%
20%
30%
40%
50%
60%
Question Number and Standard
Perc
ent S
tude
nts
by R
ubric
Sco
re0 points
1 point
2 points
3 points
4 points
0 points 40% 34% 9% 33% 26% 0% 0%
1 point 28% 38% 39% 26% 35% 2% 2%
2 points 29% 25% 52% 37% 37% 38% 35%
3 points 50% 53%
4 points 8% 7%
Q3 Read Comp (2
points)
Q6 Read Comp (2
points)
Q8 Lit Resp & Analy (2
points)
Q11 Lit Resp & Analy (2
points)
Q13a Read Comp (2
points)
Q13b Writ App (4
points)
Q13c Lang Conv (4 points)
61
Grade 7Test 3 English/Language Arts Applied Skills Frequency Distribution
0% 0%1% 0%
7% 6%
41% 41%44%
53%
6%
1%0%
10%
20%
30%
40%
50%
60%
Question Number and Standard
Perc
ent S
tude
nts
by R
ubric
Sco
re0 points1 point2 points3 points4 points5 points6 points
0 points 0% 0%
1 point 1% 0%
2 points 7% 6%
3 points 41% 41%
4 points 44% 53%
5 points 6%
6 points 1%
Q1a Writ App (6 points) Q1b Lang Conv (4 points)

62
Grade 8Test 8 Mathematics Applied Skills Frequency Distribution
45%
71%
35%
49%
70%
42%
54%
2%5%
35%
16%
0%
34%
2%
53%
4%
30%
3%
27%
23%
42%
18%
31%
0%
10%
20%
30%
40%
50%
60%
70%
80%
Question Number and Standard
Perc
ent S
tude
nts
by R
ubric
Sco
re0 Points1 Point2 Points3 Points
0 Points 45% 71% 35% 49% 70% 42% 54%
1 Point 2% 5% 35% 16% 0% 34% 2%
2 Points 53% 4% 30% 3% 27% 23% 42%
3 Points 18% 31%
Q1 Alg (2 points)
Q2 Prob Sol (3 points)
Q3 Data (2 points)
Q4 Prob Sol (3 points)
Q5 Meas (2 points)
Q6 Prob Sol (2 points)
Q7 Meas (2 points)
63
Grade 8Test 7 Mathematics Applied Skills Frequency Distribution
38%
8%
38%
7%
50%
11%
22%
50%48%
45%
27%
13%
22%
16%
11%
44%
17%
66%
2%
66%
61%
35%
0%
10%
20%
30%
40%
50%
60%
70%
Question Number and Standard
Perc
ent S
tude
nts
by R
ubric
Sco
re0 Points1 Point2 Points3 Points
0 Points 38% 8% 38% 7% 50% 11% 22%
1 Point 50% 48% 45% 27% 13% 22% 16%
2 Points 11% 44% 17% 66% 2% 66% 61%
3 Points 35%
Q1 Alg (2 points)
Q2 Data (2 points)
Q3 Alg (2 points)
Q4 Geom (2 points)
Q5 Prob Sol (3 points)
Q6 Geom (2 points)
Q7 No Sen (2 points)
64
Grade 7Test 7 Mathematics Applied Skills Frequency Distribution
26%
53%
37%
19%
15%
12%
37%36%
13%
28%
15%
34% 35%
8%
38%
32% 33%
18%
50%52%
54%
48%
0%
10%
20%
30%
40%
50%
60%
Question Number and Standard
Perc
ent S
tude
nts
by R
ubric
Sco
re0 Points1 Point2 Points3 Points
0 Points 26% 53% 37% 19% 15% 12% 37%
1 Point 36% 13% 28% 15% 34% 35% 8%
2 Points 38% 32% 33% 18% 50% 52% 54%
3 Points 48%
Q1 No Sen (2 points)
Q2 Comp (2 points)
Q3 Geom (2 points)
Q4 Prob Sol (3 points)
Q5 Data (2 points)
Q6 Alg (2 points)
Q7 Alg (2 points)
65
Grade 7Test 8 Mathematics Applied Skills Frequency Distribution
45%
35%
58% 59%
51%
56%
27%
13%
29%
6%
12%
28%
18%
5%
36%
13%
35%
27%
19%
24%
66%
22%
0%
10%
20%
30%
40%
50%
60%
70%
Question Number and Standard
Perc
ent S
tude
nts
by R
ubric
Sco
re0 Points1 Point2 Points3 Points
0 Points 45% 35% 58% 59% 51% 56% 27%
1 Point 13% 29% 6% 12% 28% 18% 5%
2 Points 36% 13% 35% 27% 19% 24% 66%
3 Points 22%
Q1 Data (2 points)
Q2 Prob Sol (3 points)
Q3 Prob Sol (2 points)
Q4 Prob Sol (2 points)
Q5 Data (2 points)
Q6 Meas (2 points)
Q7 Alg (2 points)

66
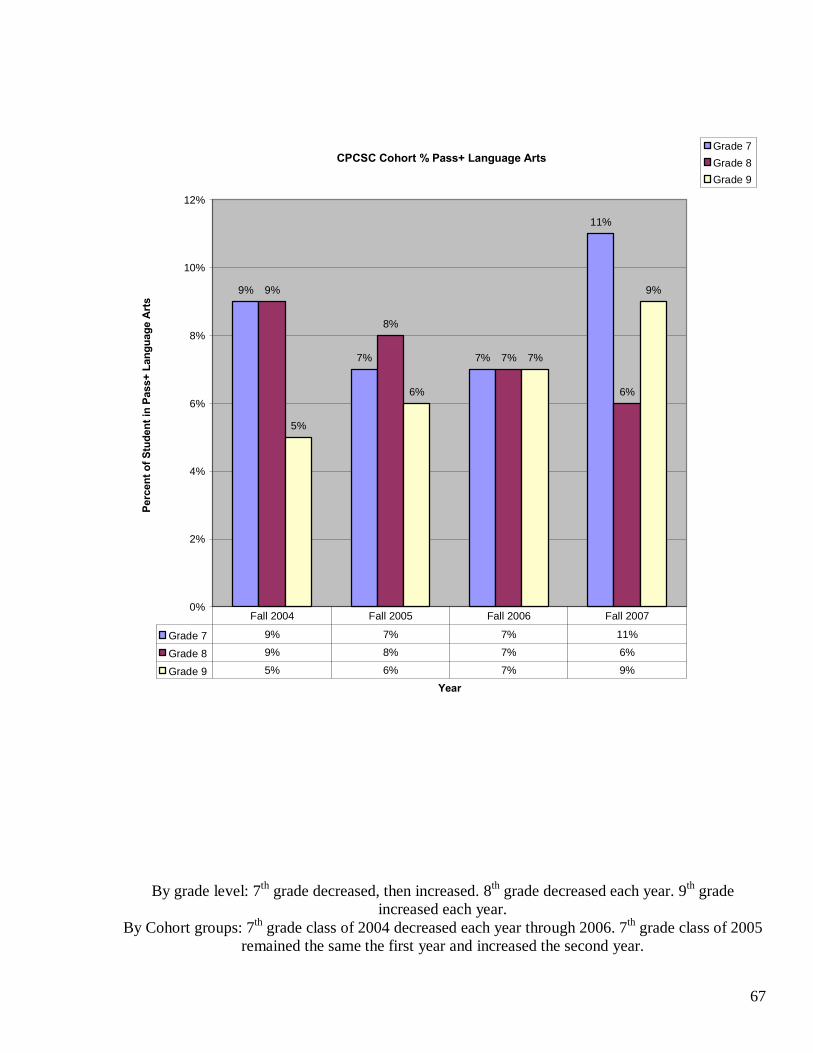
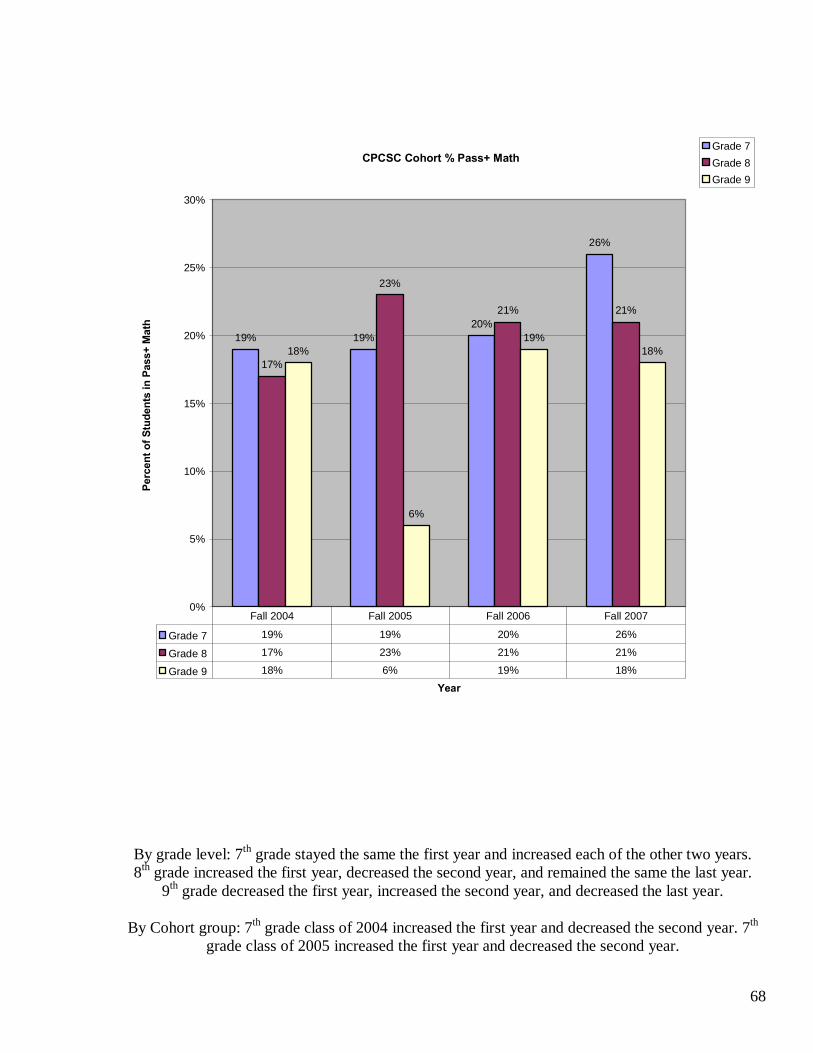
ISTEP+ /PASS+ SCORES (2004-2007) In English/Language Arts there are 2% more seventh grade students and 4% more ninth grade students scoring in the Pass+ range. However, the number of eighth grade students in the Pass+ category declined by 3% (page 67). In math there are 7% more seventh grade students and 4% more eighth grade students scoring in the Pass+ range. The percentage of ninth grade students in the Pass+ category remained the same (page 68).
67
CPCSC Cohort % Pass+ Language Arts
9%
7% 7%
11%
9%
8%
7%
6%
5%
6%
7%
9%
0%
2%
4%
6%
8%
10%
12%
Year
Perc
ent o
f Stu
dent
in P
ass+
Lan
guag
e A
rts
Grade 7Grade 8Grade 9
Grade 7 9% 7% 7% 11%
Grade 8 9% 8% 7% 6%
Grade 9 5% 6% 7% 9%
Fall 2004 Fall 2005 Fall 2006 Fall 2007
By grade level: 7th grade decreased, then increased. 8th grade decreased each year. 9th grade increased each year.
By Cohort groups: 7th grade class of 2004 decreased each year through 2006. 7th grade class of 2005 remained the same the first year and increased the second year.
68
CPCSC Cohort % Pass+ Math
19% 19%20%
26%
17%
23%
21% 21%
18%
6%
19%18%
0%
5%
10%
15%
20%
25%
30%
Year
Perc
ent o
f Stu
dent
s in
Pas
s+ M
ath
Grade 7Grade 8Grade 9
Grade 7 19% 19% 20% 26%
Grade 8 17% 23% 21% 21%
Grade 9 18% 6% 19% 18%
Fall 2004 Fall 2005 Fall 2006 Fall 2007
By grade level: 7th grade stayed the same the first year and increased each of the other two years. 8th grade increased the first year, decreased the second year, and remained the same the last year.
9th grade decreased the first year, increased the second year, and decreased the last year.
By Cohort group: 7th grade class of 2004 increased the first year and decreased the second year. 7th grade class of 2005 increased the first year and decreased the second year.
69
CTBS-TERRA NOVA SCORES (2003-2006)
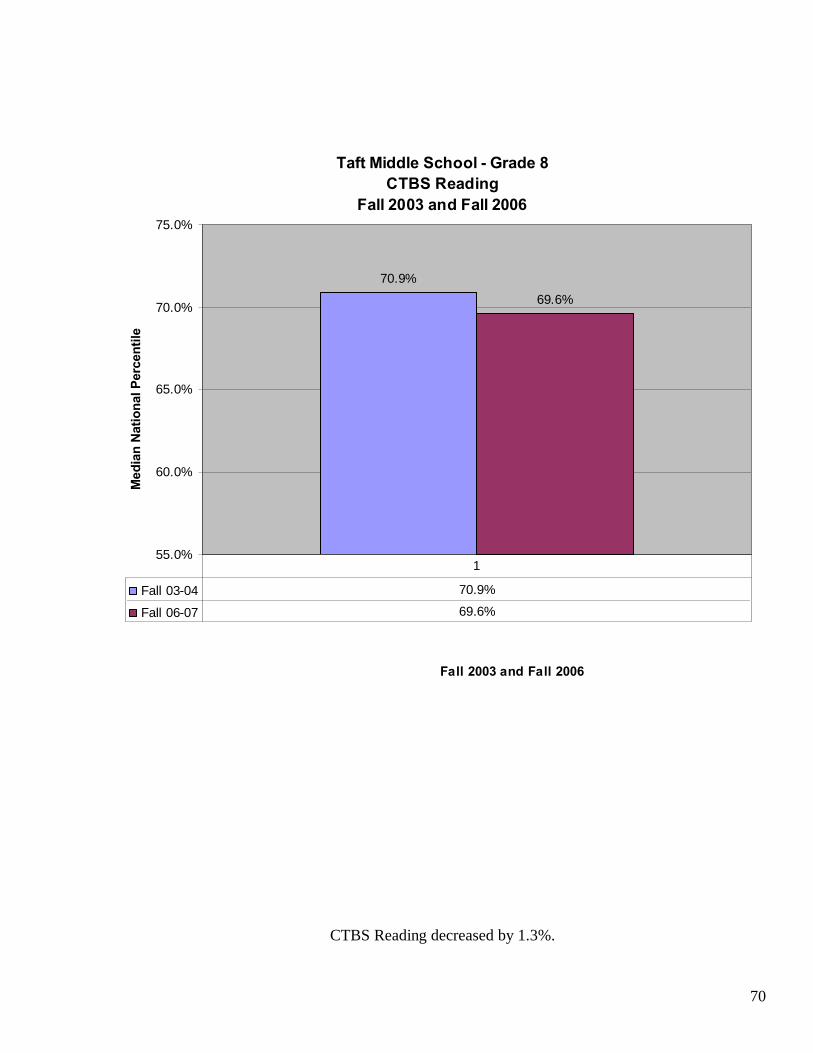
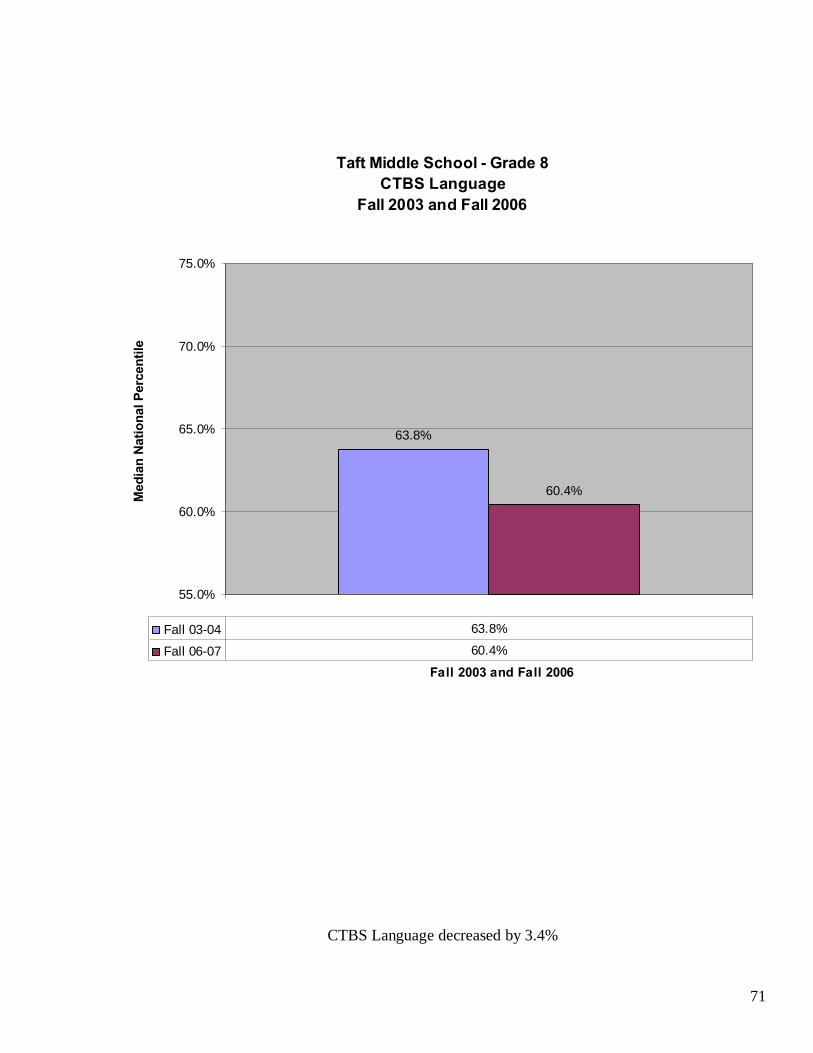
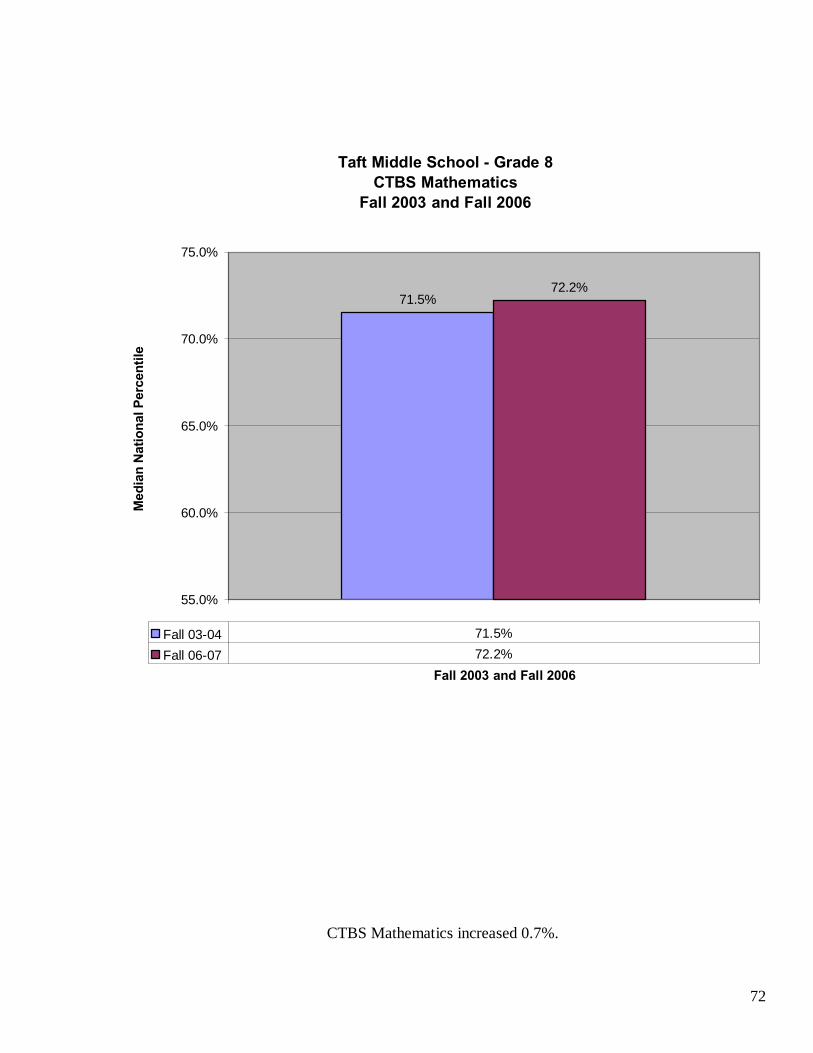
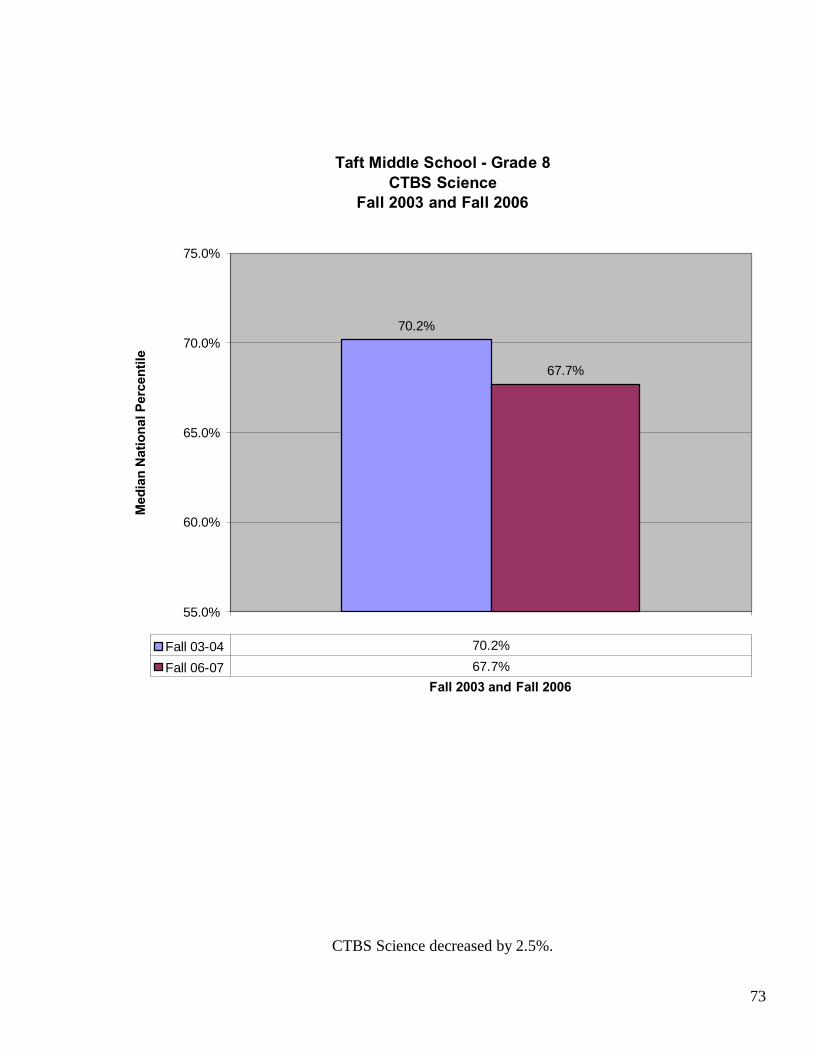
Students in the eighth grade showed a decrease in Reading (1.3%), Language (3.4%), and Science (2.5%), while math scores increased 0.7% (pages 70-73).
70
Taft Middle School - Grade 8CTBS Reading
Fall 2003 and Fall 2006
70.9%69.6%
55.0%
60.0%
65.0%
70.0%
75.0%
Fall 2003 and Fall 2006
Med
ian
Nat
iona
l Per
cent
ile
Fall 03-04 70.9%
Fall 06-07 69.6%
1
CTBS Reading decreased by 1.3%.
71
Taft Middle School - Grade 8CTBS Language
Fall 2003 and Fall 2006
63.8%
60.4%
55.0%
60.0%
65.0%
70.0%
75.0%
Fall 2003 and Fall 2006
Med
ian
Nat
iona
l Per
cent
ile
Fall 03-04 63.8%
Fall 06-07 60.4%
CTBS Language decreased by 3.4%
72
Taft Middle School - Grade 8CTBS Mathematics
Fall 2003 and Fall 2006
71.5%72.2%
55.0%
60.0%
65.0%
70.0%
75.0%
Fall 2003 and Fall 2006
Med
ian
Nat
iona
l Per
cent
ile
Fall 03-04 71.5%
Fall 06-07 72.2%
CTBS Mathematics increased 0.7%.
73
Taft Middle School - Grade 8CTBS Science
Fall 2003 and Fall 2006
70.2%
67.7%
55.0%
60.0%
65.0%
70.0%
75.0%
Fall 2003 and Fall 2006
Med
ian
Nat
iona
l Per
cent
ile
Fall 03-04 70.2%
Fall 06-07 67.7%
CTBS Science decreased by 2.5%.
74
LOCAL ASSESMENT-READING AND WRITING SCORES (SPRING 2004 TO 2007)
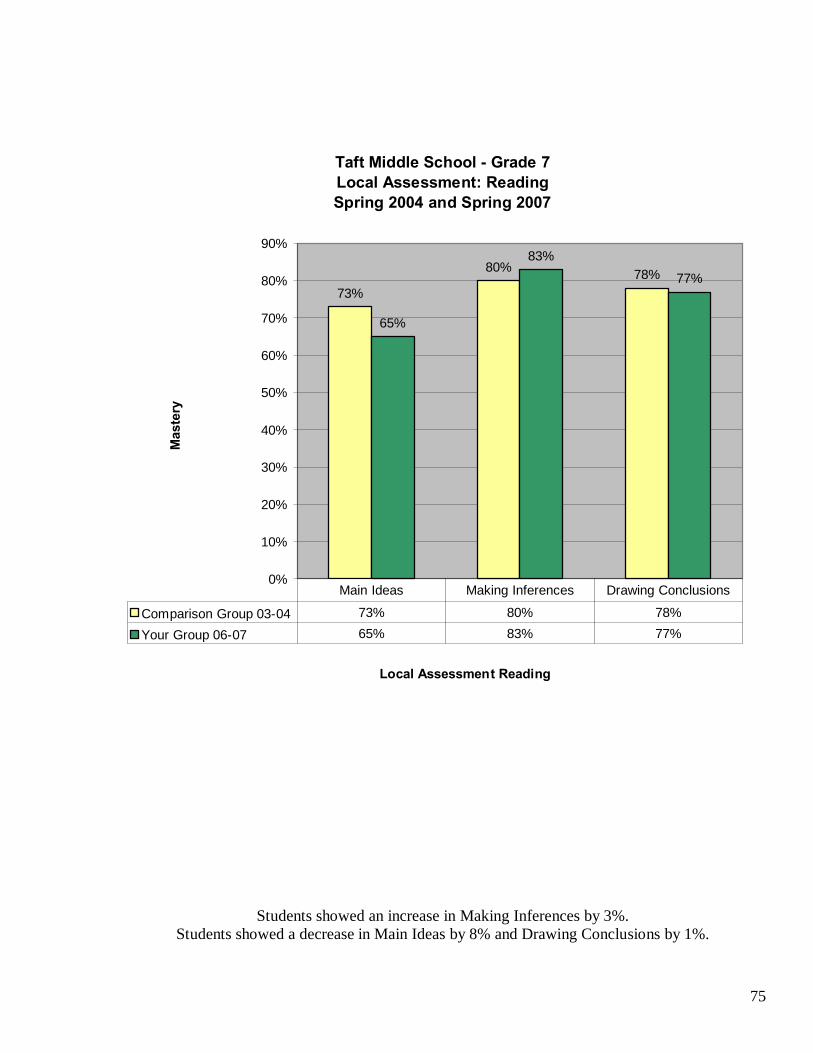
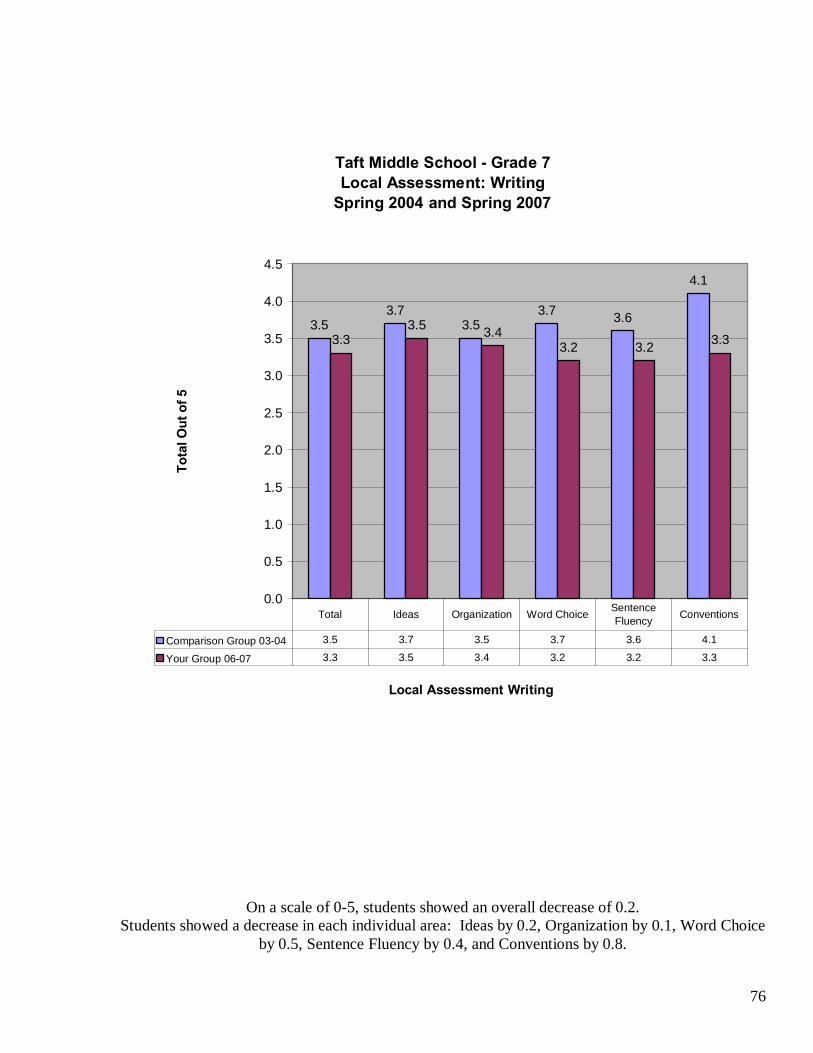
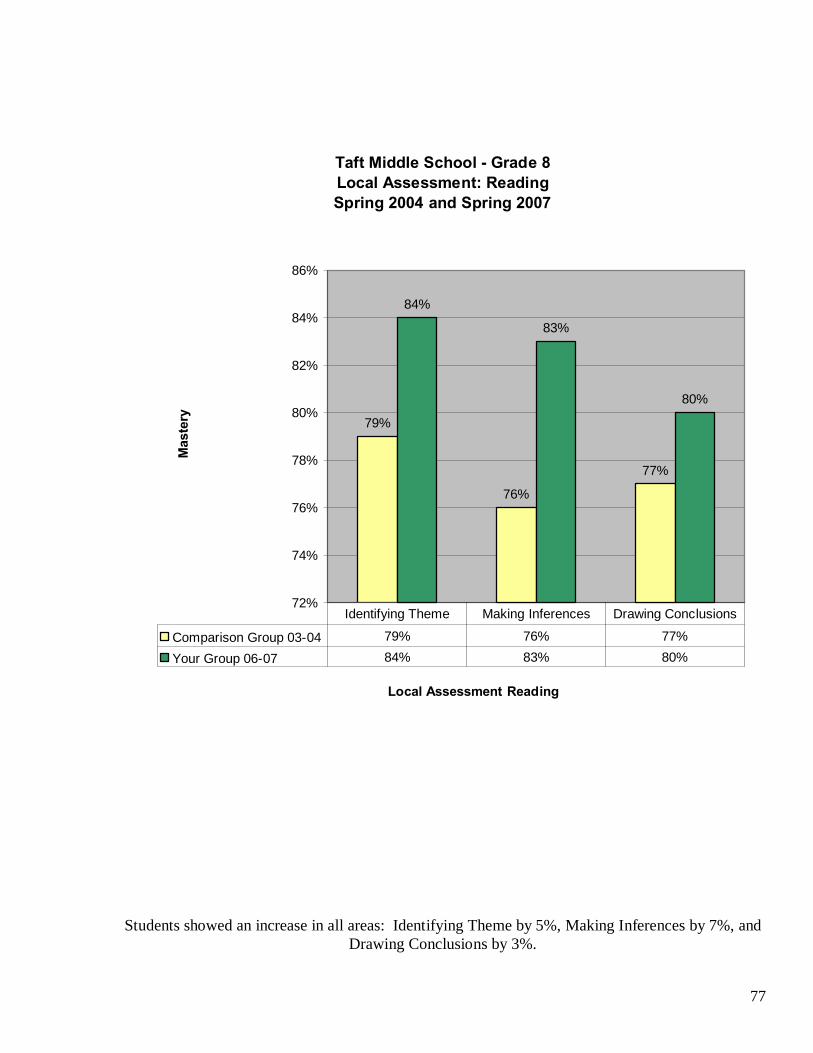
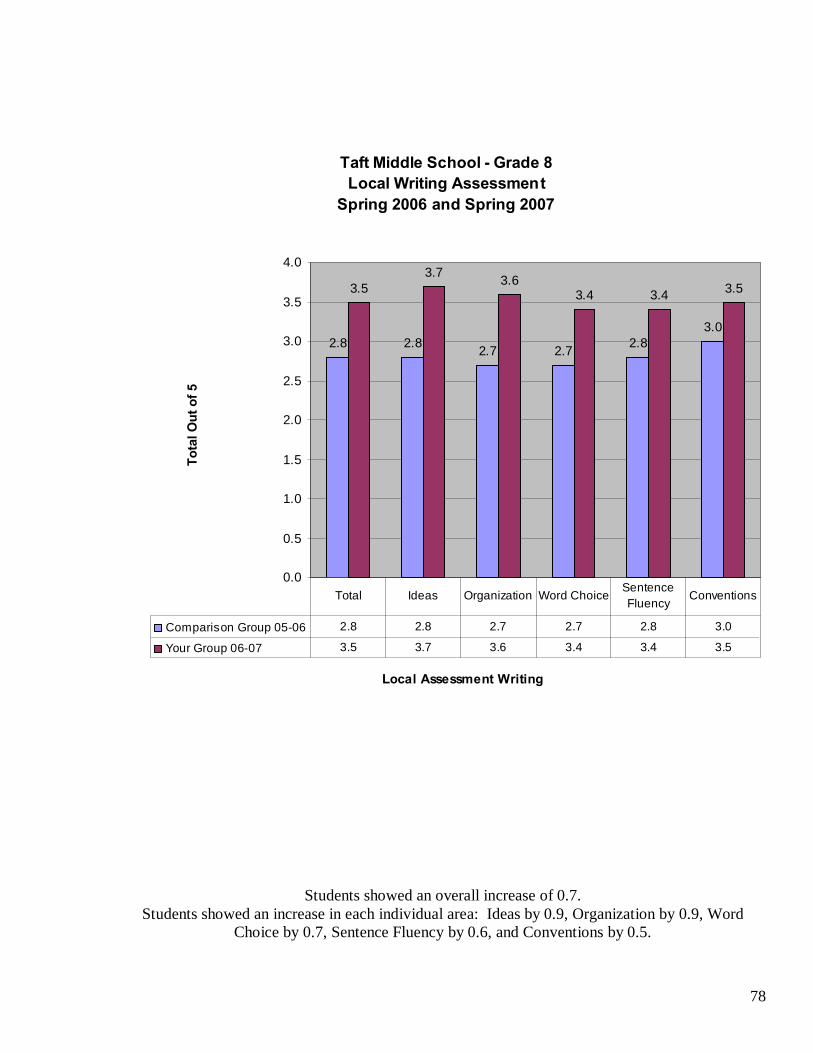
Students in the seventh and eighth grade participated in Local Reading and Writing Assessments. The seventh grade Local Reading Scores declined in the areas of Main Ideas (8%), and Drawing Conclusions (1%), but improved in the area of Making Inferences (3%). In the area of Writing, the seventh grade students showed an overall decrease (0.2) on a scale of 0 to 5 (pages 75-76). Students in the eighth grade improved substantially in all three areas of the Local Reading Scores: Identifying Themes (5%), Making Inferences (7%), and Drawing Conclusions (3%). In the area of Writing, the eighth grade students showed an overall increase of (0.7) on a scale of 0 to 5 (pages 77-78).
75
Taft Middle School - Grade 7Local Assessment: ReadingSpring 2004 and Spring 2007
73%
80% 78%
65%
83%
77%
0%
10%
20%
30%
40%
50%
60%
70%
80%
90%
Local Assessment Reading
Mas
tery
Comparison Group 03-04 73% 80% 78%
Your Group 06-07 65% 83% 77%
Main Ideas Making Inferences Drawing Conclusions
Students showed an increase in Making Inferences by 3%. Students showed a decrease in Main Ideas by 8% and Drawing Conclusions by 1%.
76
Taft Middle School - Grade 7Local Assessment: Writing
Spring 2004 and Spring 2007
3.53.7
3.53.7 3.6
4.1
3.33.5 3.4
3.2 3.2 3.3
0.0
0.5
1.0
1.5
2.0
2.5
3.0
3.5
4.0
4.5
Local Assessment Writing
Tota
l Out
of 5
Comparison Group 03-04 3.5 3.7 3.5 3.7 3.6 4.1
Your Group 06-07 3.3 3.5 3.4 3.2 3.2 3.3
Total Ideas Organization Word Choice Sentence Fluency Conventions
On a scale of 0-5, students showed an overall decrease of 0.2. Students showed a decrease in each individual area: Ideas by 0.2, Organization by 0.1, Word Choice
by 0.5, Sentence Fluency by 0.4, and Conventions by 0.8.
77
Taft Middle School - Grade 8Local Assessment: ReadingSpring 2004 and Spring 2007
79%
76%
77%
84%
83%
80%
72%
74%
76%
78%
80%
82%
84%
86%
Local Assessment Reading
Mas
tery
Comparison Group 03-04 79% 76% 77%
Your Group 06-07 84% 83% 80%
Identifying Theme Making Inferences Drawing Conclusions
Students showed an increase in all areas: Identifying Theme by 5%, Making Inferences by 7%, and Drawing Conclusions by 3%.
78
Taft Middle School - Grade 8Local Writing Assessment
Spring 2006 and Spring 2007
2.8 2.8 2.7 2.7 2.83.0
3.53.7 3.6
3.4 3.4 3.5
0.0
0.5
1.0
1.5
2.0
2.5
3.0
3.5
4.0
Local Assessment Writing
Tota
l Out
of 5
Comparison Group 05-06 2.8 2.8 2.7 2.7 2.8 3.0
Your Group 06-07 3.5 3.7 3.6 3.4 3.4 3.5
Total Ideas Organization Word ChoiceSentence Fluency
Conventions
Students showed an overall increase of 0.7. Students showed an increase in each individual area: Ideas by 0.9, Organization by 0.9, Word
Choice by 0.7, Sentence Fluency by 0.6, and Conventions by 0.5.
79
School Data • Information that documents aspects of the school (page 80). • Information and data on teacher instructional practices used and hours of professional
development (page 81). • Taft’s instructional strategies support the achievement of Indiana Academic
Standards (page 82) Student online survey #5 (page 83) Student online survey #14 (page 84)
• Information and data on technology used by students and teachers. Student views on technology (page 85). Students access to technology (page 86). My Skills Tutor (page 87).
• Perception data about school effectiveness Current student survey (page 88). Former student survey (page 91). Staff survey (page 94). Staff survey-Increasing student achievement (page 99). • Local Time on Task survey (page 103) • Records Grade distribution (page 105). Advanced course work in teacher’s content area and number of Taft staff with advanced course work v/s Bachelor’s (page 106).
80
INFORMATION THAT DOCUMENTS ASPECTS OF THE SCHOOL
English/Language Arts- seventh and eighth grade students have a second set of textbooks available to them at home. In addition to the textbook, one online essay is given once a school year using a designated writing prompt. One “Understanding by Design” reading and writing assessment is also given to students annually. The media center has a large collection of Accelerated Reader books for students to use during sustained, silent reading. Mathematics- seventh and eighth grade students have a second set of textbooks available to them at home. Textbooks are also online. Math assessments are given to all students every grading period. Science- seventh and eighth grade students have a second set of textbooks available to them at home. An online talking book is also available to seventh and eighth grade students. All students are assessed by units that include the Indiana Academic State Standards. Social Studies- seventh and eighth grade students have a second set of textbooks available to them at home. Eighth grade students are assessed twice a school year with a performance task. Sixth and seventh grade students are assessed once a school year. “Clues to Effective Writing”- Student writing manual that reviews the writing process and the 6+1 Trait Writing rubric. It provides revising, editing, proof reading tips, suggestions for improving word choice, punctuation, and capitalization. “Wild Over Writing”- (WOW) is a writing manual for teachers that shows in a step by step fashion how ideas from a graphic organizer can become a topic sentence for a five-sentence paragraph. Through the addition of details, this five-sentence paragraph can be expanded to an eight-sentence paragraph. This eight-sentence paragraph can be developed into a five-paragraph essay. Templates for each of the paragraphs are presented and can be given to students to use. My Skills Tutor- A web-based tutorial/enhancement program that provides pre-tests, lessons, and post-tests in the area of reading, writing, critical thinking, science, social studies, math, and study skills. Students are given a pre-test that contains a list of multiple choice questions. Lessons are prescribed in areas in which the student struggled. Upon completion of the lessons, post-tests are provided and may be taken multiple times.
81
INFORMATION AND DATA ON TEACHER INSTRUCTIONAL PRACTICES USED AND HOURS OF
PROFESSIONAL DEVELOPMENT
Classroom observations support the conclusion that staff members have an awareness of current best practice and make a strong effort to employ these research based strategies in their lessons.
Some of these strategies include cooperative learning, student choice, hands-on activities, active learning, greater emphasis on critical thinking, greater use of primary sources, and more diverse roles for teachers. The movement is away from teacher centered learning to student centered learning that is exploratory (learning from doing vs. hearing about it).
Taft teachers completed 332 hours of professional development during the 2006-07 academic year. During the 2007-08 academic year, teachers completed 357 hours of training. This work was in support of the school improvement goals for Robert A. Taft Middle School.
82
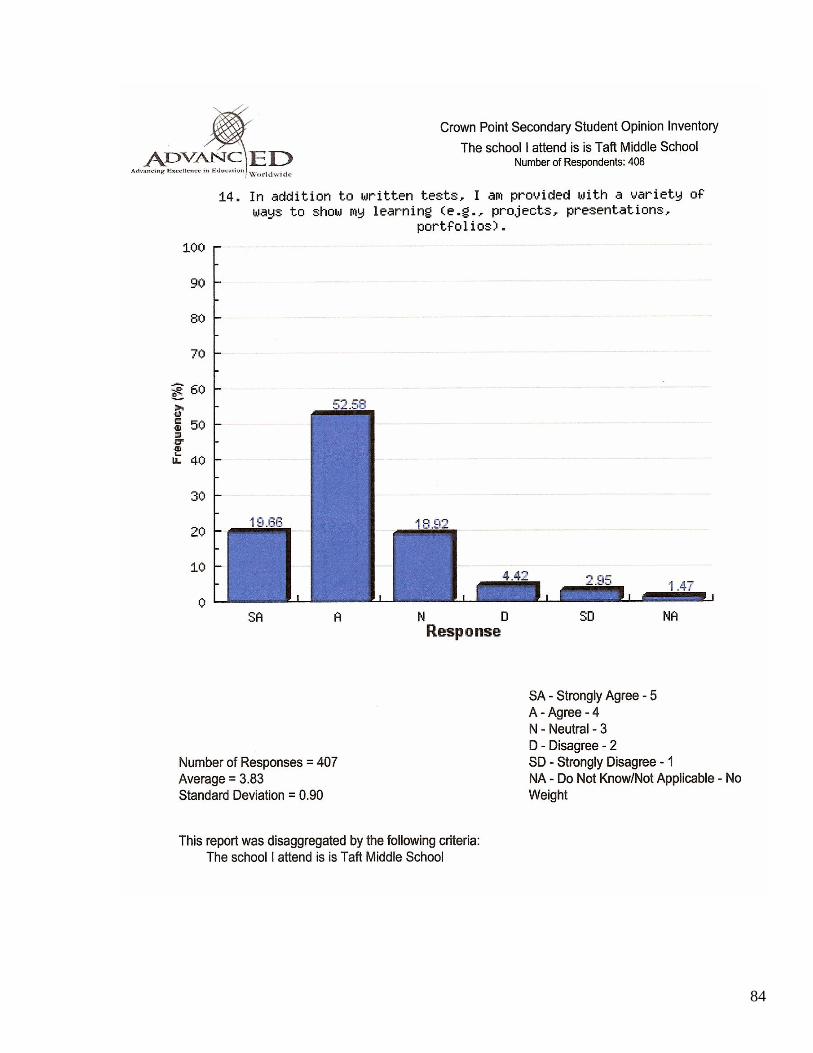
TAFT INSTRUCTIONAL STRATEGIES Taft Middle School’s instructional strategies support achievement of the Indiana Academic Standards through a variety of ways. According to the Time on Task Survey, teachers spend the greatest amounts of time on cooperative learning, lecturing, and problem solving/critical thinking strategies. Students agree that their teachers use a variety of these strategies and learning activities in the classroom to help them learn. Students also agree that in addition to written tests, they are provided with a variety of ways to show their learning (i.e. projects, presentations, and portfolios) (pages 83-84).
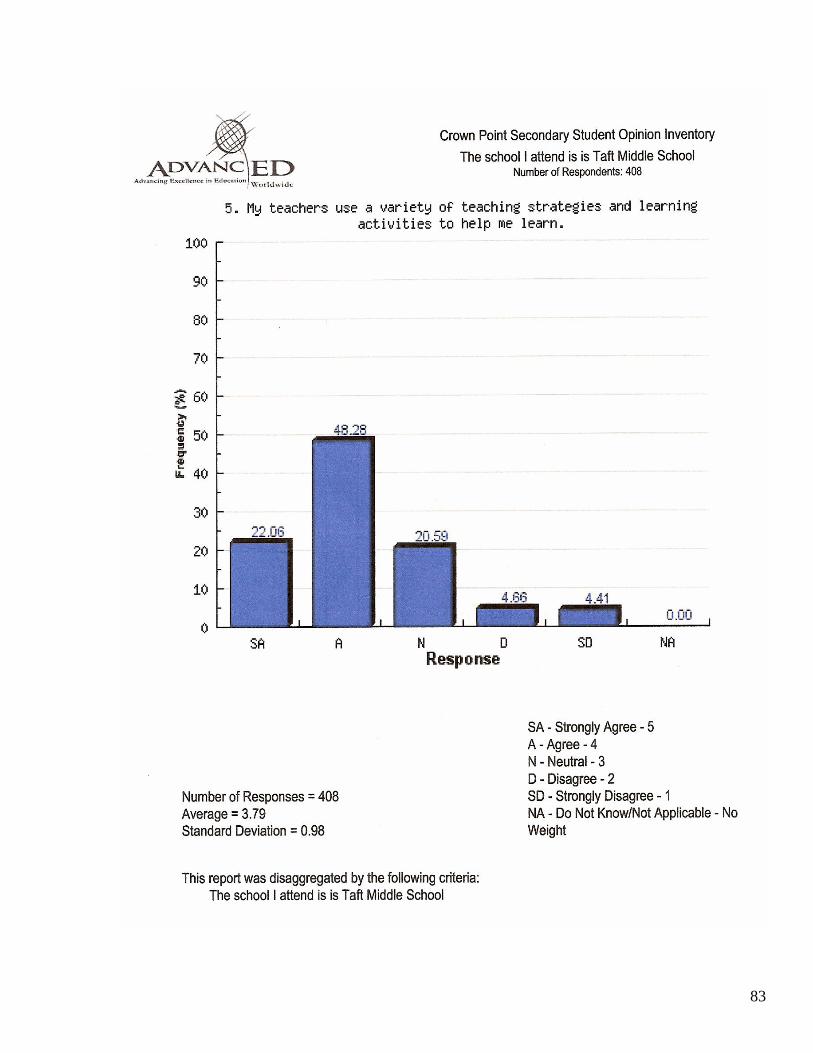
83
84
85
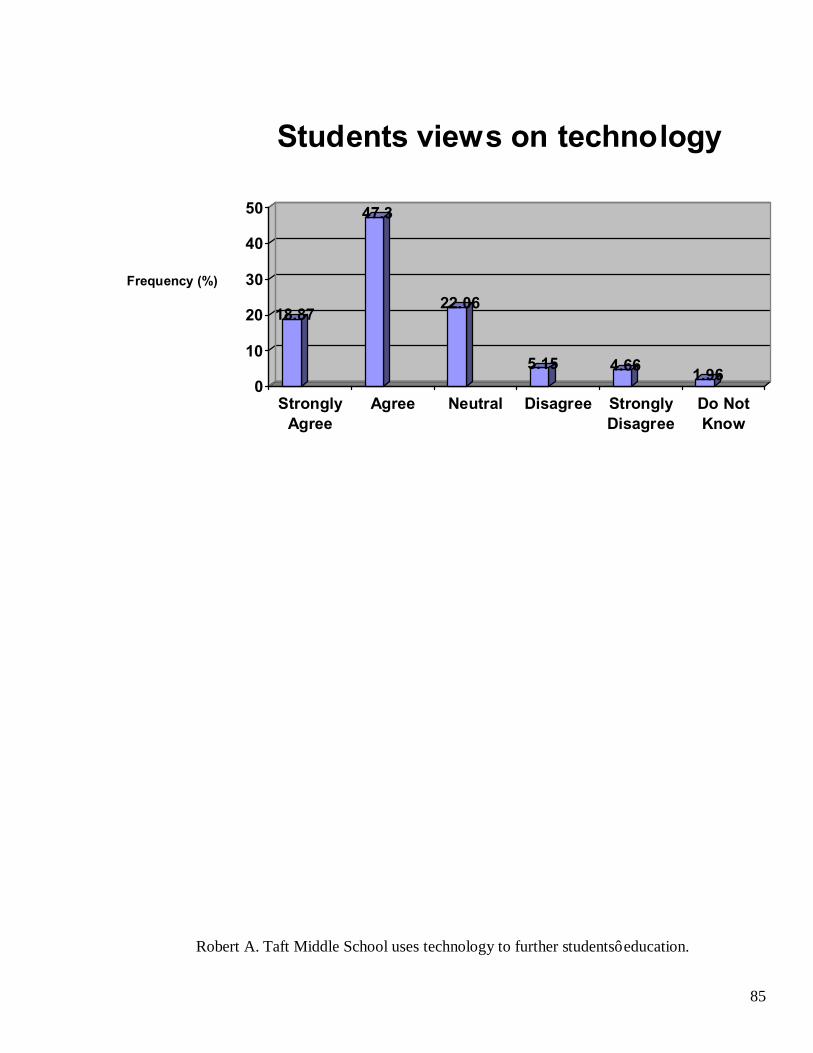
18.87
47.3
22.06
5.15 4.66 1.960
10
20
30
40
50
Frequency (%)
StronglyAgree
Agree Neutral Disagree StronglyDisagree
Do NotKnow
Students views on technology
Robert A. Taft Middle School uses technology to further students’ education.
86
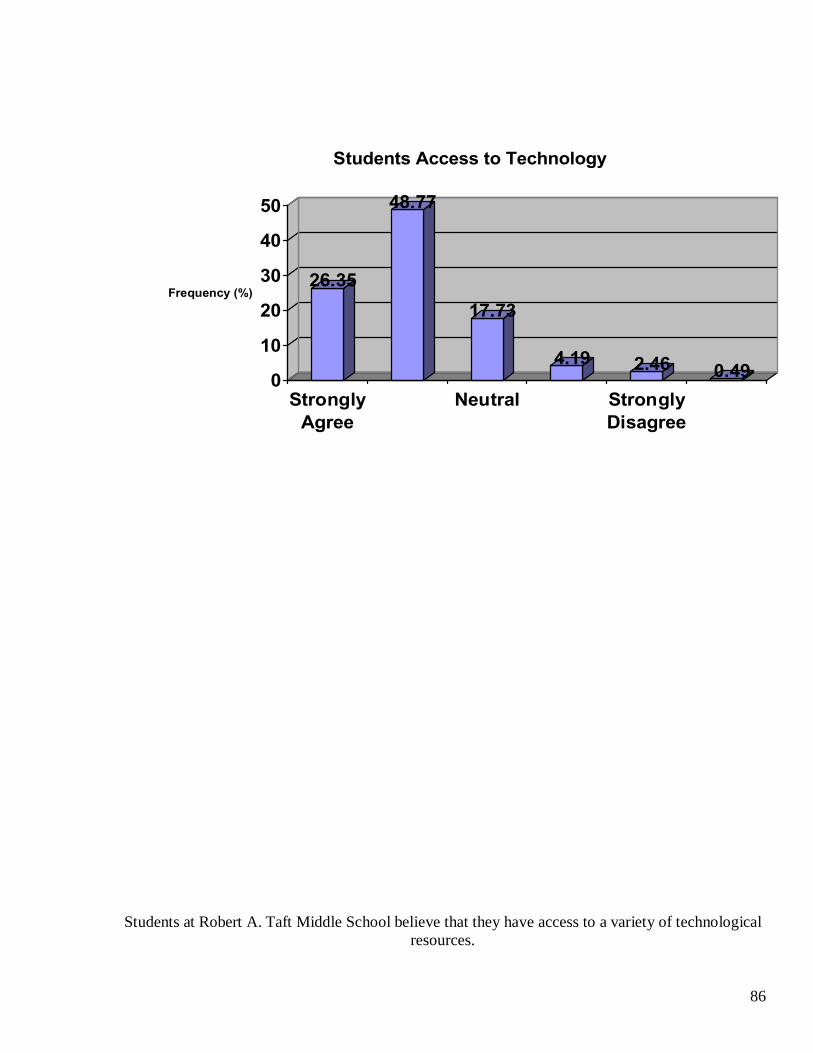
26.35
48.77
17.73
4.19 2.46 0.490
10
20
30
40
50
Frequency (%)
StronglyAgree
Neutral StronglyDisagree
Students Access to Technology
Students at Robert A. Taft Middle School believe that they have access to a variety of technological
resources.
87
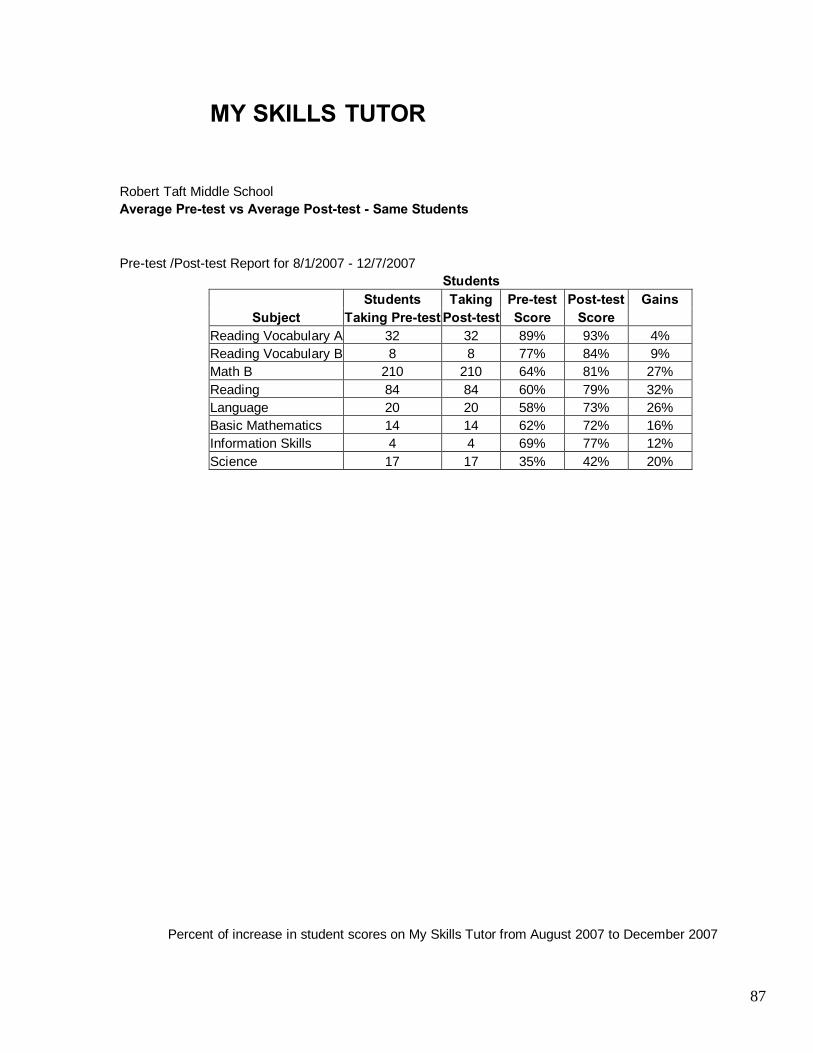
MY SKILLS TUTOR Robert Taft Middle School Average Pre-test vs Average Post-test - Same Students Pre-test /Post-test Report for 8/1/2007 - 12/7/2007 Students Students Taking Pre-test Post-test Gains Subject Taking Pre-test Post-test Score Score Reading Vocabulary A 32 32 89% 93% 4% Reading Vocabulary B 8 8 77% 84% 9% Math B 210 210 64% 81% 27% Reading 84 84 60% 79% 32% Language 20 20 58% 73% 26% Basic Mathematics 14 14 62% 72% 16% Information Skills 4 4 69% 77% 12% Science 17 17 35% 42% 20%
Percent of increase in student scores on My Skills Tutor from August 2007 to December 2007
88
CURRENT STUDENT SURVEY In the fall of 2007 sixth, seventh, and eighth grade students were surveyed during their Skill Enhancement class. Because the survey was done at school, 100% of the surveys were returned Students overwhelmingly like their classes at Taft and feel challenged in their classes. Most students agree that the elementary schools prepared them for the transition to Taft. Students agree that they have the opportunity to improve their reading and writing skills in each class and view class size as appropriate for the middle school. They overwhelmingly agree that teachers use a variety of ways to teach, and feel that core and encore teachers work together to show how subjects are connected. Students feel that technology helps them to learn and are happy with the books the media center provides (page 89). Most students like the middle school philosophy, programs, and teaming. They feel safe at school, but not as many students feel parental involvement is encouraged at Taft (page 90). Students feel that positive behavior is recognized and rewarded and that their emotional needs are being met. Students agree that social opportunities are provided at Taft and that Taft’s extra curricular offerings meet their needs. A large number of sixth grade students feel that the student agenda book is helpful in keeping themselves organized and is a good communication tool between parents and teachers, while a larger number of seventh and eighth grade students do not agree with either statement. All students agree that the homework hotline is a useful tool in communicating information.
89
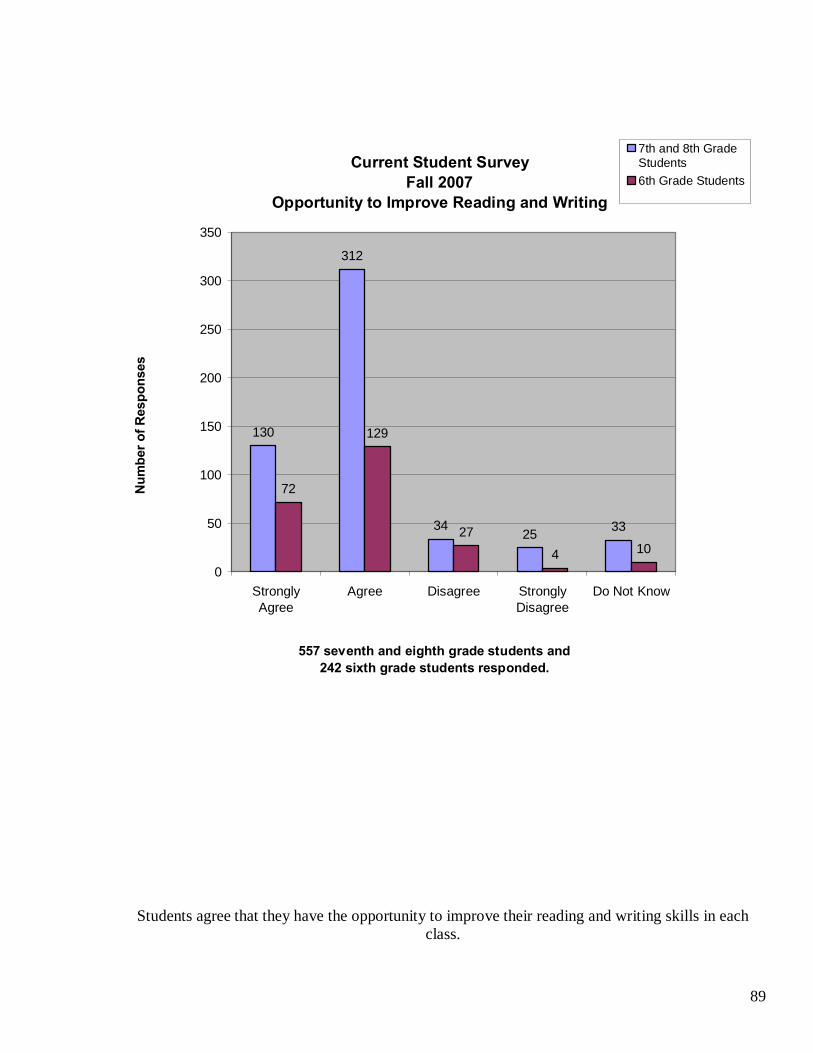
Current Student SurveyFall 2007
Opportunity to Improve Reading and Writing
130
312
3425 33
72
129
27
4 10
0
50
100
150
200
250
300
350
StronglyAgree
Agree Disagree StronglyDisagree
Do Not Know
557 seventh and eighth grade students and242 sixth grade students responded.
Num
ber o
f Res
pons
es7th and 8th GradeStudents6th Grade Students
Students agree that they have the opportunity to improve their reading and writing skills in each class.
90
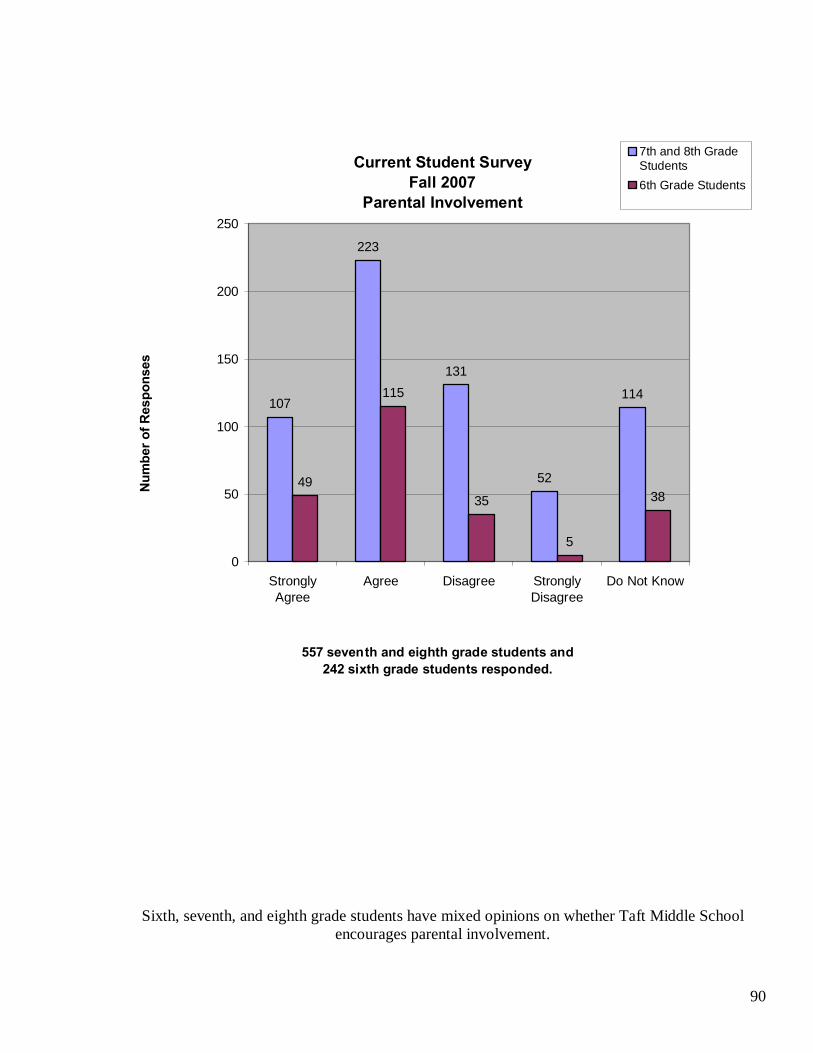
Current Student SurveyFall 2007
Parental Involvement
107
223
131
52
114
49
115
35
5
38
0
50
100
150
200
250
StronglyAgree
Agree Disagree StronglyDisagree
Do Not Know
557 seventh and eighth grade students and242 sixth grade students responded.
Num
ber o
f Res
pons
es7th and 8th GradeStudents6th Grade Students
Sixth, seventh, and eighth grade students have mixed opinions on whether Taft Middle School encourages parental involvement.
91
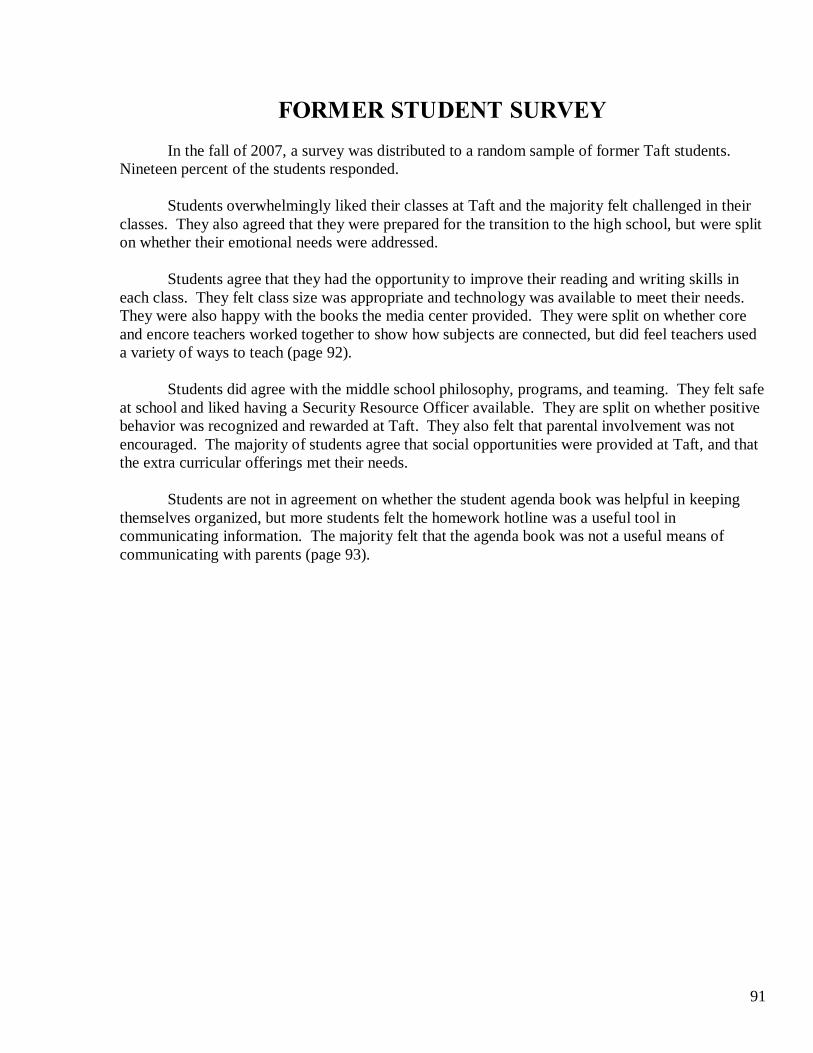
FORMER STUDENT SURVEY In the fall of 2007, a survey was distributed to a random sample of former Taft students. Nineteen percent of the students responded. Students overwhelmingly liked their classes at Taft and the majority felt challenged in their classes. They also agreed that they were prepared for the transition to the high school, but were split on whether their emotional needs were addressed. Students agree that they had the opportunity to improve their reading and writing skills in each class. They felt class size was appropriate and technology was available to meet their needs. They were also happy with the books the media center provided. They were split on whether core and encore teachers worked together to show how subjects are connected, but did feel teachers used a variety of ways to teach (page 92). Students did agree with the middle school philosophy, programs, and teaming. They felt safe at school and liked having a Security Resource Officer available. They are split on whether positive behavior was recognized and rewarded at Taft. They also felt that parental involvement was not encouraged. The majority of students agree that social opportunities were provided at Taft, and that the extra curricular offerings met their needs. Students are not in agreement on whether the student agenda book was helpful in keeping themselves organized, but more students felt the homework hotline was a useful tool in communicating information. The majority felt that the agenda book was not a useful means of communicating with parents (page 93).
92
Former Student SurveyFall 2007
Opportunity to Improve Reading and Writing
3
17
8
00
2
4
6
8
10
12
14
16
18
Strongly Agree Agree Disagree Strongly Disagree
N = 28 former students responded
Num
ber o
f Res
pons
es
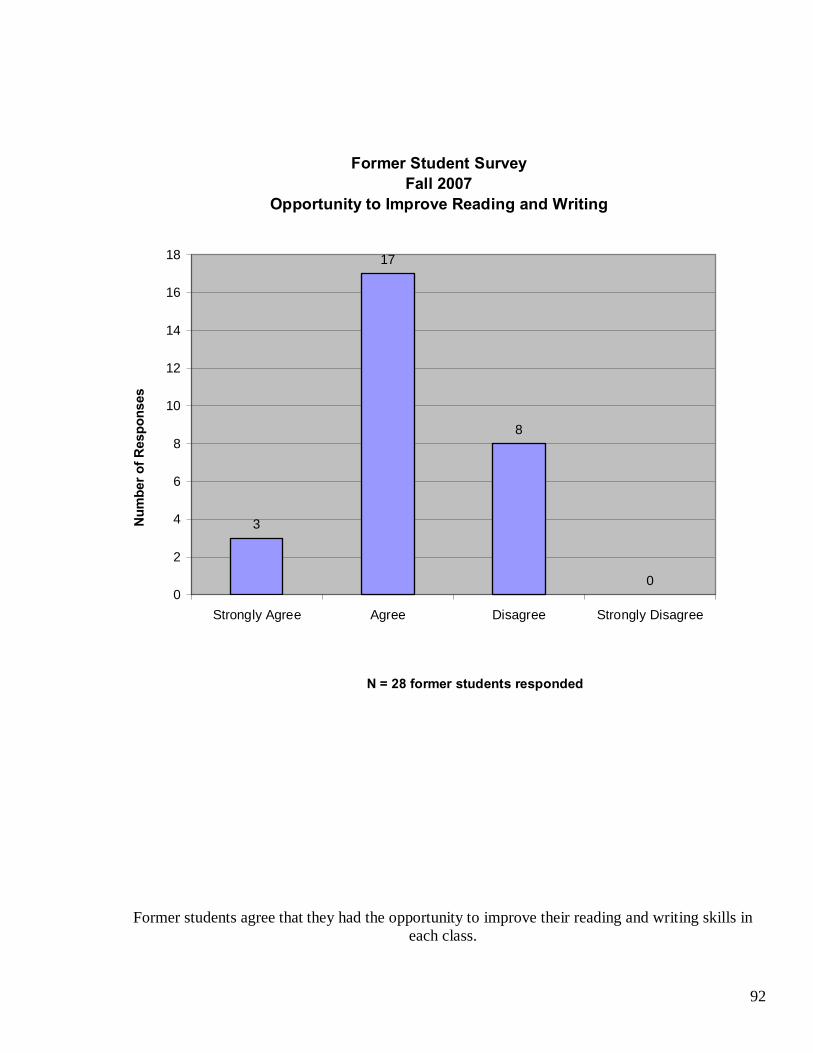
Former students agree that they had the opportunity to improve their reading and writing skills in each class.
93
Former Student SurveyFall 2007
Agenda Book as a Communication Tool
2
7
13
3
0
5
10
15
StronglyAgree
Agree Disagree StronglyDisagree
n = 28 former students responded
Nu
mb
er
of
Re
sp
on
se
s
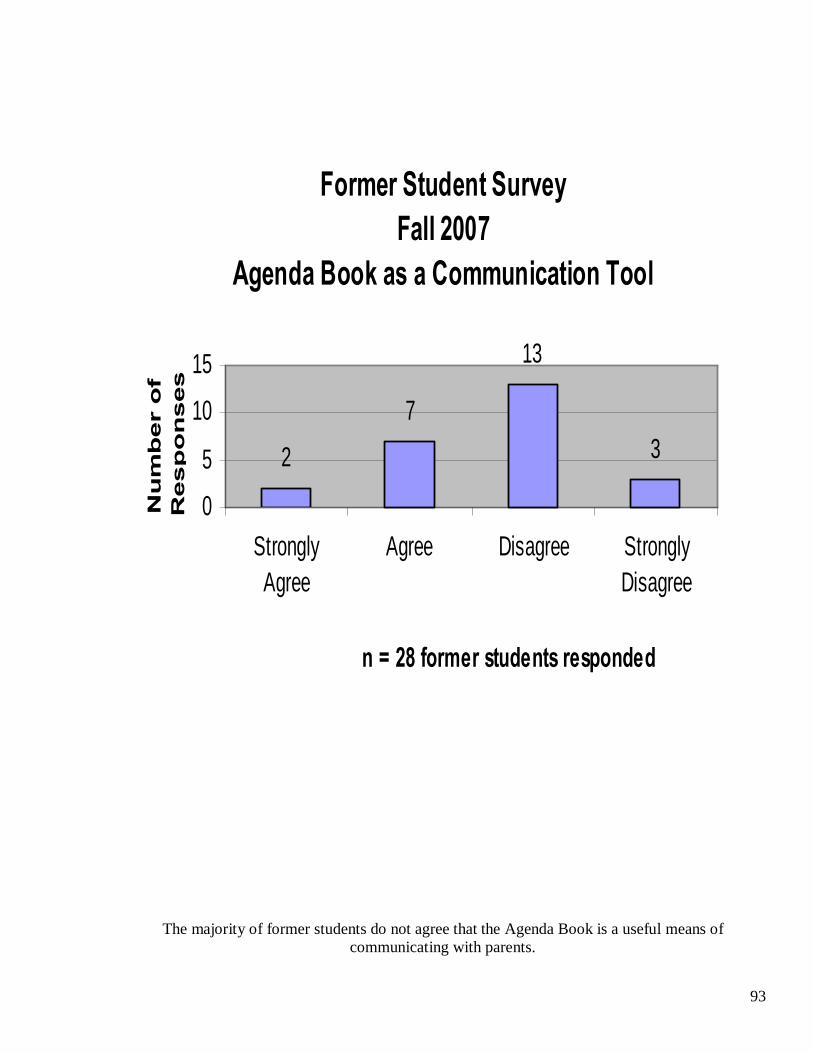
The majority of former students do not agree that the Agenda Book is a useful means of communicating with parents.
94
STAFF SURVEY In the fall of 2007, 52 staff members were surveyed, both certified and non-certified. Eighty-five percent returned the survey. Staff agrees that the orientation programs provided for students and parents are effective, and that Taft’s curriculum builds on the elementary curriculum and forms a foundation for the high school curriculum. They also agree that the academic opportunities provided to Taft students are satisfactory, challenging, integrative and exploratory. Staff agrees that the affective and emotional needs of its students, along with expanding needs of technology, are met. Most staff members feel class size is appropriate for middle school students (page 95). Staff agrees that students have the opportunity to improve reading and/or writing skills in each class. Staff members do not agree that encore and core teachers work together to show how subjects are connected. They do, however, feel that training for interdisciplinary teaching methods is provided for the staff, and that opportunities for sharing innovative instructional strategies are provided at the building level. Staff agrees that Taft’s facility allows for large group instruction and interdisciplinary teaming (page 96). Staff agrees that Taft continues to improve curriculum by using current educational research. They agree that a variety of instructional methods that are used in the classroom encourage critical thinking skills. The staff supports the middle school philosophy, and programs. They agree that teaming is helpful to students and staff. Staff agrees that Skill Enhancement/Advisory activities focus on students’ needs in the areas of academic development, personal growth, and community service opportunities. Staff agrees that Skill Enhancement/Advisory provides students with a home base program, stressing the importance of self-concept, and provides a positive climate. They agree that Taft provides social opportunities and extra curricular activities that meet students’ needs (page 97). Staff agrees that the Alternative Classroom is necessary, and that placement in the Alternative Classroom reflects student handbook guidelines. Staff disagrees that students have shown improvement in behavior, attitude, and study skills as a result of participation in the Alternative Classroom. Also, positive behavior is recognized and rewarded at Taft (page 98). Staff agrees that preparatory times currently allowed meet their needs. Teams also have flexibility in their schedules. Staff agrees that the student agenda book and homework hotline are useful means of communicating with parents, and that parental involvement is encouraged at Taft. They agree that Taft uses various resources to promote community support and involvement. Also, staff agrees that Taft’s media center provides resources to meet expanding needs of students.
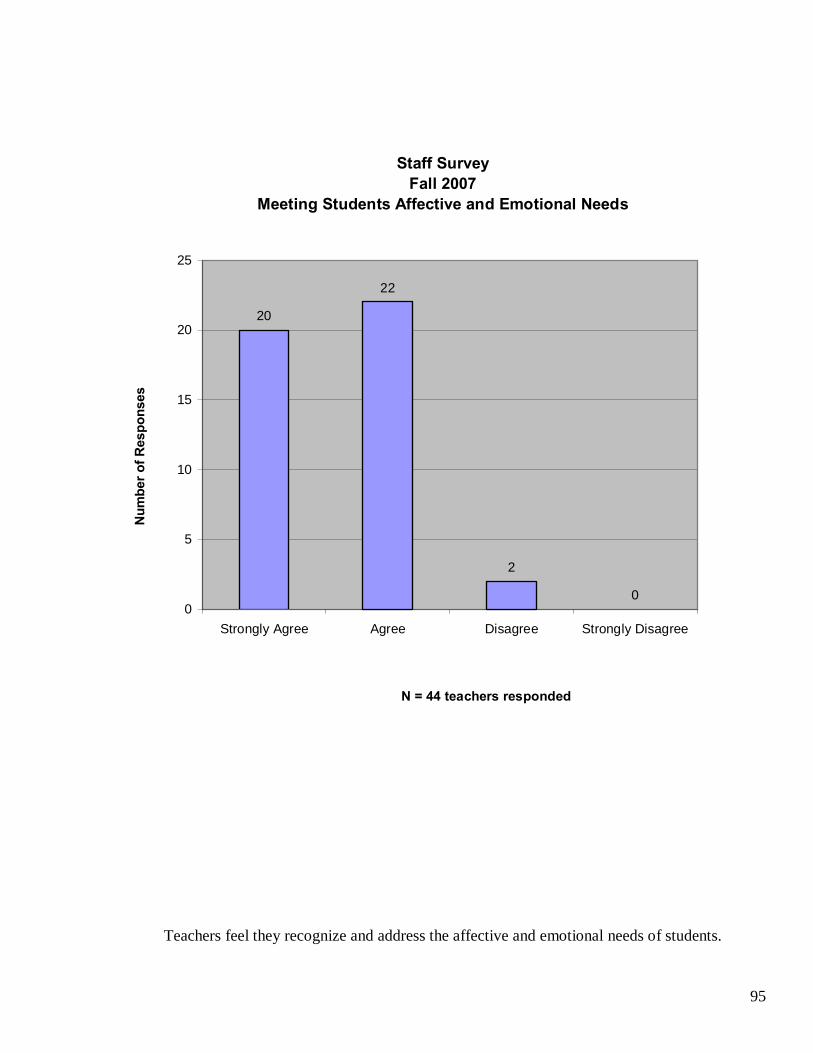
95
Staff SurveyFall 2007
Meeting Students Affective and Emotional Needs
20
22
2
00
5
10
15
20
25
Strongly Agree Agree Disagree Strongly Disagree
N = 44 teachers responded
Num
ber o
f Res
pons
es
Teachers feel they recognize and address the affective and emotional needs of students.
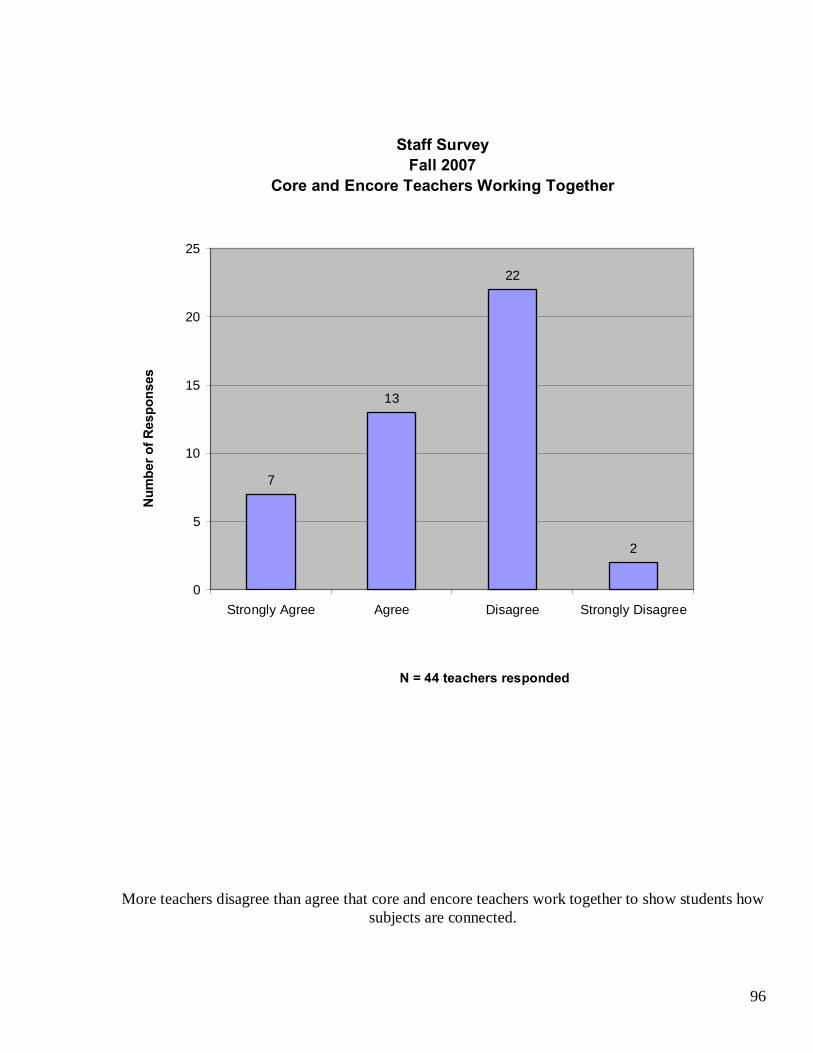
96
Staff SurveyFall 2007
Core and Encore Teachers Working Together
7
13
22
2
0
5
10
15
20
25
Strongly Agree Agree Disagree Strongly Disagree
N = 44 teachers responded
Num
ber o
f Res
pons
es
More teachers disagree than agree that core and encore teachers work together to show students how subjects are connected.
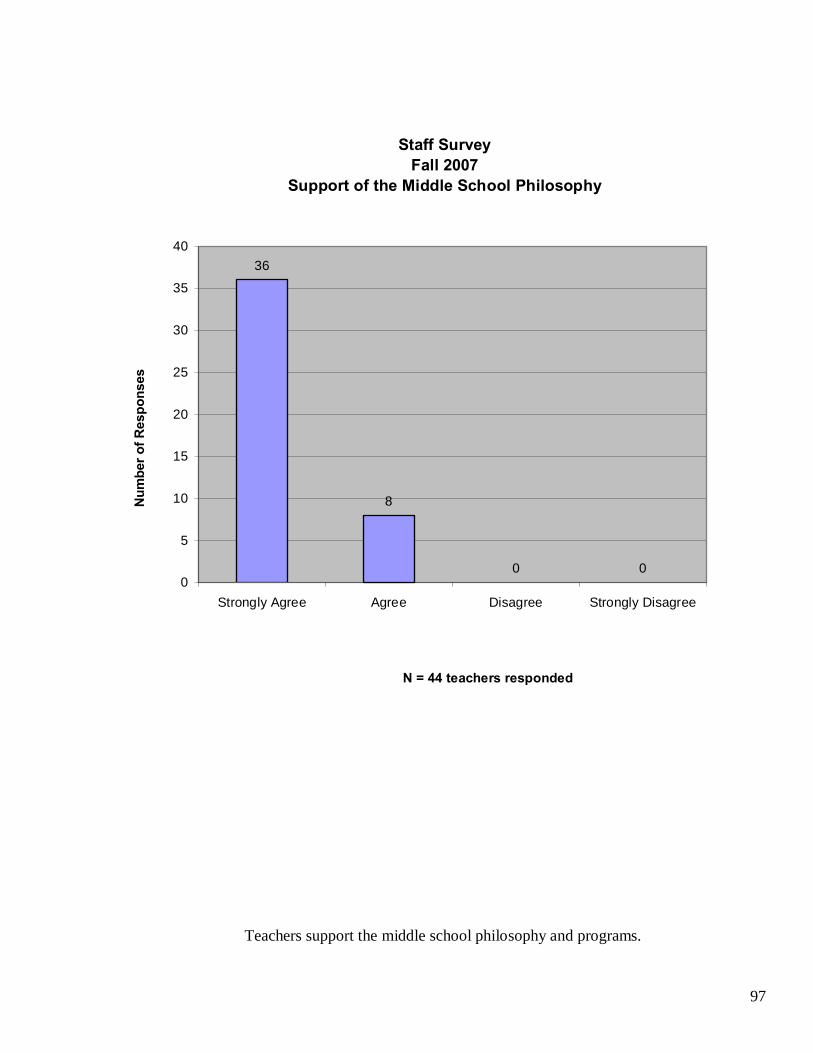
97
Staff SurveyFall 2007
Support of the Middle School Philosophy
36
8
0 00
5
10
15
20
25
30
35
40
Strongly Agree Agree Disagree Strongly Disagree
N = 44 teachers responded
Num
ber o
f Res
pons
es
Teachers support the middle school philosophy and programs.
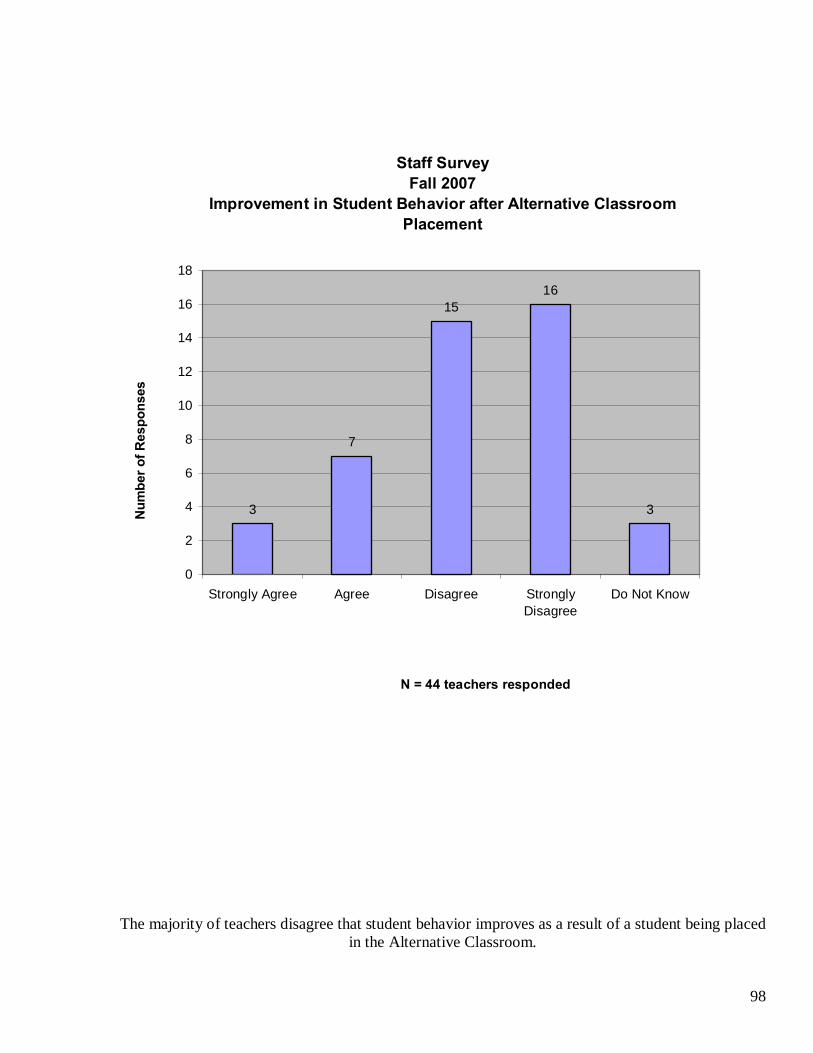
98
Staff SurveyFall 2007
Improvement in Student Behavior after Alternative Classroom Placement
3
7
1516
3
0
2
4
6
8
10
12
14
16
18
Strongly Agree Agree Disagree StronglyDisagree
Do Not Know
N = 44 teachers responded
Num
ber o
f Res
pons
es
The majority of teachers disagree that student behavior improves as a result of a student being placed in the Alternative Classroom.
99
STAFF SURVEY-INCREASING STUDENT ACHIEVMENT
In the fall of 2007 a survey was given to staff members. Forty-three staff members returned the survey. This survey asked the staff members to indicate which methods have been successful for increasing student achievement in staff members’ classroom. The staff agrees that successful methods for increasing student achievement include hands-on learning, cooperative learning, a positive rapport between teachers and students, and a variety of instructional methods based on the student’s readiness level. They also agree that a shared middle school philosophy creates a challenging instructional program, where the expectation that quality work is expected from all students develops a school atmosphere where every student can succeed. The staff agrees that effective parental involvement encouraged by communication with parents about student progress, and making students and parents aware of the outcomes and expectations also increases student achievement. The majority of the staff agrees that the following methods are effective methods for increasing student achievement at Taft:
Middle school philosophy Integrating instruction across the curriculum Thematic instruction
The majority of staff also agrees that student self-assessment, the use of computers, and addressing student learning styles increases student achievement. The staff also somewhat agrees that partnerships with businesses, teacher use of student achievement data, and frequent communication with parents are methods for increasing student achievement at Taft (pages 100-102).
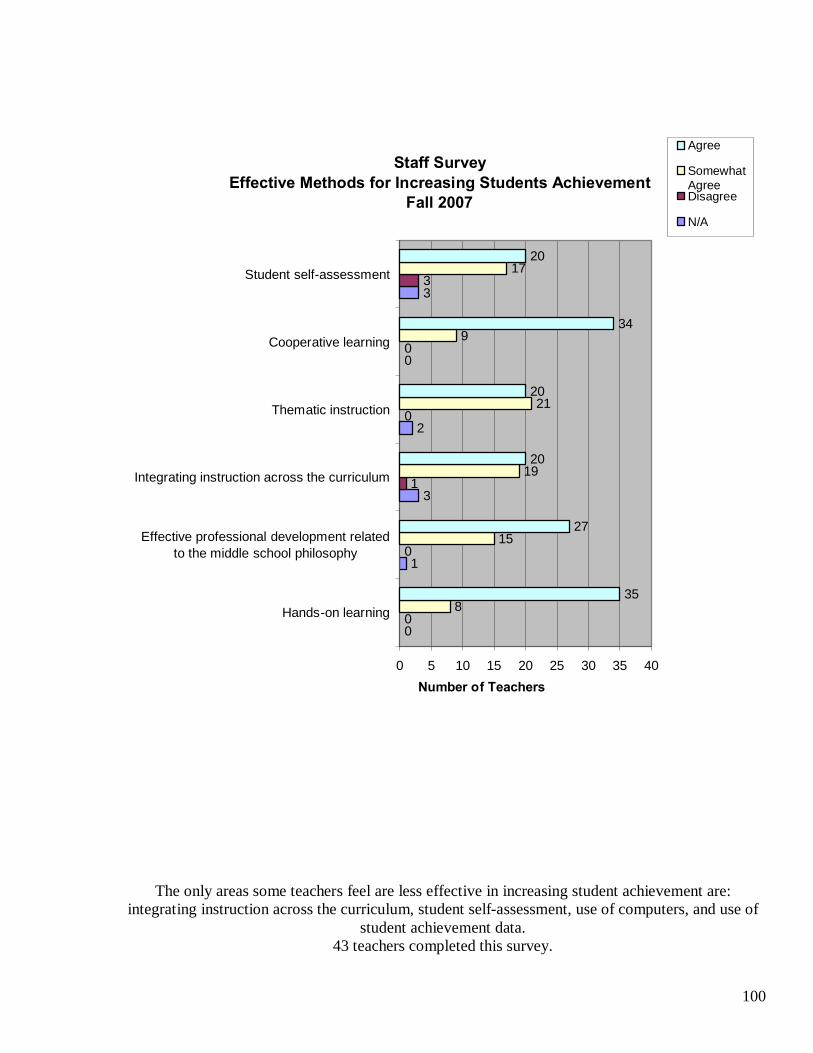
100
Staff SurveyEffective Methods for Increasing Students Achievement
Fall 2007
0
1
3
2
0
3
0
0
1
0
0
3
8
15
19
21
9
17
35
27
20
20
34
20
0 5 10 15 20 25 30 35 40
Hands-on learning
Effective professional development relatedto the middle school philosophy
Integrating instruction across the curriculum
Thematic instruction
Cooperative learning
Student self-assessment
Number of Teachers
Agree
SomewhatAgreeDisagree
N/A
The only areas some teachers feel are less effective in increasing student achievement are: integrating instruction across the curriculum, student self-assessment, use of computers, and use of
student achievement data. 43 teachers completed this survey.
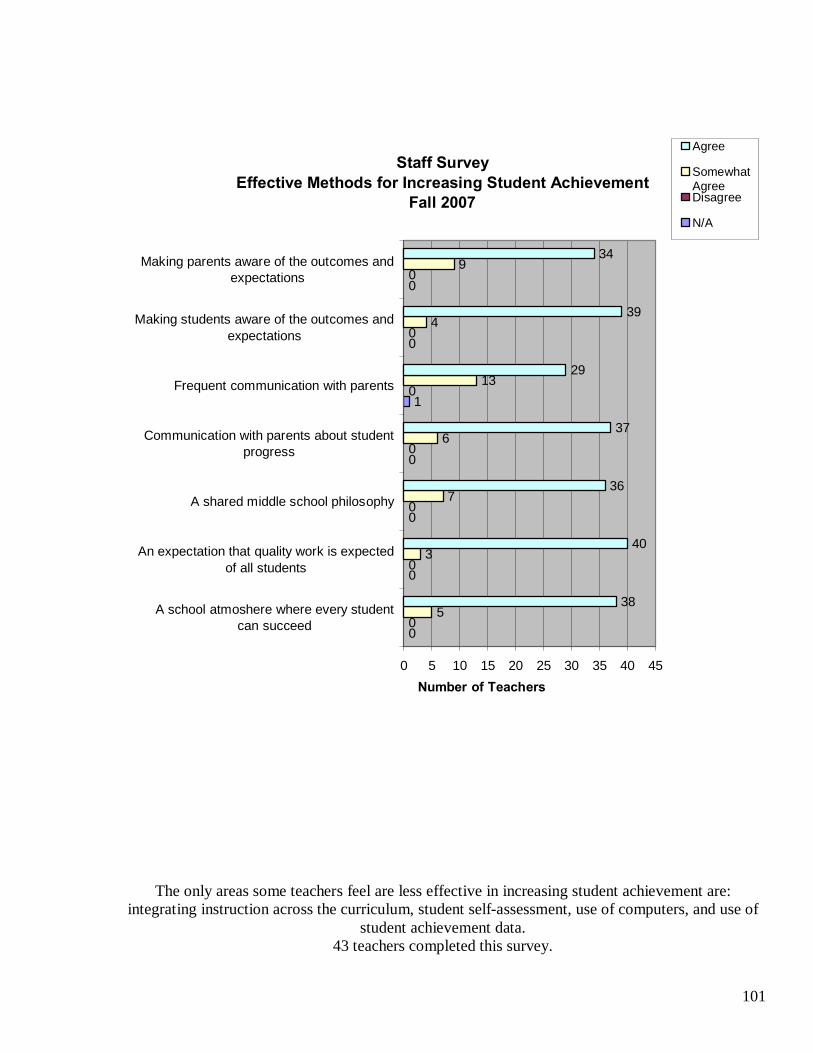
101
Staff SurveyEffective Methods for Increasing Student Achievement
Fall 2007
0
0
0
0
1
0
0
0
0
0
0
0
0
0
5
3
7
6
13
4
9
38
40
36
37
29
39
34
0 5 10 15 20 25 30 35 40 45
A school atmoshere where every studentcan succeed
An expectation that quality work is expectedof all students
A shared middle school philosophy
Communication with parents about studentprogress
Frequent communication with parents
Making students aware of the outcomes andexpectations
Making parents aware of the outcomes andexpectations
Number of Teachers
Agree
SomewhatAgreeDisagree
N/A
The only areas some teachers feel are less effective in increasing student achievement are: integrating instruction across the curriculum, student self-assessment, use of computers, and use of
student achievement data. 43 teachers completed this survey.
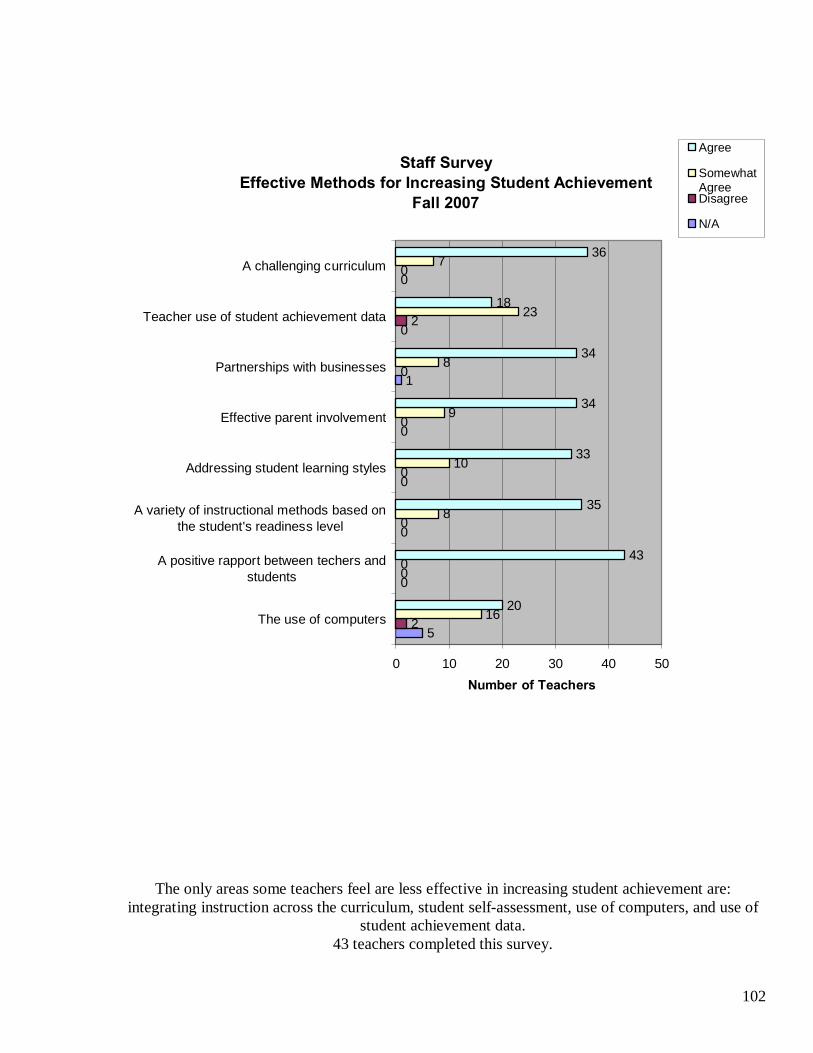
102
Staff SurveyEffective Methods for Increasing Student Achievement
Fall 2007
5
0
0
0
0
1
0
0
2
0
0
0
0
0
2
0
16
0
8
10
9
8
23
7
20
43
35
33
34
34
18
36
0 10 20 30 40 50
The use of computers
A positive rapport between techers andstudents
A variety of instructional methods based onthe student's readiness level
Addressing student learning styles
Effective parent involvement
Partnerships with businesses
Teacher use of student achievement data
A challenging curriculum
Number of Teachers
Agree
SomewhatAgreeDisagree
N/A
The only areas some teachers feel are less effective in increasing student achievement are: integrating instruction across the curriculum, student self-assessment, use of computers, and use of
student achievement data. 43 teachers completed this survey.
103
LOCAL TIME ON TASK SURVEY
In the fall of 2007, a Time on Task Survey was given to all teachers to emulate a typical school day. Thirty-seven surveys were used. The greatest amount of time is spent on Cooperative Learning Activities (22.5%), followed by Lecturing (17.1%), and Problem Solving/Critical Thinking (15.1%). Team teaching ranks the lowest of all areas (1.7%) (page 104).
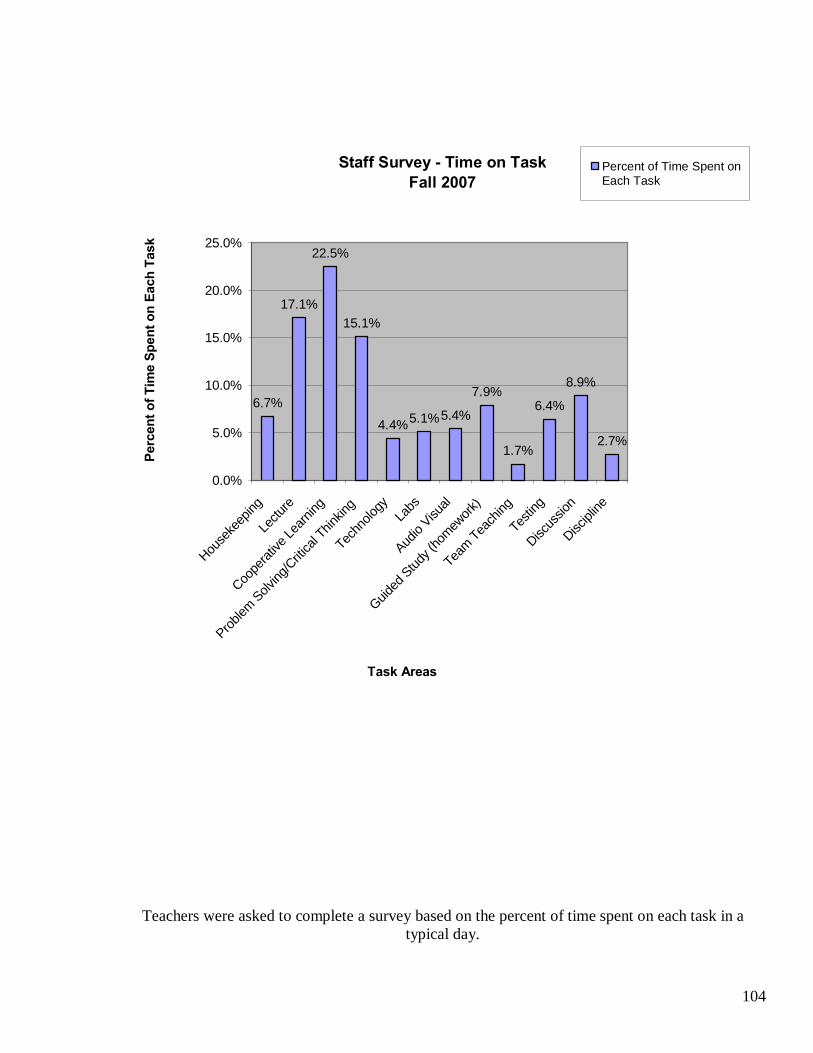
104
Staff Survey - Time on TaskFall 2007
6.7%
17.1%
22.5%
15.1%
4.4%5.1%5.4%
7.9%
1.7%
6.4%
8.9%
2.7%
0.0%
5.0%
10.0%
15.0%
20.0%
25.0%
House
keep
ing
Lectu
re
Coope
rative
Learn
ing
Problem
Solving
/Criti
cal T
hinkin
g
Techn
ology
Labs
Audio
Visual
Guided
Study (
homew
ork)
Team Tea
ching
Testin
g
Discus
sion
Discipl
ine
Task Areas
Perc
ent o
f Tim
e Sp
ent o
n Ea
ch T
ask
Percent of Time Spent onEach Task
Teachers were asked to complete a survey based on the percent of time spent on each task in a typical day.
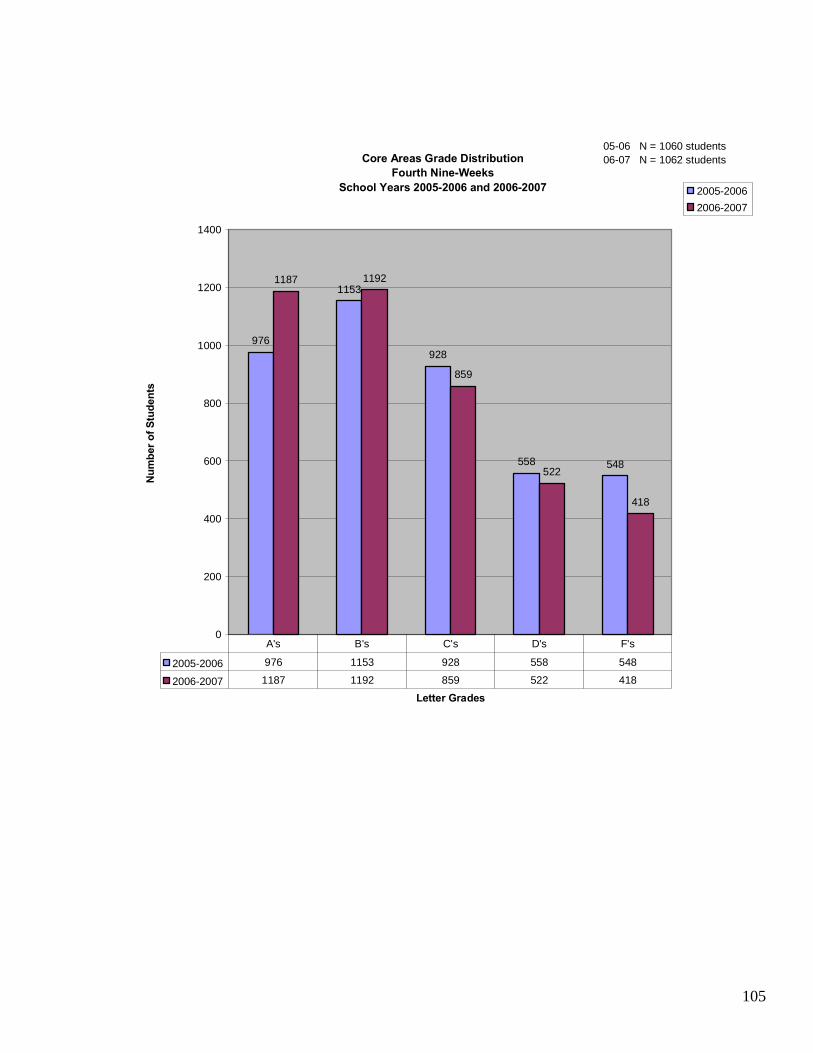
105
Core Areas Grade DistributionFourth Nine-Weeks
School Years 2005-2006 and 2006-2007
976
1153
928
558 548
1187 1192
859
522
418
0
200
400
600
800
1000
1200
1400
Letter Grades
Num
ber o
f Stu
dent
s
2005-20062006-2007
2005-2006 976 1153 928 558 548
2006-2007 1187 1192 859 522 418
A's B's C's D's F's
05-06 N = 1060 students06-07 N = 1062 students
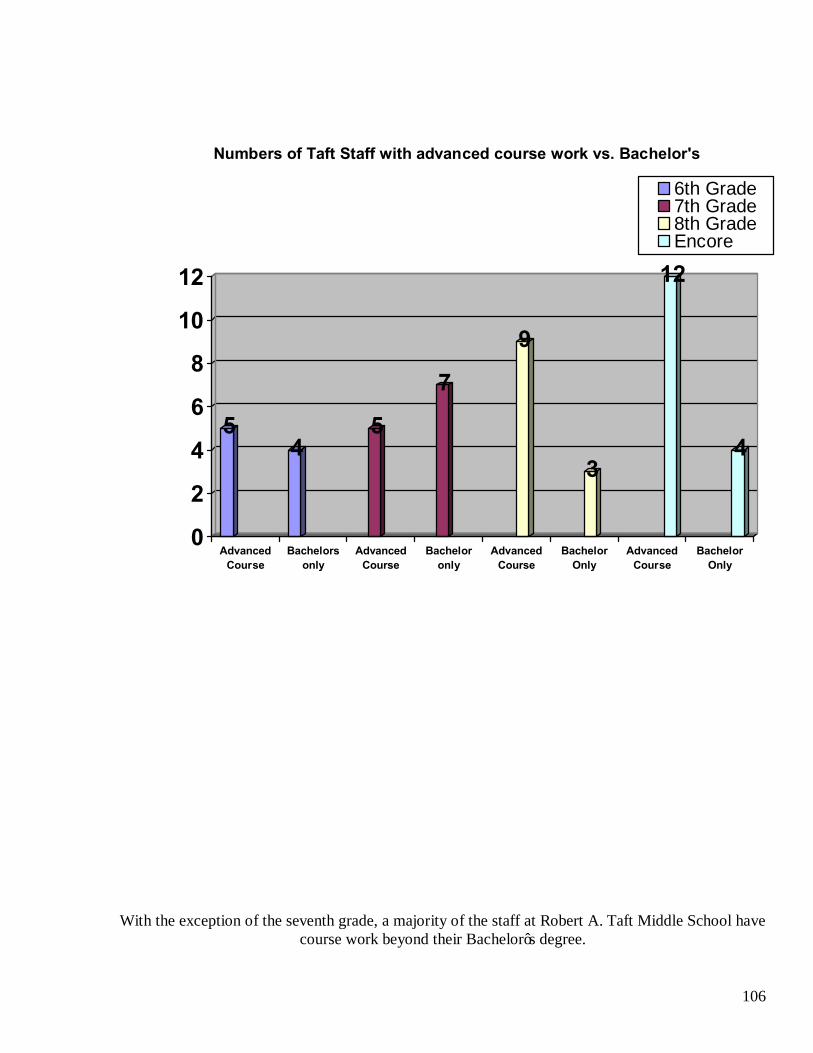
106
54
5
7
9
3
12
4
0
2
4
6
8
10
12
AdvancedCourse
Bachelorsonly
AdvancedCourse
Bacheloronly
AdvancedCourse
BachelorOnly
AdvancedCourse
BachelorOnly
Numbers of Taft Staff with advanced course work vs. Bachelor's
6th Grade7th Grade8th GradeEncore
With the exception of the seventh grade, a majority of the staff at Robert A. Taft Middle School have course work beyond their Bachelor’s degree.
107
Family and Community Data • Communication between the school and other stakeholders (page 108) • Participation/Parents and community (page 109) • Characteristics of family and community (page 110) • Perception data Parent survey (page 111) Business survey (page 116)
108
COMMUNICATION BETWEEN TAFT AND OTHER STAKEHOLDERS INCLUDE THE FOLLOWING:
1. PTA meetings 2. CASS coffees 3. Parent newsletter (every 2 months) 4. Student grade updates 5. Formal interim reports and report cards every 4 ½ weeks 6. Staff/Parent e-mails 7. Parent/Team/Counselor conferences
109
PARTICIPATION/ PARENTS AND COMMUNITY In the 2006-2007 school year, the seventh grade counselors and team members met with 27%
of the seventh grade parents. The eighth grade counselor and team members met with 22% of the eighth grade parents. This does not include phone conferences with teams and counselors. Partnerships with the community include career presentations by the business leaders in the community to eighth grade students. Taft Middle School also includes both parents and business leaders on its School Improvement Committee.
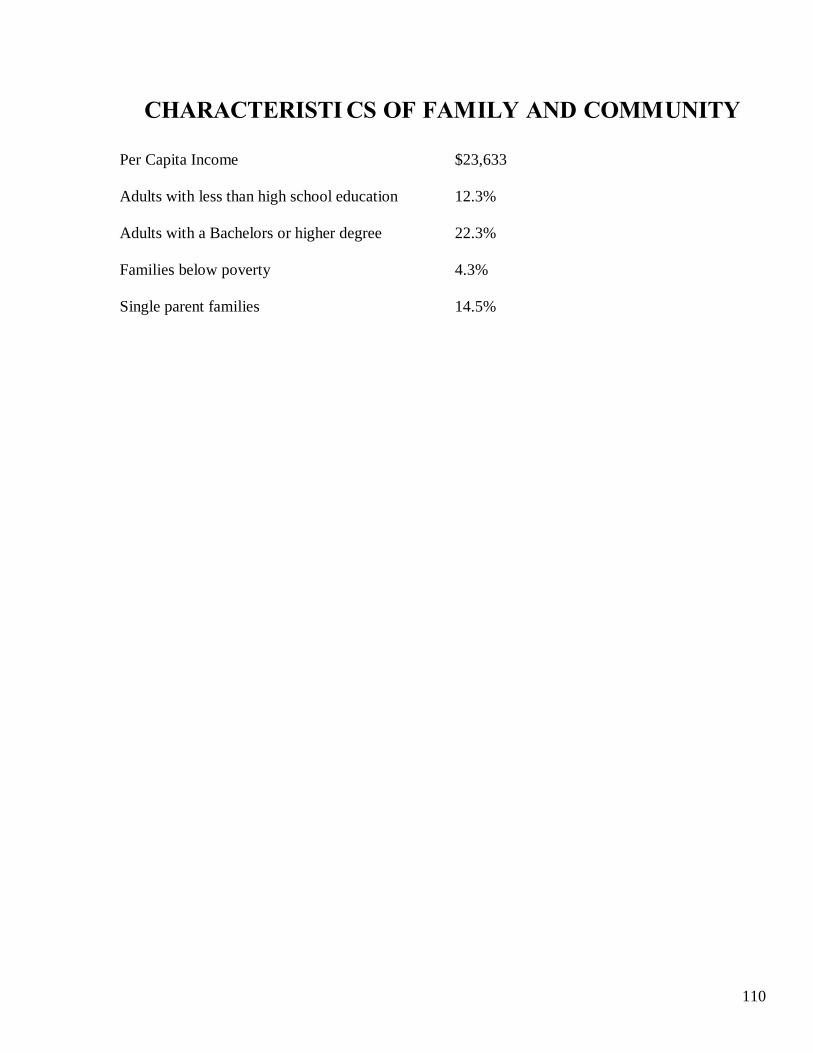
110
CHARACTERISTI CS OF FAMILY AND COMMUNITY
Per Capita Income $23,633 Adults with less than high school education 12.3% Adults with a Bachelors or higher degree 22.3% Families below poverty 4.3% Single parent families 14.5%
111
PARENT SURVEY In the fall of 2007, a parent survey was distributed to a random sample of parents of sixth, seventh, eighth, and ninth grade students. Twenty-two percent of the sixth, seventh, and eighth grade parents returned the survey and nine percent of ninth grade students returned the survey. Parents are in agreement that the academic opportunities provided to Taft students are satisfactory. Most parents feel that Taft provides its students with a curriculum that is challenging and integrative, and agree that Taft prepares students for the transition to the high school. Parents also agree that orientation programs provided for in-coming Taft students are effective. Parents of sixth, seventh, and eighth grade students agree that Taft recognizes and addresses the affective and emotional needs of its students and that class size is appropriate. Parents of ninth grade students are split on whether students’ emotional needs are met, and whether class size is appropriate (pages 112-113). A large number of parents of sixth, seventh, and eighth grade students agree that core and encore teachers work together to show how subjects are connected and that teachers use a variety of ways to teach, while more parents of ninth grade students do not agree. Parents feel students have the opportunity to improve reading and writing skills in each class. Parents agree that media services are provided for students to complete assignments, and that students technology needs are being met. Parents like the middle school philosophy, programs, and teaming and feel that their child is safe at Taft Middle School and are very satisfied with having a Security Resource Officer (page 114). The majority of parents of sixth, seventh and eighth grade students feel that positive behavior is recognized at Taft, while parents of former students are split. All parents agree that e-mail and the homework hotline are the most important tools for communicating information to parents. Neither group of parents agrees that the student agenda book is a good communication tool. Parents of sixth, seventh, and eighth grade students agree that parental involvement is encouraged, while parents of former students are split on this (page 115).
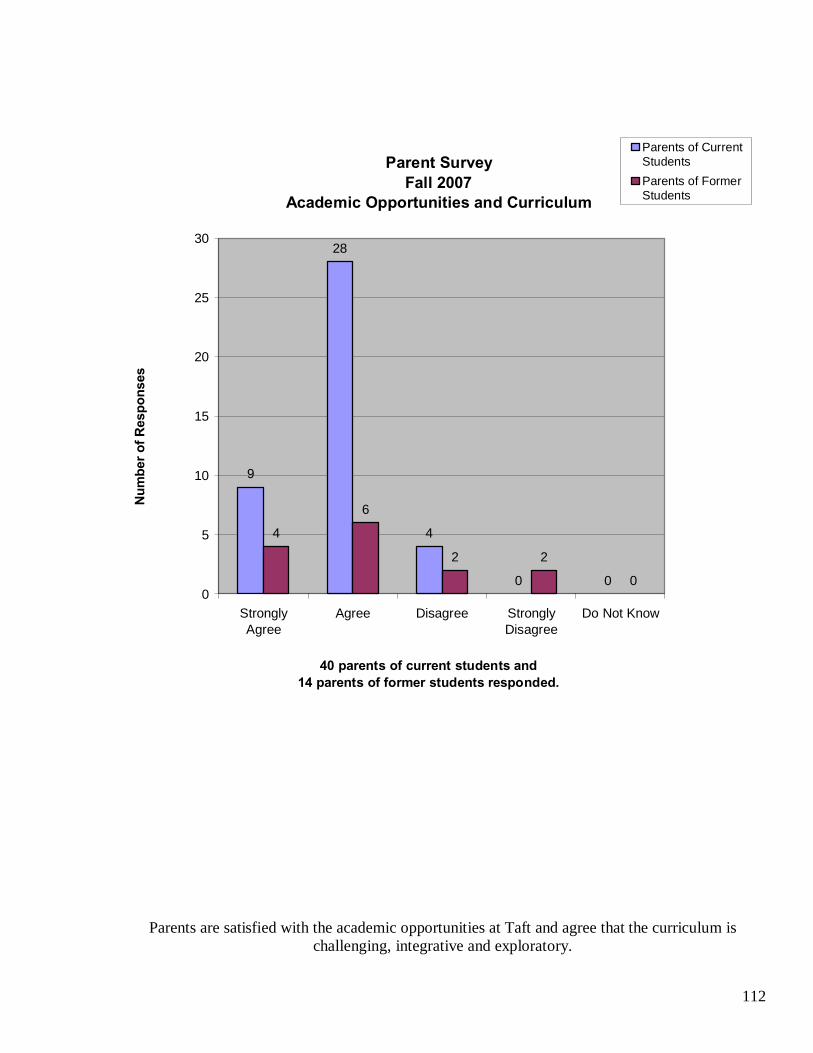
112
Parent SurveyFall 2007
Academic Opportunities and Curriculum
9
28
4
0 0
4
6
2 2
00
5
10
15
20
25
30
StronglyAgree
Agree Disagree StronglyDisagree
Do Not Know
40 parents of current students and14 parents of former students responded.
Num
ber o
f Res
pons
esParents of CurrentStudentsParents of FormerStudents
Parents are satisfied with the academic opportunities at Taft and agree that the curriculum is challenging, integrative and exploratory.
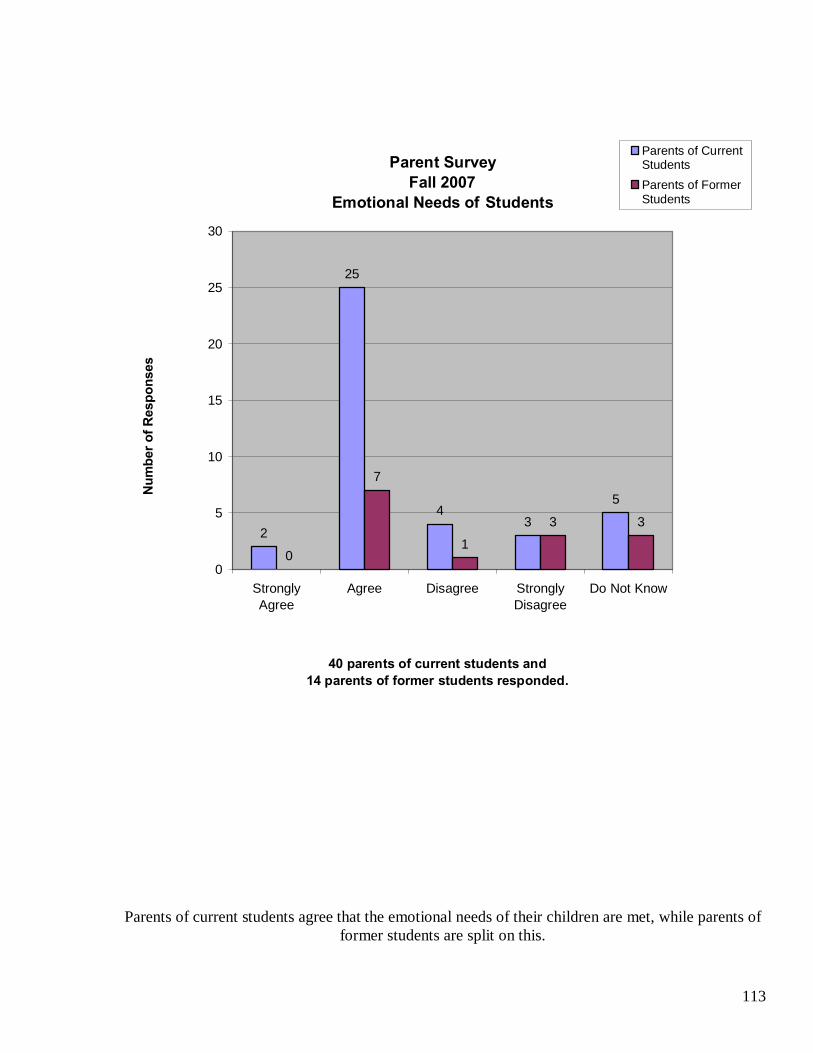
113
Parent SurveyFall 2007
Emotional Needs of Students
2
25
43
5
0
7
1
3 3
0
5
10
15
20
25
30
StronglyAgree
Agree Disagree StronglyDisagree
Do Not Know
40 parents of current students and14 parents of former students responded.
Num
ber o
f Res
pons
esParents of CurrentStudentsParents of FormerStudents
Parents of current students agree that the emotional needs of their children are met, while parents of former students are split on this.
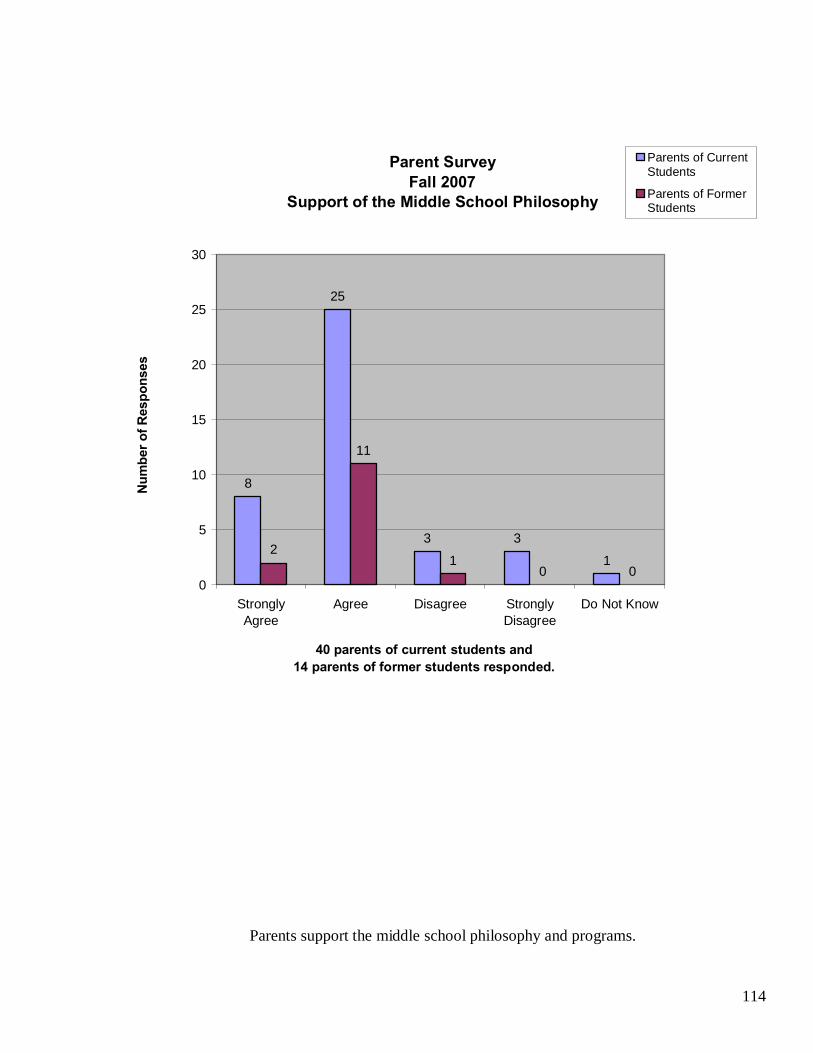
114
Parent SurveyFall 2007
Support of the Middle School Philosophy
8
25
3 3
12
11
10 0
0
5
10
15
20
25
30
StronglyAgree
Agree Disagree StronglyDisagree
Do Not Know
40 parents of current students and14 parents of former students responded.
Num
ber o
f Res
pons
esParents of CurrentStudents
Parents of FormerStudents
Parents support the middle school philosophy and programs.

115
Parent Survey Fall 2007
Encouraging Parental Involvement
5
19
7
5
223
5
1
3
0
2
4
6
8
10
12
14
16
18
20
StronglyAgree
Agree Disagree StronglyDisagree
Do Not Know
40 parents of current students and14 parents of former students responded.
Num
ber o
f Res
pons
esParents of CurrentStudents
Parents of FormerStudents
Parents of current students agree that Taft Middle School encourages parental involvement, while parents of former students are split on this.
116
BUSINESS SURVEY
In the fall of 2007, business surveys were sent out to our community merchants to determine how they view our youngsters in the work force. Twenty-three surveys were returned. The survey asked a variety of questions in the following areas: 1). Preparedness in home life and work life outside of school. 2). Teaching students how to learn in and out of a work-related setting. 3). Preparing young people for college and non-college students for the work force. 4). Preparing young people to have a strong work ethic and to be part of a team. 5). Preparing young people to read and write clearly. 6). Preparing students to work with others for diverse backgrounds. 7). Preparing young people to logically solve problems. 8). Internships and volunteer programs for students and teachers in the workforce. 9). The role local businesses should take in further educating our students. On average, local businesses believe Taft Middle School is doing a satisfactory job in preparing students for getting their first job, having students practice what they’ve learned in a work-related setting, and preparing college and non-college bound students for the work force. Business owners believe that Taft taught students how to learn, and all agree that some kind of career preparation is necessary by the time students graduate from high school. Business owners also believe that students generally had a good outlook on home life and work life, as well as, being good citizens, but agree all areas could improve. Local businesses believe skills such as strong work ethic, working with others from diverse backgrounds, and the ability to work in a team are very important for our young students to be successful. Students also must know how to read and write clearly and have the ability to logically solve problems. A majority of local merchants favor having local employers and community organizations play a larger role in our educational system. In doing this, local businesses favor having internships that provide students with hands-on training and paid learning experiences. Merchants also favor internships as well as mentoring programs for teachers. Businesses favor partnering with parents, teachers, students, and community leaders to implement such plans. All businesses believe they should and can provide students with information about the skills and expectations necessary for today’s workforce.
117
Conclusions about: • Taft’s curriculum supports the achievement of Indiana Academic Standards.
(page 118) • Student Achievement Triangulation (page 119) Student Achievement Summary (page 121) • Parental participation (page 123) • Technology as a learning tool Taft student/teacher computer usage (page 124) • Safe and disciplined learning environment
Disciplinary actions (page 125) CASS students online survey (page 128) Drug/Alcohol student survey (page 132) Substance abuse student online survey (page 133)
• Professional development An evaluation system that provides for the professional growth of all personnel (page 139) Student assessment data used to make decisions regarding continuous improvement of teaching and learning processes. (page 140)
118
TAFTS CURRICULUM SUPPORTS THE ACIEVMENT OF INDIANA ACADEMIC STANDARDS
Taft Middle School is participating in the Understanding by Design model, or UBD, as our curriculum guideline. Under our UBD program, each content area creates Enduring Understandings, which are based on the Indiana Academic Standards. These are overall understandings that each content area believes the students should learn. Departments have studied and reviewed their standards to make sure the Enduring Understandings cover repeated concepts throughout the standards. Teachers refer to these understandings throughout the year. Lessons, units, and assessments are based on these understandings. Students are prompted with essential questions to tie each lesson or unit into the overall enduring understandings for their content areas.

119
TRIANGULAT ION OF DATA
I. Reading ISTEP 9th grade- Declined in reading comprehension- males 8th grade- Total population and Special Education stayed the same in reading comprehension. 7th grade-Total population declined in reading comprehension. Applied Skills 7th grade- Large percentage of students scored zero points in ISTEP reading comprehension. 7th grade- English/language arts declined 3% in Pass+ Local 7th grade- Declined in main ideas and drawing conclusions CTBS 8th grade- Declined in reading Business Survey Students must know how to read. II. Writing ISTEP 8th grade- Remained the same in writing process and applications 8th grade- Male population scores declined. 7th grade- Declined in writing process and applications Local 7th grade- Decline of 0.2 on a scale of 0-5 in ideas, organization, word choice, sentence fluency and conventions. Business Survey Students must know how to write clearly. III. Problem Solving ISTEP 9th grade- Declined in problem solving 1%, male population largest decline in problem solving. 8th grade- Declined in problem solving, male population largest decline.
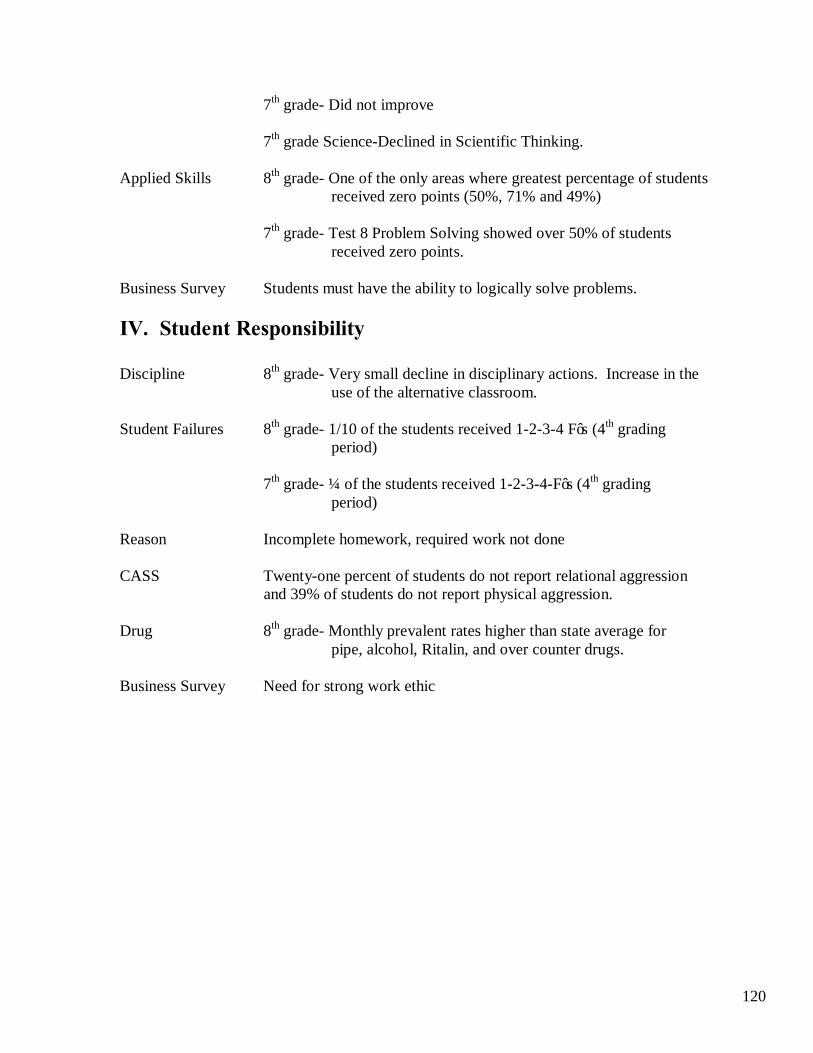
120
7th grade- Did not improve 7th grade Science-Declined in Scientific Thinking. Applied Skills 8th grade- One of the only areas where greatest percentage of students received zero points (50%, 71% and 49%) 7th grade- Test 8 Problem Solving showed over 50% of students received zero points. Business Survey Students must have the ability to logically solve problems. IV. Student Responsibility Discipline 8th grade- Very small decline in disciplinary actions. Increase in the use of the alternative classroom. Student Failures 8th grade- 1/10 of the students received 1-2-3-4 F’s (4th grading period) 7th grade- ¼ of the students received 1-2-3-4-F’s (4th grading period) Reason Incomplete homework, required work not done CASS Twenty-one percent of students do not report relational aggression and 39% of students do not report physical aggression. Drug 8th grade- Monthly prevalent rates higher than state average for pipe, alcohol, Ritalin, and over counter drugs. Business Survey Need for strong work ethic
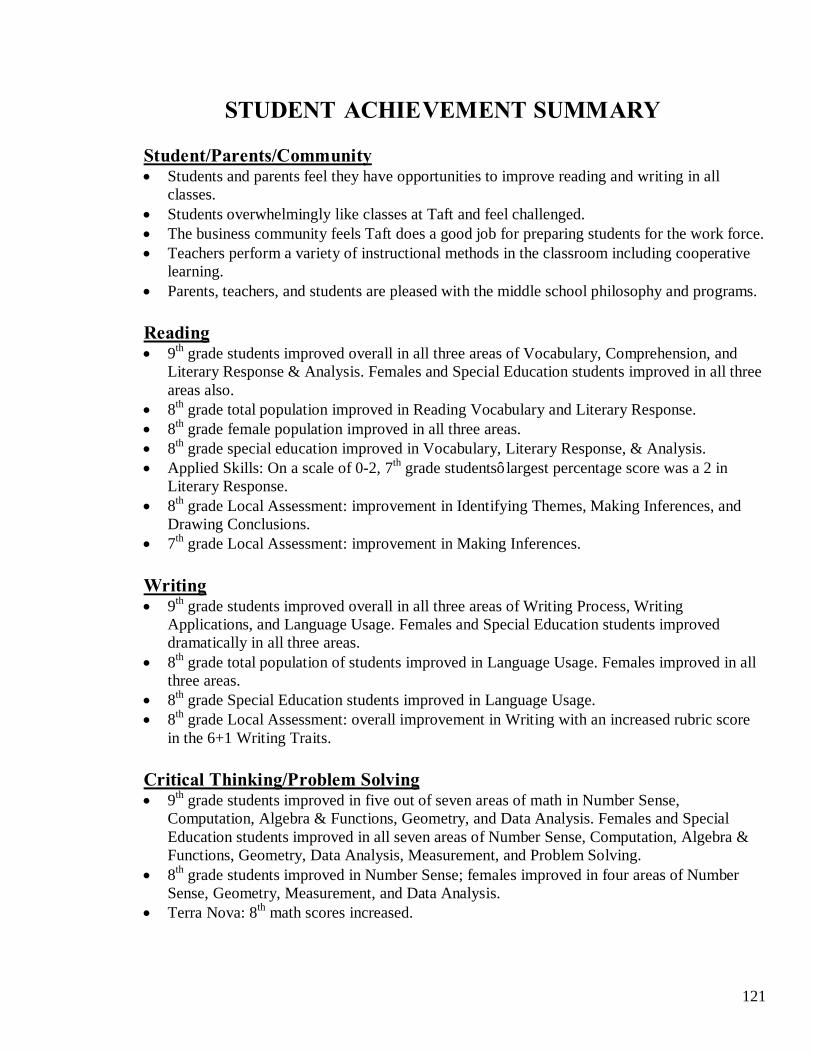
121
STUDENT ACHIEVEMENT SUMMARY
Student/Parents/Community • Students and parents feel they have opportunities to improve reading and writing in all
classes. • Students overwhelmingly like classes at Taft and feel challenged. • The business community feels Taft does a good job for preparing students for the work force. • Teachers perform a variety of instructional methods in the classroom including cooperative
learning. • Parents, teachers, and students are pleased with the middle school philosophy and programs.
Reading • 9th grade students improved overall in all three areas of Vocabulary, Comprehension, and
Literary Response & Analysis. Females and Special Education students improved in all three areas also.
• 8th grade total population improved in Reading Vocabulary and Literary Response. • 8th grade female population improved in all three areas. • 8th grade special education improved in Vocabulary, Literary Response, & Analysis. • Applied Skills: On a scale of 0-2, 7th grade students’ largest percentage score was a 2 in
Literary Response. • 8th grade Local Assessment: improvement in Identifying Themes, Making Inferences, and
Drawing Conclusions. • 7th grade Local Assessment: improvement in Making Inferences.
Writing • 9th grade students improved overall in all three areas of Writing Process, Writing
Applications, and Language Usage. Females and Special Education students improved dramatically in all three areas.
• 8th grade total population of students improved in Language Usage. Females improved in all three areas.
• 8th grade Special Education students improved in Language Usage. • 8th grade Local Assessment: overall improvement in Writing with an increased rubric score
in the 6+1 Writing Traits.
Critical Thinking/Problem Solving • 9th grade students improved in five out of seven areas of math in Number Sense,
Computation, Algebra & Functions, Geometry, and Data Analysis. Females and Special Education students improved in all seven areas of Number Sense, Computation, Algebra & Functions, Geometry, Data Analysis, Measurement, and Problem Solving.
• 8th grade students improved in Number Sense; females improved in four areas of Number Sense, Geometry, Measurement, and Data Analysis.
• Terra Nova: 8th math scores increased.
122
• 7th grade Hispanic & Multi-racial populations increased in Algebra, Geometry, and Data Analysis.
• 7th and 8th grade students increased overall in the Pass + category.
Student Responsibilities • 7th grade disciplinary actions through the office cut in half.
123
PARENTAL PARTICIPATIO N
Parental involvement and support is a welcomed improvement to Taft Middle School. Parents are an integral part of our CASS program, (Creating a Safe School). They attend monthly meetings and are encouraged to discuss with their children everyday occurrences in school so as to provide productive and positive feedback and guidance concerning these matters. The volunteer parent group creates monthly themed bulletin boards, chaperones dances, and supervises the monthly mix-it up lunches. The parental role in CASS is crucial to its success. Taft Middle School is working more closely with parents through the Parent Teachers Association. The purpose of the Parent Teacher Association is to work closely with the principal and teachers to solve problems and set goals that will benefit our students. By being a member of the Parent Teacher Association, parents have the opportunity to take and active role in their children’s education. Currently, a parent volunteer room has been established to assist teachers with photocopying, laminating, preparing bulletin boards, and preparing projects for hands-on classes. Parents also assist with fundraising, school pictures, concession stand, and the Taft Parent-Teacher Association webpage. Taft welcomes the opportunity to partner more closely with parents as we share a mutual concern for the well-being of their children.
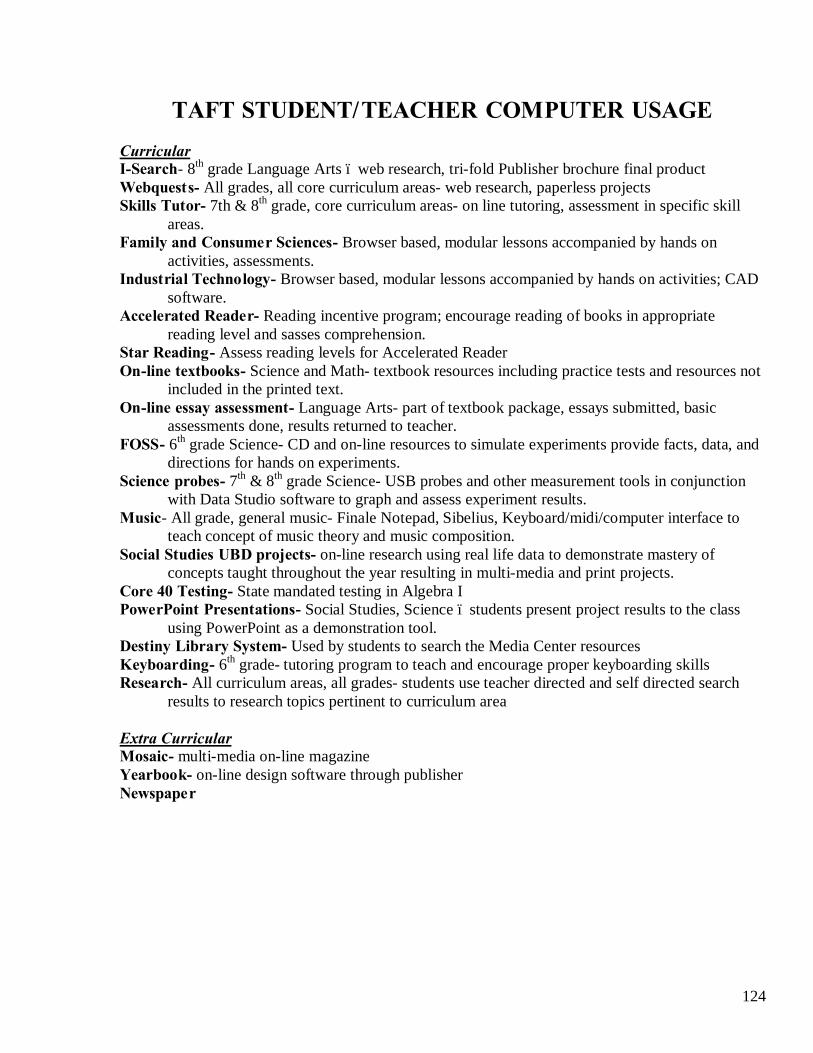
124
TAFT STUDENT/TEACHER COMPUTER USAGE Curricular I-Search- 8th grade Language Arts – web research, tri-fold Publisher brochure final product Webquests- All grades, all core curriculum areas- web research, paperless projects Skills Tutor- 7th & 8th grade, core curriculum areas- on line tutoring, assessment in specific skill areas. Family and Consumer Sciences- Browser based, modular lessons accompanied by hands on activities, assessments. Industrial Technology- Browser based, modular lessons accompanied by hands on activities; CAD software. Accelerated Reader- Reading incentive program; encourage reading of books in appropriate reading level and sasses comprehension. Star Reading- Assess reading levels for Accelerated Reader On-line textbooks- Science and Math- textbook resources including practice tests and resources not included in the printed text. On-line essay assessment- Language Arts- part of textbook package, essays submitted, basic assessments done, results returned to teacher. FOSS- 6th grade Science- CD and on-line resources to simulate experiments provide facts, data, and directions for hands on experiments. Science probes- 7th & 8th grade Science- USB probes and other measurement tools in conjunction with Data Studio software to graph and assess experiment results. Music- All grade, general music- Finale Notepad, Sibelius, Keyboard/midi/computer interface to teach concept of music theory and music composition. Social Studies UBD projects- on-line research using real life data to demonstrate mastery of concepts taught throughout the year resulting in multi-media and print projects. Core 40 Testing- State mandated testing in Algebra I PowerPoint Presentations- Social Studies, Science – students present project results to the class using PowerPoint as a demonstration tool. Destiny Library System- Used by students to search the Media Center resources Keyboarding- 6th grade- tutoring program to teach and encourage proper keyboarding skills Research- All curriculum areas, all grades- students use teacher directed and self directed search results to research topics pertinent to curriculum area Extra Curricular Mosaic- multi-media on-line magazine Yearbook- on-line design software through publisher Newspaper
125
DISCIPLINARY ACTIONS
From the 2003-2004 school year to the 2006-2007 school year, the disciplinary actions taking place through the office at the eighth grade level declined from 2,638 to 2,623. From the 2003-2004 school year to the 2006-2007 school year, the total number of disciplinary actions taking place through the office at the seventh grade level fell from 3,035 to 1,506. Disciplinary actions for students at Taft consist of lunch detentions, after school detentions, alternative classroom, and out of school suspension. At the eighth grade level, the number of disciplinary actions for lunch detentions, after school detentions, and out of school suspensions decreased, while the number of alternative classrooms increased slightly. At the seventh grade level, the number of disciplinary actions for each category decreased (pages 126-127).
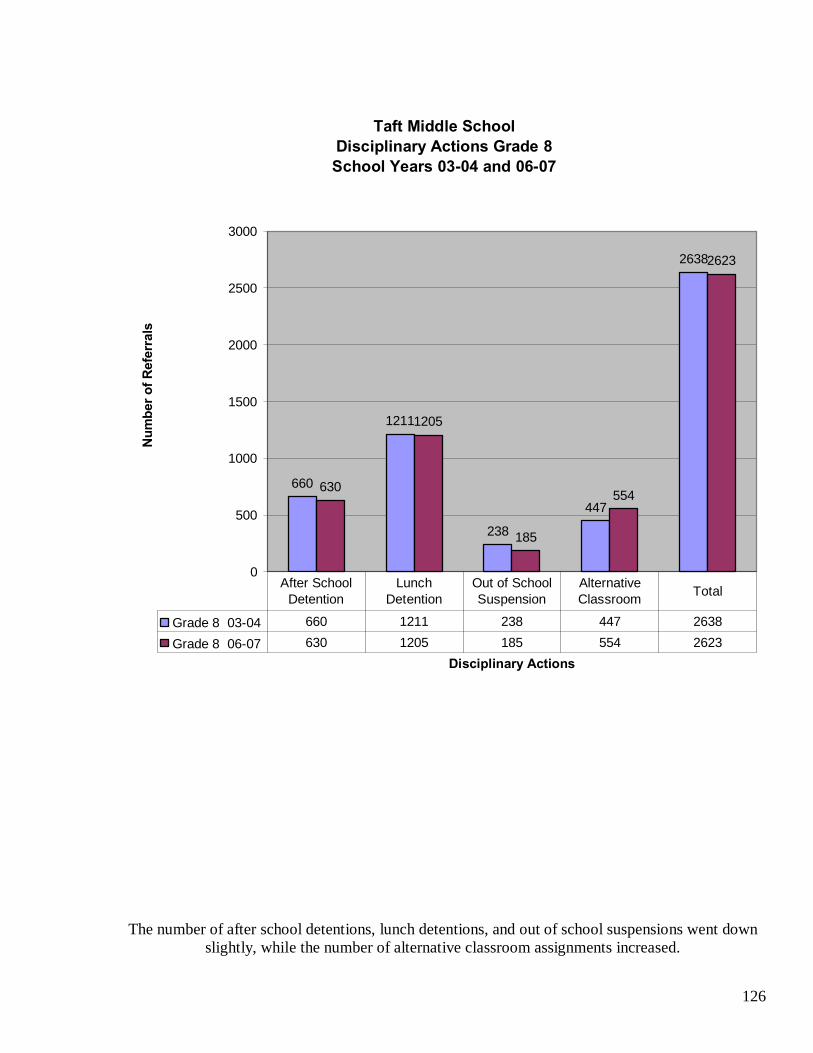
126
Taft Middle SchoolDisciplinary Actions Grade 8School Years 03-04 and 06-07
660
1211
238
447
2638
630
1205
185
554
2623
0
500
1000
1500
2000
2500
3000
Disciplinary Actions
Num
ber o
f Ref
erra
ls
Grade 8 03-04 660 1211 238 447 2638
Grade 8 06-07 630 1205 185 554 2623
After School Detention
Lunch Detention
Out of School Suspension
Alternative Classroom Total
The number of after school detentions, lunch detentions, and out of school suspensions went down slightly, while the number of alternative classroom assignments increased.
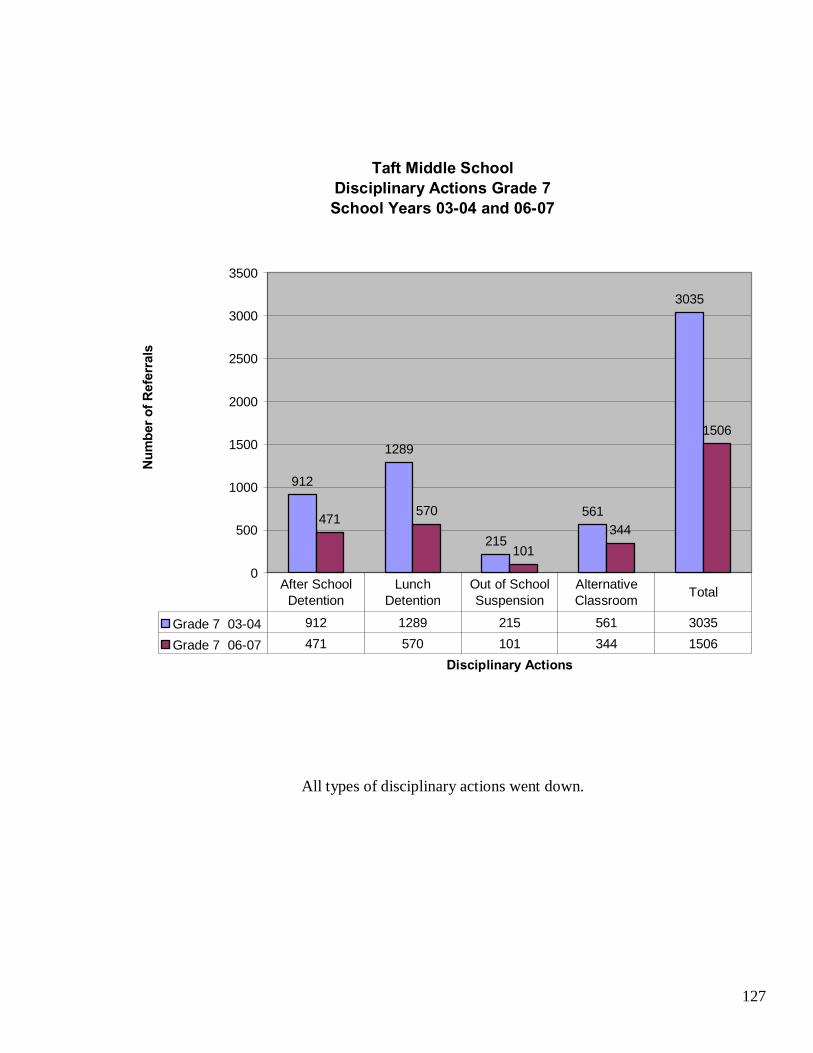
127
Taft Middle SchoolDisciplinary Actions Grade 7School Years 03-04 and 06-07
912
1289
215
561
3035
471 570
101344
1506
0
500
1000
1500
2000
2500
3000
3500
Disciplinary Actions
Num
ber o
f Ref
erra
ls
Grade 7 03-04 912 1289 215 561 3035
Grade 7 06-07 471 570 101 344 1506
After School Detention
Lunch Detention
Out of School Suspension
Alternative Classroom Total
All types of disciplinary actions went down.
128
CASS ONLINE STUDENT SURVEY
In 2005 Taft Middle School adopted the CASS program, Creating a Safe School. This nationally recognized anti-bullying program is sponsored by the Ophelia Project. The program was implemented as a result of teachers and administrators noticing repeated and intolerable act of physical and relational aggression amongst our students. Students completed a CASS survey in the fall of 2007. The results indicate that most students felt comfortable reporting aggression to their friends. Sixty-four percent of students will report relational aggression to a friend and sixty-two percent will report physical aggression to a friend. Students will also report aggression to parents and teachers. However, 21% of students will not report relational aggression and 39% of students will not report physical aggression to any one (page 129-130). This survey indicated that students see relational aggression mostly in the cafeteria (57%), and in the hallways (56%). Forty-one percent of the students see relational aggression in the classroom. Thirty-five percent of the students frequently see physical aggression in the cafeteria. Twenty-eight percent of the students witness physical aggression in the hallways, and 24% of the students witness it on the way home from school (page 131).
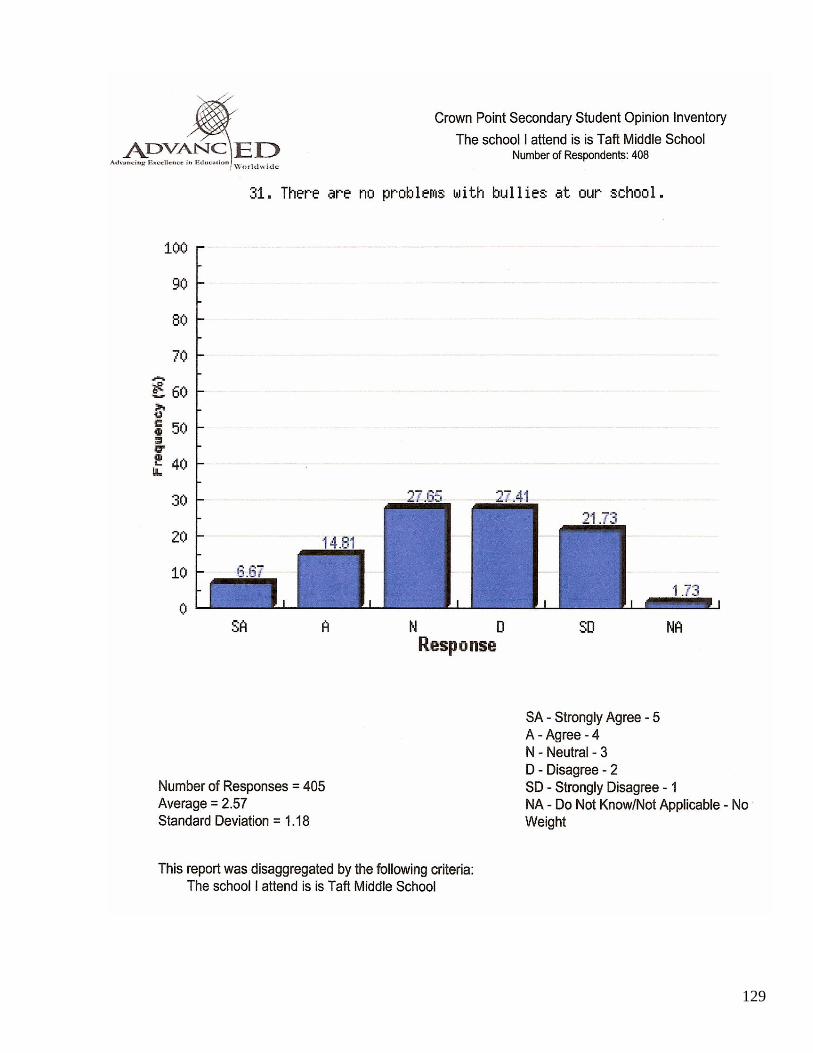
129
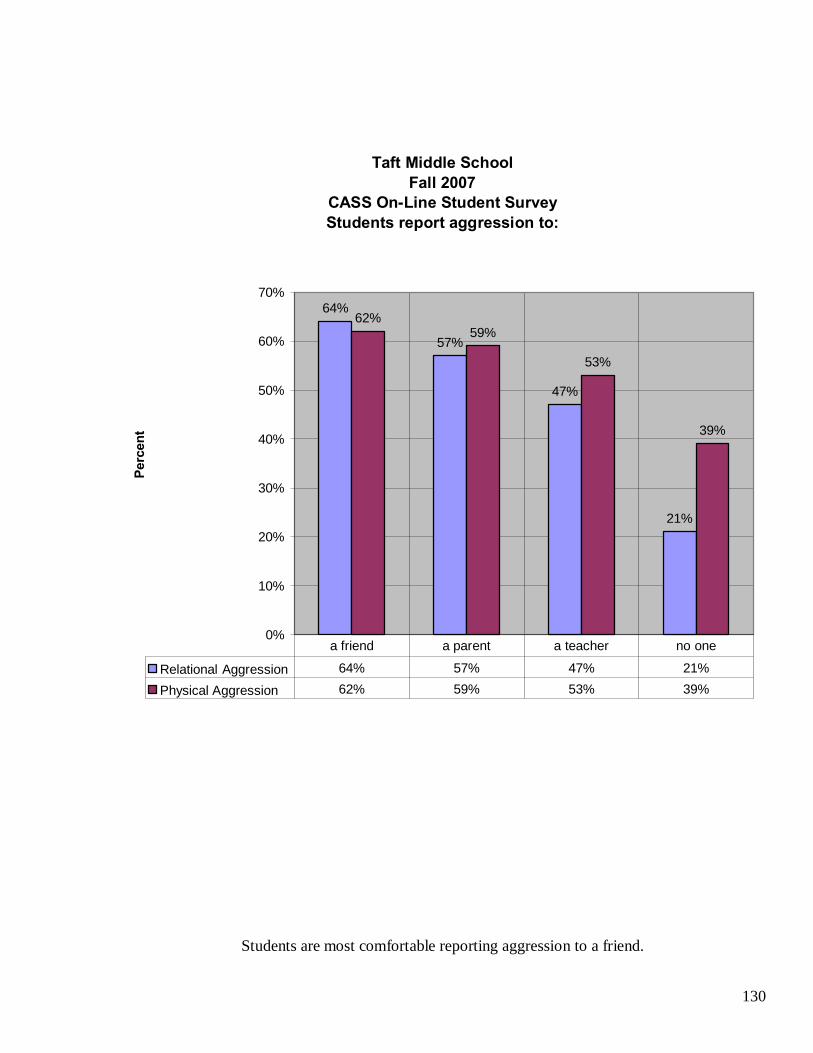
130
Taft Middle SchoolFall 2007
CASS On-Line Student SurveyStudents report aggression to:
64%
57%
47%
21%
62%59%
53%
39%
0%
10%
20%
30%
40%
50%
60%
70%
Perc
ent
Relational Aggression 64% 57% 47% 21%
Physical Aggression 62% 59% 53% 39%
a friend a parent a teacher no one
Students are most comfortable reporting aggression to a friend.
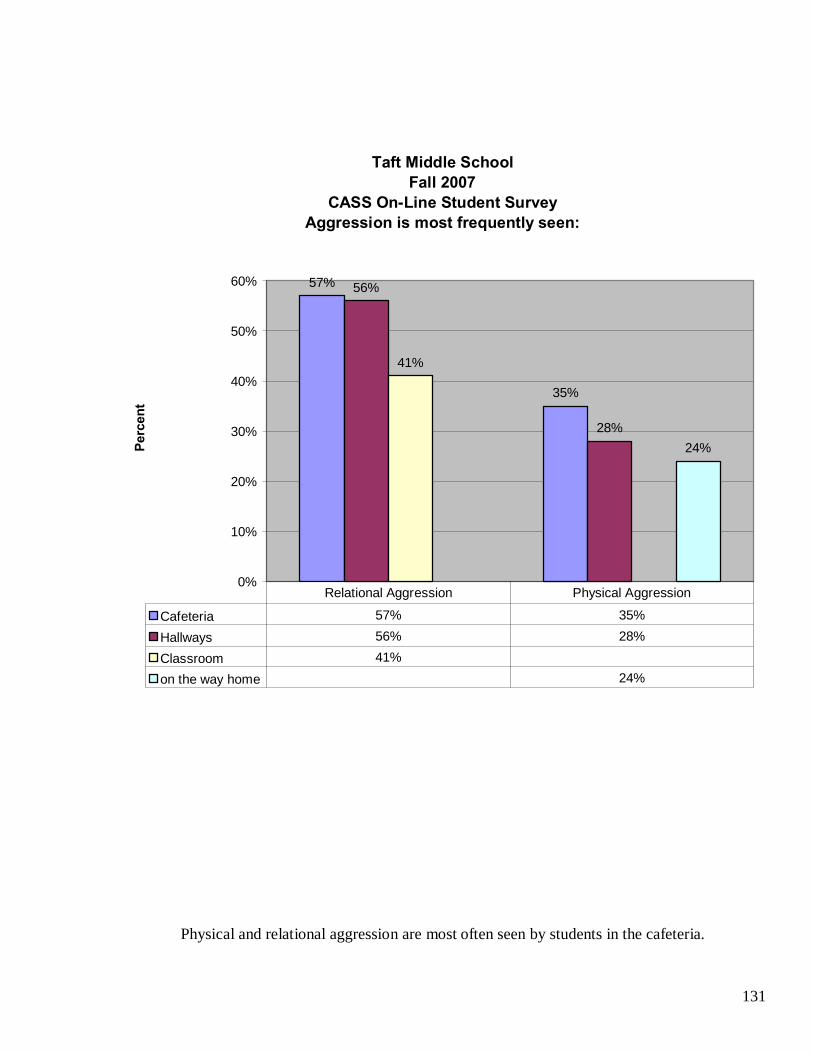
131
Taft Middle SchoolFall 2007
CASS On-Line Student SurveyAggression is most frequently seen:
57%
35%
56%
28%
41%
24%
0%
10%
20%
30%
40%
50%
60%
Perc
ent
Cafeteria 57% 35%
Hallways 56% 28%
Classroom 41%
on the way home 24%
Relational Aggression Physical Aggression
Physical and relational aggression are most often seen by students in the cafeteria.
132
DRUG/ALCOHOL STUDENT SURVEY
The findings from the 2007 Indiana Drug, Alcohol, Tobacco, and Other Drug Use survey indicate that Crown Point Community School Corporation reports prevalence rates that were higher than the state rates. In particular 10th and 12th grade students reported rates for alcohol that were higher than the state rates, and 10th grade students reported prevalence rates for marijuana that were higher than the state rates. However, 6th grade students reported prevalence rates for cigarette smoking that were lower than the state rates (pages 133-138).
• Monthly prevalence rates were higher than state rates for cigars (12th), pipe (8th, 10th, and 12th), alcohol (8th, 10th, and 12th), marijuana (10th), Ritalin (8th and 10th), narcotics (10th), MDMA (10th and 12th), and over the counter drugs (8th).
Data submitted from: The Indiana Prevention Resource Center/School of Health, Physical Education, and Recreation
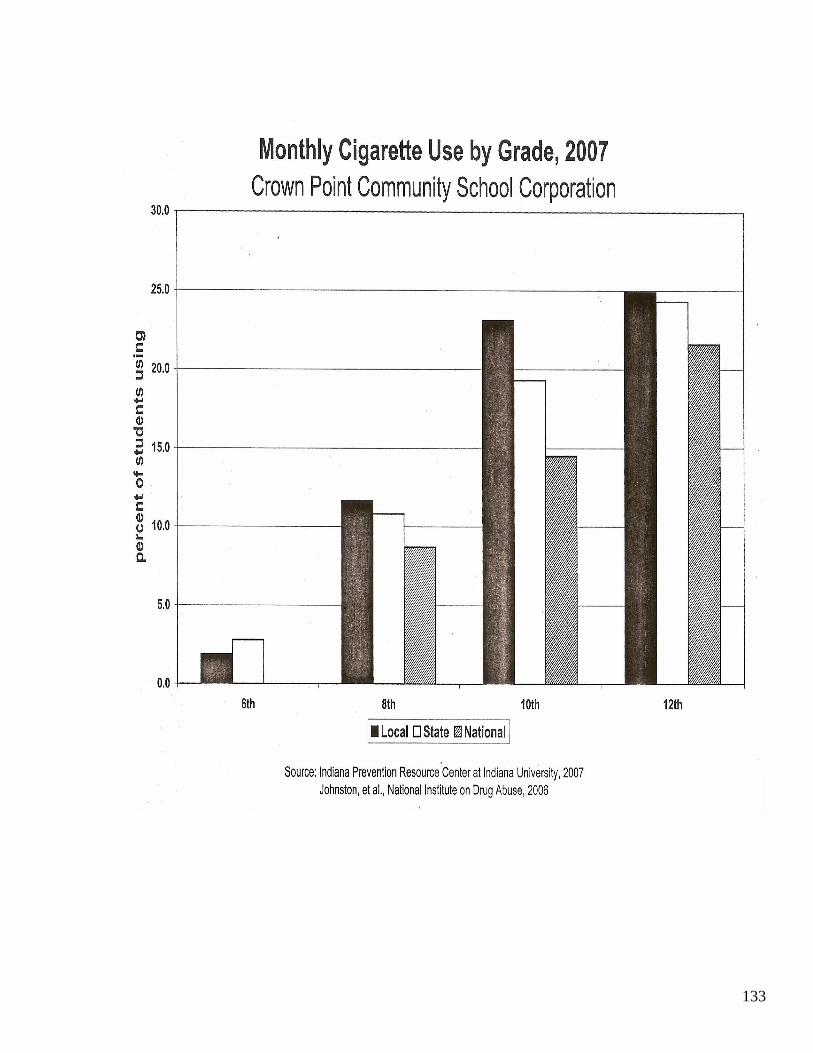
133
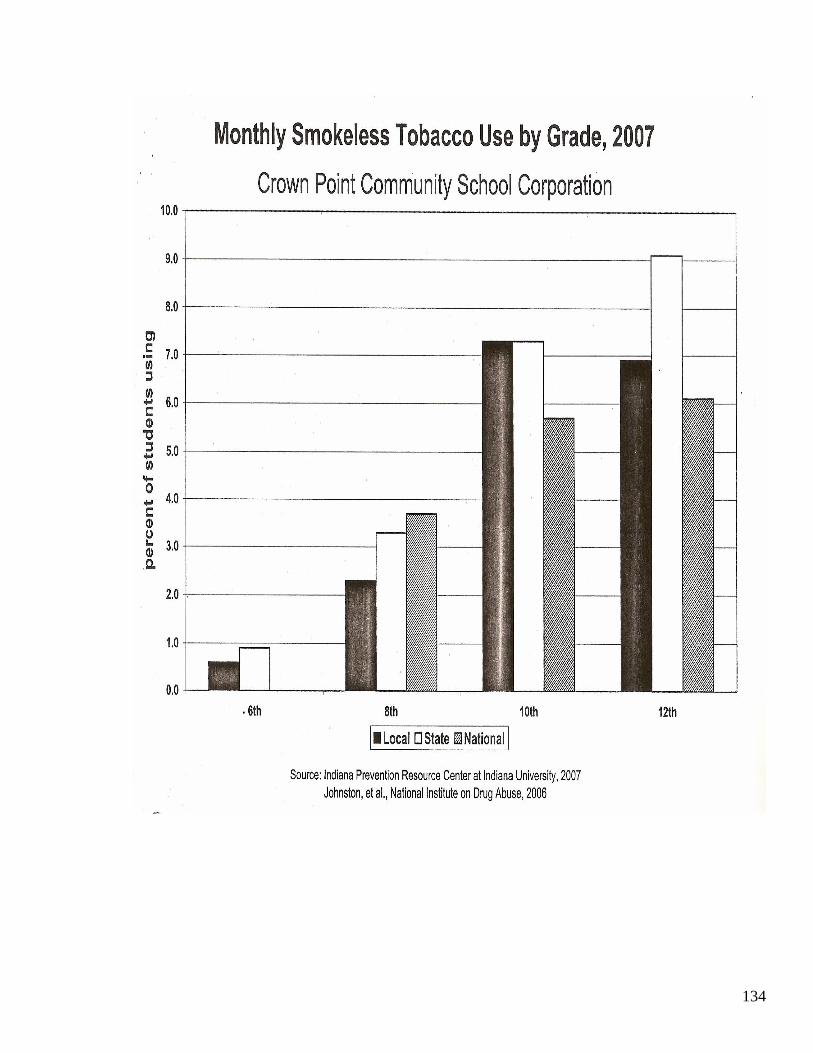
134
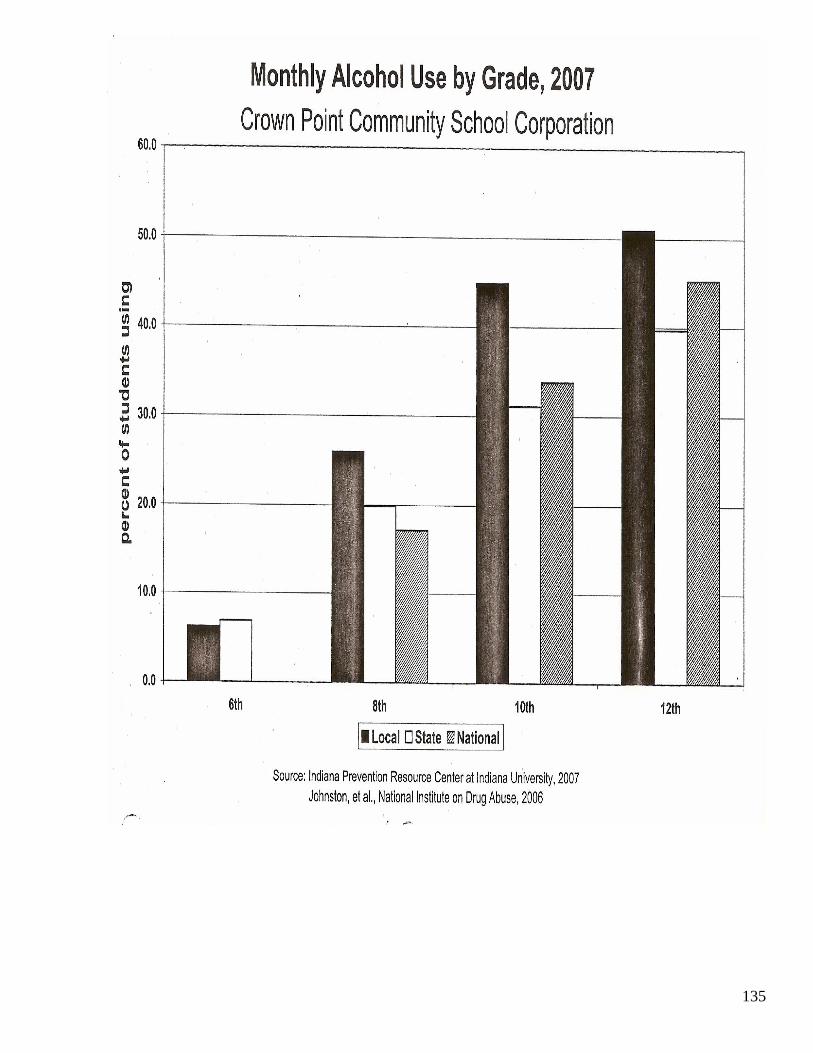
135
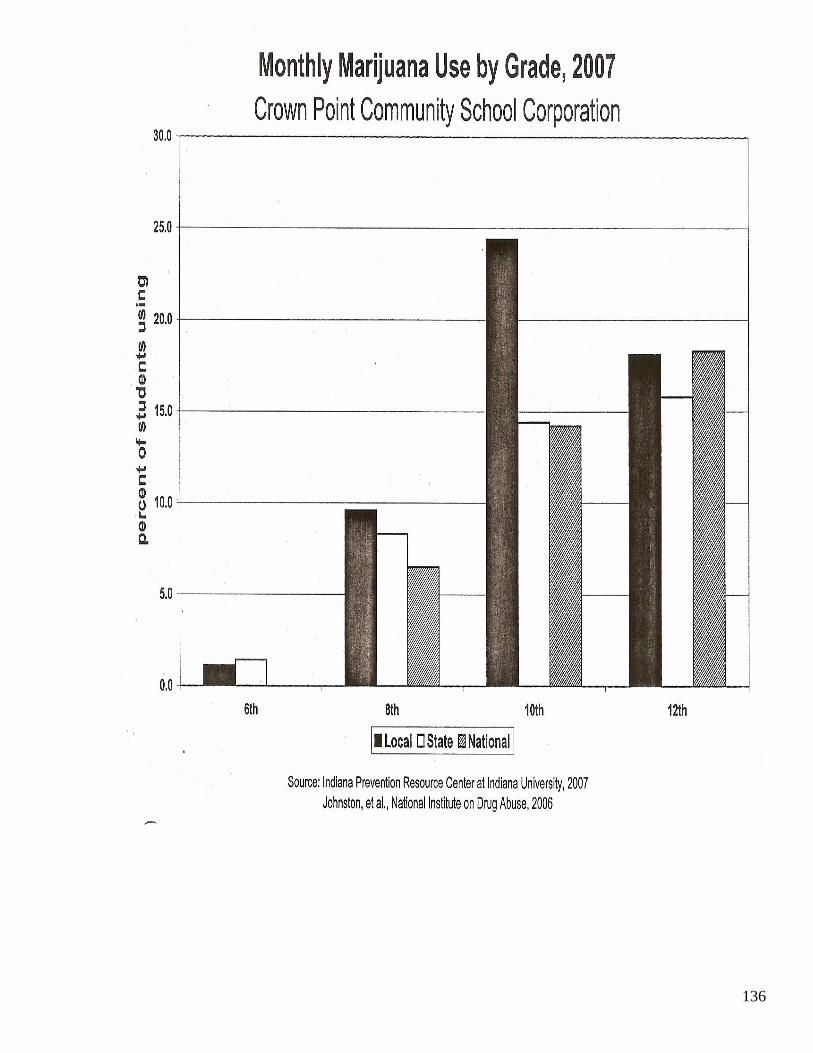
136
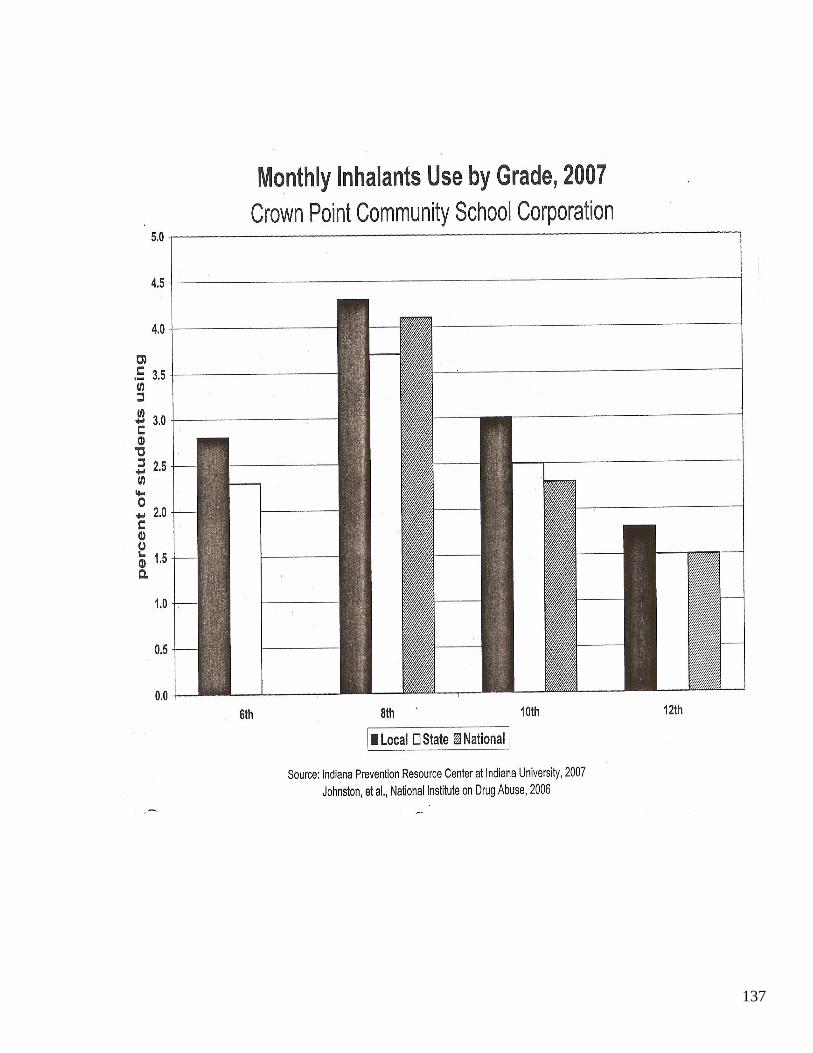
137
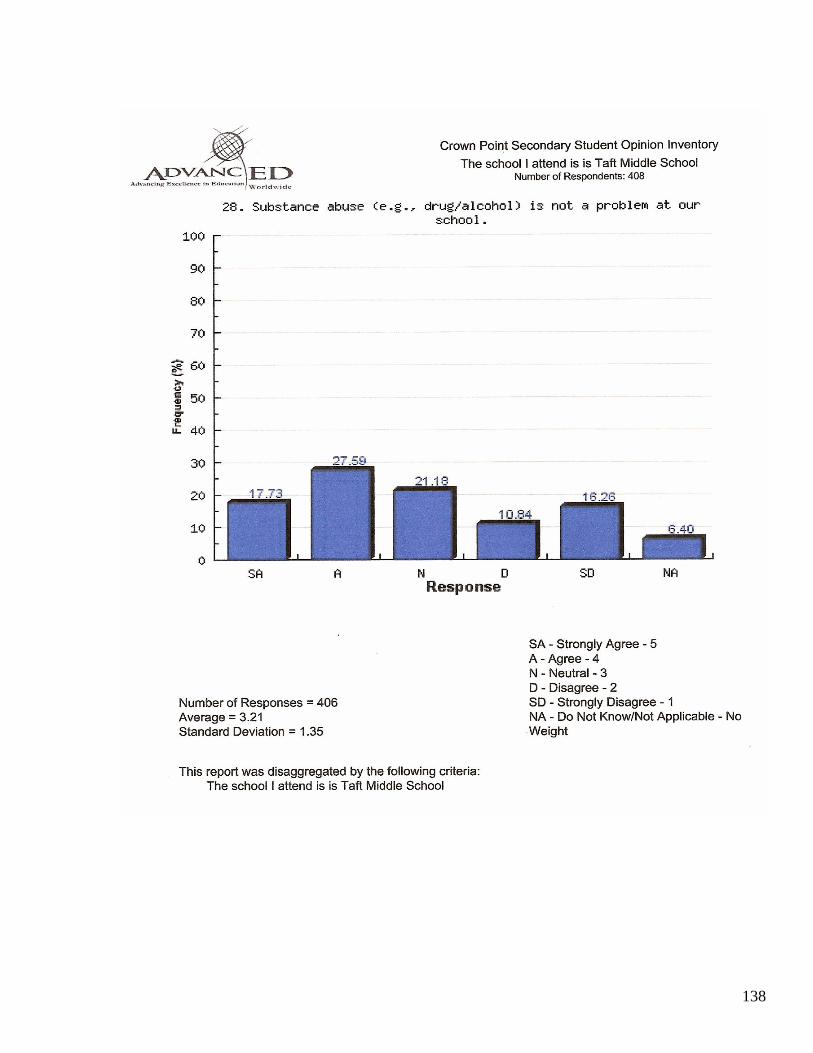
138
139
AN EVALUATION SYSTEM THAT PROVIDES FOR THE PROFESSIONAL GROWTH OF ALL PERSONNEL
Taft administration employs a two-tiered evaluation system that is used district-wide to
observe, evaluate and provide for professional growth for teachers.
Tier one is the summative program. All teachers on the summative program are observed by an administrator. Data is written on the observation form, a copy of which is given to the teacher. A conference is scheduled with the administrator within five days of the formal observation. A final evaluation form is completed by the administrator and each item is checked either “proficient” or “needs improvement”. At Taft, evaluation conferences are forums for discussions of how instructional practices align with school improvement goals. Teachers are guided to use current best practices, based on research to support school-wide goals.
Tier two is the formative model which has, as its core, a professional growth plan. The plan is a collaborative effort by a teacher or group of teachers and an administrator. Teachers who have signed their third contract with the Crown Point Community School Corporation and have received “all proficient” are eligible for this program. Plans must be based on professional teaching standards or the school’s improvement goals. A list of recommended, prescribed questions can be used at the final review meeting in order to assess the effectiveness of the plan. Sample questions include:
• How does the plan relate to the professional teaching standard, state standard or school improvement goals?
• How would you evaluate your professional growth during this growth plan period? • Did the professional growth plan affect learning in any way?
140
CONTINUOUS IMPROVEMENT OF TEACHING AND LEARNING PROCESSES
In the future, the goal of the language arts department is to have students become aware of the fact that while reading, they must connect, reflect, and react before they can record. These strategies will aid in the improvement of both reading comprehension and writing skills. All teachers will be in-serviced on specific reading strategies that can apply to all areas of the curriculum. This will enable teachers to instruct students in specific reading strategies and apply these strategies to their curriculum area. To encourage more active participation in the 6+1 Trait Writing Program, each department is selecting the writing trait (ideas, organization, voice, word choices, and sentence fluency) that is most applicable to their department and assign to their students a writing activity emphasizing that trait. The trait will be discussed, the writing activity assigned and completed by students, assessment made with the 6+1 Trait Writing Rubric and followed by teacher student discussion of the assessment process. As we look to critical thinking/problem solving in the future, it is our goal to in-service all staff with the more in depth problem solving framework, so that students can be instructed in this more in depth approach across all curriculum areas. A common rubric will be used across the curriculum to assess critical thinking/problem solving skills. Students will be instructed how to assess themselves by using the same rubric, but in language that is conducive to student understanding.
141
School Improvement Action Plan • Goal Statement: All students will improve problem solving/critical thinking skills
across the curriculum. o Intervention I: All students will improve their reading skills in all areas of the
curriculum (page 142). o Intervention II: All students will improve their writing skills in all areas of the
curriculum (page 146). o Intervention III: All students will be responsible for setting achievement/behavior
goals and working to maintain them (page 151). o Research Citations (page 154).
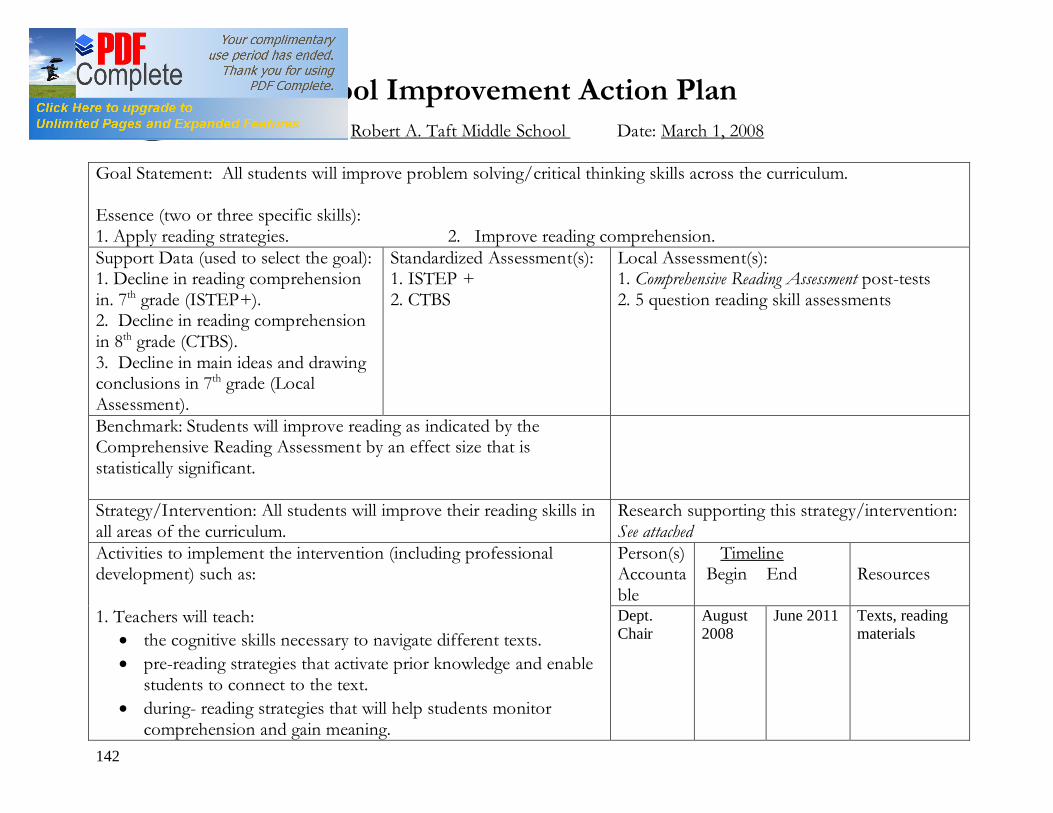
142
School Improvement Action Plan
School: Robert A. Taft Middle School Date: March 1, 2008 Goal Statement: All students will improve problem solving/critical thinking skills across the curriculum. Essence (two or three specific skills): 1. Apply reading strategies. 2. Improve reading comprehension. Support Data (used to select the goal): 1. Decline in reading comprehension in. 7th grade (ISTEP+). 2. Decline in reading comprehension in 8th grade (CTBS). 3. Decline in main ideas and drawing conclusions in 7th grade (Local Assessment).
Standardized Assessment(s): 1. ISTEP + 2. CTBS
Local Assessment(s): 1. Comprehensive Reading Assessment post-tests 2. 5 question reading skill assessments
Benchmark: Students will improve reading as indicated by the Comprehensive Reading Assessment by an effect size that is statistically significant.
Strategy/Intervention: All students will improve their reading skills in all areas of the curriculum.
Research supporting this strategy/intervention: See attached
Activities to implement the intervention (including professional development) such as:
Person(s) Accountable
Timeline Begin End
Resources
1. Teachers will teach: • the cognitive skills necessary to navigate different texts. • pre-reading strategies that activate prior knowledge and enable
students to connect to the text. • during- reading strategies that will help students monitor
comprehension and gain meaning.
Dept. Chair
August 2008
June 2011
Texts, reading materials
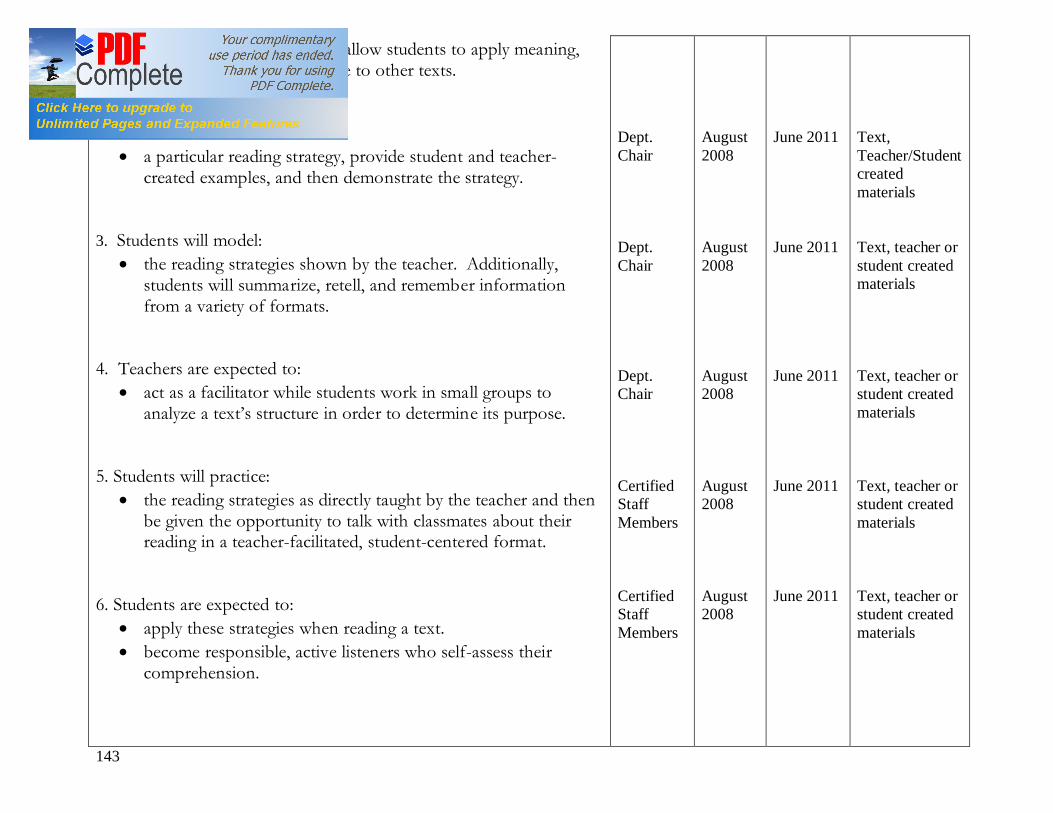
143
• after-reading strategies that allow students to apply meaning, share information, and relate to other texts.
2. Teachers will model:
• a particular reading strategy, provide student and teacher-created examples, and then demonstrate the strategy.
3. Students will model:
• the reading strategies shown by the teacher. Additionally, students will summarize, retell, and remember information from a variety of formats.
4. Teachers are expected to:
• act as a facilitator while students work in small groups to analyze a text’s structure in order to determine its purpose.
5. Students will practice:
• the reading strategies as directly taught by the teacher and then be given the opportunity to talk with classmates about their reading in a teacher-facilitated, student-centered format.
6. Students are expected to:
• apply these strategies when reading a text. • become responsible, active listeners who self-assess their
comprehension.
Dept. Chair Dept. Chair Dept. Chair Certified Staff Members Certified Staff Members
August 2008 August 2008 August 2008 August 2008 August 2008
June 2011 June 2011 June 2011 June 2011 June 2011
Text, Teacher/Student created materials Text, teacher or student created materials Text, teacher or student created materials Text, teacher or student created materials Text, teacher or student created materials
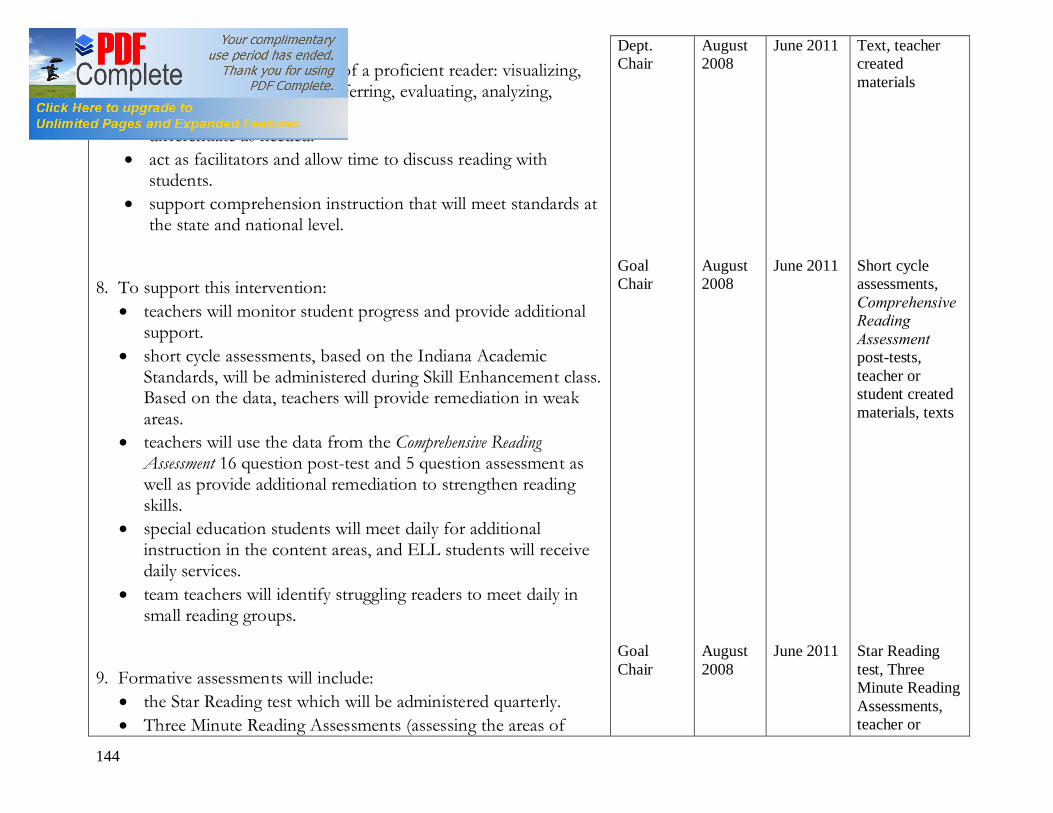
144
7. Teachers are expected to: • demonstrate the strategies of a proficient reader: visualizing,
connecting, questioning, inferring, evaluating, analyzing, recalling, and monitoring.
• differentiate as needed. • act as facilitators and allow time to discuss reading with
students. • support comprehension instruction that will meet standards at
the state and national level.
8. To support this intervention: • teachers will monitor student progress and provide additional
support. • short cycle assessments, based on the Indiana Academic
Standards, will be administered during Skill Enhancement class. Based on the data, teachers will provide remediation in weak areas.
• teachers will use the data from the Comprehensive Reading Assessment 16 question post-test and 5 question assessment as well as provide additional remediation to strengthen reading skills.
• special education students will meet daily for additional instruction in the content areas, and ELL students will receive daily services.
• team teachers will identify struggling readers to meet daily in small reading groups.
9. Formative assessments will include:
• the Star Reading test which will be administered quarterly. • Three Minute Reading Assessments (assessing the areas of
Dept. Chair Goal Chair Goal Chair
August 2008 August 2008 August 2008
June 2011 June 2011 June 2011
Text, teacher created materials Short cycle assessments, Comprehensive Reading Assessment post-tests, teacher or student created materials, texts Star Reading test, Three Minute Reading Assessments, teacher or
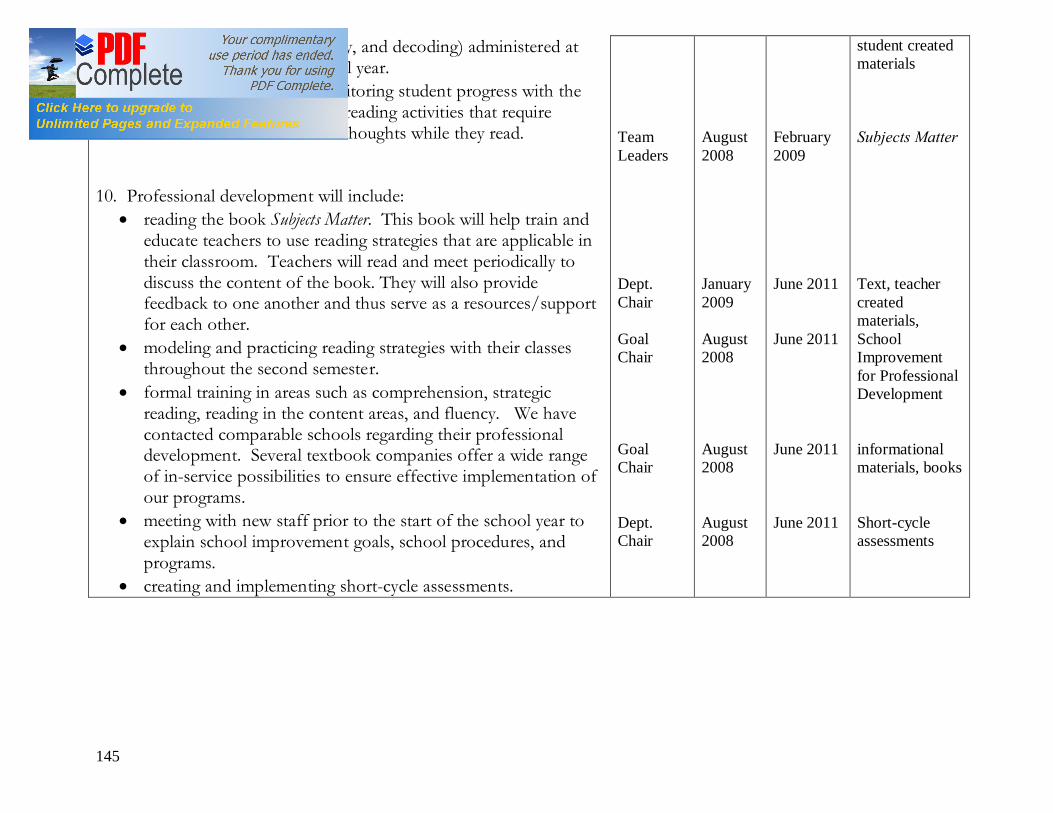
145
comprehension, automaticity, and decoding) administered at the beginning of each school year.
• individual departments monitoring student progress with the use of pre, during and after reading activities that require students to document their thoughts while they read.
10. Professional development will include: • reading the book Subjects Matter. This book will help train and
educate teachers to use reading strategies that are applicable in their classroom. Teachers will read and meet periodically to discuss the content of the book. They will also provide feedback to one another and thus serve as a resources/support for each other.
• modeling and practicing reading strategies with their classes throughout the second semester.
• formal training in areas such as comprehension, strategic reading, reading in the content areas, and fluency. We have contacted comparable schools regarding their professional development. Several textbook companies offer a wide range of in-service possibilities to ensure effective implementation of our programs.
• meeting with new staff prior to the start of the school year to explain school improvement goals, school procedures, and programs.
• creating and implementing short-cycle assessments.
Team Leaders Dept. Chair Goal Chair Goal Chair Dept. Chair
August 2008 January 2009 August 2008 August 2008 August 2008
February 2009 June 2011 June 2011 June 2011 June 2011
student created materials Subjects Matter Text, teacher created materials, School Improvement for Professional Development informational materials, books Short-cycle assessments
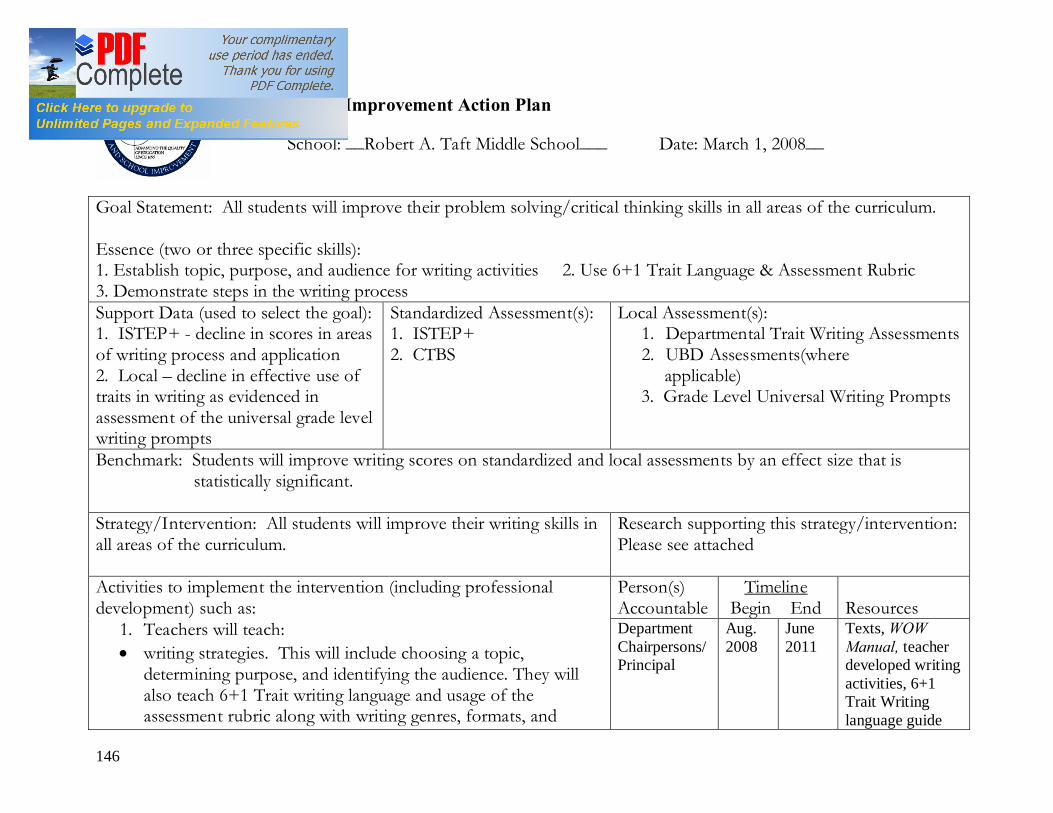
146
School Improvement Action Plan
School: __Robert A. Taft Middle School___ Date: March 1, 2008__ Goal Statement: All students will improve their problem solving/critical thinking skills in all areas of the curriculum. Essence (two or three specific skills): 1. Establish topic, purpose, and audience for writing activities 2. Use 6+1 Trait Language & Assessment Rubric 3. Demonstrate steps in the writing process Support Data (used to select the goal): 1. ISTEP+ - decline in scores in areas of writing process and application 2. Local – decline in effective use of traits in writing as evidenced in assessment of the universal grade level writing prompts
Standardized Assessment(s): 1. ISTEP+ 2. CTBS
Local Assessment(s): 1. Departmental Trait Writing Assessments 2. UBD Assessments(where
applicable) 3. Grade Level Universal Writing Prompts
Benchmark: Students will improve writing scores on standardized and local assessments by an effect size that is statistically significant. Strategy/Intervention: All students will improve their writing skills in all areas of the curriculum.
Research supporting this strategy/intervention: Please see attached
Activities to implement the intervention (including professional development) such as:
Person(s) Accountable
Timeline Begin End
Resources
1. Teachers will teach: • writing strategies. This will include choosing a topic,
determining purpose, and identifying the audience. They will also teach 6+1 Trait writing language and usage of the assessment rubric along with writing genres, formats, and
Department Chairpersons/Principal
Aug. 2008
June 2011
Texts, WOW Manual, teacher developed writing activities, 6+1 Trait Writing language guide
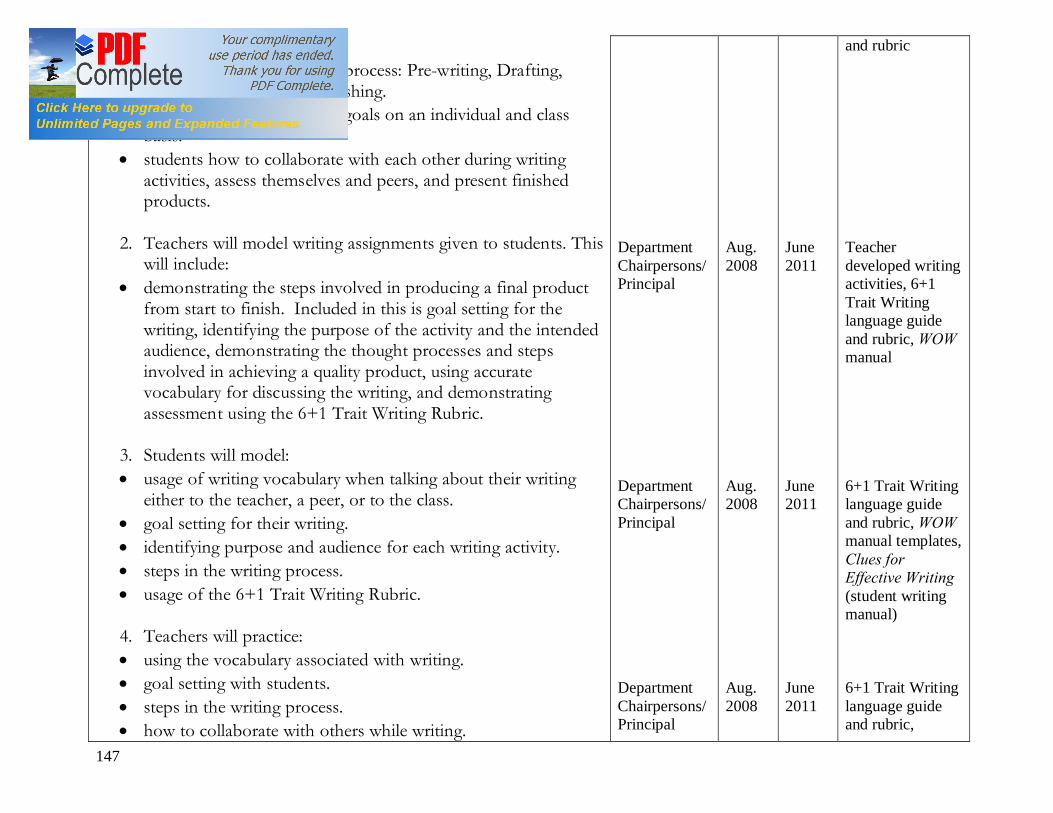
147
styles. • the five steps in the writing process: Pre-writing, Drafting,
Revising, Editing, and Publishing. • students how to set writing goals on an individual and class
basis. • students how to collaborate with each other during writing
activities, assess themselves and peers, and present finished products.
2. Teachers will model writing assignments given to students. This
will include: • demonstrating the steps involved in producing a final product
from start to finish. Included in this is goal setting for the writing, identifying the purpose of the activity and the intended audience, demonstrating the thought processes and steps involved in achieving a quality product, using accurate vocabulary for discussing the writing, and demonstrating assessment using the 6+1 Trait Writing Rubric.
3. Students will model: • usage of writing vocabulary when talking about their writing
either to the teacher, a peer, or to the class. • goal setting for their writing. • identifying purpose and audience for each writing activity. • steps in the writing process. • usage of the 6+1 Trait Writing Rubric.
4. Teachers will practice: • using the vocabulary associated with writing. • goal setting with students. • steps in the writing process. • how to collaborate with others while writing.
Department Chairpersons/Principal Department Chairpersons/ Principal Department Chairpersons/ Principal
Aug. 2008 Aug. 2008 Aug. 2008
June 2011 June 2011 June 2011
and rubric Teacher developed writing activities, 6+1 Trait Writing language guide and rubric, WOW manual 6+1 Trait Writing language guide and rubric, WOW manual templates, Clues for Effective Writing (student writing manual) 6+1 Trait Writing language guide and rubric,

148
• assessing writing with students by using their own writing.
5. Students will practice: • goal setting both individually and as a class. • collaborating with other students. • assessing their own and other students’ writing. • steps in the writing process.
6. Students are expected to: • independently apply writing strategies in all subject areas. • experiment with different writing genres. • self assess in order to adjust their writing practice to facilitate
reaching their goal. • seek assistance from teachers when needed. • continually attempt to improve their writing.
7. Teachers are expected to: • facilitate writing in their classrooms by providing students with
opportunities for guided practice. • use formative assessments along the way to determine if
students are understanding writing instruction. • gather data on writing, analyze it, and use it to change or better
instructional strategies in order to meet the needs of all students.
8. To support the intervention: • every department will select a writing trait/s that is/are most
applicable to their department and reinforce it throughout the school year either in discussion with students or in formal writing activities.
• periodic assessments will be completed to determine if the
Department Chairpersons Department Chairpersons Department Chairpersons/ Principal Department Chairpersons/Principal
Aug. 2008 Aug. 2008 Aug. 2008 Aug. 2008
June 2011 June 2011 June 2011 June 2011
teacher-made activities 6+1 Trait Writing language guide and rubric, WOW manual, Clues to Effective Writing Teacher writing mini-lessons, Clues to Effective Writing Teacher-made formative assessments based on writing standards” indicators, data collection grids 6+1 Trait Writing language guide and rubric;
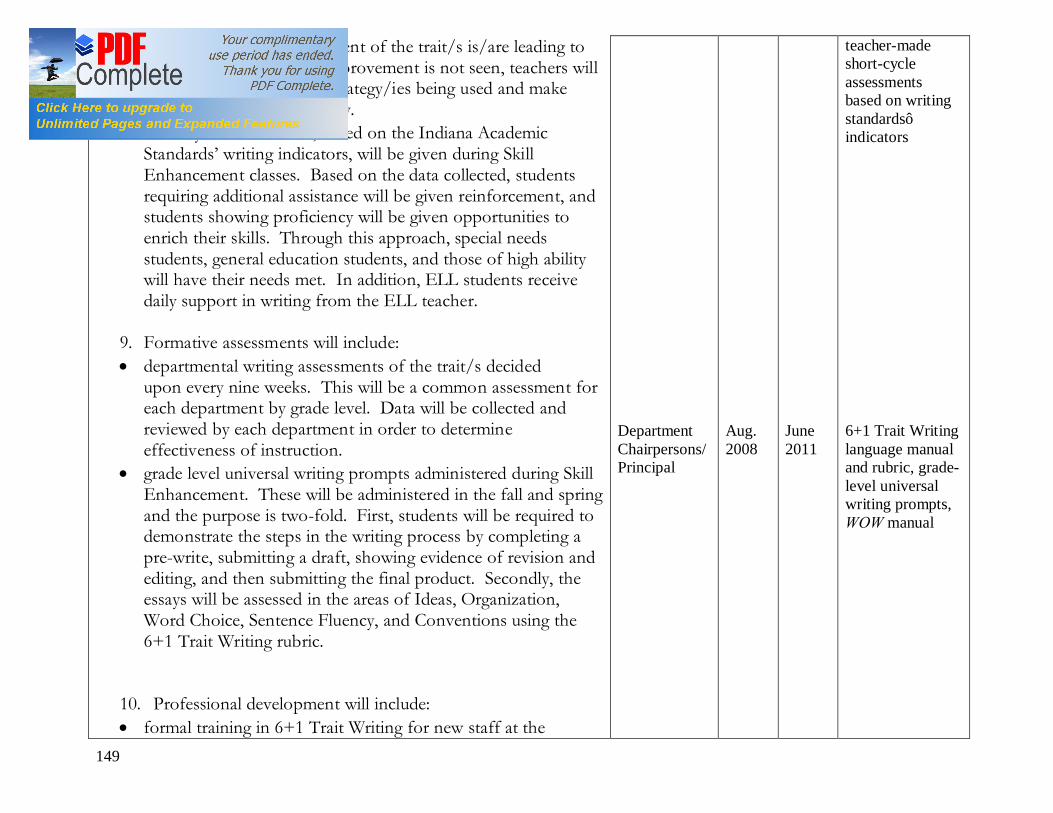
149
above discussed reinforcement of the trait/s is/are leading to writing improvement. If improvement is not seen, teachers will evaluate the instructional strategy/ies being used and make adjustments where necessary.
• short-cycle assessments, based on the Indiana Academic Standards’ writing indicators, will be given during Skill Enhancement classes. Based on the data collected, students requiring additional assistance will be given reinforcement, and students showing proficiency will be given opportunities to enrich their skills. Through this approach, special needs students, general education students, and those of high ability will have their needs met. In addition, ELL students receive daily support in writing from the ELL teacher.
9. Formative assessments will include: • departmental writing assessments of the trait/s decided
upon every nine weeks. This will be a common assessment for each department by grade level. Data will be collected and reviewed by each department in order to determine effectiveness of instruction.
• grade level universal writing prompts administered during Skill Enhancement. These will be administered in the fall and spring and the purpose is two-fold. First, students will be required to demonstrate the steps in the writing process by completing a pre-write, submitting a draft, showing evidence of revision and editing, and then submitting the final product. Secondly, the essays will be assessed in the areas of Ideas, Organization, Word Choice, Sentence Fluency, and Conventions using the 6+1 Trait Writing rubric.
10. Professional development will include: • formal training in 6+1 Trait Writing for new staff at the
Department Chairpersons/Principal
Aug. 2008
June 2011
teacher-made short-cycle assessments based on writing standards’ indicators 6+1 Trait Writing language manual and rubric, grade-level universal writing prompts, WOW manual

150
beginning of each school year. • review of steps in the writing process during tea meetings at the
beginning of each school year. • assessment of departmental writing samples during team meetings using the 6+1 Trait Writing rubric at least one time during each nine weeks. • reading professional journals and books outlining Best
Practice in writing on an on-going basis. Ideas will be shared at “book talks” held periodically during team meetings.
Principal/Lan-guage Arts Teachers/ Team Leaders/Department Chairperson
Aug. 2008
June 2011
School Improvement Funding for Professional Development, Discussion of “Best Practice” in writing
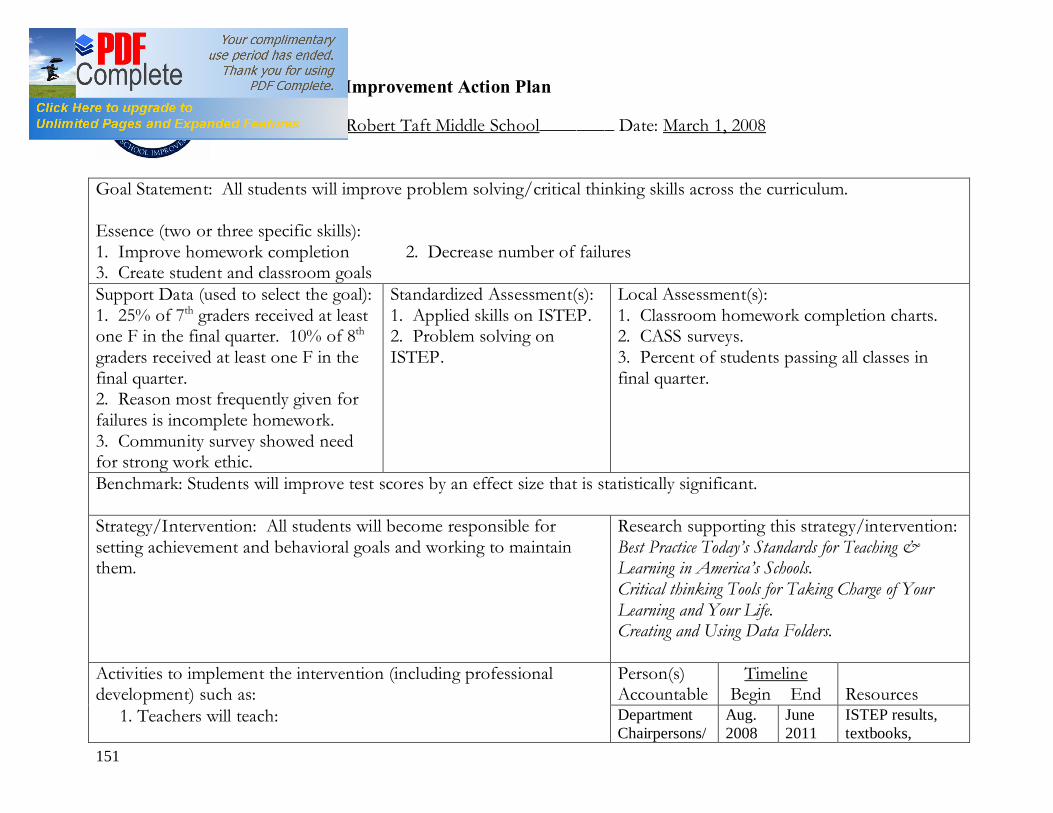
151
School Improvement Action Plan
School: Robert Taft Middle School________ Date: March 1, 2008 Goal Statement: All students will improve problem solving/critical thinking skills across the curriculum. Essence (two or three specific skills): 1. Improve homework completion 2. Decrease number of failures 3. Create student and classroom goals Support Data (used to select the goal): 1. 25% of 7th graders received at least one F in the final quarter. 10% of 8th graders received at least one F in the final quarter. 2. Reason most frequently given for failures is incomplete homework. 3. Community survey showed need for strong work ethic.
Standardized Assessment(s): 1. Applied skills on ISTEP. 2. Problem solving on ISTEP.
Local Assessment(s): 1. Classroom homework completion charts. 2. CASS surveys. 3. Percent of students passing all classes in final quarter.
Benchmark: Students will improve test scores by an effect size that is statistically significant. Strategy/Intervention: All students will become responsible for setting achievement and behavioral goals and working to maintain them.
Research supporting this strategy/intervention: Best Practice Today’s Standards for Teaching & Learning in America’s Schools. Critical thinking Tools for Taking Charge of Your Learning and Your Life. Creating and Using Data Folders.
Activities to implement the intervention (including professional development) such as:
Person(s) Accountable
Timeline Begin End
Resources
1. Teachers will teach: Department Chairpersons/
Aug. 2008
June 2011
ISTEP results, textbooks,
152
• Strategies for creating reasonable and valid goals. • Standards that have been identified in use with short-cycle
assessments. • CASS lessons to create a positive learning community. 2. Teachers will model: • Appropriate goal setting for the classroom. • Appropriate behaviors to model the CASS program. 3. Students will model: • Appropriate goal setting strategies. • Behaviors that are in line with CASS expectations. 4. Teachers will practice: • Skills that have been identified in short-cycle assessments. • Remediation will be given to those who are not proficient. • Enrichment will be given to those who are proficient. 5. Students will practice: • Skills that have been identified as areas of weakness. • Assessing their goals and adjusting them when appropriate. 6. Students are expected to: • Set goals that are appropriate for their ability level. • Work to achieve the goals that they have set. • Maintain data folders that show the progress that they have
made over time. • Behave in a manner that follows the expectations of the CASS
program. • Take responsibility for their actions and behaviors.
Team Leaders/ Principal Department Chairpersons/Team Leaders Classroom teachers Department Chairpersons/Principal Classroom teachers Classroom teachers/individual students.
Teacher and department developed lessons, CASS lessons CASS lessons. CASS lessons Teacher and department developed lessons Teacher developed activities and lessons. Creating and Using Data Folders. CASS lessons and activities.
153
7. Teachers are expected to: • Set classroom goals that are appropriate for their classroom. • Encourage students to work toward their individual and
classroom goals. • Help keep data folders organized and manageable. • Hold students to behaviors and actions that are in line with the
expectations of the CASS program. 8. To support the intervention: • CASS program will continue to be utilized. • Improvements will be made in AC room to help make students
more responsible for their behaviors. • Student-led conferences will be implemented to help students
take more responsibility for their own goals. 9. Formative assessments will include: • Short-cycle assessments based on the Indiana Academic
Standards that departments have chosen to address. 10. Professional development will include: • Training in implementation of student-led conferences. • Visitation of student-led conferences. • Training in setting appropriate classroom and individual goals.
Department chairpersons/Team leaders/Principal. Responsibility committee/ CASS leaders/ Principal Department chairperson Responsibility committee/ Principal
Creating and Using Data Folders. CASS lessons and activities. CASS lessons. New interventions within the AC room. Department created short-cycle assessments. School Improvement Funding for Professional Development.
154
RESEARCH CITATIONS Reading Zemelman, Steven et al. Best Practice: Today’s Standards for Teaching & Learning in America’s Schools. Portsmouth, NH: Heinemann, 2005. Zemelman, Steven et al. Subjects Matter: Every Teacher’s Guide to Content-Area Reading. Portsmouth, NH: Heinemann, 2004.
Writing Atwell, Nancie.1998. In the Middle: New Understandings About Writing, Reading, and Learning (Second Edition), Portsmouth, NH: Boynton/Cook. Carroll, Joyce Armstrong, and Edward W. Wilson. 1993. Acts of Teaching: How to Teach Writing, Englewood, Colorado: Teachers Ideaa Press. Olson, Carol Booth. 2003. The Reading/Writing Connection: Strategies for Teaching and Learning in the Secondary Classroom. Boston: A & B. Zemelman, Steven, Harvey Daniels, and Arthur Hyde. 2005. Best Practice: Today’s Standards for Teaching & Learning in America’s Schools (Third Edition), Portsmouth, NH: Heinemann.
Student Responsibility Duncan, Sally and Soren Gormley. 2005. Creating and Using Data Folders, (Version Seven), PQ Systems, Inc.
155
Professional Development Plan • Three year plan:
o Year One (page 156) o Year Two (page 159) o Year Three (page 161)
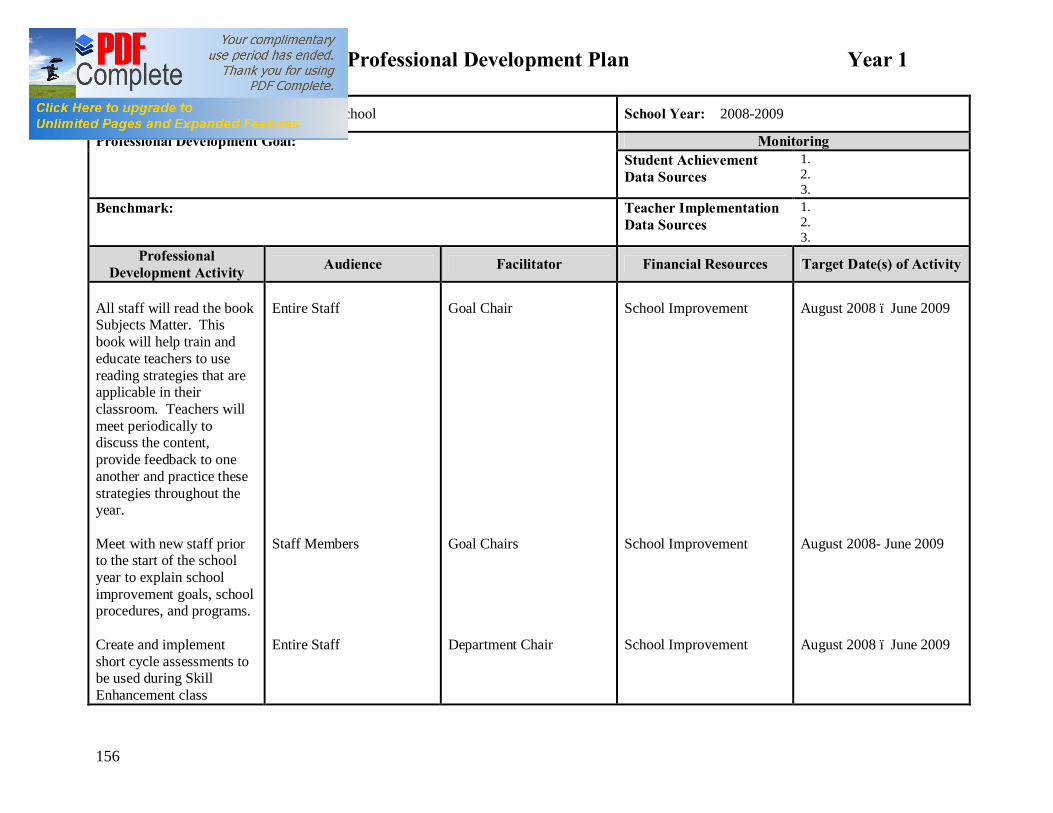
Professional Development Plan Year 1
156
School Name: Robert A. Taft Middle School School Year: 2008-2009
Monitoring Professional Development Goal: Student Achievement Data Sources
1. 2. 3.
Benchmark: Teacher Implementation Data Sources
1. 2. 3.
Professional Development Activity Audience Facilitator Financial Resources Target Date(s) of Activity
All staff will read the book Subjects Matter. This book will help train and educate teachers to use reading strategies that are applicable in their classroom. Teachers will meet periodically to discuss the content, provide feedback to one another and practice these strategies throughout the year. Meet with new staff prior to the start of the school year to explain school improvement goals, school procedures, and programs. Create and implement short cycle assessments to be used during Skill Enhancement class
Entire Staff Staff Members Entire Staff
Goal Chair Goal Chairs Department Chair
School Improvement School Improvement School Improvement
August 2008 – June 2009 August 2008- June 2009 August 2008 – June 2009
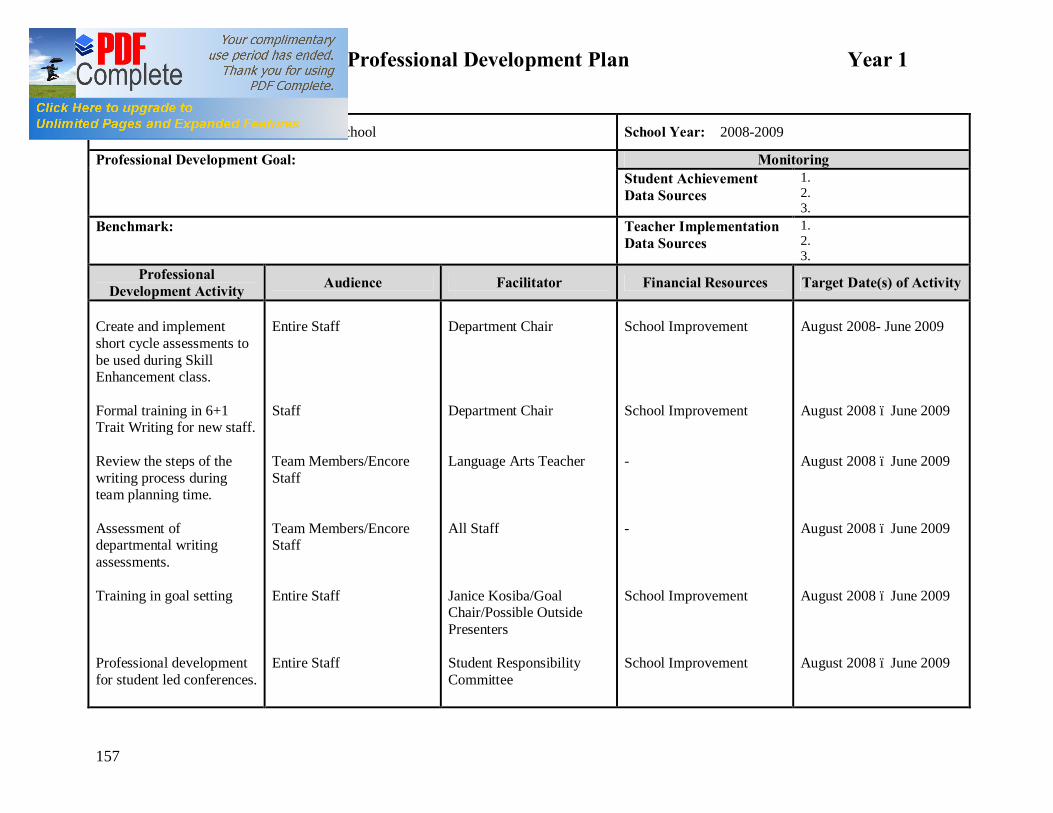
Professional Development Plan Year 1
157
School Name: Robert A. Taft Middle School School Year: 2008-2009
Monitoring Professional Development Goal: Student Achievement Data Sources
1. 2. 3.
Benchmark: Teacher Implementation Data Sources
1. 2. 3.
Professional Development Activity Audience Facilitator Financial Resources Target Date(s) of Activity
Create and implement short cycle assessments to be used during Skill Enhancement class. Formal training in 6+1 Trait Writing for new staff. Review the steps of the writing process during team planning time. Assessment of departmental writing assessments. Training in goal setting Professional development for student led conferences.
Entire Staff Staff Team Members/Encore Staff Team Members/Encore Staff Entire Staff Entire Staff
Department Chair Department Chair Language Arts Teacher All Staff Janice Kosiba/Goal Chair/Possible Outside Presenters Student Responsibility Committee
School Improvement School Improvement - - School Improvement School Improvement
August 2008- June 2009 August 2008 – June 2009 August 2008 – June 2009 August 2008 – June 2009 August 2008 – June 2009 August 2008 – June 2009
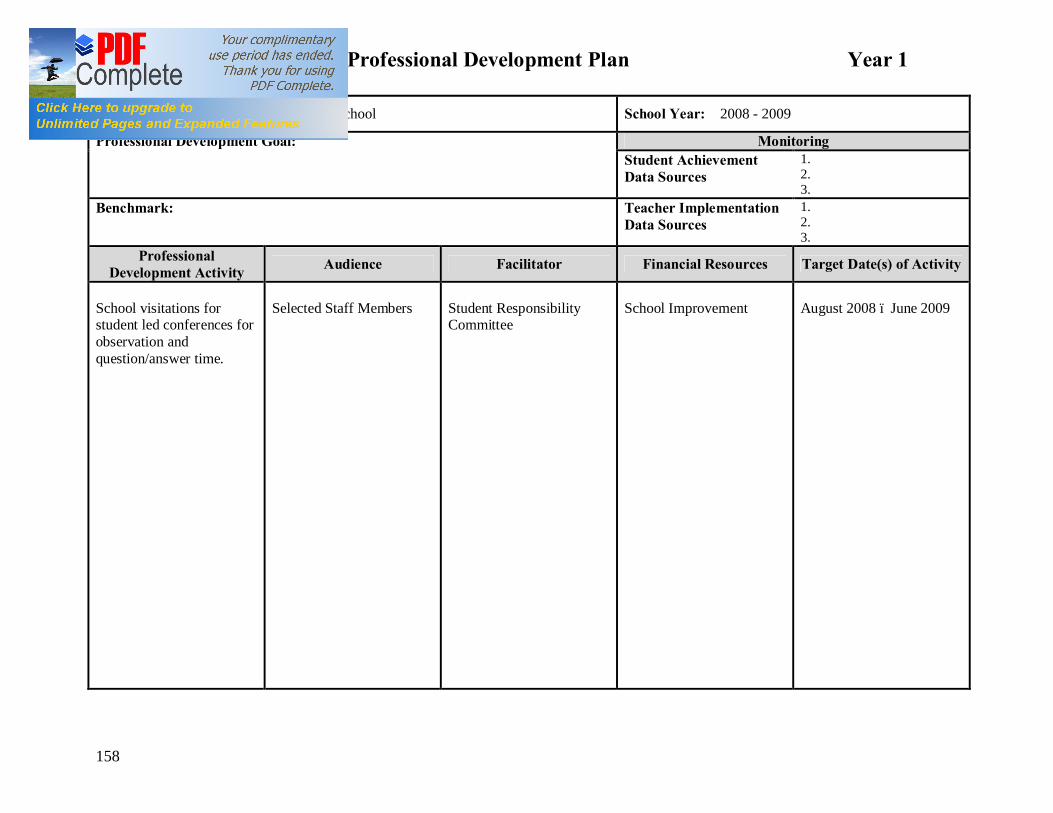
Professional Development Plan Year 1
158
School Name: Robert A. Taft Middle School School Year: 2008 - 2009
Monitoring Professional Development Goal: Student Achievement Data Sources
1. 2. 3.
Benchmark: Teacher Implementation Data Sources
1. 2. 3.
Professional Development Activity Audience Facilitator Financial Resources Target Date(s) of Activity
School visitations for student led conferences for observation and question/answer time.
Selected Staff Members
Student Responsibility Committee
School Improvement
August 2008 – June 2009
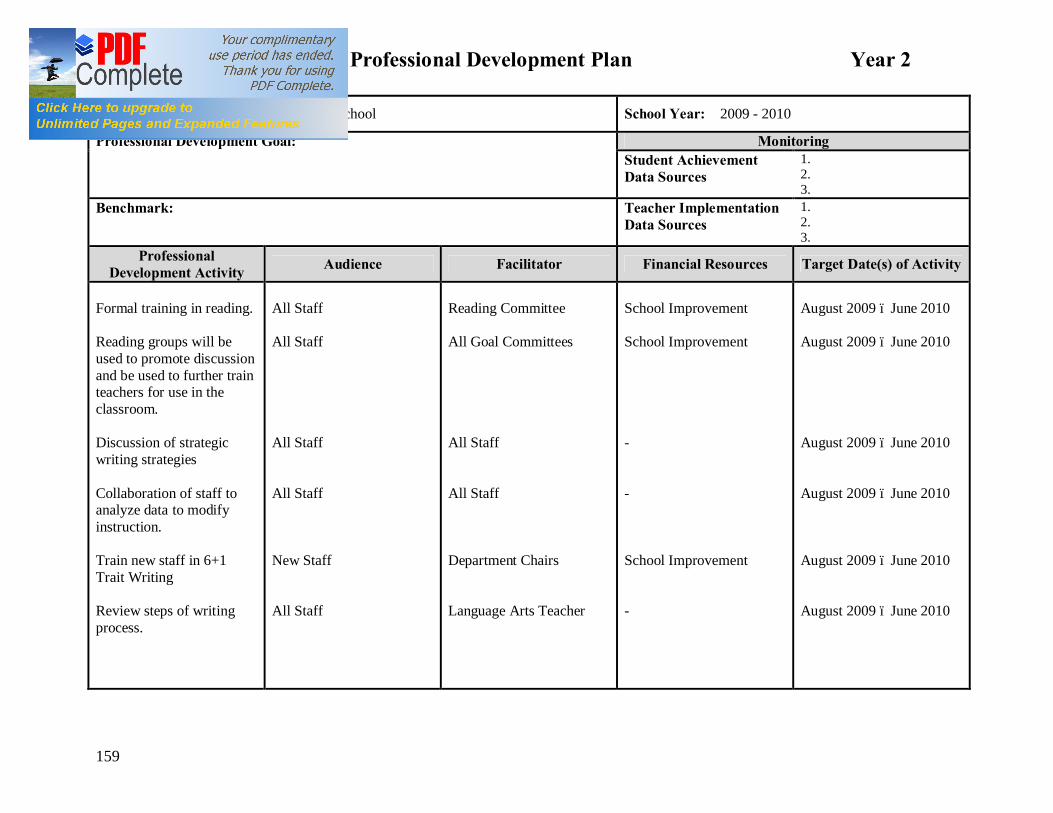
Professional Development Plan Year 2
159
School Name: Robert A. Taft Middle School School Year: 2009 - 2010
Monitoring Professional Development Goal: Student Achievement Data Sources
1. 2. 3.
Benchmark: Teacher Implementation Data Sources
1. 2. 3.
Professional Development Activity Audience Facilitator Financial Resources Target Date(s) of Activity
Formal training in reading. Reading groups will be used to promote discussion and be used to further train teachers for use in the classroom. Discussion of strategic writing strategies Collaboration of staff to analyze data to modify instruction. Train new staff in 6+1 Trait Writing Review steps of writing process.
All Staff All Staff All Staff All Staff New Staff All Staff
Reading Committee All Goal Committees All Staff All Staff Department Chairs Language Arts Teacher
School Improvement School Improvement - - School Improvement -
August 2009 – June 2010 August 2009 – June 2010 August 2009 – June 2010 August 2009 – June 2010 August 2009 – June 2010 August 2009 – June 2010
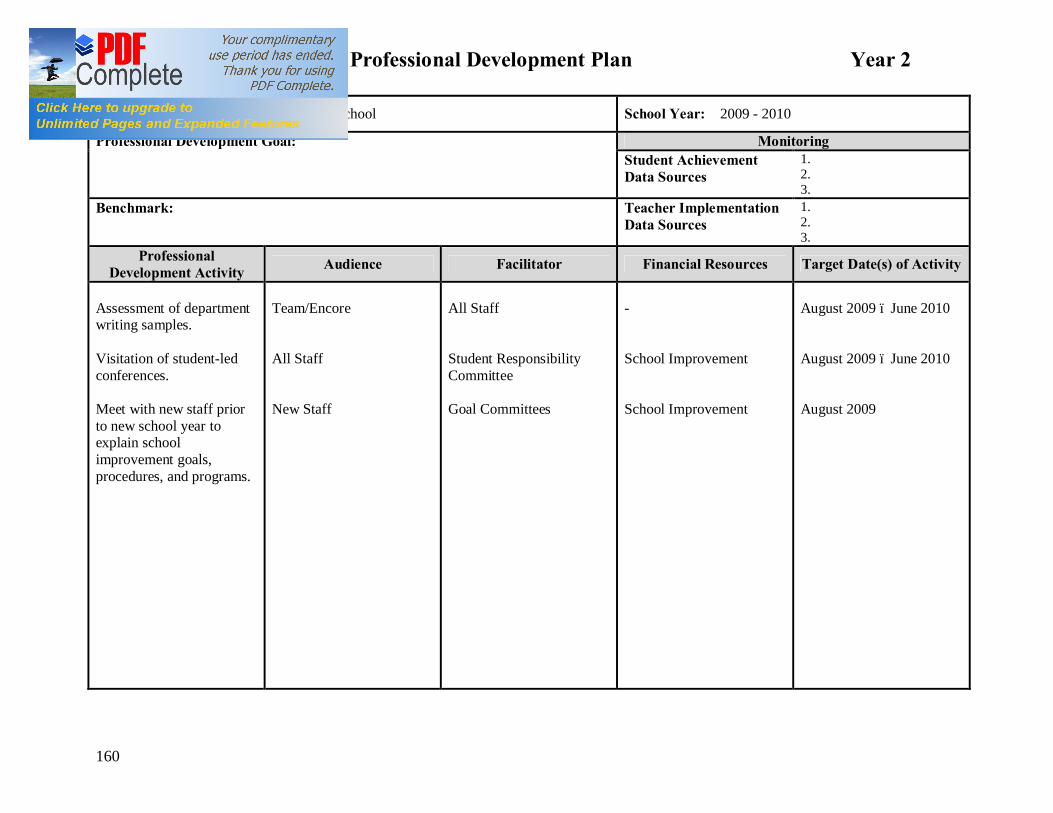
Professional Development Plan Year 2
160
School Name: Robert A. Taft Middle School School Year: 2009 - 2010
Monitoring Professional Development Goal: Student Achievement Data Sources
1. 2. 3.
Benchmark: Teacher Implementation Data Sources
1. 2. 3.
Professional Development Activity Audience Facilitator Financial Resources Target Date(s) of Activity
Assessment of department writing samples. Visitation of student-led conferences. Meet with new staff prior to new school year to explain school improvement goals, procedures, and programs.
Team/Encore All Staff New Staff
All Staff Student Responsibility Committee Goal Committees
- School Improvement School Improvement
August 2009 – June 2010 August 2009 – June 2010 August 2009
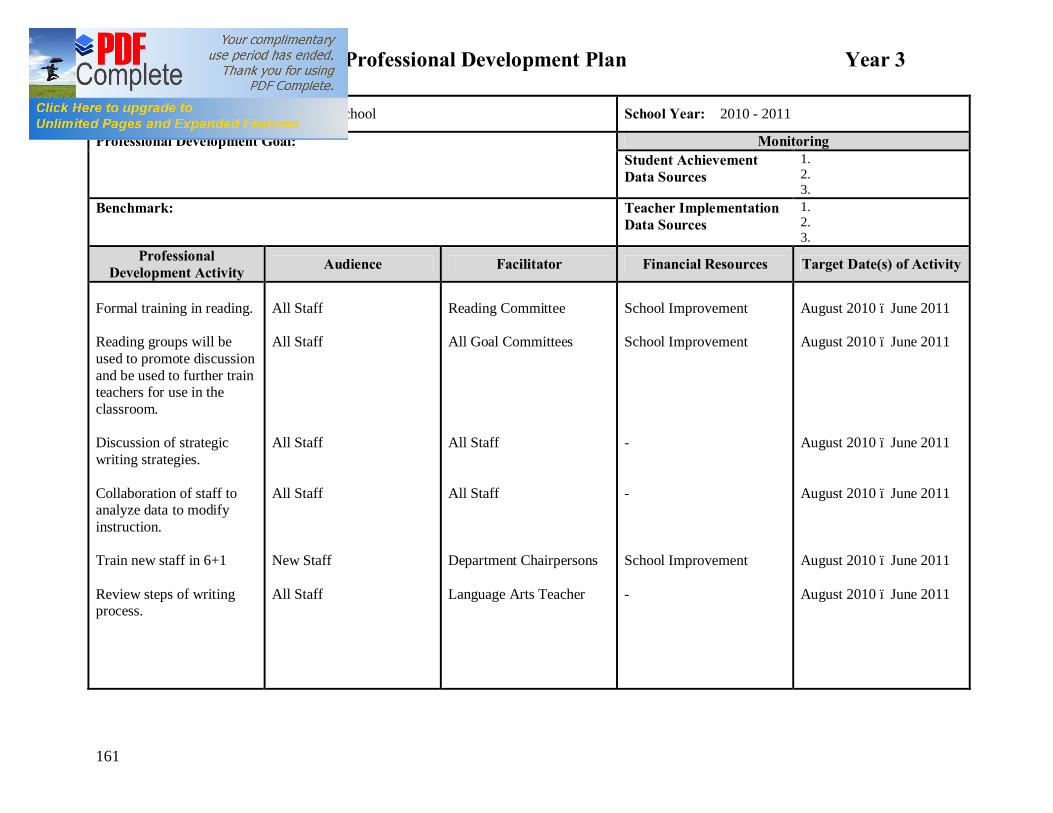
Professional Development Plan Year 3
161
School Name: Robert A. Taft Middle School School Year: 2010 - 2011
Monitoring Professional Development Goal: Student Achievement Data Sources
1. 2. 3.
Benchmark: Teacher Implementation Data Sources
1. 2. 3.
Professional Development Activity Audience Facilitator Financial Resources Target Date(s) of Activity
Formal training in reading. Reading groups will be used to promote discussion and be used to further train teachers for use in the classroom. Discussion of strategic writing strategies. Collaboration of staff to analyze data to modify instruction. Train new staff in 6+1 Review steps of writing process.
All Staff All Staff All Staff All Staff New Staff All Staff
Reading Committee All Goal Committees All Staff All Staff Department Chairpersons Language Arts Teacher
School Improvement School Improvement - - School Improvement -
August 2010 – June 2011 August 2010 – June 2011 August 2010 – June 2011 August 2010 – June 2011 August 2010 – June 2011 August 2010 – June 2011
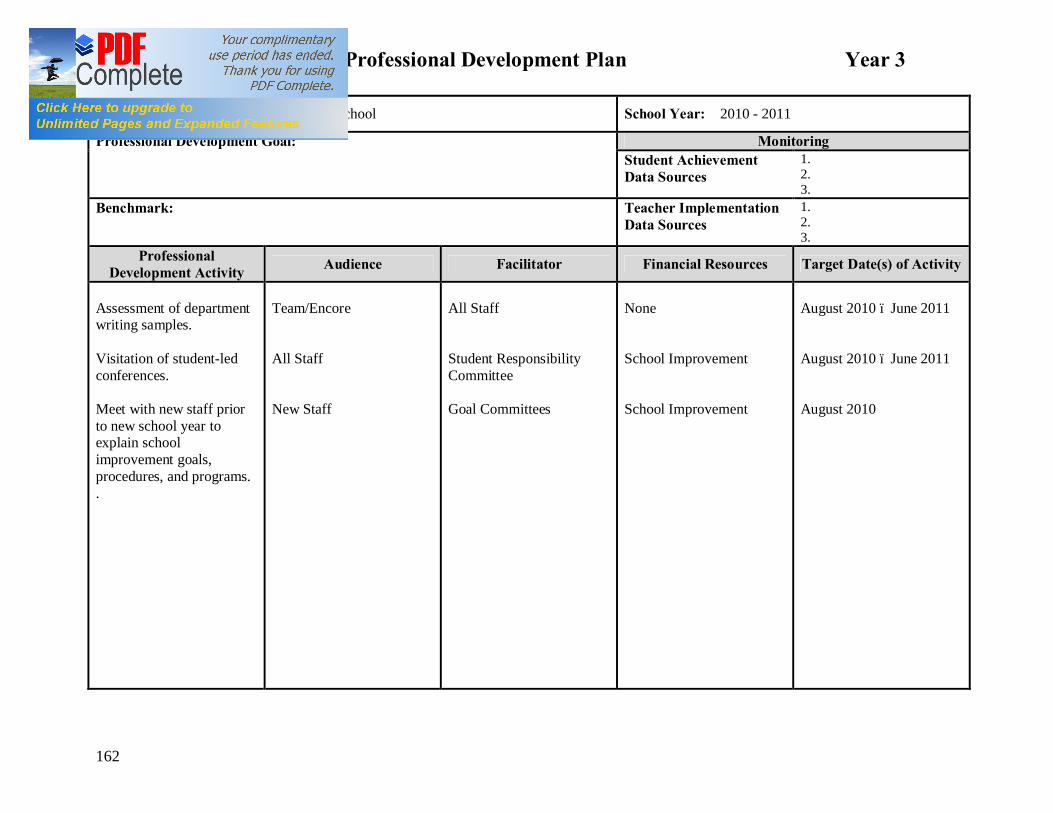
Professional Development Plan Year 3
162
School Name: Robert A. Taft Middle School School Year: 2010 - 2011
Monitoring Professional Development Goal: Student Achievement Data Sources
1. 2. 3.
Benchmark: Teacher Implementation Data Sources
1. 2. 3.
Professional Development Activity Audience Facilitator Financial Resources Target Date(s) of Activity
Assessment of department writing samples. Visitation of student-led conferences. Meet with new staff prior to new school year to explain school improvement goals, procedures, and programs. .
Team/Encore All Staff New Staff
All Staff Student Responsibility Committee Goal Committees
None School Improvement School Improvement
August 2010 – June 2011 August 2010 – June 2011 August 2010