introduction of molecular vibrations & ir...
TRANSCRIPT
Modern Optical Spectroscopy
Shu-Ping Lin, Ph.D.
Institute of Biomedical Engineering E-mail: [email protected]
Website: http://web.nchu.edu.tw/pweb/users/splin/
Introduction of Molecular Vibrations & IR Spectroscopy

分子振動 伸縮振動頻率和二個量有關:原子的質量與鍵的僵硬度
(stiffness of bond)。例如鍵比鍵有較低的特性頻率。在一群具有相似的鍵能中,其頻率隨原子量增加而減少。
較強的鍵通常較僵硬,拉長或壓縮它們需要更多力量。較強的鍵通常比較弱的鍵,振動更快 ( 假設原子有相似的質量 )。
鍵 種 類 近似鍵能 (KJ) 近似伸縮頻率(cm-1)
1. 頻率與原子質量的關係
C-H
C-D
C-C
420
420
350
3000
2100
1200
2. 頻率與鍵能的關係
C-C
C=C
C-H
C=N
350
611
840
305
615
891
1200
1660
2200
1200
1650
2200
原子較重
C C
C N
較強鍵
較強鍵
頻率增加
頻率增加
頻率減少
例如O-H鍵比C-H鍵更強,故O-H鍵以較高頻率振動。參鍵比雙鍵更強,故參鍵比雙鍵以更高頻率振動。
鍵的伸縮頻率的比較

IR- 活化與IR- 不活化振動
IR活化 (IR active) 交互的鍵拉長及壓縮受電磁波作用,以分子自然的
振動速率之頻率發生的能量,可被吸收。具有偶極矩的鍵振動,通常為IR吸收的結果
IR不活化 (IR inactive) 一鍵是對稱的而具有零偶極矩,則鍵與電場不相互
作用。例如,乙炔的參鍵之偶極矩為零,其特性頻率在IR光譜中看不到。

振動偶合 振動能可能被分子中的其他振動所偶合 (coupling),下列數個因素會影響偶合的程度。
1. 伸縮振動發生強的偶合時,必有一原子同屬二個振動。
2. 彎曲振動交互作用,需有一共同鍵在振動基之間。
3. 伸縮振動和彎曲振動之偶合,發生在伸縮鍵形成彎曲
振動中,角度改變的一邊。
4. 個別的振動能接近時,其偶合作用最大。
5. 間隔二個或二個以上的鍵,偶合作用很小或沒有。
6. 發生偶合的振動,須是同一種對稱。
振動偶合是一個普遍現象,因此對一個有機官能基無法準確指定一特定吸收峰位置。例如,C-O伸縮頻率在甲醇中為 ,在乙醇中為 ,在2-
丁醇中為 。這是由於C-O伸縮振動和鄰近
C-C伸縮振動或C-H伸縮振動偶合的結果。
11034 cm (9.67 m) 11053 cm (9.50 m)11105 cm (9.05 m)

分子的振動方式

紅外線光譜儀
紅外線吸收之量測儀器有四種型式:
(1) 分散光柵分光光度計 (dispersive grating spectrophotometer):
主要用於定性分析。
(2) 傅立葉轉換分光光度計 (fourier-transform spectrophotometer,
FTIR) :
主要用於定性及定量紅外線測量。
(3) 非分散光度計 (nondispersive photometer) :
主要用於大氣中不同種類有機物的定量測定。
(4) 反射式光度計 (reflectance photometer) : 主要用於農業及工業上的固體物分析。

光 源
1. 能士特發光體 (Nernst glower)
2. 熾棒光源 (Globar source)
3. 白熱燈絲光源 (Incandescent wire source)
4. 汞弧燈 (Mercury arc)
5. 鎢絲燈 (Tungsten filament lamp)
6. 二氧化碳雷射光源 (Carbon dioxide laser source)

單色器 使用稜鏡或光柵將複合光色散成單色波,再射到偵測器上測量。
紅外線分光光度計的單色器最早用稜鏡,使用稜鏡時,稜鏡的材料必須能透過紅外線且對光的色散儘可能大。
常用的稜鏡材料之適用波長如下表所示。
材 料 適用波長 性 質
氯化鈉 0.25~16 溶於水、價廉、易磨製。
溴化銫 1~40 溶於水及低級醇、酸。質軟、易受潮,適於遠紅外線區,價昂。
溴化鉀 0.25~30 溶於水及低級醇、酸。質軟、價廉、易磨製。
KRS-5 1~40 含48% 溴化酰及酰52% 碘化酰,微溶於水,溶於鹼,不溶於酸,化學惰性強,透光性極佳,反射性強、價昂。
氟化鉛 0.2~12 不溶於水,溶於酸、質硬、不易磨製。
氟化鈣 0.2~10 不溶於水,溶於氨,質硬、可作耐高壓容器。
氟化銀 1~22 不溶於水,溶於氨及強鹼,易生干涉。
石英玻璃 0.2~3 用於近紅外線光區。
( m)
IR分光光度計之稜鏡材料
紅外線的偵測器
紅外線的偵測器有三種型式:
(1) 熱偵測器 (thermal detector)
用於光度計及分散式分光光度計
(2) 焦熱電偵測器 (pyroelectric detector)
(3) 光導偵測器 (photoconducting detector)
第二及第三種用於較複雜的傅立葉轉換分光光度
計。

樣品處理
要獲得滿意的紅外線光譜圖,樣品前處理的製作十分重要。製作樣品時應注意下列原則:
1. 樣品的濃度和厚度要適當,以使紅外線吸收光譜
圖中,大多數之吸收峰的透光度在15~70%T範圍
內。濃度太稀或厚度太薄,常使弱峰消失,甚至
中等強度的峰及微細結構部分消失,則得不到完
整的譜圖。
2. 直接測定固體樣品時,要求樣品顆粒直徑小於紅
外線之波長,否則會發生對入射光明顯的散射。

液體樣品
液體樣品可使用:
(1) 液體吸收槽法
溶液或液體可注入具有鹽片窗口的吸槽中進行
測定
(2) 夾片法
適於樣品很少或沒有適當溶劑的低揮發性液
體樣品。
(3) 塗片法
粘度大的液體樣品,可將樣品塗在一片空白的 溴化鉀晶片上來測定。
氣體樣品
氣體樣品通常注入氣體吸收槽中測定。分為兩種:
1.短光程容槽
用於高濃度無毒性或低沸點液體之測定。
2.長光程容槽
用於檢測低濃度有毒氣體及測定低蒸氣壓物質
之蒸氣紅外線吸收光譜。
固體樣品
固體樣品最簡單的方法是溶液,即選擇適宜的溶劑配成10% 溶液,用液體吸收法測定。
1. 壓片法
2. 薄膜法
(1) 溶液法
(2) 熔化法
3. 糊劑法

有機官能基之特性頻率
為了方便進行光譜解析,通常將中紅外線光區,分為二個大區域:
1. 4000~1500cm-1為特性頻率區
2. 1500~600cm-1為指紋區
其中1200~600cm-1最為有用。

特性頻率區
特性頻率區又稱為基頻率區 (group frequency region),此區的吸收峰稱為特性吸收峰或特徵吸收峰,或稱特性頻率。
吸收峰的主要來源為含氫原子的單鍵、各種雙鍵、參鍵的伸縮振動之基頻率峰。
此區特點是峰的數目少且有鮮明的特徵,可用以鑑定官能基。

XH伸縮振動區(X可以是C, D, N, S原子) 1. CD, CH基的伸縮振動吸收峰位於範圍內。大體以3000cm-1
為界,
(1) 高於3000cm-1:
表示與氫原子相連的碳原子是不飽和的,或表示
樣品可能為高鹵代烷或小環烷。
(2) 低於3000cm-1:
表示與氫相連的碳原子是飽和的。
(3) 高於3000cm-1及低於3000cm-1的吸收峰都存在:
表示在化合物的分子中不飽和碳原子及飽和碳原
子都存在。

官能基 吸收峰頻率(cm-1)
CH3 ~2960,~2870
CH2 ~2930, 2850
~2890 ( 很弱,有時觀測不到 )
O=CH ~2850及 ~2720 ( 中強,用於鑑定醛 )
=CH- 3040~3010
=CH2 ~3085
~3300 ( 用於鑑定末端炔 )
~3030 ( 峰尖銳,但比飽和CH峰弱 )
|
CH
|
─
H
一些官能基的CH伸縮頻率
CH

2. OH基的伸縮振動出現在3700~3100cm-1範圍內,可用於鑑定醇及酚。醇及酚在非極性溶劑的稀溶液中,以游離的OH基形式存在,游離的OH基之伸縮振動吸收峰位於3700~3580cm-1。
醇和酚的濃溶液由於氫鍵存在而產生結合現象,故形成氫鍵的羥基在3400~3200cm-1出現一寬而強的吸收峰。
故醇、酚的IR光譜中,常常在3700~3600及3400~3200cm-1出現二個羥基伸縮振動的吸收峰。
3. NH基的伸縮振動出現在此範圍內,它與OH基伸縮振動重疊,但峰形比較尖銳(Spike),其吸收峰的數目與氮 上氫原子之數目有關。
RNH2及RCONH2因有二個H原子而有二個吸收峰,
及 因只有一個H原子而只有一個吸收峰。 RNHR RCONHR

1-butanol
CH3CH2CH2CH2-OH
C-O 1o
3200-3640 (b) O-H
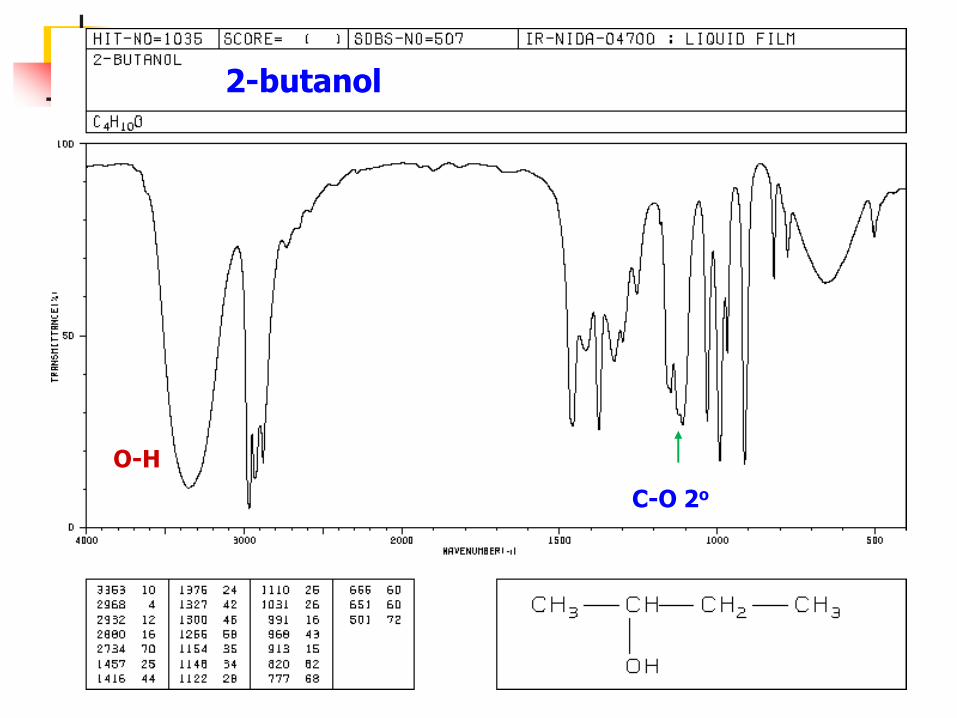
2-butanol
C-O 2o
O-H

tert-butyl alcohol
C-O 3o O-H

此區包括等參鍵,及等相鄰雙鍵之伸縮振動區,見下表的特性頻率。
官能基 特性頻率,cm-1 官能基 特性頻率
RC=CH 2100~2140 C=C=O 2150
2190~2260 ( 弱 ) C=C=C ~1950
RC=N 無 C=N=N ~2100
2240~2220 R-N=C=O ~2100
2260~2240 2275~2250
RC CR=
ArC N
RC N
表8-5 參鍵及相鄰雙鍵的特性頻率
參鍵及相鄰雙鍵伸縮振動區

C8H6
C-H unsat’d
1500, 1600
benzene
mono
C8H6 – C6H5 = C2H
phenylacetylene
3300
C-H

此區包括-C=O,C=C,C=N,- N=O等基的伸縮振動及苯環的骨架振動。
羰基(C=O)的伸縮振動在1850~1680cm-1範圍內。在紅外線吸收光譜中,羰基的吸收峰通常是最強的吸收峰,具有顯著的特徵性。
酮、酯、醯胺的羰基伸縮振動吸收峰分別位於~1710,1710~1735,1680~1710cm-1,據此來區分此三類的化合物。
脂肪族(苯環)的C=C伸縮振動吸收,出現在1675~1450cm-1,強度小且與分子的對稱性及鄰近基的差異大小有關。1600
及1500cm-1出現兩個特性吸收峰。當苯環與取代基發生π- π
或n- π共振,在~1580及1450cm-1處出現第三及第四吸收峰,同時會使1600及1500cm-1兩峰加強。
C=N 在1675~1640cm-1伸縮振動,N=N基在1630~1575cm-1
伸縮振動,-NO2的不對稱伸縮振動在1600~1500cm-1 。
雙鍵伸縮振動區

2-butanone
C=O
~1700 (s)

1-decene
910-920 & 990-1000 RCH=CH2
C=C 1640-1680
unsat’d
C-H
3020-3080 cm-1

4-methyl-1-pentene
910-920 & 990-1000 RCH=CH2

ethylbenzene
690-710, 730-770
mono-
1500 & 1600
Benzene ring
3000-3100 cm-1
Unsat’d C-H

指紋區
指紋區內的吸收峰主要來源是各種不含氫原子的單鍵 ( 如C-C,C-N,C-O,C-X等 ) 的伸縮振動,多數基團的彎曲振動間的相互偶合。
指紋區的特性: 吸收峰密集,峰位,峰強度及其形狀,對分子結構變化十分敏感,是整個分子的特徵。可以作為官能基的定性分析的旁証,判斷苯環的取代類型和烯烴的順反異構物。
甲基的對稱及不對稱彎曲振動分別位於1380及1470cm-1,其中對稱彎曲振動受取代基的影響不大,且干擾譜帶也較少,常作為鑑定甲基之依據。
當碳原子上有二個甲基時,即 ,由於二甲基的對稱彎曲振動相互偶合而出現1385及1375cm-1之等強度的吸收雙峰。同樣地, 也分裂為1395,1385,1365cm-1近似等強度的三重峰。
3 2C (CH )─
3 3C (CH )─

結 構 頻率,cm-1 結 構 頻率,cm-1
770
810
750~740
754
740~730
740
730~725
725
n>4,722
n>4,722
2 3
|C CH CH|
─ ─ ─
2 2 3
|C (CH ) CH|
─ ─ ─
2 3 3
|C C(H ) CH|
─ ─ ─
2 4 3
|C (CH ) CH|
─ ─ ─
2 n 3
|C (CH ) CH|
─ ─ ─
2
| |C CH C| |
─ ─ ─ ─
2 2
| |C (CH ) C| |
─ ─ ─ ─
2 3
| |C (CH ) C| |
─ ─ ─ ─
2 4
| |C (CH ) C| |
─ ─ ─ ─
2 n
| |C (CH ) C| |
─ ─ ─ ─
鏈狀 的搖擺振動收縮頻率 ─ ─2(CH)

(1) 平面內搖擺 (in plane rocking) 在~1468cm-1吸收
(2) 平面內剪動 (in plane scissoring) 在720cm-1吸收
(3) 不同平面搖動 (out of plane wagging) 在1306~1303cm-1吸收
(4) 不同平面扭動 (out of plane twisting) 在1306~1303cm-1吸收
以平面內搖振動最重要,由其峰位可判斷 鏈的長短。當 時,其吸收頻率在722cm-1,可用來辨別烯類的順反異構物及苯環的取代類型。
2CH\/
2 n(CH )─ ─
n 4
亞甲基有四個彎曲振動

=CH次甲基的不同平面彎曲振動位於100~600cm-1的範圍,可用來辨別烯類的順反異構物及苯環的取代類型。
取 代 類 頻率,cm-1
苯 670
單取代 770~730及710~690
鄰雙取代 770~735
間雙取代 900~860, 810~750, 710~690
對雙取代 840~800
1,2,3- 三取代 780~760及745~705
1,2,4- 三取代 88~5870及825~805
1,3,5- 三取代 865~810及730~675
1,2,3,4- 四取代 810~800
1,2,3, 5- 四取代 850~840
五取代 870~855
取代苯的不同平面彎曲振動頻率

C-O的伸縮振動的在1300~100cm-1區間產生很強的吸收峰,可用於判斷C-O鍵的存在,以鑑別醇、醚、酯及酚。
醇的C-O振動出現在1160~1040cm-1,根據峰位可區分為第一醇、第二醇及第三醇,分別出現在
1050cm-1,1100cm-1,1150cm-1。
C-X的伸縮振動在指紋區也有強吸收,C-F在1400~1000cm-1,C-Cl在800~600cm-1,C-Br在600~500cm-1,C-I在500~400cm-1。

例如某樣品的IR吸收光譜中,在1730cm-1出現一強峰,表示含有酯類的羰基存在,若在指紋區有~1200cm-1峰表示有C-O-R基存在,在1465cm-1有吸收峰表示有CH3基存在,在720cm-1有吸收峰表示有CH2基存在,則表示樣品為飽和酯。

鍵 化合物類型 頻率範圍,cm-1 備 註
C-H 烷 2850~2970 強
1340~1470 強
C-H 烯 3010~3095 中強
強
C-H 炔 3300 強
芳香環 3010~3100 中強
O-H 醇(R-OH),酚(Ar-OH) 3590~3650 可變
氫鍵結的醇及酚 3200~3600 可變,有時寬
酸 3500~3650 中強
( C C H)─ ─
|C H|
─ ─
|C H|
= ─
O||
R C OH
─ ─

氫鍵結的酸 2500~2700 寬
N-H 胺、醯胺 3300~3500 中強,可能寬、釘狀
C=C 烯 1610~1680 可變,共軛稍低
C=C 芳香環 1500~1600 可變
炔 2100~2260 可變
C-N 胺,醯胺 1180~1360 強
2210~2280 強
C-O 醇、醚、酸、酯 1050~1300 強
C=O 醛、酮、酸、酯 1690~1760 很強,酯稍高 (1735cm-1),共軛降低
NO2 硝基化合物 1500~1570
1300~1370
C C
C N

紅外線吸收光譜與分子結構
紅外線吸收光譜的用途之一是用來確定化合物的分子結構。常常需要結合其他資料,如MS, NMR等來一起判斷結構。一般分子結構之分析程序如下:
1. 了解樣品的性質
盡可能了解樣品的熔點、沸點、溶解度、顏色及氣味等物理性質,了解樣品的純度、組成及來源。
這樣不僅有利於選擇最合適的樣品的處理方式,並可縮小欲鑑定物質的範圍。
2. 樣品的分離純化
由於樣品大部分為混合物,可藉紙層析法、管柱層析法、萃取法、分餾法等來分離混合物及純化,以得到良好的 IR 光譜圖,有利於正確的判定其結構。
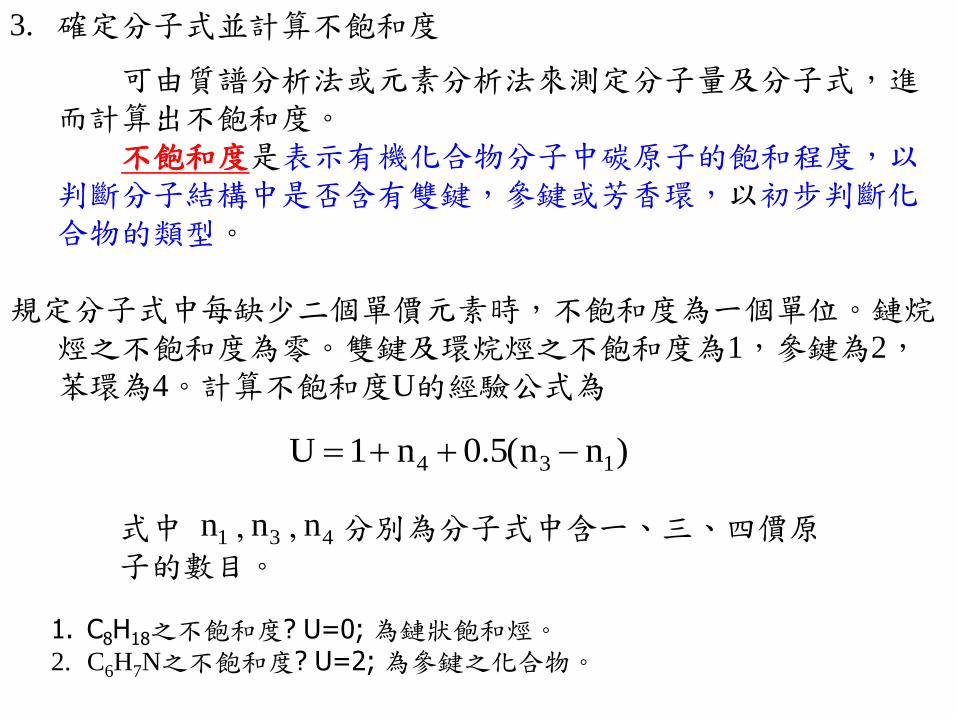
3. 確定分子式並計算不飽和度
可由質譜分析法或元素分析法來測定分子量及分子式,進而計算出不飽和度。
不飽和度是表示有機化合物分子中碳原子的飽和程度,以判斷分子結構中是否含有雙鍵,參鍵或芳香環,以初步判斷化合物的類型。
規定分子式中每缺少二個單價元素時,不飽和度為一個單位。鏈烷烴之不飽和度為零。雙鍵及環烷烴之不飽和度為1,參鍵為2,苯環為4。計算不飽和度U的經驗公式為
4 3 1U 1 n 0.5(n n )
式中 分別為分子式中含一、三、四價原子的數目。
1 3 4n n n, ,
1. C8H18之不飽和度? U=0; 為鏈狀飽和烴。
2. C6H7N之不飽和度? U=2; 為參鍵之化合物。

Homework -1

Homework -2

Homework -3

Homework -4

Fourier Transform Infrared Spectroscopy (FTIR)
Traditional dispersive spectroscopy problems: Low sensitivity in IR
Slow (relatively) low resolution
FTIR
Large optical throughout, high sensitivity Fast And high resolution
Solution:
Interferometer, mechanical modulation
Jean-Baptiste-Josephde Fourier (1768-1830)

Key element of FTIR
Michelson Interferometer
Purpose: incident beam modulation through interference

Interference of waves
In-phase: constructive Out-of-phase: destrictive

Michelson Interferometer
-Mirror moves with Velocity V
-Recorded as
intensity as a
function of
distance [I(d)]
versus the
distance (d)
-Two beams recombine before detector -Monochromatic beam of frequency n gives an interferogram (cosine curve with
wavelength proportional to 1/n)
-The interferogram contains the spectrum of the source (reference sample) minus the
spectrum of the sample
-V is usually 1.5
cm s-1
-To distinguish
two frequencies
n1 and n2:
distance, d,
≥ 1/(n1 – n2)

Fourier Transform Infrared Spectroscopy
Fourier Transform Infrared Spectroscopy
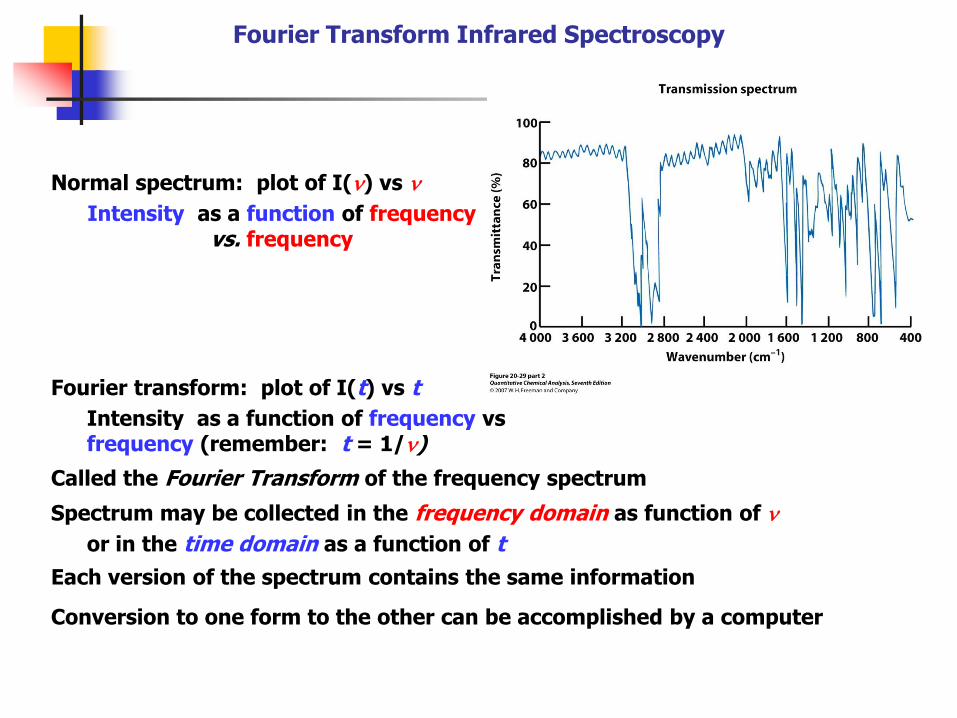
Normal spectrum: plot of I(n) vs n
Intensity as a function of frequency vs. frequency
Fourier transform: plot of I(t) vs t
Intensity as a function of frequency vs frequency (remember: t = 1/n)
Called the Fourier Transform of the frequency spectrum
Spectrum may be collected in the frequency domain as function of n
or in the time domain as a function of t
Each version of the spectrum contains the same information
Conversion to one form to the other can be accomplished by a computer

Transfer interferogram to absorption spectrum
FFT: Fast Fourier Transformation

- sample interferogram is transformed into sample spectrum
Fourier Transform Infrared Spectroscopy
- background spectrum is subtracted
from sample spectrum

Beyond stabdard transmission FTIR

Quantitative Analysis from FTIR spectrometer

Scheme
Introduction to quantitative analysis and sources
Sampling techniques for FTIR spectrometer
Base Line correction: Problems and their solutions
Curve fitting and its practical applications
Absorpitivity Ratios and Quantification
References

Introduction to Quantitative Analysis
FTIR is commonly used for qualitative analysis
You must be aware of this type of analysis before going towards quantitative analysis
The probe size of FTIR is ideal for the study of phase behavior of polymers (i.e, Moleculer vibrations and size scale is in angstrom)
It can characterize the nature and strength of strong interactions.
It can determine the fraction of interacting groups in a certainly H-bonded system.

Cont’d Consider the following blend system:
s
Two copolymers are mixed on molecular level to form a blend. The fraction of carbonyl group H-bonded with phenolic group will tell the blending extent. For a single phase blend, there will be some Equilibrium conc. of H-bonded Carbonyl group present at a certain Temperature. The distribution of free and H-bonded C-group can be described by equilibrium constants from where free energy of Formation can be calculated.
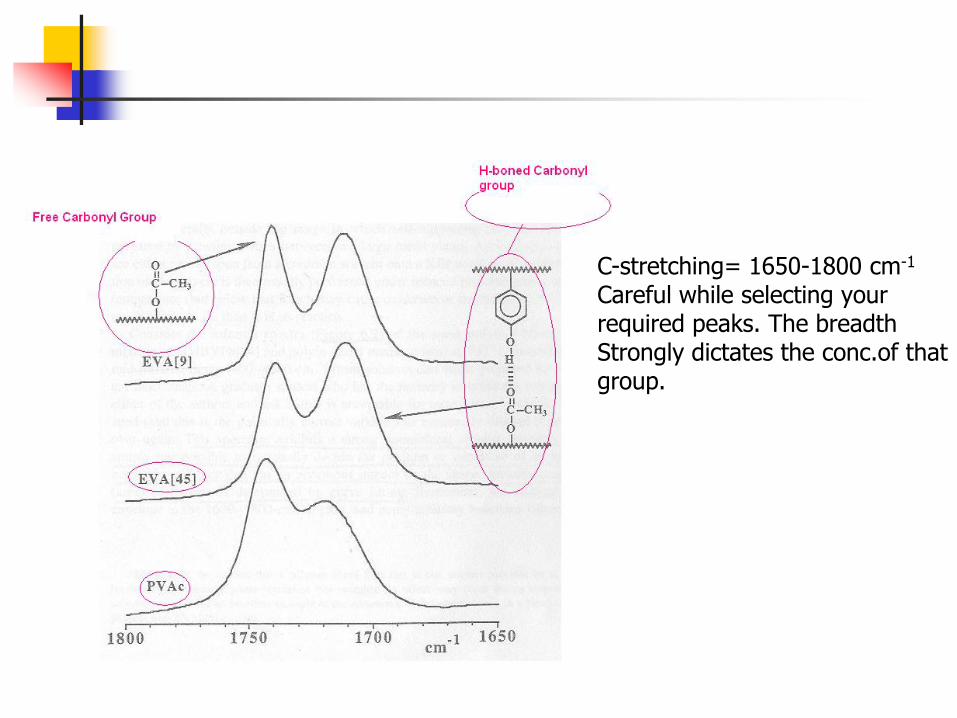
C-stretching= 1650-1800 cm-1
Careful while selecting your required peaks. The breadth Strongly dictates the conc.of that group.

Some important points
For quantitative measurements, Bee-Lambert law is strongly recommended which is
A = log10 (I0/I) = abc
Where A= Absorbance (dimensionless)
I0 = Intensity of source radiation
I = Intensity of transmitted radiation
a = absorpitivity co-efficient
b = Thickness or path length
c = Conc. Of the absorber
The spectrum should be in Beer-Lambert law absorbance units for quantitative measurements.

Error in Beer’s Law
Spectrophotometric measurements involve:
i. an adjustment for P/Po = 0 i.e. for no light through
ii. an adjustment for P/Po = 100% i.e. for all the light through
iii. an adjustment of P/Po with sample in place
c o n c e n t r a t i o n ( c ) 1 0 0 %
Consider the effect of a 1% error in T (P/Po)
In practice: the measure A should be
between:
1.0 (T = 10%) 0.1 (T = 79.4%)
i. when c is small:
Dc is also small but it is large
proportion of c
1% error
Dc
ii. when c is large:
error now corresponds to a large
uncertainty in c
Dc
1% error
P/P
o %
Scale the spectrometer

Quantitative Methods
Specificity: the ability of a method to distinguish the analyte
from others in the sample Check resolution
Linearity: How well a calibration curve follows a straight
line. Square of correlation coefficient
Accuracy: nearness to truth, check with different methods and
spiking
Precision: reproducibility, standard deviation
Range: concentration interval over which linearity,
accuracy and precision are all good
Detection Limits: defined by signal detection limit: 3s
(standard deviation), minimum concentration: 3s/m, m is
the slope of the linear curve.
Part 1. Methods validation:

Concentration-dilution formula A very versatile formula that you absolutely must know how to use
C1 V1 = C2 V2 where C = conc.; V = volume
Cconc Vconc = Cdil Vdil where “conc” refers to the concentrated solution and “dil” refers to the dilute solution
How to prepare 100ml of 0.1M NaCl solution from 2.0M stock?
Calculations:
The total NaCl molecules: V1x2.0M =100mlx0.1M
So, V1=100mlx0.1M/2.0M
=5ml (needed from stock)
How to do it:
Chef:
Measure 5ml of stock with teaspoon Add 95ml of water
Chemist:
transfer 5ml stock with a 5ml pipet into a 100ml volumetric flask. Topup to 100ml mark. Shake not stirred
Can you tell the difference between a chef and a chemist?
Quantitative Methods Part 2: Dilution

a known quantity of analyte add to the sample to test accuracy and linearity
The unknown sample: V1, A1
Spiked with V2, c2 and A2.
The solutions are diluted to volume V.
Absorbance difference A2-A1=ebV2c2/ V (spike dilution)
So the molar absorbance e can be measured, which will in turn give cx
Quantitative Methods Part 3: spike
V1Cx
V1Cx
+V2C2 Diluted to V
The final concentration:
Dilute unknown: (V1cx)/ V, absorbance A1
A1=eb (V1cx)/ V
Spiked: (V1cx+v2c2)/ V, absorbance A2
A2=eb (V1cx+v2c2)/ V
Without dilution of the unknown
unknown: (V1cx), absorbance A1
A1=eb (V1cx)
Spiked: (V1cx+v2c2)/ V, absorbance A2
A2=eb (V1cx+v2c2)/ V

Cont’d
Select the peaks (bands) well defined
Apply base line correction as recommended
Apply least square curve fitting
Determine the absorpitivities of free and H-bonded Carbonyl groups in terms of ratio aR
Determine the inter association fraction through certain formulae
The most important point is the judgment where your required groups lie and how much clear they are.

Experimental Necessities
Sample Preparation:
The samples for IR analysis can be in different form:
1- Solid
2- Liquid
3- Gas
Neat sample: If sample is a thin film then mount it as it is.
Solid: Mix with IR grade KBr in 1:100 ratio
Mull and salt window: fine powder of sample is mixed with a hydrocarbon oil and it is placed between two salt plates.
Typical salt windows: 1 inch diameter, 3-5 mm thickness
Cont’d
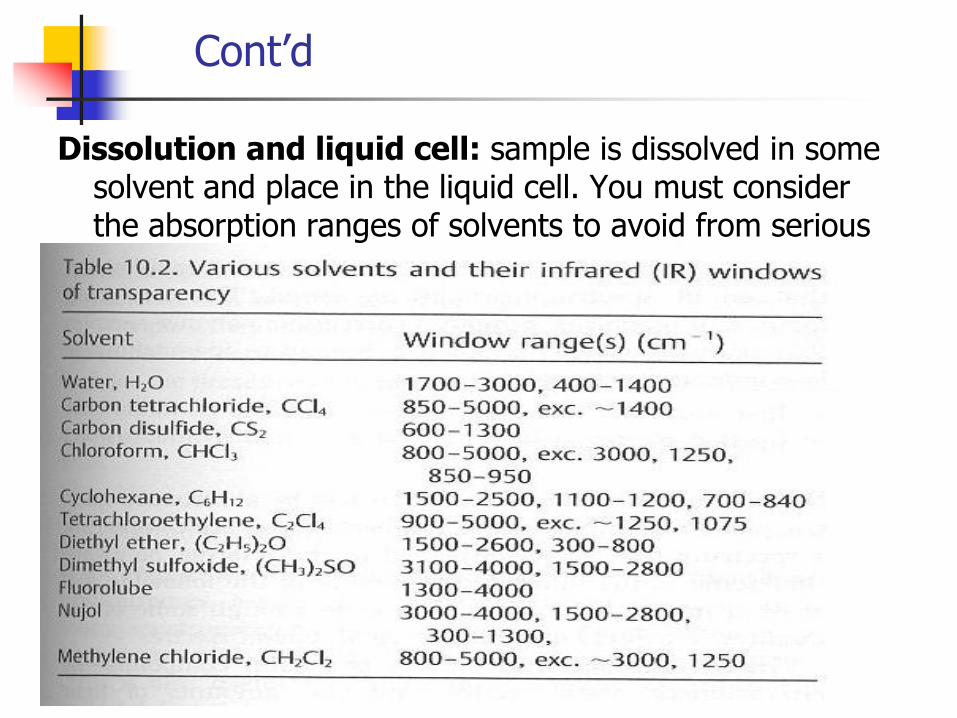
Dissolution and liquid cell: sample is dissolved in some solvent and place in the liquid cell. You must consider the absorption ranges of solvents to avoid from serious errors.

Conventional Liquid Cell
Gaskets help in making Non-leak seals and spacer. The sample is injected with The help of a syringe. After Usage, open the cell and rinse it.

Cont’d
Gas samples: A gas sample cell is required which is made of some standard salt like KBr or NaCl. The gas in injected with the help of a small piston system and kept at very low pressures. The main precaution in this system is the partial pressure of gas to be analyzed.
Films: less than 10 micron thickness, The absorbance should not be greater than 0.6.

Baseline and playing with spectra
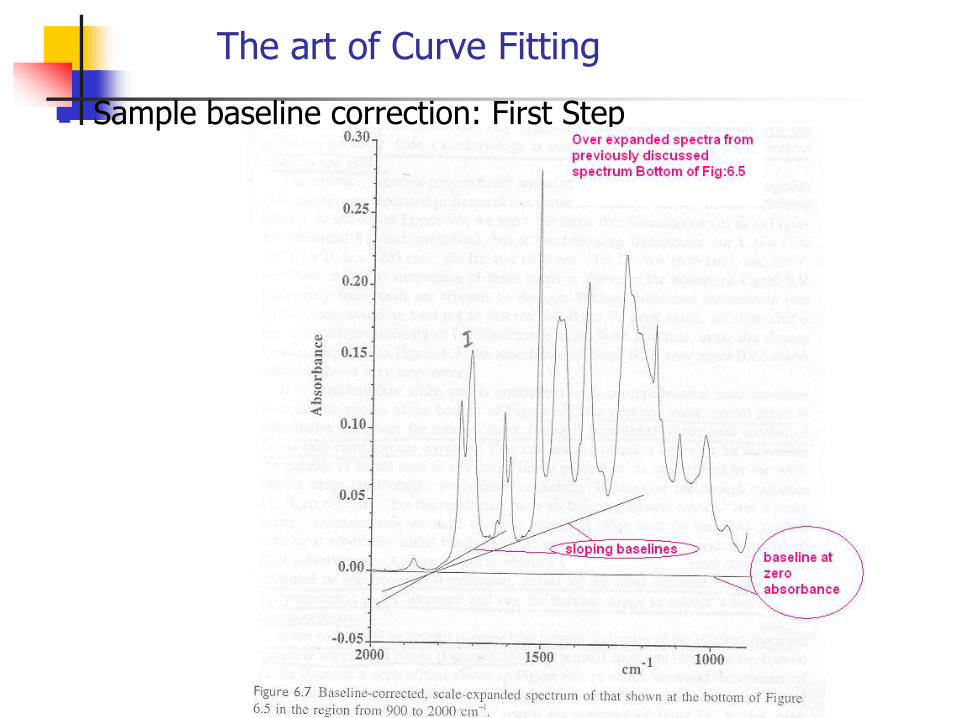
Consider the following spectrum with sloping baseline.
3 basic routes have been drawn here.

Why sloping baseline?
The most important factor for this sloping baseline is the un-even film formation due to which IR light is scattered and 2nd is the coloured sample.
Film cast method and KBr pellet method normally strike with this type of problem.
In Film cast method, certain factors must be considered:
1- Evaporation rate of the solvent
2- Chemistry of the polymeric components
3- Surface tension of the solution

Cont’d
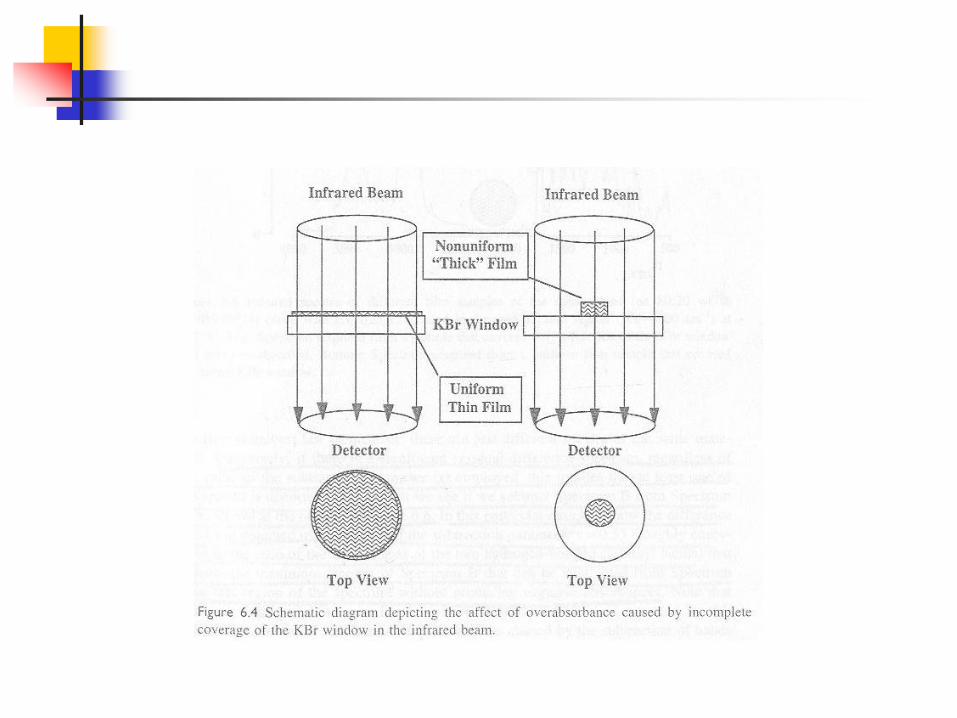
If the sample is non-uniform, then IR radiation will be dispersed due to difference in refractive indices at the curved surfaces and fraction of radiation will not reach the detector.
Scattering is inversely proportional to the fourth power of wavelength. Therefore this effect is greatest in IR at higher frequencies (high wave numbers).

A good judgment of the sample is that the absorbance should be with in 0.3-0.7 . Below 0.3, poor signals are observed which if interpreted would lead to serious errors. Modern FIR can go up to 0.05 absorbance units. But if more than 0.7, then bands are called over-absorbed and it goes out of Beer law range. This can never give good quantitative results.
But if the following situation occurs:


The art of Curve Fitting
Sample baseline correction: First Step

Understanding the Curve fitting mechanism
First of all you have to assume a specific shape of the band. This may be a Gaussian type or Lorenzian type or mixed. Almost all the polymer sample bands resemble the Gaussian Shape but not necessarily.
Let us do some sample exercises to understand what curve fitting is.
Consider five Gaussian curves named I-V, arbitrarily synthesized as:
Curve II V=1700 FWHH= 30 A = 0.4
Curve III V= 1660 FWHH = 15 A = 0.3
Curve IV V= 1640 FWHH= 15 A 0.2
Curve V V=1620 FWHH=15 A=0.5
Curve I V= 1730 cm-1
FWHH = w1/2= 15 cm-1
A=0.15
Note: These all curves have Gaussian shape, Baseline at A=0 and are separated By frequency at distances greater than w1/2 of the individual bands.

Curve fitting: cont’d

Again consider V1=1730: V2=1700: V3= 1670: V4= 1655: V4= 1640
Curve fitting is the knowledge of the total no. of bands That comprise an Envelop.
Second Derivative concept and its application
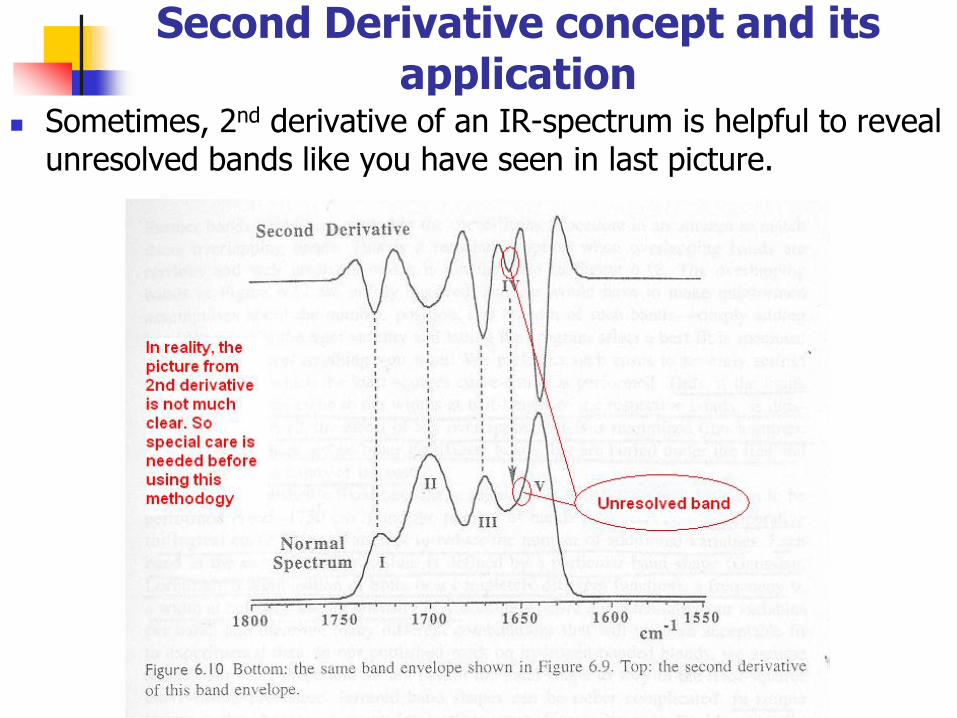
Sometimes, 2nd derivative of an IR-spectrum is helpful to reveal unresolved bands like you have seen in last picture.

If bands are spaced too close, then..

Least square curve fitting methodology

Quantitative Analysis 物質對IR的莫耳吸光係數小於1000,偵測靈敏度較低,對含量小
於1%的成分不易檢測出,故不適合微量成分的測定。
定量吸收峰:應為『特性峰』,且其附近無其他吸收峰以減少干擾。
基線法(base-line method)
According to Beer’s Law, A1 divided by A2 equals “R”.