introduction to gis / gisc 01 / 23 / 2015 - personal … · introduction to gis / gisc 01 / 23 /...
TRANSCRIPT
2/20/2015
1
Introduction to GIS / GISc01 / 23 / 2015
Topics Today:• GIS components• GIS knowledge• GIS functions (intro)• Validation and Verification• Problem Solving
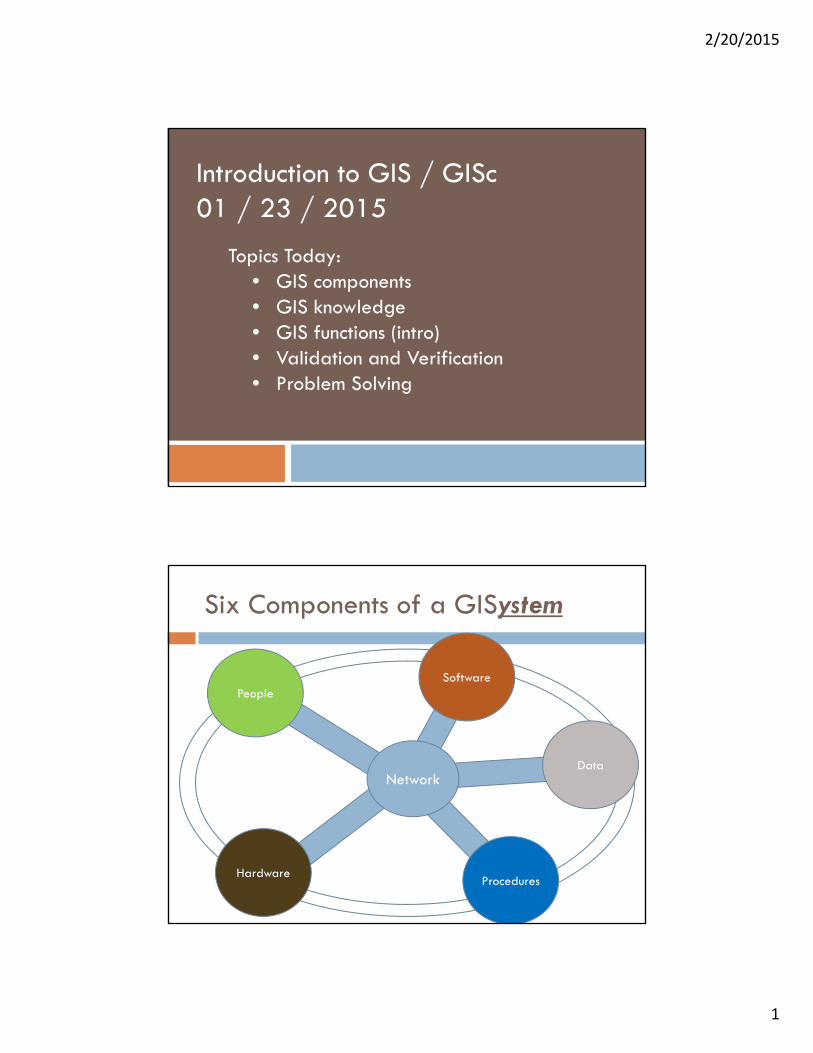
Six Components of a GISystem
Network
People
Hardware
Software
Data
Procedures
2/20/2015
2
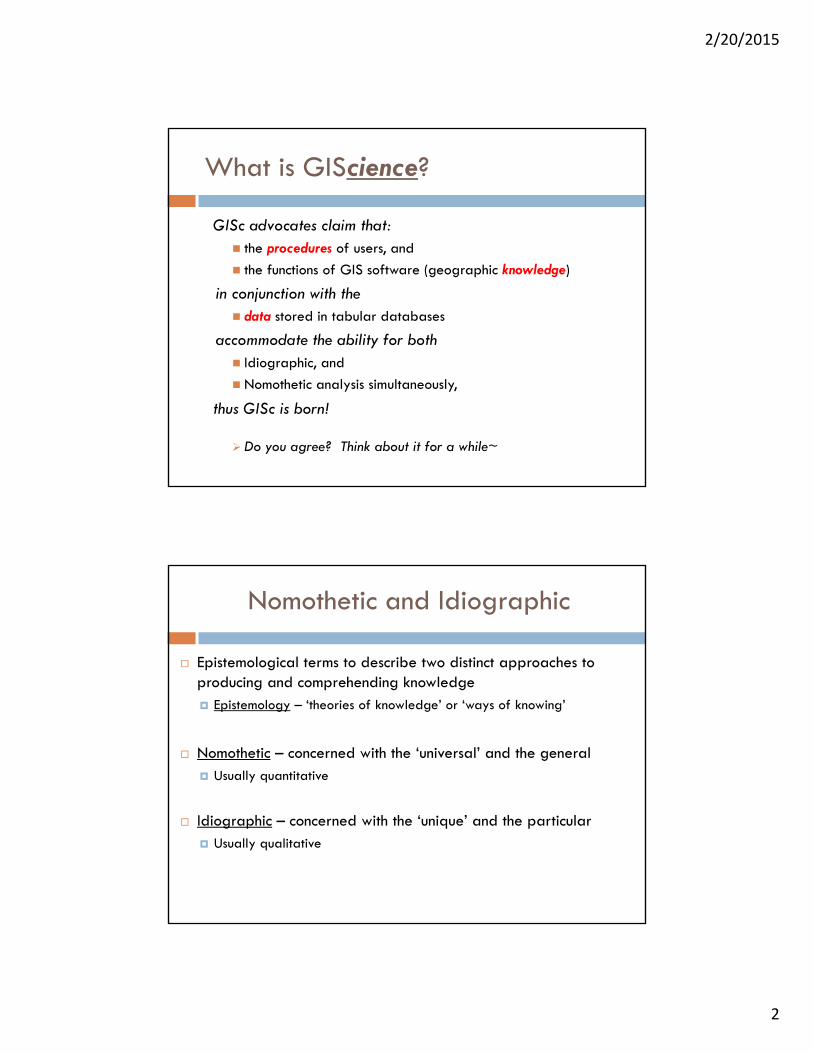
What is GIScience?
GISc advocates claim that: the procedures of users, and
the functions of GIS software (geographic knowledge)
in conjunction with the data stored in tabular databases
accommodate the ability for both Idiographic, and
Nomothetic analysis simultaneously,
thus GISc is born!
Do you agree? Think about it for a while~
Nomothetic and Idiographic
Epistemological terms to describe two distinct approaches to producing and comprehending knowledge Epistemology – ‘theories of knowledge’ or ‘ways of knowing’
Nomothetic – concerned with the ‘universal’ and the general Usually quantitative
Idiographic – concerned with the ‘unique’ and the particular Usually qualitative
2/20/2015
3
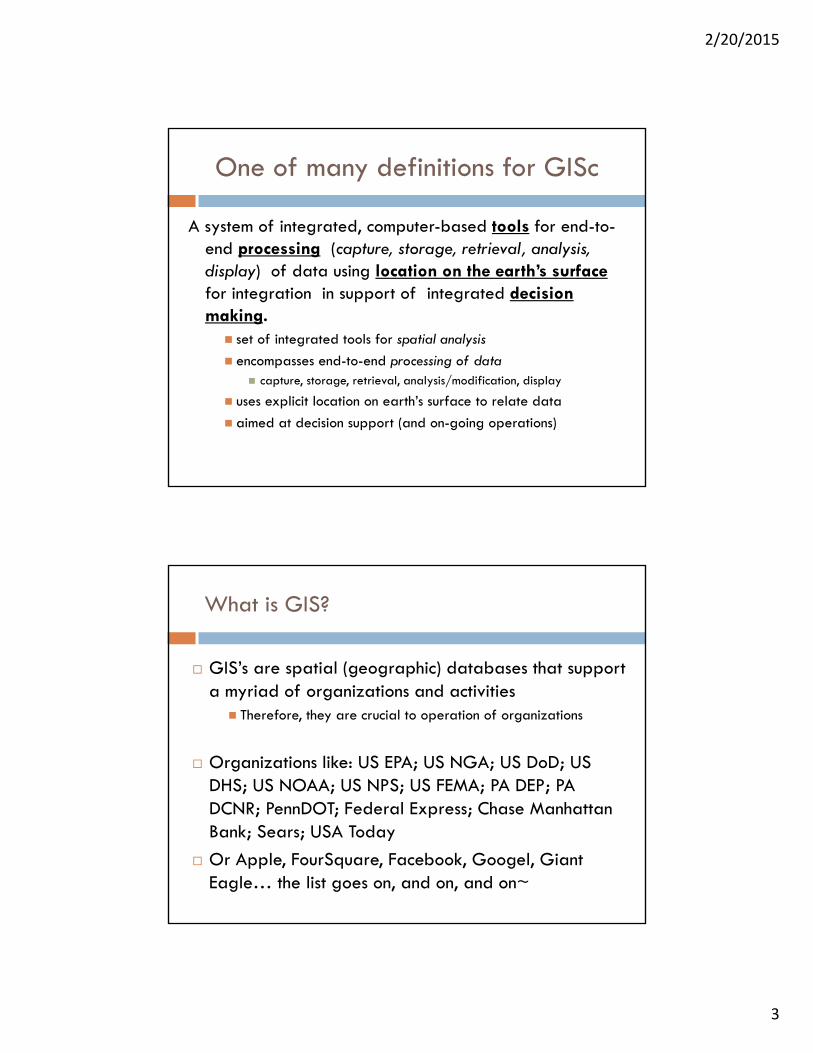
One of many definitions for GISc
A system of integrated, computer-based tools for end-to-end processing (capture, storage, retrieval, analysis, display) of data using location on the earth’s surface for integration in support of integrated decision making. set of integrated tools for spatial analysis
encompasses end-to-end processing of data capture, storage, retrieval, analysis/modification, display
uses explicit location on earth’s surface to relate data
aimed at decision support (and on-going operations)
What is GIS?
GIS’s are spatial (geographic) databases that support a myriad of organizations and activities Therefore, they are crucial to operation of organizations
Organizations like: US EPA; US NGA; US DoD; US DHS; US NOAA; US NPS; US FEMA; PA DEP; PA DCNR; PennDOT; Federal Express; Chase Manhattan Bank; Sears; USA Today
Or Apple, FourSquare, Facebook, Googel, Giant Eagle… the list goes on, and on, and on~
2/20/2015
4
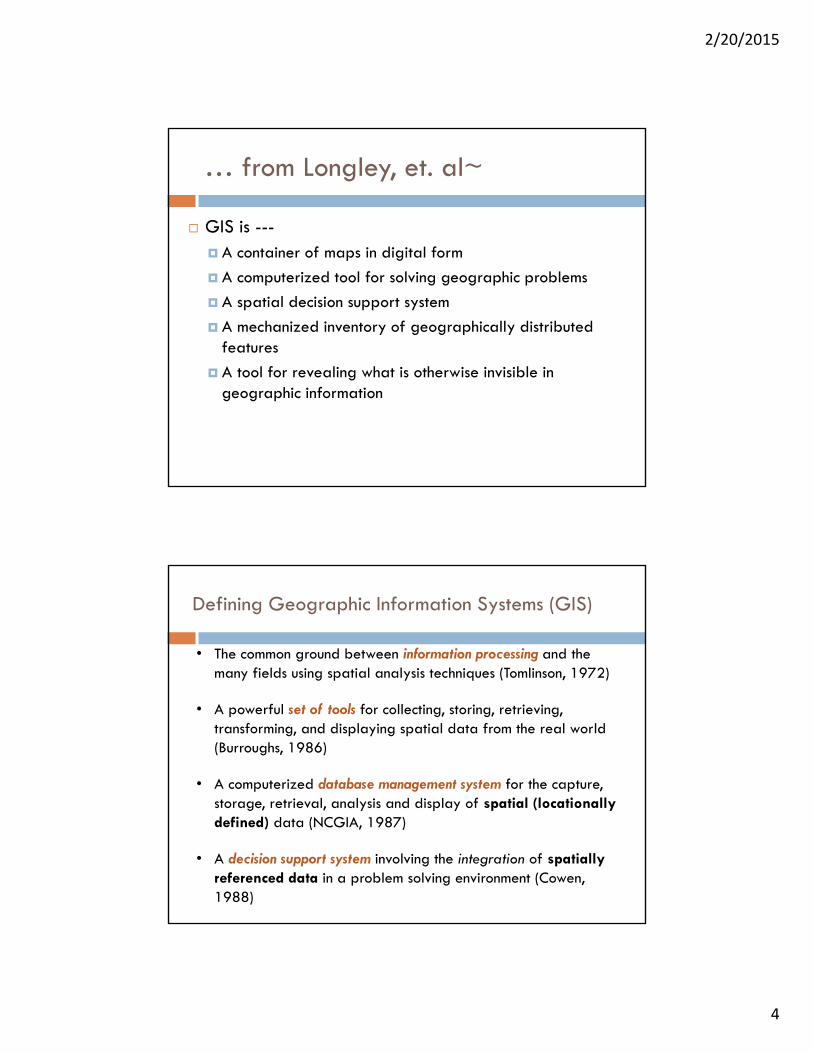
… from Longley, et. al~
GIS is --- A container of maps in digital form
A computerized tool for solving geographic problems
A spatial decision support system
A mechanized inventory of geographically distributed features
A tool for revealing what is otherwise invisible in geographic information
Defining Geographic Information Systems (GIS)
• The common ground between information processing and the many fields using spatial analysis techniques (Tomlinson, 1972)
• A powerful set of tools for collecting, storing, retrieving, transforming, and displaying spatial data from the real world (Burroughs, 1986)
• A computerized database management system for the capture, storage, retrieval, analysis and display of spatial (locationallydefined) data (NCGIA, 1987)
• A decision support system involving the integration of spatially referenced data in a problem solving environment (Cowen, 1988)
2/20/2015
5
The Purpose of a GISystem
Allows the geographic features in real world locations to be digitally represented so that they can be abstractly presented in map (analog) form, and can also be worked with and manipulated to address some problem
Provides a digital representation of the real world for use in operational management, decision making, and science
Who Uses GIS and How do They Use It?
Urban Planning, Management & Policy Zoning, subdivision planning Economic development Code enforcement Emergency response Crime analysis Tax assessment
Political Science Redistricting Analysis of election results
Business Demographic Analysis Market Penetration/ Share
Analysis Site Selection
Environmental Sciences Monitoring environmental risk Management of watersheds,
floodplains, wetlands, forests, aquifers Environmental Impact Analysis Hazardous or toxic facility siting Groundwater modeling and
contamination tracking
Real Estate Neighborhood land prices Traffic Impact Analysis Determination of Highest and Best Use
Health Care Epidemiology Needs Analysis Service Inventory
2/20/2015
6
What GIS Applications Do:manage, analyze, communicate
Make possible the automation of activities involving geographic data map production calculation of areas, distances, route lengths measurement of slope, aspect, viewshed logistics: route planning, vehicle tracking, traffic management
Allow for the integration of data previously confined to independent domains (e.gproperty maps and air photos)
By tying data to maps, permits the succinct communication of complex spatial patterns (e.g environmental sensitivity)
Provides answers to spatial queries (how many elderly in the Pittsburgh region live further than 10 minutes at rush hour from ambulance service?)
Perform complex spatial modeling (what if scenarios for transportation planning, disaster planning, resource management, utility design)
Contributing Disciplines to GIS: IThe convergence of technological fields and traditional disciplines
Geography “thinking” spatially
long tradition in spatial analysis
provides techniques for conducting spatial analysis
Cartography concerned with the display of
spatial information
maps have been a major source of information input for GIS
long tradition in map design which is an important output from GIS
Remote Sensing
images from air and space are a major (& growing) source of spatial data
low cost and consistent update of input data anywhere in the world
interpreted data from remote sensing can be merged with other GIS data
Photogrammetry
uses aerial photographs for making accurate spatial measurements
source of most data on topography (elevation) used in GIS
2/20/2015
7
Contributing Disciplines to GIS: IIThe convergence of technological fields and traditional disciplines
Geodesy
Source of high accuracy positional control for GIS
GPS (global positioning system) technology is revolutionizing efficiency, cost, and accuracy
Statistics many GIS models are statistical
many statistical techniques used in GIS analysis
statistics important to understanding issues of error and uncertainty in GIS data
Computer Science earlier computer-aided design (CAD)
work in CS
computer graphics and visualization
database management systems (DBMS)
Five “M’s” of GIS Applications:
1. Mapping Traditional Output – Perhaps the least powerful output
Maps are source of input data too (data capture)
2. Measurement Extracting distance information from data i.e., stream length from A location to B location
3. Monitoring Accessing information spatially and temporally
4. Modeling Assembling the data housed in the hardware in an organized and analytical manner
in the software for ‘knowledge’ extraction
5. Management The creation, deletion, storage, organization, updating and archiving of data
Theory
2/20/2015
8
Functional Elements of a GIS The Functional “Steps” in a “Typical” GIS Project
I. Data acquisition (never underestimate the cost!) paper maps
digital files
remote sensing/satellite
fieldwork
II. Preprocessing: preparation & integration format conversion
digitizing and/or scanning
edge matching and rectification
III. Data Management variable selection & definition
table design (performance v. usability)
CRUD policies/procedures: Create (data entry), Retrieve (view), Update (change), Deletion (remove)
IV. Manipulation and Analysis (all the user cares about!) address matching
network analysis
terrain modeling (e.g. slopes, aspects)
V. Product Generation tabular reports
graphics (maps and charts)
Practice
Steps FOLLOWING project scoping:
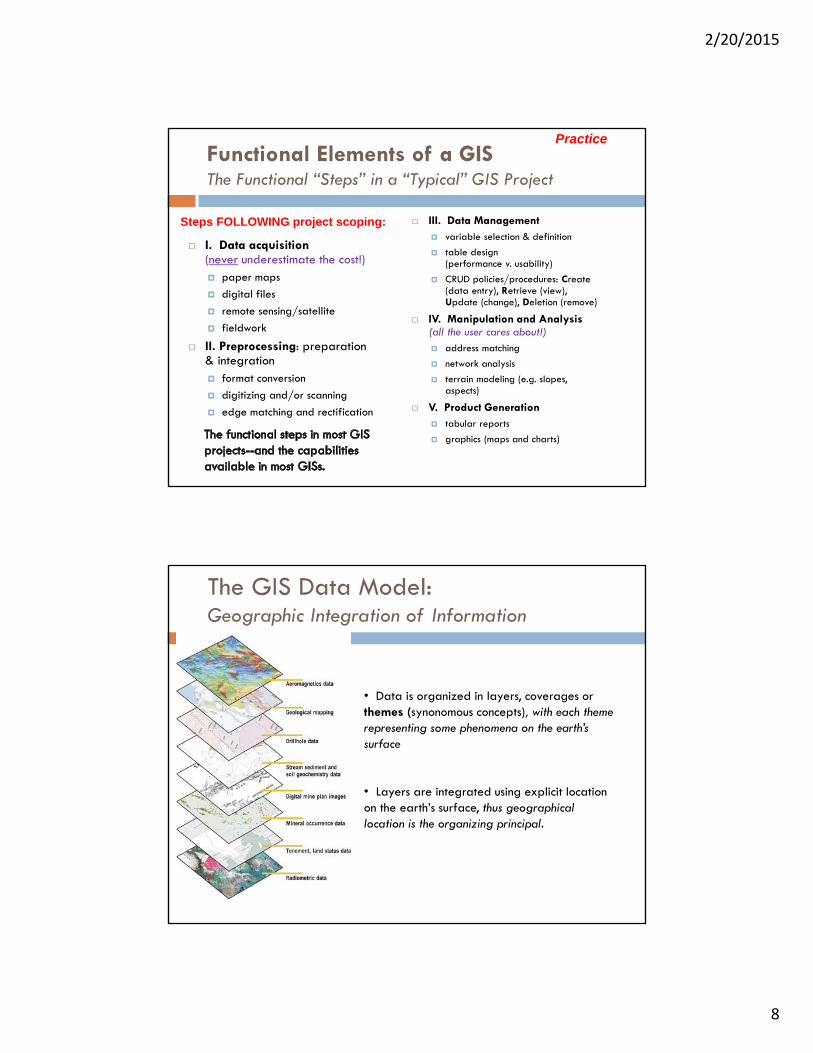
The GIS Data Model: Geographic Integration of Information
• Data is organized in layers, coverages orthemes (synonomous concepts), with each theme representing some phenomena on the earth’s surface
• Layers are integrated using explicit location on the earth’s surface, thus geographical location is the organizing principal.
2/20/2015
9
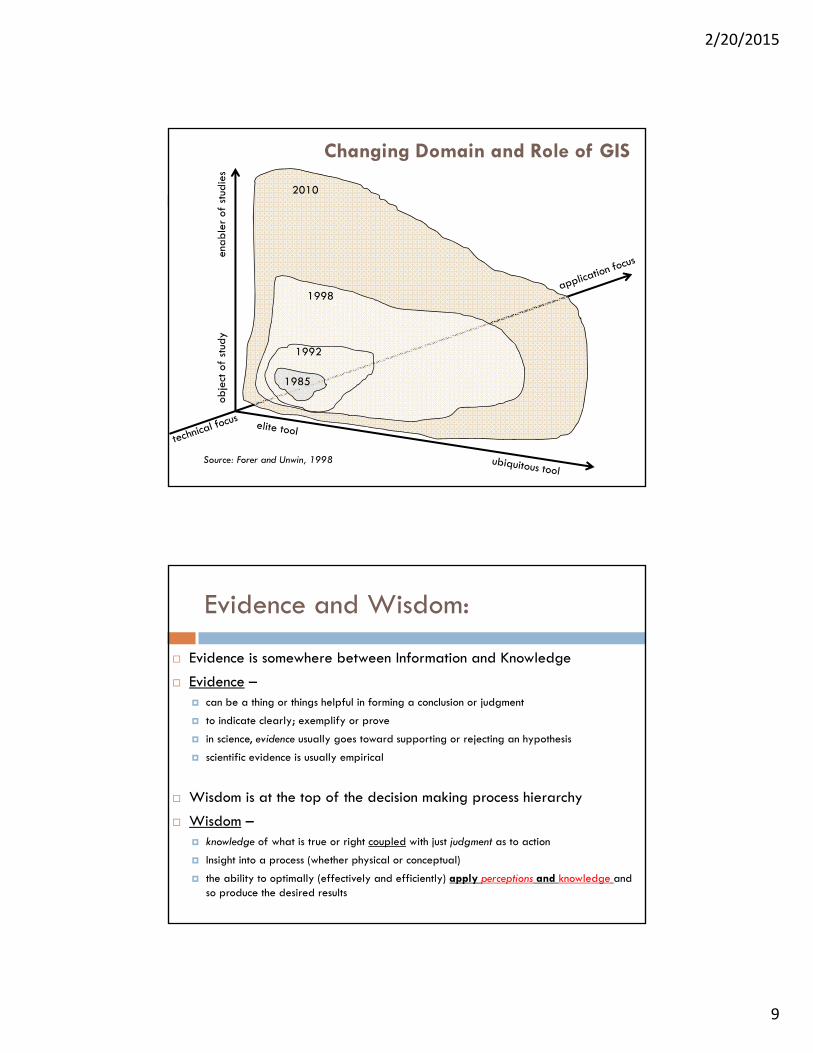
Changing Domain and Role of GIS
2010
1998
1992
1985
Source: Forer and Unwin, 1998
Evidence and Wisdom:
Evidence is somewhere between Information and Knowledge
Evidence – can be a thing or things helpful in forming a conclusion or judgment
to indicate clearly; exemplify or prove
in science, evidence usually goes toward supporting or rejecting an hypothesis
scientific evidence is usually empirical
Wisdom is at the top of the decision making process hierarchy
Wisdom – knowledge of what is true or right coupled with just judgment as to action
Insight into a process (whether physical or conceptual)
the ability to optimally (effectively and efficiently) apply perceptions and knowledge and so produce the desired results
2/20/2015
10
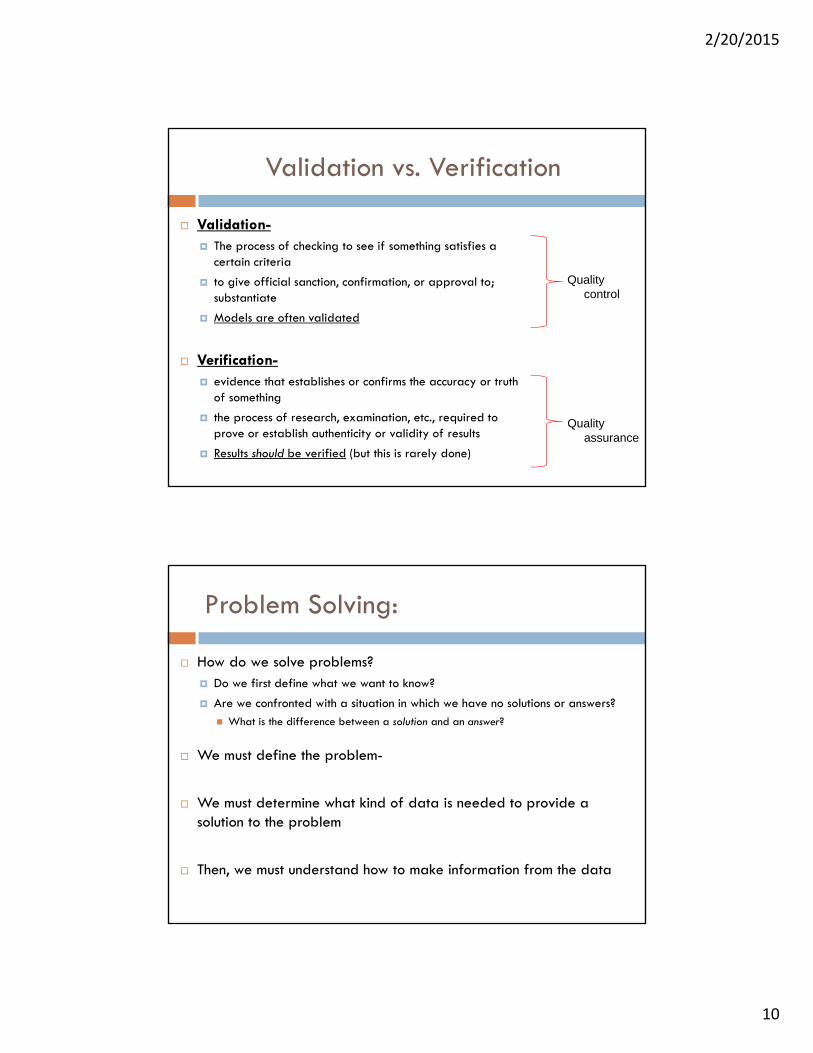
Validation vs. Verification
Validation- The process of checking to see if something satisfies a
certain criteria
to give official sanction, confirmation, or approval to; substantiate
Models are often validated
Verification- evidence that establishes or confirms the accuracy or truth
of something
the process of research, examination, etc., required to prove or establish authenticity or validity of results
Results should be verified (but this is rarely done)
Qualitycontrol
Qualityassurance
Problem Solving:
How do we solve problems? Do we first define what we want to know?
Are we confronted with a situation in which we have no solutions or answers? What is the difference between a solution and an answer?
We must define the problem-
We must determine what kind of data is needed to provide a solution to the problem
Then, we must understand how to make information from the data

2/20/2015
11
From Data to Information to Knowledge: Basic way:
Categorization of Data (idea) User-determined characteristics to be sought out in the data Used to Identify patterns in data Patterns are interpreted as information Information used in problem solving
Classification of Data (method) Method to determine differences or similarities of data
based on knowledge (often based on rules) Rules are determined on agreed upon procedures Should be based on knowledge (and a little wisdom, too)
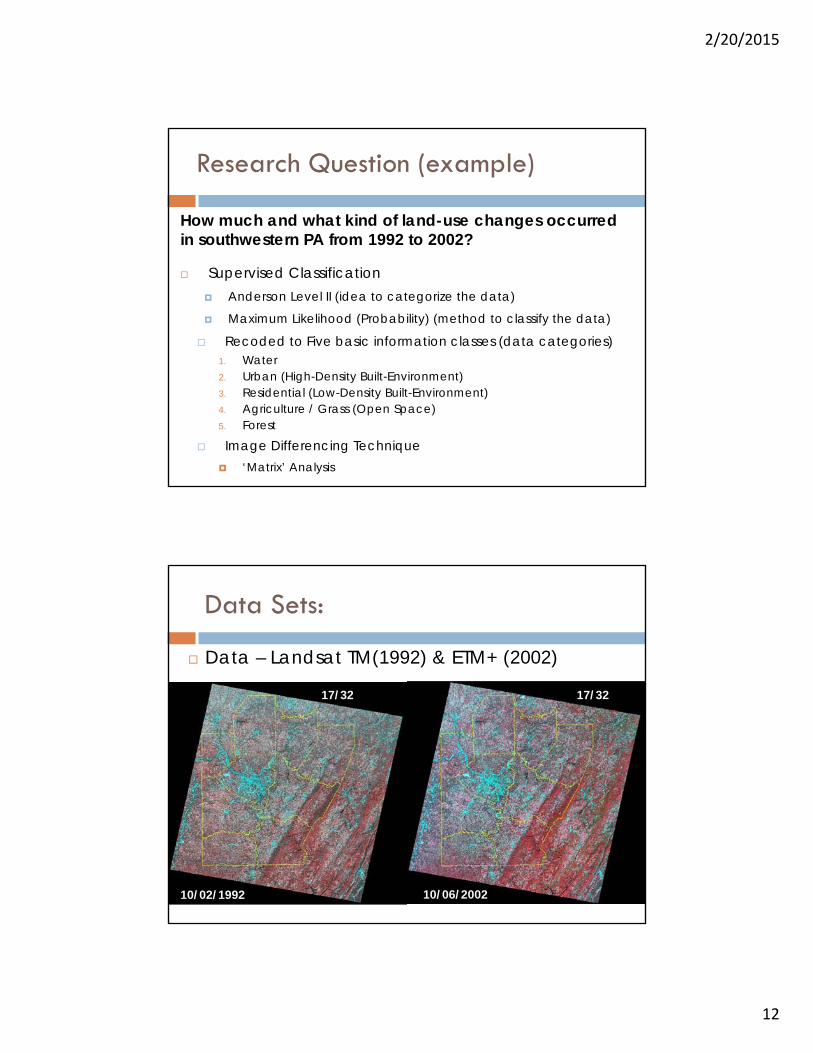
Research Question (example)
What do we want to know?How much and what kind of land-use changes occurred in southwestern PA from 1992 to 2002?
What kind of data is needed to provide a solution to the problem?
Satellite image data (raster) from 1992 and 2002
How will we process (make information) from the data?Categorize then classify the data, then search for differences between the two years
2/20/2015
12
Supervised Classification Anderson Level II (idea to categorize the data)
Maximum Likelihood (Probability) (method to classify the data)
Recoded to Five basic information classes (data categories)1. Water2. Urban (High-Density Built-Environment)3. Residential (Low-Density Built-Environment)4. Agriculture / Grass (Open Space)5. Forest
Image Differencing Technique ‘Matrix’ Analysis
Research Question (example)
How much and what kind of land-use changes occurred in southwestern PA from 1992 to 2002?
Data – Landsat TM(1992) & ETM+ (2002)
10/02/1992 10/06/2002
17/32 17/32
Data Sets:
2/20/2015
13
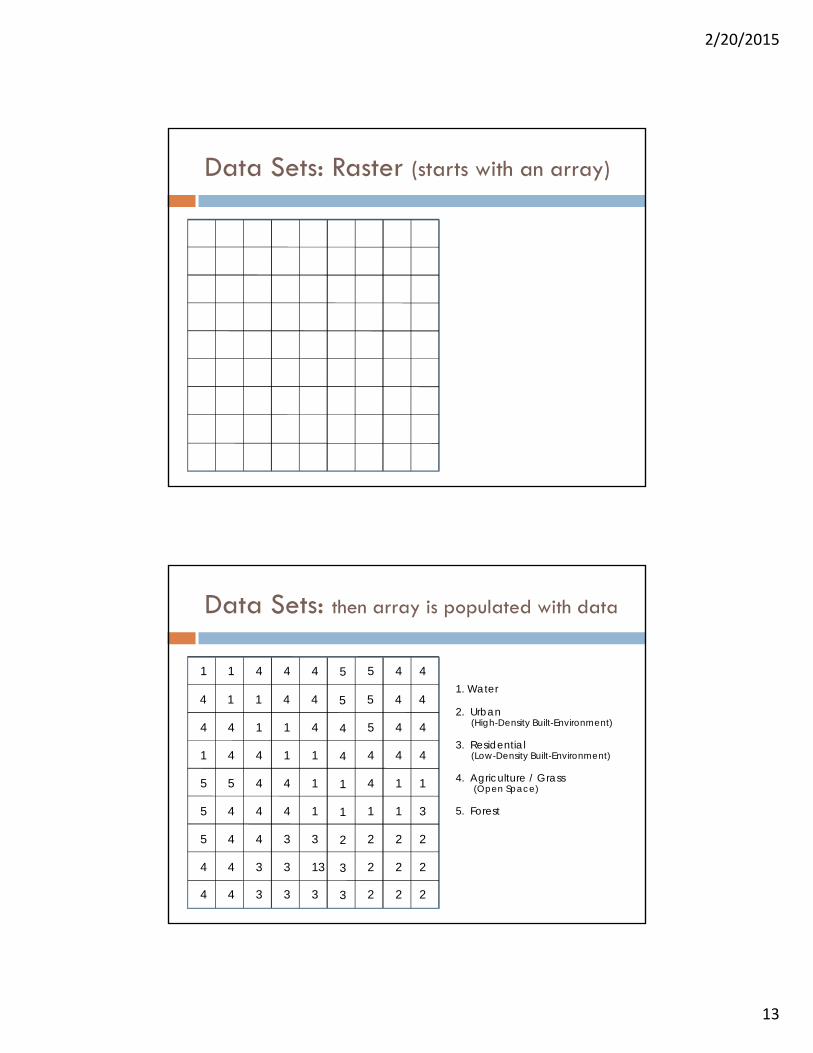
Data Sets: Raster (starts with an array)
Data Sets: then array is populated with data
4
4
4
4
5
5
5
1
1
1
4
4
4
4
4
5
4
1
1
1
3
3
4
4
4
4
4
4
1
3
3
3
4
4
1
4
4
4
3
13
3
1
1
1
4
5
4
3
3
2
1
1
4
5
5
5
2
2
2
1
4
4
5
4
4
2
2
2
1
1
4
4
4
4
2
2
2
3
1
4
4
1. Water
2. Urban (High-Density Built-Environment)
3. Residential (Low-Density Built-Environment)
4. Agriculture / Grass (Open Space)
5. Forest
2/20/2015
14
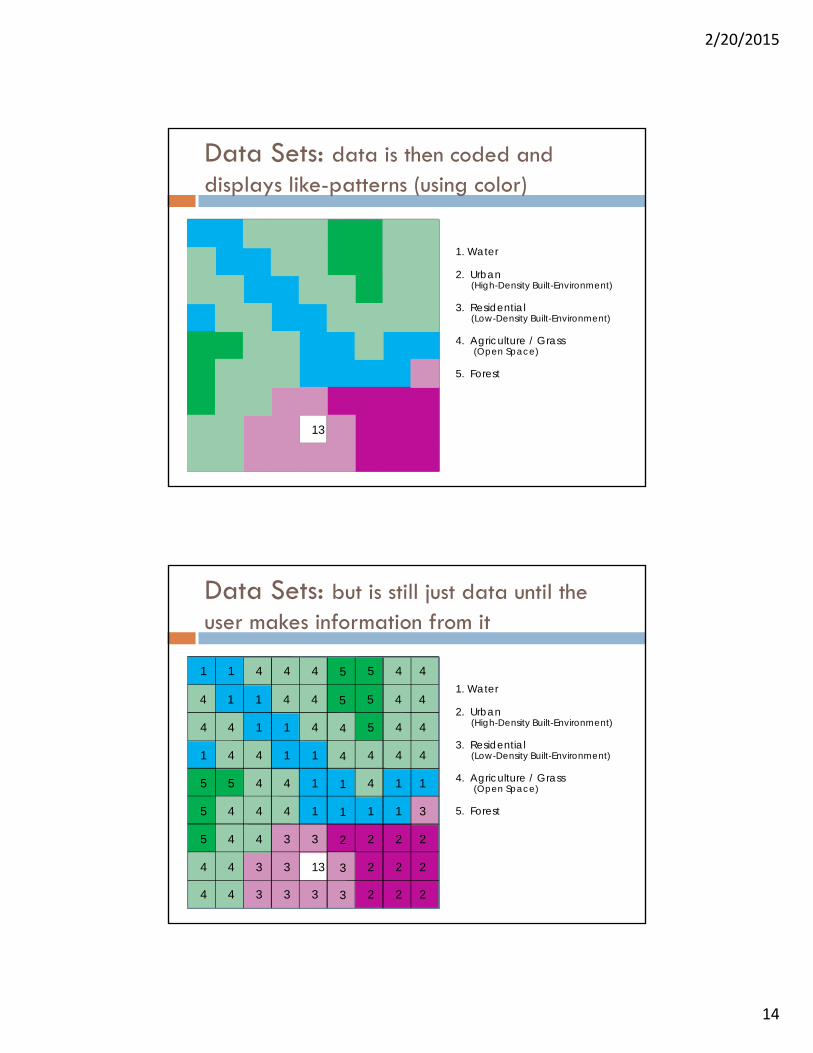
Data Sets: data is then coded and displays like-patterns (using color)
4
4
4
4
5
5
5
1
1
1
4
4
4
4
4
5
4
1
1
1
3
3
4
4
4
4
4
4
1
3
3
3
4
4
1
4
4
4
3
13
3
1
1
1
4
5
4
3
3
2
1
1
4
5
5
5
2
2
2
1
4
4
5
4
4
2
2
2
1
1
4
4
4
4
2
2
2
3
1
4
4
1. Water
2. Urban (High-Density Built-Environment)
3. Residential (Low-Density Built-Environment)
4. Agriculture / Grass (Open Space)
5. Forest
Data Sets: but is still just data until the user makes information from it
4
4
4
4
5
5
5
1
1
1
4
4
4
4
4
5
4
1
1
1
3
3
4
4
4
4
4
4
1
3
3
3
4
4
1
4
4
4
3
13
3
1
1
1
4
5
4
3
3
2
1
1
4
5
5
5
2
2
2
1
4
4
5
4
4
2
2
2
1
1
4
4
4
4
2
2
2
3
1
4
4
1. Water
2. Urban (High-Density Built-Environment)
3. Residential (Low-Density Built-Environment)
4. Agriculture / Grass (Open Space)
5. Forest
2/20/2015
15
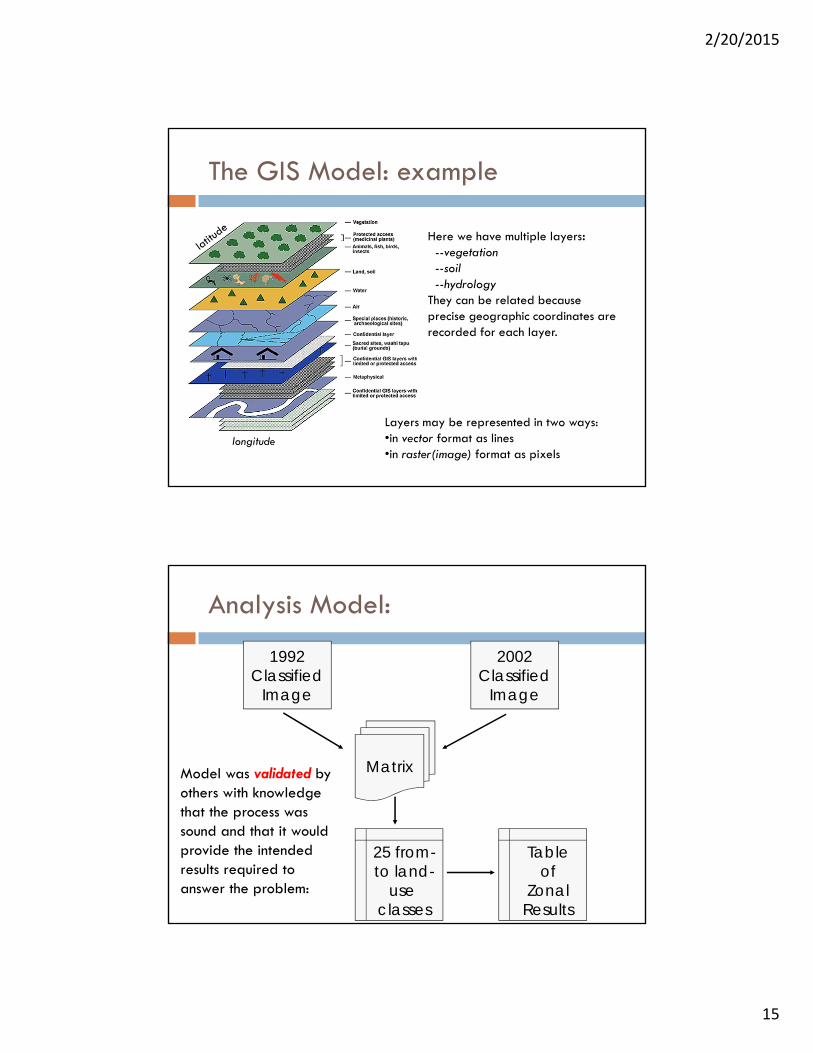
The GIS Model: example
Here we have multiple layers:--vegetation --soil--hydrology
They can be related because precise geographic coordinates are recorded for each layer.
longitude
Layers may be represented in two ways:•in vector format as lines•in raster(image) format as pixels
Tableof
ZonalResults
Matrix
2002Classified
Image
1992Classified
Image
25 from-to land-
use classes
Analysis Model:
Model was validated by others with knowledge that the process was sound and that it wouldprovide the intended results required to answer the problem:
2/20/2015
16
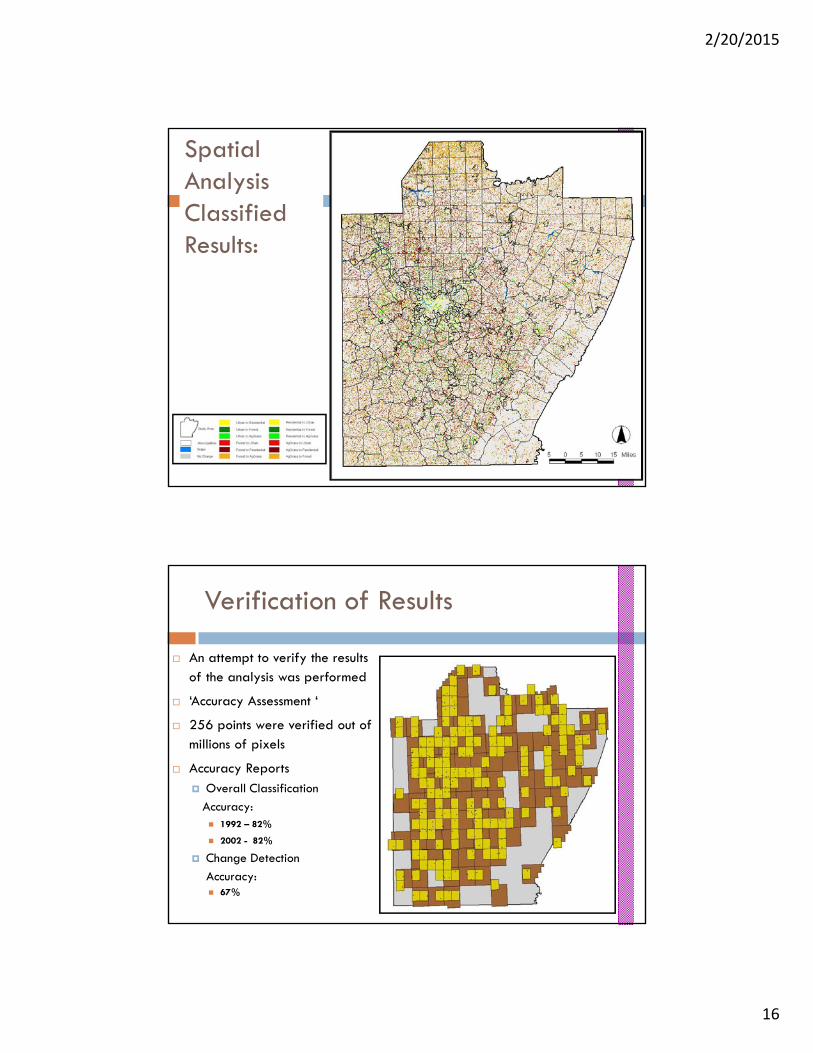
SpatialAnalysisClassifiedResults:
An attempt to verify the results of the analysis was performed
‘Accuracy Assessment ‘
256 points were verified out of millions of pixels
Accuracy Reports Overall Classification
Accuracy: 1992 – 82%
2002 - 82%
Change Detection
Accuracy: 67%
Verification of Results
2/20/2015
17
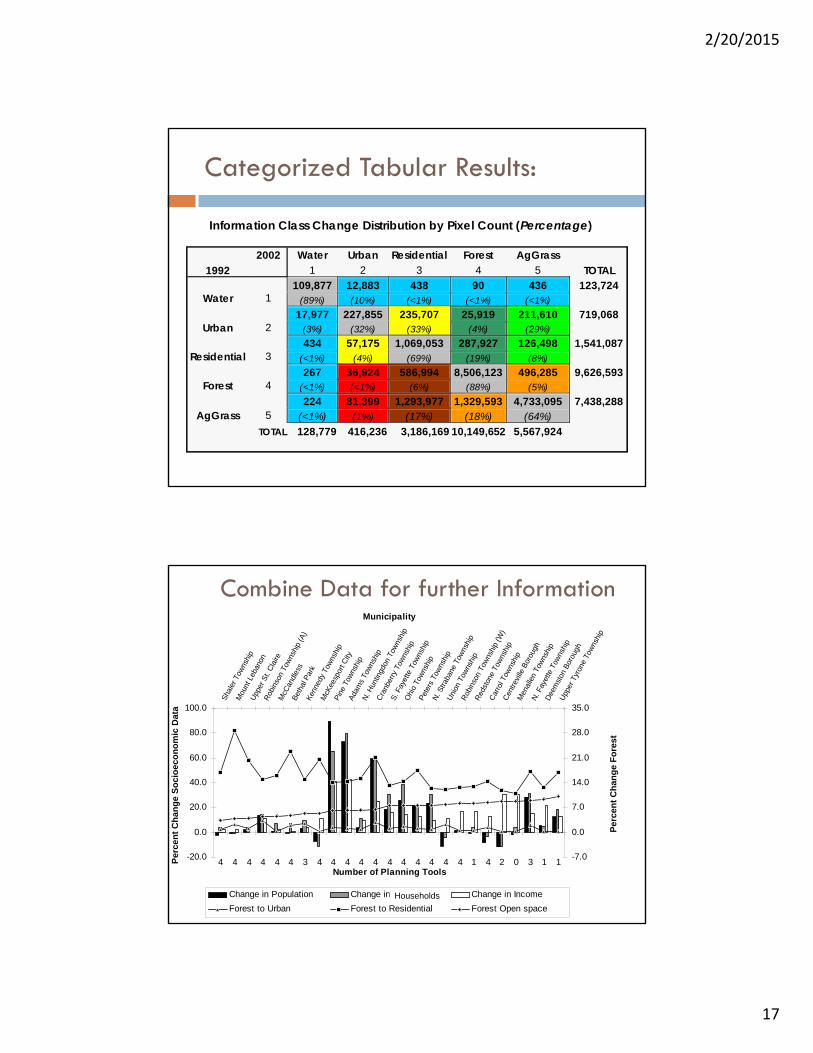
Information Class Change Distribution by Pixel Count (Percentage)
2002 Water Urban Residential Forest AgGrass 1992 1 2 3 4 5 TOTAL
109,877 12,883 438 90 436 123,724 Water 1 (89%) (10%) (<1%) (<1%) (<1%)
17,977 227,855 235,707 25,919 211,610 719,068 Urban 2 (3%) (32%) (33%) (4%) (29%)
434 57,175 1,069,053 287,927 126,498 1,541,087 Residential 3 (<1%) (4%) (69%) (19%) (8%)
267 36,924 586,994 8,506,123 496,285 9,626,593 Forest 4 (<1%) (<1%) (6%) (88%) (5%)
224 81,399 1,293,977 1,329,593 4,733,095 7,438,288 AgGrass 5 (<1%) (1%) (17%) (18%) (64%)
TOTAL 128,779 416,236 3,186,169 10,149,652 5,567,924
Categorized Tabular Results:
-20.0
0.0
20.0
40.0
60.0
80.0
100.0
4 4 4 4 4 4 3 4 4 4 4 4 4 4 4 4 4 4 1 4 2 0 3 1 1Number of Planning Tools
Per
cen
t C
han
ge
So
cio
eco
no
mic
Dat
a
-7.0
0.0
7.0
14.0
21.0
28.0
35.0
Sha
ler T
owns
hip
Mou
nt L
eban
onU
pper
St.
Cla
ire
Rob
inso
n To
wns
hip
(A)
McC
andl
ess
Bet
hal P
ark
Ken
nedy
Tow
nshi
p
McK
eesp
ort C
ity
Pin
e To
wns
hip
Ada
ms
Tow
nshi
p
N. H
untin
gdon
Tow
nshi
p
Cra
nber
ry T
owns
hip
S. F
ayet
te T
owns
hip
Ohi
o To
wns
hip
Pet
ers
Tow
nshi
p
N. S
traba
ne T
owns
hip
Uni
on T
owns
hip
Rob
inso
n To
wns
hip
(W)
Red
ston
e To
wns
hip
Car
rol T
owns
hip
Cen
trevi
lle B
orou
gh
Men
alle
n To
wns
hip
N. F
ayet
te T
owns
hip
Dee
mst
on B
orou
gh
Upp
er T
yron
e To
wns
hip
MunicipalityP
erce
nt
Ch
ang
e F
ore
st
Change in Population Change in Housing Units Change in Income
Forest to Urban Forest to Residential Forest Open space
Households
Combine Data for further Information
2/20/2015
18
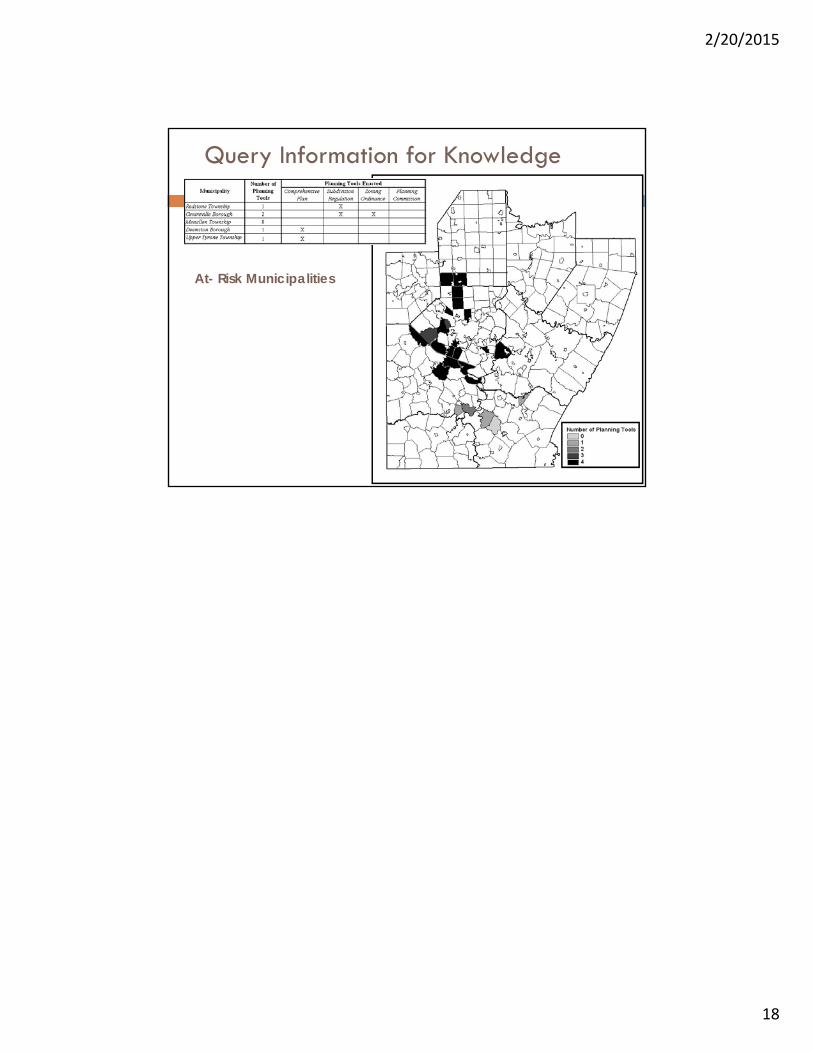
At- Risk Municipalities
Query Information for Knowledge