introduction to oncomine · visualizations can be sorted by sample data (such as gleason score,...
TRANSCRIPT

Introduction to Oncomine

2 Oncomine 4.3 Training - Module 1: Introduction to Oncomine
No part of this document may be reproduced without written consent from Compendia Bioscience.
Table of Contents
1.1 Getting Started ............................................................................. 9
1.2 Target Validation: Establishing an evidence trail for EGFR over-expression .................................................................................. 11
1.3 Multi-gene Validation: Co-expression of EGFR and pathway members in glioblastomas .......................................................... 23
1.4 Target Discovery: Meta-analysis of glioblastoma ....................... 28
1.5 Summary of Target Validation and Target Discovery ................. 32
1.6 Summary .................................................................................... 34
1.6.1 Oncomine Support ....................................................... 34
Oncomine 4.3 Training - Module 1: Introduction to Oncomine 3
No part of this document may be reproduced without written consent from Compendia Bioscience.
Introduction to Oncomine ™
Prerequisites: None
Training Setup Required:
• Internet access
• Internet Explorer 6.0 (at minimum, Service Pack 3 is strongly recommended), or higher
• Firefox 2 is supported for PC and Mac OS X users
• Java script must be enabled
• Oncomine Login
4 Oncomine 4.3 Training - Module 1: Introduction to Oncomine
No part of this document may be reproduced without written consent from Compendia Bioscience.
Welcome to Oncomine 4.2 Training!
This training module is designed to introduce you to the content, pre-computed analyses, and modes of searching the Oncomine cancer profiling database.
By the end of this module, you should be familiar with:
• The types of data available in Oncomine
• The types of questions that can be answered using Oncomine
• How to navigate the user interface and Oncomine visualizations
• How to search Oncomine using filters or the search box
• Performing Analysis Comparison (meta-analysis) across studies to identify new targets
Oncomine 4.3 Training - Module 1: Introduction to Oncomine 5
No part of this document may be reproduced without written consent from Compendia Bioscience.
Training Manual Conventions
1. Style Conventions
Bold Keyboard-entered text (MYC)
Bold and Italic Command series (All > Tumor vs. Normal > Prostate)
Title Capitalization Dialog box names (Search); menu names (Sort By)
2. Oncomine Notes
Oncomine Notes appear in boxes throughout this manual to provide general information designed to make Oncomine easier to use. There are two types of Oncomine Notes in this manual: Tip and Tech Note. These notes are enclosed in boxes to make them easy to distinguish and locate for future reference:
TIP: Tips provide added information about how Oncomine works, or offer suggestions about how to speed up an operation.
TECH NOTE: Technical notes provide additional information about various functions in Oncomine.
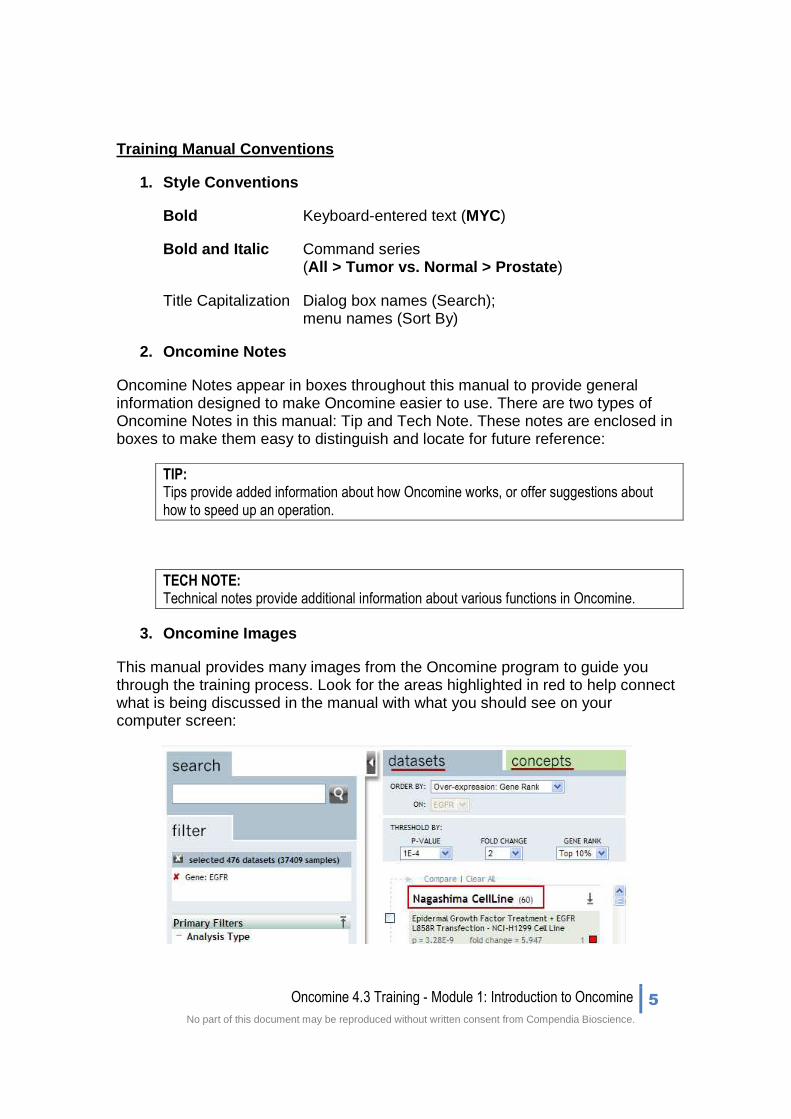
3. Oncomine Images
This manual provides many images from the Oncomine program to guide you through the training process. Look for the areas highlighted in red to help connect what is being discussed in the manual with what you should see on your computer screen:

6 Oncomine 4.3 Training - Module 1: Introduction to Oncomine
No part of this document may be reproduced without written consent from Compendia Bioscience.
What is Oncomine?
Oncomine is a cancer-profiling database containing published data that has been collected, standardized, annotated and analyzed by Compendia Bioscience. Experimental details and sample facts are collected from supplemental data and direct correspondence with authors of published work and added to the database to drive new analyses. The data are normalized and analyzed using standard protocols, and presented to the end-user of Oncomine through a web-based interface.
Oncomine Definitions
Reporters: the specific DNA sequence used to identify the expression of a gene via hybridization to sample.
Samples: single cell line, patient tissue, etc., represented as a single microarray of data.
Analyses: Various computations performed on microarray data, including differential expression testing, co-expression, and outlier analysis.
Datasets: Data related to a single publication denoted by Author Tissue Type naming convention.
Filters: Levels within the hierarchical tree/ontology structure that can be applied to isolate specific analyses, cancer types, sample types, and gene sets.
Concepts: Sets of genes representing some aspect of biology derived from both Oncomine gene expression signatures as well as third party sources such as Gene Ontology, KEGG Pathways, Human Protein Reference Database, etc.
Oncomine 4.3 Training - Module 1: Introduction to Oncomine 7
No part of this document may be reproduced without written consent from Compendia Bioscience.
Oncomine Content
Oncomine currently includes gene expression and sample data from 500 cancer types and a wide range of cancer-related cell lines. There are more than 490 datasets and nearly 40,000 measured samples, including cell line panels representing published datasets and microarray experiments, respectively. Our curation process checks for consistency and completeness of data from each dataset, such that nearly 40+ percent of datasets curated by Compendia contain data that is not available from public repositories such as GEO and ArrayExpress. Compendia continues to update the database regularly to capture the best and most recent experimental results.
Sources of data available in Oncomine: • Published Literature • Author correspondence • International Genomics Consortium (IGC) • Gene Expression Omnibus (GEO), NCI • ArrayExpress, European Bioinformatics Institute • Stanford Microarray Database (SMD)
Types of data available in Oncomine:
• Gene expression o Affymetrix o Agilent o Illumina o Custom
• DNA amplification (aCGH) o Affymetrix o Agilent o Custom
Examples of sample data available in Oncomine:
• Gleason score • Estrogen Receptor Status • Metastasis Status • P53 Mutation Status • Stage • Molecular Alteration • Treatment • Survival • Recurrence

8 Oncomine 4.3 Training - Module 1: Introduction to Oncomine
No part of this document may be reproduced without written consent from Compendia Bioscience.
Analyses that Support Hypotheses
Data in Oncomine can be searched by gene, multiple genes or by a number of cancer-related terms, such as “prostate carcinoma”, “grade” or “treatment”. Pre-computed analyses make it is easy to identify genes that have a high statistical significance for over- or under-expression in particular comparisons. Visualizations can be sorted by sample data (such as Gleason score, stage, molecular alteration, treatment, survival, and relapse) making it possible to identify genes that are de-regulated in particular cancer subtypes, or that are associated with specific clinical or pathological parameters.
Cancer gene expression signatures can be investigated with Oncomine in several ways. Oncomine is very useful for investigating genes that are over-expressed in multiple cancer datasets to validate the relationship between transcription and disease. More advanced analysis might look for genes over-expressed in a small fraction of samples of a cancer type using the Cancer Outlier Profile Analysis (COPA) method of “Outlier Analysis”, a method developed for Oncomine1. Furthermore, filters can be applied to extract sets of genes that are over-expressed within a particular dataset and within a particular gene ontology (such as apoptosis), at a high level of significance.
Below are examples of the types of analyses available in Oncomine, together with the type of question that each was designed to answer:
• Differential Gene Expression: What genes are over- or under- expressed in particular cancer types or subtypes?
• Co-expression: Is my target gene coordinately expressed with other genes that are members of a biological pathway activated in a cancer type?
• Outlier Analysis: What genes might be good biomarkers for cancer subtypes?
• Comparing: What gene expression patterns or gene sets are validated across multiple datasets?
• Concept List: Can patient subtypes be associated with this signature or gene list Representing underlying biology?
• Concept Associations: What genes are over-expressed in a cancer subtype and are members of a literature-defined biological concept?
1 Tomlins, SA et al. (2005). Recurrent Fusion of TMPRSS2 and ETS Transcription Factor Genes in Prostate Cancer. Science 310, 644-648.

Oncomine 4.3 Training - Module 1: Introduction to Oncomine 9
No part of this document may be reproduced without written consent from Compendia Bioscience.
1.1 Getting Started
Registration
• Users need to be registered for Oncomine 4.3.
• Previous username and password are still applicable.
• Navigate to www.oncomine.com
• Select the “Not a user? Register now!” link
• Request registration with valid business email
• Once registration is accepted a password will be sent to the email provided
• Select “Forgot password?” link to reset at any time
• Return to www.oncomine.com and enter USER ID (email address) and PASSWORD to login to Oncomine.
10 Oncomine 4.3 Training - Module 1: Introduction to Oncomine
No part of this document may be reproduced without written consent from Compendia Bioscience.
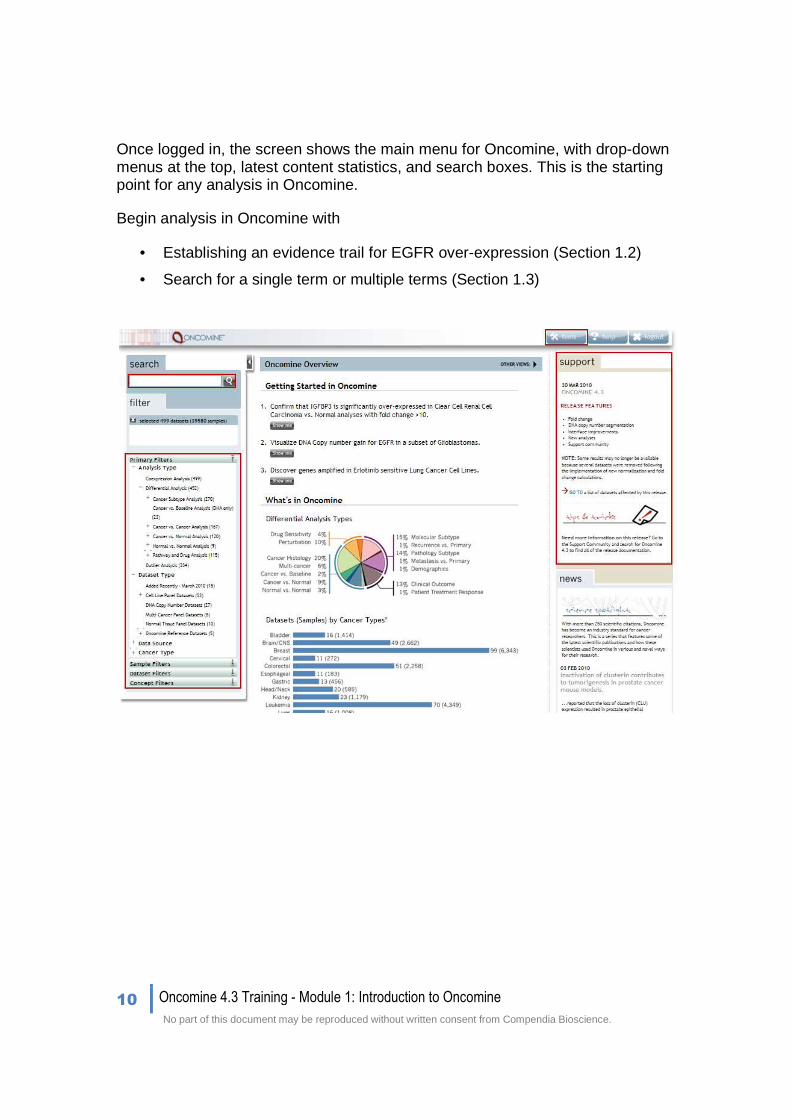
Once logged in, the screen shows the main menu for Oncomine, with drop-down menus at the top, latest content statistics, and search boxes. This is the starting point for any analysis in Oncomine.
Begin analysis in Oncomine with
• Establishing an evidence trail for EGFR over-expression (Section 1.2)
• Search for a single term or multiple terms (Section 1.3)
Oncomine 4.3 Training - Module 1: Introduction to Oncomine 11
No part of this document may be reproduced without written consent from Compendia Bioscience.
1.2 Target Validation: Establishing an evidence trail for EGFR over-expression
We begin this training module by introducing a typical starting point for analysis in Oncomine, a gene search, and demonstrate some of the strategies that can be used to derive information about additional genes in Oncomine.
I am interested in EGFR over-expression in brain cancer, specifically glioblastomas. What can Oncomine tell me about my gene of interest?
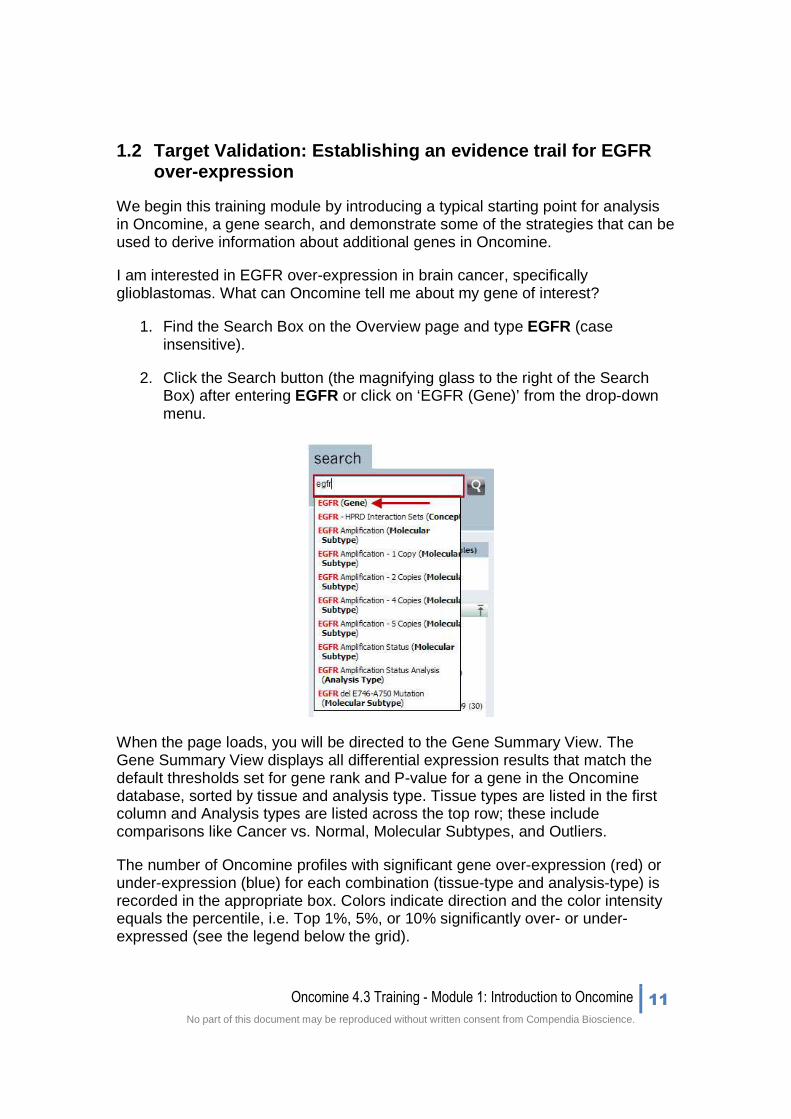
1. Find the Search Box on the Overview page and type EGFR (case insensitive).
2. Click the Search button (the magnifying glass to the right of the Search Box) after entering EGFR or click on ‘EGFR (Gene)’ from the drop-down menu.
When the page loads, you will be directed to the Gene Summary View. The Gene Summary View displays all differential expression results that match the default thresholds set for gene rank and P-value for a gene in the Oncomine database, sorted by tissue and analysis type. Tissue types are listed in the first column and Analysis types are listed across the top row; these include comparisons like Cancer vs. Normal, Molecular Subtypes, and Outliers.
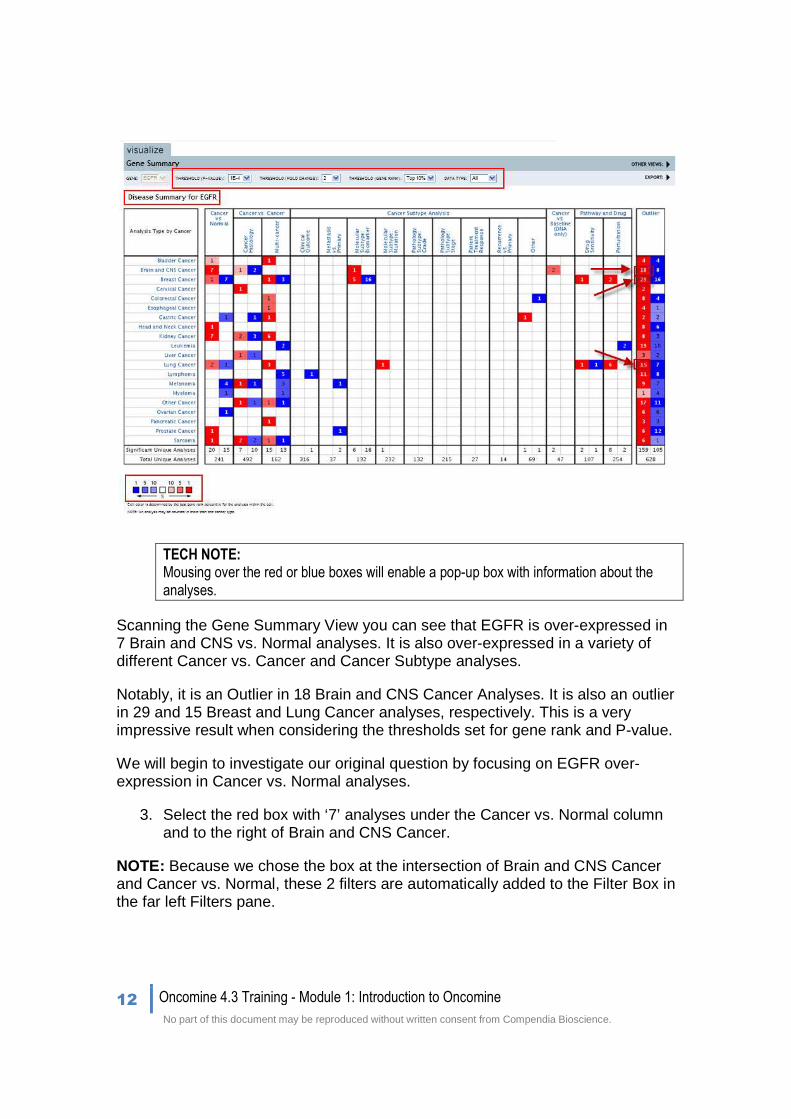
The number of Oncomine profiles with significant gene over-expression (red) or under-expression (blue) for each combination (tissue-type and analysis-type) is recorded in the appropriate box. Colors indicate direction and the color intensity equals the percentile, i.e. Top 1%, 5%, or 10% significantly over- or under-expressed (see the legend below the grid).
12 Oncomine 4.3 Training - Module 1: Introduction to Oncomine
No part of this document may be reproduced without written consent from Compendia Bioscience.
TECH NOTE: Mousing over the red or blue boxes will enable a pop-up box with information about the analyses.
Scanning the Gene Summary View you can see that EGFR is over-expressed in 7 Brain and CNS vs. Normal analyses. It is also over-expressed in a variety of different Cancer vs. Cancer and Cancer Subtype analyses.
Notably, it is an Outlier in 18 Brain and CNS Cancer Analyses. It is also an outlier in 29 and 15 Breast and Lung Cancer analyses, respectively. This is a very impressive result when considering the thresholds set for gene rank and P-value.
We will begin to investigate our original question by focusing on EGFR over-expression in Cancer vs. Normal analyses.
3. Select the red box with ‘7’ analyses under the Cancer vs. Normal column and to the right of Brain and CNS Cancer.
NOTE: Because we chose the box at the intersection of Brain and CNS Cancer and Cancer vs. Normal, these 2 filters are automatically added to the Filter Box in the far left Filters pane.
Oncomine 4.3 Training - Module 1: Introduction to Oncomine 13
No part of this document may be reproduced without written consent from Compendia Bioscience.
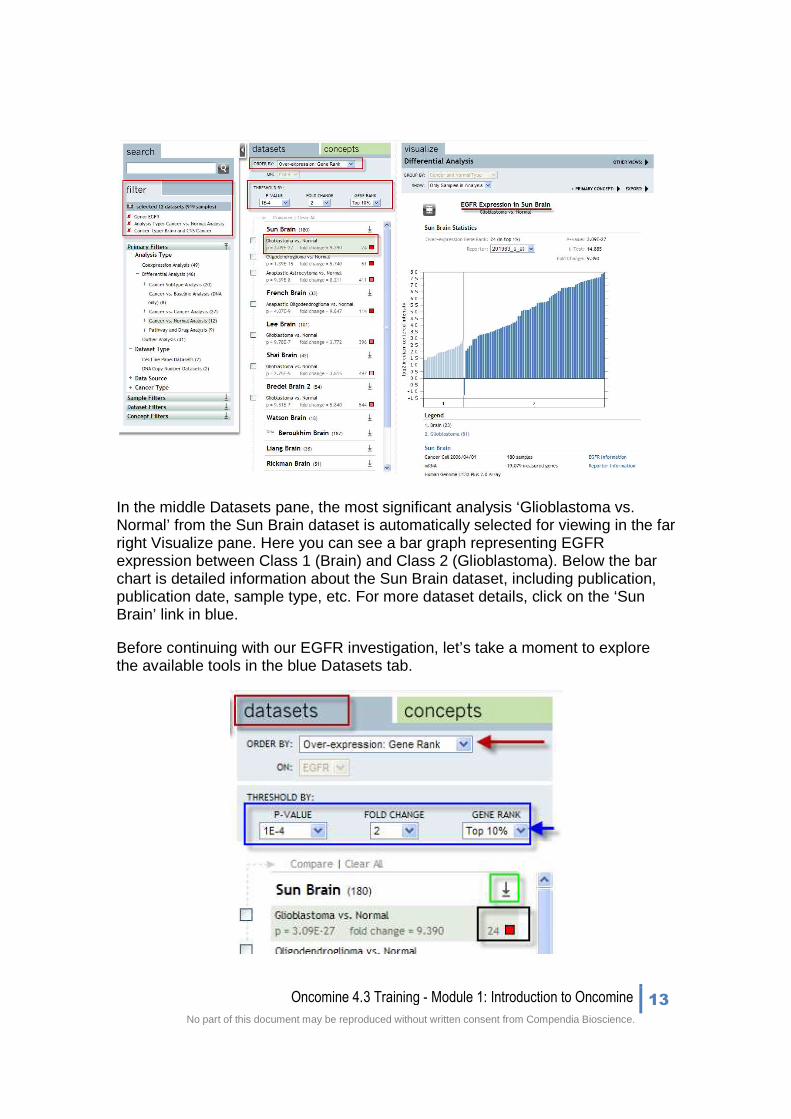
In the middle Datasets pane, the most significant analysis ‘Glioblastoma vs. Normal’ from the Sun Brain dataset is automatically selected for viewing in the far right Visualize pane. Here you can see a bar graph representing EGFR expression between Class 1 (Brain) and Class 2 (Glioblastoma). Below the bar chart is detailed information about the Sun Brain dataset, including publication, publication date, sample type, etc. For more dataset details, click on the ‘Sun Brain’ link in blue.
Before continuing with our EGFR investigation, let’s take a moment to explore the available tools in the blue Datasets tab.
14 Oncomine 4.3 Training - Module 1: Introduction to Oncomine
No part of this document may be reproduced without written consent from Compendia Bioscience.
The red arrow is pointing to the ‘Order By’ function. This enables the user to order the analyses and datasets by over-/under-expression gene rank, fold change, or P-value. You can also order by dataset name, and when possible, outlier rank and coexpression.
Below the ‘Order By’ drop-down menu, are the ‘Threshold By…’ menus where you can change the gene rank, fold change, and P-value thresholds. The default settings are shown in the image above.
The down arrow, shown in this screenshot within a green box, is clickable and allows the user to see other analyses that fulfill our filter requirements, but are not significant at the thresholds specified by the chosen gene rank, fold change, and P-value.
Lastly, the highlighted black box contains a number and a color chip. The number ‘24’ represents EGFR’s gene rank by P-value. In this analysis, there are 23 other genes having a better P-value than EGFR. The color chip (to the right of the gene rank) indicates the relative degree of significance of over-expression; the more intense red (over-expression) or blue (under-expression) indicates a more highly significant over-expressed or under-expressed gene.
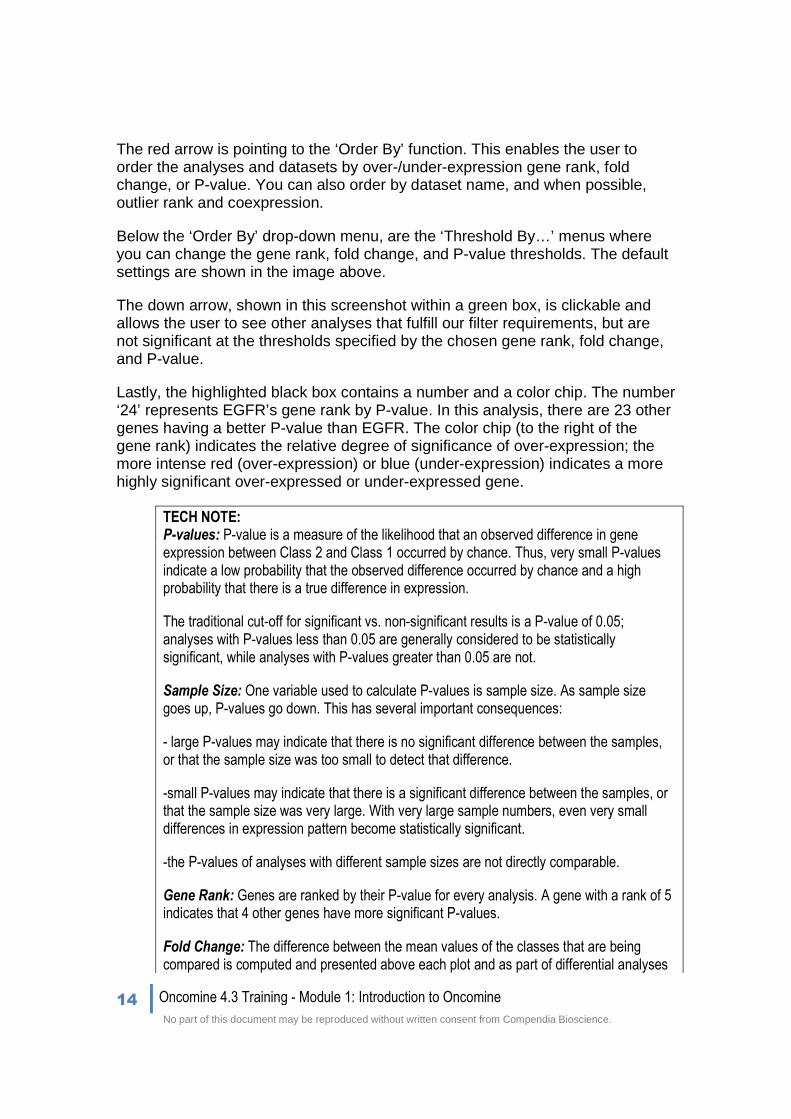
TECH NOTE: P-values: P-value is a measure of the likelihood that an observed difference in gene expression between Class 2 and Class 1 occurred by chance. Thus, very small P-values indicate a low probability that the observed difference occurred by chance and a high probability that there is a true difference in expression.
The traditional cut-off for significant vs. non-significant results is a P-value of 0.05; analyses with P-values less than 0.05 are generally considered to be statistically significant, while analyses with P-values greater than 0.05 are not.
Sample Size: One variable used to calculate P-values is sample size. As sample size goes up, P-values go down. This has several important consequences:
- large P-values may indicate that there is no significant difference between the samples, or that the sample size was too small to detect that difference.
-small P-values may indicate that there is a significant difference between the samples, or that the sample size was very large. With very large sample numbers, even very small differences in expression pattern become statistically significant.
-the P-values of analyses with different sample sizes are not directly comparable.
Gene Rank: Genes are ranked by their P-value for every analysis. A gene with a rank of 5 indicates that 4 other genes have more significant P-values.
Fold Change: The difference between the mean values of the classes that are being compared is computed and presented above each plot and as part of differential analyses
Oncomine 4.3 Training - Module 1: Introduction to Oncomine 15
No part of this document may be reproduced without written consent from Compendia Bioscience.
as “Fold Change”. Fold change provides a way to evaluate differences between groups where P-values may be insignificant due to low number of samples and high variation. In addition, fold change can inform where P-values are highly significant due to high number of samples and low variance when actual differences in levels are low.
Threshold: This feature allows users to limit (or expand) the number of analyses seen in the Datasets tab.
16 Oncomine 4.3 Training - Module 1: Introduction to Oncomine
No part of this document may be reproduced without written consent from Compendia Bioscience.
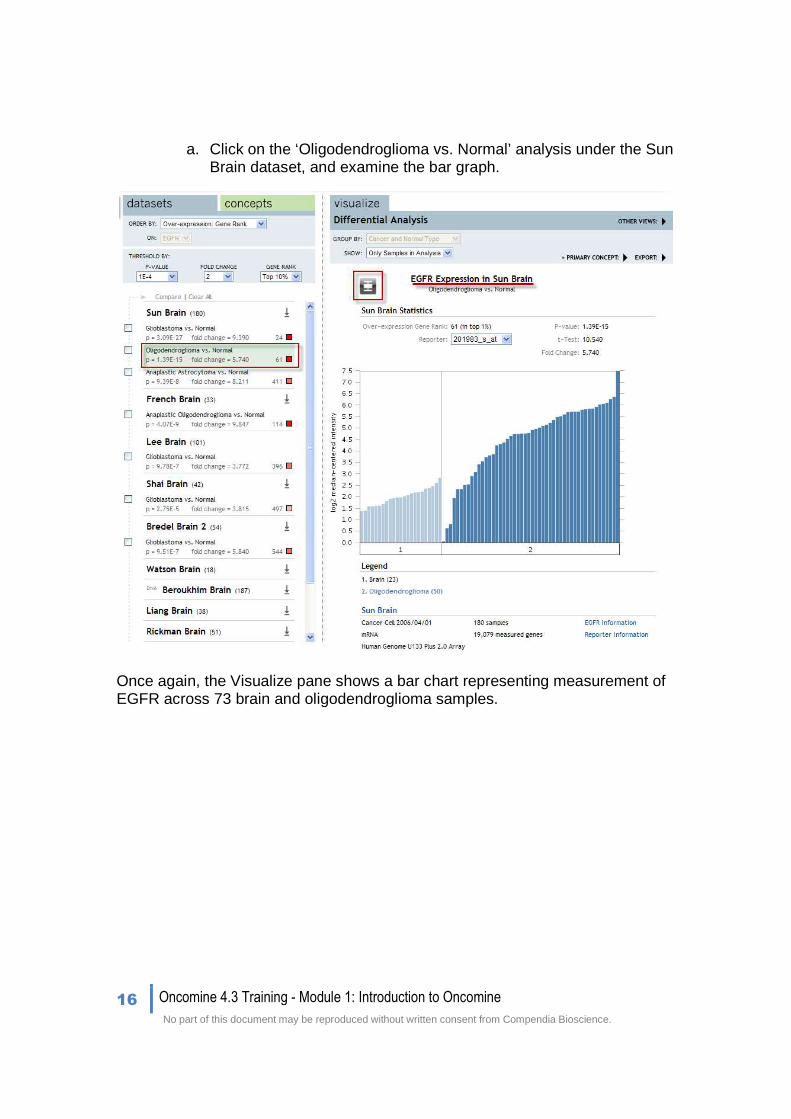
a. Click on the ‘Oligodendroglioma vs. Normal’ analysis under the Sun Brain dataset, and examine the bar graph.
Once again, the Visualize pane shows a bar chart representing measurement of EGFR across 73 brain and oligodendroglioma samples.
Oncomine 4.3 Training - Module 1: Introduction to Oncomine 17
No part of this document may be reproduced without written consent from Compendia Bioscience.
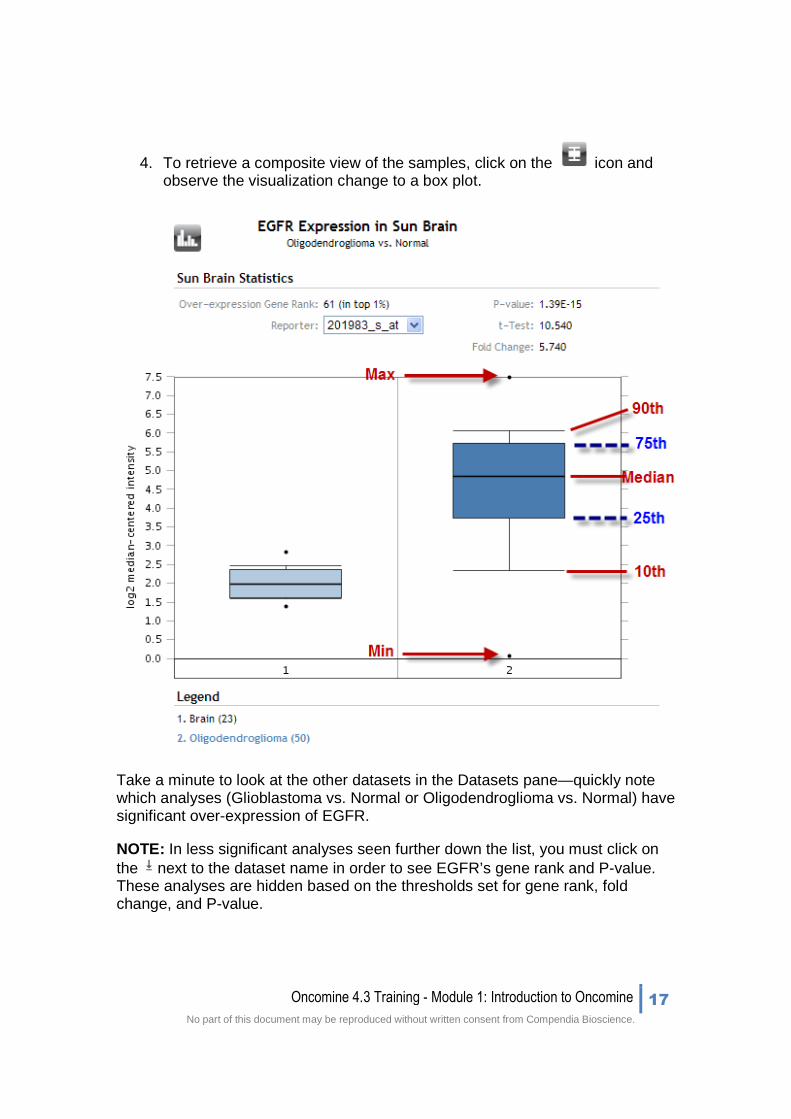
4. To retrieve a composite view of the samples, click on the icon and observe the visualization change to a box plot.
Take a minute to look at the other datasets in the Datasets pane—quickly note which analyses (Glioblastoma vs. Normal or Oligodendroglioma vs. Normal) have significant over-expression of EGFR.
NOTE: In less significant analyses seen further down the list, you must click on the next to the dataset name in order to see EGFR’s gene rank and P-value. These analyses are hidden based on the thresholds set for gene rank, fold change, and P-value.
18 Oncomine 4.3 Training - Module 1: Introduction to Oncomine
No part of this document may be reproduced without written consent from Compendia Bioscience.
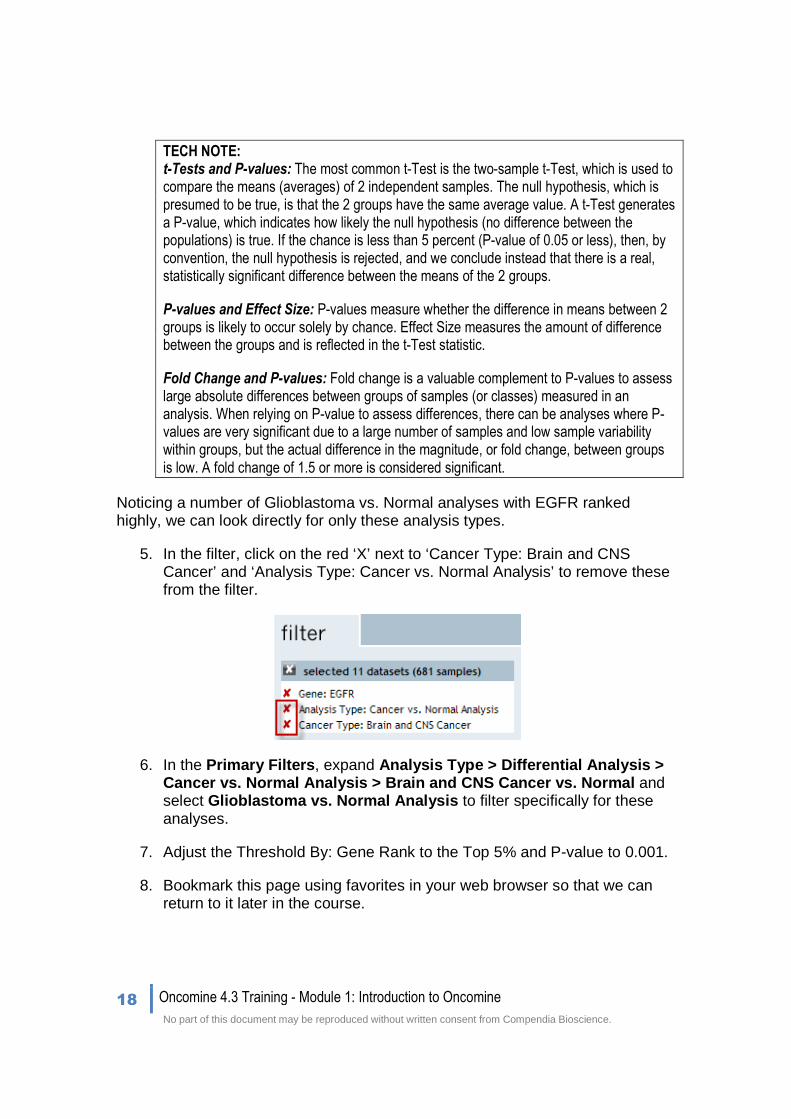
TECH NOTE: t-Tests and P-values: The most common t-Test is the two-sample t-Test, which is used to compare the means (averages) of 2 independent samples. The null hypothesis, which is presumed to be true, is that the 2 groups have the same average value. A t-Test generates a P-value, which indicates how likely the null hypothesis (no difference between the populations) is true. If the chance is less than 5 percent (P-value of 0.05 or less), then, by convention, the null hypothesis is rejected, and we conclude instead that there is a real, statistically significant difference between the means of the 2 groups.
P-values and Effect Size: P-values measure whether the difference in means between 2 groups is likely to occur solely by chance. Effect Size measures the amount of difference between the groups and is reflected in the t-Test statistic.
Fold Change and P-values: Fold change is a valuable complement to P-values to assess large absolute differences between groups of samples (or classes) measured in an analysis. When relying on P-value to assess differences, there can be analyses where P-values are very significant due to a large number of samples and low sample variability within groups, but the actual difference in the magnitude, or fold change, between groups is low. A fold change of 1.5 or more is considered significant.
Noticing a number of Glioblastoma vs. Normal analyses with EGFR ranked highly, we can look directly for only these analysis types.
5. In the filter, click on the red ‘X’ next to ‘Cancer Type: Brain and CNS Cancer’ and ‘Analysis Type: Cancer vs. Normal Analysis’ to remove these from the filter.
6. In the Primary Filters , expand Analysis Type > Differential Analysis > Cancer vs. Normal Analysis > Brain and CNS Cancer v s. Normal and select Glioblastoma vs. Normal Analysis to filter specifically for these analyses.
7. Adjust the Threshold By: Gene Rank to the Top 5% and P-value to 0.001.
8. Bookmark this page using favorites in your web browser so that we can return to it later in the course.
Oncomine 4.3 Training - Module 1: Introduction to Oncomine 19
No part of this document may be reproduced without written consent from Compendia Bioscience.
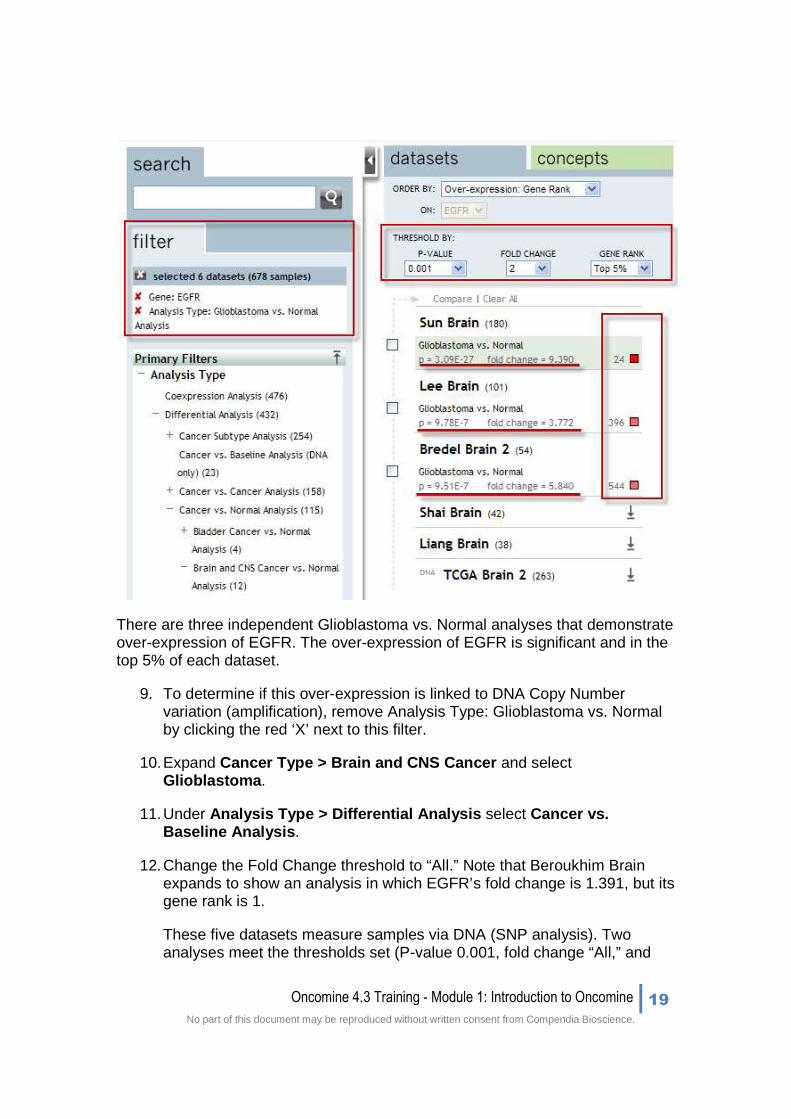
There are three independent Glioblastoma vs. Normal analyses that demonstrate over-expression of EGFR. The over-expression of EGFR is significant and in the top 5% of each dataset.
9. To determine if this over-expression is linked to DNA Copy Number variation (amplification), remove Analysis Type: Glioblastoma vs. Normal by clicking the red ‘X’ next to this filter.
10. Expand Cancer Type > Brain and CNS Cancer and select Glioblastoma .
11. Under Analysis Type > Differential Analysis select Cancer vs. Baseline Analysis .
12. Change the Fold Change threshold to “All.” Note that Beroukhim Brain expands to show an analysis in which EGFR’s fold change is 1.391, but its gene rank is 1.
These five datasets measure samples via DNA (SNP analysis). Two analyses meet the thresholds set (P-value 0.001, fold change “All,” and

20 Oncomine 4.3 Training - Module 1: Introduction to Oncomine
No part of this document may be reproduced without written consent from Compendia Bioscience.
gene rank Top 5%): Beroukhim Brain’s Primary Glioblastoma One Sample t-Test, and TCGA Brain 2 Glioblastoma One Sample t-Test.
Expand Beroukhim Brain, Maser Brain, Kotliarov Brain, and Cloughesy
Brain by selecting the icon.
Four datasets show amplification of EGFR in a subset of samples indicating that at least some EGFR over-expression is likely due to high-level amplification in glioblastomas.
13. Click the bar chart icon to return to a bar chart view.

Oncomine 4.3 Training - Module 1: Introduction to Oncomine 21
No part of this document may be reproduced without written consent from Compendia Bioscience.
TECH NOTE: If you change the thresholds for gene rank, fold change, and P-value, more analyses will automatically be shown in the Datasets pane. If you change the gene rank to ‘Top 10%,’ the fold change to ‘All,’ and the P-value to ‘0.05,’ you will now be able to see more
analyses listed without clicking on for each dataset.
TIP: Click on the reporter drop-down menu on the Visualize pane to see all of the reporters measured for your particular gene of interest.
22 Oncomine 4.3 Training - Module 1: Introduction to Oncomine
No part of this document may be reproduced without written consent from Compendia Bioscience.
Conclusion
By simply typing EGFR into the Search Box, we were able to find several significant analyses that had EGFR as a highly ranked over- or under-expressed gene. The Gene Summary View gave us a great starting point for finding significant and interesting analyses.
We looked at many tools in the Datasets pane, including ‘Order By’ and ‘Threshold By’ that will be helpful and necessary for understanding and interpreting all of Oncomine’s data and function.
By looking at Brain and CNS Cancer vs. Normal analyses, we were able to identify EGFR’s over-expression in many Glioblastoma vs. Normal analyses. We also used the Cancer vs. Baseline Analysis with Cancer Type: Glioblastoma to specifically look at DNA Copy Number experiments.
We conclude that EGFR is over-expressed in Glioblastomas vs. Normal and that this over-expression can be linked to DNA amplification in at least some samples.

Oncomine 4.3 Training - Module 1: Introduction to Oncomine 23
No part of this document may be reproduced without written consent from Compendia Bioscience.
1.3 Multi-gene Validation: Co-expression of EGFR and pathway members in glioblastomas
The Coexpression filter will rank analyses based on the correlation of expression between our gene, EGFR, and others in the data set. High correlations will be represented by the correlation value in the Datasets pane (closest to 1 indicates highest correlation) and the matching gene expression patterns in the Visualize pane.
1. Remove the Analysis Type: Cancer vs. Baseline Analysis (DNA only) from the filter by clicking the red ‘X’.
2. Expand the Dataset Filters > Data Type and select mRNA .
3. Select Coexpression Analysis (Primary Filters > Analysis Type ).
4. Expand Sample Filters > Sample Type and select Clinical Specimen .
5. Adjust the Threshold By: Gene Rank: to Top 10%.
These filters will return mRNA datasets having glioblastomas clinical samples with EGFR Coexpression results ranked in the Top 10% of the dataset. In examining the Coexpression results we can determine if there are certain programs coordinately expressed with EGFR that would help determine other potential targets in the same pathway.
24 Oncomine 4.3 Training - Module 1: Introduction to Oncomine
No part of this document may be reproduced without written consent from Compendia Bioscience.
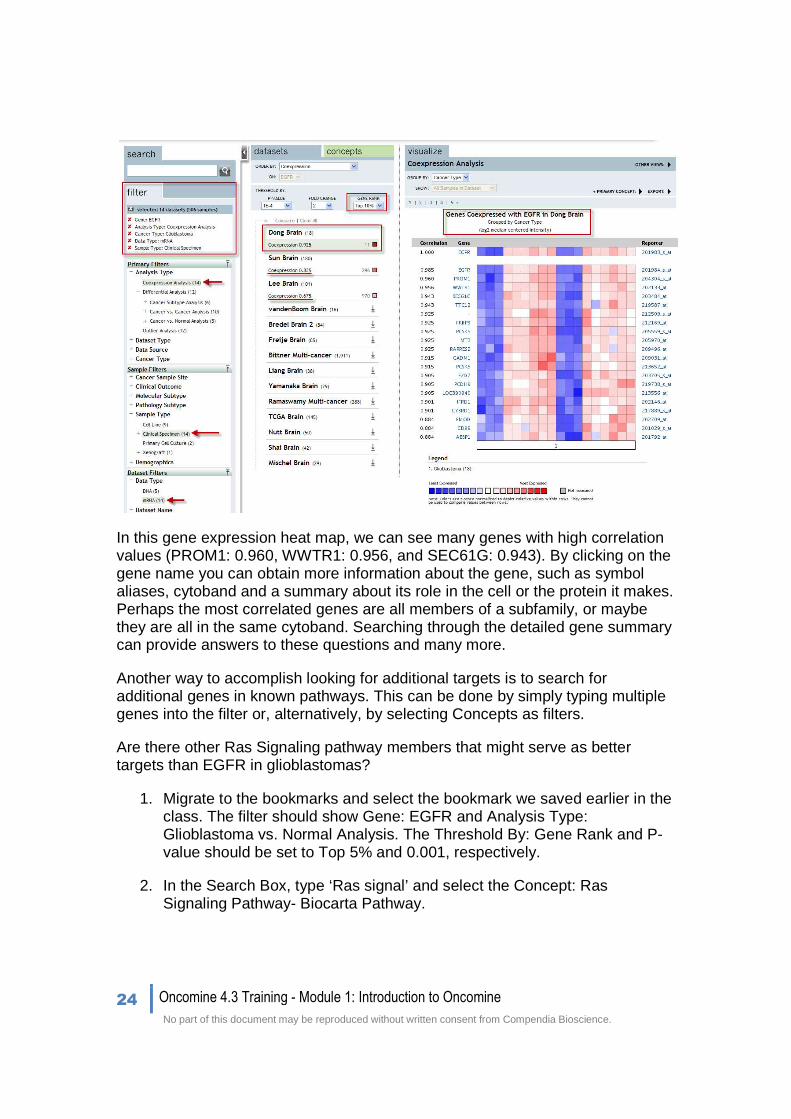
In this gene expression heat map, we can see many genes with high correlation values (PROM1: 0.960, WWTR1: 0.956, and SEC61G: 0.943). By clicking on the gene name you can obtain more information about the gene, such as symbol aliases, cytoband and a summary about its role in the cell or the protein it makes. Perhaps the most correlated genes are all members of a subfamily, or maybe they are all in the same cytoband. Searching through the detailed gene summary can provide answers to these questions and many more.
Another way to accomplish looking for additional targets is to search for additional genes in known pathways. This can be done by simply typing multiple genes into the filter or, alternatively, by selecting Concepts as filters.
Are there other Ras Signaling pathway members that might serve as better targets than EGFR in glioblastomas?
1. Migrate to the bookmarks and select the bookmark we saved earlier in the class. The filter should show Gene: EGFR and Analysis Type: Glioblastoma vs. Normal Analysis. The Threshold By: Gene Rank and P-value should be set to Top 5% and 0.001, respectively.
2. In the Search Box, type ‘Ras signal’ and select the Concept: Ras Signaling Pathway- Biocarta Pathway.
Oncomine 4.3 Training - Module 1: Introduction to Oncomine 25
No part of this document may be reproduced without written consent from Compendia Bioscience.
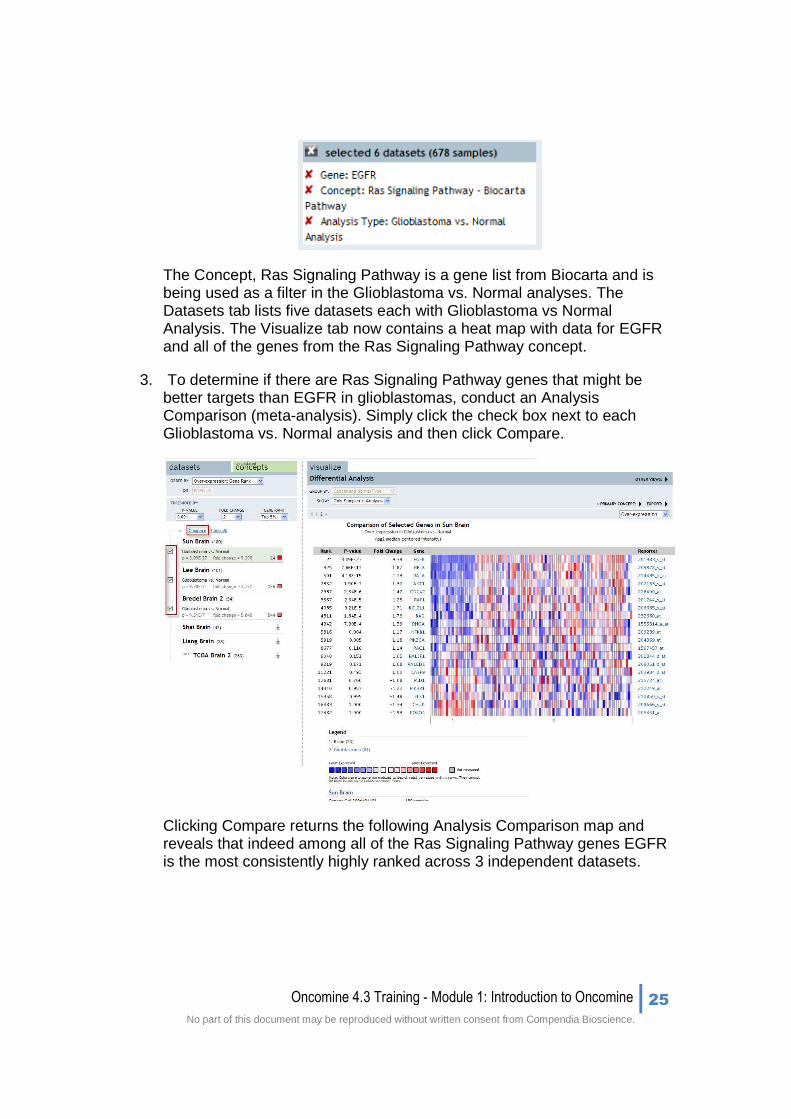
The Concept, Ras Signaling Pathway is a gene list from Biocarta and is being used as a filter in the Glioblastoma vs. Normal analyses. The Datasets tab lists five datasets each with Glioblastoma vs Normal Analysis. The Visualize tab now contains a heat map with data for EGFR and all of the genes from the Ras Signaling Pathway concept.
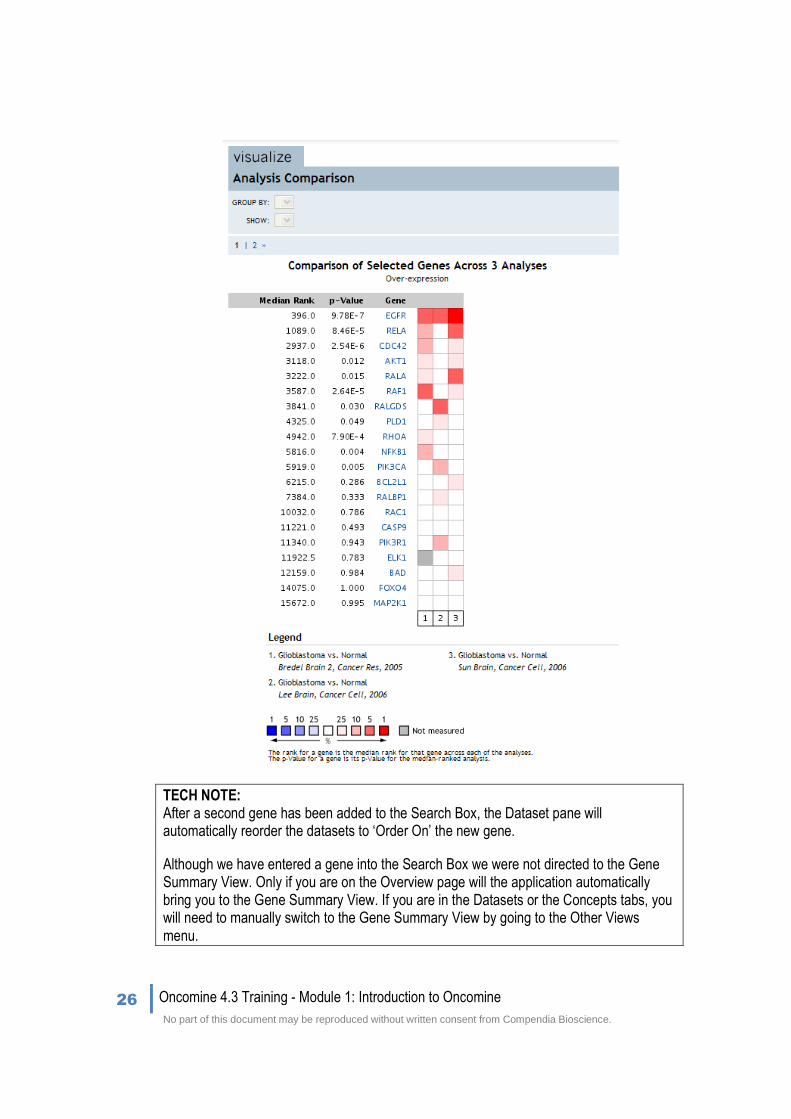
3. To determine if there are Ras Signaling Pathway genes that might be better targets than EGFR in glioblastomas, conduct an Analysis Comparison (meta-analysis). Simply click the check box next to each Glioblastoma vs. Normal analysis and then click Compare.
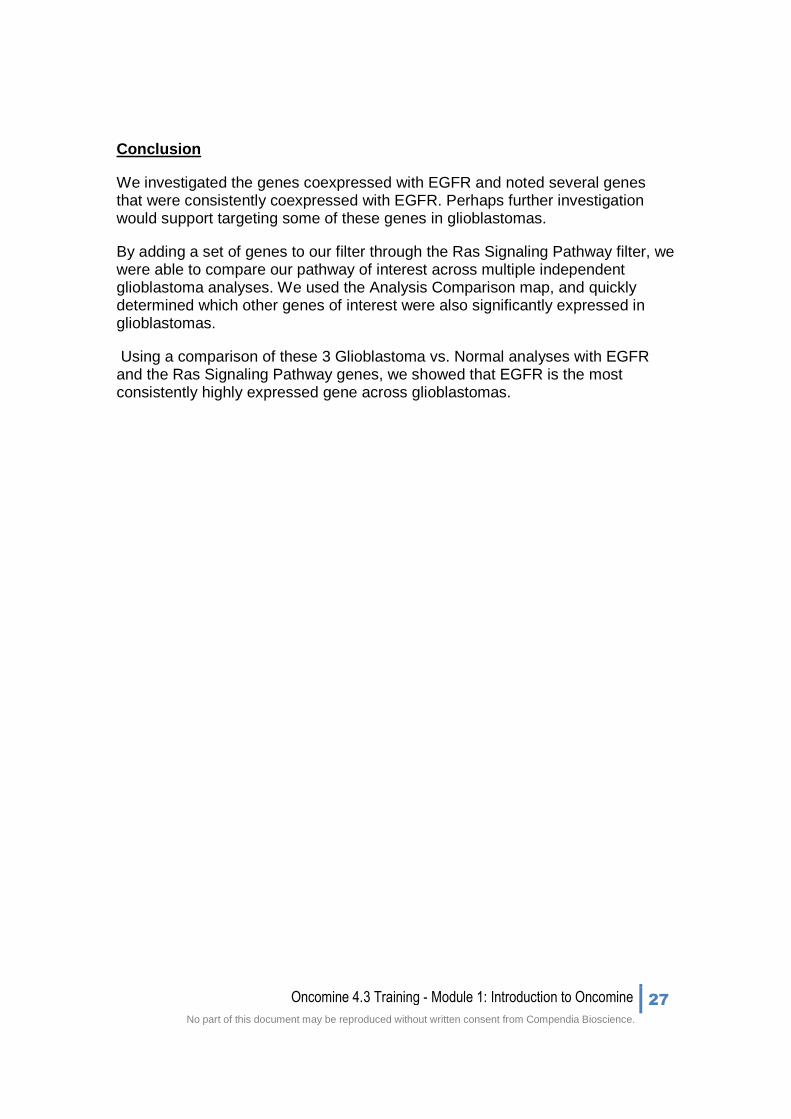
Clicking Compare returns the following Analysis Comparison map and reveals that indeed among all of the Ras Signaling Pathway genes EGFR is the most consistently highly ranked across 3 independent datasets.
26 Oncomine 4.3 Training - Module 1: Introduction to Oncomine
No part of this document may be reproduced without written consent from Compendia Bioscience.
TECH NOTE: After a second gene has been added to the Search Box, the Dataset pane will automatically reorder the datasets to ‘Order On’ the new gene.
Although we have entered a gene into the Search Box we were not directed to the Gene Summary View. Only if you are on the Overview page will the application automatically bring you to the Gene Summary View. If you are in the Datasets or the Concepts tabs, you will need to manually switch to the Gene Summary View by going to the Other Views menu.
Oncomine 4.3 Training - Module 1: Introduction to Oncomine 27
No part of this document may be reproduced without written consent from Compendia Bioscience.
Conclusion
We investigated the genes coexpressed with EGFR and noted several genes that were consistently coexpressed with EGFR. Perhaps further investigation would support targeting some of these genes in glioblastomas.
By adding a set of genes to our filter through the Ras Signaling Pathway filter, we were able to compare our pathway of interest across multiple independent glioblastoma analyses. We used the Analysis Comparison map, and quickly determined which other genes of interest were also significantly expressed in glioblastomas.
Using a comparison of these 3 Glioblastoma vs. Normal analyses with EGFR and the Ras Signaling Pathway genes, we showed that EGFR is the most consistently highly expressed gene across glioblastomas.
28 Oncomine 4.3 Training - Module 1: Introduction to Oncomine
No part of this document may be reproduced without written consent from Compendia Bioscience.
1.4 Target Discovery: Meta-analysis of glioblastoma
Looking at the over-expression data, EGFR is highly over-expressed in several glioblastoma datasets when compared to normal tissue. Can I compare multiple Glioblastoma vs. Normal analyses to identify new genes that are over-expressed in glioblastomas?
To further nominate novel targets, we will want to compare several independent Glioblastoma vs. Normal analyses in the absence of any gene filters.
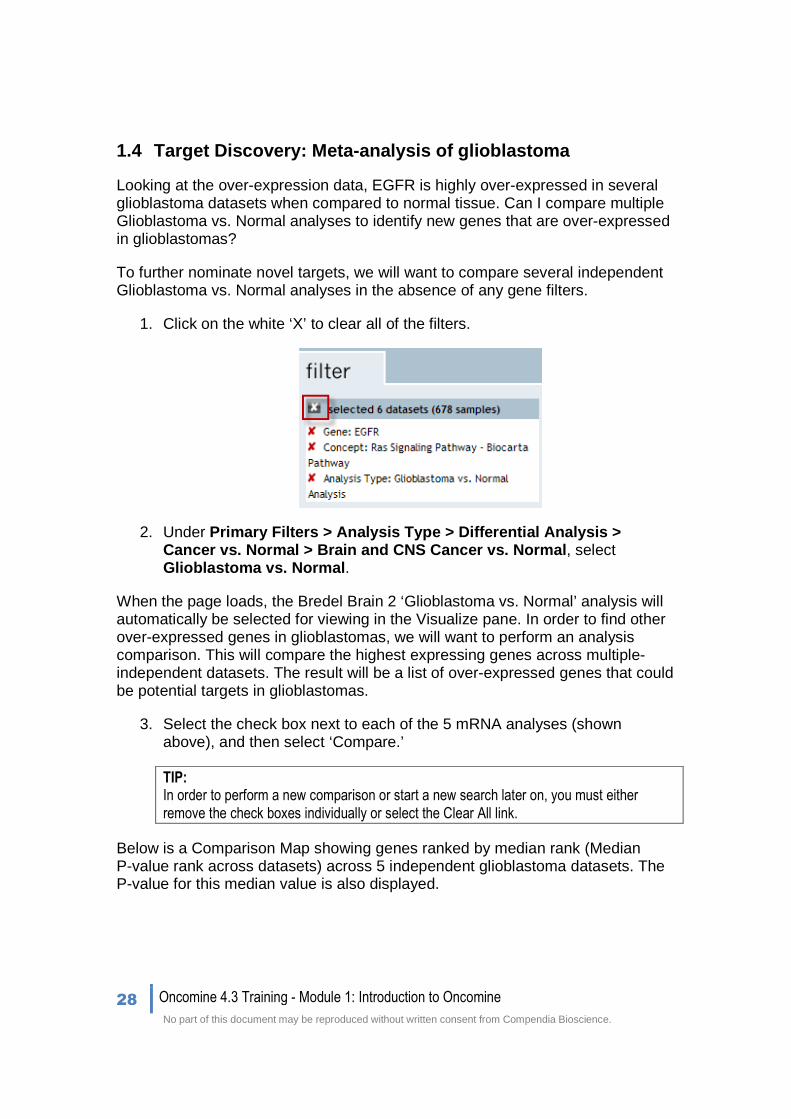
1. Click on the white ‘X’ to clear all of the filters.
2. Under Primary Filters > Analysis Type > Differential Analysis > Cancer vs. Normal > Brain and CNS Cancer vs. Normal, select Glioblastoma vs. Normal.
When the page loads, the Bredel Brain 2 ‘Glioblastoma vs. Normal’ analysis will automatically be selected for viewing in the Visualize pane. In order to find other over-expressed genes in glioblastomas, we will want to perform an analysis comparison. This will compare the highest expressing genes across multiple-independent datasets. The result will be a list of over-expressed genes that could be potential targets in glioblastomas.
3. Select the check box next to each of the 5 mRNA analyses (shown above), and then select ‘Compare.’
TIP: In order to perform a new comparison or start a new search later on, you must either remove the check boxes individually or select the Clear All link.
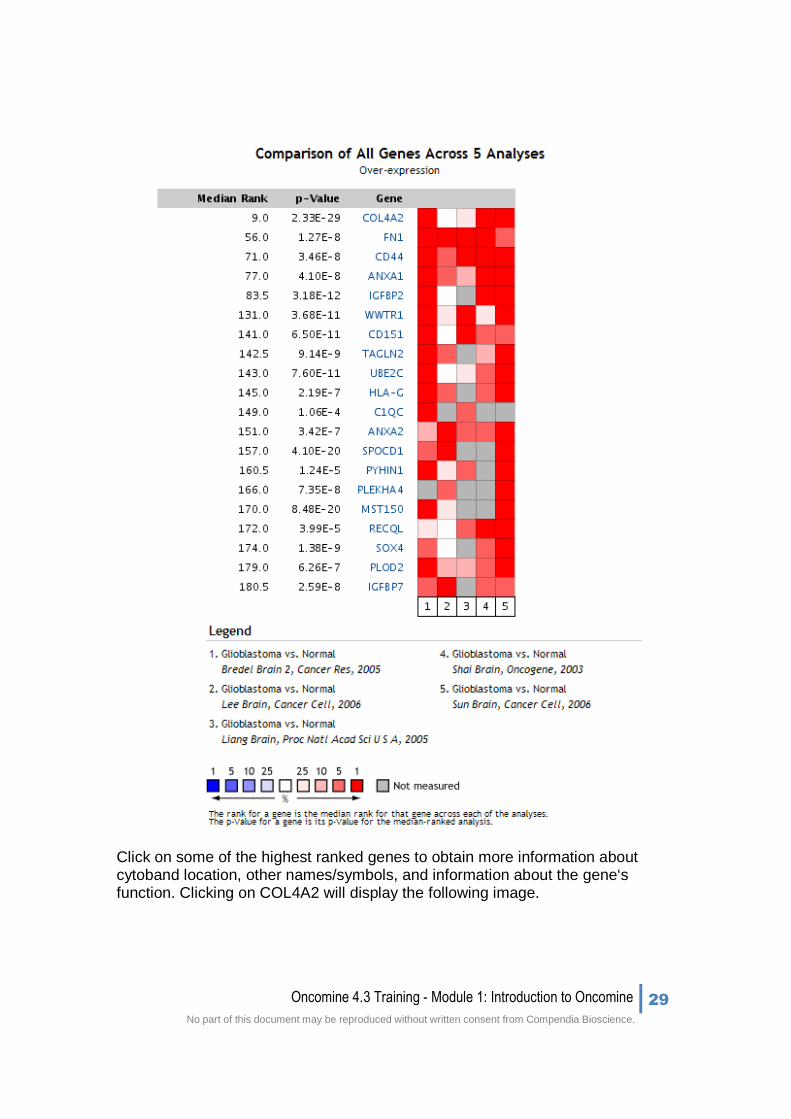
Below is a Comparison Map showing genes ranked by median rank (Median P-value rank across datasets) across 5 independent glioblastoma datasets. The P-value for this median value is also displayed.
Oncomine 4.3 Training - Module 1: Introduction to Oncomine 29
No part of this document may be reproduced without written consent from Compendia Bioscience.
Click on some of the highest ranked genes to obtain more information about cytoband location, other names/symbols, and information about the gene‘s function. Clicking on COL4A2 will display the following image.
30 Oncomine 4.3 Training - Module 1: Introduction to Oncomine
No part of this document may be reproduced without written consent from Compendia Bioscience.
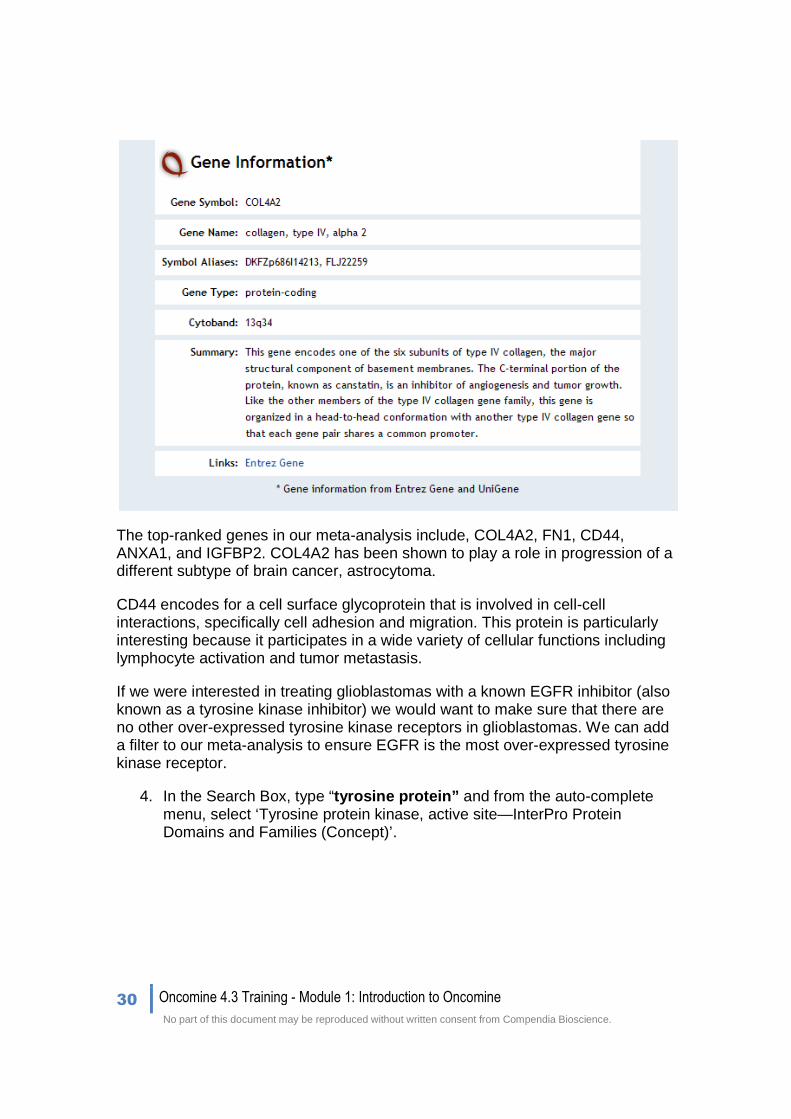
The top-ranked genes in our meta-analysis include, COL4A2, FN1, CD44, ANXA1, and IGFBP2. COL4A2 has been shown to play a role in progression of a different subtype of brain cancer, astrocytoma.
CD44 encodes for a cell surface glycoprotein that is involved in cell-cell interactions, specifically cell adhesion and migration. This protein is particularly interesting because it participates in a wide variety of cellular functions including lymphocyte activation and tumor metastasis.
If we were interested in treating glioblastomas with a known EGFR inhibitor (also known as a tyrosine kinase inhibitor) we would want to make sure that there are no other over-expressed tyrosine kinase receptors in glioblastomas. We can add a filter to our meta-analysis to ensure EGFR is the most over-expressed tyrosine kinase receptor.
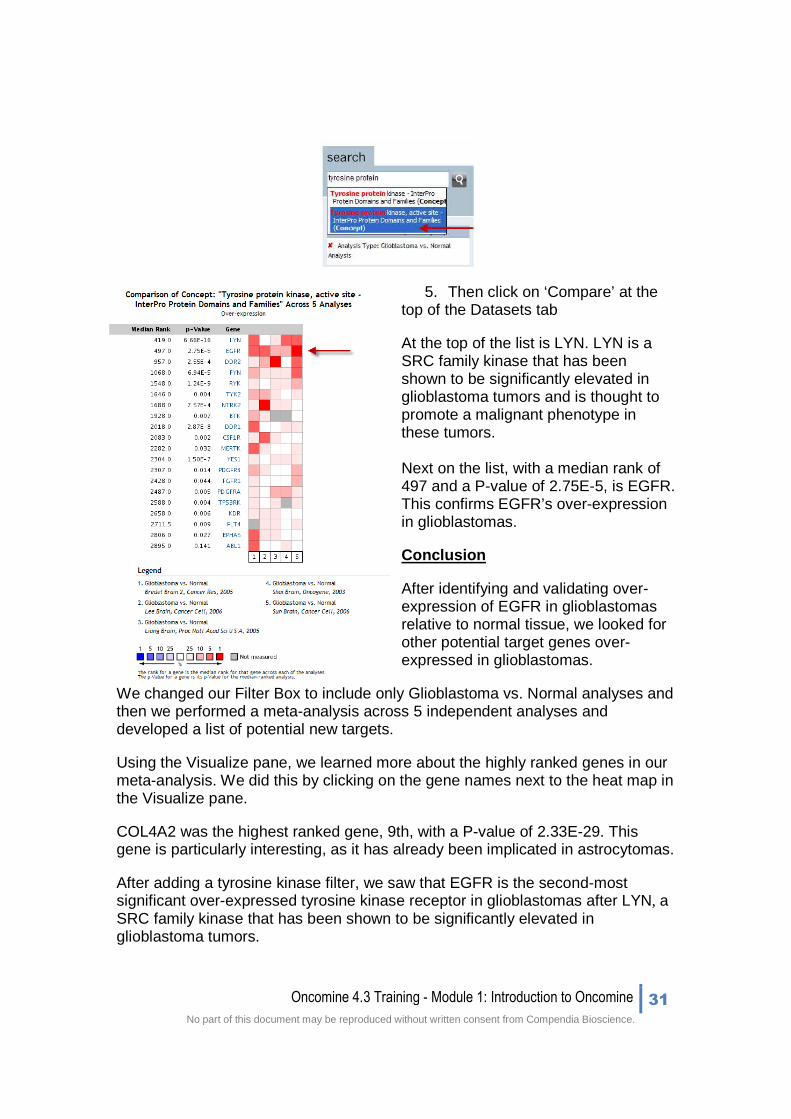
4. In the Search Box, type “tyrosine protein” and from the auto-complete menu, select ‘Tyrosine protein kinase, active site—InterPro Protein Domains and Families (Concept)’.
Oncomine 4.3 Training - Module 1: Introduction to Oncomine 31
No part of this document may be reproduced without written consent from Compendia Bioscience.
5. Then click on ‘Compare’ at the top of the Datasets tab
At the top of the list is LYN. LYN is a SRC family kinase that has been shown to be significantly elevated in glioblastoma tumors and is thought to promote a malignant phenotype in these tumors. Next on the list, with a median rank of 497 and a P-value of 2.75E-5, is EGFR. This confirms EGFR’s over-expression in glioblastomas.
Conclusion
After identifying and validating over- expression of EGFR in glioblastomas relative to normal tissue, we looked for other potential target genes over-expressed in glioblastomas.
We changed our Filter Box to include only Glioblastoma vs. Normal analyses and then we performed a meta-analysis across 5 independent analyses and developed a list of potential new targets.
Using the Visualize pane, we learned more about the highly ranked genes in our meta-analysis. We did this by clicking on the gene names next to the heat map in the Visualize pane.
COL4A2 was the highest ranked gene, 9th, with a P-value of 2.33E-29. This gene is particularly interesting, as it has already been implicated in astrocytomas.
After adding a tyrosine kinase filter, we saw that EGFR is the second-most significant over-expressed tyrosine kinase receptor in glioblastomas after LYN, a SRC family kinase that has been shown to be significantly elevated in glioblastoma tumors.

32 Oncomine 4.3 Training - Module 1: Introduction to Oncomine
No part of this document may be reproduced without written consent from Compendia Bioscience.
1.5 Summary of Target Validation and Target Discovery
In conclusion, we established an evidence trail for the over-expression of EGFR in glioblastoma through the following paths.
• Using the Search Box we could find several datasets in Oncomine that ranked EGFR as one of the most over-expressed genes in several analyses. The Gene Summary View was able to show us these significant analyses in a single image.
• Exploring the tools in the Datasets tab, we are able to change the thresholds for gene rank and P-value. We can also order by over-/under-expression gene rank and P-value.
• With the filters EGFR, Cancer Type: Brain and CNS Cancer, and Brain and CNS Cancer vs. Normal, we were able to look at EGFR over-expression in several analyses across independent datasets.
• The datasets were ranked according to default gene rank, fold change, and P-value thresholds. The bar graphs representing EGFR over-expression could be seen in the Visualize pane. The Visualize pane also included information regarding the class being compared (and their size), as well as important dataset information.
• By adding the Ras Signaling Pathway Biocarta Concept we were able to look at expression across multiple independent glioblastoma analyses. We wanted to test downstream targets of the Ras signaling pathway to see if they could be used as targets in glioblastoma samples.
• In meta-analysis, EGFR was the highest ranked gene among all of the RAS pathway genes.
• Although the RAS pathway is being activated, other members of the pathway are not as highly over-expressed, thus making EGFR the best target in glioblastoma samples.
• Removing all filters except for EGFR and adding the Glioblastoma vs. Normal analysis, we looked at 5 independent Glioblastoma vs. Normal Analyses.
• We performed a comparison across the 5 independent datasets and identified new genes that were over-expressed across these datasets.
• By clicking on the top genes in our comparison, we can learn more information about the new genes. These genes may be novel potential targets in glioblastomas.
• COL4A2 was the highest ranked gene, 9th, with a P-value of 2.33E-29. This gene is particularly interesting, as it has already been implicated in astrocytomas.
Oncomine 4.3 Training - Module 1: Introduction to Oncomine 33
No part of this document may be reproduced without written consent from Compendia Bioscience.
• After adding a tyrosine kinase filter, we saw that LYN is the most significant over-expressed tyrosine kinase receptor in glioblastomas, and EGFR is the second-most significant.
34 Oncomine 4.3 Training - Module 1: Introduction to Oncomine
No part of this document may be reproduced without written consent from Compendia Bioscience.
1.6 Summary
Oncomine provides access to a large collection of cancer profiling datasets and analysis tools, both of which are updated continually to provide users with the most advanced data and tools available. This combination of rich data and powerful tools makes Oncomine an important resource for understanding the underlying molecular mechanisms of cancer, and for identifying new targets and biomarkers.
With Oncomine gene expression patterns of individual or multiple genes can be explored across many different cancer types, and causal relationships between gene expression and cancer can be investigated. In addition, dataset details such as cancer type, molecular alteration, or recurrence can be used to identify subsets of genes that contribute to a particular disease state.
Oncomine provides a logical interface for investigating multiple datasets simultaneously, by linking analyses within datasets to analysis summaries across all comparisons and tissue types. Visualizations include bar charts showing the distribution of gene expression across datasets and heat maps present summary views of significant gene expression or co-expression across large gene sample sets. Visualizations are available in the context of analysis summaries.
Analyses proceed from several possible starting points, including gene or keyword search or browsing the Compendia Ontology. Combining these search tools along with multi-gene search provides a unique and powerful way to begin navigation of the Oncomine database to explore a particular gene(s), concepts or particular cancer.
The goal of Module 1: Introduction to Oncomine was to provide a summary of the data and analysis tools available in Oncomine, and to begin to show the value of this cancer research data for target discovery and validation.
We appreciate your comments and questions at [email protected].
1.6.1 Oncomine Support
1-866-369-5070, M–F, 8:30 A.M.–5:30 P.M. ET

Oncomine 4.3 Training - Module 1: Introduction to Oncomine 35
No part of this document may be reproduced without written consent from Compendia Bioscience.
Notes:
