introduction to the ev project - idaho national laboratory · influence of infrastructure...
TRANSCRIPT

Introduction to the EV Project:the Largest Deployment of Electric
Vehicles and Electric Vehicle Charging Infrastructure Ever Undertaken
John Smart, Idaho National Laboratory
Stephen Schey, ECOtality North America
INL/CON 10-19271

2
Presentation Outline
• Overview of the EV Project scope
• Product specs
• Project objectives
• Plan for reporting of results
• Project status and timing
3
The EV Project
• Purpose: Build and study mature EV charging infrastructure in 9 U.S. regions – in 16 cities and on interstate corridors
• $230 million project funded by U.S. Department of Energy (DOE) Vehicle Technologies Program as part of the American Recovery and Reinvestment Act
• 50% cost share by private sector and nonfederal government partners
• Outcome: Use lessons learned to enable efficient mass deployment of charging infrastructure and plug-in electric vehicles

4
Project Partners
Sponsor
Primary Partners
ECOtality North America Idaho National LaboratoryChevroletNissan North America

5
ECOtality North America
• DOE grant recipient and project leader
• Provider of infrastructure solutions for plug-in electric vehicles
• Partner with INL in conducting light duty vehicle testing for DOE’s Advanced Vehicle Testing Activity (AVTA)

6
Idaho National Laboratory
• Multi-disciplinary DOE lab
• Responsible for EV Project data collection, analysis, reporting
• Manages light duty vehicle testing for AVTA
Nissan, General Motors
• Integrated processes with ECOtality NA for new customer charging unit installation
• Supporting data collection

7
EV Project Strategic Partners include:

8
EV Project Locations16 cities in 9 market regions

9
Infrastructure and Vehicle Deployment
Vehicles• 5,700 Nissan LEAF
TM
vehicles included in EV Project*
• 2,600 Chevrolet Volts included in EV Project *
Electric vehicle supply equipment (EVSE) • 8,300 residential AC level 2 EVSE for participating Nissan
LEAF and Chevrolet Volt customers
• 6,350 AC Level 2 public-use EVSE
• 125 additional AC Level 2 EVSE in ORNL Solar Project
DC fast chargers• 310 DC level 2 fast charger ports in cities and on interstate
corridors
* Number of vehicles in EV Project only. Does not represent regional or national production volumes

10
Product Specs
ECOtality BlinkTM charging equipment
Chevrolet Volt
Nissan LEAFTM

11
Product Specs
ECOtality BlinkTM charging equipment
Chevrolet Volt
Nissan LEAFTM
Blink charging equipment
AC level 2 residential and commercial EVSE
• 240 VAC single phase, 6.6 kW
• Single J1772 connector per EVSE
• Networked, with data collection
• Touch screen user interface, RFID
authentication, subscription service
DC level 2 commercial fast charger
• 480 VAC 3 phase, 60 kW
• Two CHAdeMo connectors per charger
• Networked, with data collection
• Touch screen user interface, RFID
authentication, subscription service
12
Product Specs
ECOtality BlinkTM charging equipment
Chevrolet Volt
Nissan LEAFTM
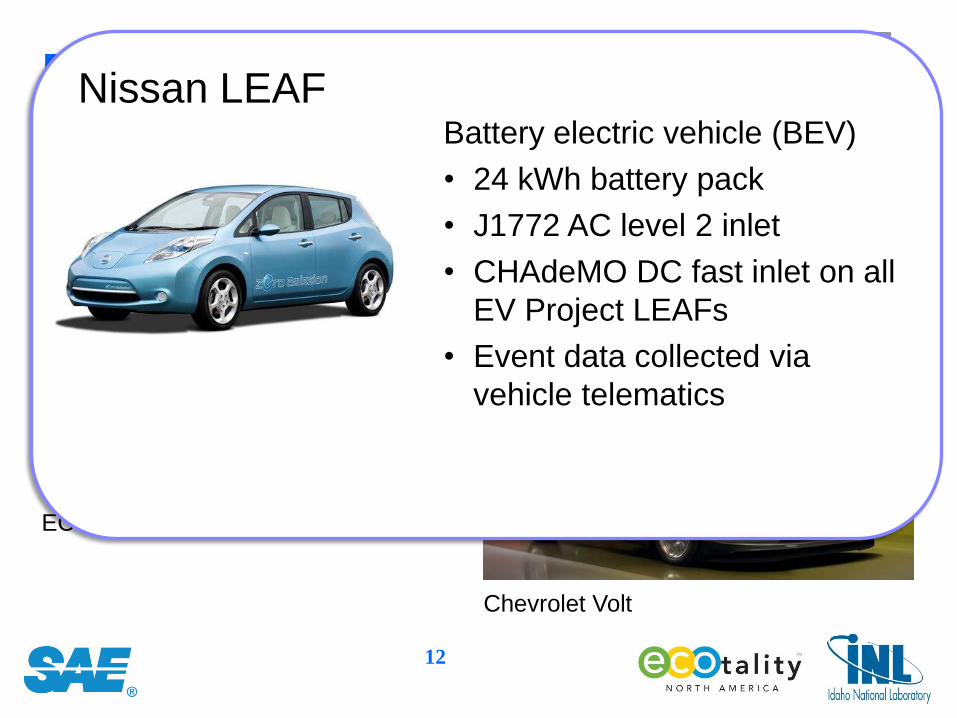
Nissan LEAFBattery electric vehicle (BEV)
• 24 kWh battery pack
• J1772 AC level 2 inlet
• CHAdeMO DC fast inlet on all
EV Project LEAFs
• Event data collected via
vehicle telematics

13
Product Specs
ECOtality BlinkTM charging equipment
Chevrolet Volt
Nissan LEAFTM
Chevrolet VoltExtended-range electric vehicle
(EREV)
• 16 kWh battery
• J1772 AC level 2 inlet
• No fast charging
• Event data collected via
vehicle telematics

14
Project Objectives
Build mature EV charging infrastructure in nine regions and study:
• Infrastructure deployment process
• Customer driving and charging behavior
• Impact on electric grid

15
Infrastructure deployment process
• Systematic selection of public charging locations for maximum benefit to vehicle owners, charger hosts, and community
Targeting where people shop, play, gather for 1 – 3 hrs
Coordinating with electric utilities, local government, and other stakeholders
Marketing to commercial hosts (final decision makers)
• Proving ground for codes, standards, and permitting
… in their various stages of maturity or development

16
Studying customer behavior
• Vehicle customer driving and charging behavior
Residential vs. public charging station utilization
AC level 2 vs. DC fast charging utilization
Influence of infrastructure availablity
• Distinctions in usage of two different vehicle types (BEV and EREV)
• Changes in behavior over time

17
Studying impact on electric grid
• Vehicle charging demand relative to system peak
• Vehicle charging demand relative to local distribution
• Influence of smart charging and incentives
User interface for charge scheduling
Electric utility time-of-use rates
15000
17500
20000
22500
25000
27500
30000
32500
35000
0:0
0
1:0
0
2:0
0
3:0
0
4:0
0
5:0
0
6:0
0
7:0
0
8:0
0
9:0
0
10:0
0
11:0
0
12:0
0
13:0
0
14:0
0
15:0
0
16:0
0
17:0
0
18:0
0
19:0
0
20:0
0
21:0
0
22:0
0
23:0
0
Ele
ctr
icit
y D
em
an
d (
MW
)

18
Reporting of results
• Individual participants access their own information on a web portal
Vehicle owners with residential or fleet EVSE
Commercial EVSE/charger hosts
• General public can see project results in quarterly fact sheets on EV Project and INL websites
• Deep-dive studies will be presented in various forums

19
Quarterly reports to public
• Aggregated reports by project region
• Overview report for at-a-glance project status
• Infrastructure-focused charging report
• Vehicle-focused charging report

20
Infrastructure-focused report
• Metrics given for each charging unit type
• Residential / AC level 2
• Private nonresidential / AC level 2
• Publicly available / AC level 2
• Publicly available / DC fast charger
• In city
• On intercity / interstate corridors
21
Infrastructure-focused report
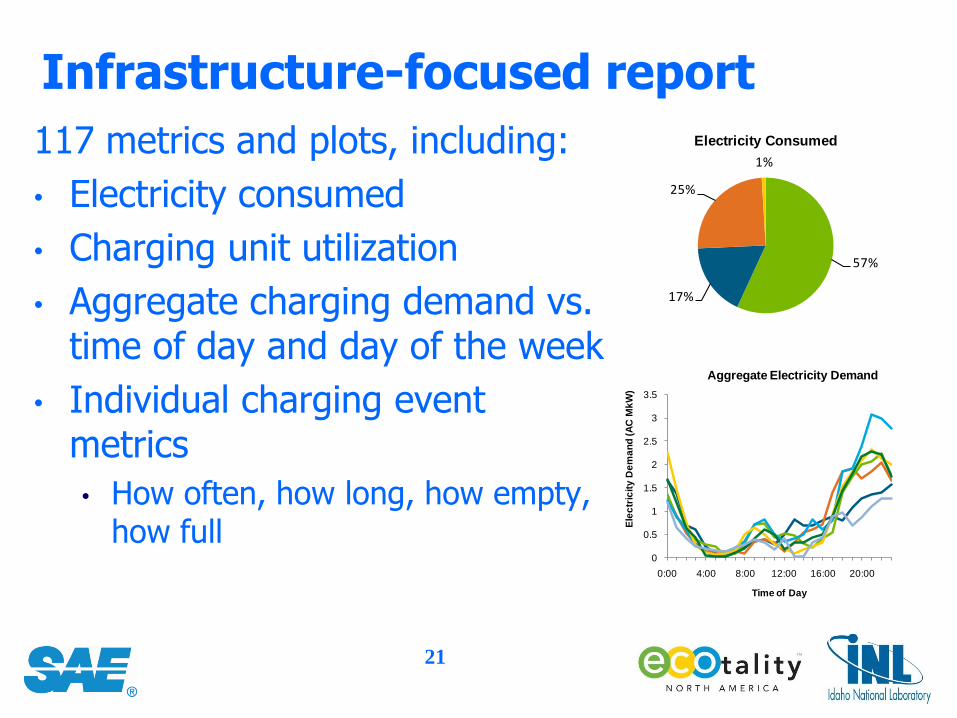
117 metrics and plots, including:
• Electricity consumed
• Charging unit utilization
• Aggregate charging demand vs. time of day and day of the week
• Individual charging event metrics
• How often, how long, how empty, how full
57%
17%
25%
1%
Electricity Consumed
ResidentialLevel 2
Private nonresidentialLevel 2
Publicly availableLevel 2
Publicly availableDC Fast
0
0.5
1
1.5
2
2.5
3
3.5
0:00 4:00 8:00 12:00 16:00 20:00
Ele
ctr
icit
y D
em
an
d (
AC
Mk
W)
Time of Day
Aggregate Electricity Demand
Sun
Mon
Tue
Wed
Thu
Fri
Sat

22
Vehicle-focused reports
Separate reports for LEAF and Volt
39 (Volt) and 47 (LEAF) metrics and plots, including:
• Distance driven, other trip statistics
• Percent of distance driven in charge depleting vs. charge sustaining mode (Volt only)
• Battery state of charge at the start and end of charge
• Percent of charging events performed at home vs. away from home (LEAF shows line items for DC fast charging)
Frequency of Charging by Charging Unit Location and Type
0%
10%
20%
30%
40%
0-1
0
10
-20
20
-30
30
-40
40
-50
50
-60
60
-70
70
-80
80
-90
90
-10
0
Charging Event Ending SOC
Battery State of Charge (SOC)at the End of Charging Events

23
Deep-dive study topics
• Change in BEV customer “used range” over time
• Geospatial Information Systems density analysis
• Charge clustering impact to local distribution
• San Diego Gas & Electric TOU study
• UC Davis human behavior studies
• Studies by other partners
Heat map

24
Confidentiality of data
• Raw data is protected by non-disclosure agreements
• Contains customer personal information
• Information is shared, data is not
• Preserving customer confidence that their data will remain secure is paramount to future of connected vehicles

25
Status
• Systematic planning process for each EV Project region is complete
• Regional stakeholder teams have developed unique deployment plans for each region
• Infrastructure deployment guidelines and long range plans were issued for each region

26
Infrastructure deployment guidelines
• Outline equipment installation process for various EVSE/charger types and locations
• Stress the need for coordination with
• Local governments, permitting authorities
• Auto manufacturers
• Electric utilities and local electrical contractors
• Other local groups such as home owner assoc.
• Summarize codes and standards applicable to each project region

27
Give practical guidelines and recommendations for:
• Site layout
• Protection of equipment
• ADA accessibility
• Site flooding potential
• Ownership, liability
Focus is on customer safety,
security, and convenience.
www.theevproject.com/documents
Infrastructure deployment guidelines
• Load management strategy
• Trouble reporting
• Lighting
• Signage
• etc.

28
Status
• Blink AC level 2 wall-mounted EVSE is UL listed
• ECOtality NA Stakeholder Services executing regional deployment plans, also signing national accounts

29
Timing
• Residential EVSE installation underway
• Public EVSE installation starting mid Feb 2011
• First reports issued after Q1 2011
• Launch curve through Sep 2011
• Just-in-time infrastructure installation – vacant charging stations do not promote EV adoption
• Data collection continues through Dec 2012
30
There’s no substitute for a test drive!

31
For more information
• EV Project: www.theevproject.com• ECOtality North America: www.ecotalityna.com• Blink: www.blinknetwork.com• INL / Advanced Vehicle Testing Activity:
http://avt.inl.gov
This work is supported by the U.S. Department of Energy’s Vehicle Technologies Program
Acknowledgement