introduction - welcome to...
TRANSCRIPT
AGE-ADJUSTED MORTALITY RATES OF TOBACCO-RELATED MALIGNANT NEOPLASMS IN ALLEGHENY COUNTY, STATE OF PENNSYLVANIA AND THE
UNITED STATES, 2012-2013
by
Chun Zou
BS, Beijing Institute of Technology, China, 2014
Submitted to the Graduate Faculty of
Department of Epidemiology
Graduate School of Public Health in partial fulfillment
of the requirements for the degree of
Master of Public Health
University of Pittsburgh
2016

ii
UNIVERSITY OF PITTSBURGH
GRADUATE SCHOOL OF PUBLIC HEALTH
This essay is submitted
by
Chun Zou
on
April 24,2016
and approved by
Essay Advisor:Nancy W. Glynn, PhD ______________________________________Assistant Professor of EpidemiologyDepartment of EpidemiologyGraduate School of Public HealthUniversity of Pittsburgh
Essay Readers:
Evelyn O. Talbott, Dr P.H, MPH ______________________________________Professor of EpidemiologyDepartment of EpidemiologyGraduate School of Public HealthUniversity of Pittsburgh
Jeremy J. Martinson, DPhil ______________________________________Assistant Professor of Infectious Diseases and MicrobiologyDepartment of Infectious Diseases and MicrobiologyGraduate School of Public Health University of Pittsburgh
John M. Kokenda, BA ______________________________________Statistical AnalystBureau of Assessment, Statistics & EpidemiologyAllegheny County Health Department

iii
Copyright © by Chun Zou
2016
ABSTRACT
Tobacco use and tobacco-related malignant neoplasms are a large problem and cause of death in
the United States. Tobacco-related malignant neoplasms status varies between sex, race, age
group and type of cancer. This essay aims to conduct an analysis of resident deaths due to
tobacco-related malignant neoplasms in Allegheny County for the year 2012, and to compare
them with those for the United States and Pennsylvania. This essay will also include spatial
analysis for 2012 and 2013 to show the geographic distribution of eight tobacco-related
malignant neoplasms in Allegheny County in 2012 and 2013. Age-adjusted mortality rates of
eight malignant neoplasms for Allegheny County residents age 25 or older in 2012 were
calculated, adjusted for sex and race. These rates were compared with those of the State of
Pennsylvania and the United States. Age-adjusted mortality rates of eight malignant neoplasms
of all sexes and races in Allegheny County in 2012 and 2013 were calculated, by municipality, to
show geographic patterns of tobacco-related malignant neoplasms. The age-adjusted mortality
rates of tobacco-related malignant neoplasms were similar among Allegheny County, State of
Pennsylvania and the United States. The age-adjusted mortality rate of malignant neoplasms of
trachea, bronchus and lung is the highest in each race and sex groups. In general, males have
higher age-adjusted mortality rates of tobacco-related cancers than females, and age-adjusted
iv
Nancy W. Glynn, PhD
AGE-ADJUSTED MORTALITY RATES OF TOBACCO-RELATED MALIGNANT
NEOPLASMS IN ALLEGHENY COUNTY, STATE OF PENNSYLVANIA AND THE
UNITED STATES, 2012-2013
Chun Zou, MPH
University of Pittsburgh, 2016

mortality rates of tobacco-related cancers in blacks are higher than those of whites. Based on
spatial analysis, higher mortality rates seem to be concentrated in Pitcairn Borough, Millvale
Borough, Etna Borough, Tarentum Borough, which present visible geographic patterns within
Allegheny County in 2012 and 2013. These results indicate a need to address and develop
tobacco cessation programs to improve policies and public health awareness of tobacco cessation
and tobacco-related malignant neoplasms prevention, and assist with reducing tobacco use and
eliminating tobacco-related disease disparities in the population.
v

TABLE OF CONTENTS
PREFACE.................................................................................................................................................. X
1.0 INTRODUCTION......................................................................................................................... 1
1.1 TOBACCO USE IN THE UNITED STATES........................................................................................1
1.2 ASSOCIATION BETWEEN TOBACCO USE AND MALIGNANT NEOPLASMS....................3
1.2.1 TOBACCO-RELATED MALIGNANT NEOPLASMS OF THE LIP, ORAL CAVITY AND
PHARYNX (C00-C14)........................................................................................................................3
1.2.2 TOBACCO-RELATED MALIGNANT NEOPLASMS OF THE ESOPHAGUS (C15)........4
1.2.3 TOBACCO-RELATED MALIGNANT NEOPLASMS OF STOMACH (C16).......................5
1.2.4 TOBACCO-RELATED MALIGNANT NEOPLASMS OF THE PANCREAS (C25)...........5
1.2.5 TOBACCO-RELATED MALIGNANT NEOPLASMS OF THE LARYNX (C32)................6
1.2.6 TOBACCO-RELATED MALIGNANT NEOPLASMS OF THE TRACHEA, BRONCHUS
AND LUNG (C33-C34)......................................................................................................................7
1.2.7 TOBACCO-RELATED MALIGNANT NEOPLASMS OF THE KIDNEY AND RENAL
PELVIS (C64-C65)..............................................................................................................................7
1.2.8 TOBACCO-RELATED MALIGNANT NEOPLASMS OF THE BLADDER (C67).............8
1.3 SEX AND RACE VARIATIONS OF TOBACCO-RELATED MALIGNANT NEOPLASMS....9
1.4 TOBACCO USE AND MALIGNANT NEOPLASMS IN ALLEGHENY COUNTY, PA..........10
1.5 GEOGRAPHIC DISTRIBUTION OF MALIGNANT NEOPLASMS IN ALLEGHENY
COUNTY, PA.............................................................................................................................................11
vi

1.6 PUBLIC HEALTH SIGNIFICANCE....................................................................................................12
1.7 OBJECTIVE................................................................................................................................................13
2.0 METHODS................................................................................................................................. 14
2.1 STUDY POPULATION...........................................................................................................................14
2.2 ALLEGHENY COUNTY RESIDENT DEATH RECORD...............................................................15
2.3 DISCLAIMER............................................................................................................................................15
2.4 CDC WONDER SYSTEM: CANCER STATISTICS.........................................................................16
2.5 AGE-ADJUSTMENT OF MORTALITY RATES..............................................................................16
2.6 DATA ANALYSES...................................................................................................................................17
3.0 RESULTS.................................................................................................................................... 19
3.1 AGE-ADJUSTED MORTALITY RATES OF TOBACCO-RELATED MALIGNANT
NEOPLASMS IN ALLEGHENY COUNTY, THE STATE OF PENNSYLVANIA AND THE
UNITED STATES.....................................................................................................................................19
3.2 AGE-SPECIFIC MORTALITY RATES OF TOBACCO-RELATED MALIGNANT
NEOPLASMS BY AGE GROUPS IN ALLEGHENY COUNTY, PENNSYLVANIA, AND THE
UNITED STATES.....................................................................................................................................26
3.3 SPATIAL ANALYSIS OF AGE-ADJUSTED MORTALITY RATES BY MUNICIPALITY IN
ALLEGHENY COUNTY..........................................................................................................................29
4.0 DISCUSSION.............................................................................................................................. 33
APPENDIX A: SUPPLEMENTARY TABLES....................................................................................... 39
APPENDIX B: SUPPLEMENTARY FIGURES.....................................................................................42
BIBLIOGRAPHY..................................................................................................................................... 45
vii
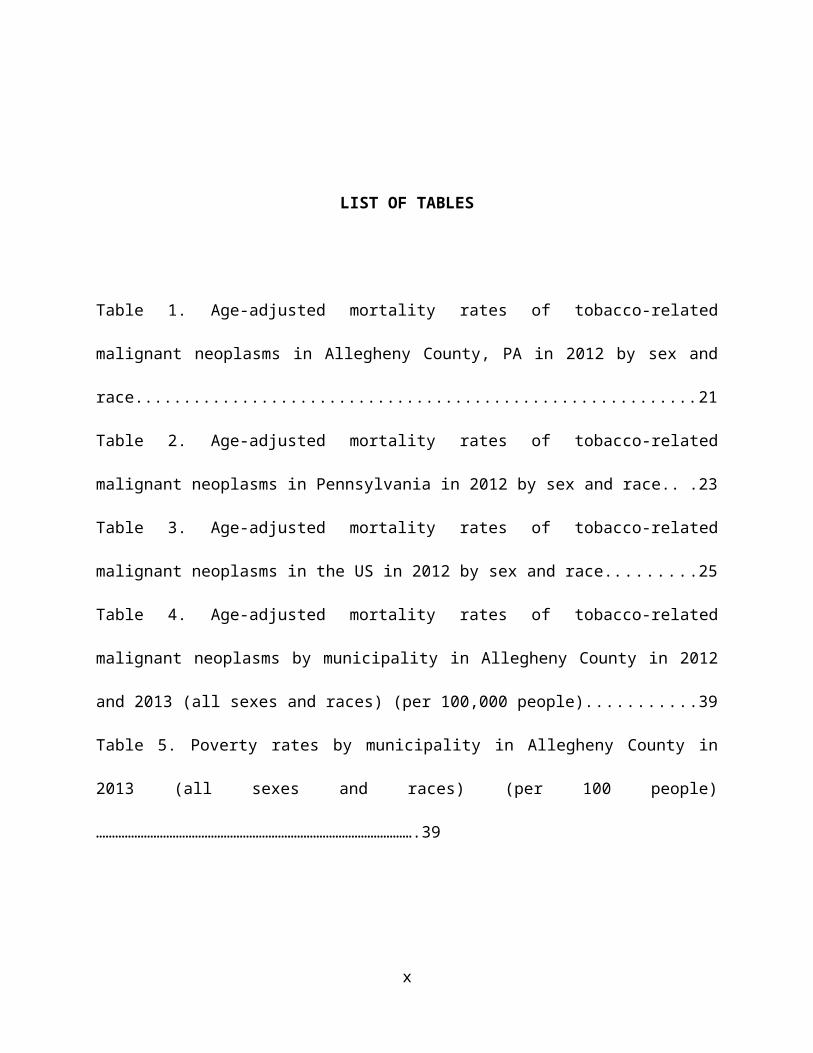
LIST OF TABLES
Table 1. Age-adjusted mortality rates of tobacco-related malignant neoplasms in Allegheny
County, PA in 2012 by sex and race..............................................................................................21
Table 2. Age-adjusted mortality rates of tobacco-related malignant neoplasms in Pennsylvania in
2012 by sex and race......................................................................................................................23
Table 3. Age-adjusted mortality rates of tobacco-related malignant neoplasms in the US in 2012
by sex and race...............................................................................................................................25
Table 4. Age-adjusted mortality rates of tobacco-related malignant neoplasms by municipality in
Allegheny County in 2012 and 2013 (all sexes and races) (per 100,000 people).........................39
Table 5. Poverty rates by municipality in Allegheny County in 2013 (all sexes and races) (per
100 people)……………………………………………………………………………………….39
viii
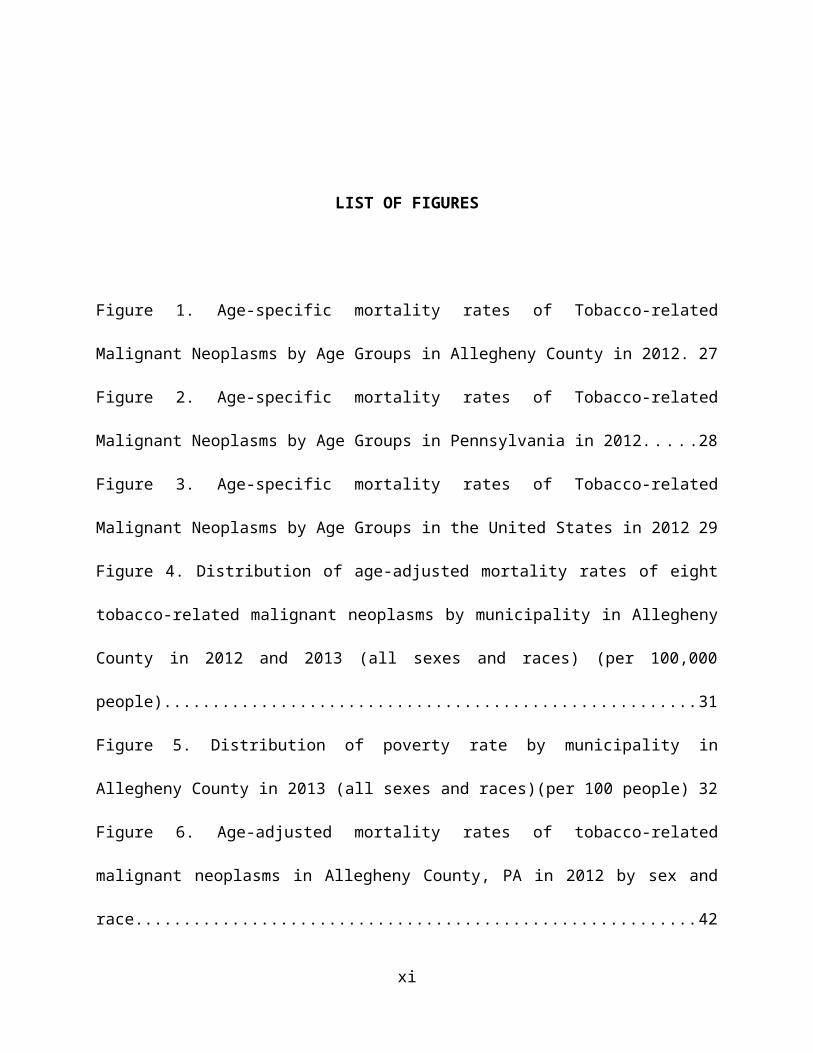
LIST OF FIGURES
Figure 1. Age-specific mortality rates of Tobacco-related Malignant Neoplasms by Age Groups
in Allegheny County in 2012.........................................................................................................27
Figure 2. Age-specific mortality rates of Tobacco-related Malignant Neoplasms by Age Groups
in Pennsylvania in 2012.................................................................................................................28
Figure 3. Age-specific mortality rates of Tobacco-related Malignant Neoplasms by Age Groups
in the United States in 2012...........................................................................................................29
Figure 4. Distribution of age-adjusted mortality rates of eight tobacco-related malignant
neoplasms by municipality in Allegheny County in 2012 and 2013 (all sexes and races) (per
100,000 people).............................................................................................................................31
Figure 5. Distribution of poverty rate by municipality in Allegheny County in 2013 (all sexes and
races)(per 100 people)...................................................................................................................32
Figure 6. Age-adjusted mortality rates of tobacco-related malignant neoplasms in Allegheny
County, PA in 2012 by sex and race..............................................................................................42
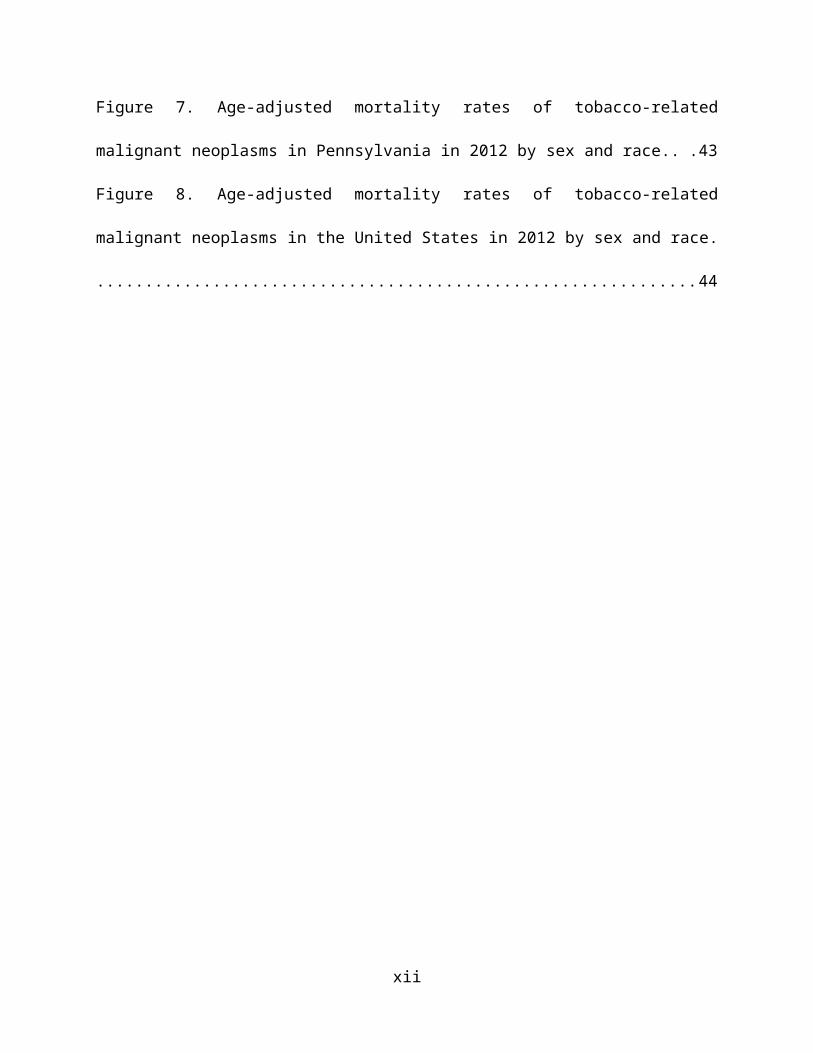
Figure 7. Age-adjusted mortality rates of tobacco-related malignant neoplasms in Pennsylvania
in 2012 by sex and race.................................................................................................................43
Figure 8. Age-adjusted mortality rates of tobacco-related malignant neoplasms in the United
States in 2012 by sex and race.......................................................................................................44
ix
PREFACE
I’d like to express my sincere appreciation to Professor Nancy W. Glynn, my academic
advisor, who has always been encouraging and illuminating me through my whole study.
Without her insights and guidance, it would be impossible to finish this essay.
My gratitude would also go to Professor Evelyn O. Talbott and Professor Jeremy J.
Martinson not only for sitting on my essay committee but most importantly for sharing their
valuable insights and inspiring comments on this essay.
I would also like to thank my supervisor, John Kokenda, Statistical Analyst, Allegheny
County Health Department, for his guidance, comments, suggestions and other assistance during
the research.
x
1.0 INTRODUCTION
1.1 TOBACCO USE IN THE UNITED STATES
Tobacco use has been a large problem and cause of disease and death in the United
States. Since 1965, the prevalence of tobacco use in U.S. has declined by almost 50%, which
shows positive trends in prevention and cessation processes[1]. Based on the data from the CDC
and NHIS, in 1965, the prevalence of tobacco use among adults in the U.S. was 42.4%, and
declined to 23.3% in 2000, which is approximately 47 million adults[2].In 2014, it was estimated
that 16.8% (40 million) of U.S. adults currently use tobacco products, and 76.8% of them were
heavy smokers[3]. The prevalence of prevention and cessation has also increased. In 1965, the
prevalence of cessation was 24.3%, increasing to 48.8% in 2000. The highest prevalence of
cessation was 49.6% in 1993. In 1974, the percentage of heavy smokers was 25.3 and decreased
to 15.3% in 2000, with positive trends in frequency control of tobacco use [4]. As the prevalence
of tobacco use declined, U.S. cigarette consumption also decreased by over 100 billion cigarettes
during the past 20 years, with the comparison of 640 billion cigarettes were smoked in 1981 and
360 billion in 2007[5].
Adults (age 18+) are the largest tobacco user group, which accounted for 63.2% of all
smokers in U.S.[3]. In 2014, almost 17 of every 100 U.S. adults used tobacco products. Although
obvious declines have been shown in tobacco use among U.S. adults over the past decade, the
1
rate of decline has slowed down in recent years[6]. Based on the data from the 2012-2013
National Adult Tobacco Survey (NATS), the use rate of emerging products, such as e-cigarettes,
has increased rapidly. Among adult smokers in 2014, males were more likely to smoke than
females, with a prevalence rate of 18.8% of males compared to 14.8% of females[7]. Current
tobacco use was higher among adults aged 25-44 years with a prevalence of 20.0% and adults
aged 45-64 with a prevalence of 18.0%, and lowest among those aged 65+, with a prevalence of
8.5%. Of all racial and ethnic groups, tobacco use was highest among non-Hispanic American
Indians/Alaska Natives (29.2%), and lowest among Asians (9.5%). Adults with a GED
certificates and lower educational attainment had the highest prevalence of tobacco use (65.9%),
and adults with a graduate degree had the lowest prevalence of tobacco use (5.4%)[3].
Tobacco use poses a serious health threat to youths in the U.S., which can cause
significant health problems, including asthma and respiratory diseases.[8] Nearly 9 out of 10
cigarette smokers report that they started smoking by age 18, and 10% of adolescents are current
smokers by the time they leave high school[9]. According to data from the U.S. Department of
Health & Human Services, over 450,000 adolescents aged 12-13 years and approximately 4.4
million adolescents aged 14-17 years have smoked. Racial/ethnic and regional differences are
significant among young smokers. White teens are more likely to smoke than black or Hispanic
teens among high school students, and prevalence of tobacco use in youths in nonmetropolitan,
Southern and Midwestern areas is higher than other regions in the U.S.[10].
The United States has been aware of the importance of tobacco cessation and has made
historic progress in combatting the prevalence of tobacco use and the epidemic of tobacco-
caused diseases, towards the Health People 2010 goal “To reduce illness, disability, and death
related to tobacco use and exposure to secondhand smoke”.
2
1.2 ASSOCIATION BETWEEN TOBACCO USE AND MALIGNANT
NEOPLASMS
Tobacco use is responsible for nearly 20% of all deaths in the U.S., and accounts for at
least 30% of all malignant neoplasm-specific deaths and over $190 billion in economic losses
annually.[11] Most tobacco-caused deaths are due to lung cancer, obstructive pulmonary disease,
coronary heart disease and other airway obstruction.[12] According to the 2014 Surgeon
General’s Report, tobacco smoking is the main cause of human malignant neoplasms in the
world[13]. It is not only related to malignant neoplasm-specific mortality but also all-cause
mortality in people with malignant neoplasms. The International Agency for Research on Cancer
(IARC) indicates that there is sufficient evidence to consider that tobacco smoking can cause up
to one third of all cancers, including lung, larynx, paranasal sinuses, oral cavity and pharynx,
stomach, esophagus, liver, ureter, pancreas, kidney and bone marrow.[14]
The CDC Tobacco-Related Mortality Report suggested that, from 2005 to 2009, annual
cigarette tobacco-related mortality in the U.S. of all cancers was 163,700, including 100,300
male and 63,400 females. The cancer with the highest annual tobacco-related mortality was lung
cancer, 127,700, accounting for 78% of all cancer-specific deaths[15].
1.2.1 TOBACCO-RELATED MALIGNANT NEOPLASMS OF THE LIP, ORAL
CAVITY AND PHARYNX (C00-C14)
Oral cancer is an uncontrolled growth of abnormal cells that starts in the mouth cavity,
which leads to the development of a tumor. It is estimated that, close to 48,000 people will be
diagnosed with lip, oral cavity and pharynx cancer every year, which causes over 9,575 deaths
3

and kills about 1 person per hour each day.[16] The International Agency for Research on
Cancer (IARC) shows that tobacco use is considered to be a major cause of lip, oral cavity and
pharynx cancers, with an estimate of 65% of lip, oral cavity and pharynx cancers being linked to
tobacco use. A meta-analysis shows that the risk of oral cavity cancer is 3 times higher in
tobacco users than that of non-tobacco users, and pharynx cancer risk is about 7 times higher in
tobacco users compared to non-tobacco users.[17] Chemicals in tobacco smoke can cause
genetic changes in mouth cells that can initiate or promote lip, oral cavity and pharynx cancers.
Exposing the mouth to the carcinogenic chemicals in tobacco will increase the risk of lip, oral
cavity and pharynx cancers, either through direct contact such as chewing tobacco products or
inhalation. Malignant neoplasms of lip, oral cavity and pharynx are defined as ICD-10 codes
C00-C14.
1.2.2 TOBACCO-RELATED MALIGNANT NEOPLASMS OF THE ESOPHAGUS
(C15)
Esophageal cancer is a disease where malignant cells form in the lining of esophagus
tissues. Based on the data from the American Cancer Society, about 16,910 new esophageal
cancer cases (13,460 in men and 3,450 in women) will be diagnosed in the United States in 2016,
which makes up approximately 1% of all cancers diagnosed in the United States. About 15,690
deaths were due to esophageal cancer.[18] In the United States, tobacco use is classified as one
of the major factors for esophageal cancer, particularly squamous cell carcinoma. It is estimated
that about 66% of esophageal cancer cases are linked to tobacco use, including several tobacco
products such as cigarettes, pipes, cigars and chewing tobacco.[19]The risk of esophageal cancer
is about 2 times higher in tobacco users than non-tobacco users, and the risk increases the more a
4
person uses tobacco products and the longer a person smokes.[20] Malignant neoplasms of the
esophagus is defined as ICD-10 code C15.
1.2.3 TOBACCO-RELATED MALIGNANT NEOPLASMS OF STOMACH (C16)
Stomach cancer, also known as gastric cancer, begins when malignant neoplasms form in
the inner lining of stomach, which grows slowly and usually affects older people. Based on the
statistics from the American Cancer Society’s estimation, about 26,370 stomach cancer cases
will be diagnosed in the United States in 2016, which involves 16,480 men and 9,890 women,
and about 10,730 deaths will occur.[21] Tobacco use is considered to be one of the major causes
of stomach cancer. According to a large cohort study of United States veterans, a statistically
significant 40% increased risk of stomach cancer exists in tobacco users compared to non-
tobacco users, and an 82% increased risk among heavier tobacco users.[22] Tobacco use could
promote stomach cancer development in several ways, such as promoting the reflux of the
duodenal contents back into stomach and increasing the acidity of the duodenum. Tobacco use
will also reduce the production of natural substances and reduce blood flow, which leads to
damage of stomach tissues.[23] Malignant neoplasms of the stomach are defined as ICD-10 code
C16.
1.2.4 TOBACCO-RELATED MALIGNANT NEOPLASMS OF THE PANCREAS (C25)
As the fifth leading cause of cancer related mortality in the United States, cancer of the
pancreas caused about 40,560 deaths (20,710 men and 19,850 women) in the United States in
2015. Tobacco use is one of the most important risk factors for cancer of the pancreas, with the
5
risk of getting cancer of the pancreas twice as high among tobacco users as non-tobacco users.
[24] Based on a prospective study of cigarette smoking and the risk of pancreatic cancer, the data
shows that the relative risk of pancreatic cancer for tobacco users was 2.5 times greater than non-
tobacco users (95% confidence interval 1.7-3.6), and as the years of tobacco use increase, there
is a significant and positive trend of pancreatic cancer risk.[25] According to a study in 2011, at
least 69 out of 250 known harmful chemicals in tobacco smoke can cause pancreatic cancer, by
damaging the DNA or changing genes that lead to cells multiplying out of control.[26]
Malignant neoplasms of the pancreas is defined as ICD-10 code C25.
1.2.5 TOBACCO-RELATED MALIGNANT NEOPLASMS OF THE LARYNX (C32)
Laryngeal cancer is not well known. It is considered a rare disease. In 2012, according to
the statistics of the American Cancer Society, about 12,000 laryngeal cancer cases were
diagnosed in the United States with about 3,600 deaths. Most laryngeal cancer develops in
people over the age of 50, and men are 10 times more likely to get laryngeal cancer compared to
women.[27] Laryngeal cancer is considered a preventable disease, but for those survivors, the
consequences still can be severe with influences on voice, breathing and swallowing.[28] Based
on a report from the American Academy of Otolaryngology, laryngeal cancer development
involves several factors, and chief among them is tobacco use. Over 90% of laryngeal cancers
are squamous cell carcinomas, and over 95% of squamous cell carcinoma patients are tobacco
users. People with more than 40 years of smoking history and people who smoke over 20
cigarettes a day have about 40 times higher risk of getting laryngeal cancers compared to non-
tobacco users. One research study shows that about 80% of laryngeal cancers could have been
6
prevented if people lived a healthier lifestyle. Malignant neoplasms of the larynx are defined as
ICD-10 code C32.[29]
1.2.6 TOBACCO-RELATED MALIGNANT NEOPLASMS OF THE TRACHEA,
BRONCHUS AND LUNG (C33-C34)
Lung cancer is the leading cancer killer for both men and women in the United States. In
2015, it’s estimated that about 158,000 deaths were due to lung cancer, which account for nearly
27% of all cancer deaths in the United States. Lung cancer is also one of the most common
cancers worldwide. In 2012, 1.8 million cases of lung cancer were diagnosed and 1.6 million
deaths were due to lung cancer.[30] The incidence of lung cancer is significantly correlated with
tobacco use, with close to 90% of lung cancer cases resulting from tobacco use. Compared to
non-tobacco users, male tobacco users have a 23 times higher risk of getting lung cancer, and
females are 13 times more likely to develop lung cancer.[31] Tobacco use causes the majority of
lung cancers not only in tobacco users, but also in people exposed to secondhand smoke.
According to the Surgeon General’s Report, non-tobacco users who are exposed to secondhand
smoke have an increased risk of developing lung cancer by 20 to 30 percent.[32] Malignant
neoplasms of trachea, bronchus and lung are defined as ICD-10 codes C33-C34.
1.2.7 TOBACCO-RELATED MALIGNANT NEOPLASMS OF THE KIDNEY AND
RENAL PELVIS (C64-C65)
After about two decades of increasing rates, kidney and renal pelvis cancers have shown
a downward trend in recent years in the United States. According to the American Cancer
7
Society’s estimates for kidney and renal pelvis cancers in the United States in 2016:
approximately over 62,000 new cases of kidney and renal pelvis cancer will be diagnosed, and
over 14,000 people will die from them.[33] Kidney cancer includes malignant tumors in renal
parenchyma and renal pelvis. Renal parenchyma cancer in adenocarcinoma cell type is the major
kidney cancer. Among all cell types, renal pelvis cancers are the most transitional. The
International Agency for Research and Cancer and the U.S. Surgeon General states that tobacco
use is a causal risk factor for kidney and renal pelvis cancers. Tobacco use is considered to
increase kidney and renal pelvis cancers through chronic tissue hypoxia, due to exposure to
carbon monoxide and chronic obstructive pulmonary disease.[34] The risk of developing kidney
and renal pelvis cancers increases about 50% in men and 20% in women compared to non-
tobacco users, with a significant dose-response pattern of the risk.[34] Malignant neoplasms of
the kidney and renal pelvis are defined as ICD-10 codes C64-C65.
1.2.8 TOBACCO-RELATED MALIGNANT NEOPLASMS OF THE BLADDER (C67)
Bladder cancer develops when cells start to grow uncontrollably in the urinary bladder.
Based on the key statistics for bladder cancer from the American Cancer Society, over 76,000
new cases of bladder cancer will be diagnosed in the United States, and over 16,000 deaths will
occur due to bladder cancer.[35] Among several risk factors of bladder cancer, the National
Institutes for Health states that tobacco use is the single most important known risk factor for
bladder cancer. Based on a new study by Dr. Neal Freedman and colleagues at NIH’s National
Cancer Institute, tobacco use is responsible for nearly 50% of men and women’s bladder cancer,
and tobacco users are 4 times as likely to develop bladder cancer than those who are non-tobacco
8
users.[36] People with the highest risk are heavy tobacco users or who have used tobacco
products for a long time. Malignant neoplasms of the bladder are defined as ICD-10 code C67.
1.3 SEX AND RACE VARIATIONS OF TOBACCO-RELATED MALIGNANT
NEOPLASMS
Malignant neoplasms status varies largely by sex and race. Based on data from the
Centers for Disease Control and Prevention, in 2011, incidence rates and mortality rates of
cancers among men were higher than those of women. For males, incidence rates of all cancers
combined among black men was 538.2 per 100,000, which was the highest of all races, followed
by white, Hispanic, Asian/Pacific Islander, and American Indian/Alaska Native. Death rates for
all cancers among black men was 247.8 per 100,000, which was higher than all the other races,
followed by white, Asian/Pacific Islander, and American Indian/Alaska Native. For females, the
incidence rate for all cancers combined among white women was 416.7 per 100,000, which was
the highest of all races, followed by black, Hispanic, Asian/Pacific Islander, and American
Indian/Alaska Native. Death rates of all cancers combined was highest among black women
(161.9 per 100,000 people), and followed by white, American Indian/Alaska Native, Hispanic
and Asian/Pacific Islander.[37]
9
1.4 TOBACCO USE AND MALIGNANT NEOPLASMS IN ALLEGHENY
COUNTY, PA
For tobacco smoking in Allegheny County, in the US state of Pennsylvania, the
Allegheny Community Indicators (ACI) report shows that 23% of adults in Allegheny County
currently smoke. That is almost 230,000 people, which is 5% higher than the mean value of all
counties in the state and leads to over $635 million health care costs every year.[7] In the
Healthier Allegheny Plan, Allegheny County Health Department (ACHD) committed to
curtailing the adult smoking rate by 10% by 2020[8]. To achieve these goals, some of the state-
level initiatives include Free Quitline, restriction of minors’ access to tobacco products, efforts to
counter tobacco-marketing, and improvement of clinical-practice guidelines for tobacco
addiction assessment and treatment.[32] Significant progress has been made, but there is still
much work to be done.
For malignant neoplasms in Allegheny County, 2012, the Allegheny County Mortality
Report shows that malignant neoplasms were responsible for 3,095 deaths of residents of
Allegheny County, and accounted for 23% of all deaths for county residents, which were the
second leading cause of death. After age-adjustment, the malignant neoplasm mortality rate was
184.2 per 100,000 standardized population, which is higher than that of heart disease.[7]
10

1.5 GEOGRAPHIC DISTRIBUTION OF MALIGNANT NEOPLASMS IN
ALLEGHENY COUNTY, PA
Malignant neoplasms rank as the second leading cause of death in Allegheny County,
which was responsible for over 3,000 deaths and accounted for over 20% of all deaths in 2012,
according to the 2012 Allegheny County Mortality Report. Tobacco-related cancers introduced
above accounted for over 50% of all cancer deaths in Allegheny County in 2012, with trachea,
bronchus and lung cancer accounting for 28%, and pancreas cancer accounting for 7%. Tobacco-
related cancer deaths vary by age group, sex, race, and geographic area.[38]
Allegheny County consists of 130 municipalities and is bordered by Pine Township,
Richland Township and other 4 municipalities to the north, Forward Township to the south,
Findlay Township to the west and Plum borough to the east. Since there are geographic
differences among all municipalities in Allegheny County, demographic variability across
Allegheny County will be one of several factors when assessing cancer status and risks, as well
as cancer detection, prevention and control.[39]
Based on the number of deaths due to cancers in each municipality in 2012 and 2013, it is
clear that the major cancer prevention effort and health care may be concentrated and provided in
the city of Pittsburgh. However, since the population of each municipality in Allegheny County
varies from each other, and age distribution of each municipality population differs, to better
control for demographic differences among all municipality populations and show tobacco-
related cancers distribution in 2012 and 2013, this essay will focus on the age-adjusted rates of
each municipality in Allegheny County.
11
1.6 PUBLIC HEALTH SIGNIFICANCE
Malignant neoplasms pose a huge threat to the United States, Pennsylvania and
Allegheny County, and according to 2014 Surgeon General’s Report, tobacco smoking is a main
cause of human malignant neoplasms in the world[7]. Among all the cancers, lung cancer is the
leading cause of cancer death in the United States for both males and females. Based on the 2014
US Surgeon General Report, men who are tobacco users have a 25 times higher risk of
developing lung cancer compared to those who never smoked, and women smokers are 25 times
more likely to get lung cancer, compared to those who never used tobacco products. [40] Besides
lung cancer, tobacco use may also increase the risk for getting other cancers, such as lip, oral
cavity and pharyngeal cancers, esophageal cancer, stomach cancer, pancreatic cancer, laryngeal
cancer, kidney and renal pelvis cancers, bladder cancer, etc. The financial costs of cancer are
extremely high for not only the people with tobacco-related cancers but also for society as a
whole. According to the Agency for Healthcare research and Quality, it is estimated that in 2011
in the United States, the direct medical costs for all cancers were over $88 billion[41], and a
large number of all cancers are tobacco-related cancers. With the huge amount of life lost and
financial cost due to tobacco-related cancers, it is crucial that public health leaders and policy
makers promote tobacco cessation programs to raise public awareness and to fight for
eliminating suffering and potential deaths due to tobacco-related cancers.
12

1.7 OBJECTIVE
The objective of this essay is to conduct an analysis and assessment of resident deaths
due to tobacco-related malignant neoplasms in Allegheny County, Pennsylvania in 2012 and
2013, using 2012 and 2013 Allegheny County Resident Death Records. Likewise, this essay will
compare the age-adjusted mortality rates of tobacco-related malignant neoplasms with those of
the Pennsylvania and the United States. This essay will also conduct spatial analysis of the
geographic distribution of tobacco-related malignant neoplasms decedents in Allegheny County
in 2012 and 2013.
The results of this analysis and interpretation will help to improve public awareness of
tobacco cessation and health practice and health policy influence regarding tobacco-related
malignant neoplasms elimination in Allegheny County, in Pennsylvania and in the United States,
and address tobacco-related malignant neoplasm disparities in sex and race. The results of this
spatial analysis will also help to explore the possible existence of geographical patterns of
tobacco-related malignant neoplasms in Allegheny County and assist in exposing health
disparities and deciding where to focus tobacco-related malignant neoplasm control
interventions.
13
2.0 METHODS
2.1 STUDY POPULATION
The data I used in this research are from 2012 and 2013 Allegheny County Resident
Death Records, which were provided by the Allegheny County Health Department, Bureau of
Assessment, Statistics & Epidemiology. The study population are decedents aged 25 years and
older who were residents of Allegheny County and died in 2012 or 2013. The subset of the
population that I used for this research are all individuals who died due to: Malignant neoplasms
of the lip, oral cavity and pharynx (C00-C14), malignant neoplasms of the esophagus (C15),
malignant neoplasms of the stomach (C16), malignant neoplasms of the pancreas (C25),
malignant neoplasms of the larynx (C32), malignant neoplasms of the trachea, bronchus and lung
(C33-C34), malignant neoplasms of the kidney and renal pelvis (C64-C65), and malignant
neoplasms of the bladder (C67), which are classified by the International Statistical
Classification of Diseases and Related Health Problems, 10th edition.
Based on vital statistics from Enterprise Data Dissemination Informatics Exchange
System of the Pennsylvania Health Department, for Allegheny County in 2012, the
municipalities of Ben Avon Heights Borough, Chalfant Borough, Edgeworth Borough, Haysville
Borough, Rosslyn Farms Borough, South Versailles Township, Trafford Borough and West
Elizabeth Borough had no deaths due to cancers, while the city of Pittsburgh had the highest
14
deaths due to cancers, that was 664 people. For Allegheny County in 2013, the municipalities of
Glenfield Borough, Haysville Borough, Kilbuck Township, Pennsbury Village Borough, Rosslyn
Farms Borough, South Versailles Township and Trafford Borough had no deaths due to cancers,
while the city of Pittsburgh had the highest number of deaths due to cancers, 695 people.[42]
2.2 ALLEGHENY COUNTY RESIDENT DEATH RECORD
Allegheny County Resident Death Records are collected by medical professionals and
completed at the time of death. They are then sent to the Pennsylvania Health Department in
Harrisburg, PA, to be filed. The Pennsylvania Department of Health then sends an annual
electronic file to the Allegheny County Health Department, Pittsburgh, PA.
The Bureau of Assessment, Statistics, & Epidemiology then reviews each death record to
verify residency and census tract. Once all records are verified for accuracy, municipality and
City of Pittsburgh neighborhood are added to each record.
2.3 DISCLAIMER
These data are provided by the Allegheny County Health Department, Bureau of
Assessment, Statistics & Epidemiology through a cooperative agreement with the Pennsylvania
Department of Health which requires the following disclaimer: "These data were supplied by the
State Health Data Center, Pennsylvania Department of Health, Harrisburg, Pennsylvania. The
15
Pennsylvania Department of Health specifically disclaims responsibility for any analyses,
interpretations or conclusions."
2.4 CDC WONDER SYSTEM: CANCER STATISTICS
CDC WONDER is an online public health information system of the Centers for Disease
Control and Prevention (CDC). It is used to provide timely and action-oriented information. The
system is created and maintained by public health professionals. The United States Cancer
Statistic (USCS) is one of the online databases of CDC WONDER. It provides cancer incidence
and mortality information for the public starting in 1999, by year, state and metropolitan
statistical areas (MSA), age group, race, sex, ethnicity, cancer classifications and cancer site. The
mortality data is provided by the Center for Disease Control and Prevention (CDC), in
collaboration with the National Center for Health Statistics (NCHS) and the National Vital
Statistics System (NVSS). The USCS automatically creates reports with the variables and
information needed. The report can include the case counts, deaths, crude mortality rate, age-
adjusted incidence and mortality rates with 95% confidence intervals.
2.5 AGE-ADJUSTMENT OF MORTALITY RATES
Crude numbers of people in each age group were inputted into an Excel program to
calculate age-adjusted mortality rates. Age-adjusted mortality rates in this essay are adjusted
using the U.S. 2000 Standard Million Population. The age groups are: 25-29 years, 30-34 years,
16
35-39 years, 40-44 years, 45-49 years, 50-54 years, 55-59 years, 60-64 years, 65-69 years, 70-74
years, 75-79 years, 80-84 years, 85+ years.
2.6 DATA ANALYSES
Data analyses were conducted using the data for 2012, except for spatial analyses which
aggregated 2012 and 2013 data to make the numbers more stable.
Age-adjusted mortality rates of malignant neoplasms of the lip, oral cavity and pharynx,
malignant neoplasms of the esophagus, malignant neoplasms of the stomach, malignant
neoplasms of the pancreas, malignant neoplasms of larynx, malignant neoplasms of the trachea,
bronchus and lung, malignant neoplasms of the kidney and renal pelvis, and malignant
neoplasms of the bladder by residence for those aged 25 years and over in Allegheny County in
2012 were analyzed, adjusted by sex and race, to illustrate the tobacco-related malignant
neoplasms status in Allegheny County in 2012. Those age-adjusted mortality rates of eight
malignant neoplasms of Allegheny County in 2012 were compared with those of Pennsylvania
and the United States. Age-adjusted mortality rates of the Pennsylvania and the United States
were collected from the United States Cancer Statistic (USCS) databases of CDC WONDER.
Each mortality rate was adjusted by age (age group: 25-34, 35-44, 45-54, 55-64, 65-74, 75-84,
85+), sex (male, female) and race (white, black).
Age-adjusted mortality rates for all eight tobacco-related malignant neoplasms combined
by residence for those aged 25 years and over in Allegheny County in 2012 and 2013 were
17
analyzed, adjusted by municipality, to conduct spatial analysis of geographical patterns of
tobacco-related malignant neoplasms in Allegheny County in 2012 and 2013.
All data were analyzed using SAS (version 9.3, SAS Institute Inc) and Excel. Spatial
analysis was run by ArcGIS 10.1.
18
3.0 RESULTS
3.1 AGE-ADJUSTED MORTALITY RATES OF TOBACCO-RELATED
MALIGNANT NEOPLASMS IN ALLEGHENY COUNTY, THE STATE OF
PENNSYLVANIA AND THE UNITED STATES
Table 1 illustrates the age-adjusted mortality rates of eight tobacco-related malignant
neoplasms in Allegheny County in 2012 by sex and race. Bar graph of Table 1 can be found in
the appendix. Within all eight tobacco-related malignant neoplasms types, the age-adjusted
mortality rate of malignant neoplasms of the trachea, bronchus and lung is the highest in each
race and sex group. The highest one is malignant neoplasms of the trachea, bronchus and lung in
black males (139.0 per 100,000 people), followed by white males (99.1 per 100,000 people) and
black females (77.8 per 100,000 people).
Among whites, the age-adjusted mortality rates of all eight tobacco-related malignant
neoplasms of males are higher than those of females, and the highest is the age-adjusted
mortality rate of malignant neoplasms of the trachea, bronchus and lung (99.1 per 100,000
people) and followed by malignant neoplasms of pancreas (19.2 per 100,000 people) and bladder
(15.4 per 100,000 people). In the black group, the age-adjusted mortality rates of all eight
tobacco-related malignant neoplasms of males are higher than those of females except malignant
19

neoplasms of the pancreas, and the highest is the age-adjusted mortality rate of malignant
neoplasms of the trachea, bronchus and lung (139.0 per 100,000 people).
20
Table 1. Age-adjusted mortality rates of tobacco-related malignant neoplasms in Allegheny County, PA in 2012 by sex and race.
Name of malignant
neoplasms
(Based on ICD-10)
(Per 100,000 people)
White Black
Male Female Male Female
Age-
adjusted
rate
95% CI
(low, hi)
Age-
adjusted
rate
95% CI
(low, hi)
Age-
adjusted
rate
95% CI
(low, hi)
Age-
adjusted
rate
95% CI
(low, hi)
Bladder 15.4 (11.6, 19.3) 4.5 (2.8, 6.2) 22.8 (7.0, 38.6) 11.5 (3.0, 20.1)
Esophagus 12.3 (8.9, 15.6) 2.4 (1.2, 3.6) 4.6 (-1.8, 11.1) 1.3 (-1.2, 3.7)
Larynx 2.0 (0.6, 3.3) 0.1 (-0.1, 0.3) 6.7 (-2.6, 16.1) 1.8 (-1.7, 5.2)
Pancreas 19.2 (15.0, 23.4) 14.9 (11.8, 18.0) 32.2 (14.7, 49.6) 36.3 (21.1, 51.5)
Stomach 4.7 (2.6, 6.8) 3.8 (2.3, 5.3) 23.7 (8.2, 39.1) 1.7 (-1.6, 5.1)
Kidney and renal pelvis 9.5 (6.5, 12.5) 5.5 (3.6, 7.5) 8.6 (0.2, 16.9) 4.8 (-0.6, 10.3)
Lip, oral cavity and pharynx 2.7 (1.0, 4.3) 2.2 (1.0, 3.4) 3.2 (-3.1, 9.6) 3.5 (-1.3, 8.3)
Trachea, bronchus and lung 99.1 (89.4, 108.7) 65.1 (58.3, 71.8) 139 (103.2, 174.8) 77.8 (55.8, 99.8)
Total 164.8 (152.3,177.2) 98.5 (90.3,106.6) 240.8 (192.9,288.7) 136.9 (107.6,166.2)
Age Group: 25-29 years, 30-34 years, 35-39 years, 40-44 years, 45-49 years, 50-54 years, 55-59 years, 60-64 years, 65-69 years, 70-74 years, 75-79 years, 80-84 years, 85+ years.Standard Population: 2000 U.S. Std. Million
21
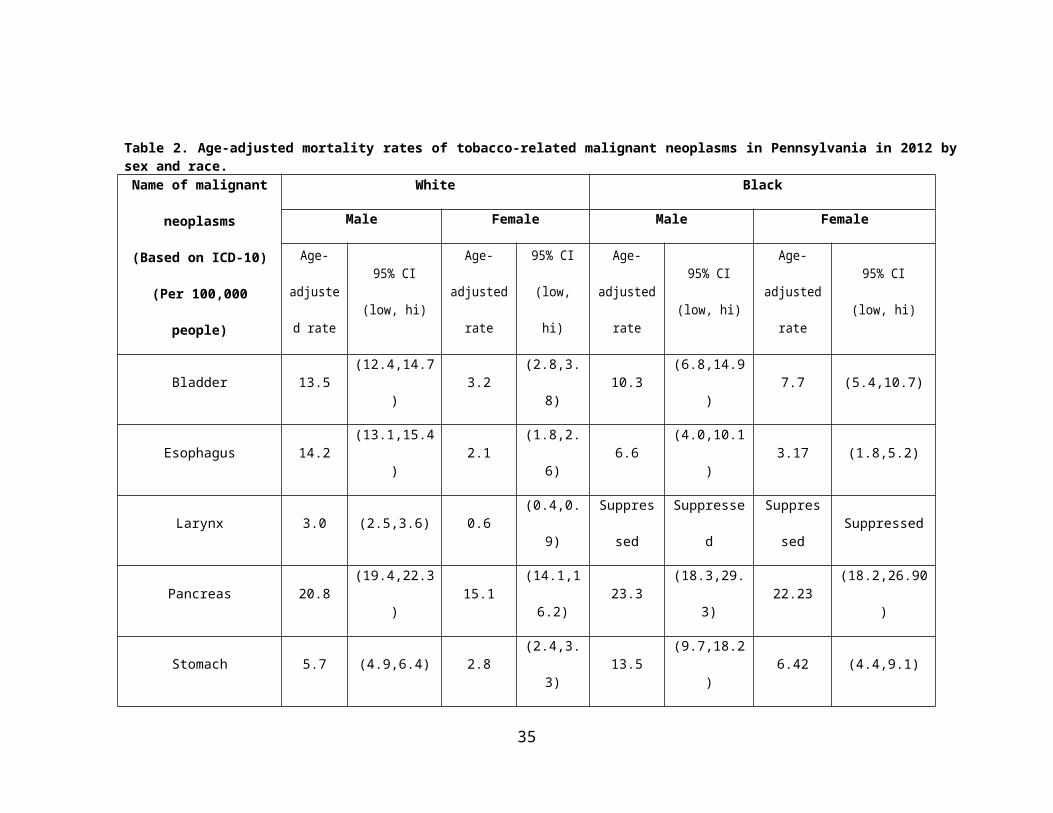
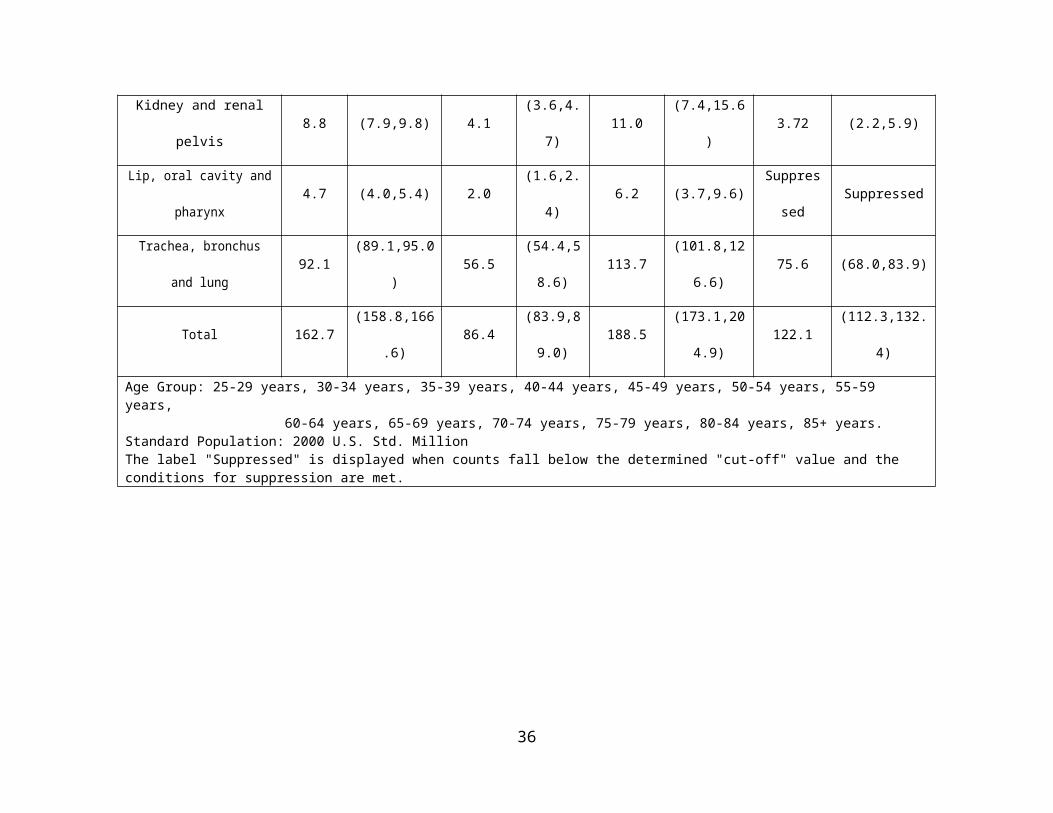
Table 2 shows the age-adjusted mortality rates of eight tobacco-related malignant
neoplasms in the State of Pennsylvania in 2012 by sex and race. Bar graph of Table 2 can be
found in the appendix. Among all age-adjusted mortality rates of eight tobacco-related malignant
neoplasms in each sex and race group, the rate for black males with malignant neoplasms of the
trachea, bronchus and lung is the highest (113.7 per 100,000 people), followed by white males
with malignant neoplasms of the trachea, bronchus and lung (92.1 per 100,000 people). When
comparing the eight tobacco-related cancer types, age-adjusted mortality rates of the larynx in
each sex and age group are the lowest than those of other cancers. In two race groups, age-
adjusted mortality rates of all cancers in males are higher than that of females. For males, age-
adjusted mortality rates of malignant neoplasms of the bladder, esophagus and larynx in whites
are higher than that of blacks, and age-adjusted mortality rates of other cancers in whites are
lower than those of blacks. For females, age-adjusted mortality rates of malignant neoplasms of
the larynx, kidney and renal pelvis and the lip, oral cavity and pharynx in whites are higher than
those of blacks, and age-adjusted mortality rates of other cancers in whites are lower than that of
blacks.
22
Table 2. Age-adjusted mortality rates of tobacco-related malignant neoplasms in Pennsylvania in 2012 by sex and race.
Name of malignant
neoplasms
(Based on ICD-10)
(Per 100,000 people)
White Black
Male Female Male Female
Age-
adjusted
rate
95% CI
(low, hi)
Age-
adjusted
rate
95% CI
(low, hi)
Age-
adjusted
rate
95% CI
(low, hi)
Age-
adjusted rate
95% CI
(low, hi)
Bladder 13.5 (12.4,14.7) 3.2 (2.8,3.8) 10.3 (6.8,14.9) 7.7 (5.4,10.7)
Esophagus 14.2 (13.1,15.4) 2.1 (1.8,2.6) 6.6 (4.0,10.1) 3.17 (1.8,5.2)
Larynx 3.0 (2.5,3.6) 0.6 (0.4,0.9) Suppressed Suppressed Suppressed Suppressed
Pancreas 20.8 (19.4,22.3) 15.1(14.1,16.2
)23.3 (18.3,29.3) 22.23 (18.2,26.90)
Stomach 5.7 (4.9,6.4) 2.8 (2.4,3.3) 13.5 (9.7,18.2) 6.42 (4.4,9.1)
Kidney and renal pelvis 8.8 (7.9,9.8) 4.1 (3.6,4.7) 11.0 (7.4,15.6) 3.72 (2.2,5.9)
Lip, oral cavity and pharynx 4.7 (4.0,5.4) 2.0 (1.6,2.4) 6.2 (3.7,9.6) Suppressed Suppressed
Trachea, bronchus and lung 92.1 (89.1,95.0) 56.5(54.4,58.6
)113.7 (101.8,126.6) 75.6 (68.0,83.9)
Total 162.7 (158.8,166.6) 86.4(83.9,89.0
)188.5 (173.1,204.9) 122.1 (112.3,132.4)
23
Age Group: 25-29 years, 30-34 years, 35-39 years, 40-44 years, 45-49 years, 50-54 years, 55-59 years, 60-64 years, 65-69 years, 70-74 years, 75-79 years, 80-84 years, 85+ years.Standard Population: 2000 U.S. Std. MillionThe label "Suppressed" is displayed when counts fall below the determined "cut-off" value and the conditions for suppression are met.
24

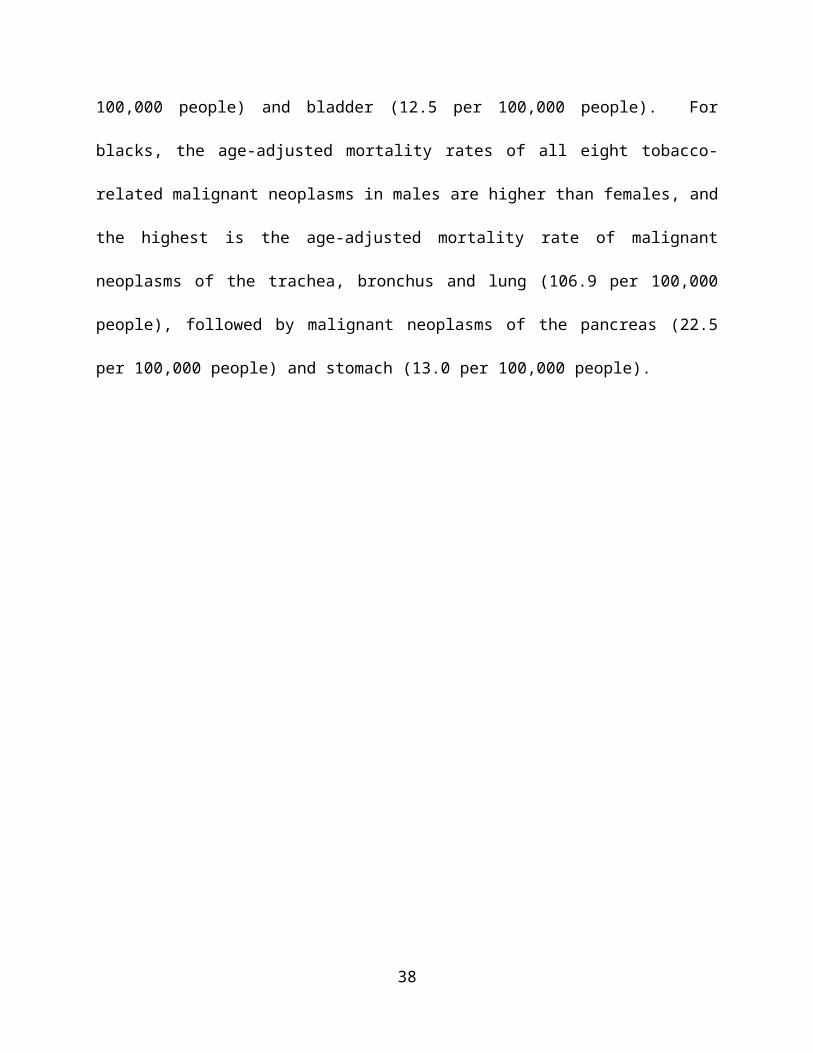
Table 3 presents the age-adjusted mortality rates of eight tobacco-related malignant
neoplasms in the United States in 2012 by sex and race. Bar graph of Table 3 can be found in the
appendix. Compared to all eight tobacco-related malignant neoplasm types, the age-adjusted
mortality rate of malignant neoplasms of the trachea, bronchus and lung is the highest in each
race and sex groups, while the age-adjusted mortality rate of malignant neoplasms of the larynx
is the lowest in each race and sex group. The age-adjusted mortality rate of malignant neoplasms
of the trachea, bronchus and lung in black males is the highest (106.9 per 100,000 people),
compared to all eight cancer types, sex groups and race groups, followed by white males with
malignant neoplasms of the trachea, bronchus and lung (86.9 per 100,000 people) and white
females with malignant neoplasms of the trachea, bronchus and lung (58.3 per 100,000 people).
For whites, the age-adjusted mortality rates of all eight tobacco-related malignant neoplasms of
males are higher than those of females, and the highest is the age-adjusted mortality rate of
malignant neoplasms of the trachea, bronchus and lung (86.9 per 100,000 people) followed by
malignant neoplasms of the pancreas (19.6 per 100,000 people) and bladder (12.5 per 100,000
people). For blacks, the age-adjusted mortality rates of all eight tobacco-related malignant
neoplasms in males are higher than females, and the highest is the age-adjusted mortality rate of
malignant neoplasms of the trachea, bronchus and lung (106.9 per 100,000 people), followed by
malignant neoplasms of the pancreas (22.5 per 100,000 people) and stomach (13.0 per 100,000
people).
25

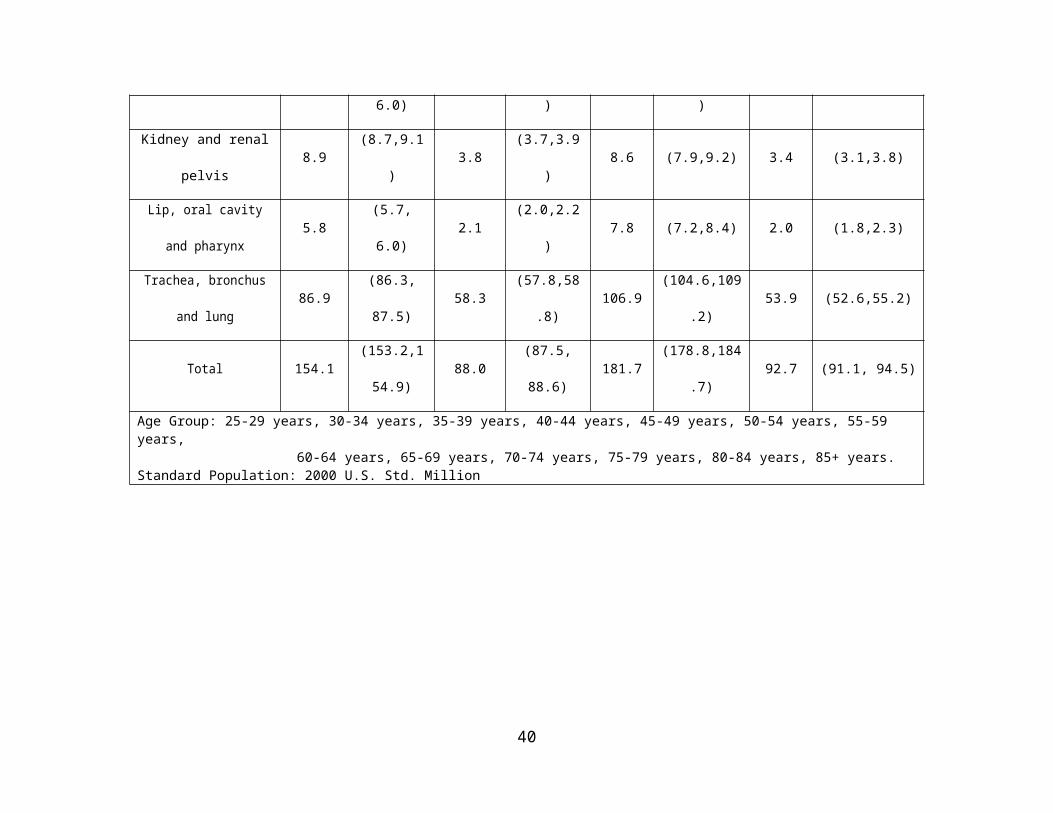
Table 3. Age-adjusted mortality rates of tobacco-related malignant neoplasms in the United States in 2012 by sex and race.
Name of malignant
neoplasms
(Based on ICD-10)
(Per 100,000 people)
White Black
Male Female Male Female
Age-
adjusted
rate
95% CI
(low, hi)
Age-
adjusted
rate
95% CI
(low, hi)
Age-
adjusted
rate
95% CI
(low, hi)
Age-
adjusted
rate
95% CI
(low, hi)
Bladder 12.5 (12.2,12.7) 3.4 (3.3, 3.5) 8.2 (7.5,8.9) 3.7 (3.3,4.0)
Esophagus 11.9 (11.6,12.1) 2.3 (2.2, 2.4) 9.6 (9.0,10.3) 3.0 (2.7,3.3)
Larynx 2.7 (2.6,2.8) 0.6 (0.5,0.6) 5.2 (4.8,5.8) 0.9 (0.7,1.1)
Pancreas 19.7 (19.3,20.0) 14.6 (14.4,14.8) 22.45 (21.4,23.5) 19.3 (18.5,20.1)
Stomach 5.8 (5.6, 6.0) 3.1 (3.0,3.2) 13.0 (12.3,13.9) 6.5 (6.1,7.0)
Kidney and renal pelvis 8.9 (8.7,9.1) 3.8 (3.7,3.9) 8.6 (7.9,9.2) 3.4 (3.1,3.8)
Lip, oral cavity and
pharynx5.8 (5.7, 6.0) 2.1 (2.0,2.2) 7.8 (7.2,8.4) 2.0 (1.8,2.3)
Trachea, bronchus and lung 86.9 (86.3, 87.5) 58.3 (57.8,58.8) 106.9 (104.6,109.2) 53.9 (52.6,55.2)
Total 154.1(153.2,154.9
)88.0 (87.5, 88.6) 181.7 (178.8,184.7) 92.7 (91.1, 94.5)
Age Group: 25-29 years, 30-34 years, 35-39 years, 40-44 years, 45-49 years, 50-54 years, 55-59 years, 60-64 years, 65-69 years, 70-74 years, 75-79 years, 80-84 years, 85+ years.
26

Standard Population: 2000 U.S. Std. Million
27
3.2 AGE-SPECIFIC MORTALITY RATES OF TOBACCO-RELATED
MALIGNANT NEOPLASMS BY AGE GROUPS IN ALLEGHENY COUNTY,
PENNSYLVANIA, AND THE UNITED STATES
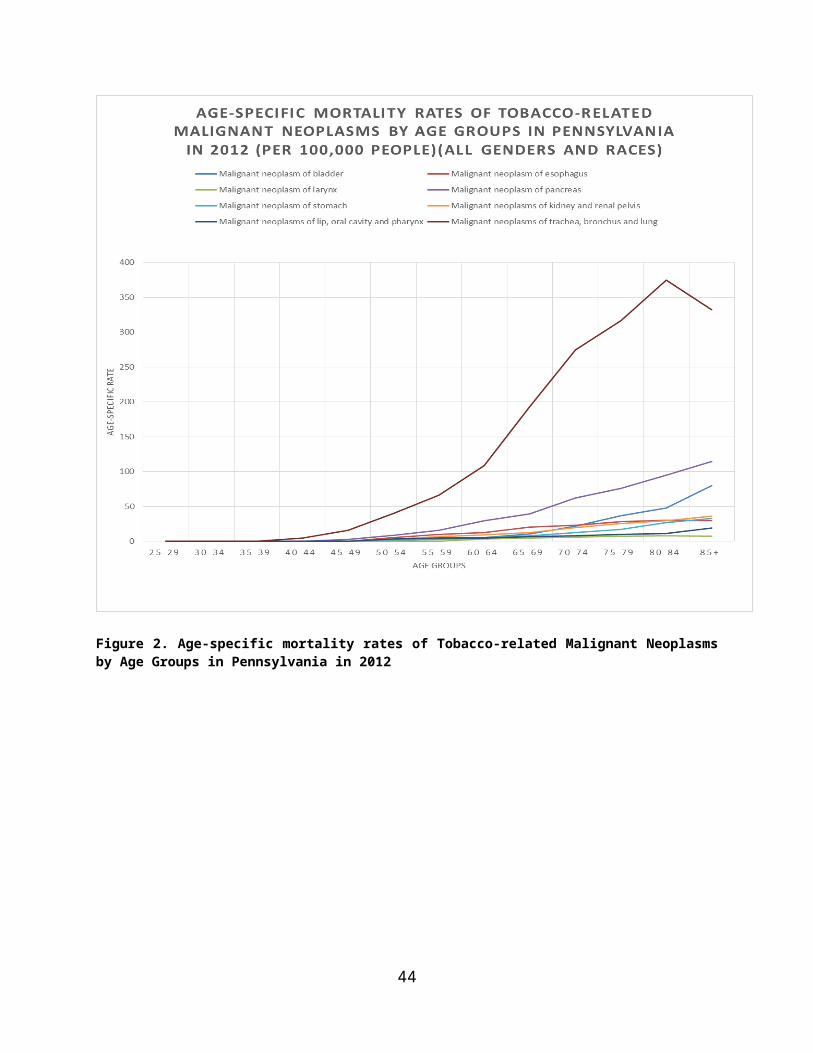
Figures 1-3 show the trends of age-specific mortality rates of tobacco-related malignant
neoplasms by age groups in Allegheny County, the State of Pennsylvania and the United States
in 2012. After comparison of age-specific mortality rates of eight tobacco-related malignant
neoplasms between Allegheny County, the State of Pennsylvania and the United States, I found
that they share similar trends by age groups for each malignant neoplasm type. The age-specific
mortality rate of malignant neoplasms of the trachea, bronchus and lung is higher than other
cancers in each age group, followed by malignant neoplasms of the pancreas and malignant
neoplasms of the bladder. The age-specific mortality rate of malignant neoplasms of the larynx
in each age group is the lowest among all eight malignant neoplasms types in Allegheny County,
the State of Pennsylvania and the United States.
In Allegheny County, the State of Pennsylvania and the United States, the age-specific
mortality rates of eight tobacco-related malignant neoplasms are very low before age 40 (less
than 1.0) and there are no significant differences among cancer types for males, females or by
race among cancer types between Allegheny County, PA, and US. When considering those aged
over 40, the age-specific mortality rates increase and show differences of trends among cancer
types. For malignant neoplasms of the trachea, bronchus and lung in the United States and
Pennsylvania in 2012, the age-specific mortality rates increase steadily between age 40 and 64,
and reach approximately 100/100,000 for those aged 60-64. Between age 64 and 84, the age-
28

specific mortality rates rise sharply and peak for those in the age group 80-84, with an age-
specific mortality rate over 350 per 100,000 people. The trend decreases after age 84. The trend
of the other seven tobacco related cancers shows a gradual rise after age 40 and reach their peak
for the age group 80-84. Malignant neoplasm of the stomach had a sharp increase after age 84.
For malignant neoplasms of the trachea, bronchus and lung in Allegheny County in 2012, the
trends are similar to those for Pennsylvania and the United States. The age-specific mortality
rates of eight tobacco-related malignant neoplasms are low before age 40 (less than 1.0) and do
not show significant difference among cancer types.
Figure 1. Age-specific mortality rates of Tobacco-related Malignant Neoplasms by Age Groups in Allegheny County in 2012
29
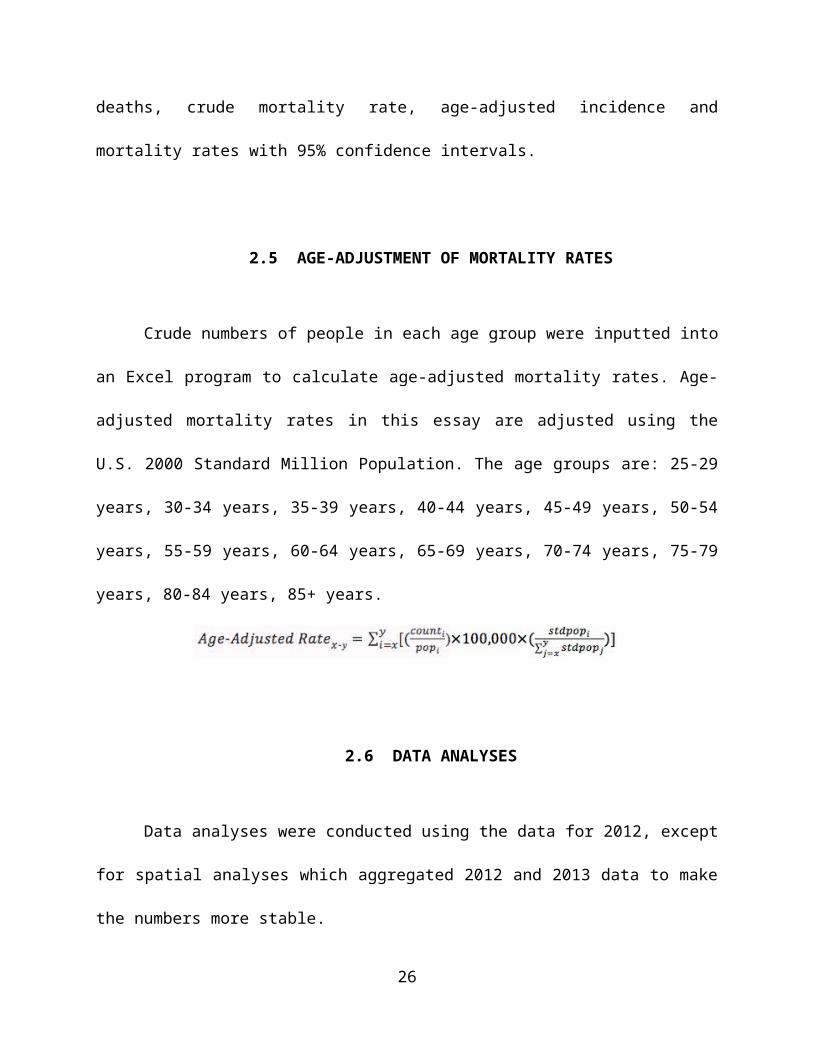
Figure 2. Age-specific mortality rates of Tobacco-related Malignant Neoplasms by Age Groups in Pennsylvania in 2012
30
Figure 3. Age-specific mortality rates of Tobacco-related Malignant Neoplasms by Age Groups in the United States in 2012
3.3 SPATIAL ANALYSIS OF AGE-ADJUSTED MORTALITY RATES BY
MUNICIPALITY IN ALLEGHENY COUNTY
Figure 4 presents the geographic spatial analysis of the distribution of age-adjusted
mortality rates of eight tobacco-related malignant neoplasms by municipality in Allegheny
County in 2012 and 2013. Data needed to create the map can be found in the Appendix. From the
map, the age-adjusted mortality rates seem to exhibit a visible geographic pattern within
31
Allegheny County, as higher mortality rates seem to be concentrated in the northeast, west and
middle of the county, such as the municipalities of Pitcairn Borough, Millvale Borough, Etna
Borough, Tarentum Borough, Braddock Borough, and Kilbuck Township. Eleven municipalities
are considered to have high age-adjusted mortality rates of tobacco-related cancers that exceeds
135.9 per 100,000 people (see figure 4). Over 20 municipalities in south and southeast Allegheny
County have low age-adjusted mortality rates, with the rates below 41.7 per 100,000 people,
such as Churchill Borough, Ohio Township, Elizabeth Borough, Harmar Township, Edgewood
Borough, and Emsworth Borough.
As the most financially distressed municipality and with the largest area (58.3 square
miles). and population (306,211 people in 2012) of all municipalities in Allegheny County, the
city of Pittsburgh has a middle level of age-adjusted mortality rates between 75.5 and 99.6 per
100,000 people in 2012 and 2013. Pennsbury Village has the highest population density of all
municipalities in Allegheny County, and the age-adjusted mortality rate of Pennsbury Village
falls between 41.7 and 75.5 per 100,000 people in 2012 and 2013, which presents a relatively
low level.
Figure 5 presents the distribution of poverty rate by municipality in Allegheny County in
2013. Data needed to create the map can be found in the appendix. As we can see in the map, the
poverty rates show a geographic pattern within Allegheny County, as higher poverty rates are
concentrated in the southeast and middle of the county, such as the municipalities of Rankin
Borough, Braddock Borough and Duquesne City. Ten municipalities are considered to have a
high poverty rate, in excess of 26 per 100 people (see the figure 5). About 37 municipalities in
Allegheny County have low poverty rates, with the rates below 5.5 per 100 people, such as
Sewickley Heights Borough, Mairshall Township, Franklin Park Borough, and others.
32
Figure 4. Distribution of age-adjusted mortality rates of eight tobacco-related malignant neoplasms by municipality in Allegheny County in 2012 and 2013 (all sexes and races) (per 100,000 people)
33
Figure 5. Distribution of poverty rate by municipality in Allegheny County in 2013 (all sexes and races)(per 100 people)
34

4.0 DISCUSSION
Overall, in 2012, for Allegheny County, the age-adjusted mortality rates of all eight
tobacco-related cancers in black males is the highest among all age and sex groups, which is
240.8 (per 100,000 people), followed by white males (164.8 per 100,000 people), black females
(136.9 per 100,000 people), and white females (98.5 per 100,000 people). For the State of
Pennsylvania, in all age and sex groups, the age-adjusted mortality rates of all eight tobacco-
related cancers in black males (188.5 per 100,000 people) is the highest, followed by white males
(162.7 per 100,000 people), black females (122.1 per 100,000 people), and white females (86.4
per 100,000 people). For the United States, of all age and sex groups, the age-adjusted mortality
rates of all eight cancers on black males is still the highest, which is 181.7 per 100,000 people,
followed by white males (154.1 per 100,000 people), black females (92.7 per 100,000 people),
and white females (88.0 per 100,000 people). In Allegheny County, the State of Pennsylvania
and the United States, the age-adjusted mortality rate of malignant neoplasms of trachea,
bronchus and lung is the highest in each race and sex groups, compared to other seven tobacco
related cancers. With the results and comparison, there are various approaches that could be
addressed and improved focusing on tobacco use cessation. This may include current tobacco
laws and policies, tobacco cessation programs, examining reasons for differences among sex and
race groups and cancer types, prevention efforts focusing on populations that are considered at
high risk, and consideration of future tobacco-related cancers intervention programs.
35

Nationwide, tobacco use is responsible for almost 20% of all deaths in the United
States[43]. Based on 2011 National Health Interview Survey and the Cancer Prevention Study,
among 345,000 malignant-specific deaths, over 167,000 were attributed to tobacco use, which
accounted for over 30% of all cancer-related deaths. The majority of them are due to malignant
neoplasms of trachea, bronchus and lung, which accounted over 125,000 deaths.[44] Tobacco
use has been a huge problem in the United States for a long time throughout its history by 1600,
tobacco use had spread across Europe and become more widespread by the 1700s as the tobacco
industry developed. After the first U.S. Surgeon General’s Report on smoking and health in
1964, the prevalence of tobacco use in the United State has declined by about 50%. The
prevalence decreased to 23.3% in 2000 compared to 42.4% in 1965. Since 1999, to prevent
tobacco-related cancers and diseases, CDC’s Office on Smoking and Health (OSH) developed a
National Tobacco Program to concentrate on tobacco-related diseases and deaths intervention,
exposure to secondhand smoking elimination, adults and youth smoking quitting and try to
eliminate disparities among population groups.[45] Pennsylvania has also created several
tobacco cessation programs and strategic plans, which included a telephone Quitline,
surveillance of tobacco sales to minors’ surveillance, and clinical-practice guidelines for
treatment of tobacco addiction promotion, etc. In 2014, the prevalence of tobacco-use decreased
to 17% in the United States, which presented obvious declines.[46] Based on Healthy People
2020, the CDC recommends several statewide programs and community-based interventions to
prevent initiation of tobacco use and quitting smoking among youth and adults, which helps to
prevent tobacco-related cancers and diseases.[47] In the Healthier Allegheny Plan, Pennsylvania
and Allegheny County Health Department committed to curtailing the smoking rate by 10% by
2020.[48] By 2015, Pennsylvania and Allegheny County had various tobacco cessation programs
36
and had victories in tobacco prevention, such as there are over 690 smoke-free units in 10
buildings designated by The Allegheny County Housing Authority, all Pennsylvania secondary
schools and 10 colleges and universities in Pennsylvania have smoke-free policies.[49]
The data and results show differences in age-adjusted mortality rates within sex and race
groups, age groups and eight tobacco-related cancers. One reason for this difference could be
that tobacco use varies across groups defined by sex, race, age, educational level and
socioeconomic status in the United States. Based on the 2008 CDC report, the overall prevalence
of tobacco use for blacks and whites was the same, about 20%. For young people under age 18,
blacks had significant lower smoking rates than whites, but for the adults, the prevalence of
tobacco use among white adults exceeds that of blacks. In addition, over 70% of black smokers
use menthol cigarette brands, which may confer greater mental health risks and inhibit smoking
cessation, compared to less than 30% of white smokers.[50] Current tobacco use is higher among
persons aged between 18-64, which accounts for over 64% of all tobacco users.[51] In terms of
education level and socioeconomic status, the prevalence of tobacco use is highest among people
with a GED than those with a graduate degree, and higher among people below the poverty level
than at or above the poverty level.[52] To address the gaps and reduce such disparities, the
National Conference on Tobacco and Health Disparities (NCTHD) 2012 has developed several
effective cessation interventions aimed at eliminating tobacco-use and tobacco-related disease
disparities in various scientific areas. For example, in the case of surveillance, plans to enhance
monitoring and evaluation of tobacco use and tobacco-related risk factors among blacks have
been developed. In the case of marketing, plans to examine brand use, distribution patterns and
advertisements of tobacco products to minority population groups have been developed. For the
37

treatment of nicotine addiction, plans have been developed to identify and test interventions to
treat tobacco users addicted to nicotine.[53]
Considering the geographic spatial analysis results of distribution of age-adjusted
mortality rates by municipality in Allegheny County for 2012-2013, the age-adjusted mortality
rates exhibit visible geographic pattern within Allegheny County, as higher mortality rates seem
to be concentrated in northeast, west and middle, such as the municipalities of Pitcairn Borough,
Millvale Borough, Etna Borough, Tarentum Borough, Braddock Borough, and Kilbuck
Township. Over 20 municipalities in south and southeast have low age-adjusted mortality rates.
One reason for the mortality geographic patterns in mortality may due to social economic status
differences within Allegheny County. Tobacco use is more concentrated among populations with
lower incomes and lower social economic status[54] As figure 5 shows the distribution of
poverty rate by municipality in Allegheny County in 2013, higher poverty rates seem to be
concentrated in the southeast and middle of the county, such as the municipalities of Rankin
Borough, Braddock Borough and Duquesne City. Although poverty status has been related to
tobacco-related cancer mortality rates, lack of physical activity, poor environment and other
factors may also affect tobacco-related cancer status. The correlation of poverty rates at the
municipality level in Allegheny County and tobacco-related cancer mortality rates is low based
on the data of this essay (R2=0.05). Another reason may be due to differences of sex and race
distribution among 130 municipalities. The spatial analysis in this essay is based on all sexes and
races, and only adjusted by age groups, so any tobacco use disparities in sex, race, age,
educational level and socioeconomic status that could affect the tobacco use and tobacco-related
cancer status among people in each municipality will not be detected. In addition, another reason
may be that Allegheny County has several tobacco-cessation programs aiming to reduce tobacco
38
product use, but their implementation status and effects may vary for each municipality. In this
case, by monitoring and understanding geographic patterns of mortality rates of tobacco-related
cancers within municipalities in Allegheny County, it is important that prevention efforts shift to
focus on the municipalities with higher tobacco-related cancer mortality rates and those
considered at high risk. Moreover, another important reason could be other risk factors may
attribute to tobacco-related cancers. Tobacco use is a major risk factor for tobacco-related
cancers, however, some other risk factors such as alcohol use, cancer-causing substances, family
history, chronic inflammation, obesity, diet, sunlight, etc. will also largely affect tobacco-related
cancers status. People in each municipality differentiate from each other for these factors, which
may affect the geographic patterns of mortality rates of tobacco-related cancers by municipality
in Allegheny County.
This essay utilized standardized data programs and data collection, which conferred
strengths and limitations. One of the strengths is that each decedent of Allegheny County has a
death certificate record, which is submitted to the Allegheny County Health Department. The
records are detailed and make the sample nearly perfect. Another strength is that, since the
deaths were due to malignant neoplasms based on ICD-10 codes, and examined and confirmed
by physicians, this makes the death certificate more accurate, compared to other typical death
certificates. For the analysis method strengths, since age-adjustment relies on rates, and also was
adjusted by sex and race, it provides accurate evaluation of the different age, sex, and race
structures. The limitations of this essay include errors and unknown information in the death
record. There are almost 40% unknown values of the tobacco variable for eight tobacco-related
cancers. During the analysis, I tried to compare age-adjusted mortality rates of deaths due to
malignant neoplasms and tobacco use, with those of non-tobacco use. But due to a large
39
proportion of unknown values for the tobacco use variable, the results show that age-adjusted
mortality rates of tobacco users with cancers of the pancreas, stomach, and kidney are
significantly lower than those of non-tobacco users, which are contradictory to previous research
and our expectation.
In conclusion, there were not many differences in the age-adjusted mortality rates of
tobacco-related malignant neoplasms between Allegheny County, the State of Pennsylvania, and
the United States. The age-adjusted mortality rate of malignant neoplasms of trachea, bronchus
and lung was highest in each race and sex groups. In general, males have higher age-adjusted
mortality rates of tobacco-related cancers than females, and age-adjusted mortality rates of
tobacco-related cancers in blacks are higher than those of whites. After conducting spatial
analysis of the distribution of age-adjusted mortality rates by municipality in Allegheny County,
higher mortality rates seem to be concentrated in the northeast, west and middle, which presents
a visible geographic pattern within Allegheny County. The results of this essay address the
importance of tobacco cessation programs and strategic plans aiming at improving public health
awareness of tobacco cessation, and will assist with reducing tobacco use in the United States
and eliminating tobacco-related diseases disparities in the population.
40

APPENDIX A: SUPPLEMENTARY TABLES
Table 4. Age-adjusted mortality rates of tobacco-related malignant neoplasms by municipality in Allegheny County in 2012 and 2013 (all sexes and races) (per 100,000 people)
Municipality names
Age-adjusted mortality rates
(per 100,000 people)
Municipality names
Age-adjusted mortality rates
(per 100,000 people)
Municipality names
Age-adjusted mortality rates
(per 100,000 people)
Municipality names
Age-adjusted mortality rates
(per 100,000 people)
Aleppo township 52 Edgeworth
borough 63.1 Monroeville municipality 66.1 Shaler township 75.5
Aspinwall borough 108.6 Elizabeth
borough 27.3 Moon township 83.9 Sharpsburg borough 83.6
Avalon borough 152.6 Elizabeth township 91.5 Mount Lebanon
township 51.9 South Fayette township 95.5
Baldwin borough 76.2 Emsworth
borough 20.4 Mount Oliver borough 59.7 South Park
township 69.4Baldwin township 63.7 Etna borough 172.6 Munhall
borough 92.6 South Versailles township 0
Bell Acres borough 31.6 Fawn
township 149.1 Mckeesport city 98 Springdale borough 59.1
Bellevue borough 72.2 Findlay
township 94.7 McCandless twp 67.9 Springdale township 35.1
Ben Avon borough 18.6 Forest Hills
borough 57.6 Neville township 130.3 Stowe township 12.7
Ben Avon Heights borough
113.9 Forward township 69.8 North Braddock
borough 133.2 Swissvale borough 113.4
Bethel Park municipality 63.7 Fox Chapel
borough 36.7 North Fayette township 111.6 Tarentum
borough 168.6Blawnox borough 104.4 Franklin Park
borough 62.5 North Versailles township 117.5 Thornburg
borough 86.2Brackenridge
borough 78 Frazer township 117.5 O'Hara
township 79.9 Turtle Creek borough 61.3
Braddock borough 160.6 Glassport
borough 157.5 Oakdale borough 39.1 Upper St. Clair
township 56.2Braddock Hills
borough 66.6 Green Tree borough 93.8 Oakmont
borough 88.9 Verona borough 110.5Bradford Woods
borough 79.6 Hampton township 41.7 Ohio township 29.4 Versailles
borough 127.4Brentwood
borough 77.7 Harmar township 26 Osborne
borough 0 West Deer township 70.9
Bridgeville borough 128.9 Harrison
township 126.8 Penn Hills township 103.6
West Homestead
borough95
Carnegie borough 90.2 Heidelberg
borough 86.9 Pennsbury Village borough 42.4 West Mifflin
borough 72.8Castle Shannon
borough 111.5 Homestead borough 88.1 Pine township 54.3 West View
borough 81.7Chalfant borough 52.4 Indiana
township 74.2 Pitcairn borough 217.5 Whitaker
borough 97.9Cheswick borough
Table 4 Continued70.3 Ingram
borough 83.5 Pleasant Hills borough 93.2 White Oak
borough 11.1
Churchill 30.7 Jefferson Hills 73.5 Plum borough 67.6 Whitehall 58.1
41
borough borough boroughClairton city 60.6 Kennedy
township 62.5 Port Vue borough 56.6 Wilkins
township 64.2
Collier township 77.2 Kilbuck township 159.1 Penn Hills twp 0 Wilkinsburg
borough 88.6Coraopolis borough 70.2 Leet township 105.1 Pittsburgh city 96 Wilmerding
borough 131Crafton borough 99.6 Leetsdale
borough 67.7 Rankin borough 36.9 West Elizabeth borough 0
Crescent township 147.1 Liberty
borough 59.9 Reserve township 85.1 Wall borough 0
Dormont borough 103.8 Lincoln
borough 83.9 Richland township 65.2 Trafford
borough 0Dravosburg
borough 88.4 Marshall township 96.3 Robinson
township 68.1 Rosslyn Farms borough 0
Duquesne city 135.9 McCandless township 67.9 Ross township 62.6 Glen Osborne
borough 0East Deer township 124.9 McDonald
borough 89 Scott township 66.5 Haysville borough 0
East McKeesport
borough121.2 McKees Rocks
borough 0 Sewickley borough 53.2 Glenfield
borough 0
East Pittsburgh borough 71.2 McKeesport
city 98Sewickley Heights borough
42.9
Edgewood borough 25.8 Millvale
borough 197.9 Sewickley Hills borough 100.1
Table 5. Poverty rates by municipality in Allegheny County in 2013 (all sexes and races) (per 100 people)
Municipality names Poverty rates (per 100 people)
Municipality names
Poverty rates (per 100 people) Municipality names
Poverty rates (per 100 people)
Municipality names Poverty rates (per 100 people)
Aleppo township 3.2
Edgeworth borough 2.8
McKees Rocks borough 33.2 Shaler township 4.7
Aspinwall borough 5.8
Elizabeth borough 15.8
Marshall township 1.4
Sharpsburg borough 22.2
Avalon borough 12.8Elizabeth township 5.8
Millvale borough 19.9
South Fayette township 5.5
Baldwin borough 10.2
Emsworth borough 6
Monroeville municipality 7.7
South Park township 8
Baldwin township 4.6 Etna borough 19.5 Moon township 9.6
South Versailles township 7.9
Bell Acres borough 3.9
Fawn township 4.4
Mount Lebanon township 5.8
Springdale borough 10.6
Bellevue borough 14.5
Findlay township 4.3
Mount Oliver borough 37.3
Springdale township 10.7
Ben Avon borough 2.5
Forest Hills borough 7.7
Munhall borough 9.6 Stowe township 30.1
Ben Avon Heights borough 1.8
Forward township 6.9
Neville township 16.4
Swissvale borough 19.3
Bethel Park municipality 3.5
Fox Chapel borough 7.4
North Braddock borough 21.4
Tarentum borough 19.8
Blawnox borough 13.1
Franklin Park borough 1.7
North Fayette township 8.5
Thornburg borough 0
Brackenridge borough 16.6
Frazer township 5.7
North Versailles township 18.4
Trafford borough 30.2
Braddock borough 39.5
Glassport borough 12.7
Oakdale borough 6.8
Turtle Creek borough 21.4
Braddock Hills borough 17.2
Glenfield borough 7.1
Oakmont borough 4.9
Upper St. Clair township 2.6
Table 5 ContinuedBradford Woods
borough 3.2Glen Osborne
borough 7.7O'Hara
township 2.8 Verona borough 17.5Brentwood
borough 15Green Tree
borough 2.6 Ohio township 3Versailles borough 16.8
Bridgeville 8.3 Hampton 4 Penn Hills 10.6 Wall borough 12.9
42

borough township townshipCarnegie borough 25.6
Harmar township 7.9
Pennsbury Village borough 6.4
West Deer township 5.8
Castle Shannon borough 12.4
Harrison township 13.5 Pine township 1.9
West Elizabeth borough 29.6
Chalfant borough 6.4
Haysville borough 14.9
Pitcairn borough 12.2
West Homestead
borough 9Cheswick borough 5.9
Heidelberg borough 6.8 Pittsburgh city 22.6
West Mifflin borough 12.7
Churchill borough 3.1
Homestead borough 23.6
Pleasant Hills borough 5.5
West View borough 6
Clairton city 28.8Indiana
township 9 Plum borough 4.7Whitaker borough 15.4
Collier township 6.8Ingram borough 11.2
Port Vue borough 11.5
Whitehall borough 8.9
Coraopolis borough 20.8
Jefferson Hills borough 4 Rankin borough 44.2
White Oak borough 3.9
Crafton borough 4.8
Kennedy township 8.6
Reserve township 4.7
Wilkins township 12.3
Crescent township 8.7
Kilbuck township 4.5
Richland township 5.1
Wilkinsburg borough 23.1
Dormont borough 6.9 Leet township 3
Robinson township 4.9
Wilmerding borough 26
Dravosburg borough 11.1
Leetsdale borough 4 Ross township 7
Duquesne city 37.7Liberty borough 7.8
Rosslyn Farms borough 2.8
East Deer township 12.4
Lincoln borough 8.6 Scott township 7.7
East McKeesport
borough 9.9McCandless
township 4.5Sewickley borough 6.7
East Pittsburgh borough 29.2
McDonald borough 13.1
Sewickley Heights borough 0.8
Edgewood borough 9.8
McKeesport city 29.6
Sewickley Hills borough 3.5
43
APPENDIX B: SUPPLEMENTARY FIGURES
44
Figure 6. Age-adjusted mortality rates of tobacco-related malignant neoplasms in Allegheny County, PA in 2012 by sex and race.
45
Figure 7. Age-adjusted mortality rates of tobacco-related malignant neoplasms in Pennsylvania in 2012 by sex and race.
46
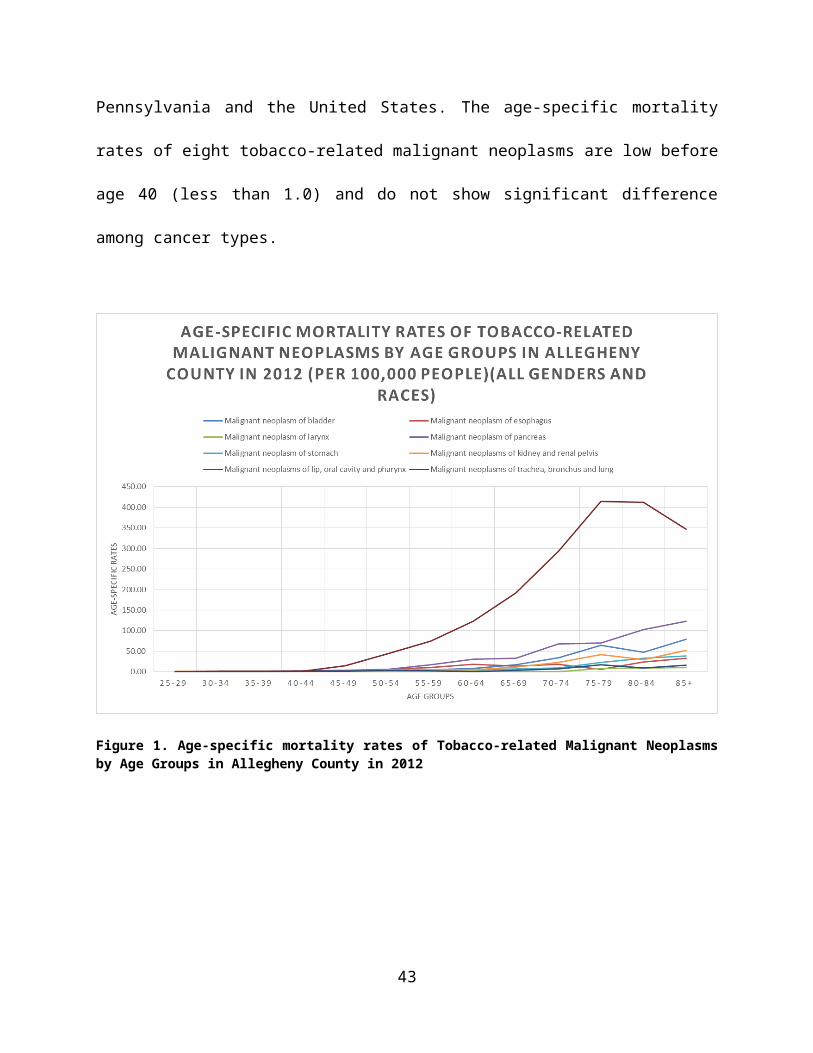
Figure 8. Age-adjusted mortality rates of tobacco-related malignant neoplasms in the United States in 2012 by sex and race.
47
BIBLIOGRAPHY
1. CDC, Smoking-attributable mortality, years of potential life lost, and productivity losses. MMWR 2008, 2000-2004. 57:1221-6.
2. CDC, Cigarette smoking among adults. 2007. 57:1221–6.3. CDC. Cigarette Smoking in the United States. Tips From Former Smokers 2015;
Available from: http://www.cdc.gov/tobacco/campaign/tips/resources/data/cigarette-smoking-in-united-states.html.
4. Giovino, G.A., Epidemiology of tobacco use in the United States. 2002. 21:7326-7348.5. Trends in Tobacco Use, R.a.P. Services, Editor. 2011, Epidemiology and Statistics Unit.6. Why Cigarette Usage Is At Record Lows And Dropping. All Sections 2015; Available
from: http://www.huffingtonpost.com/2015/03/26/cigarette-smoking-decline_n_6855468.html.
7. CDC, National Adult Tobacco Survey, in 2012-2013 National Adult Tobacco Survey Sample Design and Methodology Summary. 2015: US.
8. CDC. Health Effects of Secondhand Smoke. Fact Sheets 2016; Available from: http://www.cdc.gov/tobacco/data_statistics/fact_sheets/secondhand_smoke/health_effects/.
9. CDC. Youth and Tobacco Use. Fact Sheet 2016; Available from: http://www.cdc.gov/tobacco/data_statistics/fact_sheets/youth_data/tobacco_use/.
10. Wang, B., et al., Awareness and Use of Non-conventional Tobacco Products Among U.S. Students, 2012. American Journal of Preventive Medicine. 47(2): p. S36-S52.
11. CDC. Statistics Fast Facts. 2016; Available from: http://www.cdc.gov/tobacco/data_statistics/fact_sheets/fast_facts/.
12. CDC, Smoking and COPD. 2016.13. The Health Consequences of Smoking—50 Years of Progress. A Report of the Surgeon
General 2014; Available from: http://www.surgeongeneral.gov/library/reports/50-years-of-progress/exec-summary.pdf.
14. IARC Monographs on the Evaluation f Carcinogenic Risks to Humans. 2006; Available from: http://monographs.iarc.fr/ENG/Preamble/currentb6evalrationale0706.php.
15. CDC. Tobacco-Related Mortality. Smoking and Tobacco Use 2016; Available from: http://www.cdc.gov/tobacco/data_statistics/fact_sheets/health_effects/tobacco_related_mortality/.
16. Oral Cancer Facts. Rates of occurrence in the United States 2016; Available from: http://www.oralcancerfoundation.org/facts/.
17. Oral Cancer Risk Factors. Oral Cancer Statistics 2015; Available from: http://www.cancerresearchuk.org/health-professional/cancer-statistics/statistics-by-cancer-type/oral-cancer/risk-factors.
48

18. What are the key statistics about cancer of the esophagus? Esophagus Cancer 2014; Available from: http://www.cancer.org/cancer/esophaguscancer/detailedguide/esophagus-cancer-key-statistics.
19. Jean A. Shapiro, E.J.J.a.M.J.T., Cigar Smoking in Men and Risk of Death From Tobacco-Related Cancers. JNCI, 1999. 92(4): p. 333-337.
20. Tobacco forms and types. 2014; Available from: http://www.oralcancerfoundation.org/tobacco/tobacco-forms-types.php.
21. What are the key statistics about stomach cancer? Stomach Cancer 2016; Available from: http://www.cancer.org/cancer/stomachcancer/detailedguide/stomach-cancer-key-statistics.
22. Lopez, M.E.a.A.D., Smoking and oral tobacco use. 2014. 11(3): p. 884-890.23. Quit. How does smoking affect my stomach and bowel? 2016; Available from:
http://www.quit.org.au/about/frequently-asked-questions/how-does-smoking-affect-my-body/stomach-and-bowel.html.
24. Smoking and cancer. 2014; Available from: http://www.kingcounty.gov/healthservices/health/tobacco/tobacco-vapor/cancer.aspx.
25. Genetics of Prostate Cancer (PDQ): Genetics - Health Professional Information [NCI]. 2014; Available from: http://cancer.dartmouth.edu/pf/health_encyclopedia/ncicdr0000299612.
26. Parkin, The fraction of cancer attributable to lifestyle and environmental factors British Journal of Cancer, 2011. 105: p. 77-81.
27. Cancer Facts and Figures 2015. 2016; Available from: http://www.cancer.org/acs/groups/content/@editorial/documents/document/acspc-044552.pdf.
28. Voice Box (Laryngeal) Cancer. 2012; Available from: http://www.entnet.org/content/voice-box-laryngeal-cancer.
29. Ahmedin Jemal DVM, F.B., Melissa M. Center, Jacques Ferlay, Elizabeth Ward and David Forman, CA: A Cancer Journal for Cllinicians. Oncology and Radiotherapy, 2011. 61(2): p. 69-90.
30. Lung Cancer Fact Sheet. Lung Health and Diseases 2015; Available from: http://www.lung.org/lung-health-and-diseases/lung-disease-lookup/lung-cancer/learn-about-lung-cancer/lung-cancer-fact-sheet.html.
31. Rebecca E. Schane, M., Pamela M. Ling, MD, MPH, and Stanton A. Glantz, PhD, Health Effects of Light and Intermittent Smoking: A Review. Circulation, 2010. 121(13): p. 1518-1522.
32. CDC. Secondhand Smoke (SHS) Facts. 2016; Available from: http://www.cdc.gov/tobacco/data_statistics/fact_sheets/secondhand_smoke/general_facts/.
33. What are the key statistics about kidney cancer?. 2016; Available from: http://www.cancer.org/cancer/kidneycancer/detailedguide/kidney-
cancer-adult-key-statistics.34. Wong-Ho Chow, S.I., Linda M. Dong, postdoctoral fellow, and Susan S. Devesa,
contractor and former Senior Investigator, Epidemiology and risk factors for kidney cancer. Nat Rev Urol, 2010. 7(5): p. 245-257.
35. NIH. SEER Stat Fact Sheets: Bladder Cancer. 2015; Available from: http://seer.cancer.gov/statfacts/html/urinb.html.
49
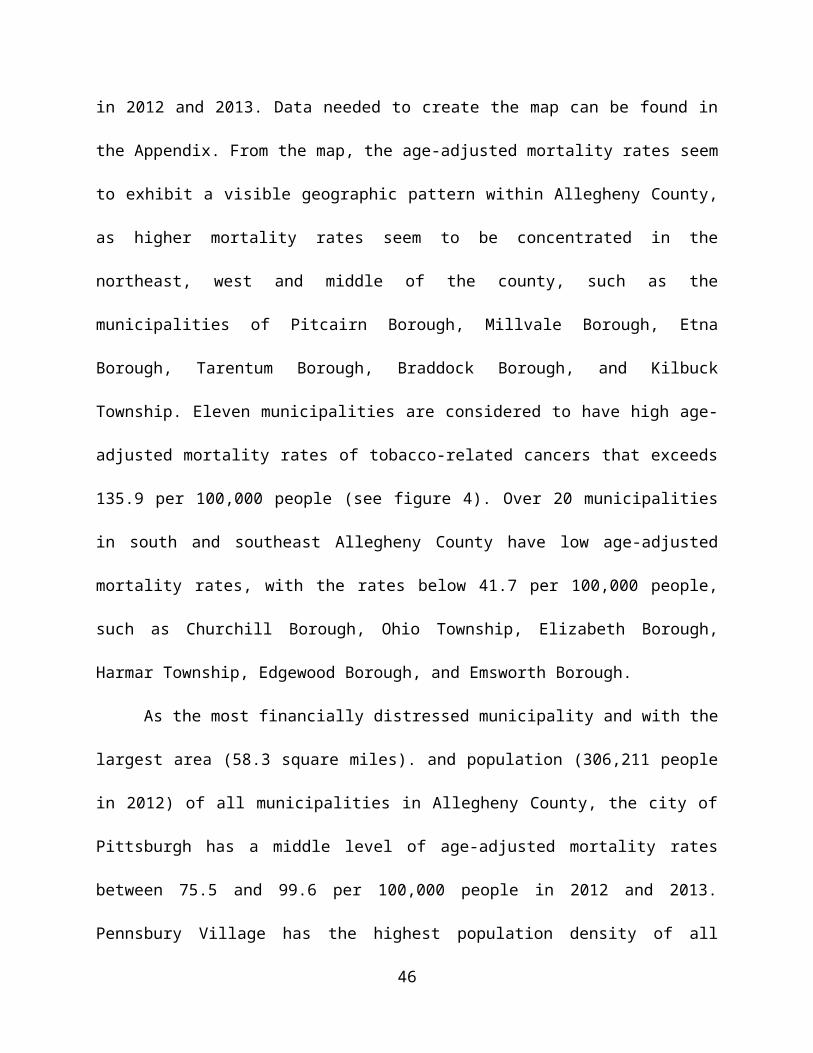
36. NIH. Smoking and Bladder Cancer. NIH Research Matters 2011; Available from: http://www.nih.gov/news-events/nih-research-matters/smoking-bladder-cancer.
37. CDC, Preliminary Data for 2010, in National Vital Statistics Reports. 2012.38. Kokenda, J.M., 2012 Allegheny County Mortality Report. 2015: Pittsburgh.39. Allegheny County Municipality Map. 2015; Available from:
http://apps.alleghenycounty.us/website/munimap.asp.40. CDC. Health Effects of Cigarette Smoking. 2016; Available from:
http://www.cdc.gov/tobacco/data_statistics/fact_sheets/health_effects/effects_cig_smoking/.
41. Economic Impact of Cancer. 2015; Available from: http://www.cancer.org/cancer/cancerbasics/economic-impact-of-cancer.
42. Michelle Kurta, L.T. 2015 COMMUNITY HEALTH ASSESSMENT. 2015; Available from: http://www.achd.net/cha/CHA_Report-Final_42815.pdf.
43. NIH. Tobacco-Related Cancers Fact Sheet. 2014; Available from: http://www.cancer.org/cancer/cancercauses/tobaccocancer/tobacco-related-cancer-fact-sheet.
44. CDC, Summary Health Statistics for the U.S. Population: National Health Interview Survey, 2011. 2012.
45. CDC, Preventing Initiation of Tobacco Use: Outcome Indicators for Comprehensive Tobacco Control Programs–2014. 2014, National Center for Chronic Disease Prevention and Health Promotion: Atlanta, Georgia.
46. NTCC Develops National Priorities, Strategic Plan. 2011; Available from: http://tobacco-cessation.org/news/news_apr09.htm.
47. CDC, Best Practices for Comprehensive Tobacco Control Programs. 2014.48. Plan for a Healthier Allegheny. 2015, Health Resources in Action.49. PA.GOV. Allegheny Quit for Life. 2015; Available from:
http://www.achd.net/chrond/pubs/pdf/111315_Tobacco_in_AlleCounty_2pg.pdf.50. CDC. Health. United States. 2008. 2009; Available from:
http://www.cdc.gov/nchs/data/hus/hus08.pdf.51. CDC, Morbidity and Mortality Weekly Report. 2014.52. CDC. Current Cigarette Smoking Among Adults in the United States. 2016; Available
from: http://www.cdc.gov/tobacco/data_statistics/fact_sheets/adult_data/cig_smoking/.53. Pebbles Fagan, G.K., Eliminating Tobacco-Related Health Disparities: Directions for
Future Research. Tobacco Cessation, 2004. 94(2): p. 211-217.54. Bach, L., Tobacco and Socioeconomic Status, in Campaign for Tobacco-Free Kids. 2015:
US.
50