invesco global equity income fund - particuliere belegger...
TRANSCRIPT
7542
/EH
/JB/I
GEI
Std
Bk/
May
16/
Invesco Global Equity Income Fund
May 2016
John BothamThis marketing document is for Professional Clients and Financial Advisers in Continental Europe, Qualified Investors in Switzerland and Professional Clients in the UK only and is not for consumer use.
Product Director

7542
/EH
/JB/I
GEI
Std
Bk/
May
16/
Contents
Our organisation
Invesco Global Equity Income Fund
Investment team and philosophy
The ‘MAPS’ investment framework
Risk management
Strategy performance
Strategy positioning
Appendix
2

7542
/EH
/JB/I
GEI
Std
Bk/
May
16/
Invesco Perpetual is part of Invesco, a global group dedicated solely to investment management Manages US$122.8bn*
3
Source: Invesco Ltd as at 31 March 2016.Investment Professionals includes CIO, Fund Managers, Analysts and Trainee Analysts, Multi Asset Product Directors and Fixed Income Dealers. Equities information includes Global, US, European, UK, Emerging Market, Asian and Japan equities teams. 1As at 31 December 2015. *Including retail, offshore and institutional assets. Years experience and tenure subject to rounding. The funds and strategies featured in this document are managed by the firm’s investment centre in Henley (UK), Invesco Perpetual. Invesco Perpetual is a business name of Invesco Asset Management Limited (IAML) and forms part of Invesco UK Limited, which itself forms part of Invesco.
Equities Fixed income Multi Asset
37 Investment Professionals
17 years avg. experience
10 years avg. with firm
AUM US$70.2bn
19 Investment Professionals
15 years avg. experience
9 years avg. with firm
AUM US$39.4bn
10 Investment Professionals
16 years avg. experience
3 year avg. with firm
AUM US$13.2bn
Invesco:
AUM US$775.6bn1
More than 750 investment professionals
On-the-ground presence in more than 20 countries
57%32%
11%
Equities Fixed income Multi-Asset
Henley Investment CentreInvesco Perpetual:

7542
/EH
/JB/I
GEI
Std
Bk/
May
16/
Invesco PerpetualBreadth of experience, depth of expertise, unique culture
4
Away from the ‘noise’
A world-class investment centre
Idea sharing, collaboration and debate
Long-term approach
66
Investment professionals*
40
Miles from the ‘noise’ of the City
28
Heads of team average years
experience16
Heads of team average years tenure
Asset class/
regional experts
InteractShare
Debate
IQ compounding
83%3 years
88%5 years
Percentage of asset weighted pooled vehicles outperforming
peers1
Breadth and depth of knowledge
Henley
Past performance is not a guide to future returns.Source: Invesco Perpetual as at 30 April 2016. *Investment Professionals includes CIO, Fund Managers, Analysts and Trainee Analysts, Multi Asset Product Directors and Fixed Income Dealers. Equities information includes Global, US, European, UK, Emerging Market, Asian and Japan equities teams. 1This makes use of the Investment Association (IA) peer ranking for each UK fund’s primary share class and the Morningstar peer ranking of the primary share class of Luxembourg and Ireland domiciled funds. Excludes fund-of-funds and passively managed products. May not sum due to rounding.
7542
/EH
/JB/I
GEI
Std
Bk/
May
16/
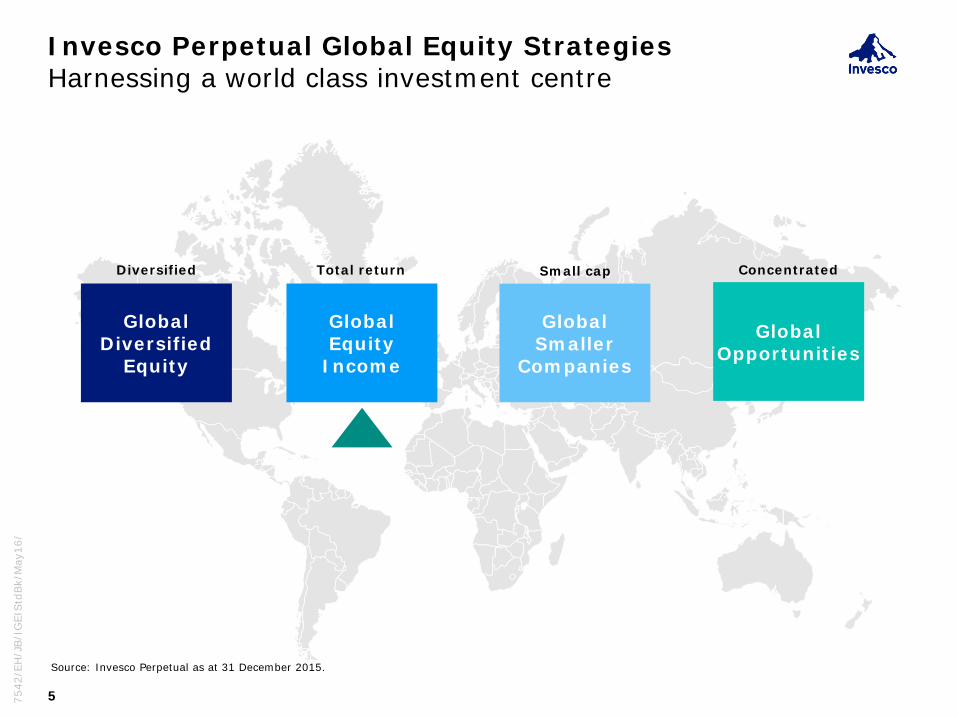
Invesco Perpetual Global Equity StrategiesHarnessing a world class investment centre
5
Source: Invesco Perpetual as at 31 December 2015.
Global Diversified
Equity
Global Equity
Income
Global Smaller
Companies
Global Opportunities
Diversified Total return Small cap Concentrated

Invesco Global Equity Income Fund

7542
/EH
/JB/I
GEI
Std
Bk/
May
16/
Invesco Global Equity Income FundInvestment proposition
7
Please note there is no guarantee the targets will be achieved.
“Our best ‘quality income’ ideas from around the world, in a diversified, globally integrated portfolio.”
Nick Mustoe and the Global Equity Income GroupInvestment team
We aim to deliver a portfolio of our best quality income ideas that:
Affords each stock the potential to contribute meaningful risk-adjusted returns
Is diversified by stock type, sector, region, and risk contribution
Provides a mix of sustainable and growing income, with capital growth
Delivers lower volatility than the market over the long-term
Invesco Perpetual Global Equity Income Group (GIG)

7542
/EH
/JB/I
GEI
Std
Bk/
May
16/
Invesco Global Equity Income FundKey differentiators
8
Source: Invesco Perpetual as at 31 March 2016. *Please see risk-return profile slide.
A world class investment centre Access to a unique investment environment and proven stock-picking capabilities.
An experienced and stable investment team Led by CIO Nick Mustoe, the team includes senior fund managers from Henley’s successful regional
equity desks.
A robust investment process, with repeatable idea generation Investment process efficiently captures the best regional ideas in a global valuation context.
A perspective advantage Deep regional knowledge, with a unique global perspective.
An attractive historic performance profile Attractive historic* long-term, risk-adjusted return, typically with lower volatility and better up/down
market capture than the market.

Investment team and philosophy

7542
/EH
/JB/I
GEI
Std
Bk/
May
16/
Invesco Perpetual Global Equity Income Group (GIG)Bringing together the best of Henley in a global portfolio
10
Source: Invesco Perpetual as at 31 March 2016. Years of experience are subject to rounding.
Martin WeissGlobal Equities Inv. Strategist
25 yearsexperience
Nick MustoeCIO/Lead Manager
31 years experience
Arwel GreenGlobal Equities Strategist
15 years experience
Global portfolio strategyTotal portfolio ownership/monitoring
John BothamGlobal Equities Product Director
23 years experience
Global product and business Client communication/business management management
David AujlaGlobal Equities Product Specialist
7 years experience
Stephanie ButcherEuropean Fund Manager
22 years experience
Simon ClinchUS Fund Manager
18 years experience
Tony RobertsJapanese Fund Manager
21 years experience
Mark BarnettHead of UKEquities
24 years experience
Tim DicksonAsian Fund Manager
23 years experience
Andrew HallGlobal Fund Manager
15 years experience
US Europe UK Japan Asia Global
Fund managersOriginal fundamental research & portfolio construction insight

7542
/EH
/JB/I
GEI
Std
Bk/
May
16/
Invesco Perpetual Global Equity Income GroupInvestment philosophy and approach
11
Investment philosophy:
Short-term market participants increasingly give rise to valuation anomalies. Dividends are a key component of equity market returns. Stock-specific factors are the primary driver of long-term returns.
Active
Unconstrained
Fundamental
Valuation
Long-term
Risk-focused
Delivering sustainable outperformance means differing from the market
Ability to invest across stock types, sectors, regions and styles
We believe original research is the key to identifying true intrinsic worth
We believe valuation is the key driver of long-term returns
Being prepared to wait is the key to sustainable value realisation
We view risk as permanent capital loss, but relative-risk is diversified
Investment approach:
Source: Invesco Perpetual as at 31 March 2016.

7542
/EH
/JB/I
GEI
Std
Bk/
May
16/
The types of stocksQuality income examples
12
Source: Invesco Perpetual as at 31 December 2015For illustrative purposes only. This must not be seen as investment advice. FCF = Free Cash Flow.
Sound fundamentalsGood management teams In our view, attractively valued
4.2% dividend yield
12.0% dividend CAGR since 1999
The market underestimates:
The magnitude and duration of FCF generation
The level of profits growth achievable despite falling volumes
3.0% dividend yield
14.7% dividend CAGR since 1995
The market underestimates:
The potential of existing products and the development pipeline
The continued secular growth opportunity for sector
2.9% dividend yield
11.9% dividend CAGR since 1995
The market underestimates:
The margin and growth potential in the existing businesses
Management’s track record of creating shareholder value
4.3% dividend yield
24.0% dividend CAGR forecast for next 3 yrs
The market underestimates:
Profits growth in the next 3 years due to cost cutting/streamlining
The decline in the cost of capital enjoyed by the company
The Global Equity Income Group looks to identify what it believes are undervalued companies, with high and sustainable dividends, or dividend growth potential
British multinational tobacco company
Swiss global health-care company
American multinational conglomerate
Dutch multinational banking and financial services corporation

7542
/EH
/JB/I
GEI
Std
Bk/
May
16/
How the Global Equity Income Group (GIG) worksContinuous management, with a robust investment platform
Led by Lead Manager, Nick Mustoe:
Market review Regional performance Macro backdrop Valuations
Portfolio review Performance attribution Sector/region/risk exposures Balance of relative risk
Existing stocks review Stock winners/losers Manager conviction check Forthcoming company meetings
New idea proposals Assessment of investment thesis Global perspective challenge Source of capital
Fortnightly GIG meeting
Investment Strategists Portfolio monitoring/implementation Regional manager dealing/conviction Intra-meeting GIG communication
CIO/Lead Manager Daily responsibility for the portfolio Harnesses views of Henley team Sets agenda for GIG meetings
Regional Fund Managers Ongoing fundamental stock research Regional stock dealing updates Recommendations for intra-meeting trading
Daily managementPortfolio
Source: Invesco Perpetual as at 31 March 2016. For illustrative purposes only.
13

The ‘MAPS’ investment framework

7542
/EH
/JB/I
GEI
Std
Bk/
May
16/
Investment process: The ‘MAPS’ frameworkMapping our best regional ideas in a global context
15
Source: Invesco Perpetual as at 31 March 2016. For illustrative purposes only.
M A P S
MANAGER ASSESSMENT PERSPECTIVE STRUCTURE
Conviction Valuation Diversification RiskContinuous monitoring
Globalportfolio
7542
/EH
/JB/I
GEI
Std
Bk/
May
16/
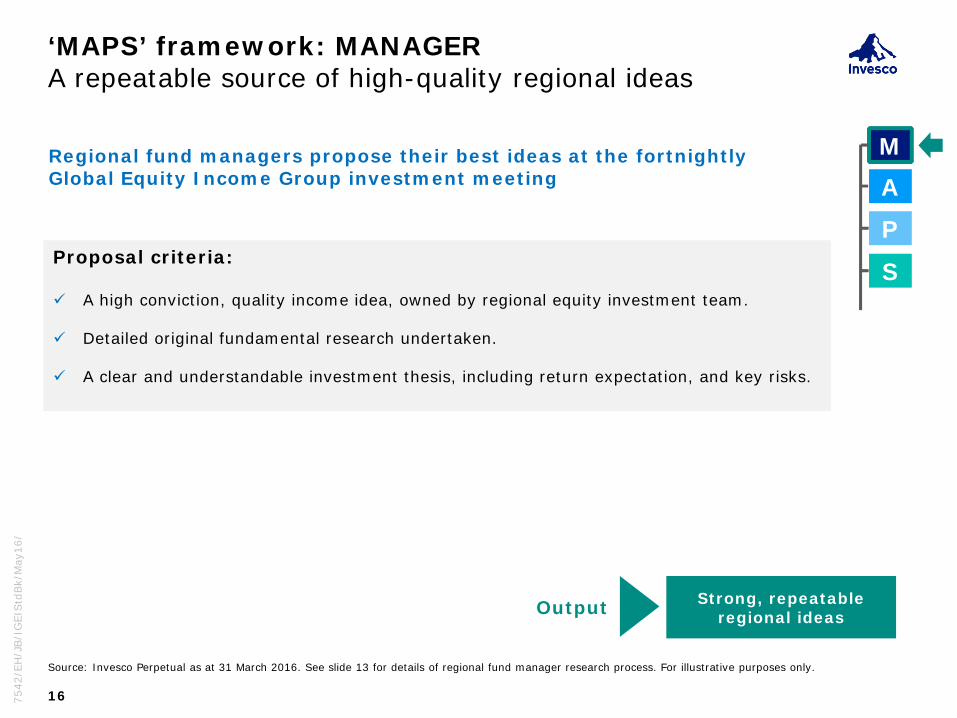
‘MAPS’ framework: MANAGERA repeatable source of high-quality regional ideas
16
Source: Invesco Perpetual as at 31 March 2016. See slide 13 for details of regional fund manager research process. For illustrative purposes only.
MA
P
SProposal criteria:
A high conviction, quality income idea, owned by regional equity investment team.
Detailed original fundamental research undertaken.
A clear and understandable investment thesis, including return expectation, and key risks.
Regional fund managers propose their best ideas at the fortnightly Global Equity Income Group investment meeting
Strong, repeatable regional ideasOutput

7542
/EH
/JB/I
GEI
Std
Bk/
May
16/
‘MAPS’ framework: ASSESSMENTUnderstanding the idea, and testing the investment thesis
17
Source: Invesco Perpetual as at 31 March 2016. For illustrative purposes only.
MA
P
S
Rigorously tested regional investment
ideas
The Global Equity Income Group rigorously tests and assesses the idea
Financials analysisAre revenues/margins sustainable?
How strong is the balance sheet?
Do we agree with assumptions?
Macro/industryWhat drives this business?
Position within the industry?
Impact of operating/economic environment?
ManagementHow well do we know them?
Alignment of interests?
Strategy/capital allocation discipline?
ValuationAttractively valued, or value trap?
What is the market missing?
What is the true intrinsic value?
Investment thesisWhat are the drivers of expected upside?
Confidence in return drivers?
RisksWhat are the key risks to the thesis?
Potential downside?
Output

7542
/EH
/JB/I
GEI
Std
Bk/
May
16/
‘MAPS’ framework: PERSPECTIVEDeploying our unique global perspective advantage
18
Source: Invesco Perpetual as at 31 March 2016. For illustrative purposes only.
MA
P
S
Our best ‘truly global’ investment ideas
The Global Equity Income Group determines whether ideas are truly attractive, on a global basis
Valuation
Valuation relative to its regional peers?Valuation relative to its global peers?
Opportunity cost
What are the global alternatives?Is there a more attractive idea elsewhere?
Source of capital
More attractive than existing ideas?
Output
The Global Equity Income Group is compensated at the total portfolio level.
Fund manager interests are aligned with choosing the best global ideas.

7542
/EH
/JB/I
GEI
Std
Bk/
May
16/
‘MAPS’ framework: STRUCTUREBuilding diversified, risk-adjusted return potential
19
Source: Invesco Perpetual as at 31 March 2016. For illustrative purposes only. *TE = Tracking Error. For the full objectives and investment policy please consult the current prospectus.
Typical portfolio parameters
Stocks Minimum size: 0.5% at entry Maximum size: 2.5% at entry (5% overall) Maximum 15% of total stock level TE*
Market capitalisation Maximum 20% of portfolio <US$10bn
Sectors Minimum of 7 GICS sectors Maximum of 2.5x GICS sector weight
Geographical exposures Developed markets focused US: 0% - 75% Europe ex. UK: 0% - 50% UK: 0% - 30% Japan: 0% - 30% Asia ex Japan: 0% - 30%
Cash levels Fully invested: Typically less than 3%
MA
P
S
Position sizing criteria:
Stock specific:
Upside Risk Strength of conviction Level of liquidity
Portfolio considerations:
Total portfolio yield Diversification potential Relative-risk contribution
A diversified portfolio of our best global
valuation opportunities Output
Bottom-up construction, driven by conviction and risk/return potential

7542
/EH
/JB/I
GEI
Std
Bk/
May
16/
Portfolio monitoringContinuous investment team oversight
20
Source: Invesco Perpetual as at 31 March 2016. For illustrative purposes only.
Globally diversifiedportfolio
50-70 holdingsActive share >90%
Low turnoverLiquid
Portfolio monitoring/implementation
Regional manager dealing/conviction
Intra-meeting GIG communication
Daily responsibility for the portfolio Harnesses views of Henley team Sets agenda for GIG meetings
Ongoing fundamental stock research
Regional stock dealing updates
Recommendations for intra-meeting trading
CIO/Lead Manager
Investment Strategists Regional Fund Managers

Risk management

7542
/EH
/JB/I
GEI
Std
Bk/
May
16/
Risk managementA robust framework, with independent oversight
22
Source: Invesco Perpetual as at 31 March 2016. For illustrative purposes only.
Investment Oversight Governance of the portfolio Oversight of the investment process
Global Equity Income Group Stock level risk management Portfolio level risk management
Independent Risk Function/GPMR Independent risk analysis Independent risk challenge
A robust framework, from investment team to independent risk management
7542
/EH
/JB/I
GEI
Std
Bk/
May
16/
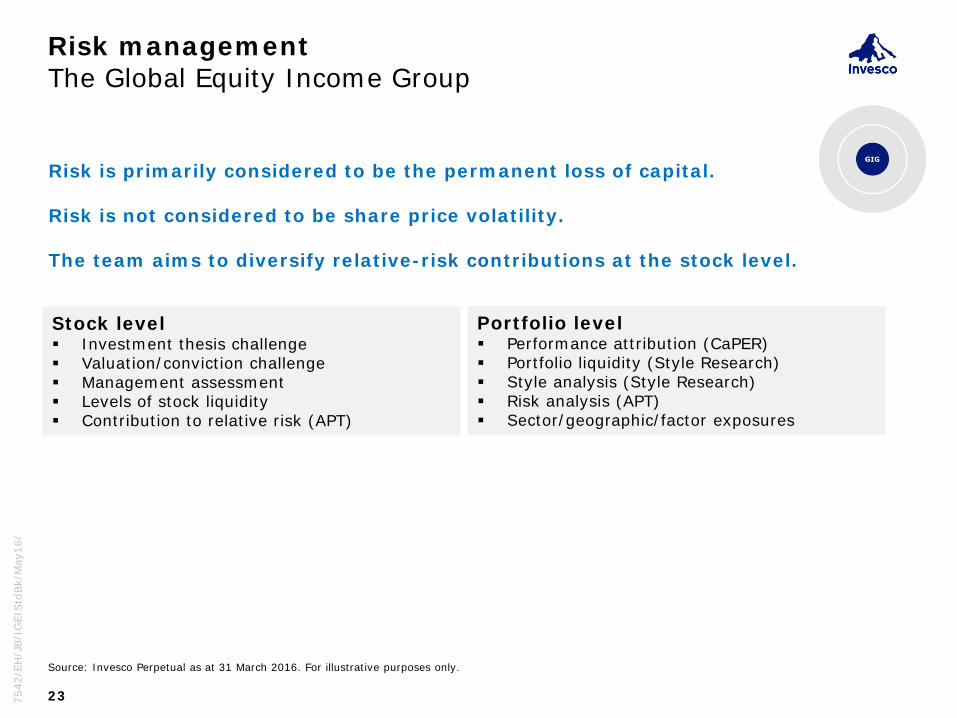
Risk managementThe Global Equity Income Group
23
Source: Invesco Perpetual as at 31 March 2016. For illustrative purposes only.
Stock level Investment thesis challenge Valuation/conviction challenge Management assessment Levels of stock liquidity Contribution to relative risk (APT)
Risk is primarily considered to be the permanent loss of capital.
Risk is not considered to be share price volatility.
The team aims to diversify relative-risk contributions at the stock level.
Portfolio level Performance attribution (CaPER) Portfolio liquidity (Style Research) Style analysis (Style Research) Risk analysis (APT) Sector/geographic/factor exposures

7542
/EH
/JB/I
GEI
Std
Bk/
May
16/
Risk managementInvestment oversight
24
Source: Invesco Perpetual as at 31 March 2016. For illustrative purposes only.
Performance
Attribution/contribution
Assets/flows/liquidity
Risk
Style attributes
Active positioning
Transaction analysis
Stock analysis
Key questions
Are portfolios being managed in line with the stated investment philosophy/approach?
Are fund managers acting in a way that adds value for clients?
Are the risks taken on behalf of clients understood and appropriate?
Is the investment process robust?
Key considerations
7542
/EH
/JB/I
GEI
Std
Bk/
May
16/
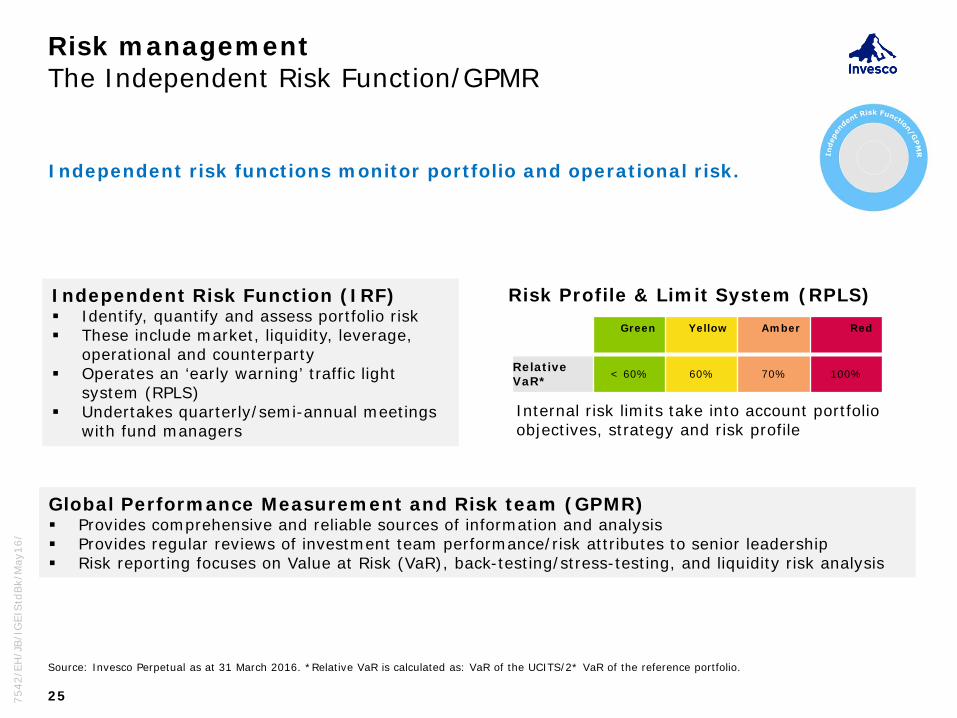
Risk managementThe Independent Risk Function/GPMR
Source: Invesco Perpetual as at 31 March 2016. *Relative VaR is calculated as: VaR of the UCITS/2* VaR of the reference portfolio.
Independent risk functions monitor portfolio and operational risk.
Independent Risk Function (IRF) Identify, quantify and assess portfolio risk These include market, liquidity, leverage,
operational and counterparty Operates an ‘early warning’ traffic light
system (RPLS) Undertakes quarterly/semi-annual meetings
with fund managers
Global Performance Measurement and Risk team (GPMR) Provides comprehensive and reliable sources of information and analysis Provides regular reviews of investment team performance/risk attributes to senior leadership Risk reporting focuses on Value at Risk (VaR), back-testing/stress-testing, and liquidity risk analysis
Green Yellow Amber Red
Relative VaR* < 60% 60% 70% 100%
Risk Profile & Limit System (RPLS)
Internal risk limits take into account portfolio objectives, strategy and risk profile
25

7542
/EH
/JB/I
GEI
Std
Bk/
May
16/
34.0028.23
25.39
4.35 3.78 2.26
17.26
62.66
7.212.74 1.74
8.40
0
10
20
30
40
50
60
70
Europe ex. UK North America United Kingdom Australasia Pacific Rim* Japan
Invesco Global Equity Income Fund MSCI World Index
Portfolio breakdown (%)
Invesco Global Equity Income FundRegional weightings
26
Source: Invesco Perpetual as at 31 March 2016. *Pacific Rim = Hong Kong and Singapore. Holdings may change without notice.

7542
/EH
/JB/I
GEI
Std
Bk/
May
16/
Invesco Global Equity Income FundTop ten holdings
27
Source: Invesco Perpetual & Bloomberg as at 31 March 2016.1Last 12 month dividend yield. As at 10 May 20162Based on Bloomberg projected compound annual growth rate of dividend over three years. As at 10 May 2016. This is not financial advice and no recommendation to buy / hold / sell these securities. There is no guarantee that Invesco will hold these securities in its funds in the future. Holdings may change without notice.
Stocks Portfolio weight (%) Dividend yield1 (%) 3 year dividend CAGR2 (%)
British American Tobacco 3.3 3.6 6.3
BT 3.2 2.9 11.3
Philip Morris International 3.0 4.0 7.8
JP Morgan Chase 2.9 2.9 10.9
Chevron 2.8 4.3 0.7
Microsoft 2.8 2.7 9.3
Legal & General 2.7 6.1 10.0
Novartis 2.7 3.7 9.0
RELX (Investments) 2.6 2.4 4.4
Nielsen 2.6 2.2 13.6
MSCI World index 2.7 6.0

7542
/EH
/JB/I
GEI
Std
Bk/
May
16/
Invesco Global Equity Income Fund Sector weightings
28
Source: Invesco Perpetual as at 31 March 2016. Holdings may change without notice. It must not be seen as investment advice.
Sector Portfolio (%) Active weight (%) MSCI World (%) Sector yield (%)
Financials 27.94 19.57 3.1
Industrials 16.10 10.97 2.3
Energy 11.05 6.36 4.4
Telecoms 5.36 3.65 4.4
Utilities 2.00 3.49 3.8
Materials 2.91 4.60 2.9
Health Care 9.98 12.74 1.8
Consumer Staples 7.66 10.94 2.6
Consumer Discretionary 9.17 13.27 1.7
IT 5.85 14.41 1.4
8.37
5.12
4.68
1.71
-1.49
-1.70
-2.76
-3.28
-4.10
-8.56

Fund performance

7542
/EH
/JB/I
GEI
Std
Bk/
May
16/
Invesco Global Equity Income FundNet performance
30
The data relates to a past period and past returns are not a guarantee of future returns.Source: Morningstar © 2016 as at 31 March 2016. Fund and sector performance figures are shown for the A share class in USD on a mid-to-mid basis, inclusive of gross reinvested income and net of ongoing charges and portfolio transaction costs. The figures do not reflect the entry charge paid by individual investors. Benchmark source: Invesco, net return, in USD. Invesco has managed the fund since 5 July 2010. Exchange rate fluctuations may impact negatively the value of the investment.
Calendar year returns USD (%) 2010 2011 2012 2013 2014 2015
Invesco Global Equity Income Fund A Acc. USD 9.29 4.90 15.07 28.89 -0.84 -0.29
MSCI World index 11.76 -5.54 15.83 26.68 4.94 -0.87
GIF OS Global Equity Income Sector - Quartile 2 1 2 1 4 1
Cumulative returns USD (%) YTD 1 year 2 years 3 years 5 years
Invesco Global Equity Income Fund A Acc. USD -2.75 -5.47 -5.50 13.70 41.39
MSCI World index -0.35 -3.45 2.37 21.89 37.09
GIF OS Global Equity Income Sector -Quartile 4 3 3 2 1
7542
/EH
/JB/I
GEI
Std
Bk/
May
16/
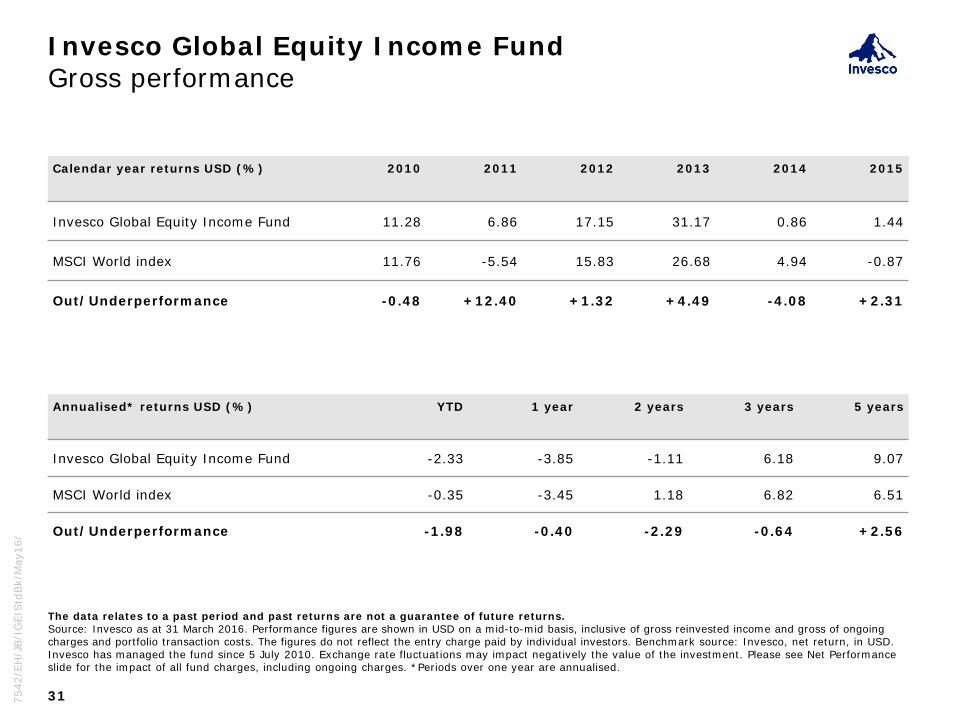
Invesco Global Equity Income FundGross performance
31
The data relates to a past period and past returns are not a guarantee of future returns.Source: Invesco as at 31 March 2016. Performance figures are shown in USD on a mid-to-mid basis, inclusive of gross reinvested income and gross of ongoing charges and portfolio transaction costs. The figures do not reflect the entry charge paid by individual investors. Benchmark source: Invesco, net return, in USD. Invesco has managed the fund since 5 July 2010. Exchange rate fluctuations may impact negatively the value of the investment. Please see Net Performance slide for the impact of all fund charges, including ongoing charges. *Periods over one year are annualised.
Calendar year returns USD (%) 2010 2011 2012 2013 2014 2015
Invesco Global Equity Income Fund 11.28 6.86 17.15 31.17 0.86 1.44
MSCI World index 11.76 -5.54 15.83 26.68 4.94 -0.87
Out/Underperformance -0.48 +12.40 +1.32 +4.49 -4.08 +2.31
Annualised* returns USD (%) YTD 1 year 2 years 3 years 5 years
Invesco Global Equity Income Fund -2.33 -3.85 -1.11 6.18 9.07
MSCI World index -0.35 -3.45 1.18 6.82 6.51
Out/Underperformance -1.98 -0.40 -2.29 -0.64 +2.56

7542
/EH
/JB/I
GEI
Std
Bk/
May
16/
Invesco Global Equity Income FundAn attractive risk-return profile
32
The data relates to a past period and past returns are not a guarantee of future returns.Source: Morningstar © 2016 as at 31 March 2016. Performance figures are provided for the A share class of the Invesco Global Equity Income Fund and are shown in USD on a mid-to-mid basis, inclusive of net reinvested income and net of ongoing charges and portfolio transaction costs. The figures do not reflect the entry charge paid by individual investors. Exchange rate fluctuations may impact negatively the value of the investment.
0.0
0.5
1.0
1.5
2.0
2.5
3.0
3.5
4.0
4.5
5.0
10 11 12 13 14
An
nu
alis
ed r
etu
rn
Annualised risk
Invesco Global Equity Income Fund
Global Equity Income sector
Higher riskHigher return
Higher riskLower return
Lower risk Higher return
Lower riskLower return
Risk versus return (%)3 years to 31 March 2016
7542
/EH
/JB/I
GEI
Std
Bk/
May
16/
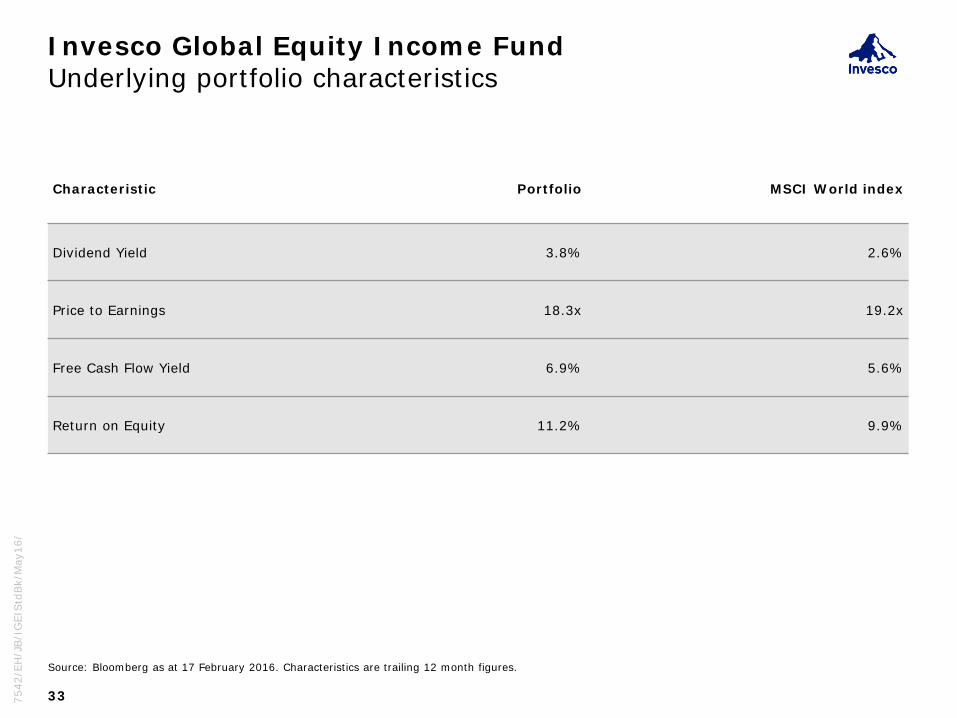
Invesco Global Equity Income FundUnderlying portfolio characteristics
33
Source: Bloomberg as at 17 February 2016. Characteristics are trailing 12 month figures.
Characteristic Portfolio MSCI World index
Dividend Yield 3.8% 2.6%
Price to Earnings 18.3x 19.2x
Free Cash Flow Yield 6.9% 5.6%
Return on Equity 11.2% 9.9%

Appendix

7014
/EH
/JB/I
PGEI
/Apr
16/U
K#
Invesco Global Equity Income FundProduct overview
35
Investment objective Aims to generate a rising level of income, together with long-term capital growth, investing primarily in global equities
Investment team Nick Mustoe (lead) and Invesco Perpetual Global Equity Income Group
Investment approach Unconstrained, style-agnostic, valuation-driven, low turnover
Strategy assets US$2.3 billion
Dividend yield 3.7%
No. of stocks 50-70
Benchmark MSCI World index ND
Active share* 91%
Market capitalisation Multi-cap.
Tracking error c.2-7% (3 years annualised)
Portfolio turnover c.25% p.a. (4 year average holding period)
Fund domicile Luxemburg
Source: Invesco Perpetual as at 31 March 2016. *Versus MSCI World index. Active share defined as sum of the fund’s equity positions less index weightings. For the full objectives and investment policy please consult the current prospectus.
7542
/EH
/JB/I
GEI
Std
Bk/
May
16/
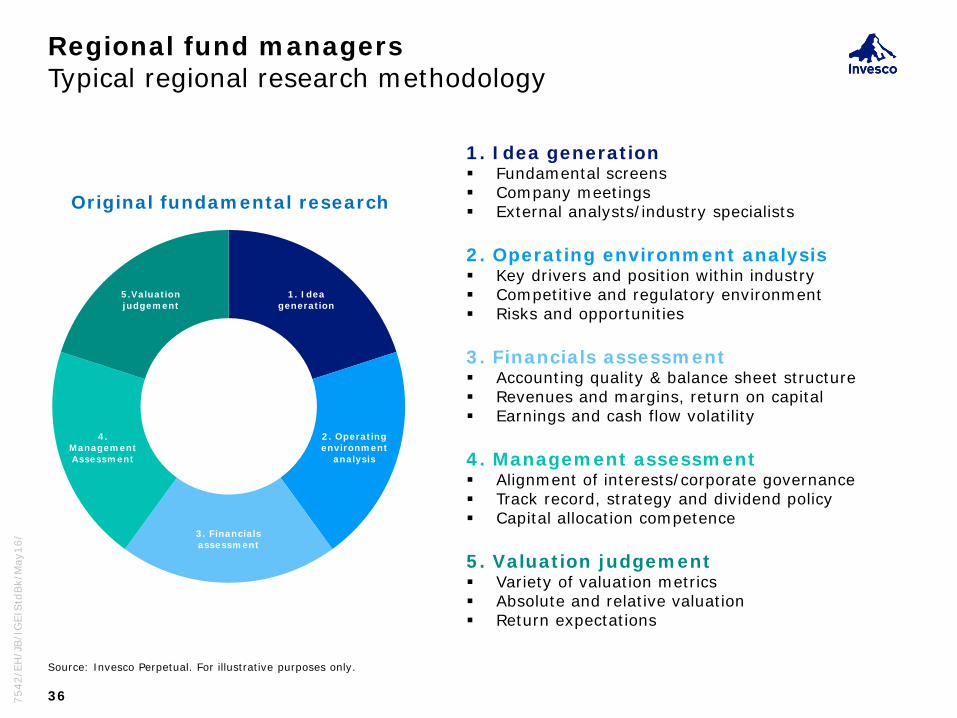
Regional fund managersTypical regional research methodology
36
1. Idea generation
2. Operating environment
analysis
3. Financials assessment
4. Management Assessment
5.Valuation judgement
1. Idea generation Fundamental screens Company meetings External analysts/industry specialists
2. Operating environment analysis Key drivers and position within industry Competitive and regulatory environment Risks and opportunities
3. Financials assessment Accounting quality & balance sheet structure Revenues and margins, return on capital Earnings and cash flow volatility
4. Management assessment Alignment of interests/corporate governance Track record, strategy and dividend policy Capital allocation competence
5. Valuation judgement Variety of valuation metrics Absolute and relative valuation Return expectations
Original fundamental research
Source: Invesco Perpetual. For illustrative purposes only.

7542
/EH
/JB/I
GEI
Std
Bk/
May
16/
ValuationOne size does not fit all
37
Stability of earnings
Ass
et i
nte
nsi
ty
SemiconductorsBasic MaterialsEnergyIndustrialsFinancialsAutosRetail
UtilitiesTelecom ServicesInfrastructure
Health CareConsumer Staples
Consumer ServicesIT HardwareMediaIT Software
Stability of earnings
Ass
et i
nte
nsi
ty
P/B vs ROE MarginEV/Sales vs EBIT MarginDividend Yield
P/B vs ROE MarginEV/EBITDAFCF Yield
FCF YieldDividend Yield
EV/EBITDAEV/Sales vs EBITMarginFCF Yield
Industry groups Valuation tools
A pragmatic approach, based on company and industry-specific factors.
Source: Invesco Perpetual. For illustrative purposes only.

7542
/EH
/JB/I
GEI
Std
Bk/
May
16/
Invesco Global Equity Income FundHistorical portfolio characteristics
38
Source: Top chart: Invesco as at 31 March 2016. Portfolio Turnover calculated using in-house method: {[(Purchases of securities + sales of securities) -(subscriptions of shares + redemption of shares)] / (NAV at start of period + NAV at end of period)} x 100%. Active share measured against MSCI World index.Bottom chart: Style Research as at 31 March 2016.
-30-20-10
0102030405060708090
100
Mar 11 Mar 12 Mar 13 Mar 14 Mar 15 Mar 16
Active share and annual portfolio turnover (%) Invesco Global Equity Income Fund: Monthly calculations
-1.5
-1.0
-0.5
0.0
0.5
1.0
1.5
2.0
2.5
Value Growth Market cap
Current Median
Port
folio
Tilt
Rel
ativ
e to
M
SCI
Wor
ld I
ndex
Style and market capitalisation tiltsInvesco Global Equity Income Fund: Minimum/Maximum range, median and current values: 5 years to 31 March 2016
High active share
Low portfolio turnover

7542
/EH
/JB/I
GEI
Std
Bk/
May
16/
Invesco Global Equity Income Fund: portfolio level riskLiquidity analysis (Style Research)
39
Source: Invesco Perpetual as at 31 March 2016. *Assumes daily tradable volume of 25%. Benchmark is MSCI World index.
0
20
40
60
80
100
0.1 0.2 0.3 0.4 0.5 1 2 3 4 5 10Pos
itio
ns
elim
inat
ed (
%)
DaysTrade to cash Trade to benchmark
At current portfolio size*
0
20
40
60
80
100
0.1 0.2 0.3 0.4 0.5 1 2 3 4 5 10Pos
itio
ns
elim
inat
ed (
%)
DaysTrade to cash Trade to benchmark
At USD10 billion portfolio size*
7542
/EH
/JB/I
GEI
Std
Bk/
May
16/
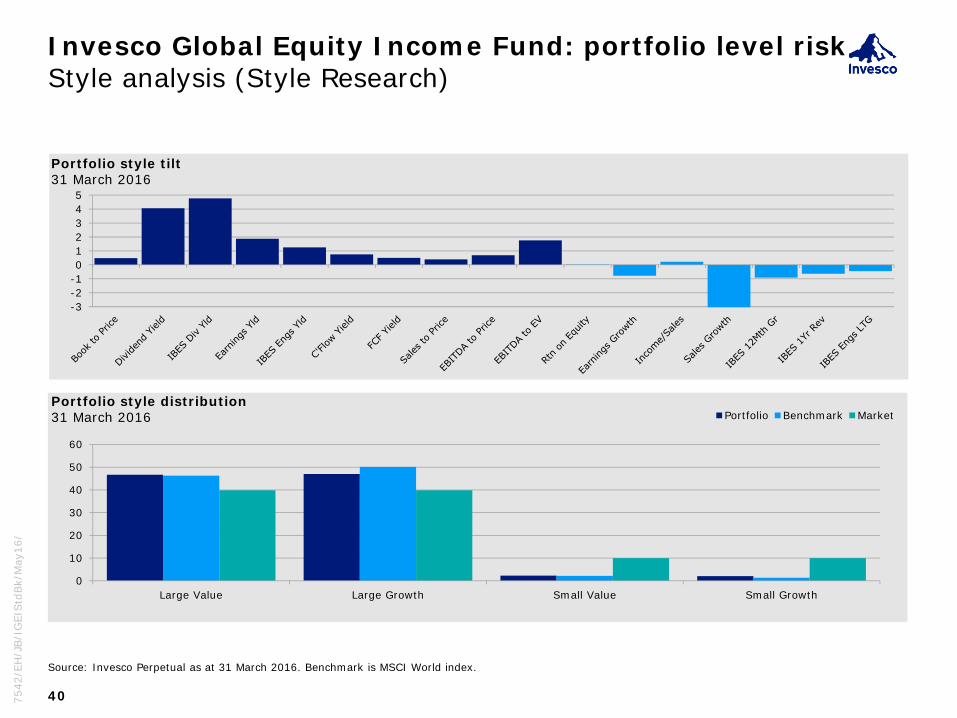
Invesco Global Equity Income Fund: portfolio level riskStyle analysis (Style Research)
40
Source: Invesco Perpetual as at 31 March 2016. Benchmark is MSCI World index.
-3-2-1012345
Portfolio style tilt31 March 2016
0
10
20
30
40
50
60
Large Value Large Growth Small Value Small Growth
Portfolio Benchmark MarketPortfolio style distribution31 March 2016

7542
/EH
/JB/I
GEI
Std
Bk/
May
16/
Invesco Global Equity Income Fund: portfolio level risk Relative risk analysis (APT)
Stock
Portfolio weight
(%)
Contribution to total volatility
(%)
Contribution to total TE
(%)
Total 100.00 11.45 4.09
Intesa Sanpaolo 2.81 5.26 0.38
Nielsen 2.35 1.05 0.32
ING Groep 2.62 5.11 0.29
BT Group 3.35 2.80 0.20
Airbus 2.35 3.08 0.18
Legal & General 2.96 3.84 0.17
Nordea Bank 2.15 3.04 0.16
CK Holdings 1.17 2.60 0.14
Deutsche Boerse 2.25 2.74 0.14
Orange 2.01 2.48 0.13
Source: APT as at 31 December 2015. Contribution figures are estimates and should be used for indicative purposes only. Data cleansing and retrospective information availability may cause changes. Benchmark is MSCI World index Portfolio characteristics are subject to change and current holdings may differ. There is no guarantee that securities are currently held or will be held by Invesco in the future nor a recommendation to buy/sell/hold the securities. It must not be seen as investment advice.
SectorAllocation contribution to total TE
(%)Selection contribution to total TE
(%)Combined contribution to total TE
(%)
Total 0.28 3.65 3.93
Financials 0.08% 1.25% 1.33%Cyclical Services 0.01% 0.55% 0.56%Non-Cyclical Services 0.01% 0.36% 0.37%Non-Cyclical Consumer Goods 0.01% 0.35% 0.36%Resources 0.06% 0.27% 0.33%Information Technology 0.09% 0.11% 0.21%General Industrials 0.00% 0.20% 0.20%Utilities 0.02% 0.08% 0.10%Basic Industries -0.06% 0.07% 0.01%Currencies 0.00% 0.00% 0.00%
Country
Activeweight
(%)
Contribution to total volatility
(%)
Contribution to total TE
(%)
Total 0.00 11.75 3.93
United States -29.50 3.27 0.99
United Kingdom 14.37 2.31 0.74
Netherlands 5.09 0.97 0.40
Italy 1.64 0.49 0.28
France 2.91 0.97 0.27
Switzerland 4.08 0.70 0.21
Germany 2.71 0.87 0.20
Norway 1.74 0.25 0.11
Japan -6.48 0.26 0.10
Luxembourg 1.76 0.16 0.10
41

7542
/EH
/JB/I
GEI
Std
Bk/
May
16/
Important information (1)
This marketing document is for Professional Clients and Financial Advisers in Continental Europe, Qualified Investors in Switzerland and Professional Clients in the UK only and is not for consumer use. Data as at 31 March 2016 unless otherwise stated. Please do not redistribute this document. This marketing document is not subject to German regulatory requirements that ensure impartiality of financial analysis. Therefore, the prohibition of trading before the release of a financial analysis does not apply.
The value of investments and any income will fluctuate (this may partly be the result of exchange rate fluctuations) and investors may not get back the full amount invested.
Whilst great care has been taken to ensure that the information contained herein is accurate, no responsibility can be accepted for any errors, mistakes or omissions or for any action taken in reliance thereon. Where Invesco has expressed views and opinions, these may change.
This document is not an invitation to subscribe for shares in the fund and is by way of information only. Where securities are mentioned in this document they do not necessarily represent a specific portfolio holding and do not constitute a recommendation to purchase or sell. It is not investment advice for buying/holding/selling shares of mentioned companies. This document contains general information only and does not take into account individual objectives, taxation position or financial needs. Neither does this constitute a recommendation of the suitability of any investment strategy for a particular investor. The performance data shown does not take account of the commissions and costs incurred on the issue and redemption of units. Any reference to a ranking, a rating or an award provides no guarantee for future performance results and is not constant over time. Asset management services are provided by Invesco in accordance with appropriate local legislation and regulations.
Past performance is not an indication for future performance, provides no guarantee for the future and is not constant over time. Any
reference to a ranking, a rating or an award provides no guarantee for future performance results and is not constant over time.
The distribution and the offering of the fund in certain jurisdictions may be restricted by law. Persons into whose possession this document may come are required to inform themselves about and to comply with any relevant restrictions. This does not constitute an offer or solicitation by anyone in any jurisdiction in which such an offer is not authorised or to any person to whom it is unlawful to make such an offer or solicitation.
Persons interested in acquiring the fund should inform themselves as to (i) the legal requirements in the countries of their nationality, residence, ordinary residence or domicile; (ii) any foreign exchange controls and (iii) any relevant tax consequences. The fund is available only in jurisdictions where its promotion and sale is permitted.
For the purposes of UK law, the fund is a recognised scheme under section 264 of the Financial Services & Markets Act 2000. The protections provided by the UK regulatory system, for the protection of Retail Clients, do not apply to offshore investments.
Not all share classes of this fund are available for public sale in all jurisdictions and not all share classes are the same nor do they necessarily suit every investor. There may be differences in fee structures, in minimum investment amounts, etc. Please check the most recent version of the fund prospectus in relation to the criteria for the individual share classes and contact your local Invesco office for full details of the fund registration status in your jurisdiction. Please be advised that the information provided in this document is referring to Class A (accumulation- USD) of the Invesco Global Equity Income Fund exclusively.
Further information on our products is available using the contact details shown.
42

7542
/EH
/JB/I
GEI
Std
Bk/
May
16/
Important information (2)
Denmark: The fund is not registered for public distribution in these jurisdictions. This document is provided only at the request of a Professional Client or qualified investor and is intended for the sole use of this person.
Germany, Austria and Switzerland: This document is issued in Germany by Invesco Asset Management Deutschland GmbH. This document is issued in Austria by Invesco Asset Management ÖsterreichGmbH and in Switzerland by Invesco Asset Management (Schweiz) AG. Subscriptions of shares are only accepted on the basis of the most up to date legal offering documents. The legal offering documents (fund & share class specific Key Investor Information Document, prospectus, annual & semi-annual reports, articles and trustee deed) are available free of charge at our website and in hardcopy and local language from the issuers: Invesco Asset Management Deutschland GmbH, An der Welle 5, D-60322 Frankfurt am Main, Invesco Asset Management Österreich GmbH, Rotenturmstrasse 16-18, A-1010 Wien, and Invesco Asset Management (Schweiz) AG, Talacker 34, CH-8001 Zürich, who acts as a representative for the funds distributed in Switzerland. Paying agent for the fund distributed in Switzerland: BNP PARIBAS SECURITIES SERVICES, Paris, succursale de Zurich, Selnaustrasse 16, CH-8002 Zürich. www.invescoeurope.com. The Fund is domiciled in Luxembourg. Issued in the UK by Invesco Global Investment Funds Limited, Perpetual Park, Perpetual Park Drive, Henley-on-Thames, Oxon, RG9 1HH, UK. Authorised and regulated by the Financial Conduct Authority.
43