invest malaysia 2018 - maybank.com€¦ · market services for corporate ... • awarded best sme...
TRANSCRIPT
0www.maybank.com
Invest Malaysia 2018
Shangri-La Hotel, Kuala Lumpur
23-24 January 2018
Humanising Financial Services
1
Table of Contents
Maybank Overview: Strategy and Performance 2
Appendix:
1. Financial Performance 19
2. Community Financial Services 45
3. Global Banking 49
4. Maybank Singapore 53
5. Maybank Indonesia 56
6. Other segments 60
7. Affiliates 65
2
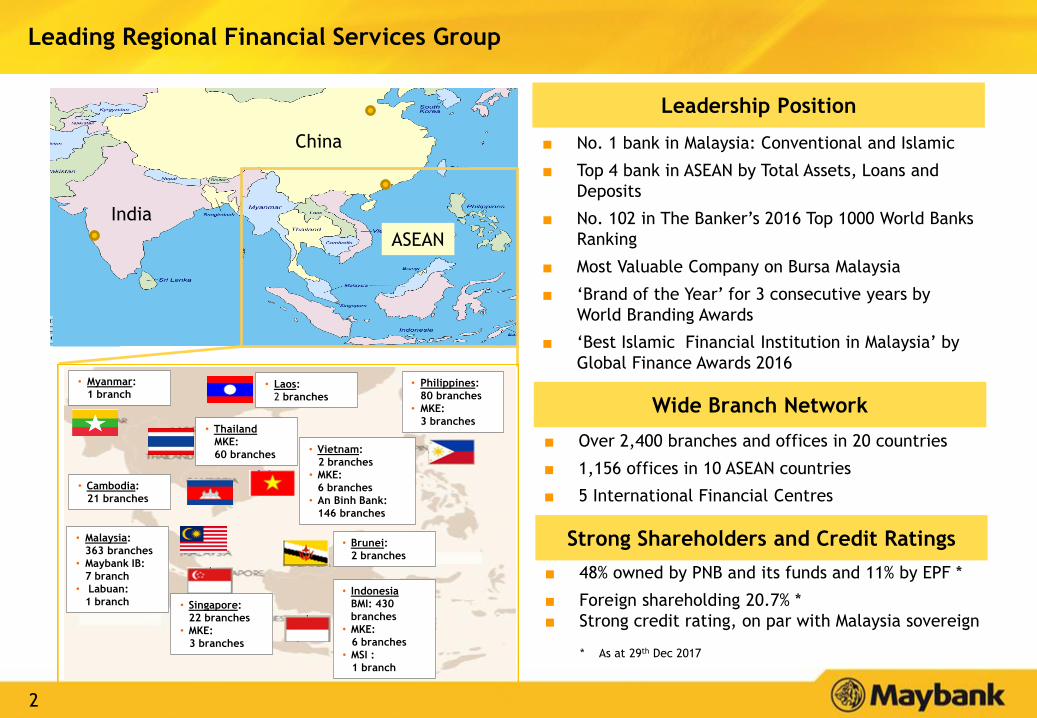
Leading Regional Financial Services Group
■ No. 1 bank in Malaysia: Conventional and Islamic
■ Top 4 bank in ASEAN by Total Assets, Loans and
Deposits
■ No. 102 in The Banker’s 2016 Top 1000 World Banks
Ranking
■ Most Valuable Company on Bursa Malaysia
■ ‘Brand of the Year’ for 3 consecutive years by
World Branding Awards
■ ‘Best Islamic Financial Institution in Malaysia’ by
Global Finance Awards 2016
■ Over 2,400 branches and offices in 20 countries
■ 1,156 offices in 10 ASEAN countries
■ 5 International Financial Centres
■ 48% owned by PNB and its funds and 11% by EPF *
■ Foreign shareholding 20.7% *
■ Strong credit rating, on par with Malaysia sovereign
Wide Branch Network
Leadership Position
Strong Shareholders and Credit Ratings
* As at 29th Dec 2017
China
India
ASEAN
• Myanmar:
1 branch• Laos:
2 branches
• Thailand
MKE:
60 branches
• Philippines:
80 branches
• MKE:
3 branches
• Cambodia:
21 branches
• Vietnam:
2 branches
• MKE:
6 branches
• An Binh Bank:
146 branches
• Malaysia:
363 branches
• Maybank IB:
7 branch
• Labuan:
1 branch • Singapore:
22 branches
• MKE:
3 branches
• Indonesia
BMI: 430
branches
• MKE:
6 branches
• MSI :
1 branch
• Brunei:
2 branches
3
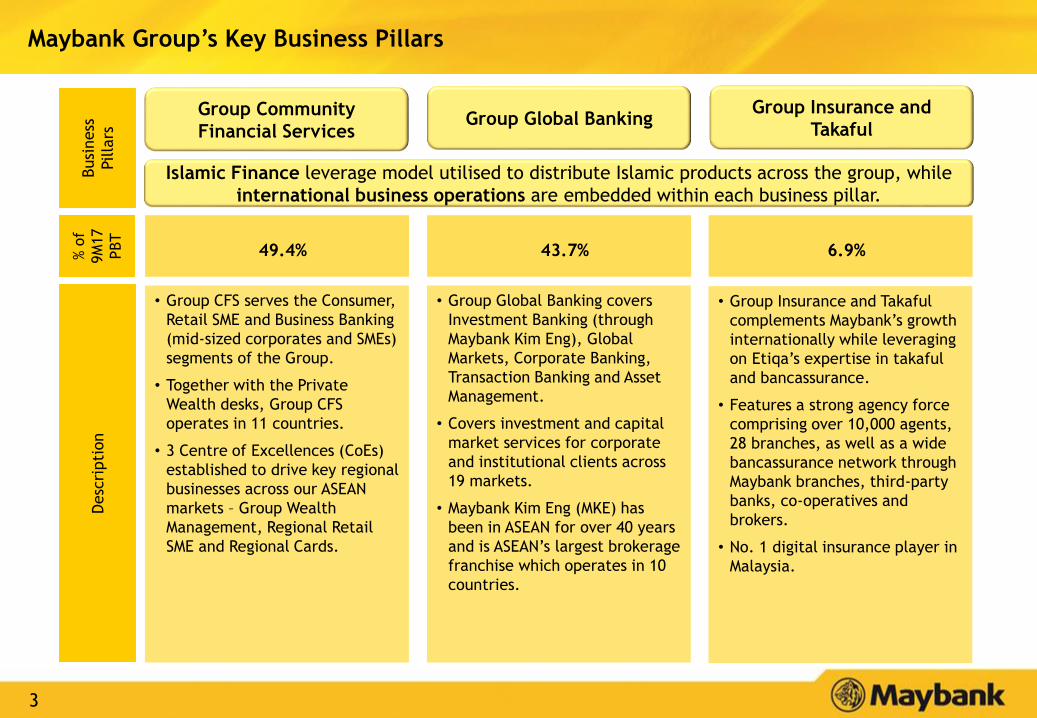
Maybank Group’s Key Business Pillars
Group Community
Financial Services
Busi
ness
Pilla
rs
• Group CFS serves the Consumer,
Retail SME and Business Banking
(mid-sized corporates and SMEs)
segments of the Group.
• Together with the Private
Wealth desks, Group CFS
operates in 11 countries.
• 3 Centre of Excellences (CoEs)
established to drive key regional
businesses across our ASEAN
markets – Group Wealth
Management, Regional Retail
SME and Regional Cards.
• Group Insurance and Takaful
complements Maybank’s growth
internationally while leveraging
on Etiqa’s expertise in takaful
and bancassurance.
• Features a strong agency force
comprising over 10,000 agents,
28 branches, as well as a wide
bancassurance network through
Maybank branches, third-party
banks, co-operatives and
brokers.
• No. 1 digital insurance player in
Malaysia.
• Group Global Banking covers
Investment Banking (through
Maybank Kim Eng), Global
Markets, Corporate Banking,
Transaction Banking and Asset
Management.
• Covers investment and capital
market services for corporate
and institutional clients across
19 markets.
• Maybank Kim Eng (MKE) has
been in ASEAN for over 40 years
and is ASEAN’s largest brokerage
franchise which operates in 10
countries.
Desc
ripti
on
% o
f
9M
17
PBT
49.4% 6.9%43.7%
Group Insurance and
TakafulGroup Global Banking
Islamic Finance leverage model utilised to distribute Islamic products across the group, while
international business operations are embedded within each business pillar.
4
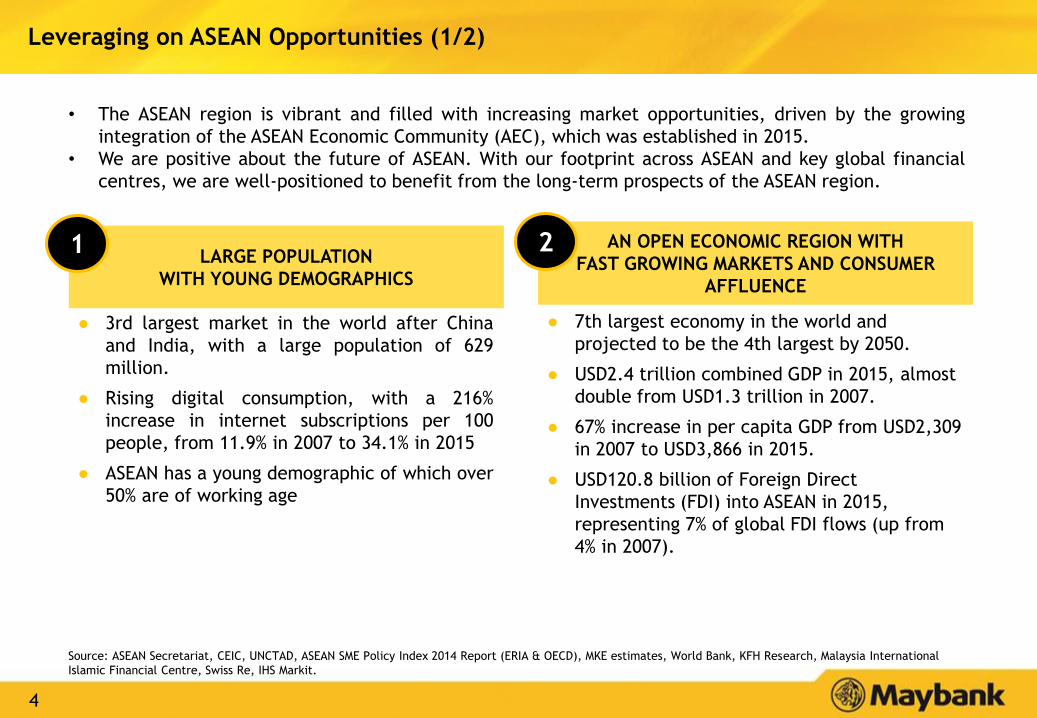
LARGE POPULATION
WITH YOUNG DEMOGRAPHICS
• The ASEAN region is vibrant and filled with increasing market opportunities, driven by the growing
integration of the ASEAN Economic Community (AEC), which was established in 2015.
• We are positive about the future of ASEAN. With our footprint across ASEAN and key global financial
centres, we are well-positioned to benefit from the long-term prospects of the ASEAN region.
● 7th largest economy in the world and
projected to be the 4th largest by 2050.
● USD2.4 trillion combined GDP in 2015, almost
double from USD1.3 trillion in 2007.
● 67% increase in per capita GDP from USD2,309
in 2007 to USD3,866 in 2015.
● USD120.8 billion of Foreign Direct
Investments (FDI) into ASEAN in 2015,
representing 7% of global FDI flows (up from
4% in 2007).
● 3rd largest market in the world after China
and India, with a large population of 629
million.
● Rising digital consumption, with a 216%
increase in internet subscriptions per 100
people, from 11.9% in 2007 to 34.1% in 2015
● ASEAN has a young demographic of which over
50% are of working age
AN OPEN ECONOMIC REGION WITH
FAST GROWING MARKETS AND CONSUMER
AFFLUENCE
Leveraging on ASEAN Opportunities (1/2)
Source: ASEAN Secretariat, CEIC, UNCTAD, ASEAN SME Policy Index 2014 Report (ERIA & OECD), MKE estimates, World Bank, KFH Research, Malaysia International
Islamic Financial Centre, Swiss Re, IHS Markit.
1 2
5
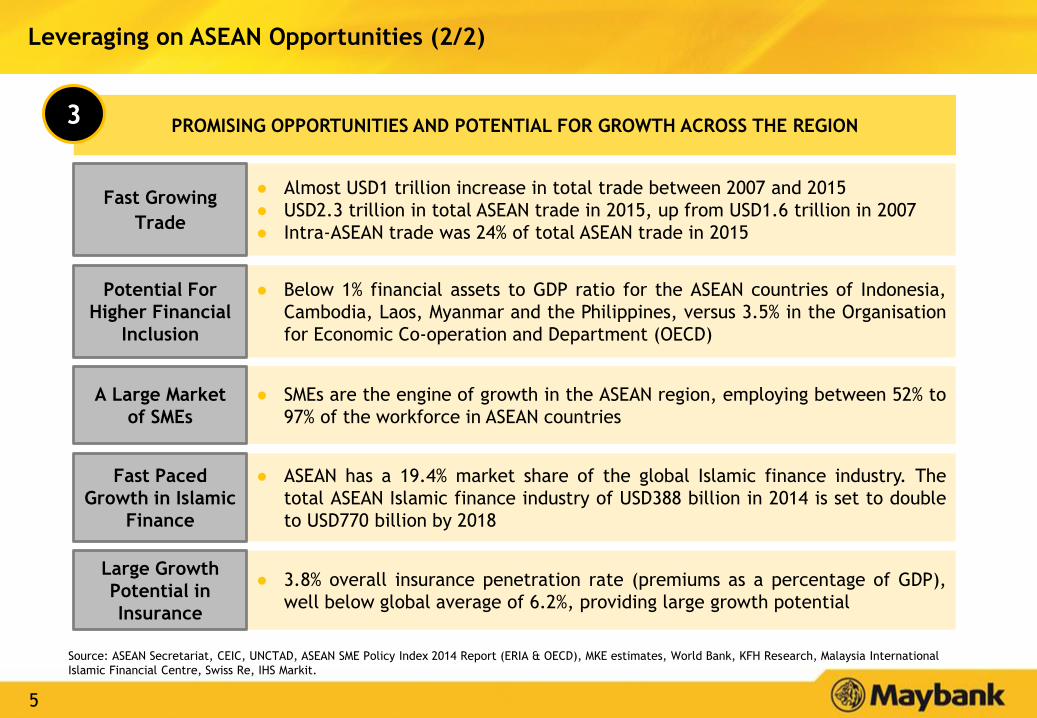
Leveraging on ASEAN Opportunities (2/2)
PROMISING OPPORTUNITIES AND POTENTIAL FOR GROWTH ACROSS THE REGION3
● Almost USD1 trillion increase in total trade between 2007 and 2015
● USD2.3 trillion in total ASEAN trade in 2015, up from USD1.6 trillion in 2007
● Intra-ASEAN trade was 24% of total ASEAN trade in 2015
Fast Growing
Trade
● Below 1% financial assets to GDP ratio for the ASEAN countries of Indonesia,
Cambodia, Laos, Myanmar and the Philippines, versus 3.5% in the Organisation
for Economic Co-operation and Department (OECD)
Potential For
Higher Financial
Inclusion
● SMEs are the engine of growth in the ASEAN region, employing between 52% to
97% of the workforce in ASEAN countries
A Large Market
of SMEs
● ASEAN has a 19.4% market share of the global Islamic finance industry. The
total ASEAN Islamic finance industry of USD388 billion in 2014 is set to double
to USD770 billion by 2018
Fast Paced
Growth in Islamic
Finance
● 3.8% overall insurance penetration rate (premiums as a percentage of GDP),
well below global average of 6.2%, providing large growth potential
Large Growth
Potential in
Insurance
Source: ASEAN Secretariat, CEIC, UNCTAD, ASEAN SME Policy Index 2014 Report (ERIA & OECD), MKE estimates, World Bank, KFH Research, Malaysia International
Islamic Financial Centre, Swiss Re, IHS Markit.
6
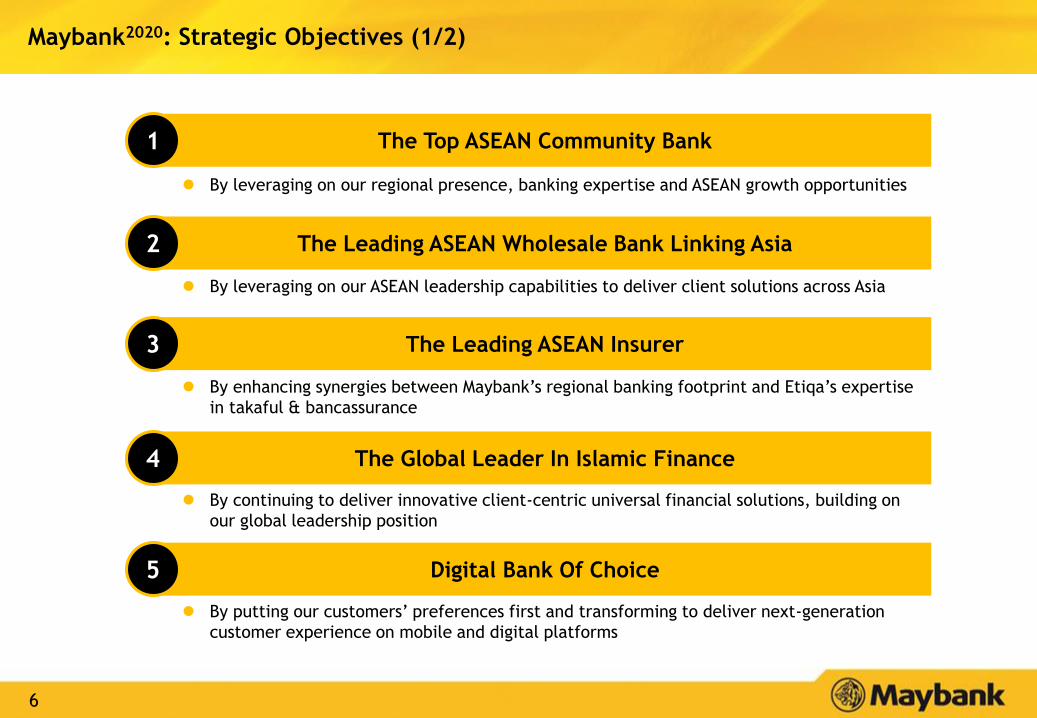
Maybank2020: Strategic Objectives (1/2)
The Top ASEAN Community Bank
The Leading ASEAN Wholesale Bank Linking Asia
The Leading ASEAN Insurer
The Global Leader In Islamic Finance
Digital Bank Of Choice
By leveraging on our regional presence, banking expertise and ASEAN growth opportunities
By leveraging on our ASEAN leadership capabilities to deliver client solutions across Asia
By enhancing synergies between Maybank’s regional banking footprint and Etiqa’s expertise
in takaful & bancassurance
By continuing to deliver innovative client-centric universal financial solutions, building on
our global leadership position
By putting our customers’ preferences first and transforming to deliver next-generation
customer experience on mobile and digital platforms
1
2
3
4
5

7
• Awarded Best Private Bank in Malaysia by Asian Private Banker for three consecutive years• Awarded Best SME Bank of the Year in Malaysia in 2017 by Alpha Southeast Asia• M2U ranked No.1 in the “Top 20 Local Brand Web Domains visited from Desktop Computers
in Malaysia” with over 3.6 million monthly unique visitors
Maybank2020: Strategic Objectives: Key FY2017 Achievements (2/2)
The Leading
ASEAN Wholesale
Bank Linking
Asia
2 • Maintained our lead as the ASEAN investment banking franchise by ranking • 1st in Bloomberg’s ASEAN Equity, Equity Linked & Rights and M&A tables• 2nd in ASEAN Local Currency Bonds and Global Sukuk tables
• Malaysian market share leader in corporate lending, trade finance and corporate deposits• MKE was awarded Best Investment Bank in Malaysia by Euromoney (3rd consecutive year)
The Leading
ASEAN Insurer
3 • Maintained No.1 online insurance position with >70% market share• Operational improvements such as most motor claims approval TAT under 30 minutes vs
industry benchmark of 3 days• Regional business expansion with bancassurance business growth into the Philippines and
75% acquisition stake in Indonesia’s PT Asuransi Asoka Mas
The Global
Leader In Islamic
Finance
4 • No.1 Global Sukuk Lead Manager on Bloomberg’s Global Sukuk League Table• No.1 Lead Manager on Bloomberg’s Ringgit Malaysia Sukuk League Table• Championed the Green Sukuk and Sustainable and Responsible Investment Sukuk market
development in Malaysia• Launched HouzKEY, a rent-to-own initiative in Malaysia
Digital Bank of
Choice
5 • Launched new Maybank2u app in Malaysia with improved user-friendliness, biometric features (Face & Voice ID) as security authentication and Secure2u function
• Launched various first–to-market digital initiatives: Maybank QRPay, Alipay-enabled merchant terminals in Malaysia and Maybank2u Pay (online merchant registration and payment via APIs)
The Top ASEAN
Community Bank
1

8
Digital Bank of Choice: Moving the Nation to a Cashless Society (1/3)
Maybank becomes the one-stop bank for all payment needs – both for the virtual
as well as the physical business world
9
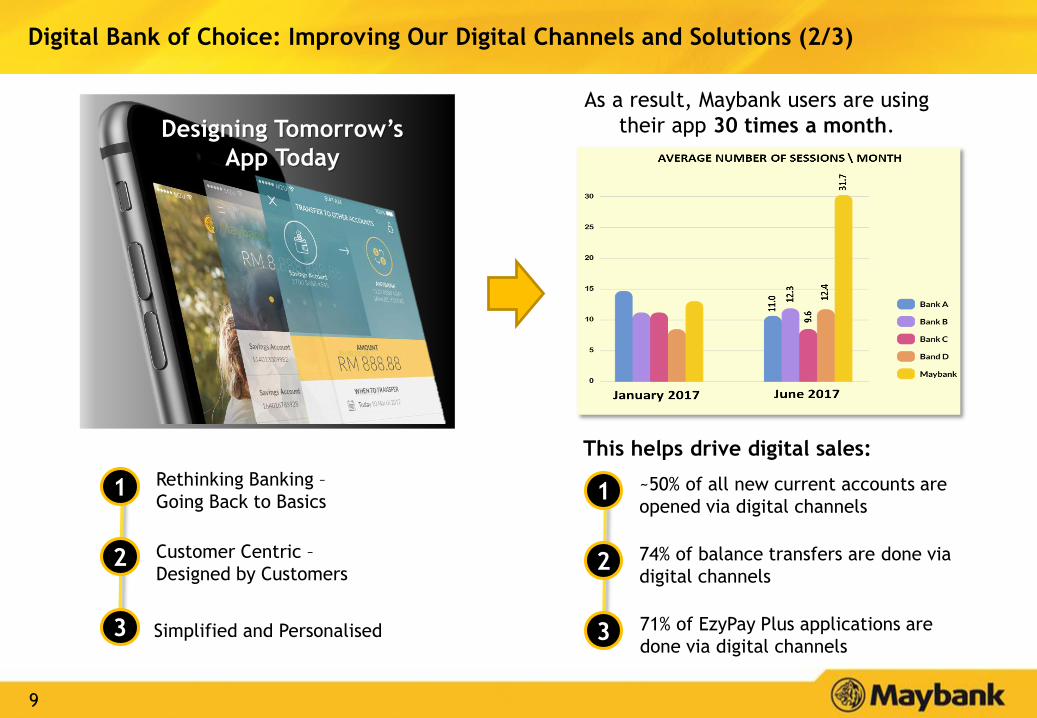
Designing Tomorrow’s
App Today
Rethinking Banking –
Going Back to Basics
Customer Centric –
Designed by Customers
Simplified and Personalised
As a result, Maybank users are using
their app 30 times a month.
1
2
3
~50% of all new current accounts are
opened via digital channels
74% of balance transfers are done via
digital channels
71% of EzyPay Plus applications are
done via digital channels
1
2
3
This helps drive digital sales:
Digital Bank of Choice: Improving Our Digital Channels and Solutions (2/3)
10
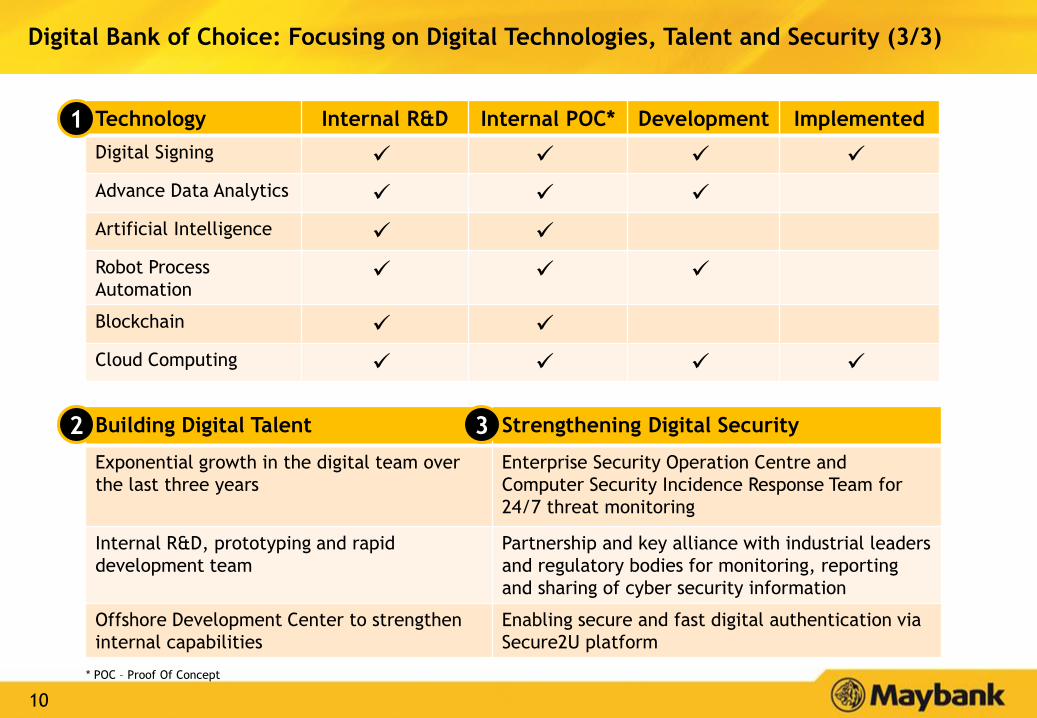
Digital Bank of Choice: Focusing on Digital Technologies, Talent and Security (3/3)
Building Digital Talent Strengthening Digital Security
Exponential growth in the digital team over
the last three years
Enterprise Security Operation Centre and
Computer Security Incidence Response Team for
24/7 threat monitoring
Internal R&D, prototyping and rapid
development team
Partnership and key alliance with industrial leaders
and regulatory bodies for monitoring, reporting
and sharing of cyber security information
Offshore Development Center to strengthen
internal capabilities
Enabling secure and fast digital authentication via
Secure2U platform
Technology Internal R&D Internal POC* Development Implemented
Digital Signing
Advance Data Analytics
Artificial Intelligence
Robot Process
Automation
Blockchain
Cloud Computing
1
2 3
* POC – Proof Of Concept
11
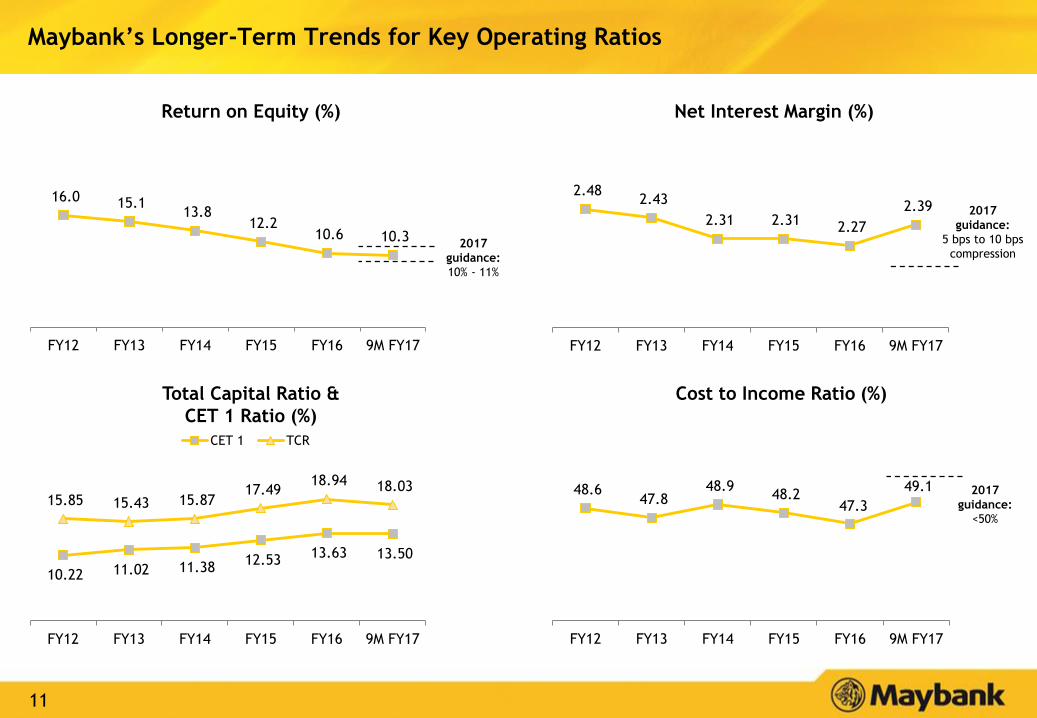
2.48 2.43
2.31 2.31 2.27
2.39
FY12 FY13 FY14 FY15 FY16 9M FY17
48.6 47.8
48.9 48.2
47.3
49.1
FY12 FY13 FY14 FY15 FY16 9M FY17
10.22 11.02 11.38 12.53
13.63 13.50
15.85 15.43 15.87 17.49
18.94 18.03
FY12 FY13 FY14 FY15 FY16 9M FY17
CET 1 TCR
16.0 15.1 13.8
12.2 10.6 10.3
FY12 FY13 FY14 FY15 FY16 9M FY17
Maybank’s Longer-Term Trends for Key Operating Ratios
Return on Equity (%) Net Interest Margin (%)
Total Capital Ratio &
CET 1 Ratio (%)
Cost to Income Ratio (%)
2017
guidance:
<50%
2017
guidance:
10% - 11%
2017
guidance:
5 bps to 10 bps
compression
12
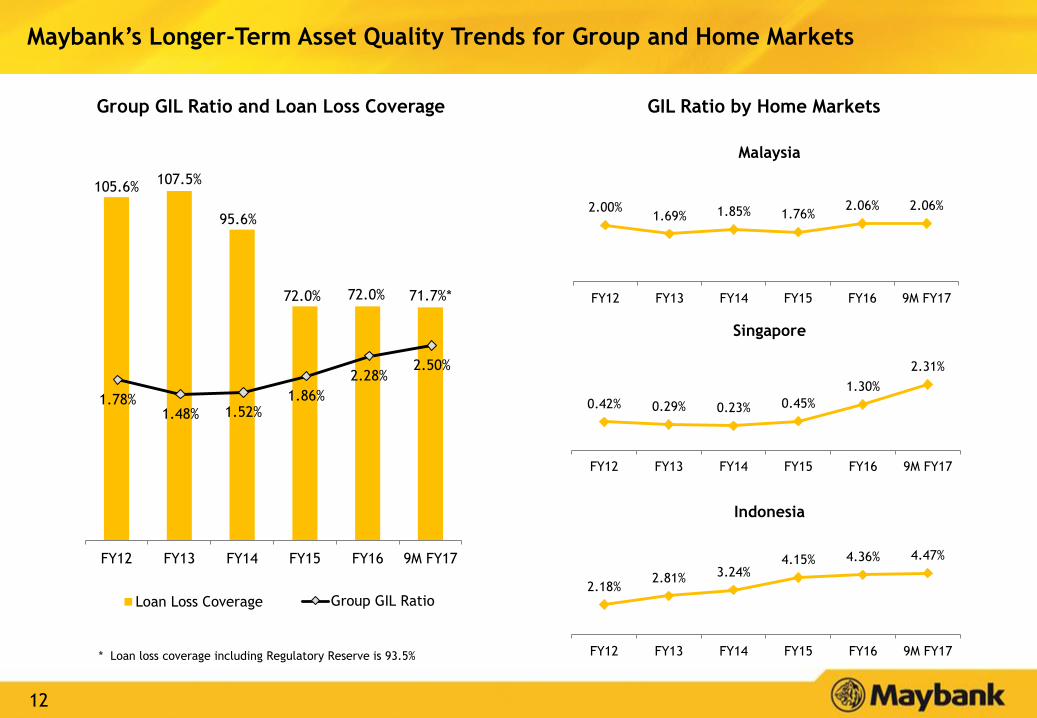
105.6%107.5%
95.6%
72.0% 72.0% 71.7%*
FY12 FY13 FY14 FY15 FY16 9M FY17
Loan Loss Coverage
Maybank’s Longer-Term Asset Quality Trends for Group and Home Markets
1.78%1.48% 1.52%
1.86%
2.28%2.50%
Group GIL Ratio
Group GIL Ratio and Loan Loss Coverage
* Loan loss coverage including Regulatory Reserve is 93.5%
GIL Ratio by Home Markets
2.00%1.69% 1.85% 1.76%
2.06% 2.06%
FY12 FY13 FY14 FY15 FY16 9M FY17
Malaysia
0.42% 0.29% 0.23% 0.45%
1.30%
2.31%
FY12 FY13 FY14 FY15 FY16 9M FY17
Singapore
2.18%2.81% 3.24%
4.15% 4.36% 4.47%
FY12 FY13 FY14 FY15 FY16 9M FY17
Indonesia
13
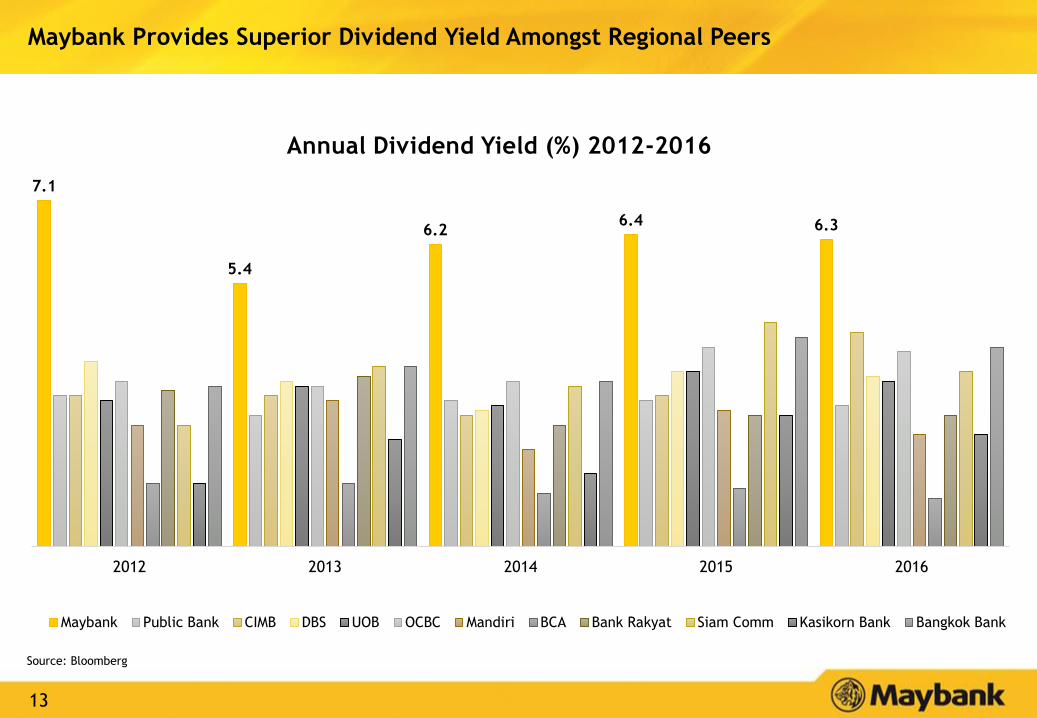
Maybank Provides Superior Dividend Yield Amongst Regional Peers
Source: Bloomberg
7.1
5.4
6.26.4 6.3
2012 2013 2014 2015 2016
Annual Dividend Yield (%) 2012-2016
Maybank Public Bank CIMB DBS UOB OCBC Mandiri BCA Bank Rakyat Siam Comm Kasikorn Bank Bangkok Bank

14
76.5% 74.9%79.9%
74.7% 71.9%78.5% 76.3% 78.1%
72.2%
11
2832
22.5 2424
20 23
44
32
36
33
3133 30
32
FY10 FY11 FP11 FY12 FY13 FY14 FY15 FY16 FY17
Final
Interim
54.0
82.6%*
52.0
* Reinvestment rate for the Dividend Reinvestment Plan
# The Net Dividend is 28.5 sen of which 15 sen is single-tier dividend.
85.9%*
85.7%*
88.2%*85.9%*
88.5%*91.1%*
86.1%*
88.6%*
85.74%*
55.060.0
36.0
65.0
53.557.0
84.0%*
Dividend Payout Ratio
Dividend (sen) and Payout Ratio (%)
87.5%*
83.7%*
83.5%*
89.06%*
#
Maybank Continues with High Dividend Payout; Above Policy Rate of 40%-60%
15
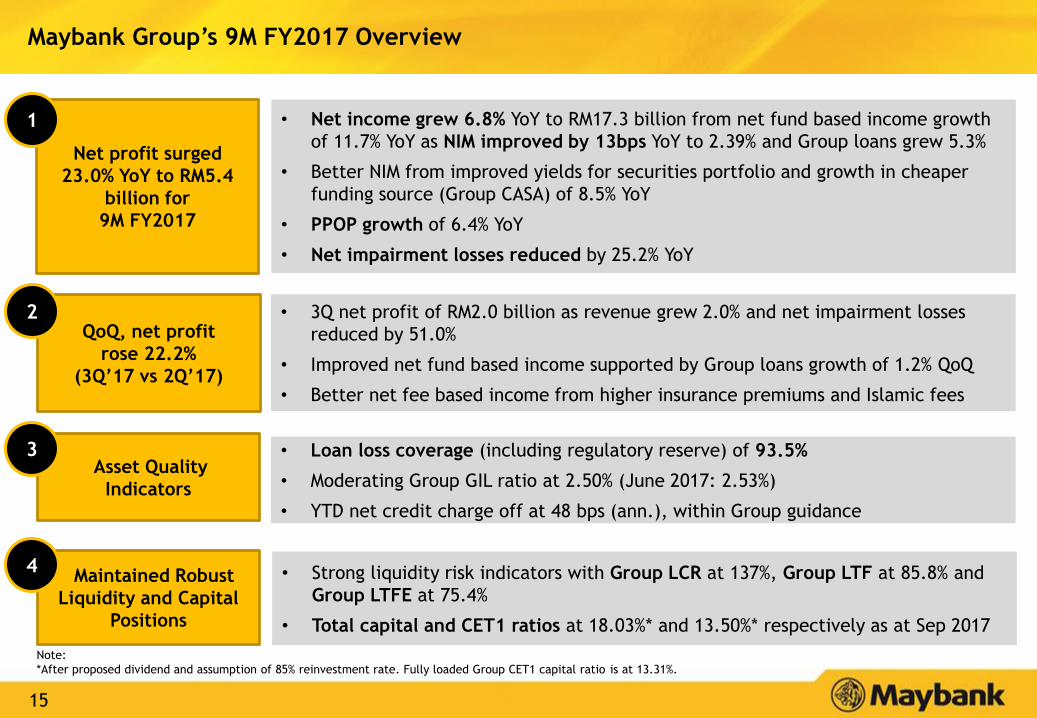
Net profit surged
23.0% YoY to RM5.4
billion for
9M FY2017
Maybank Group’s 9M FY2017 Overview
• Net income grew 6.8% YoY to RM17.3 billion from net fund based income growth
of 11.7% YoY as NIM improved by 13bps YoY to 2.39% and Group loans grew 5.3%
• Better NIM from improved yields for securities portfolio and growth in cheaper
funding source (Group CASA) of 8.5% YoY
• PPOP growth of 6.4% YoY
• Net impairment losses reduced by 25.2% YoY
1
• Loan loss coverage (including regulatory reserve) of 93.5%
• Moderating Group GIL ratio at 2.50% (June 2017: 2.53%)
• YTD net credit charge off at 48 bps (ann.), within Group guidance
Asset Quality
Indicators
• Strong liquidity risk indicators with Group LCR at 137%, Group LTF at 85.8% and
Group LTFE at 75.4%
• Total capital and CET1 ratios at 18.03%* and 13.50%* respectively as at Sep 2017
Maintained Robust
Liquidity and Capital
Positions
4
QoQ, net profit
rose 22.2%
(3Q’17 vs 2Q’17)
2 • 3Q net profit of RM2.0 billion as revenue grew 2.0% and net impairment losses
reduced by 51.0%
• Improved net fund based income supported by Group loans growth of 1.2% QoQ
• Better net fee based income from higher insurance premiums and Islamic fees
3
Note:
*After proposed dividend and assumption of 85% reinvestment rate. Fully loaded Group CET1 capital ratio is at 13.31%.

16
Full year Group loan growth of ~3%; loan growth for
Maybank Malaysia to be in line with industry growth
Managed cost growth to maintain CIR of < 50%
Maybank Performance Outlook for 2H 2017
5
Top line growth supported by effective NIM management1
3
Continued management of asset quality ahead of MFRS 9 adoption in 20186
Deposit growth to match loan growth; rising cost of funds trend 4
Maintaining full year ROE guidance of 10%-11%2
17
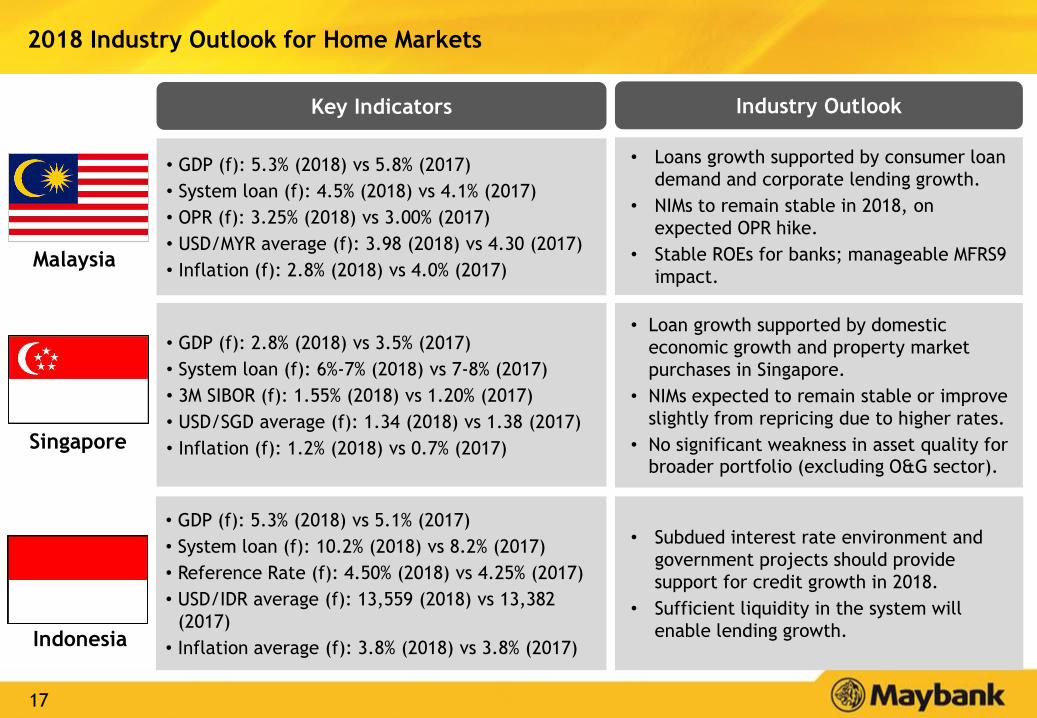
2018 Industry Outlook for Home Markets
Key Indicators Industry Outlook
Singapore
Malaysia
Indonesia
• GDP (f): 5.3% (2018) vs 5.8% (2017)
• System loan (f): 4.5% (2018) vs 4.1% (2017)
• OPR (f): 3.25% (2018) vs 3.00% (2017)
• USD/MYR average (f): 3.98 (2018) vs 4.30 (2017)
• Inflation (f): 2.8% (2018) vs 4.0% (2017)
• GDP (f): 2.8% (2018) vs 3.5% (2017)
• System loan (f): 6%-7% (2018) vs 7-8% (2017)
• 3M SIBOR (f): 1.55% (2018) vs 1.20% (2017)
• USD/SGD average (f): 1.34 (2018) vs 1.38 (2017)
• Inflation (f): 1.2% (2018) vs 0.7% (2017)
• GDP (f): 5.3% (2018) vs 5.1% (2017)
• System loan (f): 10.2% (2018) vs 8.2% (2017)
• Reference Rate (f): 4.50% (2018) vs 4.25% (2017)
• USD/IDR average (f): 13,559 (2018) vs 13,382
(2017)
• Inflation average (f): 3.8% (2018) vs 3.8% (2017)
• Subdued interest rate environment and
government projects should provide
support for credit growth in 2018.
• Sufficient liquidity in the system will
enable lending growth.
• Loan growth supported by domestic
economic growth and property market
purchases in Singapore.
• NIMs expected to remain stable or improve
slightly from repricing due to higher rates.
• No significant weakness in asset quality for broader portfolio (excluding O&G sector).
• Loans growth supported by consumer loan
demand and corporate lending growth.
• NIMs to remain stable in 2018, on
expected OPR hike.
• Stable ROEs for banks; manageable MFRS9
impact.
18
Table of Contents
Appendix:
1. Financial Performance 19
2. Community Financial Services 45
3. Global Banking 49
4. Maybank Singapore 53
5. Maybank Indonesia 56
6. Other segments 60
7. Affiliates 65
19
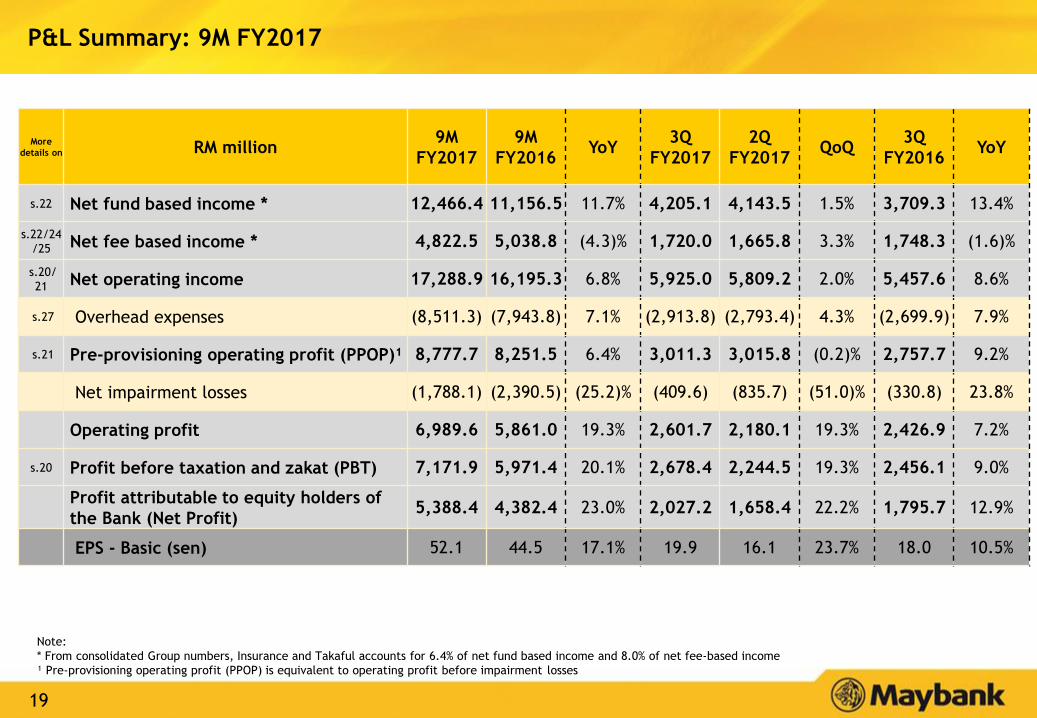
P&L Summary: 9M FY2017
More
details on RM million9M
FY2017
9M
FY2016YoY
3Q
FY2017
2Q
FY2017QoQ
3Q
FY2016YoY
s.22 Net fund based income * 12,466.4 11,156.5 11.7% 4,205.1 4,143.5 1.5% 3,709.3 13.4%
s.22/24
/25 Net fee based income * 4,822.5 5,038.8 (4.3)% 1,720.0 1,665.8 3.3% 1,748.3 (1.6)%
s.20/
21 Net operating income 17,288.9 16,195.3 6.8% 5,925.0 5,809.2 2.0% 5,457.6 8.6%
s.27 Overhead expenses (8,511.3) (7,943.8) 7.1% (2,913.8) (2,793.4) 4.3% (2,699.9) 7.9%
s.21 Pre-provisioning operating profit (PPOP)¹ 8,777.7 8,251.5 6.4% 3,011.3 3,015.8 (0.2)% 2,757.7 9.2%
Net impairment losses (1,788.1) (2,390.5) (25.2)% (409.6) (835.7) (51.0)% (330.8) 23.8%
Operating profit 6,989.6 5,861.0 19.3% 2,601.7 2,180.1 19.3% 2,426.9 7.2%
s.20 Profit before taxation and zakat (PBT) 7,171.9 5,971.4 20.1% 2,678.4 2,244.5 19.3% 2,456.1 9.0%
Profit attributable to equity holders of
the Bank (Net Profit)5,388.4 4,382.4 23.0% 2,027.2 1,658.4 22.2% 1,795.7 12.9%
EPS - Basic (sen) 52.1 44.5 17.1% 19.9 16.1 23.7% 18.0 10.5%
Note:
* From consolidated Group numbers, Insurance and Takaful accounts for 6.4% of net fund based income and 8.0% of net fee-based income
¹ Pre-provisioning operating profit (PPOP) is equivalent to operating profit before impairment losses
20
70.6%
9.6%
8.8%
11.0%
Malaysia Singapore Indonesia Others
58.7%18.5%
14.8%
8.0%
58.1%25.8%
8.1%8.0%
77.3%
10.2%
8.4%4.1%
61.4%16.2%
14.7%
7.7%
57.5%25.3%
8.3%
8.9%
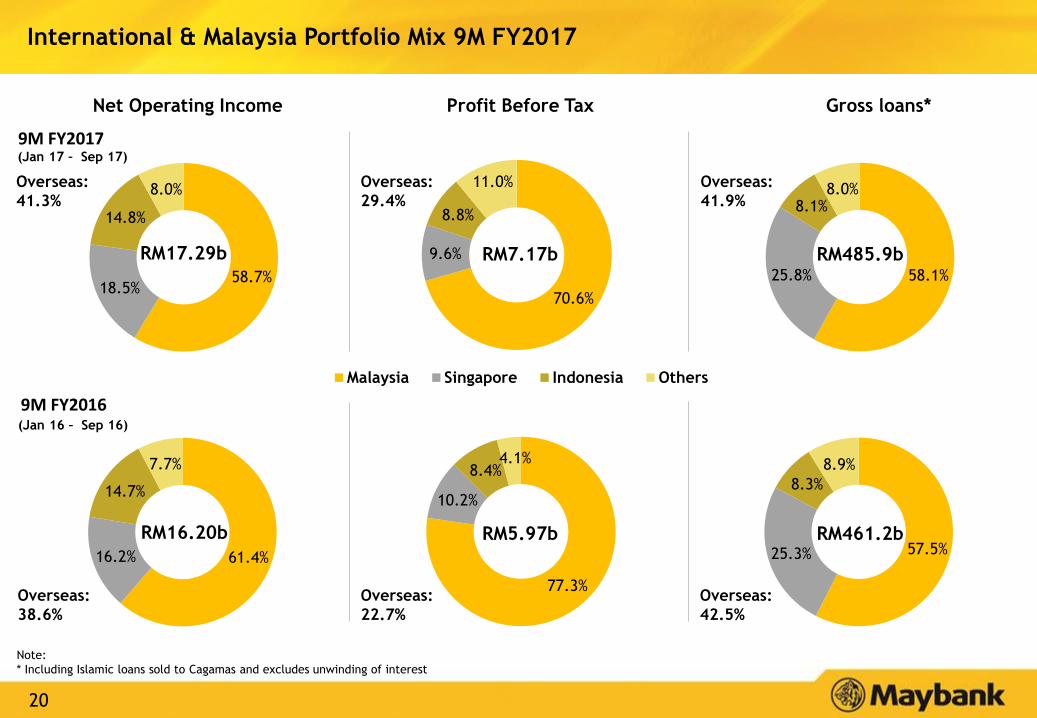
International & Malaysia Portfolio Mix 9M FY2017
Overseas:
42.5%
9M FY2016
Net Operating Income Profit Before Tax
9M FY2017
Overseas:
38.6%
Overseas:
22.7%
Gross loans*
(Jan 16 – Sep 16)
Overseas:
41.9%
Overseas:
41.3%
Overseas:
29.4%
(Jan 17 – Sep 17)
RM5.97b RM461.2bRM16.20b
RM7.17b RM485.9bRM17.29b
Note:
* Including Islamic loans sold to Cagamas and excludes unwinding of interest

21
16,195
9,272
5,724
1,065 117 1,146
17,289
10,067
5,798
993 177
1,178
Total Group CommunityFinancial Services
Group CorporateBanking & Global
Markets
Group InvestmentBanking
Group AssetManagement
Group Insurance &Takaful
9M FY2016
9M FY2017
8,252
4,161 4,340
209 25 647
8,778
4,619 4,280
102 73 628
Total Group CommunityFinancial Services
Group CorporateBanking & Global
Markets
Group InvestmentBanking
Group AssetManagement
Group Insurance &Takaful
9M FY2016
9M FY2017
Segmental Performance of Businesses: 9M FY2017 (1/2)
Net Operating Income
RM
million
+6.8%
RM
million
PPOP
+8.6% +1.3% (6.8)% +2.8%
+6.4%
+11.0% (1.4)% (51.5)% +>100%
+51.5%
(2.9)%
Group Global Banking (GB) (2.6)%
Group Global Banking (GB) +0.9%
9M FY2016: 6,907 9M FY2017: 6,969
9M FY2016: 4,574 9M FY2017: 4,454
Note:
Net income & PPOP for group includes expenditures of “Head Office & Others” of RM1,130.0 million for 9M FY2016 and RM924.2 million for 9M FY2017.
22
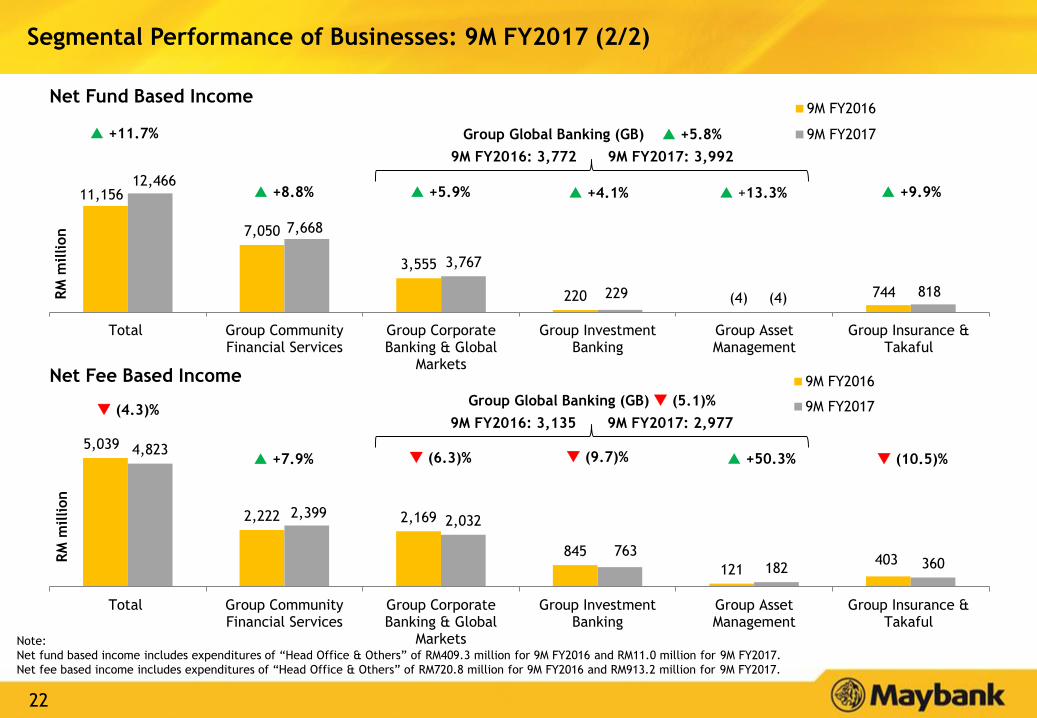
11,156
7,050
3,555
220 (4) 744
12,466
7,668
3,767
229 (4) 818
Total Group CommunityFinancial Services
Group CorporateBanking & Global
Markets
Group InvestmentBanking
Group AssetManagement
Group Insurance &Takaful
9M FY2016
9M FY2017 +11.7%
Net Fund Based Income
5,039
2,222 2,169
845
121 403
4,823
2,399 2,032
763 182 360
Total Group CommunityFinancial Services
Group CorporateBanking & Global
Markets
Group InvestmentBanking
Group AssetManagement
Group Insurance &Takaful
9M FY2016
9M FY2017 (4.3)%
(9.7)% (10.5)%
Group Global Banking (GB) +5.8%
Net Fee Based Income
RM
million
RM
million
+4.1% +13.3%
+50.3%
+8.8% +5.9% +9.9%
9M FY2016: 3,772 9M FY2017: 3,992
Group Global Banking (GB) (5.1)%
9M FY2016: 3,135 9M FY2017: 2,977
Segmental Performance of Businesses: 9M FY2017 (2/2)
Note:
Net fund based income includes expenditures of “Head Office & Others” of RM409.3 million for 9M FY2016 and RM11.0 million for 9M FY2017.
Net fee based income includes expenditures of “Head Office & Others” of RM720.8 million for 9M FY2016 and RM913.2 million for 9M FY2017.
(6.3)% +7.9%
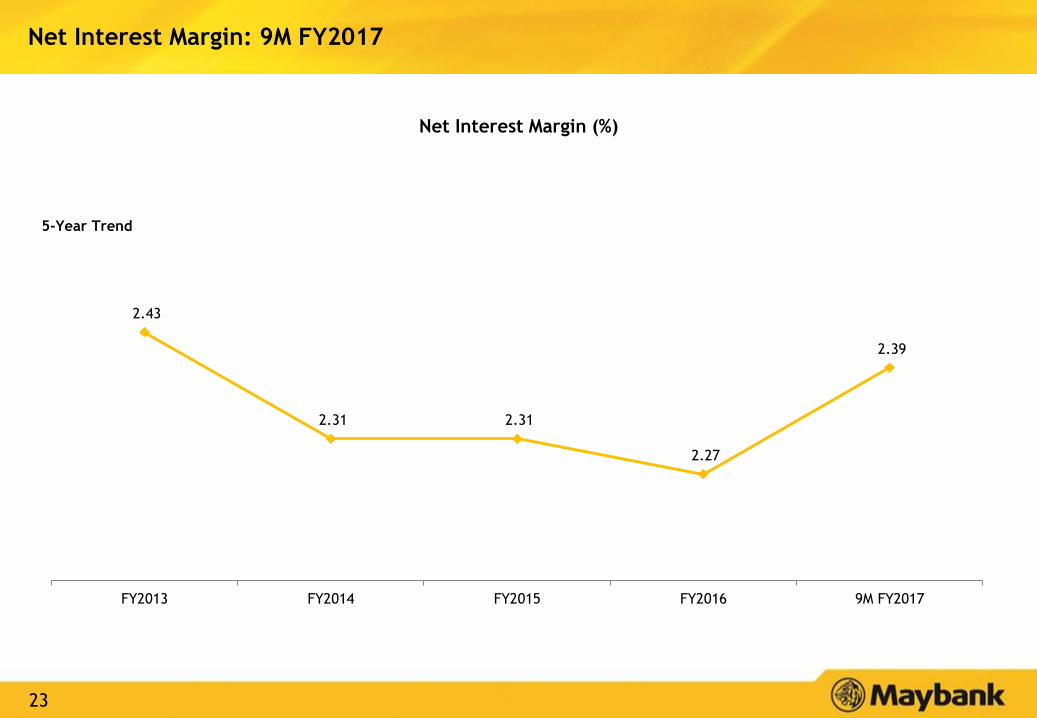
23
2.43
2.31 2.31
2.27
2.39
FY2013 FY2014 FY2015 FY2016 9M FY2017
Net Interest Margin: 9M FY2017
Net Interest Margin (%)
5-Year Trend
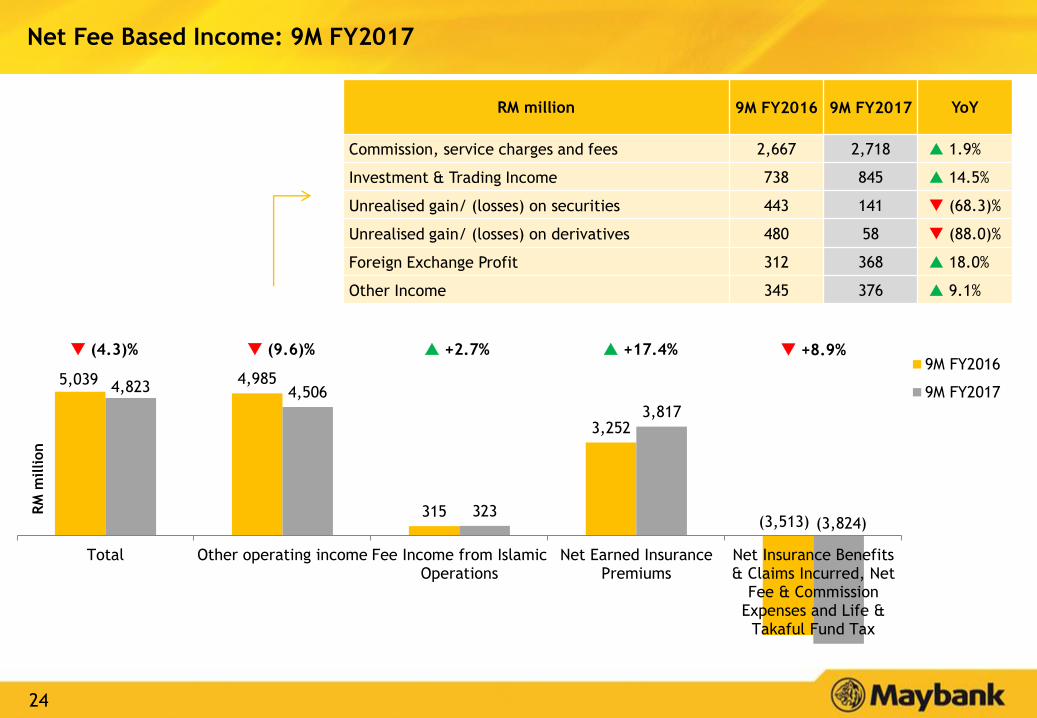
24
5,039 4,985
315
3,252
(3,513)
4,823 4,506
323
3,817
(3,824)
Total Other operating income Fee Income from IslamicOperations
Net Earned InsurancePremiums
Net Insurance Benefits& Claims Incurred, Net
Fee & CommissionExpenses and Life &
Takaful Fund Tax
9M FY2016
9M FY2017
RM
million
RM million 9M FY2016 9M FY2017 YoY
Commission, service charges and fees 2,667 2,718 1.9%
Investment & Trading Income 738 845 14.5%
Unrealised gain/ (losses) on securities 443 141 (68.3)%
Unrealised gain/ (losses) on derivatives 480 58 (88.0)%
Foreign Exchange Profit 312 368 18.0%
Other Income 345 376 9.1%
Net Fee Based Income: 9M FY2017
(4.3)% (9.6)% +2.7% +17.4% +8.9%
25
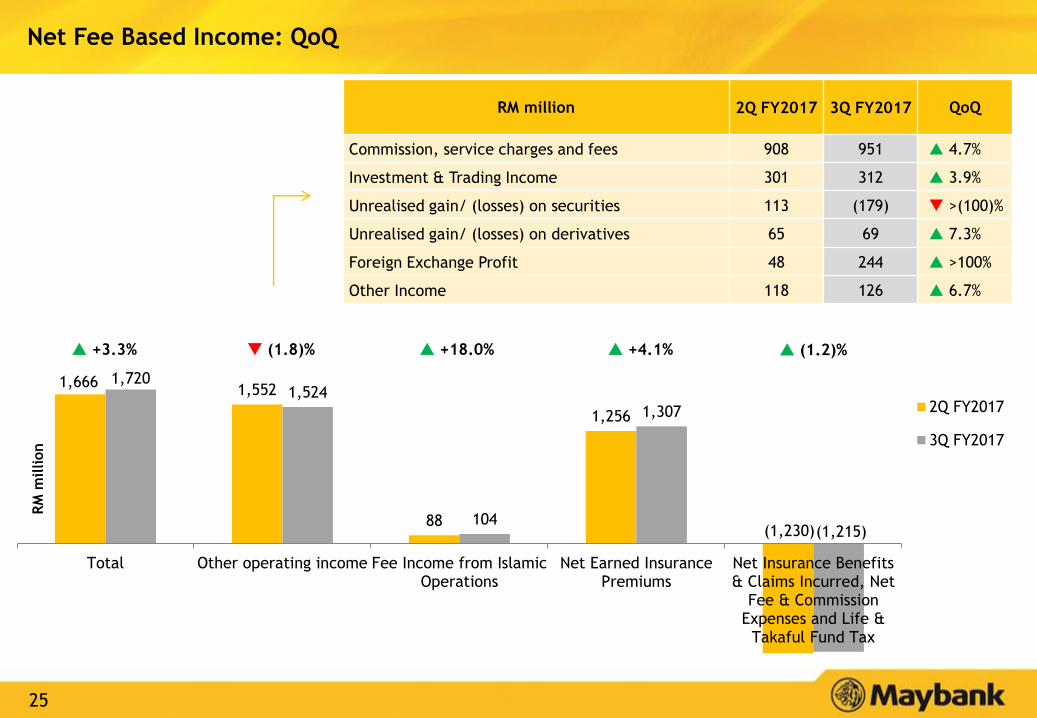
1,666 1,552
88
1,256
(1,230)
1,720 1,524
104
1,307
(1,215)
Total Other operating income Fee Income from IslamicOperations
Net Earned InsurancePremiums
Net Insurance Benefits& Claims Incurred, Net
Fee & CommissionExpenses and Life &
Takaful Fund Tax
2Q FY2017
3Q FY2017
RM
million
RM million 2Q FY2017 3Q FY2017 QoQ
Commission, service charges and fees 908 951 4.7%
Investment & Trading Income 301 312 3.9%
Unrealised gain/ (losses) on securities 113 (179) >(100)%
Unrealised gain/ (losses) on derivatives 65 69 7.3%
Foreign Exchange Profit 48 244 >100%
Other Income 118 126 6.7%
Net Fee Based Income: QoQ
+3.3% (1.8)% +18.0% +4.1% (1.2)%

26
Unaudited Income Statement for Insurance and Takaful Business
RM million9M
FY2017
9M
FY2016YoY
3Q
FY2017
2Q
FY2017QoQ
3Q
FY2016YoY
Net interest income 810.8 733.2 10.6% 260.6 299.1 (12.8)% 248.5 4.9%
Net earned premiums 3,817.1 3,251.6 17.4% 1,307.4 1,255.8 4.1% 1,018.4 28.4%
Other operating income 516.4 688.8 (25.0)% 84.4 172.3 (51.0)% 298.1 (71.7)%
Total operating income 5,144.4 4,673.5 10.1% 1,652.5 1,727.2 (4.3)% 1,565.0 5.6%
Net insurance benefits & claims
incurred, net fee & commission
expenses and life & takaful fund tax
(3,978.5) (3,648.0) 9.1% (1,289.2) (1,265.3) 1.9% (1,173.6) 9.9%
Net operating income 1,165.9 1,025.6 13.7% 363.2 461.9 (21.4)% 391.4 (7.2)%
Overhead expenses (542.5) (490.6) 10.6% (189.3) (186.8) 1.4% (162.2) 16.8%
PPOP 623.4 535.0 16.5% 173.9 275.1 (36.8)% 229.3 (24.2)%
Net impairment losses (35.5) (33.6) 5.7% (23.9) (9.8) >100% (0.2) >100%
Operating profit 587.9 501.4 17.3% 150.0 265.3 (43.5)% 229.0 (34.5)%
RM million9M
FY2017
9M
FY2016YoY
3Q
FY2017
2Q
FY2017QoQ
3Q
FY2016YoY
Net insurance benefits & claims
incurred, net fee & commission
expenses and life & takaful fund tax
(3,978.5) (3,648.0) 9.1% (1,289.2) (1,265.3) 1.9% (1,173.6) 9.9%
Less: intercompany elimination 154.6 135.4 14.2% 73.9 35.1 >100% 60.4 22.3%
Total net insurance benefits & claims
incurred, net fee & commission
expenses and life & takaful fund tax
(3,823.9) (3,512.6) 8.9% (1,215.3) (1,230.2) (1.2)% (1,113.1) 9.2%
Reconciliation of net insurance benefits & claims incurred, net fee & commission expenses and life & takaful fund tax
27
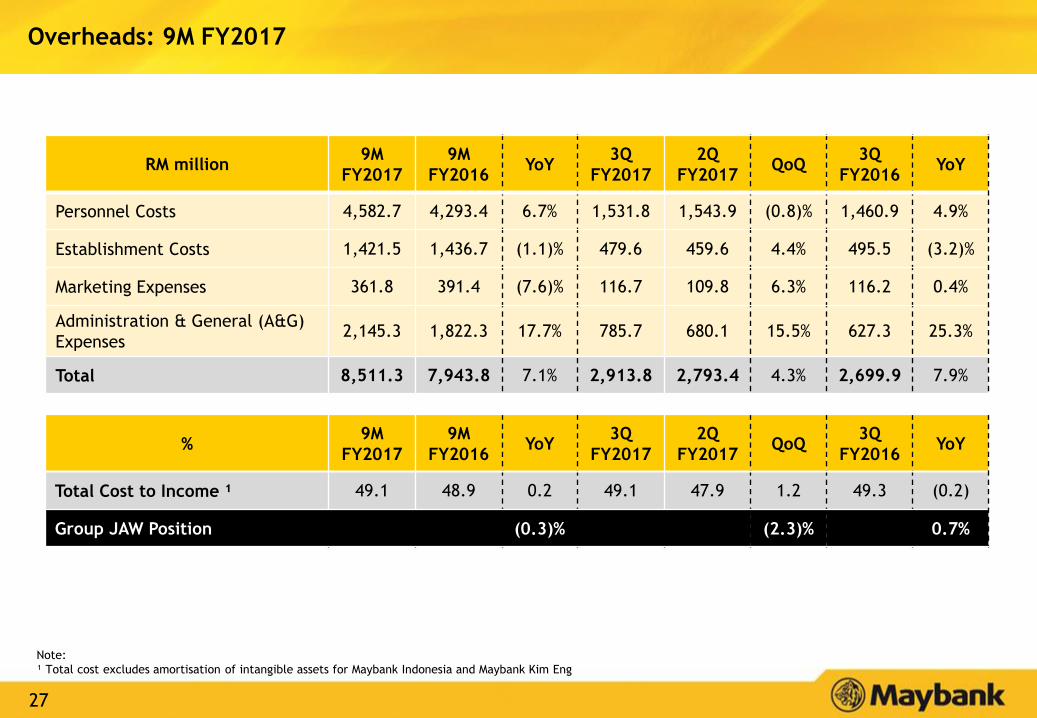
RM million9M
FY2017
9M
FY2016YoY
3Q
FY2017
2Q
FY2017QoQ
3Q
FY2016YoY
Personnel Costs 4,582.7 4,293.4 6.7% 1,531.8 1,543.9 (0.8)% 1,460.9 4.9%
Establishment Costs 1,421.5 1,436.7 (1.1)% 479.6 459.6 4.4% 495.5 (3.2)%
Marketing Expenses 361.8 391.4 (7.6)% 116.7 109.8 6.3% 116.2 0.4%
Administration & General (A&G)
Expenses 2,145.3 1,822.3 17.7% 785.7 680.1 15.5% 627.3 25.3%
Total 8,511.3 7,943.8 7.1% 2,913.8 2,793.4 4.3% 2,699.9 7.9%
%9M
FY2017
9M
FY2016YoY
3Q
FY2017
2Q
FY2017QoQ
3Q
FY2016YoY
Total Cost to Income ¹ 49.1 48.9 0.2 49.1 47.9 1.2 49.3 (0.2)
Group JAW Position (0.3)% (2.3)% 0.7%
Overheads: 9M FY2017
Note:
¹ Total cost excludes amortisation of intangible assets for Maybank Indonesia and Maybank Kim Eng

28
116.2 122.7
Sep 16 Sep 17
20.1 21.5
17.1 17.6
Sep 16 Sep 17
Community Financial Services Global Banking
95.8 94.5
22.4 30.2
Sep 16 Sep 17
+34.8%
44.245.2
Sep 16 Sep 17
190.6 199.8
72.2 79.1
Sep 16 Sep 17
461.2 485.9
Sep 16 Sep 17
Balance Sheet Management: 9M FY2017
261.5
37.4
118.5
RM
billion
SG
D b
illion
IDR
tri
llio
n
Gross Loans (YoY)
6.6% 4.6% 5.4% 5.3%
RM
billion
Group Malaysia Singapore Indonesia
39.1
278.7125.0
11.6 14.1
Sep 16 Sep 17
175.1190.1
Sep 16 Sep 17
5.6%
RM
billion
RM
billion
SG
D b
illion
IDR
tri
llio
n
CASA (YoY)
+4.8%
+9.4%
8.5% 21.7% 2.3%
+7.1%
+3.1%
(1.4)%
25.1% 31.9%40.3% 39.5%34.8% 36.8% 38.1% 37.8%CASA
Ratio:
Note: CASA ratio for Group and Malaysia includes investment accounts
Refer to pages 29-31 for detailed information on loans and deposits growth by country and products.
29
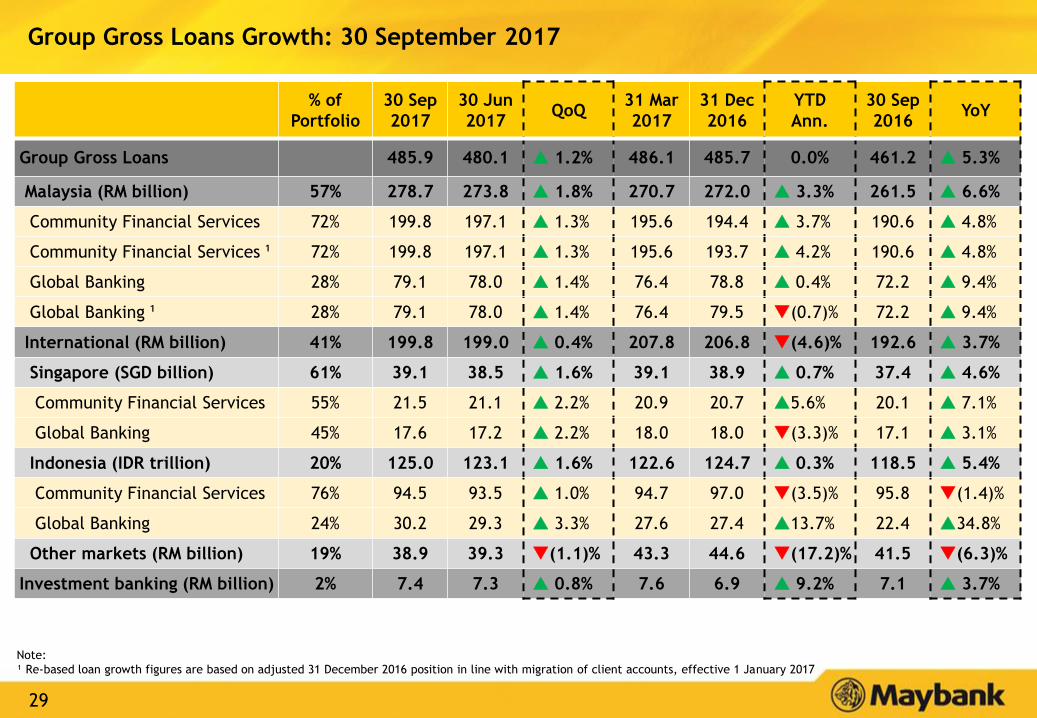
Group Gross Loans Growth: 30 September 2017
Note:
¹ Re-based loan growth figures are based on adjusted 31 December 2016 position in line with migration of client accounts, effective 1 January 2017
% of
Portfolio
30 Sep
2017
30 Jun
2017QoQ
31 Mar
2017
31 Dec
2016
YTD
Ann.
30 Sep
2016YoY
Group Gross Loans 485.9 480.1 1.2% 486.1 485.7 0.0% 461.2 5.3%
Malaysia (RM billion) 57% 278.7 273.8 1.8% 270.7 272.0 3.3% 261.5 6.6%
Community Financial Services 72% 199.8 197.1 1.3% 195.6 194.4 3.7% 190.6 4.8%
Community Financial Services ¹ 72% 199.8 197.1 1.3% 195.6 193.7 4.2% 190.6 4.8%
Global Banking 28% 79.1 78.0 1.4% 76.4 78.8 0.4% 72.2 9.4%
Global Banking ¹ 28% 79.1 78.0 1.4% 76.4 79.5 (0.7)% 72.2 9.4%
International (RM billion) 41% 199.8 199.0 0.4% 207.8 206.8 (4.6)% 192.6 3.7%
Singapore (SGD billion) 61% 39.1 38.5 1.6% 39.1 38.9 0.7% 37.4 4.6%
Community Financial Services 55% 21.5 21.1 2.2% 20.9 20.7 5.6% 20.1 7.1%
Global Banking 45% 17.6 17.2 2.2% 18.0 18.0 (3.3)% 17.1 3.1%
Indonesia (IDR trillion) 20% 125.0 123.1 1.6% 122.6 124.7 0.3% 118.5 5.4%
Community Financial Services 76% 94.5 93.5 1.0% 94.7 97.0 (3.5)% 95.8 (1.4)%
Global Banking 24% 30.2 29.3 3.3% 27.6 27.4 13.7% 22.4 34.8%
Other markets (RM billion) 19% 38.9 39.3 (1.1)% 43.3 44.6 (17.2)% 41.5 (6.3)%
Investment banking (RM billion) 2% 7.4 7.3 0.8% 7.6 6.9 9.2% 7.1 3.7%
30
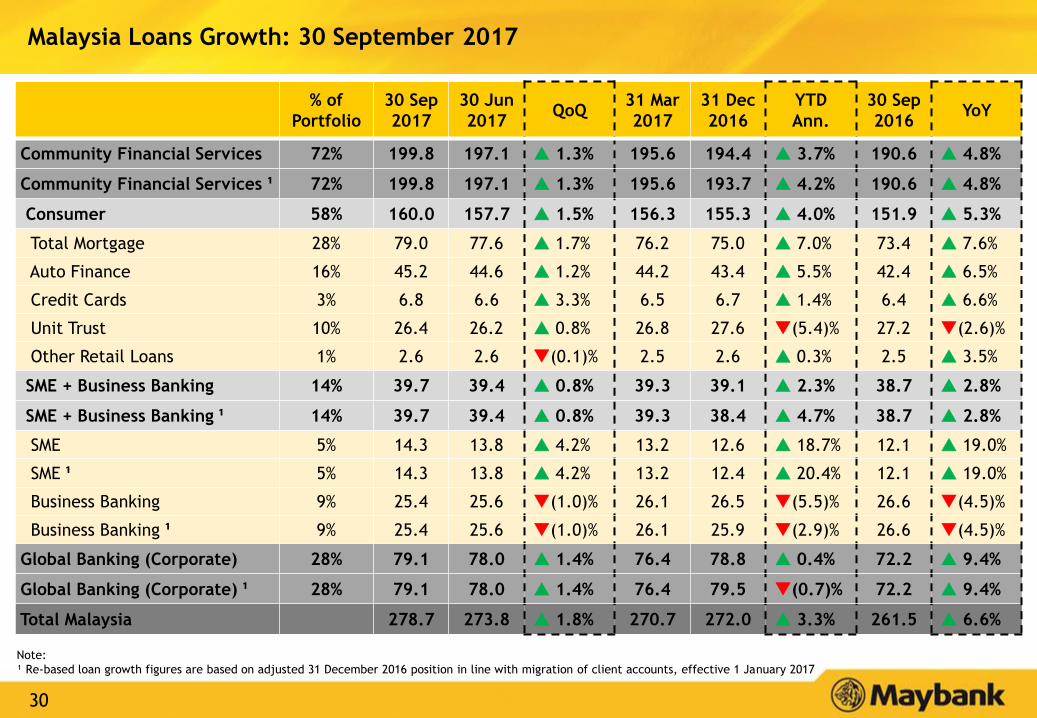
Malaysia Loans Growth: 30 September 2017
% of
Portfolio
30 Sep
2017
30 Jun
2017QoQ
31 Mar
2017
31 Dec
2016
YTD
Ann.
30 Sep
2016YoY
Community Financial Services 72% 199.8 197.1 1.3% 195.6 194.4 3.7% 190.6 4.8%
Community Financial Services ¹ 72% 199.8 197.1 1.3% 195.6 193.7 4.2% 190.6 4.8%
Consumer 58% 160.0 157.7 1.5% 156.3 155.3 4.0% 151.9 5.3%
Total Mortgage 28% 79.0 77.6 1.7% 76.2 75.0 7.0% 73.4 7.6%
Auto Finance 16% 45.2 44.6 1.2% 44.2 43.4 5.5% 42.4 6.5%
Credit Cards 3% 6.8 6.6 3.3% 6.5 6.7 1.4% 6.4 6.6%
Unit Trust 10% 26.4 26.2 0.8% 26.8 27.6 (5.4)% 27.2 (2.6)%
Other Retail Loans 1% 2.6 2.6 (0.1)% 2.5 2.6 0.3% 2.5 3.5%
SME + Business Banking 14% 39.7 39.4 0.8% 39.3 39.1 2.3% 38.7 2.8%
SME + Business Banking ¹ 14% 39.7 39.4 0.8% 39.3 38.4 4.7% 38.7 2.8%
SME 5% 14.3 13.8 4.2% 13.2 12.6 18.7% 12.1 19.0%
SME ¹ 5% 14.3 13.8 4.2% 13.2 12.4 20.4% 12.1 19.0%
Business Banking 9% 25.4 25.6 (1.0)% 26.1 26.5 (5.5)% 26.6 (4.5)%
Business Banking ¹ 9% 25.4 25.6 (1.0)% 26.1 25.9 (2.9)% 26.6 (4.5)%
Global Banking (Corporate) 28% 79.1 78.0 1.4% 76.4 78.8 0.4% 72.2 9.4%
Global Banking (Corporate) ¹ 28% 79.1 78.0 1.4% 76.4 79.5 (0.7)% 72.2 9.4%
Total Malaysia 278.7 273.8 1.8% 270.7 272.0 3.3% 261.5 6.6%
Note:
¹ Re-based loan growth figures are based on adjusted 31 December 2016 position in line with migration of client accounts, effective 1 January 2017
31
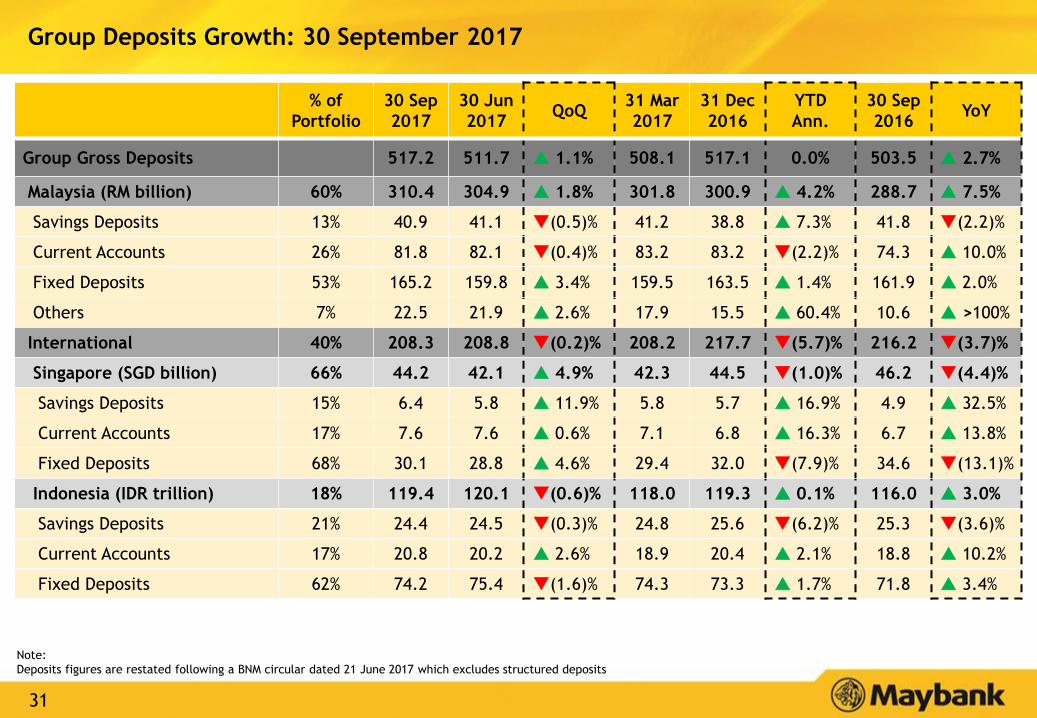
Group Deposits Growth: 30 September 2017
% of
Portfolio
30 Sep
2017
30 Jun
2017QoQ
31 Mar
2017
31 Dec
2016
YTD
Ann.
30 Sep
2016YoY
Group Gross Deposits 517.2 511.7 1.1% 508.1 517.1 0.0% 503.5 2.7%
Malaysia (RM billion) 60% 310.4 304.9 1.8% 301.8 300.9 4.2% 288.7 7.5%
Savings Deposits 13% 40.9 41.1 (0.5)% 41.2 38.8 7.3% 41.8 (2.2)%
Current Accounts 26% 81.8 82.1 (0.4)% 83.2 83.2 (2.2)% 74.3 10.0%
Fixed Deposits 53% 165.2 159.8 3.4% 159.5 163.5 1.4% 161.9 2.0%
Others 7% 22.5 21.9 2.6% 17.9 15.5 60.4% 10.6 >100%
International 40% 208.3 208.8 (0.2)% 208.2 217.7 (5.7)% 216.2 (3.7)%
Singapore (SGD billion) 66% 44.2 42.1 4.9% 42.3 44.5 (1.0)% 46.2 (4.4)%
Savings Deposits 15% 6.4 5.8 11.9% 5.8 5.7 16.9% 4.9 32.5%
Current Accounts 17% 7.6 7.6 0.6% 7.1 6.8 16.3% 6.7 13.8%
Fixed Deposits 68% 30.1 28.8 4.6% 29.4 32.0 (7.9)% 34.6 (13.1)%
Indonesia (IDR trillion) 18% 119.4 120.1 (0.6)% 118.0 119.3 0.1% 116.0 3.0%
Savings Deposits 21% 24.4 24.5 (0.3)% 24.8 25.6 (6.2)% 25.3 (3.6)%
Current Accounts 17% 20.8 20.2 2.6% 18.9 20.4 2.1% 18.8 10.2%
Fixed Deposits 62% 74.2 75.4 (1.6)% 74.3 73.3 1.7% 71.8 3.4%
Note:
Deposits figures are restated following a BNM circular dated 21 June 2017 which excludes structured deposits
32
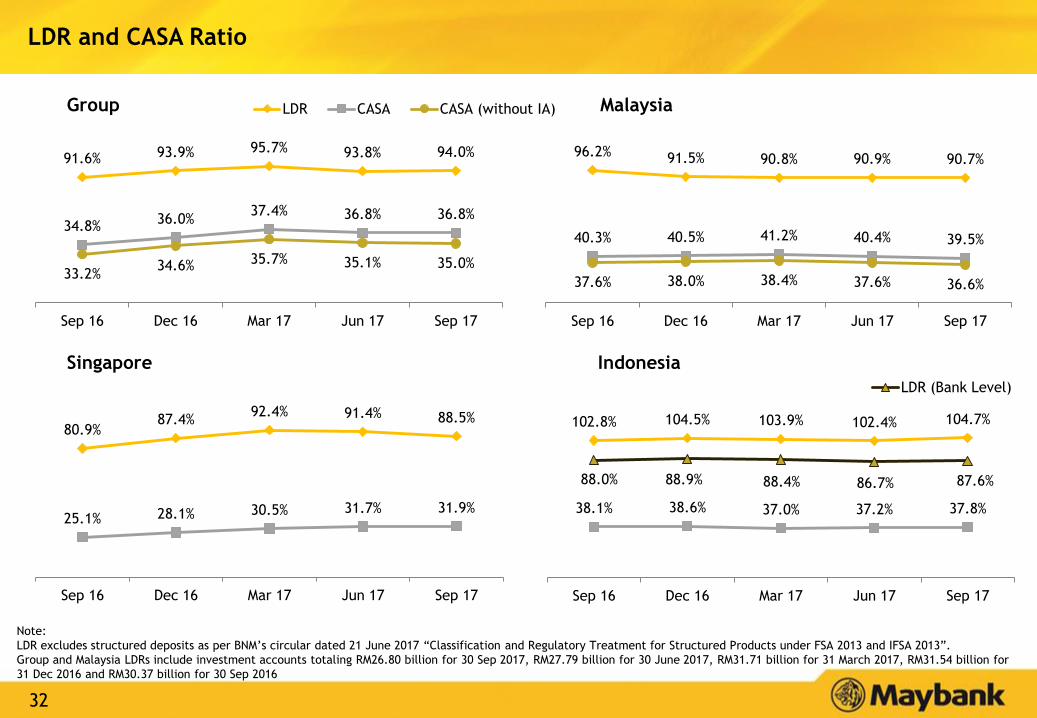
91.6% 93.9% 95.7% 93.8% 94.0%
34.8%36.0%
37.4% 36.8% 36.8%
33.2%34.6% 35.7% 35.1% 35.0%
Sep 16 Dec 16 Mar 17 Jun 17 Sep 17
LDR CASA CASA (without IA)
96.2% 91.5% 90.8% 90.9% 90.7%
40.3% 40.5% 41.2% 40.4% 39.5%
37.6% 38.0% 38.4% 37.6% 36.6%
Sep 16 Dec 16 Mar 17 Jun 17 Sep 17
LDR and CASA Ratio
Singapore Indonesia
Group Malaysia
102.8% 104.5% 103.9% 102.4% 104.7%
38.1% 38.6% 37.0% 37.2% 37.8%
88.0% 88.9% 88.4% 86.7% 87.6%
Sep 16 Dec 16 Mar 17 Jun 17 Sep 17
LDR (Bank Level)
80.9%87.4%
92.4% 91.4% 88.5%
25.1% 28.1% 30.5% 31.7% 31.9%
Sep 16 Dec 16 Mar 17 Jun 17 Sep 17
Note:
LDR excludes structured deposits as per BNM’s circular dated 21 June 2017 “Classification and Regulatory Treatment for Structured Products under FSA 2013 and IFSA 2013”.
Group and Malaysia LDRs include investment accounts totaling RM26.80 billion for 30 Sep 2017, RM27.79 billion for 30 June 2017, RM31.71 billion for 31 March 2017, RM31.54 billion for
31 Dec 2016 and RM30.37 billion for 30 Sep 2016
33
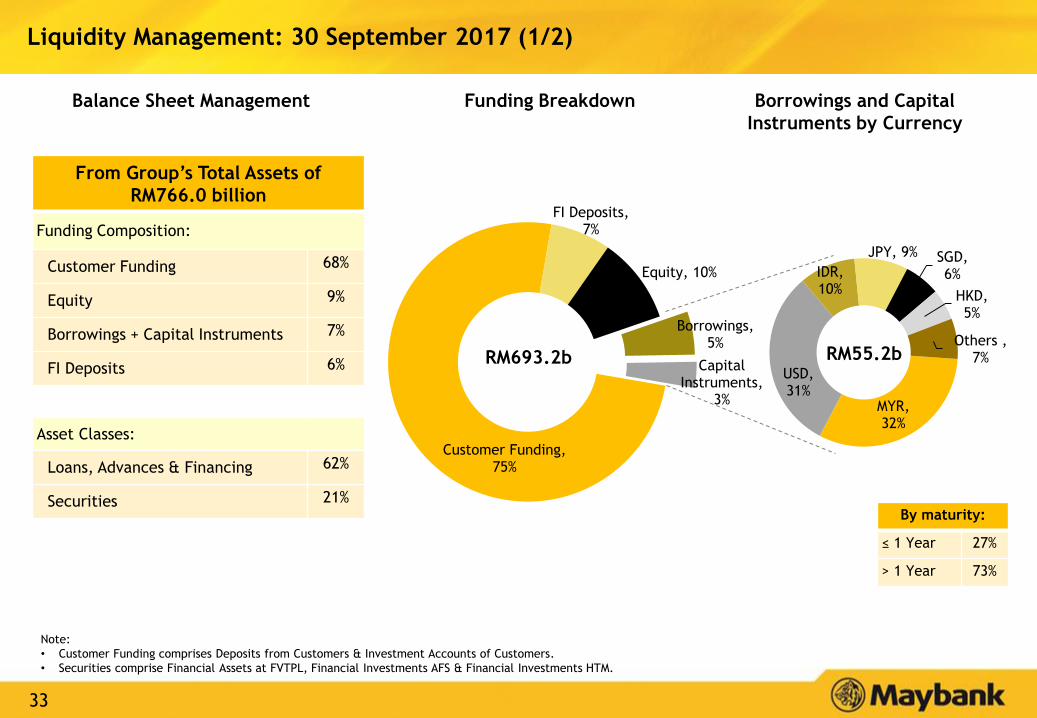
Borrowings, 5%
Capital Instruments,
3%
Customer Funding, 75%
FI Deposits, 7%
Equity, 10%
MYR, 32%
USD, 31%
IDR, 10%
JPY, 9% SGD, 6%
HKD, 5%
Others , 7%
Liquidity Management: 30 September 2017 (1/2)
Balance Sheet Management
RM693.2b RM55.2b
Funding Breakdown
Note:
• Customer Funding comprises Deposits from Customers & Investment Accounts of Customers.
• Securities comprise Financial Assets at FVTPL, Financial Investments AFS & Financial Investments HTM.
By maturity:
≤ 1 Year 27%
> 1 Year 73%
Borrowings and Capital
Instruments by Currency
From Group’s Total Assets of
RM766.0 billion
Funding Composition:
Customer Funding 68%
Equity 9%
Borrowings + Capital Instruments 7%
FI Deposits 6%
Asset Classes:
Loans, Advances & Financing 62%
Securities 21%

34
136.0%
151.9%
134.4%145.6%
137.0%
LCRMoving Towards More Reflective Liquidity Risk Indicators
Loan to
Deposits
Ratio
(LDR)
• Reflects simplistic assessment on deposits. It
ignores other funding instruments on the
balance sheet.
• Could be a contributor to the recurrence of
significant year-end spikes in the spread
between BNM’s OPR and 3-month KLIBOR.
• As financial institutions’ funding compositions
are more diversified today, traditional
indicators such as LDR are less relevant.
Loan to
Funding
Ratio
(LTF)
Loan to
Funding and
Equity Ratio
(LTFE)
Liquidity Management: 30 September 2017 (2/2)
𝐺𝑟𝑜𝑠𝑠 𝐿𝑜𝑎𝑛𝑠
𝐷𝑒𝑝𝑜𝑠𝑖𝑡𝑠 + 𝐵𝑜𝑟𝑟𝑜𝑤𝑖𝑛𝑔𝑠 + 𝑆𝑢𝑏𝑑𝑒𝑏𝑡
91.6%
93.9%
95.7%
93.8% 94.0%
83.2%
84.9%86.2%
85.5% 85.8%
73.7%75.1%
75.9%75.1% 75.4%
Sep 16 Dec 16 Mar 17 Jun 17 Sep 17
LDR LTF LTFE
𝐺𝑟𝑜𝑠𝑠 𝐿𝑜𝑎𝑛𝑠
𝐷𝑒𝑝𝑜𝑠𝑖𝑡𝑠 + 𝐵𝑜𝑟𝑟𝑜𝑤𝑖𝑛𝑔𝑠 + 𝑆𝑢𝑏𝑑𝑒𝑏𝑡 +𝐸𝑞𝑢𝑖𝑡𝑦 (𝑖𝑛𝑐𝑙𝑢𝑑𝑒𝑠 𝑐𝑎𝑝𝑖𝑡𝑎𝑙 𝑠𝑒𝑐𝑢𝑟𝑖𝑡𝑖𝑒𝑠)
Note: BNM’s minimum LCR requirement for 2017 is 80%.
As such, BNM has guided for the adoption of LCR and other liquidity
indicators to better reflect the stability and diversity of funding by a
financial institution. The other liquidity indicators are:
35
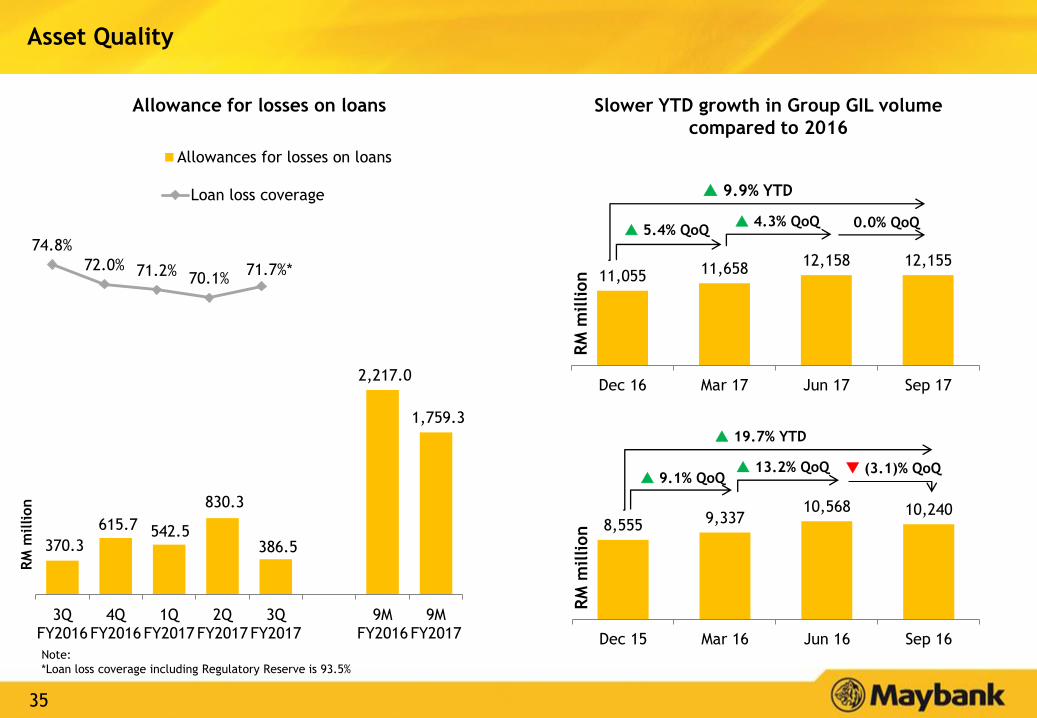
370.3
615.7 542.5
830.3
386.5
2,217.0
1,759.3
3QFY2016
4QFY2016
1QFY2017
2QFY2017
3QFY2017
9MFY2016
9MFY2017
Allowances for losses on loans
74.8%
72.0% 71.2%70.1%
71.7%*
Loan loss coverage
Allowance for losses on loans
Asset QualityR
M m
illion
Note:
*Loan loss coverage including Regulatory Reserve is 93.5%
11,055 11,65812,158 12,155
Dec 16 Mar 17 Jun 17 Sep 17
RM
million
9.9% YTD
4.3% QoQ 5.4% QoQ
8,555 9,33710,568 10,240
Dec 15 Mar 16 Jun 16 Sep 16
RM
million
19.7% YTD
13.2% QoQ 9.1% QoQ
(3.1)% QoQ
Slower YTD growth in Group GIL volume
compared to 2016
0.0% QoQ

36
Asset Quality for Group and Home Markets
Group GIL Ratio Composition
GIL Ratio Components Sep 2017 Jun 2017 Mar 2017 Dec 2016 Sep 2016
Non Performing Loans (NPL) 1.97% 1.79% 1.77% 1.64% 1.35%
Restructured & Rescheduled (R&R) 0.32% 0.37% 0.33% 0.39% 0.52%
Performing Loans Impaired Due to Judgmental/
Obligatory Triggers (IPL)0.21% 0.37% 0.30% 0.25% 0.35%
GIL Ratio 2.50% 2.53% 2.40% 2.28% 2.22%
2.14% 2.06% 2.13%
2.12% 2.06%
0.98%1.30%
1.68%
2.29% 2.31%
4.06%4.36% 4.55% 4.42% 4.47%
Sep 16 Dec 16 Mar 17 Jun 17 Sep 17
Malaysia Singapore Indonesia
GIL Ratio by Home Markets
37
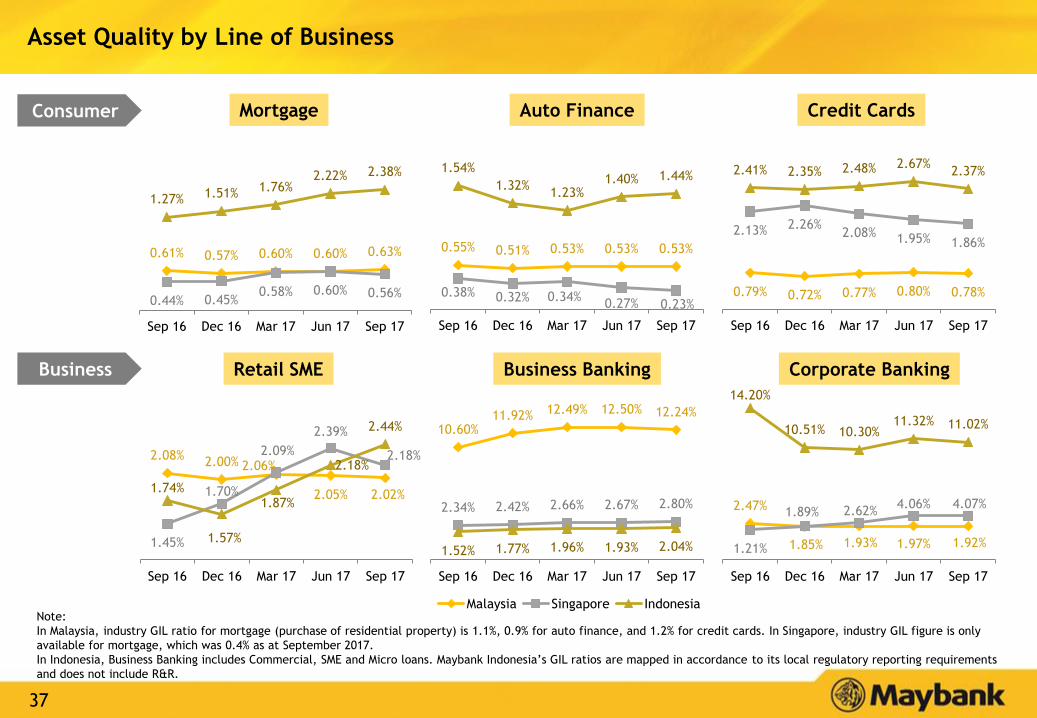
Asset Quality by Line of Business
Mortgage Auto Finance Credit Cards
Retail SME Business Banking Corporate Banking
Consumer
Business
Note:
In Malaysia, industry GIL ratio for mortgage (purchase of residential property) is 1.1%, 0.9% for auto finance, and 1.2% for credit cards. In Singapore, industry GIL figure is only
available for mortgage, which was 0.4% as at September 2017.
In Indonesia, Business Banking includes Commercial, SME and Micro loans. Maybank Indonesia’s GIL ratios are mapped in accordance to its local regulatory reporting requirements
and does not include R&R.
0.61% 0.57% 0.60% 0.60% 0.63%
0.44% 0.45%0.58% 0.60% 0.56%
1.27% 1.51% 1.76%2.22% 2.38%
Sep 16 Dec 16 Mar 17 Jun 17 Sep 17
2.08%2.00% 2.06%
2.05% 2.02%
1.45%
1.70%
2.09%
2.39%
2.18%
1.74%
1.57%
1.87%
2.18%
2.44%
Sep 16 Dec 16 Mar 17 Jun 17 Sep 17
0.55% 0.51% 0.53% 0.53% 0.53%
0.38% 0.32% 0.34%0.27% 0.23%
1.54%
1.32%1.23%
1.40% 1.44%
Sep 16 Dec 16 Mar 17 Jun 17 Sep 17
0.79% 0.72% 0.77% 0.80% 0.78%
2.13% 2.26%2.08% 1.95% 1.86%
2.41% 2.35% 2.48% 2.67%2.37%
Sep 16 Dec 16 Mar 17 Jun 17 Sep 17
10.60%11.92% 12.49% 12.50% 12.24%
2.34% 2.42% 2.66% 2.67% 2.80%
1.52% 1.77% 1.96% 1.93% 2.04%
Sep 16 Dec 16 Mar 17 Jun 17 Sep 17
Malaysia Singapore Indonesia
14.20%
10.51% 10.30%11.32% 11.02%
2.47%
1.85% 1.93% 1.97% 1.92%1.21%
1.89% 2.62%4.06% 4.07%
Sep 16 Dec 16 Mar 17 Jun 17 Sep 17
38
40%
3%
42%
15%
Normal
Special Mention Account
Watchlist
GIL
32%
34%
6%
28%
Upstream
Supporting Upstream
Downstream
Supporting Downstream
88% comes
from
supporting
upstream
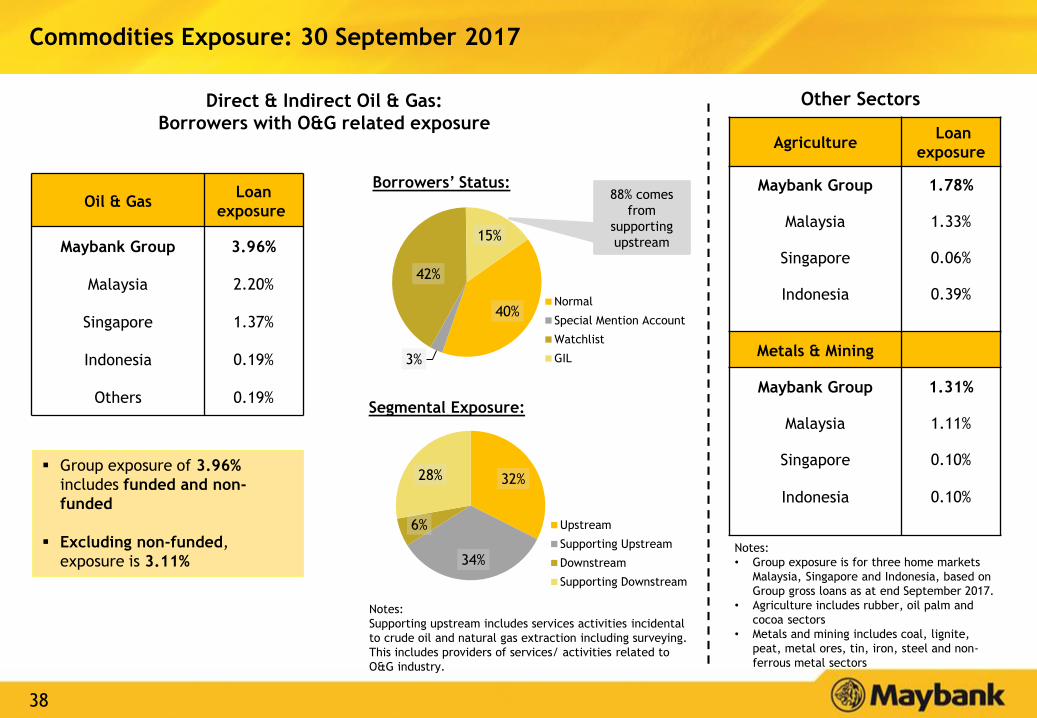
Commodities Exposure: 30 September 2017
Notes:
• Group exposure is for three home markets
Malaysia, Singapore and Indonesia, based on
Group gross loans as at end September 2017.
• Agriculture includes rubber, oil palm and
cocoa sectors
• Metals and mining includes coal, lignite,
peat, metal ores, tin, iron, steel and non-
ferrous metal sectors
AgricultureLoan
exposure
Maybank Group 1.78%
Malaysia 1.33%
Singapore 0.06%
Indonesia 0.39%
Metals & Mining
Maybank Group 1.31%
Malaysia 1.11%
Singapore 0.10%
Indonesia 0.10%
Borrowers’ Status:
Segmental Exposure:
Direct & Indirect Oil & Gas:
Borrowers with O&G related exposure
Other Sectors
Notes:
Supporting upstream includes services activities incidental
to crude oil and natural gas extraction including surveying.
This includes providers of services/ activities related to
O&G industry.
Oil & GasLoan
exposure
Maybank Group 3.96%
Malaysia 2.20%
Singapore 1.37%
Indonesia 0.19%
Others 0.19%
Group exposure of 3.96%
includes funded and non-
funded
Excluding non-funded,
exposure is 3.11%
39
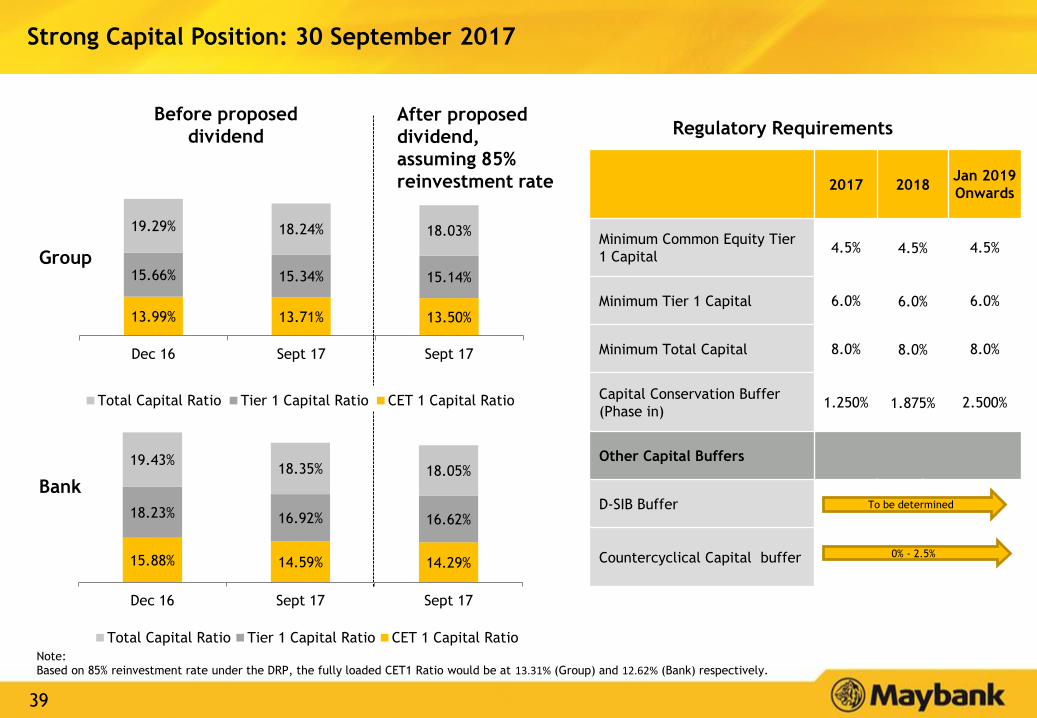
13.99% 13.71% 13.50%
15.66% 15.34% 15.14%
19.29% 18.24% 18.03%
Dec 16 Sept 17 Sept 17
Total Capital Ratio Tier 1 Capital Ratio CET 1 Capital Ratio
Group
Bank
Strong Capital Position: 30 September 2017
Before proposed
dividend
After proposed
dividend,
assuming 85%
reinvestment rate 2017 2018Jan 2019
Onwards
Minimum Common Equity Tier
1 Capital4.5% 4.5% 4.5%
Minimum Tier 1 Capital 6.0% 6.0% 6.0%
Minimum Total Capital 8.0% 8.0% 8.0%
Capital Conservation Buffer
(Phase in)1.250% 1.875% 2.500%
Other Capital Buffers
D-SIB Buffer
Countercyclical Capital buffer
Regulatory Requirements
To be determined
0% - 2.5%
Note: Based on 85% reinvestment rate under the DRP, the fully loaded CET1 Ratio would be at 13.31% (Group) and 12.62% (Bank) respectively.
15.88% 14.59% 14.29%
18.23% 16.92% 16.62%
19.43%18.35% 18.05%
Dec 16 Sept 17 Sept 17
Total Capital Ratio Tier 1 Capital Ratio CET 1 Capital Ratio
40
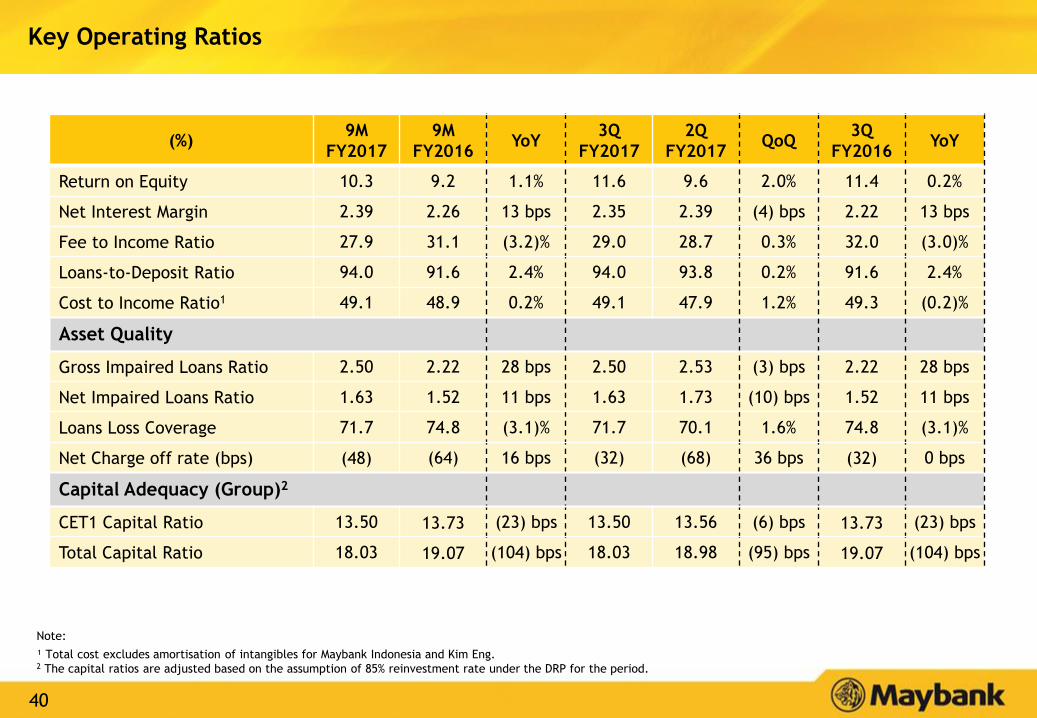
Key Operating Ratios
(%)9M
FY2017
9M
FY2016YoY
3Q
FY2017
2Q
FY2017QoQ
3Q
FY2016YoY
Return on Equity 10.3 9.2 1.1% 11.6 9.6 2.0% 11.4 0.2%
Net Interest Margin 2.39 2.26 13 bps 2.35 2.39 (4) bps 2.22 13 bps
Fee to Income Ratio 27.9 31.1 (3.2)% 29.0 28.7 0.3% 32.0 (3.0)%
Loans-to-Deposit Ratio 94.0 91.6 2.4% 94.0 93.8 0.2% 91.6 2.4%
Cost to Income Ratio1 49.1 48.9 0.2% 49.1 47.9 1.2% 49.3 (0.2)%
Asset Quality
Gross Impaired Loans Ratio 2.50 2.22 28 bps 2.50 2.53 (3) bps 2.22 28 bps
Net Impaired Loans Ratio 1.63 1.52 11 bps 1.63 1.73 (10) bps 1.52 11 bps
Loans Loss Coverage 71.7 74.8 (3.1)% 71.7 70.1 1.6% 74.8 (3.1)%
Net Charge off rate (bps) (48) (64) 16 bps (32) (68) 36 bps (32) 0 bps
Capital Adequacy (Group)2
CET1 Capital Ratio 13.50 13.73 (23) bps 13.50 13.56 (6) bps 13.73 (23) bps
Total Capital Ratio 18.03 19.07 (104) bps 18.03 18.98 (95) bps 19.07 (104) bps
Note:
¹ Total cost excludes amortisation of intangibles for Maybank Indonesia and Kim Eng.2 The capital ratios are adjusted based on the assumption of 85% reinvestment rate under the DRP for the period.
41
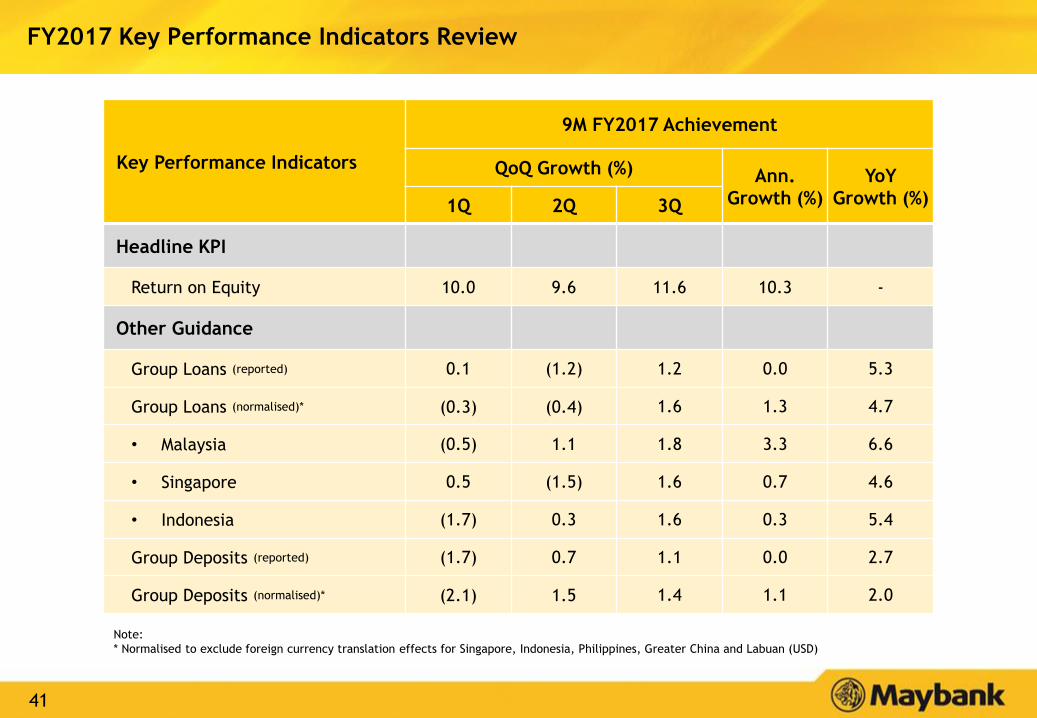
FY2017 Key Performance Indicators Review
Note:
* Normalised to exclude foreign currency translation effects for Singapore, Indonesia, Philippines, Greater China and Labuan (USD)
Key Performance Indicators
9M FY2017 Achievement
QoQ Growth (%) Ann.
Growth (%)
YoY
Growth (%)1Q 2Q 3Q
Headline KPI
Return on Equity 10.0 9.6 11.6 10.3 -
Other Guidance
Group Loans (reported) 0.1 (1.2) 1.2 0.0 5.3
Group Loans (normalised)* (0.3) (0.4) 1.6 1.3 4.7
• Malaysia (0.5) 1.1 1.8 3.3 6.6
• Singapore 0.5 (1.5) 1.6 0.7 4.6
• Indonesia (1.7) 0.3 1.6 0.3 5.4
Group Deposits (reported) (1.7) 0.7 1.1 0.0 2.7
Group Deposits (normalised)* (2.1) 1.5 1.4 1.1 2.0
42
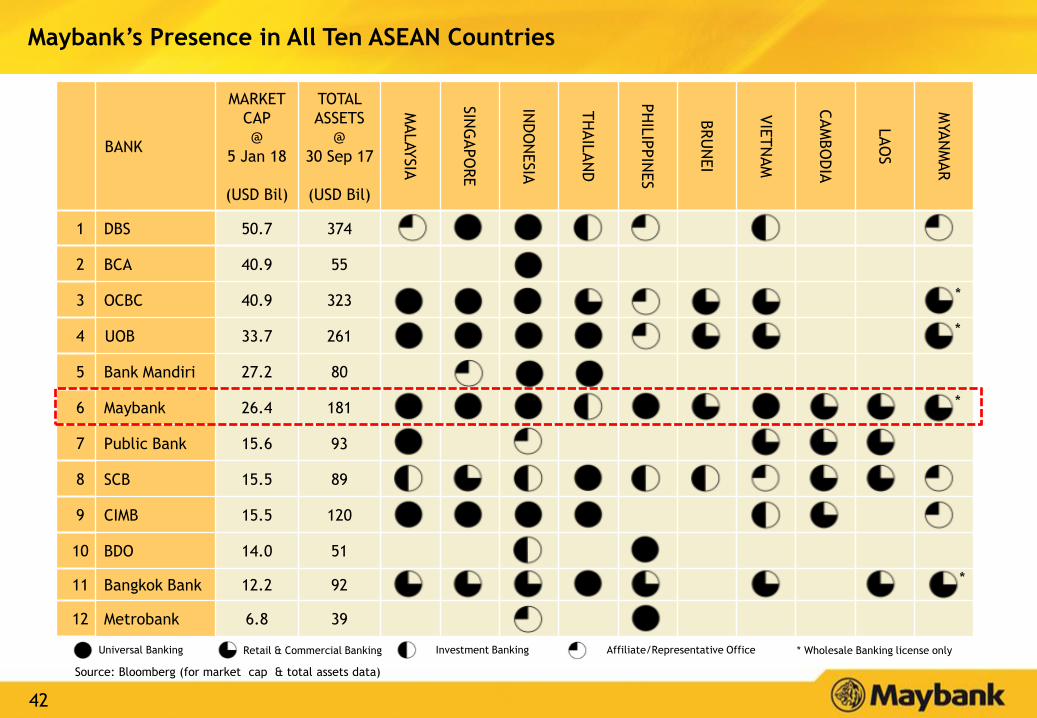
Universal Banking Retail & Commercial Banking Investment Banking Affiliate/Representative Office * Wholesale Banking license only
Source: Bloomberg (for market cap & total assets data)
Maybank’s Presence in All Ten ASEAN Countries
BANK
MARKET
CAP
@
5 Jan 18
(USD Bil)
TOTAL
ASSETS
@
30 Sep 17
(USD Bil)
MALAYSIA
SIN
GAPO
RE
IND
ON
ESIA
TH
AIL
AN
D
PH
ILIP
PIN
ES
BRU
NEI
VIE
TN
AM
CAM
BO
DIA
LAO
S
MYA
NM
AR
1 DBS 50.7 374
2 BCA 40.9 55
3 OCBC 40.9 323
4 UOB 33.7 261
5 Bank Mandiri 27.2 80
6 Maybank 26.4 181
7 Public Bank 15.6 93
8 SCB 15.5 89
9 CIMB 15.5 120
10 BDO 14.0 51
11 Bangkok Bank 12.2 92
12 Metrobank 6.8 39
*
*
*
*
43
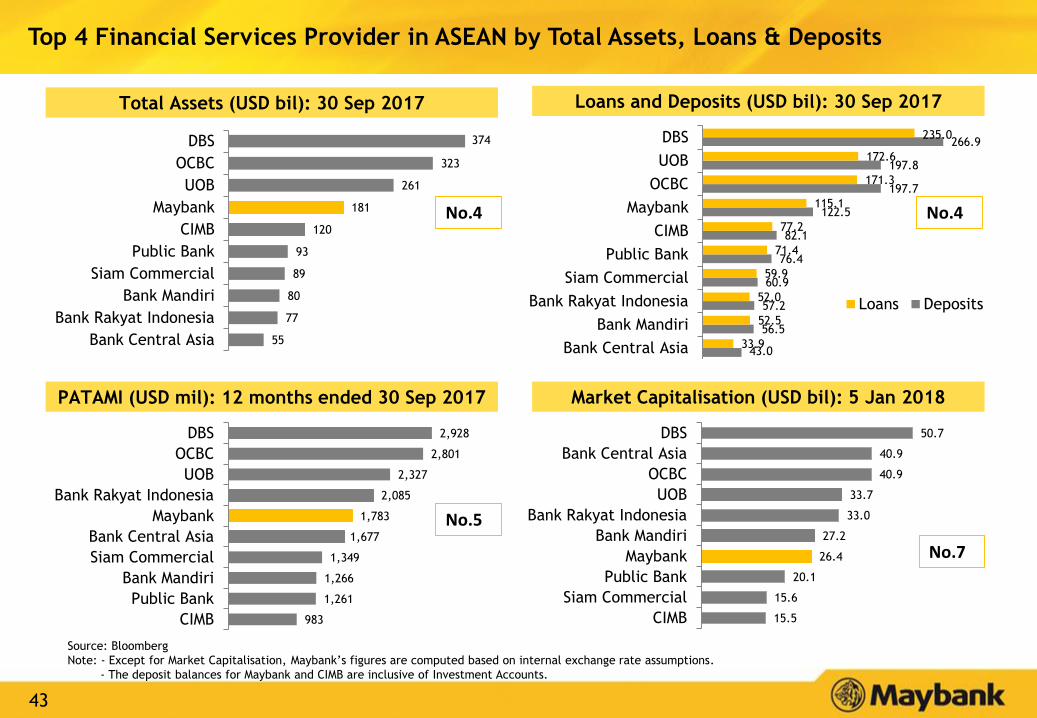
Top 4 Financial Services Provider in ASEAN by Total Assets, Loans & Deposits
50.7
40.9
40.9
33.7
33.0
27.2
26.4
20.1
15.6
15.5
DBS
Bank Central Asia
OCBC
UOB
Bank Rakyat Indonesia
Bank Mandiri
Maybank
Public Bank
Siam Commercial
CIMB
55
77
80
89
93
120
181
261
323
374
Bank Central Asia
Bank Rakyat Indonesia
Bank Mandiri
Siam Commercial
Public Bank
CIMB
Maybank
UOB
OCBC
DBS
43.0
56.5
57.2
60.9
76.4
82.1
122.5
197.7
197.8
266.9
33.9
52.5
52.0
59.9
71.4
77.2
115.1
171.3
172.6
235.0
Bank Central Asia
Bank Mandiri
Bank Rakyat Indonesia
Siam Commercial
Public Bank
CIMB
Maybank
OCBC
UOB
DBS
Loans Deposits
983
1,261
1,266
1,349
1,677
1,783
2,085
2,327
2,801
2,928
CIMB
Public Bank
Bank Mandiri
Siam Commercial
Bank Central Asia
Maybank
Bank Rakyat Indonesia
UOB
OCBC
DBS
No.7
No.4 No.4
No.5
Total Assets (USD bil): 30 Sep 2017 Loans and Deposits (USD bil): 30 Sep 2017
PATAMI (USD mil): 12 months ended 30 Sep 2017 Market Capitalisation (USD bil): 5 Jan 2018
Source: Bloomberg
Note: - Except for Market Capitalisation, Maybank’s figures are computed based on internal exchange rate assumptions.
- The deposit balances for Maybank and CIMB are inclusive of Investment Accounts.
44
Table of Contents
Appendix:
1. Financial Performance 32
2. Community Financial Services 45
3. Global Banking 49
4. Maybank Singapore 53
5. Maybank Indonesia 56
6. Other segments 60
7. Affiliates 65

45
Community Financial Services: Overview of Market Share for Malaysia
Note:¹ Rebased market share due to adjustment made to Industry data by BNM from
Jan-15 to Jun-17.
* Refers to housing, shophouse and other mortgage loans
** Credit cards market share refer to receivables for commercial
*** Total bank deposits inclusive of investment asset (“IA”)
^ Without IA. With IA, the market share as at June’17 for Total Core Retail Deposits,
Retail CASA, Retail Savings, Demand Deposits and Retail Fixed Deposits are 19.1%,
25.8%, 28.3%, 21.9% and 16.5% respectively (against MBB retail IA).
^^ Excluding non-financial transactions as per BNM guidelines
^^^ Industry numbers only available half yearly
46
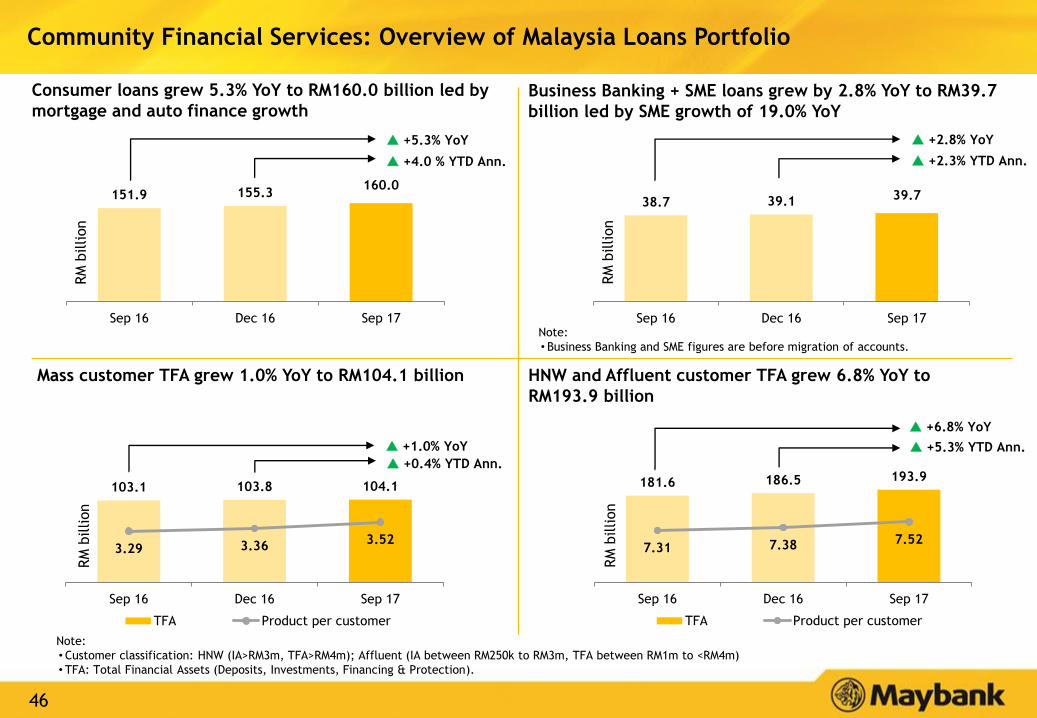
Business Banking + SME loans grew by 2.8% YoY to RM39.7
billion led by SME growth of 19.0% YoY
Community Financial Services: Overview of Malaysia Loans Portfolio
181.6 186.5 193.9
7.31 7.38 7.52
Sep 16 Dec 16 Sep 17
TFA Product per customer
103.1 103.8 104.1
3.29 3.363.52
Sep 16 Dec 16 Sep 17
TFA Product per customer
38.7 39.1 39.7
Sep 16 Dec 16 Sep 17
151.9 155.3160.0
Sep 16 Dec 16 Sep 17
+5.3% YoY
Consumer loans grew 5.3% YoY to RM160.0 billion led by
mortgage and auto finance growth
Note:
• Customer classification: HNW (IA>RM3m, TFA>RM4m); Affluent (IA between RM250k to RM3m, TFA between RM1m to <RM4m)
• TFA: Total Financial Assets (Deposits, Investments, Financing & Protection).
+4.0 % YTD Ann.
HNW and Affluent customer TFA grew 6.8% YoY to
RM193.9 billion
Mass customer TFA grew 1.0% YoY to RM104.1 billion
+2.8% YoY
+2.3% YTD Ann.
RM
billion
+1.0% YoY
RM
billion
+6.8% YoY
RM
billion
RM
billion
+5.3% YTD Ann.
Note:
• Business Banking and SME figures are before migration of accounts.
+0.4% YTD Ann.
47
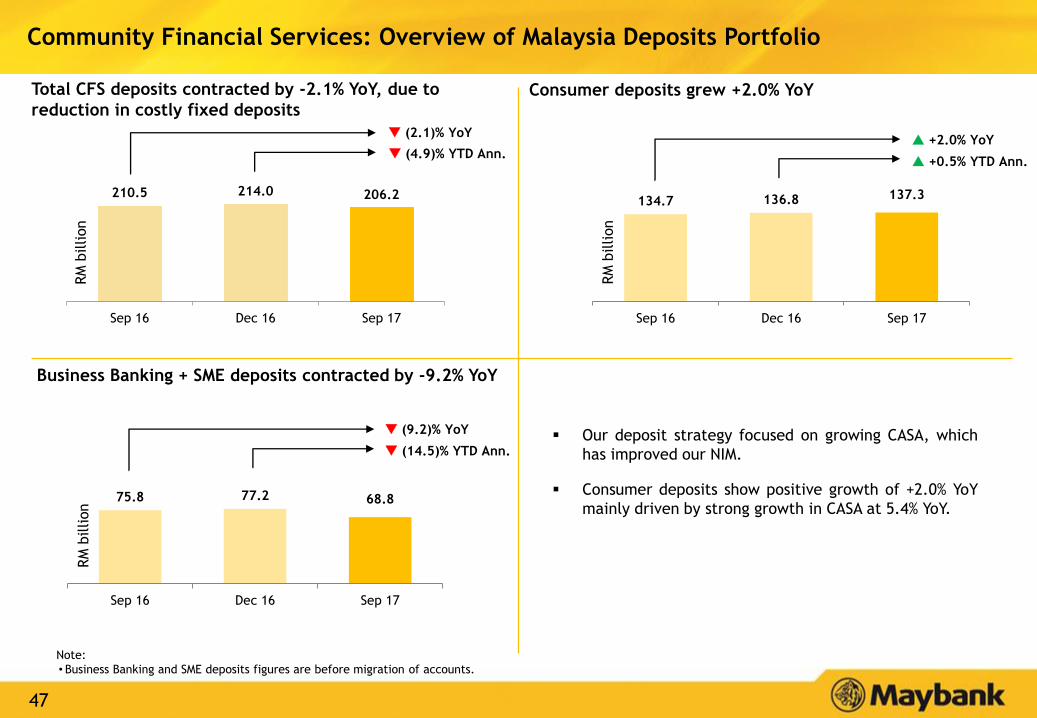
Community Financial Services: Overview of Malaysia Deposits Portfolio
210.5 214.0 206.2
Sep 16 Dec 16 Sep 17
(4.9)% YTD Ann.
134.7 136.8 137.3
Sep 16 Dec 16 Sep 17
+2.0% YoY
+0.5% YTD Ann.
Our deposit strategy focused on growing CASA, which
has improved our NIM.
Consumer deposits show positive growth of +2.0% YoY
mainly driven by strong growth in CASA at 5.4% YoY.75.8 77.2 68.8
Sep 16 Dec 16 Sep 17
(9.2)% YoY
(14.5)% YTD Ann.
RM
billion
Total CFS deposits contracted by -2.1% YoY, due to
reduction in costly fixed deposits
Business Banking + SME deposits contracted by -9.2% YoY
Consumer deposits grew +2.0% YoY
(2.1)% YoY
RM
billion
RM
billion
Note:
• Business Banking and SME deposits figures are before migration of accounts.
48
Table of Contents
Appendix:
1. Financial Performance 32
2. Community Financial Services 45
3. Global Banking 49
4. Maybank Singapore 53
5. Maybank Indonesia 56
6. Other segments 60
7. Affiliates 65
49
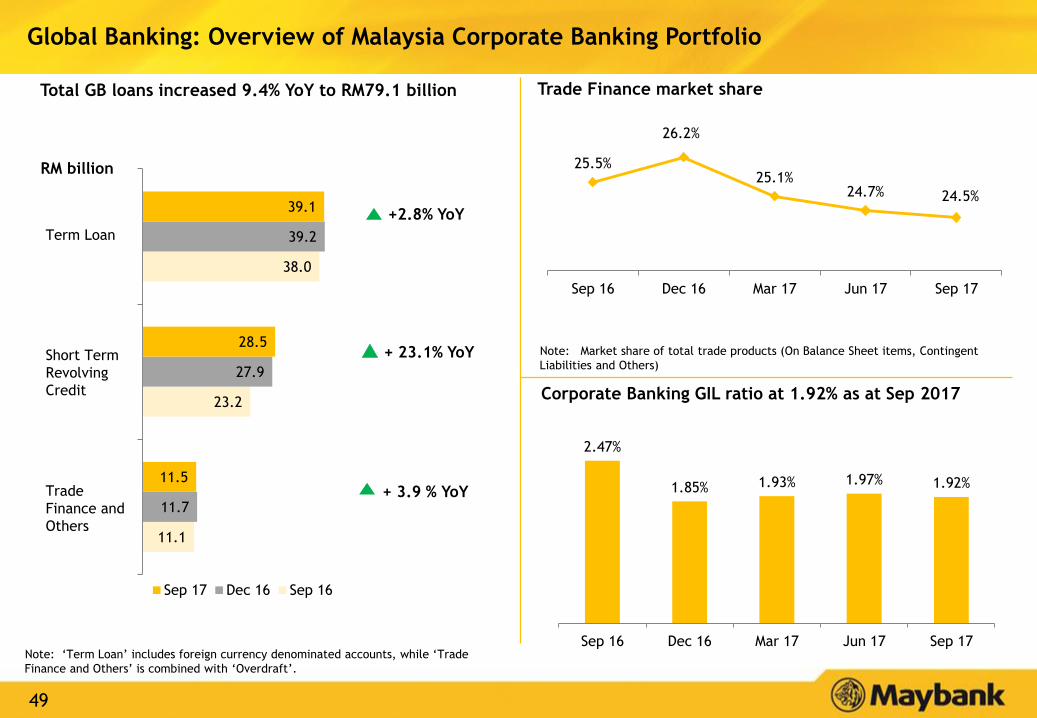
11.1
23.2
38.0
11.7
27.9
39.2
11.5
28.5
39.1
Sep 17 Dec 16 Sep 16
RM billion
Note: ‘Term Loan’ includes foreign currency denominated accounts, while ‘Trade
Finance and Others’ is combined with ‘Overdraft’.
Term Loan
Global Banking: Overview of Malaysia Corporate Banking Portfolio
Trade Finance market shareTotal GB loans increased 9.4% YoY to RM79.1 billion
Corporate Banking GIL ratio at 1.92% as at Sep 2017
Short Term
Revolving
Credit
Trade
Finance and
Others
Note: Market share of total trade products (On Balance Sheet items, Contingent
Liabilities and Others) + 23.1% YoY
+ 3.9 % YoY
+2.8% YoY
25.5%
26.2%
25.1%24.7% 24.5%
Sep 16 Dec 16 Mar 17 Jun 17 Sep 17
2.47%
1.85% 1.93% 1.97% 1.92%
Sep 16 Dec 16 Mar 17 Jun 17 Sep 17

50
Others, 69.1%
AAA, 14.3%
AA, 14.8%
A, 0.3%
< A, 0.2%
Commercial Papers, 1.3%
RM26.7
billion
24.7%
21.3%29.1%
19.0%
5.9%
RM 160.2
billion
Government
Securities
- Domestic
Government
Securities
- Foreign
PDS/Corp
Bonds
- Domestic
PDS –
Foreign
Others
(NIDs, BA, etc)
19.2%
25.2%28.7%
17.5%
9.4%
RM 138.0
billion
Government
Securities
- Domestic
Government
Securities
- Foreign
PDS/Corp
Bonds
- Domestic
PDS –
Foreign
Others
(NIDs, BA, etc)
Group Securities Portfolio¹: 40.3% Foreign Securities as at 9M FY2017
Group Securities Portfolio¹ grew 16.1% YoY
29% of PDS (Maybank Conventional Malaysia) rated “AA” or
above as at 9M FY2017
Global Banking: Overview of Group Securities and Global Markets Portfolio
9M FY20179M FY2016
61.4 57.968.2 67.7 73.6
63.762.8
68.6 71.477.1
12.910.2
11.9 9.6
9.5
Sep 16 Dec 16 Mar 17 Jun 17 Sep 17
Govt. Securities PDS/Corp Bonds Others
+16.1 %
RM
billion
138.0130.9
148.7 148.7
9M FY2016 9M FY2017
Note:
¹ Group Securities Portfolio is inclusive of Financial assets designated upon initial
recognition( part of FVTPL)
160.2
Note: ‘Others’ category refers to Government Guaranteed bonds, Partially Government
Guaranteed bonds and non rated bonds
Others, 47.3%
AAA, 21.2%
AA, 18.8%
A, 3.0%
< A, 0.6%
Commercial Papers,
9.1%
RM27.2
billion

51
Malaysia37%
Singapore26%
Thailand22%
Indonesia4%
Philippines2%
Hong Kong5%
Others4%
9M FY2017 Brokerage Market Share by Country
1 Singapore & Vietnam’s YTD ranking data are not available.
Note: Maybank Kim Eng represents the combined business of Maybank IB and business
segments under Maybank Kim Eng Holdings
Global Banking: Overview of Group Investment Banking Portfolio
Country RankMarket
Share
Trading Value
(USD’mil)
Thailand 1 6.9% 31,842.9
Malaysia 2 10.0% 20,866.0
Philippines 7 4.4% 2,598.7
Indonesia >10 2.2% 4,255.7
Hong Kong Tier 2 0.6% 23,608.2
Singapore N/A1 3.9% 12,754.0
Vietnam N/A1 2.0% 1,524.1
9M FY2017 Fee-based Income for Malaysia
Brokerage Fees50.7%
Arranger Fees8.9%
Underwriting & Placement
Fees9.3%
Advisory Fees11.0%
Agency/ Guarantee Fees
3.5%
Other Fee Income16.7%
9M FY2017 Total Income Breakdown by Country
RM992.7 mil
Total Income for Maybank Kim Eng
1,065.3992.7
9M FY2016 9M FY2017
(6.8)%
RM
mil
52
Table of Contents
Appendix:
1. Financial Performance 32
2. Community Financial Services 45
3. Global Banking 49
4. Maybank Singapore 53
5. Maybank Indonesia 56
6. Other segments 60
7. Affiliates 65
53
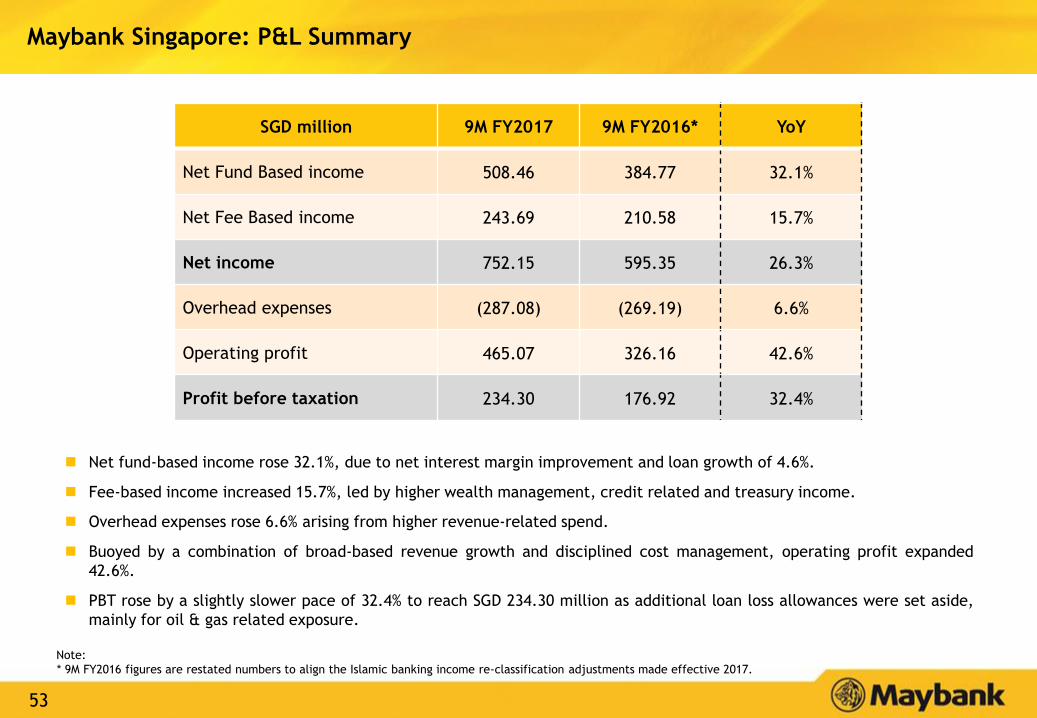
Maybank Singapore: P&L Summary
SGD million 9M FY2017 9M FY2016* YoY
Net Fund Based income 508.46 384.77 32.1%
Net Fee Based income 243.69 210.58 15.7%
Net income 752.15 595.35 26.3%
Overhead expenses (287.08) (269.19) 6.6%
Operating profit 465.07 326.16 42.6%
Profit before taxation 234.30 176.92 32.4%
Net fund-based income rose 32.1%, due to net interest margin improvement and loan growth of 4.6%.
Fee-based income increased 15.7%, led by higher wealth management, credit related and treasury income.
Overhead expenses rose 6.6% arising from higher revenue-related spend.
Buoyed by a combination of broad-based revenue growth and disciplined cost management, operating profit expanded
42.6%.
PBT rose by a slightly slower pace of 32.4% to reach SGD 234.30 million as additional loan loss allowances were set aside,
mainly for oil & gas related exposure.
Note:
* 9M FY2016 figures are restated numbers to align the Islamic banking income re-classification adjustments made effective 2017.
54
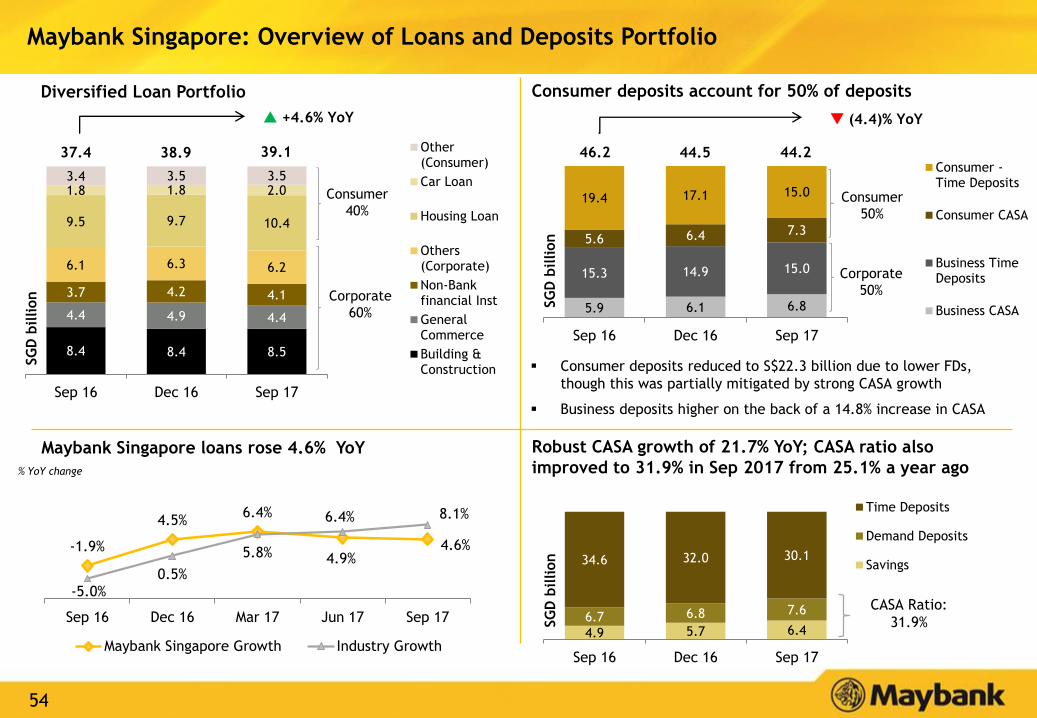
5.9 6.1 6.8
15.3 14.9 15.0
5.6 6.4 7.3
19.4 17.1 15.0
Sep 16 Dec 16 Sep 17
Consumer -Time Deposits
Consumer CASA
Business TimeDeposits
Business CASA
4.9 5.7 6.46.7 6.8 7.6
34.6 32.0 30.1
Sep 16 Dec 16 Sep 17
Time Deposits
Demand Deposits
Savings
8.4 8.4 8.5
4.4 4.9 4.4
3.7 4.2 4.1
6.1 6.3 6.2
9.5 9.7 10.4
1.8 1.8 2.03.4 3.5 3.5
Sep 16 Dec 16 Sep 17
Other(Consumer)
Car Loan
Housing Loan
Others(Corporate)
Non-Bankfinancial Inst
GeneralCommerce
Building &Construction
Maybank Singapore loans rose 4.6% YoY
Diversified Loan Portfolio
38.9
Consumer
40%
Corporate
60%
-1.9%
4.5%6.4%
4.9%4.6%
-5.0%0.5%
5.8%
6.4% 8.1%
Sep 16 Dec 16 Mar 17 Jun 17 Sep 17
Maybank Singapore Growth Industry Growth
+4.6% YoY
Maybank Singapore: Overview of Loans and Deposits Portfolio
% YoY change
39.137.4
(4.4)% YoY
Consumer
50%
Corporate
50%
SG
D b
illion
Consumer deposits account for 50% of deposits
SG
D b
illion
CASA Ratio:
31.9%SG
D b
illion
Robust CASA growth of 21.7% YoY; CASA ratio also
improved to 31.9% in Sep 2017 from 25.1% a year ago
Consumer deposits reduced to S$22.3 billion due to lower FDs,
though this was partially mitigated by strong CASA growth
Business deposits higher on the back of a 14.8% increase in CASA
44.5 44.246.2
55
Table of Contents
Appendix:
1. Financial Performance 32
2. Community Financial Services 45
3. Global Banking 49
4. Maybank Singapore 53
5. Maybank Indonesia 56
6. Other segments 60
7. Affiliates 65
56
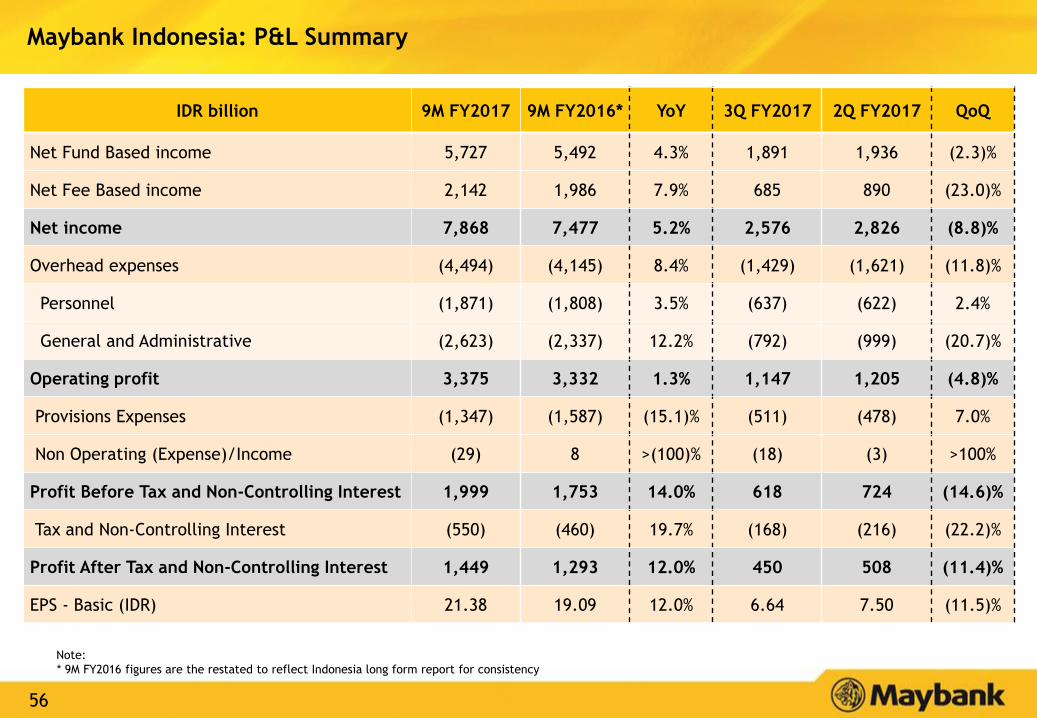
Maybank Indonesia: P&L Summary
IDR billion 9M FY2017 9M FY2016* YoY 3Q FY2017 2Q FY2017 QoQ
Net Fund Based income 5,727 5,492 4.3% 1,891 1,936 (2.3)%
Net Fee Based income 2,142 1,986 7.9% 685 890 (23.0)%
Net income 7,868 7,477 5.2% 2,576 2,826 (8.8)%
Overhead expenses (4,494) (4,145) 8.4% (1,429) (1,621) (11.8)%
Personnel (1,871) (1,808) 3.5% (637) (622) 2.4%
General and Administrative (2,623) (2,337) 12.2% (792) (999) (20.7)%
Operating profit 3,375 3,332 1.3% 1,147 1,205 (4.8)%
Provisions Expenses (1,347) (1,587) (15.1)% (511) (478) 7.0%
Non Operating (Expense)/Income (29) 8 >(100)% (18) (3) >100%
Profit Before Tax and Non-Controlling Interest 1,999 1,753 14.0% 618 724 (14.6)%
Tax and Non-Controlling Interest (550) (460) 19.7% (168) (216) (22.2)%
Profit After Tax and Non-Controlling Interest 1,449 1,293 12.0% 450 508 (11.4)%
EPS - Basic (IDR) 21.38 19.09 12.0% 6.64 7.50 (11.5)%
Note:
* 9M FY2016 figures are the restated to reflect Indonesia long form report for consistency
57
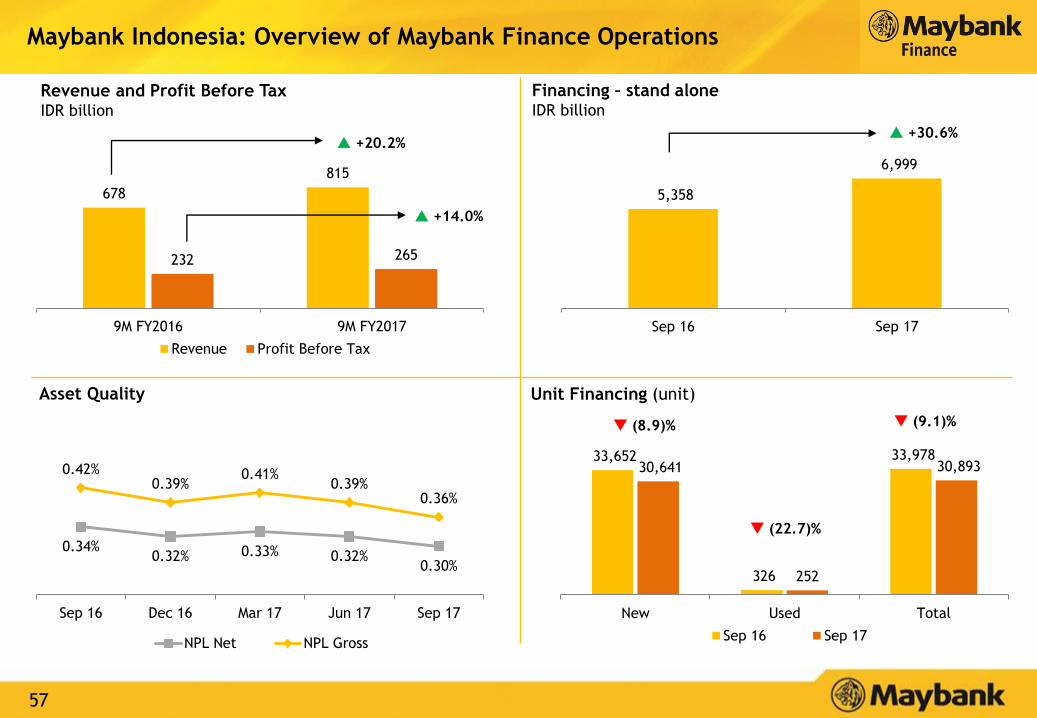
33,652
326
33,978 30,641
252
30,893
New Used Total
Sep 16 Sep 17
678
815
232 265
9M FY2016 9M FY2017
Revenue Profit Before Tax
Financing – stand aloneIDR billion
(8.9)%
(22.7)%
(9.1)%
+20.2% +30.6%
Asset Quality Unit Financing (unit)
Revenue and Profit Before Tax IDR billion
Maybank Indonesia: Overview of Maybank Finance Operations
+14.0%
0.34%0.32% 0.33% 0.32%
0.30%
0.42%0.39%
0.41%0.39%
0.36%
Sep 16 Dec 16 Mar 17 Jun 17 Sep 17
NPL Net NPL Gross
5,358
6,999
Sep 16 Sep 17
58
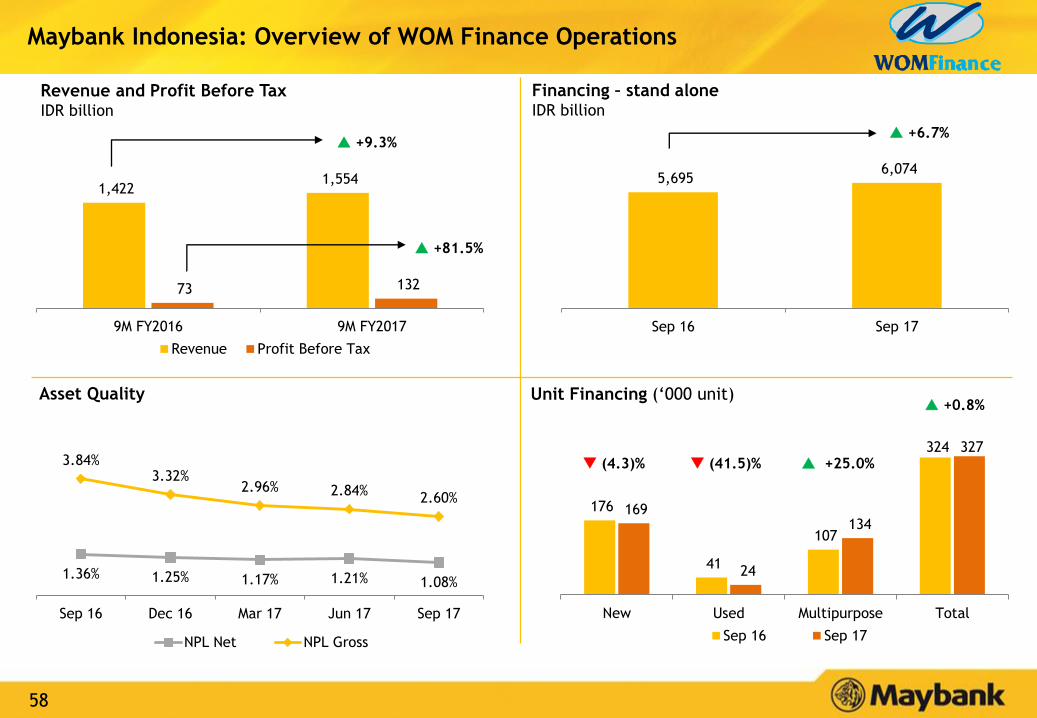
176
41
107
324
169
24
134
327
New Used Multipurpose Total
Sep 16 Sep 17
1,422 1,554
73 132
9M FY2016 9M FY2017
Revenue Profit Before Tax
Financing – stand aloneIDR billion
+9.3% +6.7%
Asset Quality Unit Financing (‘000 unit)
Revenue and Profit Before Tax IDR billion
+81.5%
1.36% 1.25% 1.17% 1.21% 1.08%
3.84%3.32%
2.96% 2.84%2.60%
Sep 16 Dec 16 Mar 17 Jun 17 Sep 17
NPL Net NPL Gross
5,695 6,074
Sep 16 Sep 17
(4.3)% (41.5)%
+0.8%
+25.0%
Maybank Indonesia: Overview of WOM Finance Operations
59
Table of Contents
Appendix:
1. Financial Performance 32
2. Community Financial Services 45
3. Global Banking 49
4. Maybank Singapore 53
5. Maybank Indonesia 56
6. Other segments 60
7. Affiliates 65
60
31.1
36.4
33.0
5.3
18.1 16.9
32.2
41.2
34.5
5.8
20.6 23.0
AITAB Mortgage Term Financing Others (CFS) Term Financing Others (GB)
RM
billion
Sep-16 Sep-17
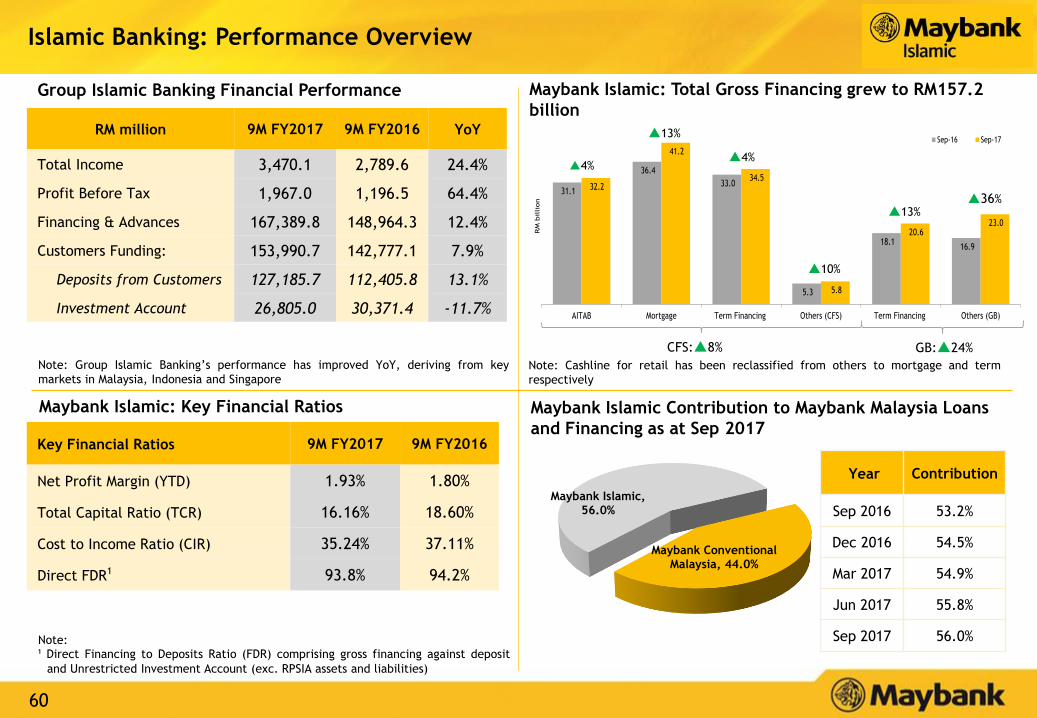
Islamic Banking: Performance Overview
Group Islamic Banking Financial Performance
Maybank Islamic: Key Financial Ratios
Maybank Islamic: Total Gross Financing grew to RM157.2
billion
CFS:8%
RM million 9M FY2017 9M FY2016 YoY
Total Income 3,470.1 2,789.6 24.4%
Profit Before Tax 1,967.0 1,196.5 64.4%
Financing & Advances 167,389.8 148,964.3 12.4%
Customers Funding: 153,990.7 142,777.1 7.9%
Deposits from Customers 127,185.7 112,405.8 13.1%
Investment Account 26,805.0 30,371.4 -11.7%
Key Financial Ratios 9M FY2017 9M FY2016
Net Profit Margin (YTD) 1.93% 1.80%
Total Capital Ratio (TCR) 16.16% 18.60%
Cost to Income Ratio (CIR) 35.24% 37.11%
Direct FDR1 93.8% 94.2%
Maybank Islamic Contribution to Maybank Malaysia Loans
and Financing as at Sep 2017
Year Contribution
Sep 2016 53.2%
Dec 2016 54.5%
Mar 2017 54.9%
Jun 2017 55.8%
Sep 2017 56.0%Note:¹ Direct Financing to Deposits Ratio (FDR) comprising gross financing against deposit
and Unrestricted Investment Account (exc. RPSIA assets and liabilities)
GB:24%
13%
4%
10%
36%
4%
13%
Note: Cashline for retail has been reclassified from others to mortgage and term
respectively
Note: Group Islamic Banking’s performance has improved YoY, deriving from key
markets in Malaysia, Indonesia and Singapore
Maybank Islamic, 56.0%
Maybank Conventional Malaysia, 44.0%

61
Maybank Islamic Market Share (Malaysia) as of Sep 17
Maybank Islamic ranks No.1 by Asset Market Share
in Malaysia
Source: BNM monthly statistical bulletin and latest respective Bank’s Financial
Statements
MalaysiaAsset Market Share
Jun 17Rank
Maybank Islamic 30% 1
CIMB Islamic 12% 2
Public Islamic 9% 3
Source: Bloomberg
Sukuk League Table Ranking Sep 2017
Key Products Sep 17 Sep 16
Automobile Financing 44.9% 43.7%
Home 27.9% 28.1%
Term Financing 29.6% 30.3%
Source for industry numbers: BNM Monthly Statistical Bulletin
Islamic Banking: Market Share
Market Share by Product (Malaysia) as of Sep 17
Source for industry numbers: BNM Monthly Statistical Bulletin
Market Share
(%)
Amount
(USD million)Issues
#2 Maybank 10.15% 4,203 98
Market Share
(%)
Amount
(USD million)Issues
#1 Maybank 29.69% 19,907 143
Global Sukuk League Table
Ranking
MYR Sukuk League Table
Ranking
33.5%34.1%
33.5% 33.6% 33.6%
30.4% 30.4%29.8% 29.6% 29.7%
Sep-16 Dec-16 Mar-17 Jun-17 Sep-17
Financing Deposits & Investment Accounts
62
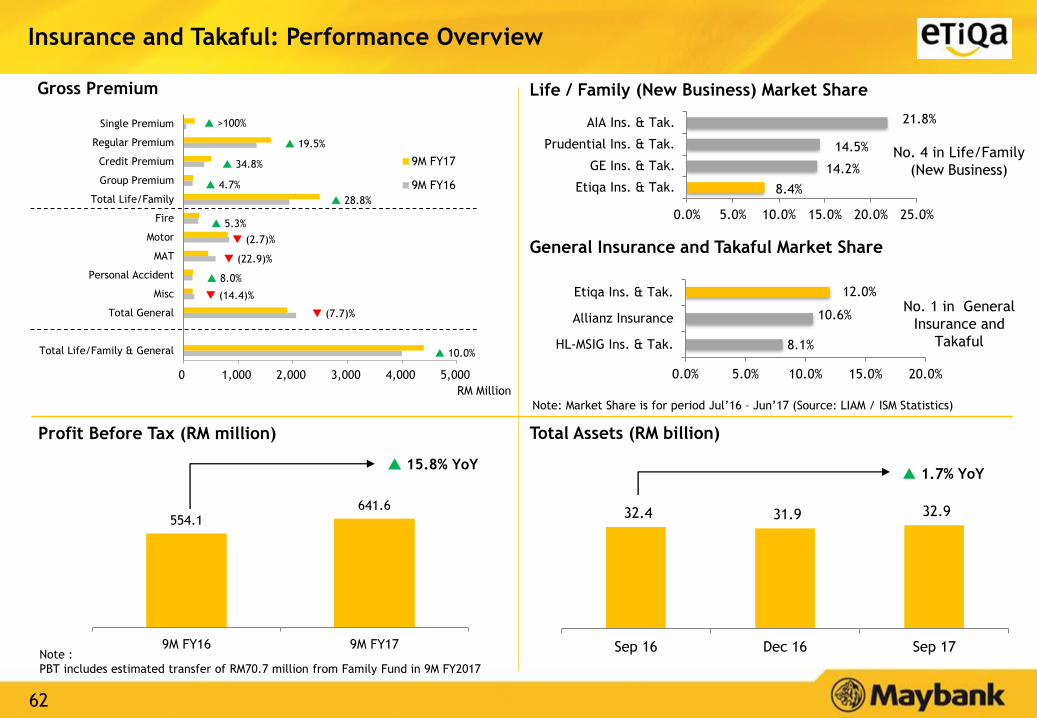
554.1 641.6
9M FY16 9M FY17
32.4 31.9 32.9
Sep 16 Dec 16 Sep 17
Insurance and Takaful: Performance Overview
Total Assets (RM billion)
Gross Premium
Profit Before Tax (RM million)
Life / Family (New Business) Market Share
No. 4 in Life/Family
(New Business)
No. 1 in General
Insurance and
Takaful
General Insurance and Takaful Market Share
15.8% YoY 1.7% YoY
Note :
PBT includes estimated transfer of RM70.7 million from Family Fund in 9M FY2017
Note: Market Share is for period Jul’16 – Jun’17 (Source: LIAM / ISM Statistics)
8.4%
14.2%
14.5%
21.8%
0.0% 5.0% 10.0% 15.0% 20.0% 25.0%
Etiqa Ins. & Tak.
GE Ins. & Tak.
Prudential Ins. & Tak.
AIA Ins. & Tak.
8.1%
10.6%
12.0%
0.0% 5.0% 10.0% 15.0% 20.0%
HL-MSIG Ins. & Tak.
Allianz Insurance
Etiqa Ins. & Tak.
0 1,000 2,000 3,000 4,000 5,000
Total Life/Family & General
Total General
Misc
Personal Accident
MAT
Motor
Fire
Total Life/Family
Group Premium
Credit Premium
Regular Premium
Single Premium
RM Million
9M FY17
9M FY16
>100%
19.5%
34.8%
4.7%
28.8%
5.3%
8.0%
(2.7)%
(22.9)%
(14.4)%
(7.7)%
10.0%
63
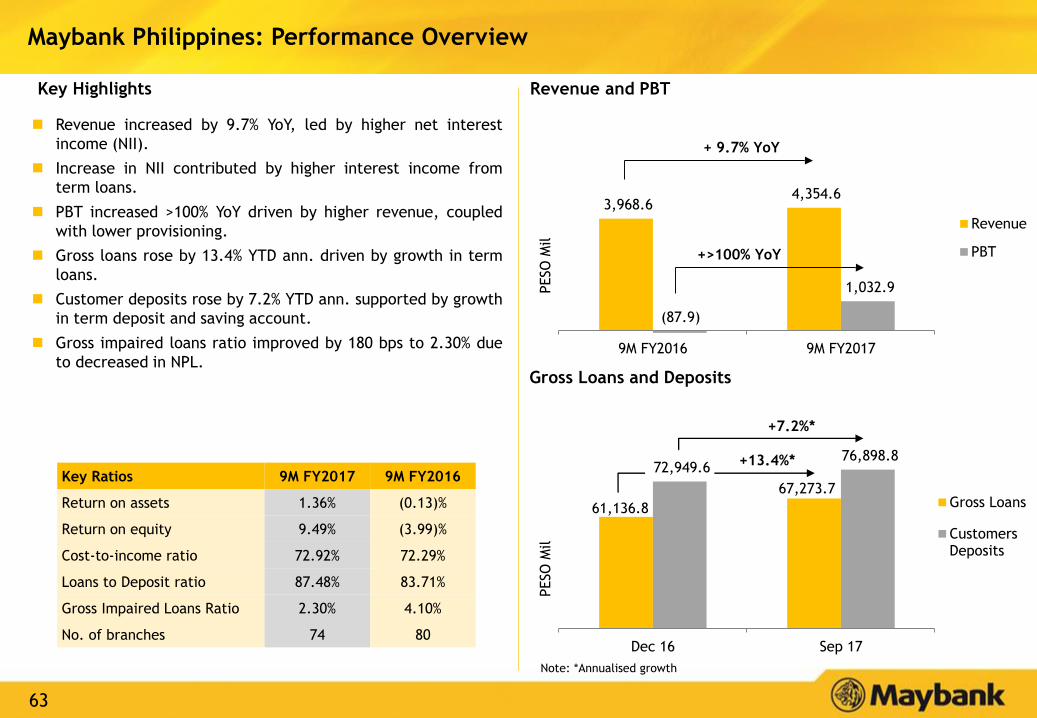
3,968.6 4,354.6
(87.9)
1,032.9
9M FY2016 9M FY2017
Revenue
PBT
Maybank Philippines: Performance Overview
Revenue increased by 9.7% YoY, led by higher net interest
income (NII).
Increase in NII contributed by higher interest income from
term loans.
PBT increased >100% YoY driven by higher revenue, coupled
with lower provisioning.
Gross loans rose by 13.4% YTD ann. driven by growth in term
loans.
Customer deposits rose by 7.2% YTD ann. supported by growth
in term deposit and saving account.
Gross impaired loans ratio improved by 180 bps to 2.30% due
to decreased in NPL.
+ 9.7% YoY
+>100% YoY
Revenue and PBT
Gross Loans and Deposits
Key Highlights
PESO
Mil
PESO
Mil
+13.4%*
+7.2%*
Key Ratios 9M FY2017 9M FY2016
Return on assets 1.36% (0.13)%
Return on equity 9.49% (3.99)%
Cost-to-income ratio 72.92% 72.29%
Loans to Deposit ratio 87.48% 83.71%
Gross Impaired Loans Ratio 2.30% 4.10%
No. of branches 74 80
Note: *Annualised growth
61,136.8
67,273.7
72,949.6 76,898.8
Dec 16 Sep 17
Gross Loans
CustomersDeposits
64
Table of Contents
Appendix:
1. Financial Performance 32
2. Community Financial Services 45
3. Global Banking 49
4. Maybank Singapore 53
5. Maybank Indonesia 56
6. Other segments 60
7. Affiliates 65
65
1,470.2
1,960.6
193.5 428.9
9M FY2016 9M FY2017
Revenue
PBT
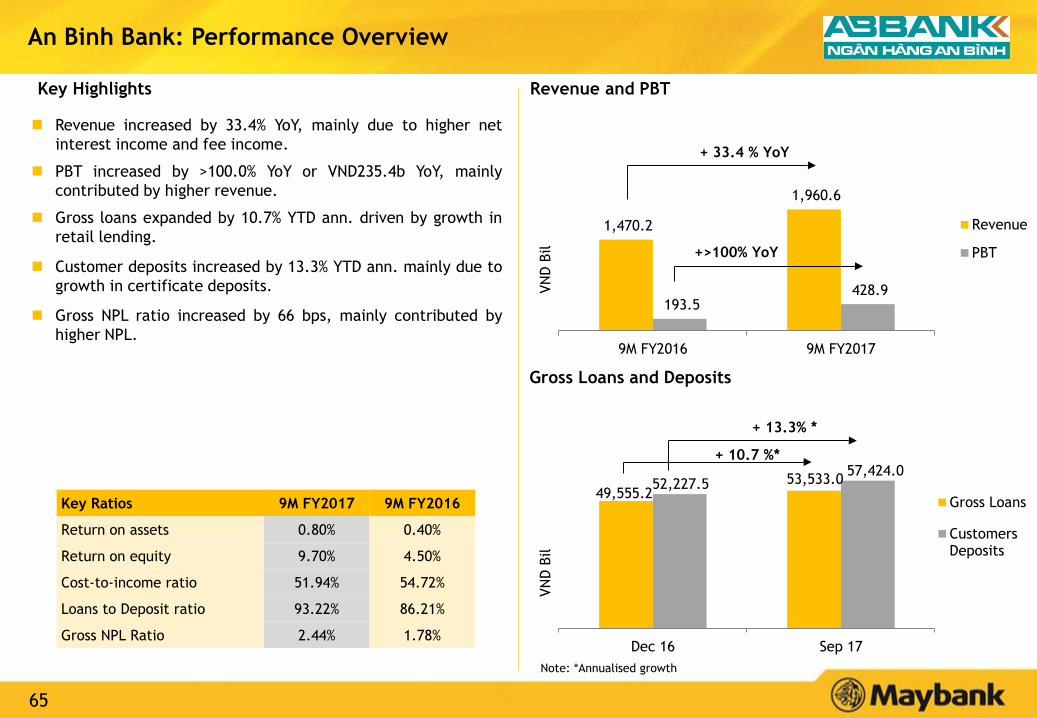
An Binh Bank: Performance Overview
Revenue increased by 33.4% YoY, mainly due to higher net
interest income and fee income.
PBT increased by >100.0% YoY or VND235.4b YoY, mainly
contributed by higher revenue.
Gross loans expanded by 10.7% YTD ann. driven by growth in
retail lending.
Customer deposits increased by 13.3% YTD ann. mainly due to
growth in certificate deposits.
Gross NPL ratio increased by 66 bps, mainly contributed by
higher NPL.
Key Ratios 9M FY2017 9M FY2016
Return on assets 0.80% 0.40%
Return on equity 9.70% 4.50%
Cost-to-income ratio 51.94% 54.72%
Loans to Deposit ratio 93.22% 86.21%
Gross NPL Ratio 2.44% 1.78%
VN
D B
ilVN
D B
il
+ 33.4 % YoY
+>100% YoY
49,555.2 53,533.0 52,227.5
57,424.0
Dec 16 Sep 17
Gross Loans
CustomersDeposits
+ 10.7 %*
+ 13.3% *
Gross Loans and Deposits
Revenue and PBTKey Highlights
Note: *Annualised growth
66
46.6 46.5
30.1 26.1
9M FY2016 9M FY2017
Revenue
PBT
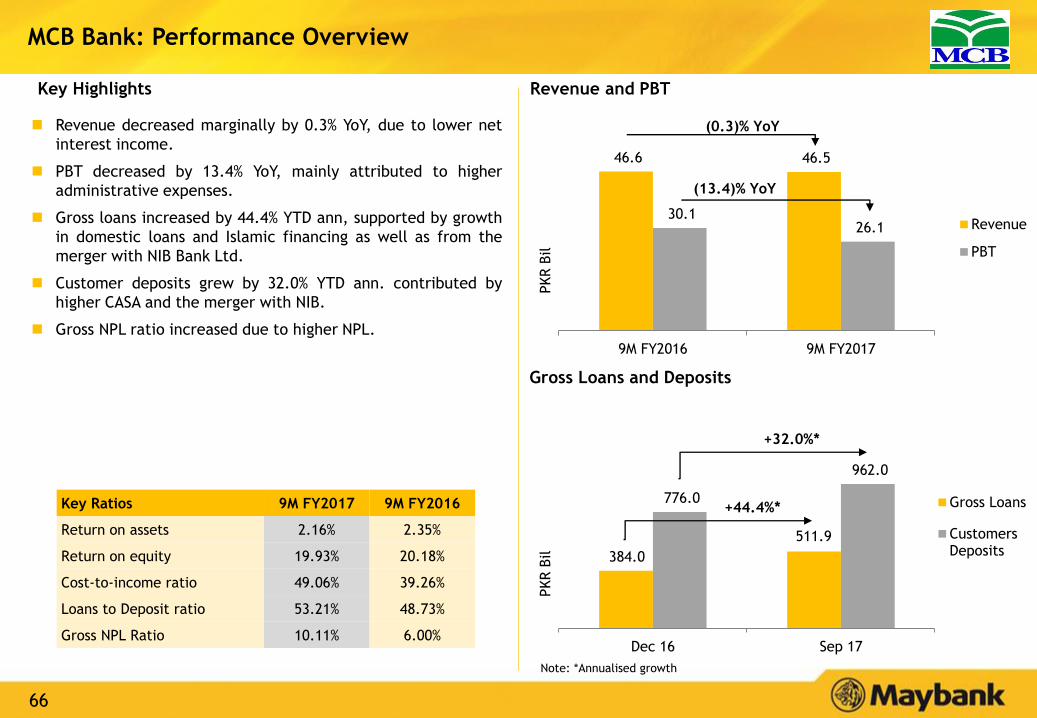
MCB Bank: Performance Overview
(0.3)% YoY
(13.4)% YoY
384.0
511.9
776.0
962.0
Dec 16 Sep 17
Gross Loans
CustomersDeposits
+32.0%*
+44.4%*
PKR B
ilPKR B
il
Key Ratios 9M FY2017 9M FY2016
Return on assets 2.16% 2.35%
Return on equity 19.93% 20.18%
Cost-to-income ratio 49.06% 39.26%
Loans to Deposit ratio 53.21% 48.73%
Gross NPL Ratio 10.11% 6.00%
Gross Loans and Deposits
Revenue decreased marginally by 0.3% YoY, due to lower net
interest income.
PBT decreased by 13.4% YoY, mainly attributed to higher
administrative expenses.
Gross loans increased by 44.4% YTD ann, supported by growth
in domestic loans and Islamic financing as well as from the
merger with NIB Bank Ltd.
Customer deposits grew by 32.0% YTD ann. contributed by
higher CASA and the merger with NIB.
Gross NPL ratio increased due to higher NPL.
Revenue and PBTKey Highlights
Note: *Annualised growth
67
Dato’ Amirul Feisal Wan Zahir
Group Chief Financial Officer
Contact: (6)03-2074 7703
Email: [email protected]
MALAYAN BANKING BERHAD
14th Floor, Menara Maybank
100, Jalan Tun Perak
50050 Kuala Lumpur, Malaysia
Tel : (6)03-2070 8833
www.maybank.com
Jeeva Arulampalam
Head, Group Investor Relations
Contact: (6)03-2074 8017
Email: [email protected]
Disclaimer. This presentation has been prepared by Malayan Banking Berhad (the “Company”) for information purposes only and does not purport to contain all the
information that may be required to evaluate the Company or its financial position. No representation or warranty, express or implied, is given by or on behalf of the
Company as to the accuracy or completeness of the information or opinions contained in this presentation.
The presentation does not constitute or form part of an offer, solicitation or invitation of any offer, to buy or subscribe for any securities, nor should it or any part of
it form the basis of, or be relied in any connection with, any contract, investment decision or commitment whatsoever.
The Company does not accept any liability whatsoever for any loss howsoever arising from any use of this presentation or their contents or otherwise arising in
connection therewith.
Investor Relations Contact
Humanising Financial Services