investigating and interpreting reduced reproductive
TRANSCRIPT

Investigating and interpreting reduced reproductive performance in fish inhabiting streams adjacent to agricultural operations
by
Sandra Marie Brasfield
Masters of Science, Zoology, Oklahoma State University
Bachelor of Science, Biology, Middle Tennessee State University
A THESIS SUBMITTED IN PARTIAL FULFILLMENT OF THE REQUIREMENTS FOR THE DEGREE OF
Doctor of Philosophy
In the Graduate Academic Unit of Biology
Supervisor: Kelly Munkittrick, Ph.D, UNBSJ Biology
Examining Board: Jack Terhune, Ph.D, Chair
Jeff Houlahan, Ph.D., UNBSJ Biology
Simon Courtenay, Ph.D., Fisheries and Oceans Canada
Katy Haralampides, Ph.D., UNBF Civil Engineering
External Examiner: D. George Dixon, Ph.D. Biology, University of Waterloo
This thesis is accepted
____________________
Dean of Graduate Studies
THE UNIVERSITY OF NEW BRUNSWICK
JULY, 2007
© Sandra Brasfield 2007

ii
ABSTRACT
Previous studies have indicated that fish in agricultural areas have reduced
proportions of young of the year (YOY) fish, due to either reproductive
dysfunction, increased mortality, or a combination of these factors. The main
objective of this research was to identify the potential mechanisms and timing
associated with the reduced reproductive performance in agricultural areas. Fish
populations were monitored systematically through multiple years to identify peak
mortality and risk periods based on agricultural practice and inputs. In previous
assessments sculpin species have presented conflicting response patterns,
making interpretation difficult. Normal reproductive profiles, growth and mortality
were assessed for reference populations of slimy sculpin (Cottus cognatus) to
identify the most appropriate window to assess reproductive integrity.
Comparisons between spring and fall spawning species in agricultural areas
determined the degree of potential impact of exposure to stressors on differing
reproductive strategies. Finally the integration of this information collected on
episodic mortality, reproductive development and reproductive performance
required some consideration of population level impacts. The tools for population
level ecological risk assessment are poorly developed, and the theoretical aspect
of this thesis focused on trying to integrate the available information, identify the
data gaps, and recommend an overall approach to population risk assessment
that will be based on information gathered regarding non-point, multiple stressor
discharges.

iii
ACKNOWLEDGMENTS
I have many, many people to thank for their support as I pursued this degree, but
head and shoulders above them all is my friend and supervisor, Dr. Kelly
Munkittrick. When my efforts were pitiful and my outlook cloudy, you always
offered sunshine and at least a couple of paths forward. Working with you
continues to be in the top five decisions I have made. My upcoming opportunities
are only possible because of the work I have done, the researcher I have
become since working with you and the CRI. I have improved in ways that are
apparent even to me. And that is really saying something.
The faculty, staff and students of the Canadian Rivers Institute and UNB
Saint John made my research experience one that will never be matched. The
crew and equipment may have got things going, but the people and the places
helped me get the job done. There was always an eager volunteer for the various
pursuits of fish, philosophy, and fun. So many of you have touched my life in
ways I still cannot define. You have set a high standard for the people I will work
with for the rest of my career. In the immortal words of my pal Chris Blanar “It
takes guts to raise the bar when everyone else is playing limbo.” Thank you for
that.
My family may have wondered why I came to Canada, even when they
saw me traveling and working all over the map, they just took it all in stride and
assumed I was getting the education I wanted. They came to visit when they
could, and hopefully understood a little more as to why I could love being in a
place so far from Tennessee. Although they missed me being closer, I was

iv
allowed the freedom to spread my wings and thank goodness for the benefit of
doubt. I would still be somewhere with my head in the clouds if there weren’t for
their rocks in my pockets. I love you all very much.
My coast-to-coast support system has expanded outside of North
America, and I am so thankful for the amazing friends that always had a kind
word or a great joke, and more importantly, faith in me. Even when I was running
low on confidence, you helped me find a way to carry on. Moving to another
country will often provide an opportunity for many people to lose touch and only
strongest friendships are left, thanks for hanging in there until the clock read
00:00.
In Canada, I was fortunate to find kindred spirits for all my varied interests,
including football, music, food and drink, all in the pursuit of fun. I will think of
many of you for the rest of my life and smile, giggle, maybe even blush a little. I
had no idea who I would meet when I moved here, and I couldn’t be more
pleased with the motley crew that amassed, disbanded, and reunited over the
four years I spent with you. You made Canada home, when I was many
thousands of miles from mine, and for that I will always be grateful.
I got somethin' in my heart, I been waitin' to give
I got a life I wanna start, one I been waitin' to live
No more waitin', tonight I feel the light I say the prayer
I open the door, I climb the stairs...
-- Bruce Springsteen

v
TABLE OF CONTENTS
Investigating and interpreting reduced reproductive performance in fish inhabiting
streams adjacent to agricultural operations ..........................................................i
1 GENERAL INTRODUCTION....................................................................... 1
1.1 Overview.................................................................................... 1
1.2 Multiple Stressors and Non-point Source Pollution.................... 2
1.3 Effects Based Assessment ........................................................ 4
1.4 Statement of Problem ................................................................ 5
1.5 General Overview of the Study Area ......................................... 7
1.6 Objectives and outline of thesis ................................................. 8
1.7 References .............................................................................. 16
2 Monitoring of fish populations along a gradient of agricultural inputs in
northwestern New Brunswick, Canada..............................................................22
2.1 Abstract ................................................................................... 22
2.2 Introduction.............................................................................. 23
2.3 Methods................................................................................... 25
2.4 Results..................................................................................... 27
2.5 Discussion ............................................................................... 30
2.6 References .............................................................................. 35
3 Seasonal patterns of energy storage, energy expenditure, and in vitro
gonadal steroidogenic capacity in slimy sculpin (Cottus cognatus) ...................50
3.1 Abstract ................................................................................... 50

vi
3.2 Introduction.............................................................................. 51
3.3 Methods................................................................................... 53
3.4 Results..................................................................................... 56
3.5 Discussion ............................................................................... 59
3.6 References .............................................................................. 64
4 Comparison of spring spawning slimy sculpin (Cottus cognatus) and fall
spawning brook trout (Salvelinus fontinalis) reproductive development in
agricultural regions of the St. John River (New Brunswick, Canada).................73
4.1 Abstract ................................................................................... 73
4.2 Introduction.............................................................................. 74
4.3 Methods................................................................................... 77
4.4 Results..................................................................................... 80
4.5 Discussion ............................................................................... 81
4.6 References .............................................................................. 87
5 Approaching population-level ecological risk assessment from an effects
driven perspective .............................................................................................97
5.1 Abstract ................................................................................... 97
5.2 Introduction.............................................................................. 98
5.3 Background to Agricultural Studies........................................ 100
5.4 Risk Assessment ................................................................... 102
5.5 Population-level assessment of agricultural impacts on fish.. 105
5.6 Population-Level Problem Formulation.................................. 105
5.7 Population-level risk analysis................................................. 108

vii
5.8 Population-level risk characterization .................................... 110
5.9 Additional Uses...................................................................... 111
5.10 Conclusions ........................................................................... 112
5.11 References ............................................................................ 114
6 Conclusions..............................................................................................127
7 VITA ............................................................................................................ 0
viii
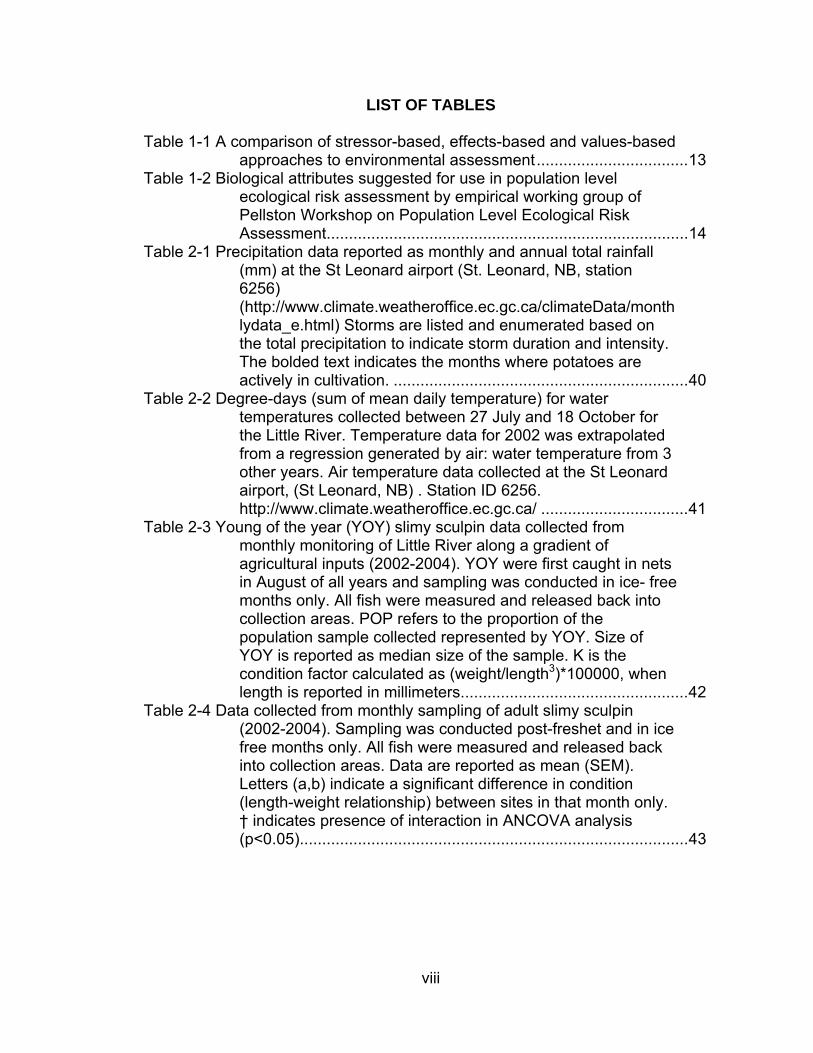
LIST OF TABLES Table 1-1 A comparison of stressor-based, effects-based and values-based
approaches to environmental assessment..................................13 Table 1-2 Biological attributes suggested for use in population level
ecological risk assessment by empirical working group of Pellston Workshop on Population Level Ecological Risk Assessment.................................................................................14
Table 2-1 Precipitation data reported as monthly and annual total rainfall (mm) at the St Leonard airport (St. Leonard, NB, station 6256) (http://www.climate.weatheroffice.ec.gc.ca/climateData/monthlydata_e.html) Storms are listed and enumerated based on the total precipitation to indicate storm duration and intensity. The bolded text indicates the months where potatoes are actively in cultivation. ..................................................................40
Table 2-2 Degree-days (sum of mean daily temperature) for water temperatures collected between 27 July and 18 October for the Little River. Temperature data for 2002 was extrapolated from a regression generated by air: water temperature from 3 other years. Air temperature data collected at the St Leonard airport, (St Leonard, NB) . Station ID 6256. http://www.climate.weatheroffice.ec.gc.ca/ .................................41
Table 2-3 Young of the year (YOY) slimy sculpin data collected from monthly monitoring of Little River along a gradient of agricultural inputs (2002-2004). YOY were first caught in nets in August of all years and sampling was conducted in ice- free months only. All fish were measured and released back into collection areas. POP refers to the proportion of the population sample collected represented by YOY. Size of YOY is reported as median size of the sample. K is the condition factor calculated as (weight/length3)*100000, when length is reported in millimeters...................................................42
Table 2-4 Data collected from monthly sampling of adult slimy sculpin (2002-2004). Sampling was conducted post-freshet and in ice free months only. All fish were measured and released back into collection areas. Data are reported as mean (SEM). Letters (a,b) indicate a significant difference in condition (length-weight relationship) between sites in that month only. † indicates presence of interaction in ANCOVA analysis (p<0.05).......................................................................................43
ix
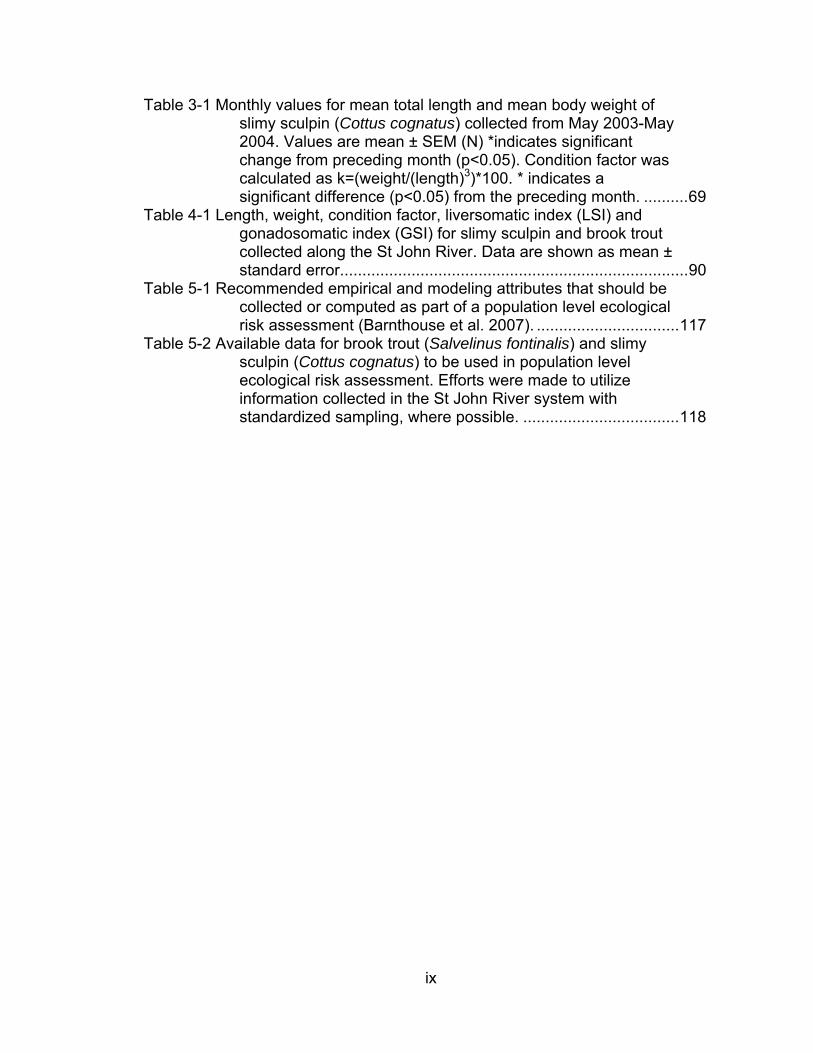
Table 3-1 Monthly values for mean total length and mean body weight of slimy sculpin (Cottus cognatus) collected from May 2003-May 2004. Values are mean ± SEM (N) *indicates significant change from preceding month (p<0.05). Condition factor was calculated as k=(weight/(length)3)*100. * indicates a significant difference (p<0.05) from the preceding month. ..........69
Table 4-1 Length, weight, condition factor, liversomatic index (LSI) and gonadosomatic index (GSI) for slimy sculpin and brook trout collected along the St John River. Data are shown as mean ± standard error..............................................................................90
Table 5-1 Recommended empirical and modeling attributes that should be collected or computed as part of a population level ecological risk assessment (Barnthouse et al. 2007). ................................117
Table 5-2 Available data for brook trout (Salvelinus fontinalis) and slimy sculpin (Cottus cognatus) to be used in population level ecological risk assessment. Efforts were made to utilize information collected in the St John River system with standardized sampling, where possible. ...................................118

x
LIST OF FIGURES
Figure 1-1 Map of (A) North America, (B) New Brunswick and (C) the St John River. sampling locations within the St. John River basin, redrawn from topographical maps obtained from the Province of New Brunswick. Inset maps provided by M.A. Gray and Environment Canada...................................................15
Figure 2-1 Map of (A) North America, (B) New Brunswick and the St John River (C) Little River and sampling sites. These sites were chosen along the Little River based on studies conducted by Gray et al. (2005). Location of Black Brook is indicated by the inset box above lowermost field station. rectangle drawn. ..........44
Figure 2-2 Slimy sculpin population structure for estimated catches of slimy sculpin collected monthly along a gradient of agricultural intensity, A) TenMile (forested), B) Donat (intermediate), C) Dead (Agriculture). Data are shown as estimated catch based on standardized effort across all sites. Data are categorized into bins based on fish total length (mm).....................................45
Figure 2-3 Estimated catch of slimy sculpin along a gradient of agriculture for A) young of the year (YOY), B) adult sculpin >70mm, C) all size classes of slimy sculpin collected monthly.. Data are shown as means of estimated catch based on standardized effort across all sites each month during 2002-2004...................46
Figure 2-4 Relationship between maximum daily temperature and estimated density of all sculpin based on standardized effort.
indicate data from forested sites and ○ indicate data from agricultural sites. .........................................................................47
Figure 2-5 Linear relationship between total rainfall (mm) and percent young of the year (YOY) for sites along the gradient of agriculture. indicate data from forested sites and □ indicate data from agriculture sites. Line shown is for agricultural sites only. ............................................................................................48
Figure 2-6 Relationship between number of summer storms >15 mm in July and August in total precipitation and percent young of the year sculpin. ................................................................................49
Figure 3-1 Monthly changes (mean monthly values) in male slimy sculpin A gonadosomatic index (gonad weight/body weight – gonad weight *100) B gonadal in vitro steroidogenic capacity to produce11-ketotestosterone C gonadal in vitro steroidogenic capacity to produce testosterone. Solid lines represent seasonal changes in the monthly mean. Dashed lines define "shut off" as defined by the maximum production value in the months of minimum steroidogenic capacity. */‡/† indicates significant (p<0.05) change from the preceding month using Mann Whitney nonparametric probabilities. ................................70

xi
Figure 3-2 Monthly changes (mean monthly values) in female slimy sculpin A gonadosomatic index (gonad weight/body weight – gonad weight *100) B gonadal forskolin stimulated in vitro steroidogenic capacity to produce 17β estradiol C gonadal in vitro steroidogenic capacity to produce testosterone. Solid lines represent seasonal changes in the monthly mean. Dashed lines define "shut off" as defined by the maximum production value in the months of minimum steroidogenic capacity. */‡/† indicates significant (p<0.05) change from the preceding month using Mann Whitney nonparametric probabilities. ................................................................................71
Figure 3-3 Monthly changes in energy storage in A male slimy sculpin (Cottus cognatus) hepatosomatic index [liver wt/(body wt-liver wt)]*100 B female sculpin hepatosomatic index from May 2003- 2004. * indicates significant (p<0.05) change from the preceding month using Mann Whitney nonparametric probabilities. ................................................................................72
Figure 4-1 Map of (A) North America, (B) New Brunswick and (C) the St John River (C) Little River and sampling sites. These sites were chosen along the St John River based on studies conducted by Gray et al. (2005). .................................................91
Figure 4-2 Relationship between gonad weight v. body weight (A) and liver weight v. body weight (B) for slimy sculpin collected at 6 sites along the St John River...............................................................92
Figure 4-3 Steroidogenic capacity of (A) testosterone and (B) estradiol by gonadal tissue excised from slimy sculpin collected in April 2004 at agricultural (AG 1-3) and forested (FOR 1-3) sites. Hormone determinations were made using RIA with the incubation media. ........................................................................93
Figure 4-4 Relationship between gonad weight v. length (A) and liver weight v. length (B) for brook trout collected at 4 sites along the St John River.........................................................................95
Figure 4-5 Steroidogenic capacity of (A) testosterone and (B) estradiol by gonadal tissue excised from brook trout collected in September 2004 at agricultural (AG 1 & 3) and forested (FOR 1-2) sites. Hormone determinations were made using RIA with the incubation media............................................................96
Figure 5-1 Comparing assessment endpoints on the individual vs. population level in the overall levels of biological organization. 119
Figure 5-2 Ecological risk assessment framework as defined by the US EPA (1998) and as modified to address population level assessment (Barnthouse et al. 2007)........................................120
Figure 5-3 Conceptual diagram of stressors associated with potato farming practices in northwestern New Brunswick as well as responses documented in previous study (1999-2002) by Gray and colleagues. ................................................................121

xii
Figure 5-4 Relationship between sculpin density (per m2) and maximum mean daily water temperature. Open triangles represent agricultural sites, filled triangles represent forested sites. Graph reprinted with permission from M. Gray..........................122
Figure 5-5 Linear relationship between number of major summer storms (>15 mm total rainfall) and percent young of the year (YOY) for sites along the gradient of agricultural inputs. Data were collected over a period of 1999-2004. .......................................123
Figure 5-6 Map of New Brunswick showing total degree days over 18°C as observed at monitoring stations for the months of July and August. Groups were assigned and lines were drawn in efforts to combine areas with similar values..............................124
Figure 5-7 Map of New Brunswick showing total number of rainfall events exceeding 15 mm of total precipitation as recorded at monitoring stations during the summer months of July and August. Groups were assigned and lines were drawn in efforts to combine areas with similar values..............................125
Figure 5-8 Map of New Brunswick showing overlapping temperature and precipitation data including total number of degree days over 18°C, total rainfall for the summer months of July and August, and number of storms exceeding 10 mm total precipitation. .....126

1
1 GENERAL INTRODUCTION
1.1 Overview
With increasing legislation and mounting popular concern for the
environment, good environmental management has become a priority (Skinner et
al. 1997, Chambers 2002), but little attention is given to non-point sources of
pollution. Intensification of agricultural operations over the last 40 years has
increased the risk of contamination of surface and ground waters by eroded soils,
nutrients, herbicides and pesticides. Subsequently, there has also been a recent
increase in research into the environmental impacts of agricultural activities and
the development of focused environmental management techniques in
agriculture (Chambers et al. 2002).
Following a recent assessment of threats to water quality (Environment
Canada 2001), the Canadian Council of Ministers of the Environment (CCME)
held a series of workshops to explore the effects of agricultural activity on aquatic
ecosystems. The CCME identified and reported several research gaps that
should be addressed by scientists and policy makers (Chambers et al. 2002).
Three key areas of concern identified were soil erosion, nutrient inputs, and
pesticide residues from agricultural runoff. Soil erosion involves mobilization and
deposition of topsoil and can be accelerated by cultivation practices. Eroded
sediments also act as carriers for both nutrients and pesticides. It remains
unclear what determines the bioavailability of these contaminants, and what the
realistic resulting hazards are to aquatic systems. Elevated nutrients such as

2
nitrogen and phosphorus are also of concern, as increased growth of lower
trophic levels can result in eutrophication. These chemical elements are
considered limiting in non-impacted systems, however, agricultural practices
provide a source of nutrients to surface and ground waters, usually from overuse
of fertilizers (Chambers et al. 2002). Finally, pesticides applied to farmed lands
are of concern, as these compounds have become the primary approach to
control weeds, insects and diseases that threaten crop yields (Skinner et al.
1997). Although the water quality guidelines are seldom exceeded during normal
application, extreme weather and poor management practices continue to create
concerns about the consequences of long-term exposure to low levels of
chemicals, as well as synergies between these chemicals in mixtures.
1.2 Multiple Stressors and Non-point Source Pollution
In the mid-1990s, there was a move by multiple regulatory bodies in North
America to modify environmental assessment approaches to address the
multitude of stressors in complex receiving environments (Ferenc and Foran
2000, Munkittrick et al. 2000). This involved a conceptual shift away from single
stressor analyses to consider the importance of multiple stressors and
cumulative impacts. The term multiple stressors originated in the field of
ecotoxicology and historically has been used to denote the interaction among
multiple chemicals. In this study, we present multiple stressors in the context of
both chemical and non-chemical stressors.

3
Estimating effects of multiple stressors to biota can be difficult, especially
when stressors are diffuse in nature and interact on differing temporal and spatial
scales, as in the case of agricultural inputs. Observed effects may be direct, such
as increased mortality or decreased fecundity as a consequence of acute
pesticide exposure, or indirect, as in altered predator prey dynamics as a result
of increased turbidity.
Non-point source pollution can negatively impact aquatic biota by altering
physical habitat, modifying seasonal water flow, altering the food base,
contaminating water with toxic chemicals, and modifying interactions among
organisms (Karr 1999, Potter et al. 2004). However, research on the impacts of
agriculture on ecosystem health have primarily focused on single measures or
stressors such as soil erosion (Chow and Rees 1995, Pimental et al. 1995),
pesticide use (Culliney et al. 1992, Clark et al. 1999, Battaglin and Fairchild,
2002), and contamination of ground water by fertilizer and other agricultural
chemicals (Bouwer 1990, Napier and Brown 1993, Böhlke 2002). While these are
important aspects of ecosystem condition, these measures provide only a partial
picture of impact. Integration of stress effects on ecosystem health may be more
efficiently assessed by addressing cumulative impacts and multiple stressors
(Munkittrick et al. 2000). Resident biota of aquatic ecosystems serve as
continuous monitors of cumulative effects on those systems and are often used
as endpoints in environmental assessments (Munkittrick et al. 2000, Diamond
and Serveiss 2001).

4
1.3 Effects Based Assessment
Despite these recent attempts to modify the traditional risk assessment
process to consider multiple stressors (Munkittrick et al. 2000, Dubé and
Munkittrick 2001), a major deficiency with environmental impact assessment has
been its inability to deal with multiple discharges or complex situations. Non-point
stressors such as agricultural inputs and sediment have been difficult to
characterize. In most situations, discharges from non-point sources are complex
mixtures, the concentrations of toxicants are difficult to characterize, and rates
and timing of discharges are difficult to predict (Landis and Yu 1999). An effects-
driven assessment can be compared and contrasted to stressor- and values
based approaches (Table 1-1). Effects-based assessment uses the performance
of resident fish in a system to determine if and to what degree native fish
populations are stressed by different inputs to the system relative to reference
conditions and/or the level of effects normally observed in similar systems which
are free of those inputs (Munkittrick et al. 2000). The performance of fish
populations can be used to identify where existing conditions are compromising
performance and help to understand the level of stress on a river reach.
Therefore, it is the biological effects of resident fish that effectively drives the
study design and sampling by identifying where performance is affected. Then in
a general sense, if fish are able to grow, reproduce and survive at similar rates to
those in reference conditions, you may conclude that there are no measurable
limitations to performance (Munkittrick et al. 2000). Alternately, if resident fish are
limited in any of the selected performance measures, then you may conclude that
5
there are environmental factors contributing to the reduced performance and
design a detailed monitoring program to identify and study the relative
contribution of possible stressors. This removes a certain level of researcher bias
from dictating where the effects would be assumed to be occurring, and may
possibly identify limiting or enhancing factors that may have been missed or
ignored by the stressor-based approach.
Effects-driven assessment has several advantages over the use of
monitoring of chemical residue levels as a measure of impact. This type of
assessment does not assume that exposure represents a deleterious effect.
Assessment is intrinsically related to a valid ecological endpoint: fish populations
and the ability of fish to grow and reproduce similar to fish at reference sites.
Exposure assessment estimates the magnitude of releases, identifies possible
pathways of exposure and estimates potential exposure. The effects-driven
framework is then used iteratively to design focus follow-up studies on the
aspects of performance that are responding to the stressors within the system.
It is not possible to estimate the impacts of all potential stressors on all biota
at all levels of organization. Thus the focus of the assessment must be narrowed
to receptors that are integrated and can provide an appropriate assessment of
the system.
1.4 Statement of Problem
Agricultural activities have received recent attention because of the
popularity of the endocrine disruptor issue and because of recent fish kill events

6
in Eastern Canada (Cairns 2002). Since 1999, there have been >25 documented
fish kills in Prince Edward Island (PEI) (Cairns 2002). The deaths of thousands of
fish on PEI have been attributed to chemical runoff from potato fields (Gray et al.
2002a, Mutch et al. 2002, Gormley et al. 2005). Investigations are still pending
regarding the potential causes, but based on circumstantial evidence, pesticides,
specifically azinphos-methyl are receiving the blame. Although pesticides are
inherently hazardous, these chemicals are not the only causative factor of fish
kills associated with agricultural runoff. In Atlantic Canada, most crops are
sprayed at least 12 times in the four month-long growing season. Potatoes are
typically grown in a three year rotation, and the more recent fish kills occurred in
the years of 1999 and 2002, indicating that there may be a relationship with the
general practices enlisted by potato farmers or with particular fields adjacent to
streams. Heavy rainstorms in mid to late summer can sometimes coincide with
heavier spraying as the potato vine grows and is more susceptible to peril.
Additional impacts from potato production involve removing large amounts of
organic material from the soil, leaving the soil bare for long periods of time, which
can lead to high erosion risk. Agricultural activities can impair surface and/or
groundwater quality.
Recently completed studies have compared fish performance in 20 New
Brunswick tributaries (Gray and Munkittrick 2005), and have shown that slimy
sculpin reproductive performance was very low at agricultural sites. Young-of-
the-year sculpin were not found at 8 of 10 agricultural sites. Detailed studies
have also documented year class failures in agricultural areas, and changes in

7
growth, fecundity and organ sizes in populations of slimy sculpin (Gray 2003).
Circumstantial evidence indicates that storm events play a role in the year class
failures and extinction events, but there is a need to also assess the causative
factors associated with differences seen in growth, organ size and fecundity.
From this work, it was determined that future studies were needed to tease out
the relative influence of temperature, sedimentation, nutrient and pesticides on
the responses observed in the local fish populations. To address the identified
research gaps, this study aimed to identify the timing of mortality events and
further investigate reductions in fish numbers in agricultural areas. Systematic
sampling of fish densities and size structures through multiple years at sites to
identify peak mortality periods was used to try to identify potential stressors
associated with the suspected periods of mortality. Although this study would aid
in the identification of periods of risk to fish populations, additional information
was required to better characterize the seasonal changes normally exhibited by
sculpin with regard to energy storage and expenditure.
1.5 General Overview of the Study Area
The St. John River watershed from Grand Falls to Hartland is one of the
largest potato-farming regions in eastern Canada. The main study sites used in
the monitoring portion of this project were along the Little River watershed
(uppermost 47° 09’ 95N 67° 40’ 10W to lowermost site 47° 04’ 85N 67° 42’ 95W),
located north (Figure 1-1). The Little River is categorized as a 4th order river,
which briefly defined indicates its position in the hierarchy of tributaries and is

8
meant to serve as way of objectively classifying watercourses (Hynes 2001). This
river originates in a forested landscape and drains predominantly agricultural
lands in its lower reaches. One of the tributaries of this river, Black Brook,
represents one of the most intensely farmed watersheds in Eastern Canada.
Differing agricultural intensities at sites along the Little River reach will provide a
gradient to assess cumulative effects. Previous work in this watershed (Gray
2003) provided a basis for selecting sites along the gradient of potato cultivation
intensity.
For the seasonal profiles, a relatively unimpacted system was necessary
to allow exploration of an ecological or physiological basis for reproductive
changes observed in previous studies with sculpin (Galloway et al. 2003, Gray et
al. 2005). The upper Kennebecasis River (45° 49’ 37”N, 65° 13’ 9”W) in southern
New Brunswick was selected, as it is primarily fed by groundwater and remains
ice free, allowing for continuous monthly collections year round (May 2003-May
2004) (Figure 1-1).
1.6 Objectives and outline of thesis
Fish in agricultural areas have shown reduced proportions of YOY fish, due to
reproductive dysfunction, increased mortality, or a combination of these factors
(Gray 2003). The main objective of the thesis is to identify the potential
mechanisms associated with the reduced reproductive performance in
agricultural areas. Previously, Gray and colleagues (2005) showed reduced
reproductive performance in the agricultural areas of this watershed, but it
9
remains unclear whether these reduced larval densities in summer were a
function of reproductive dysfunction in adult sculpin or difference in apparent
mortality rates in larval fish in forested and agricultural sites along Little River.
To address this, it was necessary to continue and expand monitoring of
fish populations along a gradient of agricultural inputs (Chapter 2 “Monitoring of
fish populations along a gradient of agricultural inputs in Northwestern New
Brunswick, Canada”). This data set allowed for comparisons over time and better
assessment for periods of risk related to agriculture and corresponding sculpin
population responses.
It remains that a major challenge in interpreting monitoring data is a lack
of basic life history information on growth rates, reproductive rates, mobility,
habitat requirements, and longevity. The objective of the seasonal work was to
assess reference populations of slimy sculpin (Cottus cognatus) to identify the
most appropriate window to assess reproductive integrity (Chapter 3 “Seasonal
patterns of energy storage, energy expenditure, and in vitro gonadal
steroidogenic capacity in slimy sculpin (Cottus cognatus)”). The effects-driven
approach recommends ruling out a physiological or ecological basis for the
changes that have been documented in the study species (Munkittrick et al.
2000). To date, no study has addressed how spring-spawning slimy sculpin
function over the winter and the rate at which recrudescence occurs under ice
cover. This chapter presents the seasonal characterization of energy storage,
energy expenditure, and in vitro gonadal hormone production in slimy sculpin,
and describes its reproductive cycle based on these observed patterns.

10
The seasonal study determined that in fact it is possible to measure
physiological endpoints during reproductive development, and collections
optimized the in vitro steroid production assay for this species. This study also
ruled out a seasonal or ecological basis for the depressions that have been
previously documented at agricultural sites. Additional confirmatory studies were
then needed in forested and agricultural areas with both a spring and fall
spawning species, slimy sculpin and brook trout (Salvelinus fontinalis),
respectively. The potato-growing season in northwestern New Brunswick is from
June-October, and may affect sculpin and trout differently as spawning times are
in the spring for sculpin or in the fall for trout. Data indicate that the peak risk
period may occur in late summer, with chemical application coinciding with
increased thunderstorm activity, rather than overwinter or after spawning
mortality. This information was collected on slimy sculpin, a benthic, spring-
spawning species, but additional comparisons included brook trout (Salvelinus
fontinalis), a pelagic, fall-spawning species in agricultural areas to determine the
differential susceptibility relative to reproductive timing (Chapter 4 “ Impacts of
agriculture on fish with differing reproductive strategies: comparing slimy sculpin
(Cottus cognatus) and brook trout (Salvelinus fontinalis)”). Integrating the
knowledge developed on episodic mortality, reproductive development and
reproductive performance for both species allowed for more complete
assessment of impacts related to agriculture. The objective of the final data
chapter was to compare the reproductive functioning of both spring- and fall-

11
spawning species in agricultural areas to assess the degree of potential impact of
exposure to stressors on reproductive function.
Small-bodied species of fish are becoming more widely used in freshwater
assessment programs because of their abundance and the assumptions that
they reflect local environmental conditions because of increased site fidelity. It is
necessary in many areas to focus on population-level assessments using these
small-bodied species, because of low species richness and/or inconsistency
among species in exposure histories. It is necessary to develop a framework for
interpreting population-level life history information on the basis of risk
assessment objectives. The theoretical part of the thesis will focus on trying to
integrate the available information, identify the data gaps, and recommend an
overall approach to population risk assessment that will be based on information
gathered regarding non-point, multiple stressor discharges. A recent Pellston
workshop on population-level risk assessment suggested that empirical data
collected for population level ecological risk assessment should include
information related to population structure, mortality, sex ratios, distribution, and
movement (Table 1-2). Over the past five years, we have been investigating the
performance of fish populations in potato-growing areas of New Brunswick that
exhibit changes in growth, fecundity and size distributions, effects that are
important in the absence of acute mortalities. For example, in these agricultural
areas, YOY sculpin can be 600% larger than conspecifics born in forested areas.
Further exposure assessment will attempt to estimate the magnitude of releases,
identify possible pathways of exposure and estimate potential exposure. In these

12
studies, whole organism and population-level consequences are important for
determining ecological significance and understanding the acceptability of
changes. These studies have been conducted using a small-bodied benthic fish
species, the slimy sculpin (Cottus cognatus) as it is abundant in these areas,
exhibits site fidelity in a small home range, and lives and feeds on the stream
bottom. Chapter 5 (“Developing population-level ecological risk assessment
framework for small freshwater systems using small bodied fish”) will synthesize
the available data in a population level framework suitable for initiating a risk
assessment process, and identify limitations and philosophical challenges to
developing population level risk assessments for small freshwater systems.

13
Table 1-1 A comparison of stressor-based, effects-based and values-based approaches to environmental assessment
Stressor-
based Effects-based Values-based
Focus Stressor-response pathways and valued ecosystem components
Performance indicators of ecosystem status
Ecosystem uses or benefits
Boundaries Related to development
Related to biological components
Related to human uses
Use of existing data
Library searches
Field studies Use and opinion surveys
Endpoints Follow-up requirements
Traditionally very little
Ongoing monitoring and adaptive management
Opinion surveys
Advantages Are often based on previous assessments and experience
Site-specific focus
Focused on user
Disadvantages Ignores unidentified interactions and cumulative effects
Time and expense of baseline monitoring
Not based on ecosystem properties or responses
Question How do I mitigate potentially important impacts?
What are the factors that are limiting energy flow?
How do I protect the uses that are important?

14
Table 1-2 Biological attributes suggested for use in population level ecological risk assessment by empirical working group of Pellston Workshop on Population Level Ecological Risk Assessment. Population parameters computed from population attributes
Attributes of populations computed from individual attributes
Measurable attributes
Population growth rate Abundance Density
Variance of abundance Age/stage structure Age, size, sex
Sex ratio Individual length
Population attractor (k) Recruitment Size
Fecundity
Egg size
Size or age at maturity
Number of viable offspring
Probability of extinction Survivorship Individual weight
Age/stage at death
Timing of mortality
Time to recovery / extinction Biomass Somatic growth rate
Energy storage Liver size
Condition
Density dependence Spatial distribution Movement/dispersal
Habitat preference Home range
Critical patch size Location (specific time)
Diet Stomach contents

15
Figure 1-1 Map of (A) North America, (B) New Brunswick and (C) the St John River. sampling locations within the St. John River basin, redrawn from topographical maps obtained from the Province of New Brunswick. Inset maps provided by M.A. Gray and Environment Canada.
Chapter 3:
Upper Kennebecasis River
45° 49’ 37”N, 65° 13’ 9”W
Chapter 2:
Nonlethal assessment 2002-2004
Little River, Grand Falls, NB
47°06’00N 67°41’10W
47°05’95N 67°42’00W
47°04’85N 67°42’95W Chapter 4:
Species comparison along St John River
47°06’00N 67°41’10W
Black
Outlet
Monquart
Muniac
Shikethawk
N
Grand FallsLittle River
St. John River
Saint John
Fredericton
NEW BRUNSWICK
St. Leonard airport
Grand FallsLittle River
St. John River
Saint John
Fredericton
NEW BRUNSWICK
St. Leonard airport
Grand FallsLittle River
St. John River
Saint John
Fredericton
NEW BRUNSWICK
St. Leonard airport
Grand FallsLittle River
St. John River
Saint John
Fredericton
NEW BRUNSWICK
St. Leonard airport
Grand FallsLittle River
St. John River
Saint John
Fredericton
NEW BRUNSWICK
St. Leonard airport
Grand FallsLittle River
St. John River
Saint John
Fredericton
NEW BRUNSWICK
St. Leonard airport
St John River
A
B
C

16
1.7 References
Barrett, JC, GD Grossman, and J Rosenfeld. 1992. Turbidity-induced changes in
reactive distance of rainbow trout. Trans. Am. Fish. Soc. 121: 437-443.
Barnthouse, LW, Munns, WR Jr, Sorenson, MT. 2007. Population-Level
Ecological Risk Assessment. Taylor Francis-CRC Press. 346 p.
Battaglin, W, Fairchild, J. 2002. Potential toxicity of pesticides measured in
Midwestern streams to aquatic organisms. Water Sci. Tech. 45, 95-103.
Böhlke, JK. 2002. Groundwater recharge and agricultural contamination.
Hydrogeology Journal 10,153–179.
Bouwer, H. 1990. Agricultural chemicals and groundwater quality. J. Soil Water
Conserv. 45, 184-189.
Cairns, DK. (Ed.). 2002. Effects of land use practices on fish, shellfish, and their
habitats on Prince Edward Island. Can. Tech. Rep. Fish. Aquat. Sci. No. 2408.
157 pp.
Chambers, PA, J DuPont, KA Schaefer and AT Bielak. 2002. Effects of
agricultural activities on water quality. Canadian Council of Ministers of the

17
Environment, Winnipeg, Manitoba. CCME Linking Water Science to Policy
Workshop Series. Report No. 1.
Chapman, DW. 1988. Critical review of variables used to define effects of fines in
redds of large salmonids. Trans. Am. Fish. Soc. 117:1-21.
Chow, TL, Rees, HW. 1995. Effects of coarse-fragment content and size on soil
erosion under simulated rainfall. Can. J. Soil Sci. 75, 227-232.
Clark, GM, Goolsby, DA, Battaglin, WA. 1999. Seasonal and annual load of
herbicides from the Mississippi River basin to the Gulf of Mexico. Environ. Sci.
Tech. 33, 981-986.
Culliney, TW, Pimentel, D, Pimentel, MH. 1992. Pesticides and natural toxicants
in food. Agriculture Ecosystems Environ. 41, 297-320.
Diamond JM, Serveiss, VB. 2001. Identifying sources of stress to native aquatic
fauna using a watershed ecological risk assessment framework. Environ. Sci.
Technol. 35, 4711-4718.
Dubé M, Munkittrick KR. 2001. Integration of effects-based and stressor-based
approaches into a holistic framework for cumulative effects assessment in
aquatic ecosystems. Human. Ecol. Risk. Assess. 7, 247-258.

18
Environment Canada. 2001. Threats to Sources of Drinking Water and Aquatic
Ecosystem Health in Canada. National Water Research Institute, Burlington,
Ontario. NWRI Scientific Assessment Report Series No. 1. 72 p.
Galloway, B.J., Munkittrick, K.R., Currie, S. Gray, M.A., Curry R.A. Wood, C.S.,
2003. Examination of the responses of slimy sculpin (Cottus cognatus) and
white sucker (Catostomus commersoni) collected on the St. John River
(Canada) downstream of pulp mill, paper mill, and sewage discharges.
Environ. Toxicol. Chem. 22, 2898-2907.
Gormley, KL, Teather, KL, Guignion, DG. 2005. Changes in salmonid
communities associated with pesticide runoff events. Ecotoxicology. 14: 671-
678.
Gray, MA, KL Teather, J Sherry, M McMaster, M Hewitt, and RE Mroz. 2002a.
Potential endocrine disruption in freshwater systems near agricultural areas on
Prince Edward Island. In Effects of land use practices on fish, shellfish, and
their habitats on Prince Edward Island. Cairns D.K. (ed). Can. Tech. Rpt. Fish.
Aquat. Sci. No. 2408. pp. 116-118.

19
Gray, MA, RA Curry and KR Munkittrick. 2002b. Non-lethal sampling methods
for assessing environmental impacts using a small-bodied sentinel fish
species. Water Quality Res J Can 37: 195-211.
Gray, M.A., 2003. Assessing non-point source pollution in agricultural regions of
the upper St. John River basin using the slimy sculpin (Cottus cognatus). PhD
thesis. University of New Brunswick, Fredericton, N.B.
Gray, M.A. Munkittrick, K.R., 2005. An effects-based assessment of slimy sculpin
(Cottus cognatus) populations in agricultural Regions of Northwestern New
Brunswick Water Quality Res. J. Can. 40, 16-27.
Ferenc SA, Foran JA. 2000. Multiple stressors in ecological risk and impact
assessment : approaches to risk estimation. SETAC Press, Pensacola, FL.
264 p.
Karr, JR. 1999. Defining and measuring river health. Freshwater Biol. 41, 221-
234.
Landis, WG and Ming-Ho Yu. 1999. An Introduction to toxicity testing. In
Introduction to Environmental Toxicology: Impacts of chemicals upon
ecological systems. CRC Press, Boca Raton, FL. pp.21-53.

20
Munkittrick, KR, M McMaster, G Van Der Kraak, C Portt, W Gibbons, A Farwell
and M Gray. 2000. Development of Methods for Effects-Based Cumulative
Effects Assessment Using Fish Populations: Moose River Project. SETAC
Press, Pensacola, FL. 236 pp.
Mutch, JP, MA Savard, GRL julien, B MacLean, B Raymond, and J Doull. 2002.
Pesticide monitoring and fish kill investigations on Prince Edward Island, 1994-
1999. In D.K. Cairns (ed.). Effects of land use practices on fish, shellfish, and
their habitats on Prince Edward Island. Can. Tech. Report. Fish. Aquat. Sci.
pp. 94-115.
Napier, TL, Brown, DE. 1993. Factors affecting attitudes toward groundwater
pollution among Ohio farmers. J. Soil Water Conserv. 48, 439-439.
Pimental D, Harvey, C, Resosudarmo, P, Sinclair, K, Kurz, D, McNair, M, Crist,
S, Shpritz, L, Fitton, L, Saffouri, R, Blair, R. 1995. Environmental and
economic costs of soil erosion and conservation benefits. Science. 267, 1117-
1123.
Potter, KM, Cubbage, FW, Blank, GB, Schaberg, RH. 2004. A watershed-scale
model for predicting non-point pollution risk in North Carolina. Environmental
Management. 34, 62–74.

21
Redding, JM, CB Schreck, and FH Everest. 1987. Physiological effects on coho
salmon and steelhead of exposure to suspended solids. Trans. Am. Fish. Soc.
116:737-744.
Skinner, JA, Lewis, KA, Bardon, KS,Tucker, P, Catt, JA, Chambers, BJ. 1997. An
overview of the environmental impact of agriculture in the U.K.. J of Env Man
(1997) 50, 111–128.
Sowden, TK and G Power. 1985. Prediction of rainbow trout embryo survival in
relation to groundwater seepage and particle size of spawning substrate.
Trans. Am. Fish. Soc. 114:804-812.
Waters, TF. 1995. Sediment in streams: sources, biological effects, and control.
Am. Fish. Soc. Monogr. No. 7., Bethesda, MD.
Welch HE, Symons PEK, Narver DW. 1977. Some effects of potato farming and
forest clearcutting on small New Brunswick streams. Technical Report 745.
Fisheries and Marine Service, St. Andrews, NB, Canada.

22
2 Monitoring of fish populations along a gradient of agricultural inputs in
northwestern New Brunswick, Canada
2.1 Abstract Non-point discharges, such as agricultural runoff, are often complex mixtures of
chemical and non-chemical stressors characterized by concentrations of
chemicals which are difficult to distinguish, and rates and timing of discharges
that are difficult to predict. An effects-based approach was used to examine
population-level endpoints including survival and reproduction of slimy sculpin
(Cottus cognatus) in the potato farming belt of New Brunswick. Fish were
nonlethally sampled monthly along a gradient of agricultural intensity over a three
year period. These data were analysed in the context of publicly available
information regarding temperature and precipitation. Results indicate that both
adult and young of the year (YOY) fish are longer and heavier in the downstream
sites as reported in previous studies. Temperature does not appear to be playing
a role in the mortality and changes in population dynamics seen from 2002-2004.
Precipitation, expressed as total rainfall July-August, has a significant negative
relationship with % YOY in the agricultural areas but not in the upstream forested
area. In conclusion, this study provides preliminary evidence that YOY sculpin
may be more impacted in the agricultural areas in years of heavier summer rains.
This study expands the existing knowledge base and development of nonlethal
methods to define cause-effect relationships and an examination of potential
solutions to the issues identified.

23
2.2 Introduction Non-point source pollution can negatively impact aquatic biota by altering
physical habitat, modifying seasonal water flow, altering the systemic food base,
contaminating water with toxic chemicals, and modifying interactions among
organisms (Karr 1999, Potter et al. 2004). Resident biota of aquatic ecosystems
serve as continuous monitors of the cumulative effects of these multiple stressors
on those systems, and are often used as endpoints in environmental
assessments (Munkittrick et al. 2000, Diamond and Serveiss 2001). Research on
the impacts of agriculture on ecosystem health have primarily focused on single
measures or stressors such as soil erosion (Chow and Rees 1995, Pimental et
al. 1995), pesticide use (Culliney et al. 1992, Clark et al. 1999, Battaglin and
Fairchild, 2002), or contamination of ground water by fertilizer and other
agricultural chemicals (Bouwer 1990, Napier and Brown 1993, Böhlke 2002).
While these are important aspects of ecosystem condition, these measures
provide only a partial picture of the integrated impact of agricultural stressors.
Integration of stress effects on ecosystem health may be more efficiently
assessed by addressing the integrated responses of upper ecosystem-level
indicators (Munkittrick et al. 2000).
There have been a number of studies of responses to agricultural
activities along the Little River watershed, located north of Grand Falls, NB,
Canada (Figure 2-1). Recent studies have documented impacts on slimy sculpin
(Cottus cognatus) populations at multiple locations along a gradient within this
watershed (Gray et al. 2002), in a comparative study at multiple rivers with
agricultural gradients (Gray and Munkittrick 2005) and at single locations within

24
21 different watersheds (Welch et al. 1977, Gray et al. 2005). The impacts
included increases in growth and condition; decreases in liver and gonad size,
fecundity, nest density and nest size; and decreases in densities of young-of-the-
year and adult sculpin. This latter study also documented numerous stressors
that may be responsible, including changes in temperature, nutrients and
sedimentation (Gray et al. 2005), but was not successful at teasing out the
relative importance of the various stressors. To address the identified research
gaps, the present study aimed to identify the timing of mortality events and
further investigate reductions in fish numbers in agricultural areas. Systematic
sampling of fish densities and size structure was conducted through multiple
years to identify peak mortality periods in an attempt to identify the timing of
mortality and potential stressors associated with the suspected periods of
mortality.
Growth and mortality are important population-level dynamics influencing
the ecology of fish populations by directly influencing the role of individuals within
the community and interactions among species, especially in size-structured
populations (Werner and Gilliam 1984). Sculpin populations were monitored as
the fish community structure is limited in the potato farming belt of Northern New
Brunswick, with a maximum of three species present at most sites (brook char
(Salvelinus fontinalis), slimy sculpin and brook stickleback (Culea inconstans);
R.A. Curry & K.R. Munkittrick, unpublished data). This project emphasized non-
lethal sampling approaches (as in Gray et al. 2002) because of the design of
repeat sampling over multiple sites, and the limited mobility of sculpin in these

25
areas (Gray et al. 2004, Cunjak et al. 2005, Keeler 2006). The life history of
sculpin also enhances its desirability as a sentinel for these studies. Sculpin are
a spring spawning species and eggs are laid approximately the same time as
potatoes are seeded in late May. These fish are benthic in nature and are in
continuous contact with the stream or lake bottom.
The main objective of this study was to examine whether the previously
observed reductions in density of YOY sculpin in potato-farming areas (Gray et
al. 2003) is related to reproductive dysfunction in adult sculpin or poor survival of
those fish after hatching. Efforts focused on expansion of the existing knowledge
base, the development of methods to define cause-effect relationships and an
examination of potential solutions to the issues identified.
2.3 Methods The main study sites used in this project are along an increasing gradient of
potato farming in the Little River watershed (D/S Ten Mile 47° 09’ 95N 67° 40’
10W; D/S Donat 47° 05’ 95N 67° 42’ 00W; D/S of Dead River (Dead) 47° 04’ 85N
67° 42’ 95W), located north of Grand Falls, New Brunswick, Canada (Figure 2-1).
The Little River is a 4th order river that originates in a forested landscape and
drains predominantly agricultural lands in its lower reaches. It is a tributary of the
St. John River, and the St John watershed from Grand Falls to Hartland is one of
the largest potato-farming regions in eastern Canada. One of the tributaries of
this river, Black Brook, represents one of the most intensely farmed watersheds
in Eastern Canada and is routinely monitored by Agriculture Canada for crop
management and improvement (Chow et al. 2000, Rees et al. 2002). Previous

26
work in this watershed (Gray 2003) provided a basis for selecting sites along the
gradient of potato cultivation intensity.
Slimy sculpin were collected by sampling shallow (approx. 0.50-0.75 m
deep), faster runs and riffles (approx. 1.1-1.5 m/s) with boulder/cobble substrates
using a backpack electrofisher (Smith-Root type VII) and dip nets (6-mm mesh
size). Collections in the first field season targeted the first 100 sculpin caught.
Upon review of the 2002 data, in subsequent collections, sampling continued
until a minimum of 100 adult fish were caught to increase the resolution of size
frequencies in the older age classes after YOY emergence. YOY were still
collected and measured. Barrier nets were not installed, as we have previously
found no significant differences with sculpin collection in open versus closed sites
using one sweep through an area (Gray 2003). Nonlethal sampling of all fish
involved species identification and measurements of fork length, or total length
for sculpin (± 1mm), and weight (± 0.01g). All fish were then released back into
the site from where they were collected. Size frequency data were used to
examine age distributions and condition factors for the fish (Gray et al. 2002).
Temperature recorders (12-bit, Minilog-TR, Vemco Limited, Shad Bay,
NS, Canada) were placed at each site to record hourly water temperatures.
Temperature was recorded beginning in May each year following spring runoff
until mid-October to encompass the period of potential growth for YOY sculpin,
from the time of approximate emergence from the nests to the end of growth for
the first growing season. Degree days were calculated as sum of mean daily
temperature between 27 July-18 October for each reported.
27
Normality and homoscedasticity were assessed by visual examination of
normal probability and residual plots, respectively. YOY were discriminated by
plotting length-frequency distributions for each site. The relationships between
mean daily temperature fluctuation and total rainfall, and YOY body size and
density were assessed using linear regression. Statistical analyses were
completed using Systat© (v. 9, SPSS, Chicago, IL, USA). Length-weight
relationships were analyzed using ANCOVA.
2.4 Results
Physical data including precipitation (Table 2-1) and temperature (Table
2-2) were obtained and presented for each sampling year. Length distribution
data were analyzed monthly for each site by generating frequency histograms
based on estimated catch for a standard amount of electrofishing effort. These
data were assessed visually to determine YOY size and growth and summarized
(Table 2-3).
At all three sites, the YOY size class was easily distinguished, appearing
in August, and increasing in size over time, as described previously (Gray et al.
2002). At the lower agricultural site, August YOY sculpin were significantly
longer than upstream sites in all three years, but had similar condition compared
to reference site fish (Table 2-4).
The proportion of the population composed of YOY increased at the DS
TenMile site between August and September, but remained stable during the rest
of the fall period in both 2002 and 2004. At DS Dead, the lowermost agricultural

28
site, YOY made up a larger portion of the population in 2002 and 2003 compared
to both upstream sites, but not in 2004 (Table 2-3). There were no consistent
differences in condition or fish size early in the year (Table 2-4). On average,
between July and October, average adult fish length and weight increased 8.3%
(4.5) and 16.7% (9.7) upstream, 10.2 (2.1) and 20.7 (13.5) in the middle reach
and 13.3 (3.1) and 37.7 (7.3) downstream (Table 2-4). Temperature units were
on average about 7% warmer downstream compared to the DS TenMile site,
which is approximately 5 km from the lowermost site.
Across all years sampled, the abundance of fish at the forested site was
stable, ranging from 200 to 600 sculpin (per 10000 s electroshocking), with an

29
average (356) similar to that found at the middle reach (349)
(
Figure 2-2). The mainstem site downstream of the agricultural area had
the highest average density (432), and the most variability (Figure 2-3). There
was much less variability at the forested site in the study (Ten Mile) indicating

30
stability of the fish populations
(

31
Figure 2-2). The population in the middle reaches
(
Figure 2-2B) is similar to the forested site, but the agricultural site
demonstrated surges of YOY following emergence in 2002 & 2003, but not in
2004.

32
There was no apparent differences among sites when densities are considered for YOY (Figure 2-3A) or larger fish (fish>70 mm) (Figure 2-3B) and when combined (Figure 2-3C) due to very high variability in total fish caught in the agricultural area. In August 2002, the YOY comprised 72% of all fish collected in the lowest agricultural site (Table 2-3 and
Figure 2-2). Following initial emergence in July, proportion of YOY remained high
at 0.80 and 0.69 for September and October, respectively. At the most upstream

33
forested site, Ten Mile, August YOY proportions were low at 24 %, but upon
subsequent sampling, the proportion more than doubled, suggesting the
presence of late emerging and/or slower growth at this site.
At Ten Mile and Donat, YOY densities were stable or increasing during the
fall, but at the downstream site, the major peak appears usually in August, and
then rapidly declined over the fall. Among larger fish, upstream numbers of
adults are relatively stable year round at upstream sites, and at all sites, large
sculpin (>70 mm) remain relatively constant from November to May, suggesting
that overwinter mortality of larger individuals is not occuring. The more
consistent decrease in density of larger fish is between July and August (2002) or
July and October (2003), suggesting that the peak mortality for both larger and
smaller fish coincides with the period of warmest water temperatures and highest
rainfall events in late summer.
The YOY are larger in the sites downstream of agricultural inputs, with
median sizes of 29 and 30 mm versus 25 mm in the upstream site (Table 2-3). In
2003, monthly sampling was hindered by heavy summer rainfall, as a result YOY
data are only available for August and October. Degree days do not vary along
the gradient; however the most upstream site, Ten Mile, had lower temperatures
across all years (Table 2-2). Maximum daily temperature (27 July-18 Oct) and
fish density were considered (Figure 2-4) and there was no significant
relationship for either forested sites (p=0.49) or agricultural sites (p=0.30).
Precipitation, reported as total rainfall, was lowest in 2002 at 639.2 mm
annually; with 481 mm falling while fields were in use (Table 2-1). As the wettest

34
year of this study, 939.9 mm of rain fell in 2003, 38% of which occurred in July
and August, with a total of 734 mm in the cropping season. The final year, 2004,
was more moderate with regard to precipitation, with 706.3 mm falling annually
and 529 mm during the cropping season. These data were summarized as total
rainfall in late summer (July-August) and regressed against % YOY for both
forested and agricultural samples. Although there was no relationship found for
forested sites (p=0.80), this relationship was significant in agricultural sites
(p=0.039) (Figure 2-5). To follow the significant relationship in precipitation, major
rainfall events were defined as storms that exceeded 15 mm of total precipitation.
Correlating % YOY and number of major storm events resulted in a significant
relationship (Figure 2-6).
2.5 Discussion In the agricultural reach, sculpin showed increased growth, density and
increased variability relative to upstream reaches. Consistent with previous
studies, YOY sculpin downstream of agricultural inputs are longer and heavier
than those of upstream non-agricultural sites (Gray et al., 2002; Gray and
Munkittrick, 2005; Gray et al., 2005). Previous studies indicated that sculpin
populations within the Little River are distinct, based on stable isotopic signatures
for carbon and nitrogen (Gray et al., 2004).The previous studies did not find
major differences between sampling sites on this river (Gray et al., 2002), a
comparison at multiple sites along three rivers (Gray and Munkittrick, 2005), or at
single sites examined on more than 20 different rivers (Gray et al., 2005). The
current study was nondestructive and did not measure internal organ weights,

35
but previous studies (Gray et al. 2005) have shown smaller livers and gonads,
and reduced fecundity in the agricultural reaches. The agricultural site used in
the current study appears to be relatively unimpacted relative to previous reports.
Gray et al. (2005) observed more than 80% of agricultural tributaries did not have
successful reproduction. However the current study was conducted in the
mainstem of Little River and damage may be more extensive in the tributaries.
In comparison to previous studies, this study did not find reduced
abundance of YOY in agricultural areas, but did record increased variability.
Additionally, the previous studies recorded decreased proportion of YOY at
agricultural sites (Gray et al., 2002, 2005). This study showed higher proportions
of YOY in the population for two of the three years.
This study demonstrated a significant negative relationship of rainfall and
proportion of the population comprised of YOY; sculpin year classes are
significantly lower during wetter years. This relationship was not seen at forested
sites. Longer term study in the southeastern United States demonstrated that
over a 10 yr period, abundances of most species either increased or remain
unchanged during low flow and, in fact, mortality from high flow events had a
stronger impact on population size than stresses imposed by low flow (Grossman
et al. 1998).
The data also indicate a significant relationship with the number of major
rain events in July and August (precipitation exceeding 15 mm). In addition, YOY
constituted 30% of the fall population during the three summers with a significant
number of storms >25 mm, compared to 62% for three summer time periods

36
without storms > 25 mm. Research related to soil loss and erosion on these
systems indicates that the majority of soil loss is mobilized by high intensity
thunderstorms during the growing season (Chow et al. 2000, Rees et al. 2002).
These summer thunderstorms coincide with both chemical applications and the
period of major acute fish kill events in potato-growing areas (Cairns et al. 2002,
Hewitt et al. unpublished data).
Temperature is higher in agricultural areas (Gray et al., 2004; Gray and
Munkittrick, 2005), but in this study, the median size of YOY was not different
between sites along the gradient. Gray et al. (2004) reported much higher
temperatures in agricultural sites in this watershed and in those cases, sculpin
were affected or entirely absent. Temperature is recognized as a major
ecological factor affecting the development of freshwater species (e.g. Vannote
and Sweeney 1980) and is thought to influence the density of fish populations
through growth and fecundity (Lobón-Cerviá and Rincón 1998). The relationships
between water temperature, fish growth, and recruitment success have received
considerable attention (Mann et al. 1984). Temperature controls the rate of food
consumption and metabolism, and thus fish growth (Nunn et al. 2003).
Additionally, a recent European study of bullhead (Cottus gobio) suggests that
the distribution of populations and individuals was first structured by the suitability
of physical habitat and hydraulic conditions, and then population dynamics were
mainly governed by the thermal regime (Legalle et al. 2005).
At the two upstream stations, YOY densities are stable or increasing during the fall, but at the downstream site, the major peak appears usually in August, and then shows rapid declines over the fall. Prior to this study, August densities at the same sites were between 400 and 500 / 10,000 s (Gray et al., 2002), very

37
similar to 2002, but lower densities were recorded in 2004. The density of large sculpin was high in 2002, after consecutive dry years
(
Figure 2-2), but 2003 and 2004 had very wet summer storms, and two
years with lower survival characterized by major summer storms (5 in 2003 and 4
in 2004).

38
Among larger fish, upstream numbers of adults are relatively stable year
round at upstream sites, and at all sites, large sculpin (>70 mm) remain relatively
constant from November to May, suggesting that overwinter mortality of larger
individuals is not occuring. The major consistent decrease in density of larger fish
is between July and August (2002) or July and October (2003), suggesting that
the peak mortality for both larger and smaller fish coincides with the period of
warmest water temperatures and highest rainfall events in late summer.
The study has confirmed previous findings of faster growth, and larger
sizes of sculpin in agricultural areas, but found that year class strength and larval
survival were dependent on the number and severity of summer rainfall periods.
Although this study contributes novel information on sculpin population changes
within and between years, more information is needed on the reproductive timing
and population dynamics in an unimpacted system. This would help establish if
there is an ecological basis for the effects that have been documented in
agricultural areas. Although the standardized nonlethal sampling design was
improved over previous studies to isolate periods of risk to fish populations, the
data remain difficult to interpret. Condition factor shows some differences in
energy storage between sites, but no clear patterns emerge. Additional
ecological studies are also needed to better understand the response patterns
observed in slimy sculpin.
Streams in potato dominated landscapes are subjected to a complex array
of stressors associated with increased water temperatures, increased nutrients
from fertilizers, increased sediment loading, increased runoff associated with

39
storm events, and increased chemical exposures associated with pesticide,
fungicide and herbicide applications. The peak risk period appears to be late
summer, and although slimy sculpin are showing higher mortality during these
periods, they may not be the most sensitive fish species for evaluating impacts.
Their spawning period is completed before summer storms, chemical
applications and warm temperatures, and peak exposures to stress occur during
a period of reproductive inactivity. In New Brunswick, other fish species present
are relatively limited, including brook stickleback (Culea inconstans) and brook
trout (Salvelinus fontinalis), and in warmer downstream areas there are also
blacknose dace (Rhinichtys atratulus) (Curry et al. unpublished data). It would
be important to evaluate these other species for potential impacts.
40
2.6 References
Battaglin, W, Fairchild, J. 2002. Potential toxicity of pesticides measured in
Midwestern streams to aquatic organisms. Water Sci. Tech. 45, 95-103.
Böhlke, JK. 2002. Groundwater recharge and agricultural contamination.
Hydrogeology Journal 10,153–179.
Bouwer, H. 1990. Agricultural chemicals and groundwater quality. J. Soil Water
Conserv. 45, 184-189.
Chow, TL, Rees, HW. 1995. Effects of coarse-fragment content and size on soil
erosion under simulated rainfall. Can. J. Soil Sci. 75, 227-232.
Chow, T. L., Rees, H. W. and Monteith, J. 2000. Seasonal distribution of runoff
and soil loss under four tillage treatments in the upper St. John River valley
New Brunswick, Canada. Can. J. Soil Sci. 80: 649–660.
Clark, GM, Goolsby, DA, Battaglin, WA. 1999. Seasonal and annual load of
herbicides from the Mississippi River basin to the Gulf of Mexico. Environ.
Sci. Tech. 33, 981-986.
Culliney, TW, Pimentel, D, Pimentel, MH. 1992. Pesticides and natural toxicants
in food. Agriculture Ecosystems Environ. 41, 297-320.

41
Delong, MD, Brusven, MA. 1998. Macroinvertebrate community structure along
the longitudinal gradient of an agriculturally impacted stream. Environ
Management. 22, 445-457.
Diamond JM, Serveiss, VB. 2001. Identifying sources of stress to native aquatic
fauna using a watershed ecological risk assessment framework. Environ. Sci.
Technol. 35, 4711-4718.
Gray, MA, RA Curry and KR Munkittrick. 2002. Non-lethal sampling methods for
assessing environmental impacts using a small-bodied sentinel fish species.
Water Quality Res J Can 37: 195-211.
Gray, M.A., 2003. Assessing non-point source pollution in agricultural regions of
the upper St. John River basin using the slimy sculpin (Cottus cognatus). PhD
thesis. University of New Brunswick, Fredericton, N.B.
Gray, M.A. Munkittrick, K.R., 2005. An effects-based assessment of slimy sculpin
(Cottus cognatus) populations in agricultural Regions of Northwestern New
Brunswick Water Quality Res. J. Can. 40, 16-27.

42
Grossman, GD, Ratajczak, RE, Crawford, M, Freeman, MC. 1998. Assemblage
organization in stream fishes: effects of environmental variation and
interspecific interactions. Ecol. Monographs. 68, 395-420.
Karr, JR. 1999. Defining and measuring river health. Freshwater Biol. 41, 221-
234.
Landis, WG and Ming-Ho Yu. 1999. An Introduction to toxicity testing. In
Introduction to Environmental Toxicology: Impacts of chemicals upon
ecological systems. CRC Press, Boca Raton, FL. pp.21-53.
Legalle, M. Santoul, F, Figuerola, J, Mastrorillo, S, Ce Re Ghino, R. 2005.
Factors influencing the spatial distribution patterns of the bullhead (Cottus
gobio L., Teleostei Cottidae): a multi-scale study. Biodiversity and
Conservation. 14, 1319–1334.
Lobón-Cerviá J, Rincón, PA. 1998. Environmental determinants of recruitment
and their influence on the population dynamics of stream-living brown trout
Salmo trutta. Oikos, 105 641-646.
Mann, RHK, Mills, CA, Crisp, DT. 1984. Geographical variation in the life-history
of some species of freshwater fish. In Potts, GW, Wootton, RJ (ed.) Fish
Reproduction: Strategies and Tactics pp.171-186. Academic Press, London.

43
Munkittrick, KR, M McMaster, G Van Der Kraak, C Portt, W Gibbons, A Farwell
and M Gray. 2000. Development of Methods for Effects-Based Cumulative
Effects Assessment Using Fish Populations: Moose River Project. SETAC
Press, Pensacola, FL. 236 pp.
Mutch, JP, MA Savard, GRL Julien, B MacLean, B Raymond, and J Doull. 2002.
Pesticide monitoring and fish kill investigations on Prince Edward Island,
1994-1999. In D.K. Cairns (ed.). Effects of land use practices on fish,
shellfish, and their habitats on Prince Edward Island. Can. Tech. Report. Fish.
Aquat. Sci. pp. 94-115.
Napier, TL, Brown, DE. 1993. Factors affecting attitudes toward groundwater
pollution among Ohio farmers. J. Soil Water Conserv. 48, 439-439.
Nunn AD, Cowx, IG, Frear, PA, Harvey, JP. 2003. Is water temperature an
adequate predictor of recruitment success in cyprinid fish populations in
lowland rivers? Freshwater Biol. 48, 579-588.
Pimental D, Harvey, C, Resosudarmo, P, Sinclair, K, Kurz, D, McNair, M, Crist,
S, Shpritz, L, Fitton, L, Saffouri, R, Blair, R. 1995. Environmental and
economic costs of soil erosion and conservation benefits. Science. 267, 1117-
1123.

44
Potter, KM, Cubbage, FW, Blank, GB, Schaberg, RH. 2004. A watershed-scale
model for predicting nonpoint pollution risk in North Carolina. Environmental
Management. 34, 62–74.
Rees, H. W., Chow, T. L., Loro, P. J., Lavoie, J., Monteith, J. O. and Blaauw, A.
2002. Hay mulching to reduce runoff and soil loss under intensive potato
production in northwestern New Brunswick, Canada. Can. J. Soil Sci. 82:
249–258.
Vannote RL, Sweeney, BW. 1980 Geographic analysis of thermal equilibria: a
conceptual model for evaluating the effect of natural and modified thermal
regimes on aquatic insect communities. Amer. Nat. 115, 667–695.
Welch HE, Symons PEK, Narver DW. 1977. Some effects of potato farming and
forest clearcutting on small New Brunswick streams. Technical Report 745.
Fisheries and Marine Service, St. Andrews, NB, Canada.

45
Table 2-1 Precipitation data reported as monthly and annual total rainfall (mm) at the St Leonard airport (St. Leonard, NB, station 6256) (http://www.climate.weatheroffice.ec.gc.ca/climateData/monthlydata_e.html) Storms are listed and enumerated based on the total precipitation to indicate storm duration and intensity. The bolded text indicates the months where potatoes are actively in cultivation. Total Precipitation Storms
>15 mm/>25/>35 mm
2002 2003 2004 2002 2003 2004
January 0.2 0 0
February 18.2 2.2 0
March 22.6 31 23.7
April 59 31.8 66.2 2/0/0 0 1/0/0
May 74 81.8 70.1 0/0/0 0/0/0 0/0/0
June 68.8 103.1 93 0/0/0 2/0/0 3/0/0
July 101.2 225.8 122.3 2/0/0 3/3/3 2/2/1
August 58 135.9 112.5 2/0/0 3/2/0 3/2/0
September 116.8 37.2 80 2/2/0 0/0/0 2/1/0
October 62.2 150.2 51.3 1/0/0 3/2/1 0/0/0
November 31.8 94.2 59.8 1/0/0 4/1/1 3/0/0
December 26.4 46.7 27.4 1/0/0 1/1/1 3/1/0
Total Rainfall 639.2 939.9 706.3

46
Table 2-2 Degree-days (sum of mean daily temperature) for water temperatures collected between 27 July and 18 October for the Little River. Temperature data for 2002 was extrapolated from a regression generated by air: water temperature from 3 other years. Air temperature data collected at the St Leonard airport, (St Leonard, NB) . Station ID 6256. http://www.climate.weatheroffice.ec.gc.ca/
2002 2003 2004
Ten Mile 931.19 939.96 917.54
Donat 997.11 1027.46 965.25
Dead 931.09 1014.83 1024.27

47
Table 2-3 Young of the year (YOY) slimy sculpin data collected from monthly monitoring of Little River along a gradient of agricultural inputs (2002-2004). YOY were first caught in nets in August of all years and sampling was conducted in ice- free months only. All fish were measured and released back into collection areas. POP refers to the proportion of the population sample collected represented by YOY. Size of YOY is reported as median size of the sample. K is the condition factor calculated as (weight/length3)*100000, when length is reported in millimeters.
Ten Mile (Forested) Donat (Intermediate) Dead (Agriculture)
n POP
Median Size (mm)
Body Wt (g) K n POP
Median Size (mm)
Body Wt (g) K n POP
Median Size (mm)
Body Wt (g) K
2002 Aug 21 0.21 25 0.16 1.01 37 0.38 29 0.24 0.93 71 0.72 30 0.17 1.01 Sept 47 0.44 31 0.39 1.15 59 0.61 32 0.37 1.11 80 0.80 34 0.46 1.16 Oct 45 0.45 31 0.38 1.14 47 0.47 36 0.49 1.03 69 0.69 36 0.56 1.08 Nov 47 0.46 34 0.39 0.97 44 0.61 36 0.53 1.07 2003 Aug 47 0.29 27 0.18 0.94 21 0.18 25 0.16 0.97 80 0.45 27 0.26 0.92 Oct 53 0.34 32 0.35 1.02 39 0.31 32 0.34 1.16 88 0.50 36 0.47 0.98 2004 Aug 65 0.43 26 0.14 1.08 20 0.30 27 0.19 1.01 12 0.24 28 0.14 1.07 Sept 72 0.52 31 0.35 1.11 72 0.53 32 0.35 1.05 119 0.59 32 0.36 1.06 Oct 100 0.56 35 0.45 1.05 65 0.40 35 0.45 0.98 74 0.44 35 0.44 0.96
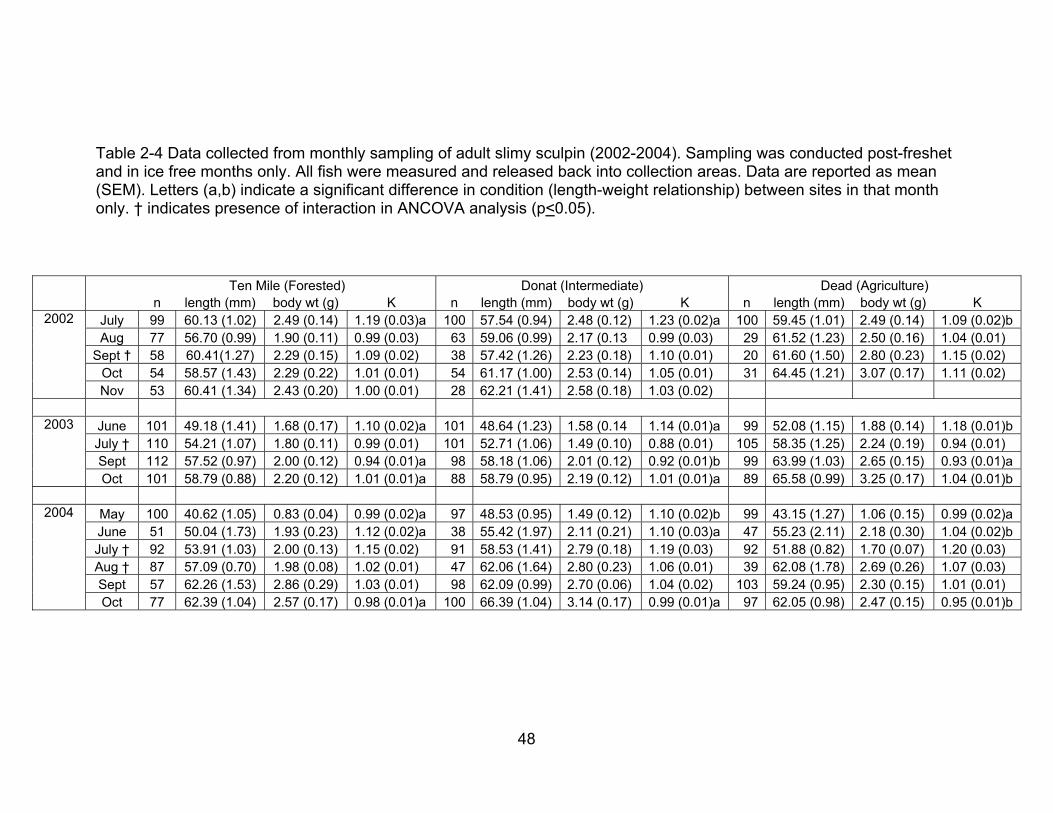
48
Table 2-4 Data collected from monthly sampling of adult slimy sculpin (2002-2004). Sampling was conducted post-freshet and in ice free months only. All fish were measured and released back into collection areas. Data are reported as mean (SEM). Letters (a,b) indicate a significant difference in condition (length-weight relationship) between sites in that month only. † indicates presence of interaction in ANCOVA analysis (p<0.05).
Ten Mile (Forested) Donat (Intermediate) Dead (Agriculture) n length (mm) body wt (g) K n length (mm) body wt (g) K n length (mm) body wt (g) K
2002 July 99 60.13 (1.02) 2.49 (0.14) 1.19 (0.03)a 100 57.54 (0.94) 2.48 (0.12) 1.23 (0.02)a 100 59.45 (1.01) 2.49 (0.14) 1.09 (0.02)b Aug 77 56.70 (0.99) 1.90 (0.11) 0.99 (0.03) 63 59.06 (0.99) 2.17 (0.13 0.99 (0.03) 29 61.52 (1.23) 2.50 (0.16) 1.04 (0.01) Sept † 58 60.41(1.27) 2.29 (0.15) 1.09 (0.02) 38 57.42 (1.26) 2.23 (0.18) 1.10 (0.01) 20 61.60 (1.50) 2.80 (0.23) 1.15 (0.02) Oct 54 58.57 (1.43) 2.29 (0.22) 1.01 (0.01) 54 61.17 (1.00) 2.53 (0.14) 1.05 (0.01) 31 64.45 (1.21) 3.07 (0.17) 1.11 (0.02) Nov 53 60.41 (1.34) 2.43 (0.20) 1.00 (0.01) 28 62.21 (1.41) 2.58 (0.18) 1.03 (0.02)
2003 June 101 49.18 (1.41) 1.68 (0.17) 1.10 (0.02)a 101 48.64 (1.23) 1.58 (0.14 1.14 (0.01)a 99 52.08 (1.15) 1.88 (0.14) 1.18 (0.01)b July † 110 54.21 (1.07) 1.80 (0.11) 0.99 (0.01) 101 52.71 (1.06) 1.49 (0.10) 0.88 (0.01) 105 58.35 (1.25) 2.24 (0.19) 0.94 (0.01) Sept 112 57.52 (0.97) 2.00 (0.12) 0.94 (0.01)a 98 58.18 (1.06) 2.01 (0.12) 0.92 (0.01)b 99 63.99 (1.03) 2.65 (0.15) 0.93 (0.01)a Oct 101 58.79 (0.88) 2.20 (0.12) 1.01 (0.01)a 88 58.79 (0.95) 2.19 (0.12) 1.01 (0.01)a 89 65.58 (0.99) 3.25 (0.17) 1.04 (0.01)b
2004 May 100 40.62 (1.05) 0.83 (0.04) 0.99 (0.02)a 97 48.53 (0.95) 1.49 (0.12) 1.10 (0.02)b 99 43.15 (1.27) 1.06 (0.15) 0.99 (0.02)a June 51 50.04 (1.73) 1.93 (0.23) 1.12 (0.02)a 38 55.42 (1.97) 2.11 (0.21) 1.10 (0.03)a 47 55.23 (2.11) 2.18 (0.30) 1.04 (0.02)b July † 92 53.91 (1.03) 2.00 (0.13) 1.15 (0.02) 91 58.53 (1.41) 2.79 (0.18) 1.19 (0.03) 92 51.88 (0.82) 1.70 (0.07) 1.20 (0.03) Aug † 87 57.09 (0.70) 1.98 (0.08) 1.02 (0.01) 47 62.06 (1.64) 2.80 (0.23) 1.06 (0.01) 39 62.08 (1.78) 2.69 (0.26) 1.07 (0.03) Sept 57 62.26 (1.53) 2.86 (0.29) 1.03 (0.01) 98 62.09 (0.99) 2.70 (0.06) 1.04 (0.02) 103 59.24 (0.95) 2.30 (0.15) 1.01 (0.01) Oct 77 62.39 (1.04) 2.57 (0.17) 0.98 (0.01)a 100 66.39 (1.04) 3.14 (0.17) 0.99 (0.01)a 97 62.05 (0.98) 2.47 (0.15) 0.95 (0.01)b

49
Flow
0k 5k
Little River
TenMile
Donat
Dead
St. John River
Grand Falls Little River
St. John River
Saint John
Fredericton
NEW BRUNSWICK
St. Leonard airport
Black Brook
A
B
C
Figure 2-1 Map of (A) North America, (B) New Brunswick and the St John River (C) Little River and sampling sites. These sites were chosen along the Little River based on studies conducted by Gray et al. (2005). Location of Black Brook is indicated by the inset box above lowermost field station. rectangle drawn.
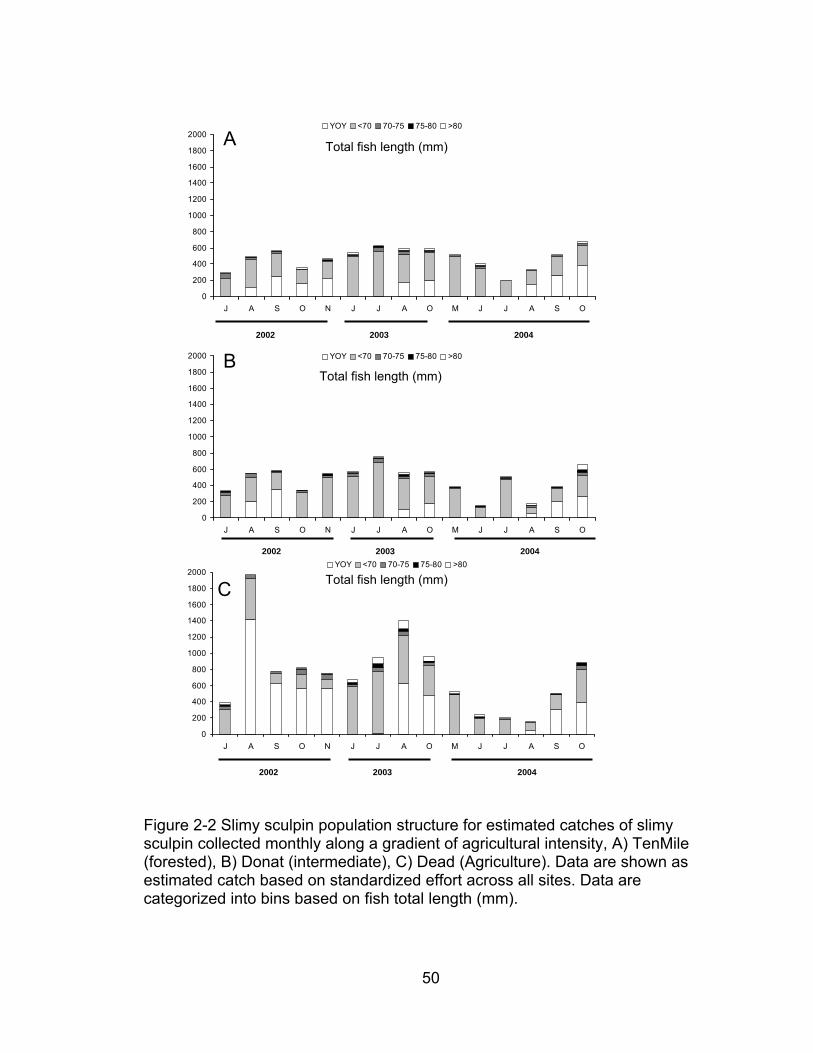
50
Figure 2-2 Slimy sculpin population structure for estimated catches of slimy sculpin collected monthly along a gradient of agricultural intensity, A) TenMile (forested), B) Donat (intermediate), C) Dead (Agriculture). Data are shown as estimated catch based on standardized effort across all sites. Data are categorized into bins based on fish total length (mm).
0
200
400
600
800
1000
1200
1400
1600
1800
2000
J A S O N J J A O M J J A S O
YOY <70 70-75 75-80 >80
0
200
400
600
800
1000
1200
1400
1600
1800
2000
J A S O N J J A O M J J A S O
YOY <70 70-75 75-80 >80
0
200
400
600
800
1000
1200
1400
1600
1800
2000
J A S O N J J A O M J J A S O
YOY <70 70-75 75-80 >80
2002 2003 2004
2002 2003 2004
2002 2003 2004
Total fish length (mm)
Total fish length (mm)
Total fish length (mm)
A
B
C

51
Figure 2-3 Estimated catch of slimy sculpin along a gradient of agriculture for A) young of the year (YOY), B) adult sculpin >70mm, C) all size classes of slimy sculpin collected monthly.. Data are shown as means of estimated catch based on standardized effort across all sites each month during 2002-2004.
0
100
200
300
400
500
600
Estim
ated
Cat
ch o
f YO
Y sc
ulpi
n
A
0
100
200
300
400
500
600
Estim
ated
Cat
ch o
f YO
Y sc
ulpi
n
0
100
200
300
400
500
600
Estim
ated
Cat
ch o
f YO
Y sc
ulpi
n
A
0
20
40
60
80
100
120
140
Estim
ated
Cat
ch S
culp
in >
70 m
m B
0
20
40
60
80
100
120
140
Estim
ated
Cat
ch S
culp
in >
70 m
m
0
20
40
60
80
100
120
140
Estim
ated
Cat
ch S
culp
in >
70 m
m B
0
200
400
600
800
1000
1200
1400
Ten Mile (Forested)
Donat(Intermediate)
Dead(Agriculture)
Estim
ated
cat
ch o
f scu
lpin
(all
size
cla
sses
)
0
200
400
600
800
1000
1200
1400
Ten Mile (Forested)
Donat(Intermediate)
Dead(Agriculture)
Estim
ated
cat
ch o
f scu
lpin
(all
size
cla
sses
)
C
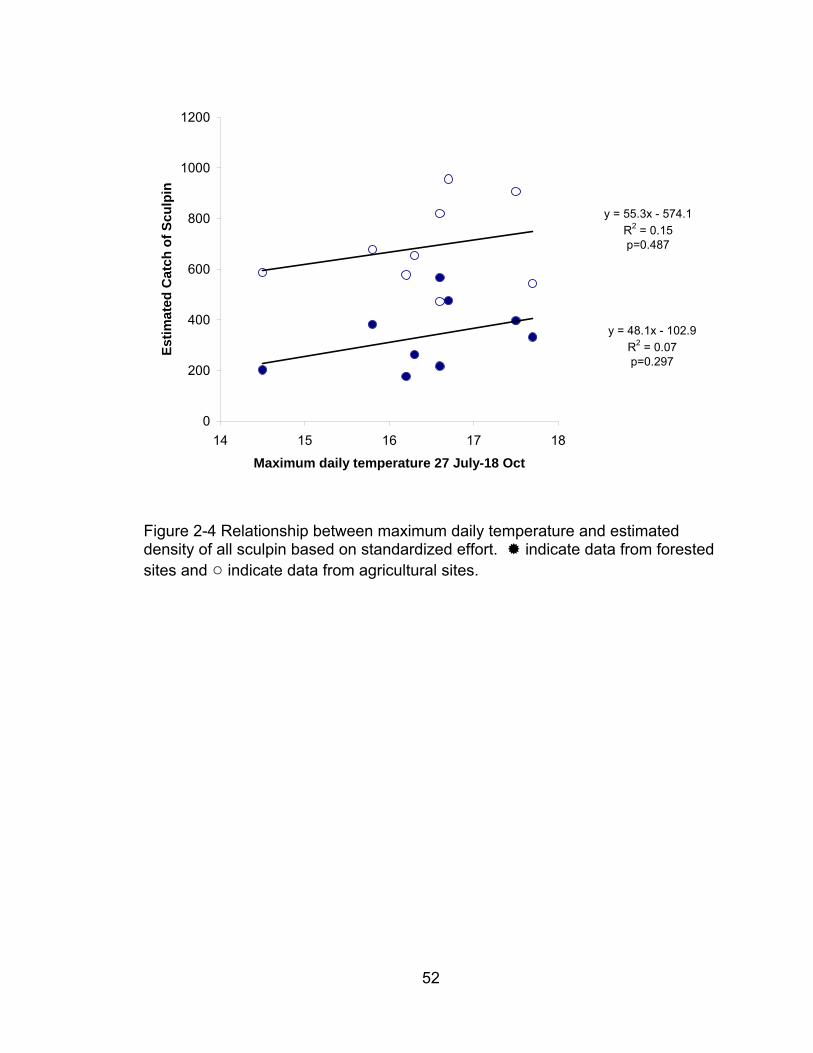
52
y = 55.3x - 574.1R2 = 0.15p=0.487
y = 48.1x - 102.9R2 = 0.07p=0.297
0
200
400
600
800
1000
1200
14 15 16 17 18
Maximum daily temperature 27 July-18 Oct
Estim
ated
Cat
ch o
f Scu
lpin
Figure 2-4 Relationship between maximum daily temperature and estimated density of all sculpin based on standardized effort. indicate data from forested sites and ○ indicate data from agricultural sites.

53
Figure 2-5 Linear relationship between total rainfall **** July and August (mm) and percent young of the year (YOY) for sites along the gradient of agriculture.
indicate data from forested sites and □ indicate data from agriculture sites. Line shown is for agricultural sites only. The relationship between percent YOY and YOY abundance (per 10000 s electrofishing time) has an r2 of 0.98. ***
y = -0.0011x + 0.6289R2 = 0.1803
p=0.039 (0.044)
0
0.1
0.2
0.3
0.4
0.5
0.6
0.7
0.8
0 50 100 150 200 250 300 350 400
Total Rainfall (mm)
YOY
perc
ent o
f tot
al s
ampl
e po
pula
tion
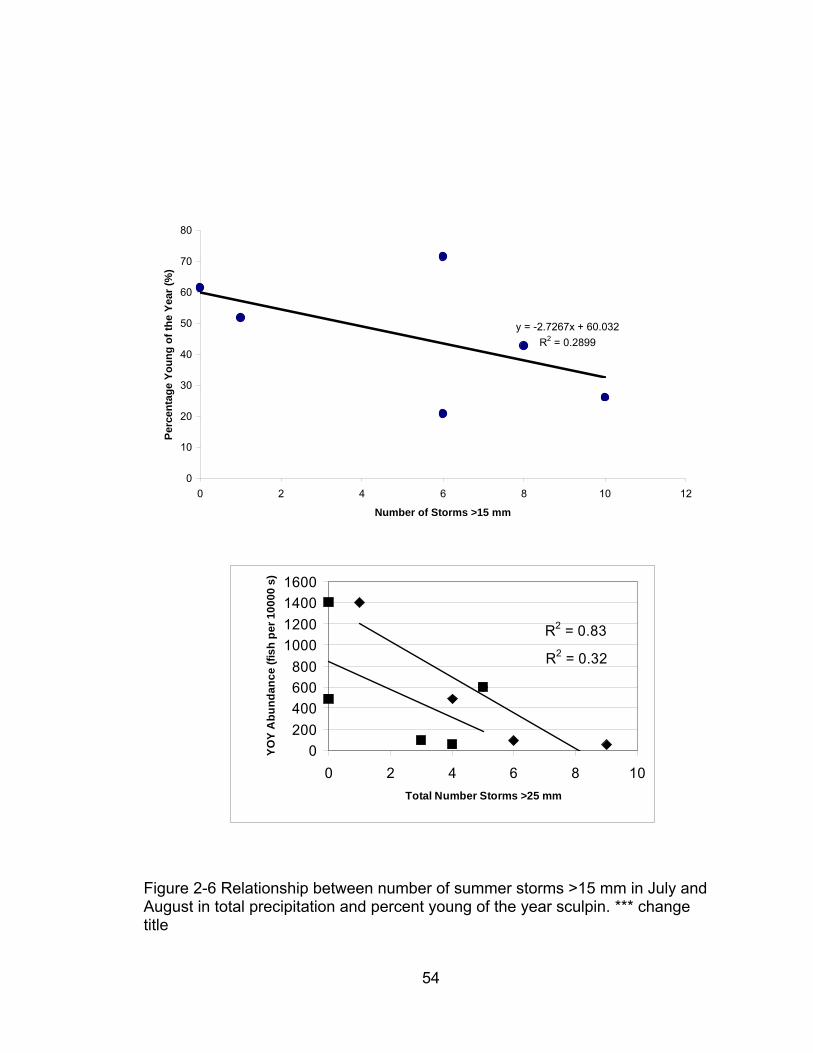
54
Figure 2-6 Relationship between number of summer storms >15 mm in July and August in total precipitation and percent young of the year sculpin. *** change title
y = -2.7267x + 60.032R2 = 0.2899
0
10
20
30
40
50
60
70
80
0 2 4 6 8 10 12
Number of Storms >15 mm
Perc
enta
ge Y
oung
of t
he Y
ear (
%)
R2 = 0.32
R2 = 0.83
0200400600800
1000120014001600
0 2 4 6 8 10Total Number Storms >25 mm
YOY
Abu
ndan
ce (f
ish
per 1
0000
s)

55
3 Seasonal patterns of energy storage, energy expenditure, and in vitro
gonadal steroidogenic capacity in slimy sculpin (Cottus cognatus)
3.1 Abstract The objective of this study was to characterize the reproductive seasonality of a
wild population of slimy sculpin (Cottus cognatus), a small-bodied, benthic spring
spawning species. We observed and described the gonadosomatic index,
hepatosomatic index, condition factor, and in vitro gonadal production of estradiol
(E2) and testosterone (T) in females and T and 11-ketotestosterone (11-KT) in
males. Seasonal patterns were observed in the reproduction of both male and
female slimy sculpin, with the males initiating gonadal development before the
females. Following a quiescent period in the summer, female sculpin showed an
increase in gonadal hormone production during the fall, which was associated
with increases in gonad and liver sizes, however males experienced a much
shorter resting phase following spawning in May. Elevated production of both T
and 11-KT appears to both signal the initiation of spermatogenesis in September
and contribute to sperm maturation over the winter. Although hormone
production and precise timing of the spawning period will vary with fluctuation in
environmental factors such as temperature and food availability, this study is
important because it is the first characterization of the seasonal reproductive
pattern in slimy sculpin and it describes the patterns of energy expenditure and
energy storage in this species as it prepares for spawning. Sculpin appear to be
unique compared with other temperate fish species because it has a reproductive

56
pattern that means gonadal maturation can occur in water temperatures of <1 °C
in northern areas of its distribution.
3.2 Introduction Freshwater sculpin are often locally abundant and occupy primarily swift-
water, boulder-gravel river habitat. Sculpin (Cottus spp.) represent an important
ecological component of northern temperate systems, but surprisingly little is
known about their reproductive biology (deVlaming et al. 1984). These fish have
been characterized as rock nesters (Natsumeda 2001), with males maintaining
breeding space under rocks where they mate with females (Goto 1998). They are
usually a spring spawning species in northern temperate waters, and are
relatively unique in that they do not start to accumulate gonadal tissue until the
winter and early spring (Gray 2003). They are complete spawners, with fecundity
ranging from 40-200 depending on their size and age. Freshwater sculpin
reproductive strategies do not appear to be similar to other temperate freshwater
species, however, no comprehensive studies have been conducted.
For an organism to survive, it must be able to convert calories contained in
food into energy, to store part of that energy for subsequent use, and to mobilize
it when necessary (Griffin 2000). Maintenance of energy homeostasis is also
important for regulating body weight, which requires a balance between food
consumption and energy expenditure. The typical diet of slimy sculpin is believed
to consist of small benthic invertebrates and fishes (Scott and Crossman, 1998);
however, several studies have documented finding salmonid eggs in the
stomachs of slimy sculpin (Mirza and Chivers 2002). Spring and early summer

57
spawning species commonly use a reproductive strategy where gonadal tissue
develops in the fall with final maturation as water temperatures rise in the spring,
as with white sucker (Catostomus commersoni) (Scott et al. 1984) or gonadal
development occurs quickly in the spring, as with several species of dace
(Galloway and Munkittrick 2005). Freshwater sculpin species such as the
spoonhead sculpin (Cottus ricei) spawn immediately after ice out in the spring
(Gibbons et al., 1998) and slimy sculpin spawn following the spring freshet. This
strategy requires that the bulk of gonad tissue is generated overwinter and under
ice, when water temperatures are at or below freezing, and activity levels are
usually limited. In this regard, sculpin also present an interesting model for
energy storage, as they are actively synthesizing lipid-rich tissue (gonad) under
ice while food sources are limited.
To ensure that a fish is in breeding condition at the appropriate season,
physiological mechanisms must control the timing of gonad maturation (Wootton
1998). Gonadal steroid hormones are an important factor involved in these
physiological processes, and timely and appropriate changes in gonadal
steroidogenesis are necessary for successful reproduction (Ponthier et al. 1998).
It is not known which hormones are responsible for initiating and sustaining the
processes of sperm and oocyte maturation in sculpin. Previous studies have
shown that female slimy sculpin gonad sizes are very small (<2-5% of body
weight) at the beginning of the ice-cover period, and are then very large (30-
40%) prior to spawning time following the spring freshet (Gray 2003). Hormonal
assessment of reproduction is complicated by the small size of freshwater cottids

58
(usually <<10 g) and low blood volume precludes the use of blood samples for
analysis of circulating sex steroids. A protocol has been developed to measure
the in vitro steroid biosynthetic capability of gonadal tissue as a surrogate for
levels circulating in blood (McMaster et al. 1995). Hormones produced by the
gonads interact to regulate the growth and structural integrity of the reproductive
organs, the production of gametes, the patterns of sexual behavior, the
phenotypic differences between the sexes, and the continuation of the species.
To date, no study has addressed how spring spawning slimy sculpin
function over the winter and the rate at which recrudescence occurs under ice
cover. This study presents the seasonal characterization of energy storage,
energy expenditure, and in vitro gonadal hormone production in slimy sculpin,
and describes its reproductive cycle based on these observed patterns.
3.3 Methods Slimy sculpin were collected from the upper Kennebecasis River (45° 49’
37”N, 65° 13’ 9”W), southern New Brunswick (Canada). This section of the river
is primarily groundwater-fed and remains ice free, allowing for continuous
monthly collections year round (May 2003-May 2004). Slimy sculpin were
collected by sampling faster runs and riffles (approx. 1.1–1.5 m/s) approximately
0.5 to 0.75 m deep with boulder/cobble substrates, between the hours of 10:00
and 13:00. Sculpin were collected with dipnets (1.2 m, 6-mm mesh size) and a
backpack electrofisher unit (Smith-Root type VII). Collections targeted a
minimum of 20 adult males and 20 females per sampling period. Holding time in

59
the cooler did not exceed 4 h, based on results of previous experiments on the
effects of holding time on steroid production (Tetreault 2002). Each adult fish was
rendered unconscious by concussion, followed by spinal severance, and
measured for total length (+0.1 cm), body weight (+0.01 g), gonad weight (+0.001
g), and liver weight (+0.001 g). Gonadosomatic index (GSI) and hepatosomatic
index (HSI) were calculated similarly using the ratio of (organ/(body weight-
organ))*100. Condition factor was calculated as 100000*(body weight/((total
length)^3)) when length is reported in millimetres.
Gonadal tissues were placed in medium 199 (M199; containing Hank’s
salts without bicarbonate; GIBCO, Burlington, ON, Canada which was
supplemented with 25 mM Hepes, 4.0 mM sodium bicarbonate, 0.01%
streptomycin sulfate, and 0.1% bovine serum albumin (pH 7.4)) at 4˚C until
preparation for culture; holding time for gonadal tissue never exceeded 6 h.
Small sections (18-25 mg) of the gonad tissue were placed into M199 in 20-ml
sample tubes on ice. In vitro incubation of the gonadal tissue was conducted in
24-well tissue culture plates (Falcon 3047; Fisher Scientific, Toronto, ON,
Canada). Tissues were subjected to two treatments: basal (M199 alone) or
stimulated (forskolin + M199) (Sigma F6886). Forskolin is a diterpene activator of
the adenylate cyclase pathway which mimics gonadotropin action. This
compound bypasses the gonadotropin receptor which increases cyclic AMP
production and subsequent gonadal steroid production (McMaster et al. 1995).
The level of forskolin-stimulated steroid production provides information
regarding the integrity and maximal capacity of the tissue to produce steroid

60
hormones. Tissues were incubated for 18 h at 16˚C, after which the media from
each of the wells was removed, placed in cryovials, and stored at -80˚C until the
time of analysis.
Hormones were analyzed at the National Water Research Institute
(Burlington, ON). Concentrations of testosterone (T) (both sexes), 17β-estradiol
(E2) (females) and 11-ketotestosterone (11-KT) (males) released into the media
during the incubation period were quantified by radioimmunoassay (RIA) as
described by McMaster et al. (1992). Media samples were assayed in duplicate
at a volume of 100-200 μL for each hormone and values were converted to
correct for size of sub-sample of tissue analyzed, and expressed in pg/mg of
gonadal tissue. For T, E2 and 11-KT, inter-assay variabilities were <10% and
intra-assay variability for each steroid was approximately 5%. T and E2
antibodies were purchased from Medicorp (Prod#07-189016, #07-138016
Montreal, Que., Canada) and radiolabelled T, E2, and 11-KT from Amersham
Pharmacia Biotech (3H-T Prod# TRK 402; 3H-E2 Prod# TRH 322; 3H-11-KT
Prod# TRQ 8945, Baie D’Urfe, Que., Canada). Unlabelled T and E2 were
purchased from Sigma–Aldrich; KT antibody was received from Dr. Glen Van Der
Kraak (University of Guelph, Guelph, ON, Canada) and purchased from Helix
Biotech (0.3024 mg/mL; Vancouver, BC, Canada).
Due to the seasonal aspect of this study, samples in a given month were
only compared to the previous and following month's samples. For example, May
was compared to April and June, but not to other months. Estimates of condition
(weight vs. length), gonad size (gonad weight vs. body weight), and liver size

61
(liver weight vs. body weight) were evaluated using analysis of covariance
(ANCOVA) among adjacent months (SYSTAT v 9.0). Tukey's post hoc test was
then used when p<0.05.
Gonadal tissue weight determined how many replicates were possible,
and average values for in vitro hormone production were obtained from three
replicates when possible. Data are shown for 8-10 fish per sample, to illustrate
the variability as well as the polarization of some individuals. A single mean was
calculated for each month, and we attempted to characterize months when the
fish appeared to be "shut down" or “dormant” with regard to gonadal hormone
production. Due to unequal variances, hormone production data were analyzed
using non parametric comparisons (NCSS© 2004).
3.4 Results Only mature sculpin were kept for analysis during this study. During periods of
low gonadal development, a minimum length of 50 mm was used for sampling to
ensure fish were mature. During periods where gonadal growth was discernable
externally, samples included some smaller, but obviously sexually mature, fish.
Average weights for female fish ranged from 1.7 to 3.3 g, and 2.2 to 5.0 g for
males (Table 3-1). Densities of slimy sculpin in this portion of the Kennebecasis
River can be as high as 8 per m2. There were no detectable differences in size
distributions of the population at this site (n>150) in collections conducted prior to
and following the completion of the study (data not shown).
Male gonad sizes increased rapidly throughout September, reaching their maximum size (2.29 ± 0.07%) in November (

62
0
0.5
1
1.5
2
2.5
Gon
ados
omat
ic In
dex
(%)
Post-spawning Recrudescence Maturation
0
10000
20000
30000
40000
In V
itro
Test
oste
rone
Pro
duct
ion
(pg/
ml)
May June July Aug Sept Oct Nov Jan February March April May
0
10000
20000
30000
40000
50000
In V
itro
11-K
etot
esto
ster
one
Pro
duct
ion
(pg/
ml)
†
‡
†
†
‡
‡
**
**
*
Spawn Spawn
A
B
C
0
0.5
1
1.5
2
2.5
Gon
ados
omat
ic In
dex
(%)
0
0.5
1
1.5
2
2.5
Gon
ados
omat
ic In
dex
(%)
Post-spawning Recrudescence Maturation
0
10000
20000
30000
40000
In V
itro
Test
oste
rone
Pro
duct
ion
(pg/
ml)
May June July Aug Sept Oct Nov Jan February March April May0
10000
20000
30000
40000
In V
itro
Test
oste
rone
Pro
duct
ion
(pg/
ml)
May June July Aug Sept Oct Nov Jan February March April May0
10000
20000
30000
40000
In V
itro
Test
oste
rone
Pro
duct
ion
(pg/
ml)
May June July Aug Sept Oct Nov Jan February March April MayMay June July Aug Sept Oct Nov Jan February March April May
0
10000
20000
30000
40000
50000
In V
itro
11-K
etot
esto
ster
one
Pro
duct
ion
(pg/
ml)
0
10000
20000
30000
40000
50000
In V
itro
11-K
etot
esto
ster
one
Pro
duct
ion
(pg/
ml)
†
‡
†
†
‡
‡
**
**
*
Spawn Spawn
A
B
C
Figure 3-1A). Testis size decreased significantly by January (p=0.016), and then continued to gradually decrease until spawning (1.80 ± 0.08%), although the decreases were not statistically significant between adjacent months (p=0.14, 0.8, 0.69, 0.76). Male gonad sizes were at their minimum during July (0.21± 0.04%), however, both T and 11-KT showed significant increases in gonadal in vitro productive capacity during July, compared to June (p=0.028 & p=0.032, respectively) (

63
0
0.5
1
1.5
2
2.5
Gon
ados
omat
ic In
dex
(%)
Post-spawning Recrudescence Maturation
0
10000
20000
30000
40000
In V
itro
Test
oste
rone
Pro
duct
ion
(pg/
ml)
May June July Aug Sept Oct Nov Jan February March April May
0
10000
20000
30000
40000
50000
In V
itro
11-K
etot
esto
ster
one
Pro
duct
ion
(pg/
ml)
†
‡
†
†
‡
‡
**
**
*
Spawn Spawn
A
B
C
0
0.5
1
1.5
2
2.5
Gon
ados
omat
ic In
dex
(%)
0
0.5
1
1.5
2
2.5
Gon
ados
omat
ic In
dex
(%)
Post-spawning Recrudescence Maturation
0
10000
20000
30000
40000
In V
itro
Test
oste
rone
Pro
duct
ion
(pg/
ml)
May June July Aug Sept Oct Nov Jan February March April May0
10000
20000
30000
40000
In V
itro
Test
oste
rone
Pro
duct
ion
(pg/
ml)
May June July Aug Sept Oct Nov Jan February March April May0
10000
20000
30000
40000
In V
itro
Test
oste
rone
Pro
duct
ion
(pg/
ml)
May June July Aug Sept Oct Nov Jan February March April MayMay June July Aug Sept Oct Nov Jan February March April May
0
10000
20000
30000
40000
50000
In V
itro
11-K
etot
esto
ster
one
Pro
duct
ion
(pg/
ml)
0
10000
20000
30000
40000
50000
In V
itro
11-K
etot
esto
ster
one
Pro
duct
ion
(pg/
ml)
†
‡
†
†
‡
‡
**
**
*
Spawn Spawn
A
B
C
Figure 3-1). Based on a combination of hormone level and gonadal size, the
reproductive cycle for male sculpin was divided into four “seasons”:
postspawning (June), recrudescence (July-October), maturation (late October to
April) and spawning (May).

64
In vitro steroid synthetic capacity in male testis tissue was highly variable
among individuals, also within a given collection period (i.e. month). Highest
individual values for T were seen during August, immediately preceding the large
increase in gonad size during September and early October. Similarly, males
showed increased synthetic capacity for 11-KT in August, but maximum levels
were not observed until November. This is followed by a significant decrease in
testis weight (p=0.016) and presumably spermatocyte maturation. However,
individual males continued to show low steroid productivity, and there was no
relationship between T production and relative gonad size (r2=0.082), or between
T and 11-KT (r2 =0.40).
In contrast to the male reproductive cycle, female gonad sizes increased
gradually during the winter in preparation for the next spawn (May) (Figure 3-2A).
During the winter, at water temperatures below 1˚C, the ovaries increased in size
from less than 1% in October to more than 12% when water temperatures began
to rise in April. Rapid growth occurred in this tissue between early April and May,
increasing significantly from 12.41 ± .0.54 % to 29.66 ± 0.76 % (p<0.001).
For females, both E2 and T production capacity were diminished during
the collections following the spawning period (Figure 3-2). T capacity remained
low until early February as recrudescence ended (p<0.001). Following this initial
increase, T production remained elevated until spawning. In September, E2
production increased as recrudescence began and stayed elevated in most fish
until late February. E2 production dropped off in the months preceding spawning,

65
with a marked reduction in May (p=0.023). As E2 capacity declined, T production
began to increase starting in early February (p=0.003).
In male sculpin, there was not a significant decrease in condition factor following spawning in May 2003 (p=0.170) (Table 3-1). However, during the season of gonadal growth, there were changes in condition (p<0.0001) (Table 3-1). In November, when both gonad and liver showed significant increases, condition decreased (p<0.0001). Additionally, condition increased more than 10% in the early February collection (p<0.0001), from 0.90 to 1.06 in developing males. Following spawning, liver size in male sculpin was constant, with no detectable change until September (p=0.004) (Figure 3-3). This coincided with a period of rapid testis growth. While testis size reached its maximum in November (

66
0
0.5
1
1.5
2
2.5
Gon
ados
omat
ic In
dex
(%)
Post-spawning Recrudescence Maturation
0
10000
20000
30000
40000
In V
itro
Test
oste
rone
Pro
duct
ion
(pg/
ml)
May June July Aug Sept Oct Nov Jan February March April May
0
10000
20000
30000
40000
50000
In V
itro
11-K
etot
esto
ster
one
Pro
duct
ion
(pg/
ml)
†
‡
†
†
‡
‡
**
**
*
Spawn Spawn
A
B
C
0
0.5
1
1.5
2
2.5
Gon
ados
omat
ic In
dex
(%)
0
0.5
1
1.5
2
2.5
Gon
ados
omat
ic In
dex
(%)
Post-spawning Recrudescence Maturation
0
10000
20000
30000
40000
In V
itro
Test
oste
rone
Pro
duct
ion
(pg/
ml)
May June July Aug Sept Oct Nov Jan February March April May0
10000
20000
30000
40000
In V
itro
Test
oste
rone
Pro
duct
ion
(pg/
ml)
May June July Aug Sept Oct Nov Jan February March April May0
10000
20000
30000
40000
In V
itro
Test
oste
rone
Pro
duct
ion
(pg/
ml)
May June July Aug Sept Oct Nov Jan February March April MayMay June July Aug Sept Oct Nov Jan February March April May
0
10000
20000
30000
40000
50000
In V
itro
11-K
etot
esto
ster
one
Pro
duct
ion
(pg/
ml)
0
10000
20000
30000
40000
50000
In V
itro
11-K
etot
esto
ster
one
Pro
duct
ion
(pg/
ml)
†
‡
†
†
‡
‡
**
**
*
Spawn Spawn
A
B
C
Figure 3-1), liver size recovered and began to increase in late fall
(p<0.001), continuing through until March (Figure 3-3).
Unlike males, females exhibited a significant decrease in condition
following the spawn (p=0.022) (Table 3-1). Initially during recrudescence, there
was no change in condition, but condition decreased in late fall (p<0.0001)
67
corresponding with increases in both gonad (p=0.002; Figure 3-2) and liver size
(p=0.031; Figure 3-3). Beginning in February, there was a slight but significant
increase in condition (p<0.0001).
Liver size was dynamic in females, initially increasing after spawn
(p=0.016) and then decreasing until after the onset of recrudescence. Beginning
in October, liver size increased significantly each month, reaching maximum size
in early March. From September to March relative liver size increased by 400%.
During the final phases of gonadal growth, male and female liver sizes dropped
rapidly (p=0.004 & p=0.009, respectively).
3.5 Discussion The assimilation of resources and the management of reserves are
important in the life history of fish and may affect survival and reproductive
success. Energy reserves in the liver, carcass, and body cavity are partitioned to
provide energy requirements for both reproduction and winter maintenance and
survival.
We observed a seasonal pattern in GSI, HSI, condition factor, and
gonadal hormone production in both male and female sculpin. Males have a
much shorter post-spawn/resting period than females, and male recrudescence
begins in July with a significant increase in both 11-KT and T production, but not
in gonad weight. This surge in T production in August may be the cue for the
subsequent increase in testes weight. However, during the period of rapid gonad
growth (Sept-Oct), both T and 11-KT production are near post spawning levels.
68
In November, elevated production of both T and 11-KT appear to trigger a
decrease in testis size, perhaps as gamete maturation progresses. As with the
initiation of recrudescence, the onset of gonadal maturation corresponds with
higher production of both 11-KT and T in the preceding month's collection. Both
11-KT and T production stabilize about 2 months prior to spawning, perhaps
indicating that sperm maturation is complete, and males may be ready to spawn
prior to females.
Decreased steroid production capacity is potentially indicative of reduced
substrate availability, such as cholesterol, or an inhibition or shift in the regulatory
enzymes controlling steroid biosynthesis (McMaster et al. 1995). In some
species, 11-KT is associated with the expression of secondary sex
characteristics, e.g., parental behaviors (Liley et al. 1986, Kindler et al. 1989).
Given the pattern of 11-KT observed, perhaps it also plays a role in the
reproductive behavior in the slimy sculpin. Additionally these data suggest that T
and 11-KT work in conjunction throughout the observed season, however,
additional research is needed to investigate the interplay between these
hormones, as well as the seasonal expression of gonadal enzymes. Stimulation
tests, such as the in vitro assay used in this study, are designed to take
advantage of known endogenous control mechanisms to assess steroidogenic
capacity of the tissue to produce hormone (Griffin 2000). Variability between fish
in vitro steroidogenic capacities in a given month generates questions about
reproductive asynchrony and how microhabitat differences may influence
physiological endpoints. During phases of the reproductive cycle when there are

69
critical changes in gonadal development, the variability in steroidogenesis is high.
This indicates there is not synchrony among fish, or the fish utilize differences in
microhabitat to give themselves benefits in terms of performance. This is a
worthy hypothesis for future study in the slimy sculpin.
For post-spawning females, both T and E2 production appears to be shut
off in August, followed by what may be an increase in aromatase (enzyme that
converts T to E2) in Sept, evidenced by an increase in E2 production after being
"shutdown” from June-August. In February, all the fish have increased E2
production, and T is beginning to increase. Recrudescence in females is initiated
in September and corresponds to a significant increase in E2. T production stays
consistently low until early spring, when there appears to be a shift, perhaps
enzymatic, in gonadal hormone production. In early spring, both T and E2 show
significant increases in hormone production, potentially related to thermal cues
as water temperatures increase. At the time of prespawning, E2 production has
dropped significantly, while T remains elevated. This switch in the steroid
pathway may be to other hormones involved in maturation and ovulation. In white
sucker, during gonadal maturation, E2 production is lessened while 17α-20β-
dihydroxy 4-pregnen-3-one is up-regulated (Van Der Kraak et al. 1992).
In March and April, there is increased energy expenditure (gonads are
growing). The liver appears to be the most dynamic energy source as gonads
develop, although the female sculpin don’t appear to be depleting liver storage as
they build gonad over the winter. This pattern may be indicative of female sculpin
actively feeding during winter for gonadal growth, as liver size increases in a

70
similar pattern until March and the shift into the prespawning stage. Male gonad
growth appears to be fueled by liver stores, and the males could be searching for
nest sites and may not be guarding until May. Maintenance of energy
homeostasis is important for regulating body weight, which requires a balance
between food consumption and energy expenditure. In a previous comparative
study of stable isotopes (Jardine et al. 2005), male slimy sculpin sampled in April
exhibited 15N enrichment, suggesting they may be in poor nutritional condition
prior to spawning in May. Female sculpin in this study did not show significant
15N enrichment suggesting that their prey consumption rates remained constant
throughout the winter. Jardine et al. (2005) suggest this may be a consequence
of cessation or reduction in feeding during the establishment of territories and
nest guarding by males. MacInnis and Corkum (2000) suggest that male sculpin
do not feed while guarding the nest, a contributing factor to the early death of
males after a single spawning cycle. Given this metabolically challenging
environment, is it likely female sculpin have developed a divergent approach to
reproductive and energetic investment.
Assuming that the pattern of allocating time and resources will be related
to the breeding system, we expected to see male sculpin exhibit changes in liver
size and condition during the prespawning period. In this species, males may be
responsible for several of the following behaviors in preparation for spawning:
movement to and choice of a breeding site, preparation of a spawning site,
defence of a spawning site, courtship and parental care.

71
Sculpin have been used recently for freshwater environmental monitoring
related to agriculture (Gray et al. 2002, Gray 2003, Gray et al. 2005), pulp and
paper and sewage effluents (Gibbons et al. 1998, Galloway et al. 2003) as well
as oil sands operations (Tetreault et al. 2003a, Tetreault et al. 2003b). Several
studies have attempted to compare large- and small-bodied fishes to similar
stressors and attribute differences in responses to habitat, life history and
mobility (Gibbons et al. 1998, Galloway et al. 2003). However, sculpin have
consistently presented alternative confounding response patterns and results,
and limited information about their life history and reproductive cycles make the
data difficult to interpret in the context of other species and previous studies.
This study presents the reproductive cycle of both male and female slimy
sculpin which is characterized by distinct seasonal variations in energy storage,
represented by liver size and condition factor, and energy expenditure
represented by gonad size. Data on organ sizes, condition and hormone
production can indicate when males and females are shifting reproductive stages
from pre- and to post-spawning, to recrudescence, and then to final maturation
and will assist in interpreting population data collected in environmental studies.
Sculpin are unique, compared with other temperate fish species, as gonadal
steroid production is more variable and their reproductive pattern reveals that
gonadal maturation can take place in water temperatures below 1 °C in central to
northern Canadian streams.

72
3.6 References deVlaming, V., Fitzgerald, R. Delahunty G. Cech, J.J., Selman, K., Barkley,
M.,1984. Dynamics of oocyte development and related changes in serum
estradiol 17β, yolk precursor, and lipid levels in the Teleostean fish, Leptocottus
armatus. Comp. Biochem. Physiol. 77A, 599-610.
Galloway, B.J., Munkittrick, K.R., Currie, S. Gray, M.A., Curry R.A. Wood, C.S.,
2003. Examination of the responses of slimy sculpin (Cottus cognatus) and white
sucker (Catostomus commersoni) collected on the St. John River (Canada)
downstream of pulp mill, paper mill, and sewage discharges. Environ. Toxicol.
Chem. 22, 2898-2907.
Galloway B.J., Munkittrick, K.R., 2005. Influence of seasonal changes on the
suitability of multiple spawning freshwater fish species for examining reproductive
impacts of stress. Submitted to J Fish Biol.
Gibbons, W.N., Munkittrick K.R., Taylor, W.D., 1998. Monitoring aquatic
environments receiving industrial effluents using small fish species 1: response
of spoonhead sculpin (Cottus ricei) downstream of a bleached-kraft pulp mill.
Environ. Toxicol. Chem. 17, 2227-2237.
Gray, M.A., Curry, R.A. Munkittrick, K.R., 2002. Non-lethal sampling methods for
assessing environmental impacts using a small-bodied sentinel fish species.
Water Quality Res. J. Can. 37, 195-211.

73
Gray, M.A., 2003. Assessing non-point source pollution in agricultural regions of
the upper St. John River basin using the slimy sculpin (Cottus cognatus). PhD
thesis. University of New Brunswick, Fredericton, N.B.
Gray, M.A. Munkittrick, K.R., 2005. An effects-based assessment of slimy
sculpin (Cottus cognatus) populations in agricultural Regions of Northwestern
New Brunswick. Water Quality Res. J. Can. 40, 16-27.
Goto, A., 1998. Life history variation in the fluvial sculpin Cottus nozawae
(Cottidae) along the course of a small mountain stream. Env. Biol. Fishes. 52,
203-212.
Griffin, J.E., 2000. Assessment of Endocrine Function. In: Griffin, J.E., Ojeda,
S.R. (Eds.), Textbook of Endocrine Physiology. Oxford university Press, New
York, pp. 113-127.
Jardine, T.D., Gray, M.A., McWilliam, S.M., Cunjak, R.A., 2005. Stable isotope
variability in tissues of temperate stream fishes. Transactions of the American
Fisheries Society. In press.
Kindler, P.M., Philipp, D.P., Gross, M.R., Bahr, J.M., 1989. Serum 11-
ketotestosterone and testosterone concentrations associated with reproduction in

74
male bluegill (Lepomis macrochirus: Centrarchidae). Gen. Comp. Endocrinol. 75,
446-53.
Liley, N.R., Breton, B., Fostier, A., Tan, E.S., 1986. Endocrine changes
associated with spawning behavior and social stimuli in a wild population of
rainbow trout (Salmo gairdneri). I. Males. Gen Comp Endocrinol. 62, 145-56.
MacInnis, A.J., Corkum, L.D., 2000. Fecundity and reproductive season of the
round goby Neogobius melanostomus in the Upper Detroit River. Trans. Amer.
Fish. Soc. 129,136–144.
McMaster, M.E., Munkittrick, K.R., Van Der Kraak, G.J., 1992. Protocol for
measuring circulating levels of gonadal sex steroids in fish. Can. Tech. Rept.
Fish Aquat. Sci. 1836: 29 p.
McMaster, M.E., Munkittrick, K.R., Jardine, J.J., Robinson, R.D., Van Der Kraak,
G.J., 1995. Protocol for measuring in vitro steroid production by fish gonadal
tissue. Can. Tech. Rept. Fish Aquat. Sci. 1961: 78 p.
Mirza, R.S., Chivers, D.P., 2002. Attraction of slimy sculpins to chemical cues of
brook charr eggs. J. Fish Biol. 61, 532–539.

75
Natsumeda, T., 2001. Space use by the Japanese fluvial sculpin, Cottus pollux,
related to spatio-temporal limitations in nest resources. Env. Biol. Fishes. 62,
393-400.
Ponthier, J.L., Shackleton, C.H.L., Trant, J.M., 1998. Seasonal changes in the
production of two novel and abundant ovarian steroids in the channel catfish
(Ictalurus punctatus). Gen. Comp. Endocrinol. 111, 141-155.
Scott, A.P., MacKenzie, D.S., Stacey, N.E., 1984. Endocrine changes during
natural spawning in the white sucker, Catostomus commersoni. II. Steroid
hormones. Gen. Comp. Endocrinol. 56, 349–359.
Scott, W.B., Crossman, E.J., 1998. Freshwater fishes of Canada. Galt House
Oakville, ON. Canada. 966 p.
Tetreault, G.R. 2002. Monitoring the aquatic environment in the Athabasca Oil
Sands using reproductive responses in small-bodied fish. M. Sc. thesis.
University of Waterloo, Waterloo. Ontario.
Tetreault, G.R., McMaster, M.E., Dixon, D.G., Parrott, J.L., 2003a. Using
reproductive endpoints in small forage fish species to evaluate the effects of
Athabasca Oil Sands activities. Environ Chem. Tox. 22, 2775-2782.

76
Tetreault, G.R., McMaster, M.E., Dixon, D.G., Parrott, J.L., 2003b. Physiological
and biochemical responses of Ontario slimy sculpin (Cottus cognatus) to
sediment from the Athabasca Oil Sands Area. Water Qual. Res. J. Canada. 38,
631-377.
Van der Kraak GJ, KR Munkittrick, ME McMaster, CB Portt and JP Chang.,
1992. Exposure to bleached kraft pulp mill effluent disrupts the pituitary-gonadal
axis of white sucker at multiple sites. Toxicol and Applied Pharmacology 115:
224-233.
Wootton, R.J., 1998. Life-history strategies. In: Wootton, R.J. (Ed.), Ecology of
Teleost Fishes. Fish and Fisheries Series Vol 24. Kluwer Academic, Dordrecht.
pp.259-283.

77
Table 3-1 Monthly values for mean total length and mean body weight of slimy sculpin (Cottus cognatus) collected from May 2003-May 2004. Values are mean ± SEM (N) *indicates significant change from preceding month (p<0.05). Condition factor was calculated as k=(weight/(length)3)*100. * indicates a significant difference (p<0.05) from the preceding month.
Females Males Length (mm) Body Wt (g) Condition
Factor Length (mm) Body Wt (g) Condition Factor
May 61 + 1 (21) 2.63+ 0.24
1.09 ± 0.025 75.67 + 0.33 (3) 5.07 + 0.29
1.17 ± 0.058
June 62+1 (22) 2.47+0.19
0.99 ± 0.015* 67.43 + 1.89 (23) 3.15 + 0.26*
0.98 ± 0.017
July 58+1(21)* 1.94+0.24 * 0.95 ± 0.013 66.95 + 2.45 (21) 3.29 + 0.45 0.99 ± 0.016
August 67+4 (6)* 3.25+0.64* 1.00 ± 0.016 75.17 + 1.74 (6) 3.17 + 0.31 1.03 ± 0.028
September 61+ 1 (22)* 2.18+0.09* 0.96 ± 0.017 65.90 + 1.87 (21)* 3.00 + 0.29* 1.00 ± 0.024
October 61+1 (22) 2.26+0.17 0.96 ± 0.014 67.73 + 2.16 (22) 3.30 + 0.33 0.99 ± 0.017
November 58+1 (23) 1.70+0.10* 0.84 ± 0.015* 68.08 + 1.38 (26) 2.83 + 0.19 0.87 ± 0.01*
January 58+2 (20) 1.87+0.22 0.89 ± 0.013 61.29 + 1.71 (24)* 2.22 + 0.22* 0.90 ± 0.014
55+2 (25) 1.76+0.17 1.01 ± 0.019* 62.17 + 2.09 (18) 2.71 + 0.31 1.06 ± 0.030* February 58+2 (30) 2.12+0.21 1.01 ± 0.014 64.75 + 2.23(24) 2.91 + 0.30 1.02 ± 0.027
March 51+1 (15)* 2.54+0.22 1.03 ± 0.024 53.17 + 2.00 (24)* 3.25 + 0.42 1.07 ± 0.026
April 46+1 (23)* 1.99+0.15* 1.08 ± 0.030 60.10 + 1.54 (30)* 4.56 + 0.38* 1.10 ± 0.022
May 53+1 (55)* 1.95+0.12 1.21 ± 0.01 64.11+ 1.29 (31)* 3.26 + 0.20* 1.19 ± .0.01

78
0
0.5
1
1.5
2
2.5
Gon
ados
omat
ic In
dex
(%)
Post-spawning Recrudescence Maturation
0
10000
20000
30000
40000
In V
itro
Test
oste
rone
Pro
duct
ion
(pg/
ml)
May June July Aug Sept Oct Nov Jan February March April May
0
10000
20000
30000
40000
50000
In V
itro
11-K
etot
esto
ster
one
Pro
duct
ion
(pg/
ml)
†
‡
†
†
‡
‡
**
**
*
Spawn Spawn
A
B
C
0
0.5
1
1.5
2
2.5
Gon
ados
omat
ic In
dex
(%)
0
0.5
1
1.5
2
2.5
Gon
ados
omat
ic In
dex
(%)
Post-spawning Recrudescence Maturation
0
10000
20000
30000
40000
In V
itro
Test
oste
rone
Pro
duct
ion
(pg/
ml)
May June July Aug Sept Oct Nov Jan February March April May0
10000
20000
30000
40000
In V
itro
Test
oste
rone
Pro
duct
ion
(pg/
ml)
May June July Aug Sept Oct Nov Jan February March April May0
10000
20000
30000
40000
In V
itro
Test
oste
rone
Pro
duct
ion
(pg/
ml)
May June July Aug Sept Oct Nov Jan February March April MayMay June July Aug Sept Oct Nov Jan February March April May
0
10000
20000
30000
40000
50000
In V
itro
11-K
etot
esto
ster
one
Pro
duct
ion
(pg/
ml)
0
10000
20000
30000
40000
50000
In V
itro
11-K
etot
esto
ster
one
Pro
duct
ion
(pg/
ml)
†
‡
†
†
‡
‡
**
**
*
Spawn Spawn
A
B
C
Figure 3-1 Monthly changes (mean monthly values) in male slimy sculpin A gonadosomatic index (gonad weight/body weight – gonad weight *100) B gonadal in vitro steroidogenic capacity to produce11-ketotestosterone C gonadal in vitro steroidogenic capacity to produce testosterone. Solid lines represent seasonal changes in the monthly mean. Dashed lines define "shut off" as defined by the maximum production value in the months of minimum steroidogenic capacity. */‡/† indicates significant (p<0.05) change from the preceding month using Mann Whitney nonparametric probabilities.

79
0
5
10
15
20
25
30
35
40
45
Gon
ados
omat
ic In
dex
(%)
Post-spawning Recrudescence Pre-spawning
0
5000
10000
15000
20000
25000
In V
itro
Test
oste
rone
Pro
duct
ion
(pg/
ml)
0
10000
20000
30000
In V
itro
Estra
diol
Pro
duct
ion
(pg/
ml)
‡
‡
‡
†
†
†
* * * * * **
*
* *
Spawn
May June July Aug Sept Oct Nov Jan February March April May
A
B
C
0
5
10
15
20
25
30
35
40
45
Gon
ados
omat
ic In
dex
(%)
Post-spawning Recrudescence Pre-spawning
0
5000
10000
15000
20000
25000
In V
itro
Test
oste
rone
Pro
duct
ion
(pg/
ml)
0
10000
20000
30000
In V
itro
Estra
diol
Pro
duct
ion
(pg/
ml)
‡
‡
‡
†
†
†
* * * * * **
*
* *
Spawn
May June July Aug Sept Oct Nov Jan February March April May
0
5
10
15
20
25
30
35
40
45
Gon
ados
omat
ic In
dex
(%)
0
5
10
15
20
25
30
35
40
45
Gon
ados
omat
ic In
dex
(%)
Post-spawning Recrudescence Pre-spawning
0
5000
10000
15000
20000
25000
In V
itro
Test
oste
rone
Pro
duct
ion
(pg/
ml)
0
5000
10000
15000
20000
25000
In V
itro
Test
oste
rone
Pro
duct
ion
(pg/
ml)
0
5000
10000
15000
20000
25000
In V
itro
Test
oste
rone
Pro
duct
ion
(pg/
ml)
0
10000
20000
30000
In V
itro
Estra
diol
Pro
duct
ion
(pg/
ml)
0
10000
20000
30000
In V
itro
Estra
diol
Pro
duct
ion
(pg/
ml)
‡
‡
‡
†
†
†
* * * * * **
*
* *
Spawn
May June July Aug Sept Oct Nov Jan February March April May
A
B
C
Figure 3-2 Monthly changes (mean monthly values) in female slimy sculpin A gonadosomatic index (gonad weight/body weight – gonad weight *100) B gonadal forskolin stimulated in vitro steroidogenic capacity to produce 17β estradiol C gonadal in vitro steroidogenic capacity to produce testosterone. Solid lines represent seasonal changes in the monthly mean. Dashed lines define "shut off" as defined by the maximum production value in the months of minimum steroidogenic capacity. */‡/† indicates significant (p<0.05) change from the preceding month using Mann Whitney nonparametric probabilities.

80
May June July Aug Sept Oct Nov Jan February March April May0
1
2
3
4
5
Hep
atos
omat
icIn
dex
(%)
Males
Females*
*
**
**
*
*
*
*
3
May June July Aug Sept Oct Nov Jan February March April May
**
* ***
0
1
2
3
4
5
Hep
atos
omat
icIn
dex
(%)
A
B
May June July Aug Sept Oct Nov Jan February March April May0
1
2
3
4
5
Hep
atos
omat
icIn
dex
(%)
May June July Aug Sept Oct Nov Jan February March April MayMay June July Aug Sept Oct Nov Jan February March April May0
1
2
3
4
5
Hep
atos
omat
icIn
dex
(%)
Males
Females*
*
**
**
*
*
*
*
3
May June July Aug Sept Oct Nov Jan February March April May
**
* ***
0
1
2
3
4
5
Hep
atos
omat
icIn
dex
(%)
3
May June July Aug Sept Oct Nov Jan February March April MayMay June July Aug Sept Oct Nov Jan February March April May
**
* ***
0
1
2
3
4
5
Hep
atos
omat
icIn
dex
(%)
0
1
2
3
4
5
Hep
atos
omat
icIn
dex
(%)
A
B
Figure 3-3 Monthly changes in energy storage in A male slimy sculpin (Cottus cognatus) hepatosomatic index [liver wt/(body wt-liver wt)]*100 B female sculpin hepatosomatic index from May 2003- 2004. * indicates significant (p<0.05) change from the preceding month using Mann Whitney nonparametric probabilities.
81
4 Comparison of spring spawning slimy sculpin (Cottus cognatus) and
fall spawning brook trout (Salvelinus fontinalis) reproductive
development in agricultural regions of the St. John River (New
Brunswick, Canada)
4.1 Abstract Previous research has demonstrated that fish in agricultural areas in New
Brunswick have reduced proportions of YOY fish, due to either reproductive
dysfunction, increased mortality, or a combination of these factors. The objective
of this study was to examine two fish species with different life history strategies
and timing of reproduction. Additional comparisons were needed with a second
species and brook trout (Salvelinus fontinalis), a pelagic, fall spawning species,
were chosen to better determine the differential susceptibility relative to
reproductive timing. Previous studies in these areas indicate that the peak risk
period may occur in late summer, coinciding with trout recrudescence. Pre-
spawning sculpin demonstrated differences in condition factor, LSI, GSI and in
vitro gonadal steroidogenesis among agricultural and forested sites. Trout
responses were highly variable and no consistent patterns were seen in fish
collected at sites near agriculture. It would appear from the data that fall
spawning brook trout are not synchronized for spawning by the same cues as
spring spawning species, thereby making comparisons difficult in this species. In
a study that was designed to identify differences in a reproductive impairment in
fish with differing reproductive strategies, the patterns remain unclear.

82
4.2 Introduction There has been considerable attention given to the impacts of potato
farming on fish populations in Atlantic Canada over the past few years. An
increased frequency of summer fish kills of brook trout (Salvelinus fontinalis) in
potato farming areas of Prince Edward Island has been associated with summer
thunderstorm events (Cairns 2002). In Atlantic Canada, heavy rainstorms in mid
to late summer can coincide with heavier chemical application as the potato vine
grows and is more susceptible to peril (Chow et al. 2000, Rees et al. 2002).
Recently completed studies have compared fish performance in 20 New
Brunswick tributaries (Gray and Munkittrick, 2005), and have shown that slimy
sculpin reproductive performance was very low at agricultural sites. Detailed
studies in northern New Brunswick have demonstrated that slimy sculpin (Cottus
cognatus) in agricultural areas have reduced proportions of young of the year
(YOY) fish, due to either reproductive dysfunction, increased mortality, or a
combination of these factors (Gray et al. 2002, 2004, 2005).
These studies have demonstrated a number of potential causes of stress
in the agricultural areas, including changes in chemicals, and potential
concomitant stress imposed by nutrients, altered habitat, changes in
temperature, runoff, and sediment deposition. The mixtures of chemicals and
non-chemical stressors are complex, difficult to characterize, and the rates and
timing of discharges are difficult to predict (Landis and Yu 1999). Potato
production involves leaving the soil bare for long periods of time, which can lead
to high erosion risk. Sediment is the number one pollutant in streams in North
America (Waters 1995), and can impact fish populations through turbidity,

83
suspended sediments, and deposition of sediments (Sowden and Power 1985,
Redding et al. 1987, Chapman 1988, Barrett et al. 1992).
It is unclear if the decreased abundance of young-of-the-year (YOY) noted
in agricultural areas (Gray and Munkittrick, 2005, Gray et al. 2005) is associated
with altered YOY survival or depressed reproduction. In addition to the difficulties
encountered in trying to separate the potential stressors, there are also
challenges in separating the complex impacts. Detailed studies have
documented year class failures in agricultural areas, and decreases in ovary
size, fecundity, and nest size in populations of slimy sculpin (Gray et al. 2002,
Gray and Munkittrick, 2004). However, a recent study (Chapter 2) has also
identified that the peak mortality period for sculpin occurs in late summer,
coinciding with highest water temperatures and the most intense chemical
applications (>10 applications between July-Sept.). Furthermore, year class
strength in terms of YOY abundance correlates with the number of summer
storms (Chapter 2).
It is difficult to evaluate the contribution of reproductive impairment to the
depressions in YOY because of the life history and reproductive development of
the slimy sculpin. Slimy sculpin spawn in mid May (Keeler and Cunjak 2006),
and hatch in mid to late June (unpubl. data). Gonadal development in females
occurs primarily from November to April (Chapter 3; Brasfield et al., submitted), a
period of no agricultural activity in potato-growing areas, and little pesticide
mobility in the water column (Hewitt et al. 2005). It is not presently known if
pesticides adsorbed to sediments present a route of exposure although extracts

84
from sediments collected from brook trout egg incubators deployed during winter
in Black Brook affected hatching success (Cunjak et al. unpublished). In contrast,
male sculpin undergo most of their gonadal growth between late August and
early October (Chapter 3) and reproductive potential can be assessed in the
early fall.
Previous and continuing studies on the St. John River indicate small-
bodied fish species present more suitable models for effects-driven assessment
(Gray et al. 2002, Galloway et al. 2003, Vallis 2003, Vallieres 2005). Small rivers
in this part of Canada are dominated in colder reaches by a small fish community
of 3 to 4 fish species, including slimy sculpin, brook trout, and brook stickleback
(Culea inconstans) in slower areas, and blacknose dace (Rhinichthys atratulus)
in warmer areas (Curry and Munkittrick, unpublished data). Slimy sculpin have
been utilized as a sentinel species because of their low mobility and high site
fidelity in these systems (Gray et al., 2004; Cunjak et al., 2005). It is possible
that other species may be more sensitive to the impacts of potato farming.
Reproductive development in brook trout occurs during summer period, with
spawning in early fall just after the potato harvest. Brook trout are a fall spawning
species, and therefore are recrudescent during summer periods of increased
runoff events and potentially at greater risk. Comparing the responses of these
two species in agricultural areas may determine the differential susceptibility
relative to timing of reproduction.
This study evaluates the reproductive potential of prespawning slimy
sculpin and brook trout in potato farming and reference areas of Northern New

85
Brunswick. The study focused on whole organism endpoints and in vitro steroid
production. Gonadal steroid hormones are an important regulator of reproductive
development (Ponthier et al. 1998, Wooton, 1998) and laboratory and field
studies have shown that reductions in circulating levels of sex steroids can
indicate exposure to stressors affecting the reproductive system (McMaster et al.
1995). Gonadal steroidogenic capacity can be used for identifying periods of risk
related to agricultural runoff and differential susceptibility of fish populations
warrants comparisons between different species.
4.3 Methods The St. John River from Grand Falls to Woodstock is one of the largest
potato farming regions in eastern Canada. Previous work in this watershed (Gray
et al. 2003) provided a basis for selecting sites along the gradient of potato
cultivation intensity. Fish were collected from the three agricultural and three
reference sites in tributaries along the St. John River, southern New Brunswick
(Canada) during April (prespawning) and September (recrudescence). Paired
forested and agricultural sites were chosen from three different tributaries of the
St John River (Figure 4-1).
Sculpin were collected by sampling run and riffle habitat (approx. 1.1-1.5
m/s) approximately 0.5 to 0.75 m deep with boulder/cobble substrates, while
brook trout were collected from deeper pools and undercut banks. All fish were
collected with dipnets (1.2 m, 6-mm mesh size) and a backpack electrofisher unit
(Smith-Root type VII). Collections targeted a minimum of 10 brook trout adult
females and 20 slimy sculpin adult females per sampling period and site.

86
Guidance for interpreting fish reponses (EEM citation here**) suggests using 20
of each species, however efforts were made to reduce this sample size for trout
because of the recreational importance of the species. Only females were
sampled for this study in an effort to reduce the impact of sampling on
prespawning fish, and because responses of interest were specific to females.
Holding time in the cooler did not exceed 4 h, based on results of previous
experiments on the effects of holding time on steroid production (Tetreault 2002).
Each adult fish was rendered unconscious by concussion, followed by spinal
severance, and measured for total length (± 0.1 cm), body weight (± 0.01 g),
gonad weight (± 0.001 g), and liver weight (± 0.001 g). Gonadosomatic index
(GSI) and hepatosomatic index (HSI) were calculated similarly using the ratio of
(organ/(body weight-organ))*100. Condition factor was calculated as
100000*(body weight/((total length)^3)) when length is reported in millimeters.
Following excision, gonadal tissues were placed in medium 199 (M199;
containing Hank’s salts without bicarbonate; GIBCO, Burlington, ON, Canada
which was supplemented with 25 mM Hepes, 4.0 mM sodium bicarbonate,
0.01% streptomycin sulfate, and 0.1% bovine serum albumin (pH 7.4)) at 4˚C
until preparation for culture; holding time for gonadal tissue never exceeded 6 h.
Small sections (18-25 mg) of the gonad tissue were placed into M199 in 20-ml
sample tubes on ice. In vitro incubation of the gonadal tissue was conducted in
24-well tissue culture plates (Falcon 3047; Fisher Scientific, Toronto, ON,
Canada). Follicles were subjected to two treatments: basal (M199 alone) or
stimulated (forskolin + M199) (Sigma F6886). Forskolin is a diterpene activator of

87
the adenylate cyclase pathway which mimics gonadotropin action. This
compound bypasses the gonadotropin receptor which increases cyclic AMP
production and subsequent gonadal steroid production (McMaster et al. 1995).
The level of forskolin-stimulated steroid production provides information
regarding the integrity and maximal capacity of the tissue to produce steroid
hormones. Follicles were incubated for 18 h at 16˚C, after which the media from
each of the wells was removed, placed in cryovials, and stored at -80˚C until the
time of analysis.
Hormones were analyzed at the National Water Research Institute
(Burlington, ON). Concentrations of testosterone (T) and 17β-estradiol (E2)
released into the media during the incubation period were quantified by RIA as
described by McMaster et al. (1992). Media was assayed in duplicate at a
volume of 200 μL for testosterone and 100 μL for 17β-estradiol and values were
converted to correct for size of sub-sample of tissue analyzed, and expressed in
pg/mg of gonadal tissue. For T and E2, inter-assay variabilities were <10% and
intra-assay variability for each steroid was approximately 5%. T and E2
antibodies were purchased from Medicorp (Prod#07-189016, #07-138016
Montreal, Que., Canada) and radiolabelled T and E2 from Amersham Pharmacia
Biotech (3H-T Prod# TRK 402; 3H-E2 Prod# TRH 322). Unlabelled T and E2 were
purchased from Sigma–Aldrich.
Estimates of condition (weight vs. length), gonad size (gonad weight vs.
body weight), and liver size (liver weight vs. body weight) were evaluated using
analysis of covariance (ANCOVA) among sites (SYSTAT v 9.0). Tukey's post hoc

88
test was used to test for differences between sites when p<0.05. Gonadal tissue
weight determined how many replicates were possible, and average values for in
vitro hormone production were obtained from three replicates when possible.
Data are shown for 8-10 fish per sample. Due to unequal variances, hormone
production data was analyzed using non parametric comparisons (NCSS 2004).
4.4 Results Only adult female fish were sampled in these studies. Efforts were made
to collect 10 mature females of each species at each site. Pre-spawning sculpin
were collected at three agricultural sites in different rivers and three forested sites
in April 2004, while pre-spawning brook trout were only accessible at four of the
six sites sampled in September 2004, perhaps due to the presence of Atlantic
salmon parr in the sites lacking brook trout. No interactions were detected for any
of the endpoints analyzed with treatment (agricultural, reference), thus all sites
were compared to all sites.
Prespawning sculpin exhibited differences in condition factor among sites
(p=0.006), with FOR1 sculpin having higher condition factor relative to AG3
(p=0.007) and FOR2 (p=0.045) (Table 4-1). Energy storage patterns, estimated
based on liver size, were different in fish at the three forested sites (p=0.001).
FOR1 fish had an elevated HSI of 3.94, higher than FOR2 fish with HSI of 2.70
(p=0.001) and FOR3 at 2.94 (p=0.002). Gonad weights were higher at the two
upstream sites, FOR1 and AG1, than in downstream sites, with GSI means of
20.5 and 16.2, respectively (p<0.001). Downstream sites show no difference in

89
energy expenditure
(
0
0.2
0.4
0.6
0.8
1
0 1 2 3 4 5 6Body Wt (g)
Gon
ad W
eigh
t (g)
AG 1
AG 2
AG 3
FOR 1
FOR 2
FOR 3
0
0.1
0.2
0.3
0 1 2 3 4 5 6Body Wt (g)
Live
r Wei
ght (
g)
AG 1
AG 2
AG 3
FOR 1
FOR 2
FOR 3
p=0.001
FOR1>AG1, FOR2, FOR3
p<0.001
FOR1>AG>all other sites
A
B
0
0.2
0.4
0.6
0.8
1
0 1 2 3 4 5 6Body Wt (g)
Gon
ad W
eigh
t (g)
AG 1
AG 2
AG 3
FOR 1
FOR 2
FOR 3
0
0.1
0.2
0.3
0 1 2 3 4 5 6Body Wt (g)
Live
r Wei
ght (
g)
AG 1
AG 2
AG 3
FOR 1
FOR 2
FOR 3
p=0.001
FOR1>AG1, FOR2, FOR3
p<0.001
FOR1>AG>all other sites
A
B
Figure 4-2). Gonadal testosterone production was different (p=0.036)
between agricultural and forested areas, however no clear patterns emerged
between sites. Gonadal estradiol production was also different between sites

90
(p=0.037), with AG2 fish producing significantly less than all sites except FOR1
(p=0.032).
There was no difference in condition factor across sites where female
brook trout were collected (p= 0.996,

91
Table 4-1). Energy storage, estimated based on liver size, was also similar
for all sites (p=0.87) sampled. Energy expenditure (GSI) showed no differences
among fish spawning in systems influenced by agriculture (p=0.58). Reproductive
readiness varied within sites, as gonad weights ranging widely (0.05 to 2.5 g) in a
single site. Also, some fish displayed large ripe eggs while others had very small
oocytes (data not shown). Gonadal testosterone production offered ranges of
195-17 470 pg/mg tissue in the two agricultural sites, and 346-16 839 pg/mg
tissue in the forested sites. Variability among fish in a given site ranged several
orders of magnitude. No differences among sites were observed (p=0.603).
Estradiol production was less variable within sites AG1, FOR1, and FOR2,
however AG3 fish expressed steroidogenic capacity ranging from 500-51 907
pg/mg tissue. There were no differences among sites with regard to estradiol
production (p=0.425) in pre-spawning brook trout.
4.5 Discussion
The main objective of this study was to examine potential mechanisms
associated with the reduced reproductive performance in fish near potato
growing areas of New Brunswick, Canada. Previous studies (Gray et al. 2005)
demonstrated that sculpin collected downstream of agricultural inputs had
reductions in gonad size, fecundity, nest size and nest density when compared to
forested reference sites. Similar to previous studies, the sculpin collected in the
Little River showed decreases in liver size and gonad size relative to the
upstream reference site (Gray and Munkittrick 2005, Gray et al. 2005).
92
In this study, impacts on sculpin were not consistent among agricultural
sites. Pre-spawning sculpin demonstrated differences in condition factor, LSI,
GSI and in vitro gonadal steroidogenesis among agricultural and forested sites.
Fish furthest upstream from FOR1 site had increased condition relative to both a
downstream forested site (FOR2) and an agricultural site AG3. This would
indicate that fish were heavier at a given length at the most upstream site, where
ice cover came off at the latest time and water temperatures were lower. Energy
storage patterns, estimated based on liver size, were also different in fish at the
three upstream forested sites, perhaps reflecting different overwintering feeding
strategies. Gonad weights, an indication of energy expenditure, were elevated at
both sites on the tributary furthest upstream, FOR1 and AG1 compared to all
other downstream sites which were all similar. Although previous studies in this
part of New Brunswick demonstrated consistent impacts on reproductive
development at a series of agricultural sites (Gray et al. 2005), more recent
studies have demonstrated that the reproductive impairments are more severe in
summers with lower rainfall (Chapter 2). However, the sculpin collections in this
study occurred in the spring, prior to chemical applications for the current year.
Hormone production by the gonadal tissue was not an endpoint that
allowed for interpretation of impacts, since no differences were detected and
variability spanned orders of magnitude. Additional studies on an unimpacted
system in southern NB indicated that during phases of the reproductive cycle
when there are critical changes in gonadal development, the variability in
steroidogenesis is high (Chapter 3). This may be an indication there is not

93
synchrony among fish, or the fish utilize differences in microhabitat to give
themselves benefits in terms of performance.
This study attempted to further investigate this observation by comparing
the reproductive functioning of spring and fall spawning species in agricultural
areas to assess the degree of potential impact of exposure to stressors on
reproductive function. The potato growing season in northwestern New
Brunswick is typically from June to October (Rees et al. 2002), it was
hypothesized that temporal change in runoff volume and composition would
affect sculpin and trout differently as they spawn in the spring (sculpin) or fall
(trout). In fall 2004, pre-spawning brook trout were collected at four of the six
desired sites where sculpin were collected earlier that same year in April, three
agricultural and three forested in three different tributaries of the St. John River.
Trout responses were highly variable and no consistent patterns were seen in
fish collected at sites near agriculture. It would appear from the fall sampling that
the fall spawning brook trout are not synchronized for spawning by the same
cues as spring spawning species. This makes comparisons among and within
sites difficult as fish are at differing stages of reproductive readiness. Within
treatment variability is higher than expected, and all forested sites are not
showing the same response pattern. In a study that was designed to identify
differences in a reproductive impairment in fish with differing reproductive
strategies, the patterns remain unclear. A study with another salmonid species
indicated environmental variables, such as rainfall and subsequent discharge,

94
affected the availability of habitat, driving the population dynamics and
recruitment (Lobon and Cervia 1999).
Spring spawning species are thought to be synchronized for spawning
with increasing water temperatures, unlike fall spawning species. This is a
potential explanation for the differing reproductive stages. Additionally, brook
trout are highly mobile and migrate for spawning. This may explain why
reproduction in females is unsynchronized, making it more difficult to interpret
responses.
There are many criticisms of current environmental monitoring practices
using a single sentinel species. The main argument is that no two species
occupy the same ecological niche, therefore, no single species should be
expected to act as an indicator for an entire ecosystem (Carignan and Villard
2002). Several species would likely exhibit differential sensitivity to environmental
perturbation and should be monitored in order to identify the causes of change
more precisely and limit errors of interpretation. Additionally, the argument is that
many factors unrelated to the degradation of ecological integrity may affect the
population status of an indicator species. This could complicate the detection and
interpretation of population trends and demonstrates the benefit of having more
than one species in use for decision making. In Canada, for pulp and paper mills
as well as metal mining, fish survey expert working groups recommend using two
species at a minimum to better determine and interpret the potential
environmental effects (Environment Canada, 2005). However, in tributaries such

95
as these in upper St. John River, where fish communities consist of less than five
species, selection of more than one species can be problematic.
In brook trout, the absence of impact may be a result of the increased
rainfall in 2003, the year previous to this prespawning sample collected in
September 2004. Salmonids are much more mobile than cottids and are not as
synchronized for spawning. Brook trout may be originating from the mainstem St.
John River, or resident within the tributary in which they were collected. This
would constitute support for not using trout as indicators, because their
responses would not reflect changes locally, but rather would be more complex
based on where the eggs were laid and where reproductive adults were resident
at the time of recrudescence. It would also be interesting to repeat these
collections in years following dryer conditions. In sculpin, the prespawning period
occurs several months following the summer rainfall and agricultural inputs, so
the exposure period occurs prior to gonadal development (Chapter 3).
This study represents further investigation of previously reported
reproductive impacts on sculpin collected near agricultural operations. Brook
trout were included to assess a larger-bodied, more mobile fall spawning
species. It was our prediction that the two species would have differential
exposure to the stressors based on their life history and their reproductive
strategies. Sculpin and trout were collected prior to their respective spawning
periods to better assess their reproductive integrity, and in fact, the species
exhibited different response patterns, with brook trout having much more
variability in responses. Future studies could address the significance of the

96
variability seen in brook trout, or rather be designed in such a way to minimize
this factor.

97
4.6 References Barrett, JC, GD Grossman, and J Rosenfeld. 1992. Turbidity-induced changes in
reactive distance of rainbow trout. Trans. Am. Fish. Soc. 121: 437-443.
Cairns, DK. (Ed.). 2002. Effects of land use practices on fish, shellfish, and their
habitats on Prince Edward Island. Can. Tech. Rep. Fish. Aquat. Sci. No. 2408.
157 pp.
Carignan, V, and MA Villard. 2002. Selecting indicator species to monitor
ecological integrity: a review. Environ. Monit. Assess. 78: 45-61.
Chambers, PA, J DuPont, KA Schaefer and AT Bielak. 2002. Effects of
agricultural activities on water quality. Canadian Council of Ministers of the
Environment, Winnipeg, Manitoba. CCME Linking Water Science to Policy
Workshop Series. Report No. 1.
Chapman, DW. 1988. Critical review of variables used to define effects of fines in
redds of large salmonids. Trans. Am. Fish. Soc. 117:1-21.
Gray, MA, RA Curry and KR Munkittrick. 2002. Non-lethal sampling methods for
assessing environmental impacts using a small-bodied sentinel fish species.
Water Quality Res J Can 37: 195-211.

98
Landis, WG and Ming-Ho Yu. 1999. An Introduction to toxicity testing. In
Introduction to Environmental Toxicology: Impacts of chemicals upon ecological
systems. CRC Press, Boca Raton, FL. pp.21-53.
Lobón-Cerviá, J, Rincón, PA. 2004. Environmental determinants of recruitment
and their influence on the population dynamics of stream-living brown trout
Salmo trutta. Oikos. 105, 641-646.
Munkittrick, KR, M McMaster, G Van Der Kraak, C Portt, W Gibbons, A Farwell
and M Gray. 2000. Development of Methods for Effects-Based Cumulative
Effects Assessment Using Fish Populations: Moose River Project. SETAC Press,
Pensacola, FL. 236 pp.
Mutch, JP, MA Savard, GRL julien, B MacLean, B Raymond, and J Doull. 2002.
Pesticide monitoring and fish kill investigations on Prince Edward Island, 1994-
1999. In D.K. Cairns (ed.). Effects of land use practices on fish, shellfish, and
their habitats on Prince Edward Island. Can. Tech. Report. Fish. Aquat. Sci. pp.
94-115.
Redding, JM, CB Schreck, and FH Everest. 1987. Physiological effects on coho
salmon and steelhead of exposure to suspended solids. Trans. Am. Fish. Soc.
116:737-744.

99
Sowden, TK and G Power. 1985. Prediction of rainbow trout embryo survival in
relation to groundwater seepage and particle size of spawning substrate. Trans.
Am. Fish. Soc. 114:804-812.
Tetreault, G.R. 2002. Monitoring the aquatic environment in the Athabasca Oil
Sands using reproductive responses in small-bodied fish. M. Sc. thesis.
University of Waterloo, Waterloo. Ontario.
Waters, TF. 1995. Sediment in streams: sources, biological effects, and control.
Am. Fish. Soc. Monogr. No. 7., Bethesda, MD.

100
Table 4-1 Length, weight, condition factor, liversomatic index (LSI) and gonadosomatic index (GSI) for slimy sculpin and brook trout collected along the St John River. Data are shown as mean ± standard error.
Site Total
Length (mm)
Body
Weight (g)
Cond.
Factor
LSI GSI
AG1 60.67±2.59 2.77±0.4 1.17±0.04 3.07±0.23 16.15±1.30
AG2 76.07±2.27 5.53±0.62 1.20±0.03 3.18±0.14 13.51±0.47
AG3 70.75±3.21 4.04±0.59 1.08±0.02 3.21±0.25 12.66±0.63
FOR1 64.31±2.58 3.51±0.41 1.24±0.03 3.94±0.22 20.53±0.79
FOR2 55.50±1.94 1.93±0.21 1.09±0.02 2.71±0.22 11.79±0.73
Slimy
Sculpin
FOR3 67.47±2.59 3.77±0.44 1.15±0.02 2.94±0.12 12.93±0.61
AG1 118.7±1.36 17.6±2.01 1.01±0.03 1.16±0.16 3.98±1.53
AG3 103±7.92 11.14±2.58 0.97±0.05 0.95±0.06 0.19±0.06
FOR1 124.3±2.85 19.9±1.68 1.02±0.04 0.97±0.14 2.12±1.60
Brook
Trout
FOR2 124.4±4.85 20.89±4.00 1.04±0.10 1.32±0.51 2.57±2.14

101
Grand FallsLittle River
St. John River
Saint John
Fredericton
NEW BRUNSWICK
St. Leonard airport
A
B
C
FOR2
FOR1
AG1
AG2
FOR3
AG3
Grand FallsLittle River
St. John River
Saint John
Fredericton
NEW BRUNSWICK
St. Leonard airport
Grand FallsLittle River
St. John River
Saint John
Fredericton
NEW BRUNSWICK
St. Leonard airport
Grand FallsLittle River
St. John River
Saint John
Fredericton
NEW BRUNSWICK
St. Leonard airport
A
B
C
FOR2
FOR1
AG1
AG2
FOR3
AG3
Figure 4-1 Map of (A) North America, (B) New Brunswick and (C) the St John River (C) Little River and sampling sites. These sites were chosen along the St John River based on studies conducted by Gray et al. (2005).

102
0
0.2
0.4
0.6
0.8
1
0 1 2 3 4 5 6Body Wt (g)
Gon
ad W
eigh
t (g)
AG 1
AG 2
AG 3
FOR 1
FOR 2
FOR 3
0
0.1
0.2
0.3
0 1 2 3 4 5 6Body Wt (g)
Live
r Wei
ght (
g)
AG 1
AG 2
AG 3
FOR 1
FOR 2
FOR 3
p=0.001
FOR1>AG1, FOR2, FOR3
p<0.001
FOR1>AG>all other sites
A
B
0
0.2
0.4
0.6
0.8
1
0 1 2 3 4 5 6Body Wt (g)
Gon
ad W
eigh
t (g)
AG 1
AG 2
AG 3
FOR 1
FOR 2
FOR 3
0
0.1
0.2
0.3
0 1 2 3 4 5 6Body Wt (g)
Live
r Wei
ght (
g)
AG 1
AG 2
AG 3
FOR 1
FOR 2
FOR 3
p=0.001
FOR1>AG1, FOR2, FOR3
p<0.001
FOR1>AG>all other sites
A
B
Figure 4-2 Relationship between gonad weight v. body weight (A) and liver weight v.
body weight (B) for slimy sculpin collected at 6 sites along the St John River.

103
AG 1AG 2
AG 3FOR 1
FOR 2FOR 3
SITE
0
5000
10000
15000
In v
itro
Tes t
oste
rone
Pr o
duct
ion
(pg /
g tis
s ue)
AG 1AG 2
AG 3FOR 1
FOR 2FOR 3
SITE
0
5000
10000
15000
20000
In v
itro
Est
radi
ol P
r odu
ctio
n (p
g/g
tissu
e)
Figure 4-3 Steroidogenic capacity of (A) testosterone and (B) estradiol by gonadal tissue excised from slimy sculpin collected in April 2004 at agricultural (AG 1-3) and forested (FOR 1-3) sites. Hormone determinations were made using RIA with the incubation media.
B
A

104

105
Figure 4-4 Relationship between gonad weight v. length (A) and liver weight v. length (B) for brook trout collected at 4 sites along the St John River.
0
0.5
1
1.5
2
2.5
3
80 90 100 110 120 130 140 150
Length (mm)
Gon
ad W
t (g)
FOR 1FOR 2AG 1AG 3
p=0.574
0
0.1
0.2
0.3
0.4
0.5
0.6
0.7
0.8
0.9
1
80 90 100 110 120 130 140 150Length (mm)
Live
r Wt (
g)
FOR 1FOR 2AG 1AG 3
p=0.872
A
B

106
AG 1 AG 3 FOR 1FOR 2SITE
0
5000
10000
15000
20000
In v
itro
test
oste
rone
pro
duct
ion
(pg/
g tis
sue)
AG 1 AG 3 FOR 1FOR 2SITE
0
5000
10000
15000
20000
In v
itro
test
oste
rone
pro
duct
ion
(pg/
g tis
sue)
AG 1 AG 3 FOR 1FOR 2SITE
0
10000
20000
30000
40000
50000
60000
70000
In v
itro
Est
radi
ol P
rodu
ctio
n (p
g/g
tissu
e)
AG 1 AG 3 FOR 1FOR 2SITE
0
10000
20000
30000
40000
50000
60000
70000
In v
itro
Est
radi
ol P
rodu
ctio
n (p
g/g
tissu
e)
Figure 4-5 Steroidogenic capacity of (A) testosterone and (B) estradiol by gonadal tissue excised from brook trout collected in September 2004 at agricultural (AG 1 & 3) and forested (FOR 1-2) sites. Hormone determinations were made using RIA with the incubation media.
A
B

107
5 Approaching population-level ecological risk assessment from an
effects driven perspective
5.1 Abstract
There have been recent attempts to modify the traditional risk assessment
process to consider multiple stressors, and a major deficiency with environmental
impact assessment has been its inability to deal with multiple discharges or
complex situations. From 1999-2004, effects-driven assessments were
conducted to investigate the performance of fish populations in potato-growing
areas of New Brunswick. These studies were conducted using a small-bodied
benthic fish species, the slimy sculpin (Cottus cognatus) as it is abundant in
these areas, exhibits site fidelity in a small home range, and lives and feeds on
the stream bottom. These populations exhibit changes in growth, fecundity and
size distributions–effects that are important in the absence of acute mortalities.
These changes have been associated with higher water temperatures and
shorter-term high rainfall events. This paper examines the data within a
framework for ecological risk assessment, focusing on the ability to conduct
population-level risk assessments. After synthesizing all available information,
high risk periods for sculpin appear to be July and August. Rainfall and
temperature patterns can be used to identify high risk areas for fish populations.
Population level risk assessment holds potential for shifting assessments to
addressing more ecological relevant responses.

108
5.2 Introduction
Ecological risk assessment is considered one of the preferred methods of
applying scientific knowledge to the decision making process. The purpose of
ecological risk assessment is to contribute to the protection and management of
the environment through scientifically credible evaluation of the ecological effects
of human activities (Suter and Barnthouse 1993). The risk assessment process
provides a way to develop, organize and present scientific information so that it is
relevant to environmental decisions. Ecological risk assessments can vary based
on the scenario and the assessor, but usually will contain discrete phases and
goals including problem formulation, analysis, and risk characterization. There
have been attempts to modify the traditional risk assessment process to consider
multiple stressors and population level endpoints (Foran and Ferenc, 1999;
Ferenc and Foran, 2000). These initiatives are meant to address major
deficiencies with environmental risk assessment and its inability to deal with
multiple discharges or complex situations.
In the mid-1990s, there was a move by multiple regulatory bodies to
modify environmental assessment approaches to address the multitude of
stressors in complex receiving environments (Ferenc and Foran 2000,
Munkittrick et al. 2000). This has involved a conceptual shift away from single
stressor analyses to consider the importance of multiple stressors and
cumulative impacts. Despite the development of conceptual models and general
frameworks by both research and regulatory communities, relatively few

109
quantitative assessments of multiple stressors have been conducted (Foran and
Ferenc 1999).
Any assessment must have defined endpoints. Because of redundancy,
feedback loops, and other compensatory mechanisms, many changes can be
documented at one level without affecting higher levels (Suter 1993), and the
significance of an endpoint should be determined by its importance to a higher
level of biological organization. For example, a physiological change may be
significant if it affects the survival, growth, or reproduction of the whole organism.
A recent workshop recognized that despite the many published calls for
assessing risks to populations, the overwhelming majority of assessments of
ecological risks are still based on an individual-level approach (Barnthouse et al.
2007). It was the consensus of these experts that data collected for population
level ecological risk assessment (PLERA) should begin to include information
related to population structure, mortality, sex ratios, distribution, and movement
(Table 5-1). These empirical data often serve as inputs for modelling efforts to
further increase the number and breadth of assessment endpoints that are
included.
From 1999-2004, researchers have been investigating fish responses in
agricultural areas of New Brunswick. Recently completed studies have compared
fish performance in 20 tributaries of the St John River (Gray and Munkittrick
2005), and have shown that reproductive performance was very low at sites
adjacent to intensive potato production. Follow-up studies described in this study
were designed to include nonlethal sampling over discreet time intervals, ruling

110
out an ecological basis for the observed changes, and comparisons of species
with differing life histories. The progression of these studies has an application
towards population-level risk assessment, and this effort will serve to summarize
those data and interpret them in the context of protecting fish at the population
level and conducting a population level risk assessment.
5.3 Background to Agricultural Studies
There are a variety of concomitant stressors associated with intensive
potato production, including increases in water runoff, sediment deposition (Gray
and Munkittrick 2005) and nutrients and pesticides, but the relative roles of the
various stressors in effecting observed changes in size, fecundity, nest size,
gonad size, liver size and fish condition (Gray et al. 2002, 2005) have not been
identified.
It has been established that there are reductions in the density of young-
of-the-year sculpin in agricultural areas of NB (Gray et al. 2002). More recent
work addressed the timing of mortality events and further investigated reductions
in fish numbers in agricultural areas. Systematic sampling of fish densities and
size structures through multiple years at sites to identify peak mortality periods
was used to identify potential stressors associated with the suspected periods of
mortality (Chapter 2). Sculpin mortality appears to be higher during summer
periods, coinciding with high water temperatures and periodic rainfall events.
Circumstantial evidence in other areas of eastern Canada indicates that storm
events may be playing a role in the year class failures and extinction events of

111
fish (Cairns 2002), but there is a demonstrated need to also assess the causative
factors associated with differences seen in growth, organ size and fecundity
(Gray et al. 2005).
Earlier studies documented impacts on reproduction and year class
strengths, and follow-up studies identified that year class strength was affected
by summer rainfall (Chapter 2). There is much higher variability in fish numbers
in the agricultural areas (Chapter 2), however we did not see the same year class
failures associated with wet years (Gray et al. 2005) and thunderstorm events
(Cairns 2002) seen previously. The persistence of sculpin populations despite
poor reproductive performance (Gray and Munkittrick, 2005) suggests that the
persistence of fish populations in agricultural areas cannot be predicted based on
individual performance attributes. Protection of the persistence of populations
will be a complex interaction of the biology of the fish, the timing of chemical
applications, and the interactions of rainfall, flow, temperature and nutrients. It
appears that sculpin populations in agricultural streams persist by having strong
year classes in years with low rainfall during the potato growing season (Chapter
2).
Given the absence of information on the interactions of the various
potential stressors and their consequent impacts on fish performance, it is
difficult to identify areas where agricultural activities put fish populations most at
risk. Although populations are by no means the only entities that can or should
be addressed in ecological risk assessments, the reproducing population is the
lowest level we can meaningfully protect (Suter and Barnthouse 1993; Figure
112
Figure 5-1), and the general rarity of assessments that focus on population
characteristics is quite remarkable. It is simply not possible to estimate the
impacts of all potential stressors on all biota at all levels of biological
organization. Instead the focus should be on the most relevant ecological
receptors for the stressor dynamics or nature of the issue. The organism is the
smallest unit that interacts directly with the environment, and individual-level
responses are currently the best described component of toxicology. For these
reasons, most risk assessment methodologies operate at the individual level.
Moreover, risk assessors continue to struggle in determining how population-
level considerations can be integrated into environmental decision-making.
5.4 Risk Assessment As usually practiced, the ecological risk assessment process focuses on
specific stressors, valued ecosystem components usually identified by key
stakeholders, potential stressor-response pathways associated with known or
previously identified impacts, and potential mitigative approaches to reduce the
risk associated with a development or activity under consideration. The US
EPA’s risk assessment guidelines were deliberately designed to be general and
applicable to the full range of assessment problems by recognizing three classes
of assessments: stressor-based, effects-directed, and values-directed (Harwell
and Gentile 2000). Although the stressor-based risk assessment approach has
helped to reduce the environmental impact of specific stressors, it is lacking
methodology to assess the additive impacts and interaction between effects

113
associated with multiple stressors over space and time (Dubé and Munkittrick
2001).
Quite often field studies involve conducting a retrospective risk
assessment, where a study is initiated because a biological effect has been
noted, and the field study is designed to find the cause. Of the several types of
ecological risk assessments, the retrospective risk assessment is often deemed
the most difficult (Suter 1993). Multiple stressor assessments tend to focus on
larger spatial scales and are concerned with effects at higher levels of
organization: subject areas for which we lack expertise in ecological risk
assessment. Risk-based assessment of multiple stressors presents a situation
with more complexity, and should not be viewed as a sequential set of steps
executed in a well-defined order. Instead, it should be viewed as an iterative
process dominated by problem complexity. Attempts to define the problem,
identify study goals, or recognize the major factors responsible for determining
system characteristics and dynamics will not necessarily be immediately
successful. Estimating effects of multiple stressors to biota is a daunting task
when one considers that stressors are disparate in nature and interact on
differing temporal and spatial scales. Effects may be direct, such as increased
mortality or decreased fecundity, or indirect, as in altered predator and prey
dynamics (Riddell et al. 2005).
A major aim of ecotoxicology is to establish causal linkages between
exposure to a toxicant, or toxicants, and resultant biological effects. In the
laboratory, where investigators study the relationships between exposure to

114
limited numbers of toxicants and alterations in limited numbers of endpoints,
such linkages can be examined exhaustively. Laboratory replication and dose-
response studies allow definitive statements concerning the nature of causal
linkages. However, when these linkages are sought in natural ecosystems, many
other factors may interfere with our ability to make definitive statements
concerning causality. These other factors include the multitude of toxicants often
present in natural systems, non-contaminant stressors (including both
anthropogenic and natural stressors), and the inherently high biological variability
of natural systems.
Limited baseline data availability hinders the ability of stressor-based
approaches to assess the state of the existing environment. An understanding of
the environmental components of the system includes existing stressors, existing
sensitivities to stressor exposure, and natural variability in the system over time
and space (Munkittrick et al. 2000). The risk assessment process also commonly
lacks a post-operational monitoring phase to verify that the mitigative attempts
have successfully eliminated or reduced the risk, or to examine whether
unanticipated interactions have resulted in unpredicted impacts. This will require
the development of a level of commitment to baseline monitoring, science-based
decision-making, and post-operational monitoring that is currently lacking in most
situations.
Non-point sources are more difficult to evaluate because discharges are
complex mixtures, the concentrations of toxicants are variable, and rates of input
and timing of discharges are difficult to predict. Sublethal impacts may already

115
exist within an aquatic system, and further addition of stress, regardless of
magnitude, could have impacts beyond those that would have been observed
through stressor-based approaches. Understanding the capability of a system to
assimilate natural and anthropogenic wastes would be much easier once the
factors limiting ecological performance for a particular system are known and
existing mechanisms of impact are understood.
For the purpose of assessing the impacts of agriculture operations to fish
populations, we chose to adapt the existing ecological risk assessment
framework to better interpret the available information at the population level, and
assess impacts.
5.5 Population-level assessment of agricultural impacts on fish
The risk assessment will rely heavily on the situation of potato farming in
northern New Brunswick, Canada, to illustrate how population-level risk
assessment may be applied to understanding the risks of anthropogenic
developments, in both a retrospective and predictive format. The traditional risk
assessment paradigm consists of specific stages of problem formulation,
analysis, and risk characterization. Recently this has been adapted for population
level endpoints and expanded to refine the interpretation of the collected
information (Figure 5-2).
5.6 Population-Level Problem Formulation

116
In the traditional risk assessment paradigm, the problem formulation stage
involves evaluating goals and selecting assessment endpoints, preparing the
conceptual model, and developing an analysis plan. The problem statement for a
traditional risk assessment usually relates to the potential risk of an exposure or
a stressor to an individual. However, a population can tolerate many individual-
level impacts before a major change occurs at the population level in terms of
recruitment, reproductive rates, mortality or abundance that threatens the
sustainability of the population. As you go up in levels of complexity to a
population from an individual, there are increases in time lag and ecological
relevance, but decreases in reversibility and ability to determine the causes of
changes (Munkittrick et al., 2000). The problem formulation statement for the
population-level risk assessment is going to be influenced by factors such as
abundance, age/stage structure, sex ratio and recruitment, whereas concerns for
individuals revolve around issues such as body burdens, exposure
concentrations, physiological alterations, and acute and chronic toxicity
responses. The population acts as an integrator of exposures, habitat factors
and ecological interactions to give an integrated assessment of the status.
For an agricultural situation, an individual-level risk assessment might
address the potential hazards and risks of a pesticide or herbicide. But at the
population level, the question focuses on whether the fish population can sustain
the cumulative stressors imposed by agriculture. Within the example of potato
farming, potential stressors have been identified and fish responses that have

117
been reported. These will be characterized in the data analysis phase. But the
next step in problem formulation is developing a conceptual model.
The first step in developing the conceptual model is to identify the species
of fish to focus the risk assessment. While the individual level risk assessment
often uses public stakeholder input to identify valued ecosystem components
(VECs), the population level assessment needs to focus on the species that has
the most potential to answer the specific questions. Species selected as VECs
by public stakeholders often do not have ideal characteristics for interpreting the
potential impacts of stressors. In the northern New Brunswick situation, there are
four species present in most tributaries in the agricultural region: brook trout
(Salvelinus fontinalis), slimy sculpin, brook stickleback (Culea inconstans) and
blacknose dace (Rhinichthys atralus). The stickleback are only found in slow
backwater areas and in beaver ponds, and are not widely distributed. The dace
are only found in the lower reaches of the rivers, where water is warmer. Of the
available species, a comparison of species life history characteristics (Table 5-2)
shows that slimy sculpin are less mobile (Gray 2003), more abundant (Curry and
Munkittrick 2005), and are more likely to be able to reflect local conditions.
The reduced proportions of YOY sculpin evident in these agricultural
areas (Gray et al., 2005), are either due to reproductive dysfunction, increased
mortality, or a combination of these factors. Systematic sampling of fish densities
and size structures through multiple years at sites to identify peak mortality
periods was used to try to identify potential stressors associated with the
suspected periods of mortality (Chapter 2). A detailed systematic study of the
118
reproductive development of slimy sculpin (Chapter 3) has ruled out a seasonal
or ecological basis for the depressions that have been previously documented at
agricultural sites.
Over three growing seasons fish densities and size structures have been
monitored non-lethally along an agricultural gradient to identify peak mortality
periods across all size classes (Chapter 2). Data indicate that the peak risk
period may occur in late summer, with chemical applications on the fields
coinciding with increased thunderstorm activity, rather than having major
mortality periods associated with overwinter losses or after-spawning mortality.
The conceptual model includes a variety of potential pathways of stressors
leading to the main responses that have been seen in slimy sculpin populations
(Figure 5-3). The analysis plan is to evaluate the population-level characteristics
of the slimy sculpin in terms of the potential risks in agricultural areas.
5.7 Population-level risk analysis
Following the problem formulation stage, risk assessors evaluate exposure to
stressors and the relationship between stressor levels and ecological effects.
Effects driven assessments focus the discussion on sustainability, acceptability,
and the consequences of additional future changes rather than just on adverse
effects. The framework outlined by Munkittrick and colleagues (2000) is designed
to be used iteratively to design hypotheses to focus follow-up studies on the
aspects of performance that are responding to the stressors within the system.

119
The studies by Gray and Munkittrick (2005) and Gray et al. (2002)
demonstrated that year class failures happened intermittently, consistent with the
periodic thunderstorm-related acute fish kills seen in other potato producing
areas (Cairns, 2002). A detailed study of 20 small streams evaluated the health
and abundance of fish populations, and concluded that temperature was a
dominant factor accounting for the distribution and abundance of sculpin
populations in northern New Brunswick (Figure 5-4) (Gray et al. 2005). Slimy
sculpin populations were absent from streams with a maximum summer water
temperature above 22°C, and were reduced in abundance in a linear fashion in
streams that had a maximum summer water temperatures above 16°C (Gray et
al., 2005). Size of young-of-the-year (YOY) was also related to temperature, with
median sizes of YOY sculpin continuing to increase to water temperatures of
22°C.
The studies conducted by Gray (2003) were conducted during relatively wet
years, while more recent (Chapter 2) studies were conducted in the same area
during relatively dry years. A significant correlation was found between year
class strength and the number of large summer rainfall events in agricultural
areas, but no such relationship was seen in forested areas (Figure 5-5). The
summer period also appears to be the period of highest mortality risk for sculpin
(Chapter 2).
Abundance and size could not be related to sediment deposition although
both sediment deposition and water temperatures were elevated in agricultural
areas (Gray et al., 2005). It is likely that both sediment deposition and pesticide

120
exposures are playing a role, but that the sampling methods employed to sample
sediments and pesticides are not reflecting the real risk to populations. The best
predictors of good sculpin population health are cool water temperatures and
lower numbers of large summer storm events. Increasing risk is associated with
warmer water temperatures and higher summer storm frequencies.
5.8 Population-level risk characterization
Assessors estimate risk through integration of exposure and stressor-response
profiles, describe risk by discussing lines of evidence and determining ecological
adversity. With the information collected as part of this research, combined with
previous and ongoing research, it was attempted to identify areas of concern for
sculpin populations. Rainfall and temperature were identified as important
stressors to sculpin populations. Maps of New Brunswick were constructed
highlighting the St. John River basin and the environmental data collected from
Environment Canada climate monitoring stations
(http://www.climate.weatheroffice.ec.gc.ca/) were overlain.
Contour maps of temperature were drawn, using the total number of
degree days over 18°C to indicate areas of the province where warmer water
temperatures would be expected. It is acknowledged that local groundwater
inputs will alter stream temperatures, but at a coarse level for population-level
risk assessment, this can be used to at least indicate the areas of high risk for
sculpin populations associated with agricultural development. Darker colors

121
indicate areas of the province with higher numbers of degree days over 18°C
(Figure 5-6). Storms exceeding 15 mm total precipitation have shown to be
negatively correlated to % YOY in areas with agricultural practice (Chapter 2),
and these data were also grouped to identify regions of the province receiving
heavy storm activity (Figure 5-7).
Each of these data: temperature, total rainfall for July and August, number
of storms exceeding 10 mm of rainfall, were plotted for the St John River basin.
The combined data identify the Grand Falls area as a concern for sculpin
populations (Figure 5-8). This reaffirms the need to study fish populations in this
farming region, particularly in years with warmer temperatures and heavier
rainfall.
5.9 Additional Uses
Although this is one such use of population-level assessment as it relates
to agricultural stressors, there are many scenarios that lend themselves to use of
this approach. One of the outcomes of this work involved mapping stressors and
overlaying data to better assess areas of risk. This technique could be used for
future monitoring of fish populations in agricultural regions, or even in a larger
context of climate change and further industrial development. There is currently a
larger effort to estimate the assimilative capacity of the St. John River
(Munkittrick et al. NCE), and this type of tool could be of use in overlaying
industrial effluent plumes, critical fish and benthic habitat areas, hydroelectric
operations and resulting flow regimes, etc., in an effort to predict impacts.

122
5.10 Conclusions
This interpretation demonstrates that empirical studies directly measure
population effects and can be used to quantify the causal relationships linking the
stressor to the observed impact. Reproductive and death rates, age structure,
spatial distributions, migration pathways and rates, and habitat utilization are
factors that can be applied in the population-level risk assessment. One of the
more critical pieces of information is the temporal dynamics of the populations
that form the risk assessment. This type of data requires multiple surveys over a
period of time representative of the fluctuations. If the population is known to
have the potential to fluctuate over large numbers very rapidly then a large
number of samples over a short time period will be necessary. The danger is in
selecting a sampling period that does not allow an accurate determination of the
extremes and potential rate of change in the numbers of individuals. Too long a
sampling period will likely underestimate the extremes and the rate of change.
Additional species can provide a more comprehensive picture of the risks
involved. Measurable attributes of individuals should be used to estimate
population parameters. They are also widely used as inputs to population
models, particularly individual-based models. While attributes of individuals can
also be used to evaluate stress to an individual, it is only when aggregated over
multiple individuals that they are useful in population risk assessment. It may be
argued that the only true measures of populations are their total numbers, but
populations and communities can exhibit a graded level of response (Munkittrick
and McCarty 1995).

123
At the population level, the first indicators of stress include changes in
individual growth rates and other performance measures, long before changes in
recruitment or abundance are noticed. For example, individual-level performance
characteristics that can integrate factors that affect key performance
measurements include growth, reproduction, and survival. They are also useful in
determining the mechanism for which the stressor exerts a population-level
impact. These attributes are directly measured on individuals of the assessment
population. Individual level assessments are still important in environmental
decision making, especially as it relates to protected species where the individual
organisms are highly valued and unnecessary deaths of any individuals are
considered a loss to society (Barnthouse et al. 2007).

124
5.11 References
Barnthouse, LW, Munns, WR Jr, Sorenson, MT. 2007. Population-Level
Ecological Risk Assessment. Taylor Francis-CRC Press. 346 p.
Brasfield SM, Tetreault G, McMaster ME, Munkittrick KR. Seasonal
characterization of energy expenditure, energy storage, and in vitro gonadal
steroidogenic capacity in slimy sculpin (Cottus cognatus). Submitted to J. Fish
Biology.
Cairns, DK. (Ed.). 2002. Effects of land use practices on fish, shellfish, and their
habitats on Prince Edward Island. Can. Tech. Rep. Fish. Aquat. Sci. No. 2408.
157 pp.
Curry, R.A. and K.R. Munkittrick. 2005. Fish community responses to multiple
stressors along the Saint John River, New Brunswick, Canada. In (J.N. Rinne,
R. Calamusso, and R. Hughes Eds.) Changes in large river fish assemblages in
the North America: Implications for management and sustainability of native
species. American Fish. Soc. Symp. 45:505-521.
Dubé, M.G. and K.Munkittrick. 2001. Integration of effect-based and stressor-
based approaches into a holistic framework for cumulative effects assessment in
aquatic ecosystems. Human Ecol Risk Assessment 7:247-258.

125
Ferenc, S.A., and Foran, J.A. (eds.), Multiple stressors in ecological risk and
impact assessment: Approach to risk estimation. SETAC Press, Pensacola, FL,
USA. 264 p.
Foran JA, Ferenc, SA, editors. 1999. Multiple stressors in ecological risk and
impact assessment. SETAC Press, Pensacola, FL. USA. 100 p.
Gray, M. A., Curry, R. A. & Munkittrick, K. R. (2002). Non-lethal sampling
methods for assessing environmental impacts using a small-bodied sentinel fish
species. Water Quality Research Journal of Canada. 37, 195-211.
Gray, M. A., (2003). Assessing non-point source pollution in agricultural regions
of the upper St. John River basin using the slimy sculpin (Cottus cognatus). PhD
thesis. University of New Brunswick, Fredericton, N.B.
Gray, M. A. & Munkittrick, K. R., (2005). An effects-based assessment of slimy
sculpin (Cottus cognatus) populations in agricultural Regions of Northwestern
New Brunswick. Water Quality Research Journal of Canada 40, 16-27.
Harwell MA and Gentile JH. 2000. Environmental decision-making for multiple
stressors: framework, tools, case studies, and prospects. In: Ferenc SA and
Foran JA (eds), Multiple Stressors in Ecological Risk and Impact Assessment:

126
Approaches to Risk Estimation. Society of Environmental Toxicology and
Chemistry, Pensacola FL.
Munkittrick, KR, McCarty, LS. 1995. An integrated approach to aquatic
ecosystem health: top-down, bottom-up or middle-out? J. Aqautic Ecosystem
Health 4: 77-90.
Munkittrick, KR, M McMaster, G Van Der Kraak, C Portt, W Gibbons, A Farwell
and M Gray. 2000. Development of Methods for Effects-Based Cumulative
Effects Assessment Using Fish Populations: Moose River Project. SETAC Press,
Pensacola, FL. 236 pp.
Riddell D, Culp JM, Baird DJ. 2005. Sublethal effects of cadmium on prey choice
and capture efficiency in juvenile brook trout (Salvelinus alpinus). Environ.
Toxicol. Chem. 24: 1751-1758.
Suter II, GW. 1993. Introduction to ecological risk assessment. In: Suter II, G.W.
(Ed.) Ecological Risk Assessment, pp. 21-47. Lewis, Boca Raton, Florida.
Suter II, GW, Barnthouse, LW. 1993. Assessment concepts. In: Suter II, G.W.
(Ed.) Ecological Risk Assessment, pp. 21-47. Lewis, Boca Raton, Florida.

127
Table 5-1 Recommended empirical and modeling attributes that should be collected or computed as part of a population level ecological risk assessment (Barnthouse et al. 2007).
Population parameters
computed from population
attributes
Attributes of populations
computed from
individual attributes
Measurable attributes
Population growth rate Abundance Density
Variance of abundance Age/stage structure Age, size, sex
Sex ratio Individual length
Population attractor (k) Recruitment Size
Fecundity
Egg size
Size or age at maturity
Number of viable offspring
Probability of extinction Survivorship Individual weight
Age/stage at death
Timing of mortality
Time to recovery / extinction Biomass Somatic growth rate
Energy storage Liver size
Condition
Density dependence Spatial distribution Movement/dispersal
Habitat preference Home range
Critical patch size Location (specific time)
Diet Stomach contents

128
Table 5-2 Available data for brook trout (Salvelinus fontinalis) and slimy sculpin (Cottus cognatus) to be used in population level ecological risk assessment. Efforts were made to utilize information collected in the St John River system with standardized sampling, where possible. Measurable attributes of
individuals
Available information for Brook
Trout (S. fontinalis)
Available information for
Slimy Sculpin (C. cognatus)
Density 100-200 /100m2
Age, size, sex Up to 5 yrs,
Individual length TL 3-12 cm
Size
Fecundity 100-400 50-300
Egg size
Size or age at maturity 2-3 1-2
Number of viable offspring
Individual weight
Age/stage at death 4-5
Timing of mortality
Somatic growth rate
Liver size
Condition
Movement/dispersal
Home range 10-10,000 m2 1-100 m2
Location (specific time) Deeper pool, embankments Swift water and riffle areas
Stomach contents Invertebrates, small fish invertebrates

129
Biosphere
Ecosystem
Community
Cellular
Tissue
Population
Organ
Individual
Molecular
Feasibility and cost of testing and monitoring
Precision and generality of the results
Suter and Barnthouse 1993
Smallest unit for measuring an integrated response
Transitory
Consumable
Expendable
Smallest ecological unit persistent on scale of decades
Lowest level that we can meaningfully protect
Figure 5-1 Comparing assessment endpoints on the individual vs. population level in the overall levels of biological organization.

130
Figure 5-2 Ecological risk assessment framework as defined by the US EPA (1998) and as modified to address population level assessment (Barnthouse et al. 2007).
Problem Formulation
Analysis
Risk Characterization
Collect site information
Identify potential stressors
Select focal species based
on life history
characteristics
Gather species specific
information
Collect stressor attribute data
•Species response •Define stressors of interest
Conduct analysis to identify key
stressors potentially affecting
populations (empirical, modeling)
Conduct risk characterization to
evaluate population-level risks
Risk management/decision process

131
Figure 5-3 Conceptual diagram of stressors associated with potato farming practices in northwestern New Brunswick as well as responses documented in previous study (1999-2002) by Gray and colleagues.
Densities
Survival
Baby Fish
Gonad size
Fecundity
Nest size and density
Liver size
Growth
Responses
Pesticides
Long term alteration flow regime
Sediment
Temperature
Nutrients
Stressors
Episodic events
Pesticides
Temperature
Nutrients
Densities
Survival
Gonad size
YOY
Nest size and density Fecundity
Liver size
Growth
Episodic events
Sediment
Long term alteration flow
Condition

132
Figure 5-4 Relationship between sculpin density (per m2) and maximum mean daily water temperature. Open triangles represent agricultural sites, filled triangles represent forested sites. Graph reprinted with permission from M. Gray.

133
y = -2.7267x + 60.032R2 = 0.2899
0
10
20
30
40
50
60
70
80
0 2 4 6 8 10 12
Number of Storms >15 mm
Perc
enta
ge Y
oung
of t
he Y
ear (
%)
Figure 5-5 Linear relationship between number of major summer storms (>15 mm total rainfall) and percent young of the year (YOY) for sites along the gradient of agricultural inputs. Data were collected over a period of 1999-2004.

134
Figure 5-6 Map of New Brunswick showing total degree days over 18°C as observed at monitoring stations for the months of July and August. Groups were assigned and lines were drawn in efforts to combine areas with similar values.

135
Figure 5-7 Map of New Brunswick showing total number of rainfall events exceeding 15 mm of total precipitation as recorded at monitoring stations during the summer months of July and August. Groups were assigned and lines were drawn in efforts to combine areas with similar values.

136
Figure 5-8 Map of New Brunswick showing overlapping temperature and precipitation data including total number of degree days over 18°C, total rainfall for the summer months of July and August, and number of storms exceeding 10 mm total precipitation.

137
6 Conclusions
Fish in agricultural areas have shown reduced proportions of YOY fish, due to
reproductive dysfunction, increased mortality, or a combination of these factors.
The main objective of the thesis was to identify the potential mechanisms
associated with the reduced reproductive performance in agricultural areas.
Previously, research showed reduced reproductive performance in the
agricultural areas of this watershed, but it remained unclear whether these
reduced larval densities in summer were a function of reproductive dysfunction in
adult sculpin or difference in apparent mortality rates in larval fish in forested and
agricultural sites along Little River.
To address these research needs, monitoring of fish populations along a
gradient of agricultural inputs was continued and expanded to allow monthly
nonlethal samples over three growing seasons (Chapter 2 “Monitoring of fish
populations along a gradient of agricultural inputs in Northwestern New
Brunswick, Canada”). This data set allowed for comparisons over time and better
assessment for periods of risk related to agriculture and corresponding sculpin
population responses. In the agricultural reach, sculpin showed increased
growth, density and increased variability relative to upstream reaches.
Consistent with previous studies, YOY sculpin downstream of agricultural inputs
were longer and heavier than those of upstream non-agricultural sites (Gray et
al., 2002; Gray and Munkittrick, 2005; Gray et al., 2005). Although new
information is presented on sculpin population changes within and between
years, more information was needed on the reproductive timing and population
138
dynamics in an unimpacted system. This would further establish if there is an
ecological basis for the effects that have been documented in agricultural areas.
Although the standardized nonlethal sampling design was improved over
previous studies to isolate periods of risk to fish populations, the data remain
difficult to interpret.
The objective of the seasonal aspect of this thesis was to assess
reference populations of slimy sculpin (Cottus cognatus) to identify the most
appropriate window to assess reproductive integrity (Chapter 3 “Seasonal
patterns of energy storage, energy expenditure, and in vitro gonadal
steroidogenic capacity in slimy sculpin (Cottus cognatus)”). The effects-driven
approach recommends ruling out a physiological or ecological basis for the
changes that have been documented in the study species (Munkittrick et al.
2000). To date, no study has addressed how spring-spawning slimy sculpin
function over the winter and the rate at which recrudescence occurs under ice
cover. The seasonal study determined that in fact it is possible to measure
physiological endpoints during reproductive development, and collections
optimized the in vitro steroid production assay for this species. This study also
ruled out a seasonal or ecological basis for the depressions that have been
previously documented at agricultural sites.
Confirmatory studies were then needed in forested and agricultural areas
with both a spring and fall spawning species, slimy sculpin and brook trout
(Salvelinus fontinalis), respectively. The potato-growing season in northwestern
New Brunswick is from June-October, and may affect sculpin and trout differently

139
as spawning times are in the spring for sculpin or in the fall for trout. Data
indicated that the peak risk period may occur in late summer, with chemical
application coinciding with increased thunderstorm activity, rather than overwinter
or after spawning mortality. This information was collected on slimy sculpin, a
benthic, spring-spawning species, but additional comparisons included brook
trout (Salvelinus fontinalis), a pelagic, fall-spawning species in agricultural areas
to determine the differential susceptibility relative to reproductive timing (Chapter
4 “ Impacts of agriculture on fish with differing reproductive strategies: comparing
slimy sculpin (Cottus cognatus) and brook trout (Salvelinus fontinalis)”). In this
study, impacts on sculpin were not consistent between agricultural sites. Pre-
spawning sculpin demonstrated differences in condition factor, LSI, GSI and in
vitro gonadal steroidogenesis among agricultural and forested sites. Trout
responses were highly variable and no consistent patterns were seen in fish
collected at sites near agriculture. It would appear from the data that fall
spawning brook trout are not synchronized for spawning by the same cues as
spring spawning species. This makes comparisons among and within sites
difficult as fish are at differing stages of reproductive readiness. Within treatment
variability is higher than expected, and all forested sites are not showing the
same response pattern. In a study that was designed to identify differences in a
reproductive impairment in fish with differing reproductive strategies,
unfortunately the patterns remain unclear.
Integrating the knowledge developed on episodic mortality, reproductive
development and reproductive performance for both species allowed for more

140
complete assessment of impacts related to agriculture. Small-bodied species of
fish are becoming more widely used in freshwater assessment programs
because of their abundance and the assumptions that they reflect local
environmental conditions because of increased site fidelity. It has become
necessary in many areas to focus on population-level assessments using these
small-bodied species, because of low species richness and/or inconsistency
among species in exposure histories. With the information collected during this
study, combined with previous and ongoing research, it was our goal to identify
areas of concern for sculpin populations (Chapter 5- “Approaching population-
level ecological risk assessment from an effects driven perspective”.) Rainfall
and temperature were identified as important stressors to sculpin populations in
Chapter 2. Maps of New Brunswick were constructed highlighting the St John
River basin and the environmental data were overlaid. Each of these data:
temperature, total rainfall for July and August, number of storms exceeding 15
mm of rainfall, were plotted for the St John River basin. The combined data
identify the Grand Falls area as a concern for sculpin populations. This reaffirms
the need to study fish populations in this farming region, particularly in years with
warmer temperatures and heavier rainfall.

7 VITA
Candidate's full name: Sandra Marie Brasfield
Universities attended (with dates and degrees obtained):
1995-1999 Middle Tennessee State University BSc Biology, cum laude 1999-2002 Oklahoma State University
MSc Zoology
Publications:
Brasfield SM, Talent LG, Janz DM. 2007. Reproductive and thyroid hormones in captive western fence lizards (Sceloporus occidentalis) following a period of brumation. Accepted by Zoo Biology. Suedel B, Steevens JA, Kennedy AJ, Brasfield SM, Ray GL. 2007. Environmental Consequences of Water Pumped from Greater New Orleans following Hurricane Katrina: Chemical, Toxicological and Infaunal Analysis. Environ. Sci. Technol. 41: 2594-2601. Brasfield SM, Bradham K, Wells JB, Talent LG, Lanno RP, Janz DM. 2004. Evaluation of fence lizard (Sceloporus spp.) eggs as a terrestrial vertebrate model for assessing bioavailability and in ovo effects of soil contaminants. Chemosphere. 54(11): 1643-1651. Brasfield SM, Weber LP, Talent LG, Janz DM. 2002. Dose response and time course relationships of vitellogenin induction in male Western fence lizards (Sceloporus occidentalis) exposed to ethinylestradiol. Environ Toxicol Chem 21(7): 1410-1416. Submitted Gray MA, Keeler RA, Curry RA, Cunjak RA, Clément M, Brasfield SM, Munkittrick KR. 2006. On the biology of the slimy sculpin – a recipe for effective environmental monitoring. Submitted to Transactions of the American Fisheries Society. Brasfield SM, Tetreault G, McMaster ME, Munkittrick KR. Seasonal characterization of energy expenditure, energy storage, and in vitro gonadal steroidogenic capacity in slimy sculpin (Cottus cognatus). Submitted to J. Fish Biology. Brasfield SM, Munkittrick, KR. Monitoring of fish populations along a gradient of agricultural inputs in northwestern New Brunswick, Canada. Submitted Environ. Mon. Assess.

Brasfield SM, Tetreault G, McMaster ME, Munkittrick KR. In prep. Comparison of spring spawning slimy sculpin (Cottus cognatus) and fall spawning brook trout (Salvelinus fontinalis) in agricultural regions of the St John River (New Brunswick, Canada).
Conference Presentations:
Suedel B, Steevens JA, Kennedy AJ, Brasfield SM, Ray GL. Effects of Hurricane Katrina-related Levee Failures on Wetland Sediment" Battelle 4th International Conference on Remediation of Contaminated Sediments in Savannah, GA. 22-23 January 2007.
Brasfield SM, Yoo, LJ, Schlenk, D, Steevens JA. Isolation of Hepatocytes from Fence Lizards for Use as a Screening Tool in Assessing the Estrogenicity of Military Relevant Compounds. Partners in Environmental Technology Technical Symposium & Workshop. 28-30 November 2006.
Suedel B, Steevens JA, Kennedy AJ, Brasfield SM, Ray GL. Environmental consequences of the failure of the New Orleans levee system during Hurricane Katrina: chemical, toxicological, and benthic community analysis. 27th Annual Meeting of SETAC North America, Montreal, PQ, Canada. 5-9 November 2007.
Brasfield SM, Gray MA, Munkittrick KR. Monitoring of fish populations along a gradient of agricultural inputs in New Brunswick, Canada using a nonlethal sampling approach. 27th Annual Meeting of SETAC North America, Montreal, PQ, Canada. 5-9 November 2007. (Invited abstract)
Brasfield SM, Yoo, LJ, Schlenk, D, Steevens JA. Isolation of Hepatocytes from Fence Lizards for Use as a Screening Tool in Assessing the Estrogenicity of Military Relevant Compounds. 27th Annual Meeting of SETAC North America, Montreal, PQ, Canada. 5-9 November 2007.
Gray, MA, Brasfield SM, Keeler R, Curry RA, Cunjak RA, Munkittrick KR. On the ecology of slimy sculpin - a recipe for effective environmental monitoring. 135th Meeting of the American Fisheries Society, Anchorage, AK. 11-15 September 2005.
Brasfield SM, Keeler RA, McMaster ME, Tetreault G, Munkittrick KR. Determining optimal windows for assessing reproductive endpoints in slimy sculpin: what Cottus has taught us. 135th Meeting of the American Fisheries Society, Anchorage, AK. 11-15 September 2005.
Brasfield SM, Keeler R, Gray MA, Munkittrick KR. 2005. Developing population-level ecological risk assessment framework for small freshwater systems using small bodied fish. 10th Annual North Atlantic Chapter of SETAC meeting. 8-10 June 2005. Burlington, VT. USA.
Brasfield, S.M., R. Keeler, M.A. Gray and K.R. Munkittrick. 2004. Investigating
limitations and challenges to developing population-level ecological risk assessments for small freshwater systems. Fourth SETAC World

Congress. 14-18 November 2004. Portland, Oregon, USA (interactive platform).
Brasfield, SM, MA Gray, and KR Munkittrick. 2004. Using small-bodied fish in
effects-based assessments: interpreting non lethal data for use in environmental monitoring studies. 31st Aquatic Toxicity Workshop. 24-27 October 2004. Charlottetown, PEI, Canada.
Brasfield, SM, KR Munkittrick GR Tetreault and ME McMaster. 2004. Use of fish
populations in effects-based assessments: seasonal characterization of reproductive endpoints. North Atlantic Chapter of SETAC. Portsmouth, RI USA.
Brasfield, SM, MA Gray, LM Hewitt, and KR Munkittrick. 2004. Use of fish
populations in an effects based assessment to evaluate non point stressors associated with agriculture. Canadian Conference for Fisheries Research. 8-10 January 2004. St. John’s, NL Canada.
Brasfield, SM, MA Gray, LM Hewitt, and KR Munkittrick. 2003. Use of fish
populations in an effects based assessment to evaluate non point stressors associated with agriculture. 24th Annual SETAC North America Meeting 9-13 November 2003, Austin, TX USA
Brasfield, SM, MA Gray, and KR Munkittrick. 2003. Use of fish populations in an
effects based assessment to evaluate non point stressors associated with agriculture. Society of Environmental Toxicology and Chemistry Asia-Pacific. 29 September-1 October, Christchurch, NZ.
Munkittrick, KR, LM Hewitt, K Teather, D MacLatchy, G Van Der Kraak, S
Brasfield, M Gray, C Jardine and K Gormley. 2003. Quantification of sediment-associated EDSs in agricultural areas, and their potential biological impacts on fish. CNTC abstract CNTC Annual Research Symposium, March 25-26, 2003, Ottawa ON.
Brasfield, SM, Curry RA, Munkittrick KR. 2003. Identification of an upstream
source of contamination on the Saint John River near Clair, NB. Canadian Conference for Fisheries Research. 2-5 January 2003. Ottawa, ON.
Brasfield SM, Weber LP, Talent LG, Janz DM. Dose response and time course
relationships of vitellogenin induction in male Western fence lizards (Sceloporus occidentalis) exposed to ethinylestradiol. 12th Annual SETAC Europe Meeting 12-16 May 2002, Vienna, Austria.
Brasfield SM, Peters LE, Galloway B, Gray MA, Munkittrick, KR. Identification of
an upstream source of contamination near Claire, NB. 2nd Annual Saint John River Meeting. 24 January 2002, Saint John, NB.

Brasfield SM, Weber LP, Talent LG, Janz DM. Is plasma alkaline-labile
phosphate a suitable alternative to measuring vitellogenin? Ozark Prairie Regional Chapter SETAC Meeting, 18-20 May 2001, Stillwater, OK.
Brasfield SM, Eggert SL, Wallace JB. Effects of litter exclusion on headwater
stream metabolism in the southern Appalachian Mountains. Tennessee Academy of Science, November 1998, Cookeville, TN.
Brasfield, S.M., M.E. McMaster, and K.R. Munkittrick. 2004. Investigating
reduced reproductive performance in fish populations in potato growing areas of New Brunswick, Canada. Fourth SETAC World Congress. 14-18 November 2004. Portland, Oregon, USA.
Brasfield, SM, KR Munkittrick, and C Portt. 2004. Examining population-level
responses in small-bodied and short-lived fishes: what Cottus has taught us. 24-27 October 2004. Charlottetown, PEI, Canada.
Gray MA, SM Brasfield, and KR Munkittrick. 2004. The application of effects-
based assessment to study non-point source pollution in agricultural regions. 2nd Annual Canadian Water Network Symposium. 20-22 June. Ottawa, ON.
Brasfield SM, KR Munkittrick, and MA Gray. 2004. Using small-bodied fish in
effects-based assessments: non-lethal assessments downstream of agricultural activity. 2nd Annual Canadian Water Network Symposium. 20-22 June. Ottawa, ON.
Gray MA, SM Brasfield, and KR Munkittrick. 2004. The application of effects-
based assessment to study non-point source pollution in agricultural regions. Society of Experimental Biology. 29 April-2 May. Edinburgh, Scotland.
Chapman, P F; Brasfield, S; Carlsen, T; Elmegaard, N; Landis, W; Moe, S;
Nacci, D; Spromberg, J; Noel, H. 2004. Empirical Approaches to Population Level Ecological Risk Assessment and its Relationship to Mathematical Modeling. SETAC Europe Meeting, 18-22 April 2004, Prague, Czech Republic.
Brasfield, SM, Gray MA, Munkittrick KR. 2004. Non lethal effects-based
assessment of fish populations to evaluate non point stressors associated with agriculture. Environmental Effects Monitoring Symposium. 16-18 February 2004. Fredericton, NB.
Brasfield, SM, McMaster. ME, Portt, C, Munkittrick, KR. 2004. Characterization
of seasonal reproductive endpoints of slimy sculpin (Cottus cognatus) for

use in environmental monitoring and assessment. 16-18 February 2004. Fredericton, NB.
Chapman, P F; Brasfield, S; Carlsen, T; Elmegaard, N; Landis, W; Moe, S;
Nacci, D; Spromberg, J; Noel, H. 2003. Empirical Approaches to Population Level Ecological Risk Assessment and its Relationship to Mathematical Modeling. 24th Annual SETAC North America Meeting 9-13 November 2003, Austin, TX.
Brasfield SM, Haralampides K, Munkittrick KR, Haines C. Quantitative
examination of sediment transport and associated pesticide transport from agricultural areas. 12th Atlantic Region Hydrotechnical Conference of the Canadian Society for Civil Engineering. October 2-4, 2002 Charlottetown, PEI.
Brasfield SM, Bradham K, Wells JB, Talent LG, Lanno RP, Janz DM. Evaluation
of fence lizard (Sceloporus spp.) eggs as a terrestrial vertebrate model for assessing bioavailability and in ovo effects of soil contaminants. 22nd Annual SETAC North America Meeting 11-15 November 2001, Baltimore, MD.
Brasfield, S.M., L.P. Weber, L.G. Talent, and D. M. Janz. "Time course and
dose response relationships of vitellogenin induction in male Western fence lizards (Sceloporus occidentalis) exposed to ethinylestradiol. 21st Annual SETAC Meeting 11-16 November 2000, Nashville, TN.
Brasfield, S.M., L.P. Weber, L.G. Talent, and D. M. Janz. "Time course and
dose response relationships of vitellogenin induction in male Western fence lizards (Sceloporus occidentalis) exposed to ethinylestradiol. Ozark-Prairie Regional SETAC, 18-20 May 2000, Leavenworth, KS.
Brasfield SM, Eggert SL, Wallace JB. Effects of litter exclusion on headwater
stream metabolism in the southern Appalachian Mountains. Undergraduate Research Symposium, April 1999, Murfreesboro, TN.