investigating simulated driving behaviour and brain ... · investigating simulated driving...
TRANSCRIPT

Investigating Simulated Driving Behaviour and Brain Activation in
Mild Cognitive Impairment
by
Megan Alexandra Hird
A thesis submitted in conformity with the requirements for the degree of Master of Science
Institute of Medical Science University of Toronto
© Copyright by Megan Alexandra Hird 2016

ii
Investigating Simulated Driving Behaviour and Brain Activation in
Mild Cognitive Impairment
Megan Alexandra Hird
Master of Science
Institute of Medical Science
University of Toronto
2016
Abstract
There are no guidelines or tools to help physicians assess the driving safety of patients with MCI.
This study combined fMRI and driving simulation to compare the driving performance, and
corresponding brain activation patterns, of patients with MCI and healthy controls. Patients with
MCI committed significantly more driving errors compared to controls. Patients with amnestic
multiple-domain MCI patients were at a greater risk of difficulty relative to those with amnestic
single-domain MCI. Patients with MCI exhibited increased recruitment of frontal brain regions
compared to controls, particularly during left turns with traffic. Patients with sd-MCI exhibited
increased recruitment of frontal and medial regions across turning conditions, whereas patients
with md-MCI exhibited decreased recruitment of frontal and medial regions. The results suggest
that patients with MCI can demonstrate driving difficulties and deviations in brain activation
compared to controls and that the areas and degree of difficulty vary across the subtypes of MCI.

iii
Acknowledgements
First, I would like to thank my supervisor and mentor, Dr. Tom Schweizer for his continued
guidance and support over the years. I am sincerely grateful for the opportunities that he has
provided me with and all that he has taught me, particularly over the course of my graduate
studies. I can say with confidence that I would not be the driven, passionate, aspiring researcher
that I am today without him. I would also like to thank the other members of my PAC, Dr. Simon
Graham and Dr. Gary Naglie for their guidance, constructive and helpful feedback, as well as
their confidence in my project and abilities throughout the duration of my Master’s degree.
Thank-you to the remainder of the Schweizer Lab for their constant moral support. The key to a
successful and productive work environment is one that is filled with hard-work, positivity, as
well as fun thrown in the mix, including the occasional lunch outing and Game of Thrones
discussion. In particular, I would like to thank Kristin Vesely and Shannon Lenehan for their
assistance with data collection throughout the study. Running a participant in the fMRI driving
simulator is always a two person job, and the completion of my project would not have been
possible without their support. Importantly, I would like to thank Dr. Nathan Churchill for his
patience and time in teaching me how to use PRONTO and interpret activation maps. Thank-you
to Fred Tam for constructing the fMRI driving equipment that I used to test my participants. I
would also like to thank Anthony Sheen and Cindy Hamid, the research MRI technologists at
SMH, as well as Dr. General Leung, MRI physicist at SMH, for their assistance in running the
MRI, acquiring the MRI data used in the current project, and confirming the MR-compatibility
of a few participants.
Finally, and most importantly, I would like to thank my entire family for their endless love and
support. In particular, I would like to thank my parents, Lindsay and Cathy, my siblings, Amanda
and James, and my cousins, Adriana and Matthew. My life has been very busy as of late and I
sincerely appreciate your constant understanding, patience, and support in my pursuit of my
career aspirations. I would not be where I am today without you. Thank you and I love you all.

iv
Contributions
Dr. Tom Schweizer (1) provided the funding for the current study, (2) oversaw the development
of the study protocol, patient and control recruitment, participant testing, data analysis, and data
interpretation of the current study, and (3) provided feedback and revisions of the thesis.
Dr. Gary Naglie and Dr. Simon Graham assisted with the development of the study protocol,
provided advice on project issues that arose, and provided important and detailed revisions of the
thesis.
Kristin Vesely was thoroughly involved in most aspects of the current project. She assisted with
the development of the driving scenarios and participant testing. She also helped develop a data
analysis plan for the behavioural driving results of the study.
Dr. Nathan Churchill trained me on how to use the PRONTO software that was used to analyze
the fMRI data. He also over saw me as I analyzed the data, helped with any issues that arose with
the analysis, and assisted with the interpretation of the results.
Dr. Corinne Fischer referred all of the patients with MCI included in the current study from the
Memory Disorders Clinic at St. Michael’s Hospital.
This work was supported by an Alzheimer’s Society Research Program Research Grant from the
Alzheimer’s Society of Canada awarded to Dr. Tom Schweizer as well as a CIHR Frederick
Banting and Charles Best Canada Graduate Scholarship—Master’s and Ontario Graduate
Scholarship (OGS) awarded to Megan Hird.

v
Table of Contents
Abstract ................................................................................................................................................. ii
Acknowledgements ............................................................................................................................. iii
Contributions ....................................................................................................................................... iv
Table of Contents ................................................................................................................................. v
List of Abbreviations ........................................................................................................................... ix
List of Tables ....................................................................................................................................... xi
List of Figures ..................................................................................................................................... xii
Chapter 1: Introduction ........................................................................................................................ 1
1.1 Background ..................................................................................................................................... 1
1.1.1 Diagnosis of MCI .................................................................................................................... 3
1.1.2 Presentation of Subtypes of MCI ........................................................................................... 6
1.1.3 Performance on IADLs in MCI and Subtypes of MCI ......................................................... 8
1.2 The Complex and Multi-Faceted Nature of Driving .................................................................... 9
1.2.1 Guidelines for Driving with MCI and AD ........................................................................... 10
1.2.2 The Primary Methods of Driving Assessment .................................................................... 12
1.2.3 Driving in the Context of MCI ............................................................................................. 16
1.2.4 Driving in the Context of AD ............................................................................................... 18
1.2. The Current AD & MCI and Driving Literature: Summary and Limitations ..................... 22
1.3 Neuroimaging Methods ............................................................................................................... 23
1.3. fMRI and Blood Oxygen Level Dependency (BOLD) Signal ............................................. 25
1.3. Strengths and Limitations of fMRI versus Other Functional Neuroimaging Modalities ... 26
1.3.3 Functional Neuroimaging and Driving ................................................................................ 28
1.4 Knowledge Gaps .......................................................................................................................... 33
Chapter 2: Specific Research Questions and Hypotheses................................................................ 34

vi
2.1 Summary and Rationale ............................................................................................................... 34
2.2 Research Objectives and Hypotheses ......................................................................................... 36
2.2.1 Investigating the Areas and Degree of Driving Impairment Characteristic of Patients with
MCI and Subtypes of MCI ............................................................................................................. 36
2.2.2 Investigating the Brain Activation Patterns Characteristic of Patients with MCI during
Routine and Cognitively Demanding Driving Tasks ................................................................... 38
Chapter 3: Driving Impairments in Patients with MCI, Including the Amnestic Single-Domain
and Multiple-Domain Subtypes of MCI ........................................................................................... 39
3.1 Experimental Materials and Methods ......................................................................................... 40
3.1.1 Statement of Ethical Approval ............................................................................................. 40
3.1.2 Participants ............................................................................................................................ 40
3.1.3 Experimental Procedures ...................................................................................................... 43
3.1.3.1 Clinical Data Collection ................................................................................................. 43
3.1.3.2 Driving Simulation ......................................................................................................... 43
3.1.3.3 Cognitive Tests and Questionnaires .............................................................................. 48
3.1.4 Data Extraction and Analysis ............................................................................................... 54
3.1.4.1 Driving Simulator Data Extraction ............................................................................... 54
3.1.4.2 Cognitive and Demographic Data Extraction ............................................................... 55
3.1.4.3 Statistical Analyses Using Statistical Package for the Social Sciences (SPSS)
Software ....................................................................................................................................... 56
3.2 Results ........................................................................................................................................... 57
3.2.2 Demographic and Cognitive Presentation ........................................................................... 57
3.2.3 Driving Simulator Performance ........................................................................................... 62
3.2.3.1 Experimental Driving Scenarios (Full Scenario 1 & Full Scenario 2) ....................... 62
3.2.3.2 Associations between Cognitive Test Scores and Driving Errors in Patients with MCI
...................................................................................................................................................... 69
vii
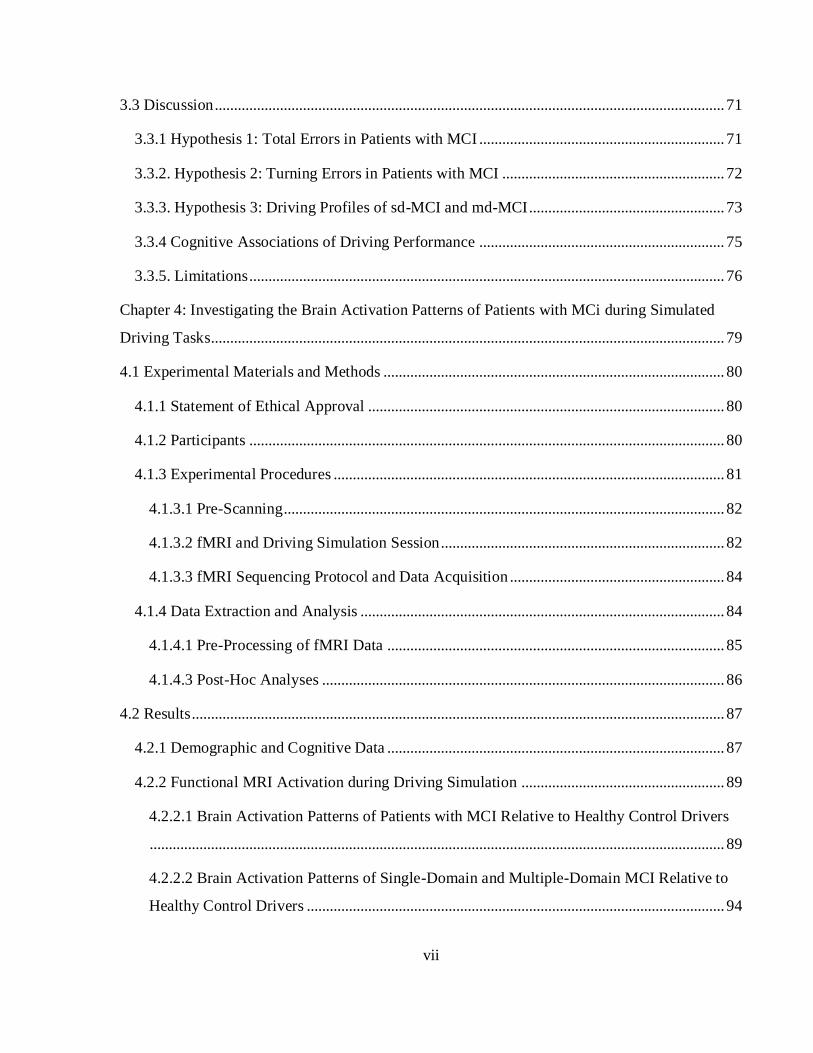
3.3 Discussion ..................................................................................................................................... 71
3.3.1 Hypothesis 1: Total Errors in Patients with MCI ................................................................ 71
3.3.2. Hypothesis 2: Turning Errors in Patients with MCI .......................................................... 72
3.3.3. Hypothesis 3: Driving Profiles of sd-MCI and md-MCI ................................................... 73
3.3.4 Cognitive Associations of Driving Performance ................................................................ 75
3.3.5. Limitations ............................................................................................................................ 76
Chapter 4: Investigating the Brain Activation Patterns of Patients with MCi during Simulated
Driving Tasks...................................................................................................................................... 79
4.1 Experimental Materials and Methods ......................................................................................... 80
4.1.1 Statement of Ethical Approval ............................................................................................. 80
4.1.2 Participants ............................................................................................................................ 80
4.1.3 Experimental Procedures ...................................................................................................... 81
4.1.3.1 Pre-Scanning ................................................................................................................... 82
4.1.3.2 fMRI and Driving Simulation Session .......................................................................... 82
4.1.3.3 fMRI Sequencing Protocol and Data Acquisition ........................................................ 84
4.1.4 Data Extraction and Analysis ............................................................................................... 84
4.1.4.1 Pre-Processing of fMRI Data ........................................................................................ 85
4.1.4.3 Post-Hoc Analyses ......................................................................................................... 86
4.2 Results ........................................................................................................................................... 87
4.2.1 Demographic and Cognitive Data ........................................................................................ 87
4.2.2 Functional MRI Activation during Driving Simulation ..................................................... 89
4.2.2.1 Brain Activation Patterns of Patients with MCI Relative to Healthy Control Drivers
...................................................................................................................................................... 89
4.2.2.2 Brain Activation Patterns of Single-Domain and Multiple-Domain MCI Relative to
Healthy Control Drivers ............................................................................................................. 94
viii
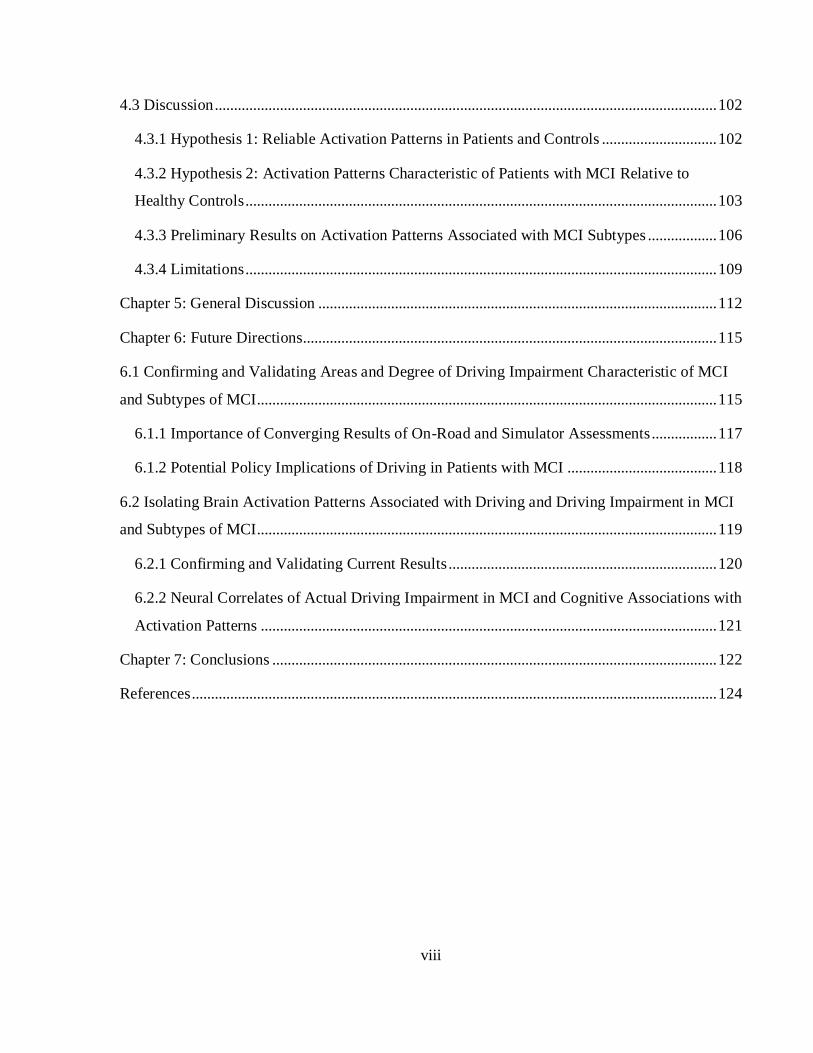
4.3 Discussion ................................................................................................................................... 102
4.3.1 Hypothesis 1: Reliable Activation Patterns in Patients and Controls .............................. 102
4.3.2 Hypothesis 2: Activation Patterns Characteristic of Patients with MCI Relative to
Healthy Controls ........................................................................................................................... 103
4.3.3 Preliminary Results on Activation Patterns Associated with MCI Subtypes .................. 106
4.3.4 Limitations ........................................................................................................................... 109
Chapter 5: General Discussion ........................................................................................................ 112
Chapter 6: Future Directions............................................................................................................ 115
6.1 Confirming and Validating Areas and Degree of Driving Impairment Characteristic of MCI
and Subtypes of MCI........................................................................................................................ 115
6.1.1 Importance of Converging Results of On-Road and Simulator Assessments ................. 117
6.1.2 Potential Policy Implications of Driving in Patients with MCI ....................................... 118
6.2 Isolating Brain Activation Patterns Associated with Driving and Driving Impairment in MCI
and Subtypes of MCI........................................................................................................................ 119
6.2.1 Confirming and Validating Current Results ...................................................................... 120
6.2.2 Neural Correlates of Actual Driving Impairment in MCI and Cognitive Associations with
Activation Patterns ....................................................................................................................... 121
Chapter 7: Conclusions .................................................................................................................... 122
References ......................................................................................................................................... 124

ix
List of Abbreviations
AAL – Automated Anatomical Labelling
AD – Alzheimer’s Disease
ADLs – Activities of Daily Living
AFNI – Analysis of Functional NeuroImaging
a-MCI – Amnestic Mild Cognitive Impairment
ANOVA – Analysis of Variance
AUC – Area Under the Receiver Operating Characteristic Curve
BOLD – Blood Oxygenation Level Dependent
BNA – Behavioural Neurology Assessment
CDR – Clinical Dementia Rating
CDT – Clock Drawing Test
CRF – Case Report Form
CRUNCH – Compensation-Related Utilization of Neural Circuits Hypothesis
CT – Computerized Tomography
DHQ – Driving Habits Questionnaire
DICOM – Digital Imaging and Communications in Medicine
HADS – Hospital Anxiety and Depression Scale
EEG – Electroencephalography
EPI – Echo-Planar Images
GLM – General Linear Model
FDG – Fluoro-D-Glucose
FDR – False Discovery Rate
fMRI – Functional Magnetic Resonance Imaging
fNIRS – Functional Near Infrared Spectroscopy
FOV – Field of View
FSL – FMRIB Software Library
FTD – Frontotemporal Dementia
IADLs – Instrumental Activities of Daily Living

x
L – Left
LBD – Lewy Body Dementia
MCI – Mild Cognitive Impairment
md-MCI – Multiple Domain Mild Cognitive Impairment
MEG –Magnetoencephalography
MNI – Montreal Neurological Institute and Hospital
MoCA – Montreal Cognitive Assessment
MR – Magnetic Resonance
MRI – Magnetic Resonance Imaging
na-MCI – Non-Amnestic Mild Cognitive Impairment
NIfTI – Neuroimaging Informatics Technology Initiative
NINCDS-ADRDA – National Institute of Neurological and Communicative Disorders and
Stroke and the Alzheimer’s Disease and Related Disorders Association
PET – Positron Emission Tomography
PRONTO – Preprocessing OptimizatioN Toolkit
R – Right
REB – Research Ethics Board
ROCF – Rey- Osterrieth Complex Figure
SD – Semantic Dementia
sd-MCI – Single Domain Mild Cognitive Impairment
SPECT – Single Photon Emission Tomography
SPSS – Statistical Analysis Using Statistical Package for the Social Sciences Software
T – Tesla
TE – Echo Timing
TMT-A – Trail Making Test Part A
TMT-B – Trail Making Test Part B
UFOV – Useful Field of View
VaD – Vascular Dementia
VCI – Vascular Cognitive Impairment

xi
List of Tables
Table 3.1: Demographic Characteristics ........................................................................................... 41
Table 3.2: Driving Habits................................................................................................................... 49
Table 3.3: MoCA Test Scores ........................................................................................................... 59
Table 3.4: Cognitive Test Scores....................................................................................................... 61
Table 3.5: Driving Simulator Errors Controls and MCI Patients .................................................... 63
Table 3.6: Driving Simulator Errors Controls and MCI Subtypes .................................................. 68
Table 3.7: Cognitive and Driving Simulator Correlation Results ................................................... 70
Table 4.1: Demographic Characteristics of fMRI Participants ....................................................... 88

xii
List of Figures
Figure 3.1: Driving Scenario Screen Shot ........................................................................................ 45
Figure 3.2: Lane Maintenance ........................................................................................................... 64
Figure 3.3: Total Driving Simulator Errors ...................................................................................... 66
Figure 3.4: Turning Errors ................................................................................................................. 67
Figure 4.1: Right Turn Activation Maps of Controls and MCI Patients......................................... 90
Figure 4.2: Left Turn Activation Maps of Controls and MCI Patients ........................................... 92
Figure 4.3: Left Turn with Traffic Activation Maps of Controls and MCI Patients ...................... 94
Figure 4.4: Right Turn Activation Maps of Controls and MCI Subtypes ...................................... 97
Figure 4.5: Left Turn Activation Maps of Controls and MCI Subtypes ......................................... 99
Figure 4.6: Left Turn with Traffic Activation Maps of Controls and MCI Subtypes .................. 101

1
Chapter 1
Introduction
1.1 Background
Cognitive impairment can manifest across a wide spectrum, ranging from typical age-related
cognitive changes, to the mild deficits associated with mild cognitive impairment (MCI), to the
more moderate to severe deficits that are characteristic of Alzheimer’s disease (AD).
Approximately 47.5 million individuals worldwide are living with AD or a related dementia, and
this number is expected to triple to 135.5 million individuals affected globally by 2050 (World
Health Organization, 2015).
MCI is often conceptualized as a clinical intermediate, or transition zone, between normal
healthy aging and dementia. The distinction between normal aging and MCI is often very subtle
and can be difficult to differentiate (Petersen, 2004). Furthermore, the progression of MCI to
very early AD (or a different form of dementia) can be difficult to identify (Petersen, 2004).
Prevalence rates of MCI vary depending on a variety of factors, including the diagnostic criteria
utilized as well as assessment procedures, the source of participants, and the normal reference
standards (Busse, Bischkopf, Riedel-Heller, & Angermeyer, 2003; Petersen, 2004; Petersen et
al., 2001; Pusswald et al., 2013; Ward, Arrighi, Michels, & Cedarbaum, 2012). A systematic
review conducted by Ward and colleagues (2012) supported this variability at a global level (35
studies on prevalence, 13 on incidence), suggesting that prevalence rates of MCI range from 3-42
percent and that overall incidence rates ranged from 21.5-71.3 percent per 1,000 people/year.
The variability in prevalence rates is largely the result of different definitions of MCI being
utilized across studies (Ward et al., 2012).
2
The cognitive presentation and disease progression of patients with MCI can be highly
heterogeneous. Specifically, patients with MCI can maintain their clinical status, improve and
revert to normal healthy aging, or progress to AD or a related dementia over time. A meta-
analysis conducted by Mitchell and Shiri-Feshki (2009) investigated the conversion rates of MCI
to dementia, AD, and vascular dementia (VaD) among studies that utilized Mayo Clinic
diagnostic criteria (i.e. criteria developed by Petersen and colleagues (1999; 2001); see section
1.1.1 for detailed criteria) and non-Mayo Clinic criteria (i.e. criteria that deviated from the
criteria developed by Petersen and colleagues). The results suggested an overall annual
conversion rate of 6.7% (95% CI = 4.6-9.1%) for progression to dementia, 6.5% (95% CI = 4.8-
8.5%) for AD, and 1.6% (95% CI = 0.8-2.7%) for VaD. Furthermore, multiple studies have
reported that patients with MCI consistently demonstrate an increased risk of progression to AD
or related dementia compared to individuals who never develop MCI (Mitchell & Shiri-Feshki,
2009; Petersen, 2004; Petersen et al., 2001; Roberts & Knopman, 2013). Compared to healthy
elderly individuals, the relative risk of progression was 15.9 (Mayo Clinic MCI criteria) and 6.2
(non-Mayo Clinic MCI criteria) for dementia and 9.5 (Mayo Clinic MCI criteria) and 4.7 for AD
(non-Mayo Clinic MCI criteria) (Mitchell & Shiri-Feshki, 2009). Furthermore, although previous
research suggests that approximately 20 percent of patients with MCI improve over time
(Roberts & Knopman, 2013), it has been suggested that these patients are at an increased risk of
reverting back to MCI or subsequently developing AD compared to individuals who never
develop MCI (Koepsell & Monsell, 2012; Lopez et al., 2012; Roberts & Knopman, 2013).
Driving is an important daily behaviour for drivers both with and without cognitive impairment.
Furthermore, driving is a highly complex activity that requires the coordination of numerous
cognitive functions, including memory, executive function, attention, and visuospatial ability.
Although some patients with MCI and AD are not capable of driving safely, some individuals are
able to maintain the ability to drive. Thus, diagnosis of MCI or AD does not definitively imply
driving impairment. Given that driving is an important source of independence, and involuntary
driving cessation is associated with numerous negative consequences, it is important to maximize
patient autonomy while ensuring patient as well as public safety. Consequently, assessing the
driving ability of individuals with cognitive impairment, including patients with MCI and AD, is
an important clinical issue.
3
1.1.1 Diagnosis of MCI
One major factor contributing to the variability in prevalence and incidence rates of MCI is the
lack of consensus on a single set of diagnostic criteria for MCI (Petersen, 2004; Stephan et al.,
2013; Ward et al., 2012). Cognitive assessments and functional measures are highly useful in the
diagnosis process; however, the final classification and diagnosis of patients relies on the
judgement of the clinician (Petersen, 2004). Although there is no universal criteria utilized to
diagnosis MCI, the criteria proposed by the National Institute on Aging-Alzheimer’s Association
(Albert et al., 2011), which are based on the criteria proposed by Petersen and colleagues (2004;
1999) as well as the National Institute of Neurological and Communicative Disorders and Stroke
and the Alzheimer’s Disease and Related Disorders Association (NINCDS-ADRDA) ((McKhann
et al., 2011), are the most widely accepted and implemented. The recommendations presented by
the National Institute on Aging-Alzheimer’s Association propose Core Clinical Criteria and
Clinical Research Criteria for the diagnosis of MCI (Albert et al., 2011). The Core Clinical
Criteria were developed for widespread application in all clinical settings without requiring
highly specialized procedures, whereas the Clinical Research Criteria utilize biomarkers in the
diagnostic criteria and are implemented only in research settings (i.e. clinical trials) (Albert et al.,
2011).
The National Institute on Aging-Alzheimer’s Association proposed four core clinical criteria for
diagnosing MCI. The Core Clinical Criteria are utilized in conjunction with clinician judgement
to diagnose MCI and differentiate MCI from normal cognition as well as dementia (Albert et al.,
2011).
i) Concern regarding a change in cognition
There is evidence of a change in cognition (i.e. a deterioration) from the patient’s previous ability
level (Albert et al., 2011; Petersen, 2004). This concern is based on information obtained from a
self-report from the patient, a reliable informant, or observation from a skilled clinician (Albert
et al., 2011).
4
ii) Impairment in one or more cognitive domains
There is evidence of impairment in one or more cognitive domains (Albert et al., 2011; Petersen,
2004). This is demonstrated by the patient performing/scoring lower on cognitive assessments
than would be expected for someone of that patient’s age and level of education (Albert et al.,
2011). Thus, objective evidence of cognitive decline is essential. Traditionally, patients with
MCI score 1 to 1.5 standard deviations below the mean scores (on validated cognitive measures)
of healthy individuals of their approximate age and education level using appropriate normative
data (Albert et al., 2011; Peters, Villeneuve, & Belleville, 2014; Petersen, 2004; Petersen et al.,
1999; Stephan et al., 2013). However, the ranges provided by normative data are guidelines
rather than definitive cut-off scores (Albert et al., 2011). Impairment can be observed in various
cognitive domains, including memory, attention, language, visuospatial ability, and executive
function. If the clinician has performed multiple cognitive assessments over time, then a decline
in performance should be observed (Albert et al., 2011).
iii) Preservation of independence in functional abilities
The patient maintains his/her functional ability to perform daily behaviours independently, with
minimal aids or assistance (Albert et al., 2011; Petersen, 2004). Patients with MCI may exhibit
minor difficulties in performing complex tasks, such as paying bills, preparing meals, shopping,
or driving. This manifests as requiring more time, demonstrating less efficiency, or committing
more errors while completing these functional tasks than was previously observed (Albert et al.,
2011). Successful assessment of this criterion requires accurate knowledge of the patient’s past
(i.e. a reliable and accurate history of the patient is essential) as well as the patient’s current level
of function.
iv) Not demented
Based on the assessment of the clinician, there is evidence that the patient does not meet
diagnostic criteria for dementia (Albert et al., 2011; Petersen, 2004). Thus, the patient’s cognitive
changes are mild and, consequently, there is no evidence of extensive impairment in social or
occupational functioning (Albert et al., 2011).
5
Despite the widespread implementation of the criteria outlined by the National Institute on
Aging- Alzheimer’s Association, there is currently no standardized procedure on how to
operationalize and implement these criteria. As a result, there is a great deal of heterogeneity in
the procedures used to diagnose MCI across studies that utilize the same criteria to guide the
diagnostic process (Stephan et al., 2013). Exacerbating this issue is the fact that it remains
unclear whether there is in fact a distinction between a diagnosis of MCI and a diagnosis of very
mild AD (Morris et al., 2001). The results of Morris and colleagues (Morris et al., 2001; Morris
& Price, 2001) support the notion that MCI represents very mild AD, as the majority of patients
with MCI demonstrated impairment in multiple cognitive domains. Furthermore, results
suggested that progression of dementia severity was dependent on the degree of initial
impairment. Specifically, 60.5% (50.2-70.8%) of patients classified as “CDR 0.5/AD” (CDR =
Clinical Dementia Rating; i.e. defined as a patients with impairment in memory (0.5 or greater)
and 3 or more cognitive domains), 35.7% (21.0-50.3%) of patients classified as “CDR
0.5/incipient AD” (i.e. defined as patients with impairment in memory and 2 or fewer other
cognitive domains), and 19.9% (8.0-31.8%) of patients classified as “CDR 0.5/uncertain
dementia” (i.e. defined as patients with impairment in only memory (0.5 level only) or those with
questionable impairment) progressed to CDR 1 or greater within 5 years. Given the high rate of
disease progression, tendency for patients classified with MCI to demonstrate some degree of
impairment in activities of daily living (ADLs, as reported by an informant), and the tendency for
patients with MCI to exhibit neuropathological characteristics of AD (Morris et al., 2001),
Morris and Price (2001) concluded that MCI often represents an early form of AD.
Future longitudinal research is required to determine (1) whether there is in fact a distinction
between AD and MCI, or whether MCI represents the earliest stage of AD or related dementia,
and (2) the optimal operationalization and implementation of the diagnostic criteria of MCI
outlined by the National Institute on Aging- Alzheimer’s Association.

6
1.1.2 Presentation of Subtypes of MCI
Traditionally, MCI was thought of as a single entity marked by memory impairment; however,
current research suggests that MCI is a highly heterogeneous disorder, which can be
characterized by impairment in various cognitive domains (Busse et al., 2003; Busse, Hensel,
Gühne, Angermeyer, & Riedel-Heller, 2006; Petersen, 2004; Petersen et al., 2001). Patients with
MCI can be classified into two broad categories—amnestic MCI (a-MCI) and non-amnestic MCI
(na-MCI). Patients with a-MCI demonstrate a significant memory impairment, whereas no
memory impairment is present in patients with na-MCI (Petersen et al., 2004). Within each of
these categories, patients can be further classified as having multiple domain MCI (md-MCI),
which is characterized by the presence of impairment in multiple cognitive domains, or single
domain (sd-MCI), which manifests as impairment in a single cognitive domain (Petersen, 2004).
i) Amnestic single domain MCI
Patients with amnestic sd-MCI present with memory impairment, and memory is the only
domain that is impaired (Petersen, 2004; Petersen et al., 2001). Cognitive function remains
preserved in all other domains (e.g. language, executive function, attention, visuospatial
function).
ii) Amnestic multiple domain MCI
Patients with amnestic md-MCI present with impairment in multiple cognitive domains (i.e.
deficits are apparent in ≥2 cognitive domains), of which one of the impaired domains is memory
(Petersen, 2004; Petersen et al., 2001).
iii) Non-amnestic single domain MCI
Patients presenting with impairment in a single domain and intact memory function are classified
with non-amnestic sd-MCI (Petersen, 2004; Petersen et al., 2001). Thus, the domain that is
impaired in patients with non-amnestic sd-MCI is any domain other than memory (e.g. language,
executive function, attention, visuospatial function).

7
iv) Non-amnestic multiple domain MCI
Patients with non-amnestic md-MCI present with impairment in multiple cognitive domains (i.e.
≥ deficits are apparent in ≥2 cognitive domains); however, memory function remains intact
(Petersen, 2004; Petersen et al., 2001).
A longitudinal study of 980 participants (≥ 75 years old) conducted by Busse and colleagues
(2006) investigated the prevalence rates of MCI subtypes using Petersen criteria (Petersen, 2004)
as well as a modified version of the criteria (i.e. a subjective memory complaint was not
required). Statistical analyses revealed that prevalence rates were lowest for non-amnestic md-
MCI and highest for non-amnestic sd-MCI (Busse et al., 2006). Specifically, using Petersen
criteria, 3.0% (1.5 SD cut-off; 95% CI = 1.9-4.1%) to 4.5% (1 SD cut-off; 95% CI = 3.2-5.8%)
of patients met criteria for amnestic sd-MCI, 0.9% (1.5 SD cut-off; 95% CI = 0.3- 1.5%) to 5.5%
(1 SD cut-off; 95% CI = 4.1-6.9%) of patients met criteria for amnestic md-MCI, 0.4% (1.5 SD
cut-off; 95% CI = 0.0-0.8%) to 2.1% (1 SD cut-off; 95% CI = 1.2-3.0%) of patients met criteria
for non-amnestic md-MCI, and 5.0% (1.5 SD cut-off; 95% CI = 3.6-6.4%) to 7.1% (1 SD cut-
off; 95% CI = 5.5-8.7%) of patients met criteria for non-amnestic sd-MCI (Busse et al., 2006).
Overall, prevalence rates were higher for sd-MCI than md-MCI (X2 = 8.0-83.8, p <0.001) (Busse
et al., 2006).
Differentiating between the various subtypes of MCI (i.e. amnestic single domain, amnestic
multiple domain, non-amnestic single domain, non-amnestic multiple domain) has important
clinical implications, as specific subtypes of MCI may be at a differential risk of progression to
AD and other related dementias (e.g. VaD, frontal temporal dementia (FTD), Lewy body
dementia (LBD)) as well as functional decline (i.e. basic activities and instrumental activities of
daily living (IADLs)). Specifically, results suggest that patients with amnestic MCI may be at a
greater risk for dementia conversion than patients with non-amnestic MCI (11.7% versus 4.1%,
X2 = 35.1, p = 0.0001; Busse et al., 2006; Mitchell & Shiri-Feshki, 2009). In addition, patients
with md-MCI may have a higher risk of conversion to dementia (23.4% versus 5.3%) and a
lower rate of reversion to normal cognitive functioning (10.9% versus 43.4%) than patients with
sd-MCI (Han et al., 2012).

8
1.1.3 Performance on IADLs in MCI and Subtypes of MCI
The original diagnostic criteria outlined by Petersen and colleagues (1999) stated that individuals
with MCI demonstrate “normal” performance on activities of daily living, including IADLs such
as driving. However, this criterion has been revised (Burton, Strauss, Bunce, Hunter, & Hultsch,
2009), stating that patients with MCI maintain functional independence, but may exhibit minor
difficulties or impairments in more complex daily behaviours (Albert et al., 2011; Petersen,
2004; Winblad et al., 2004). This modification is supported by the results of numerous studies,
which demonstrate that patients with MCI often exhibit some degree of impairment in complex
activities of daily living, primarily while performing IADLs, such as driving/transportation,
managing finances, navigating through an unfamiliar place, keeping appointments, multi-tasking,
performing a task while under pressure, global IADL indices, etc. (Aretouloi & Brandt, 2010;
Artero, Touchon, & Ritchie, 2001; Burton et al., 2009; Gold, 2012; K. R. Kim et al., 2009;
Reppermund et al., 2013; Tabert et al., 2002). This minor impairment in IADLs has been
consistently demonstrated across self-report measures (Burton et al., 2009; Tabert et al., 2002),
informant reports (Burton et al., 2009; Reppermund et al., 2013), and functional tasks (Artero et
al., 2001; Burton et al., 2009; Gold, 2012). Given that performance on a variety of IADLs has
been shown to involve numerous cognitive processes (e.g. executive function, memory, verbal
learning, reasoning, visuospatial function, etc.) (Aretouloi & Brandt, 2010; Artero et al., 2001;
Farias et al., 2010), it follows that patients with MCI may perform worse than cognitively
healthy older adults on IADLs that require these cognitive resources.
A few studies have compared the degree of functional decline among various subtypes of MCI,
and results suggest that certain subtypes of MCI may be at an increased risk of impairment while
performing complex daily behaviours (Aretouloi & Brandt, 2010; Burton et al., 2009; Gold,
2012; K. R. Kim et al., 2009; Reppermund et al., 2013; C. Tam, Lam, Chiu, & Lui, 2007). In
particular, patients with md-MCI may exhibit some degree of functional impairment compared to
individuals with sd-MCI (Aretouloi & Brandt, 2010; Burton et al., 2009; C. Tam et al., 2007).
However, results remain inconsistent as to whether patients with amnestic MCI perform
comparably better (Aretouloi & Brandt, 2010) or worse (Reppermund et al., 2013) to patients
with non-amnestic MCI on complex daily tasks. Furthermore, the results of Tam and colleagues
9
(2007) suggested that patients with amnestic MCI were able to maintain performance on IADLs
to a similar degree as cognitively normal participants.
Thus, results suggest that on a group level, patients with MCI demonstrate some degree of
functional impairment compared to cognitively intact individuals (Aretouloi & Brandt, 2010;
Artero et al., 2001; Burton et al., 2009; Gold, 2012; K. R. Kim et al., 2009; Reppermund et al.,
2013; Tabert et al., 2002) and that patients with md-MCI, particularly patients with amnestic md-
MCI (K. R. Kim et al., 2009), may be at the greatest risk for functional decline (Aretouloi &
Brandt, 2010; Burton et al., 2009; K. R. Kim et al., 2009; C. Tam et al., 2007).
1.2 The Complex and Multi-Faceted Nature of Driving
Driving is an important daily behaviour and has been identified as an important clinical issue in
numerous neurological conditions, including AD (Barrash et al., 2010; Bieliauskas, Roper,
Trobe, Green, & Lacy, 1998; Brown, Ott, et al., 2005; Brown, Stern, et al., 2005; D. J. Cox,
Quillian, Thorndike, Kovatchev, & Hanna, 1998; Davis et al., 2012; Dawson, Anderson, Uc,
Dastrup, & Rizzo, 2009; Duchek et al., 2003; Duchek, Hunt, Ball, Buckles, & Morris, 1998;
Fitten et al., 1995; Frittelli et al., 2009; Grace et al., 2005; Hunt et al., 1997; Hunt, Morris,
Edwards, & Wilson, 1993; Lafont et al., 2010; Logsdon, Teri, & Larson, 1992; Ott et al., 2000,
2003; Ott, Papandonatos, Davis, & Barco, 2012; Ott, Festa, et al., 2008; Ott, Heindel, et al.,
2008; Rizzo, McGehee, Dawson, & Anderson, 2001; Rizzo, Reinach, McGehee, & Dawson,
1997; Stein & Dubinsky, 2011; Tomioka et al., 2009; Trobe, Waller, Cook-Flannagan, Teshima,
& Bieliauskas, 1996; Uc, Rizzo, Anderson, Shi, & Dawson, 2004, 2005, 2006), MCI (Devlin,
McGillivray, Charlton, Lowndes, & Etienne, 2012; Frittelli et al., 2009; Kawano, Iwamoto,
Iidaka, & Ozaki, 2012; Wadley et al., 2009), multiple sclerosis (Akinwuntan et al., 2012, 2013;
Dehning, Kim, Nguyen, Shivapour, & Denburg, 2014; Devos, Brijs, Alders, Wets, & Feys,
2013), and stroke (Akinwuntan et al., 2006; Eby & Molnar, 2010; George & Crotty, 2010; Hird

10
et al., 2015). This is due to the fact that driving is a highly complex daily behaviour that requires
the coordination of perceptual (Coeckelbergh, Brouwer, Cornelissen, van Wolffelaar, &
Kooijman, 2002; Higgins & Wood, 2005; Walter et al., 2001), motor (Calhoun et al., 2002;
Graydon et al., 2004; Walter et al., 2001), and multiple cognitive functions (Adrian, Postal,
Moessinger, Rascle, & Charles, 2011; Calhoun et al., 2002; Graydon et al., 2004; Hargrave,
Nupp, & Erickson, 2012; Motta, Lee, & Falkmer, 2014; Schweizer et al., 2013; Walter et al.,
2001).
Given that driving requires the integration of multiple cognitive functions, including executive
function (Adrian et al., 2011; Hargrave et al., 2012; Motta et al., 2014; Walter et al., 2001),
attention (Calhoun et al., 2002; Graydon et al., 2004; Schweizer et al., 2013; Walter et al., 2001),
visuospatial ability (Calhoun et al., 2002; Graydon et al., 2004; Schweizer et al., 2013), and
memory (Walter et al., 2001), it follows that patients with MCI and AD may be at an increased
risk of driving impairment compared to cognitively intact individuals. However, a diagnosis of
MCI or AD does not definitively imply that the patient is unfit to drive, as many patients retain
the ability to drive safely. Furthermore, driving is an important source of independence for many
older adults, both with and without cognitive impairment. Involuntary driving cessation can lead
to many negative consequences, including an increased risk of depression (Marottoli et al., 1997;
Ragland, Satariano, & MacLeod, 2005; Windsor, Anstey, Butterworth, Luszcz, & Andrews,
2007), feelings of embarrassment (Chacko, Wright, Worrall, Adamson, & Cheung, 2015),
loneliness and social isolation (Chacko et al., 2015; Johnson, 1999; Liddle et al., 2013; Marottoli
et al., 2000; Windsor & Anstey, 2006), stress with loved ones (Chacko et al., 2015; Liddle et al.,
2013, 2015), and institutionalization (Freeman, Gange, Munoz, & West, 2006). Thus, when
assessing the driving fitness of a patient with MCI or AD, it is important for clinicians to achieve
a balance between patient autonomy and the safety of the patient as well as the general public.
1.2.1 Guidelines for Driving with MCI and AD
There are no published guidelines as to when patients with mild AD (or related dementia) or
MCI should be referred for a formal driving assessment or reported to the driving authorities.
11
However, those with moderate to severe AD should be reported to the driving authorities
(American Medical Association, 2010; Canadian Medical Assocation, 2012; Driver and Vehicle
Licensing Agency, 2014). As a general rule, any physician who suspects that a patient’s
cognitive impairment may impact their ability to drive safely is expected to refer that patient for
a functional driving test (Canadian Medical Assocation, 2012).
The Third Canadian Consensus on Dementia (Hogan et al., 2007) provided recommendations
regarding the fitness to drive of patients with AD or related dementia and MCI:
i) Diagnosis is not sufficient to withdraw driving privileges (Hogan et al., 2007).
ii) Moderate to severe dementia is a contraindication of safe driving (Hogan et al., 2007).
iii) Driving is contraindicated, when for cognitive reasons, individuals are not capable of
performing multiple IADLs or any basic ADLs (Hogan et al., 2007).
iv) Individuals with mild AD or related dementia should undergo comprehensive off- and
on-road testing (Hogan et al., 2007).
v) No test has acceptable sensitivity or specificity to be used as the only determinate of
driving fitness; however, abnormalities on cognitive assessments suggest that the
patient should potentially undergo comprehensive assessments (Hogan et al., 2007).
Given the lack of concrete guidelines and valid screening tools, physicians often feel burdened
with the task of determining whether a patient’s licence should be reported or not reported.
Results of current studies suggest that 57-76% of physicians (Jang et al., 2007; Leinberger, Janz,
Musch, Niziol, & Gillespie, 2013; Marshall, Demmings, Woolnough, Salim, & Man-Son-Hing,
2012; Marshall & Gilbert, 1999) worry about the negative consequences that reporting can have
on patient independence and quality of life (Hum, Cohen, Persaud, & Lee, 2014), the families of
patients (Marshall et al., 2012), and the patient-physician relationship (Hum et al., 2014; Jang et
al., 2007; Leinberger et al., 2013; Marshall et al., 2012; Marshall & Gilbert, 1999). Thus,
although most clinicians acknowledge that determining the driving fitness of their patients is an
important issue, many do not feel confident in their ability to assess fitness to drive (Jang et al.,
2007; Marshall et al., 2012). This is largely due to the ambiguous and limited guidelines
available at the national and regional levels, the variable empirical data investigating the driving
12
performance of patients with AD and MCI, as well as the absence of accurate and well-
established screening tools.
1.2.2 The Primary Methods of Driving Assessment
The three most commonly used and cited methods of driving assessment are cognitive measures,
on-road evaluations, and simulator-based assessments.
i) Cognitive measures
Cognitive assessment is a cost-effective and potentially clinically useful screening tool for
isolating which patients require a more in-depth driving assessment (Dobbs, 2013; Lincoln,
Taylor, Vella, Bouman, & Radford, 2010). Administration typically involves paper and pencil or
computer-based assessments. Given that driving requires the integration of multiple cognitive
functions and that these functions can all be impaired in patients with AD and MCI, it follows
that identifying impairment in these cognitive domains may offer utility in predicting driving
performance.
Multiple studies have investigated the ability of cognitive tests to predict driving performance
(e.g.. on-road classification, on-road and driving simulator scores, on-road and driving simulator
errors, driving status, caregiver ratings of driving ability) The results of a recent meta-analysis
(Hird, Egeto, Fischer, Naglie, & Schweizer, 2016) suggested that measures of executive
function, attention, visuospatial function, and global cognition offer some utility in predicting
driving performance (effect sizes ≥ 0.5) in patients with AD and MCI. In addition, multiple
individual cognitive tests have been shown to be predictive of driving ability in patients with AD
and MCI, such as the Trail Making Test Part A (TMT-A; Grace et al., 2005; Ott, Festa, et al.,
2008) and Part B (TMT-B; Grace et al., 2005; Ott et al., 2003; Rizzo et al., 2001, 1997; Uc et al.,
2005, 2006), maze tasks (Ott et al., 2003; Ott, Festa, et al., 2008), the Useful Field of View
(UFOV; Rizzo et al., 1997; Uc et al., 2005; Yamin, Stinchcombe, & Gagnon, 2015), and the
Rey-Osterrieth Complex Figure (ROCF; Grace et al., 2005; Rizzo et al., 2001, 1997; Uc et al.,
13
2005, 2006). However, the results of other studies suggest that these same measures are not
correlated with driving outcomes (Grace et al., 2005; Ott, Festa, et al., 2008; Rizzo et al., 2001;
Uc et al., 2006).
Variability in the results of cognitive predictors is likely the result of numerous factors, including
variable driving outcomes utilized across studies, and differing degrees as well as areas of
cognitive impairment across and within study samples. Furthermore, few studies report evidence-
based cut-off scores (Molnar, Patel, Marshall, Man-Son-Hing, & Wilson, 2006) that consistently
classify safe and unsafe drivers. Given that no single cognitive measure has been thoroughly
investigated, as well as the absence of validated cut-off scores, it is impossible to translate
cognitive results into clinical practice at an individual patient level. Consequently, there are no
valid cognitive measures with sufficient specificity or sensitivity to help healthcare professionals
determine the driving fitness of individual patients with MCI or AD.
ii) On-road evaluations
The on-road test is traditionally presumed to be the gold standard method of driving assessment
(“Driving and Parkinson’s disease,” 1990). The two main subdivisions of on-road assessment
are: (1) closed-course driving tests and (2) open-road driving tests. In a closed-course driving
evaluation, the driver is required to execute manoeuvres on a highly controlled stretch of road
(i.e. the surface of the road, the lighting condition, route to follow, and length of run are
controlled) that is closed to other traffic (Wood, Lacherez, & Tyrrell, 2014; Wood, Tyrrell, &
Carberry, 2005). An open-road driving test is more commonly used in driving research,
including within the MCI and AD populations (Brown, Ott, et al., 2005; Davis et al., 2012;
Duchek et al., 2003; Grace et al., 2005; Hunt et al., 1997, 1993; Lafont et al., 2010; Ott, Festa, et
al., 2008; Ott, Heindel, et al., 2008). Such a test involves completing various manoeuvres on-
road, with real-world traffic, following a specific and pre-determined route. Based on
performance on an on-road test, patients receive an overall rating of driving performance with
three possible classifications: pass/safe, marginal/borderline, or fail/unsafe. Other outcomes
widely reported for on-road evaluations include: score (i.e. total score and score on different
manoeuvres), rating scales for various manoeuvres (e.g. Likert scale of 1-5), and the number and
type of errors committed.

14
Similar to cognitive tests and driving simulators, on-road evaluations have both strengths and
limitations. On-road tests have been demonstrated to have high face validity (Akinwuntan et al.,
2005; Galski, Bruno, & Ehle, 1992) and high reliability (Akinwuntan et al., 2003, 2005).
However, on-road assessments lack a standardized method of administration (e.g. route being
followed, variables assessed) (Mazer, Korner-Bitensky, & Sofer, 1998) and scoring (Akinwuntan
et al., 2002; Mazer et al., 1998). Furthermore, on-road assessments are expensive (Klavora,
Heslegrave, & Young, 2000; Marshall et al., 2007). Finally, few studies have assessed their
validity, particularly within the population of MCI and AD (Davis et al., 2012; Ott et al., 2012;
Shechtman, Awadzi, Classen, Lanford, & Joo, 2010). It has been suggested that the on-road test
is unidimensional, only capturing awareness of road signs and traffic behaviour (Ott et al., 2012).
In contrast, during naturalistic driving, maintenance of proper lane position emerged as a factor
critical to safe driving (Ott et al., 2012). Furthermore, it is not possible to use on-road
assessments to assess performance during complex and potentially dangerous situations, such as
collision avoidance, high traffic conditions, and distracted driving, due to the safety concerns
inherent in these situations. Future research is required to identify the differences between on-
road and naturalistic driving assessments (Davis et al., 2012) and further validate the on-road
evaluation.
iii) Simulator-based assessments
The use of simulator technology to assess driving ability has become increasingly prevalent in
multiple neurological populations, including MCI (Devlin et al., 2012; Frittelli et al., 2009;
Kawano et al., 2012), AD (Barrash et al., 2010; D. J. Cox et al., 1998; Frittelli et al., 2009; Rizzo
et al., 2001, 1997; Shua-Haim & Gross, 1996; Stein & Dubinsky, 2011; Tomioka et al., 2009; Uc
et al., 2006), multiple sclerosis (Devos et al., 2013; Kotterba, Orth, Eren, Fangerau, & Sindern,
2003), brain tumor (Yuen et al., 2007), cerebellar damage (Y. Hung et al., 2014), and stroke
(Hird et al., 2015; Kotterba, Widdig, Brylak, & Orth, 2005; Lundqvist, Gerdle, & Ronnberg,
2000; McKay, Rapport, Coleman Bryer, & Casey, 2011). Driving simulators typically come
equipped with a fully functioning steering wheel, pedal system (i.e. including accelerator and
brake pedals), software for image generation and data collection, and visual projection (i.e. one
or more monitors).

15
There are a few limitations in using driving simulator technology, such as the risk of simulator
sickness (Classen & Brooks, 2014; Domeyer, Cassavaugh, & Backs, 2013; Lee, Cameron, &
Lee, 2003; Mullen, Weaver, Riendeau, Morrison, & Bedard, 2010). Simulator sickness is a type
of motion sickness and evokes symptoms such as nausea, oculomotor disturbance (e.g. fatigue,
headache, eyestrain, blurred vision), and disorientation (e.g. dizziness, vertigo) (Mullen et al.,
2010). Reported prevalence rates of simulator sickness vary greatly, with some studies reporting
rates of 10% (Lee et al., 2003; Mullen et al., 2010) and others reporting rates as high as 50% and
above in fully immersive simulator set-ups (Mullen et al., 2010; Ramkhalawansingh, Keshavarz,
Haycock, Shahab, & Campos, 2016; Stanney, Kingdon, & Kennedy, 2002). In addition, some
patients find the system more difficult to operate than a motor vehicle (Lew et al., 2005). Finally,
simulators may be less realistic compared to real-world driving (E. Chung & Dumont, 2009; de
Winter et al., 2009; Hallvig et al., 2013). In particular, some studies have questioned whether
driving simulation is a valid representation of on-road driving performance and have suggested
that the validity of a simulator is dependent on a variety of factors, including fidelity (Riener,
2010) as well as the quality of the learning and the data produced (de Winter et al., 2009).
Despite these potential limitations, other studies have supported the validity of driving simulation
(Bedard, Parkkari, Weaver, Riendeau, & Dahlquist, 2010; Frittelli et al., 2009; Lee et al., 2003;
Lew et al., 2005; Mayhew et al., 2011; Reimer, D’Ambrosio, Coughlin, Kafrissen, & Biederman,
2006; Shechtman, Classen, Awadzi, & Mann, 2009; Y. Wang et al., 2010; Yan, Abdel-Aty,
Radwan, Wang, & Chilakapati, 2008) in terms of being related to real-world, or naturalistic,
driving (Lew et al., 2005) as well as on-road driving performance (Bedard et al., 2010; Helland
et al., 2013; Lundqvist et al., 2000; Mayhew et al., 2011; Shechtman et al., 2009). This includes
the use of both three-screen and one-screen simulators (Bedard et al., 2010; Gibbons, Mullen,
Weaver, Reguly, & Bédard, 2014). Studies have also shown that simulation is reliable and
reproducible (Bedard et al., 2010; Classen & Brooks, 2014; Frittelli et al., 2009) as well as highly
standardized (Lundqvist et al., 2000).
The use of simulator technology has emerged as a useful and valid tool in many professional
assessment and training settings, including pilot training, the training of healthcare professionals
(e.g. surgical skills training), as well as driving assessment and rehabilitation procedures. There
16
are many critical advantages to utilizing driving simulation over on-road assessments. Driving
simulation offers a safe environment to evaluate driving fitness (Bedard et al., 2010; Classen &
Brooks, 2014). This safety benefit is particularly advantageous when assessing the driving
performance of at-risk populations, such as patients with MCI and AD. Secondly, driving
simulator technology has the ability to expose patients to complex and potentially dangerous
situations without the risk of real-world collisions (Lengenfelder, Schultheis, Al-Shihabi,
Mourant, & DeLuca, 2002; Lew et al., 2005). Furthermore, driving simulation offers a highly
controlled and standardized environment (i.e. a set degree of traffic, weather and road conditions,
data collection, etc.). Driving simulation may be best suited for isolating the subtle impairments
that are related to mild deficits in cognitive function and that may go otherwise undetected using
on-road assessments. Nevertheless, both on-road assessments and driving simulation have
advantages, and both methods of assessment should be explored further within the populations of
MCI and AD.
1.2.3 Driving in the Context of MCI
There is a limited amount of research that has investigated the driving performance of patients
with MCI (Devlin et al., 2012; Frittelli et al., 2009; Kawano et al., 2012; Wadley et al., 2009).
Consequently, the areas and degree of driving impairment among patients with MCI remains
unclear.
On-road test outcomes in MCI
Only one study has used an on-road evaluation to investigate the driving performance of
individuals with MCI (n = 46) compared to healthy age-matched control drivers (n = 59)
(Wadley et al., 2009). The results suggested that overall, patients with MCI demonstrated less
than optimal performance, assessed via a Likert scale (1 = evaluator took control of the car, 2 =
unsafe, 3 = unsatisfactory, 4 = not optimal, 5 = optimal) rather than definitive driving
impairments. Specifically, after adjusting effect sizes for age and sex, patients with MCI were
4.23 times (95% CI = 1.47, 12.15) more likely to receive a less than optimal rating on global
performance (p<0.05) and 3.69 (95% CI = 1.30, 10.46) times more likely to receive a less than
17
optimal rating on lane control (p<0.05) than cognitively normal drivers (Wadley et al., 2009).
Although patients with MCI tended to perform less optimally than healthy drivers during left
turns (OR = 1.93; 95% CI = 0.82, 4.54), results were no longer significant after controlling for
age and sex (Wadley et al., 2009).
Driving simulator results in MCI
A few studies have used driving simulator technology to investigate the driving performance of
patients with MCI (Devlin et al., 2012; Frittelli et al., 2009; Kawano et al., 2012). Mirroring the
results of on-road evaluations (Wadley et al., 2009), the results of driving simulator studies
suggest that individuals with MCI tend to exhibit more minor or subtle difficulties with driving
rather than definitive and overt driving impairments (Devlin et al., 2012; Frittelli et al., 2009;
Kawano et al., 2012). Studies have investigated a variety of driving behaviours, including
performance at intersections (i.e. braking response, foot hesitations, stopping at stop signs and
traffic lights) (Devlin et al., 2012; Frittelli et al., 2009), car following ability (Kawano et al.,
2012), and overall driving (e.g. length of run, total number of infractions, mean time to collision,
number of road edge excursions) in an urban setting (Frittelli et al., 2009). Specifically, results
suggest that patients with MCI showed no or minimal impairment (i.e. results did not reach
statistical significance, p>0.05) compared to cognitively normal drivers at braking (Devlin et al.,
2012; Kawano et al., 2012), stopping at stop signs and stop lights (Devlin et al., 2012; Frittelli et
al., 2009), and road tracking (Kawano et al., 2012). Furthermore, patients with MCI committed a
similar number of infarctions and road edge excursions (i.e. when the vehicle travels off the road,
crossing onto the shoulder) as healthy control drivers (Frittelli et al., 2009). However, patients
with MCI performed worse on a car following task (Kawano et al., 2012) and had a shorter mean
time to collision (i.e. the time to make contact with an oncoming or same-lane vehicle if the
driver kept moving at a constant velocity) compared to healthy control drivers.
Thus, current research suggests that patients with MCI tend to demonstrate no or minor
impairment across most driving outcomes, and may demonstrate more significant impairments in
other aspects of driving, such as car following (Kawano et al., 2012) and mean time to collision
(Frittelli et al., 2009). Given the tendency for patients with MCI to exhibit less than optimal
global driving performance as well as the risk for patients with MCI to transition to dementia, it

18
is important for physicians and other healthcare professionals to be aware and alert to subtle
changes in driving performance that may be (or may become) a safety concern (Wadley et al.,
2009). However, despite this general trend for patients with MCI to demonstrate minor
impairment in most driving situations, current results are based on a very small number of
studies, and consequently, a relatively small sample of patients with MCI (n <100). Furthermore,
with the exception of Kawano, Iwamoto, Iidaka, and colleagues (2012), who exclusively
evaluated patients with aMCI, current studies do not differentiate between different subtypes of
MCI (i.e. amnestic, non-amnestic, single-domain, multiple-domain). Future research is required
to validate the tendency for patients with MCI to demonstrate minor driving impairments,
identify areas of driving in which patients may be at risk for more significant impairment, and to
differentiate patterns of driving impairment across different subtypes of MCI.
1.2.4 Driving in the Context of AD
The AD and driving literature is more extensive and substantial than the MCI and driving
literature. Various studies have investigated the driving performance of patients with AD using
an on-road evaluation (Barrash et al., 2010; Bieliauskas et al., 1998; Brown, Ott, et al., 2005;
Brown, Stern, et al., 2005; Davis et al., 2012; Dawson et al., 2009; Duchek et al., 2003, 1998;
Fitten et al., 1995; Grace et al., 2005; Hunt et al., 1997, 1993; Lafont et al., 2010; Ott, Festa, et
al., 2008; Ott, Heindel, et al., 2008; Ott et al., 2012; Uc et al., 2004, 2005) as well as driving
simulation (D. J. Cox et al., 1998; Frittelli et al., 2009; Rizzo et al., 2001, 1997; Stein &
Dubinsky, 2011; Tomioka et al., 2009; Uc et al., 2006). The majority of research has investigated
the driving performance of patients with AD by differentiating between individuals with very
mild AD (CDR = 0.5) (Brown, Ott, et al., 2005; Brown, Stern, et al., 2005; Davis et al., 2012;
Duchek et al., 2003, 1998; Grace et al., 2005; Hunt et al., 1997, 1993; Ott et al., 2012; Ott, Festa,
et al., 2008; Ott, Heindel, et al., 2008; Ott et al., 2000, 2003; Stein & Dubinsky, 2011) and mild
AD (CDR = 1) (Brown, Ott, et al., 2005; Davis et al., 2012; Duchek et al., 2003, 1998; Fitten et
al., 1995; Frittelli et al., 2009; Grace et al., 2005; Hunt et al., 1997, 1993, Ott et al., 2003, 2012;
Ott, Festa, et al., 2008; Ott, Heindel, et al., 2008; Ott et al., 2000; Stein & Dubinsky, 2011; Uc et
al., 2004, 2005, 2006). Although all drivers with AD across the studies, including those
diagnosed with very mild AD, met NINCDS-ADRDA (McKhann et al., 2011) or similar criteria
19
for AD, it is important to note that a CDR score (Morris, 1993) of 0.5 is used to classify patients
with very mild AD as well as MCI. Furthermore, as previous research suggests (Morris et al.,
2001), it may be very difficult, if not impossible, for clinicians to differentiate between patients
with MCI and early AD. Thus, there is potential that some patients classified with MCI may in
fact meet diagnostic criteria for very mild AD and vice versa.
On-road test outcomes in AD
The results of on-road driving assessments in patients with AD are highly variable, with some
studies reporting a fail rate of over 25% of AD patients (Duchek et al., 2003; Hunt et al., 1997;
Lafont et al., 2010), whereas others report a patient failure rate of 10% or less (Davis et al., 2012;
Grace et al., 2005). A recent meta-analysis (Hird et al., 2016) reported that of 460 patients with
AD who were assessed using an on-road evaluation, 214 (46.5%) received a pass classification,
87 (18.9%) received a fail classification, and 159 (34.6%) received a marginal classification. In
contrast, of 364 cognitively normal drivers assessed, 289 (79.4%) received a pass classification,
6 (1.6%) received a fail classification, and 69 (19%) received a marginal classification. Thus,
although patients with AD most typically receive a pass classification, patients with AD are over
ten times more likely to receive a fail classification (18.9% vs. 1.6%) than cognitively normal
drivers.
Hird and colleagues (2016) performed a chi-square analysis of on-road performance in patients
with AD (very mild and mild AD) and healthy control drivers. A significant relationship was
revealed between on-road outcome (i.e. pass/safe, marginal/borderline, and fail/unsafe) and CDR
score (0, 0.5, 1) (X2 = 116.634, p<0.001). Compared to healthy older drivers (CDR = 0, n = 364),
drivers with very mild AD (CDR = 0.5, n = 154) were significantly more likely to receive a
marginal (19.0% vs. 29.9%, p<0.05) or fail rating (1.6% vs. 13.6%, p<0.05), and significantly
less likely to receive a pass rating (79.4% vs. 56.5%, p<0.05; Hird et al., 2016). Drivers with
mild AD (CDR = 1, n = 120) were more likely to receive a fail rating than both healthy drivers
(33.3% vs. 1.6%, p<0.05) and drivers with very mild AD (33.3% vs. 13.6%, p<0.05).
Furthermore, drivers with mild AD were less likely to receive a pass rating than both healthy
drivers (41.7% vs. 79.4%, p<0.05) and drivers with very mild AD (41.7% vs. 56.5%, p<0.05)
(Hird et al., 2016).
20
Despite the variability in results observed across studies investigating on-road outcomes, results
suggest that safety to drive appears to be associated with the degree of cognitive impairment
(Hird et al., 2016). Specifically, fail ratings significantly increase with increasing severity of
cognitive impairment (i.e. from cognitively normal drivers to drivers with very mild AD to
drivers with mild AD).
Driving simulator results in AD
Similar to the results of on-road assessments, the findings from driving simulator studies
demonstrate that some drivers with AD are able to retain their ability to drive safely (Rizzo et al.,
2001, 1997; Uc et al., 2006), driving impairment increases with the severity of AD (Stein &
Dubinsky, 2011), and results are highly variable, and often contradictory. This literature is
summarized in more detail immediately below.
Although few studies have used driving simulator technology to investigate the driving
performance of patients with AD, results confirm that driving deficits become more severe with
increasing cognitive impairment (Frittelli et al., 2009; Stein & Dubinsky, 2011). The results of
Stein and Dubinsky (2011) revealed that patients with mild AD (CDR = 1.0) performed
significantly worse than healthy controls on 75% (6/8) of the variables of interest, whereas
patients with very mild AD (CDR = 0.5) performed significantly worse than healthy controls on
50% (4/8) of the variables of interest. Furthermore, drivers with mild AD were involved in more
collisions with pedestrians than drivers with very mild AD (Stein & Dubinsky, 2011). A similar
pattern of results were obtained by Frittelli and colleagues (2009). Results showed that patients
with mild AD (CDR = 1) and patients with MCI (CDR = 0.5) had a shorter mean time to
collision than healthy controls. However, drivers with mild AD committed significantly more
road edge excursions (2.9 ± 0.8) than both healthy control drivers (0.8 ± 0.2) as well as drivers
with MCI (1.2 ± 0.4) (Frittelli et al., 2009).
Number of errors, and in particular, collision involvement (Rizzo et al., 2001, 1997; Stein &
Dubinsky, 2011; Uc et al., 2006; Yamin et al., 2015) is an outcome variable depicting lack of
safety that is often reported in driving simulator research. Results of driving simulator studies
that assessed collision rates in patients with AD are highly variable, with some studies reporting
21
that drivers with AD are involved in significantly more collisions than cognitively normal drivers
(D. J. Cox et al., 1998; Rizzo et al., 1997; Stein & Dubinsky, 2011; Yamin et al., 2015), whereas
other studies report no significant difference in collision rates (Rizzo et al., 2001; Uc et al.,
2006). Across studies, collision rates for persons with AD range from 5 to 62 percent (D. J. Cox
et al., 1998; Rizzo et al., 2001, 1997; Uc et al., 2006). This variability in collision involvement
among patients with AD compliments the results of studies of on-road evaluations, which report
fail classification rates ranging from 1.7 to 30 percent (Davis et al., 2012; Duchek et al., 2003;
Lafont et al., 2010).
Contradictory results extend beyond collision involvement (D. J. Cox et al., 1998; Rizzo et al.,
2001, 1997; Stein & Dubinsky, 2011; Uc et al., 2006) across studies investigating other driving
variables in patients with AD. In particular, variables involved in vehicle control are often
subdivided into two classes: (1) steering control (e.g. number of centre line crossings, number of
road edge excursions, standard deviation of lane position, standard deviation in steering, etc.) and
(2) speed control (e.g. time/distance over the speed limit, standard deviation in velocity, average
speed etc.). In terms of steering control, some studies reported that patients with AD commit
significantly more road edge excursions or centre line crossing (i.e. shoulder crossings, off-road
events) (D. J. Cox et al., 1998; Frittelli et al., 2009; Yamin et al., 2015) and demonstrate
significantly greater standard deviation or variability in steering (Uc et al., 2006) as well as lane
position (Stein & Dubinsky, 2011 for CDR = 1; Yamin et al., 2015) than healthy controls. In
contrast, other studies reported that drivers with AD perform similarly to cognitively normal
drivers, or demonstrate only minor impairments, on the same variables, including number of road
edge excursions (Rizzo et al., 2001; Yamin et al., 2015), number of centreline crossings (D. J.
Cox et al., 1998; Rizzo et al., 2001), lateral and longitudinal vehicle control (Rizzo et al., 2001),
and standard deviation/variability in lane position (Stein & Dubinsky, 2011 for CDR = 0.5) as
well as steering (D. J. Cox et al., 1998). Similarly, some studies report that patients with AD are
impaired on a number of variables related to speed control, including average speed (i.e. an
increased tendency to drive slower than healthy controls) (D. J. Cox et al., 1998; Frittelli et al.,
2009), standard deviation or variability in speed (Stein & Dubinsky, 2011 for CDR = 1; Uc et al.,
2006), and increased number of speed exceedances (Yamin et al., 2015); however, other studies
22
report that drivers with AD are not impaired on these same variables (Cox et al., 1998; Rizzo et
al., 2001; Stein & Dubinsky, 2011 for CDR = 0.5).
Specific driving impairments have been identified in individuals with AD, including driving
slower (D. J. Cox et al., 1998; Frittelli et al., 2009; Stein & Dubinsky, 2011) applying less brake
force when attempting to stop (D. J. Cox et al., 1998) and during collision avoidance (Tomioka
et al., 2009), taking longer to complete left-hand turns (D. J. Cox et al., 1998), making judgement
errors at traffic lights (Stein & Dubinsky, 2011), unsafe outcomes in rear-end collision avoidance
(Uc et al., 2006), shorter mean time to collision (Frittelli et al., 2009), greater risk of collisions
(Rizzo et al., 1997; Stein & Dubinsky, 2011), and driving more poorly in general (D. J. Cox et
al., 1998; Frittelli et al., 2009). However, other studies report a no significant difference between
drivers with AD and healthy controls in terms of vehicle control (Rizzo et al., 2001), centreline
crossings (D. J. Cox et al., 1998; Rizzo et al., 2001), and collision involvement (Rizzo et al.,
2001; Uc et al., 2006).
1.2.5 The Current AD & MCI and Driving Literature: Summary and
Limitations
Across both on-road and driving simulator studies, results consistently suggest that an increased
severity of cognitive impairment (i.e. MCI vs. AD; very mild AD vs. mild AD) is associated with
greater driving impairment (Brown, Ott, et al., 2005; Duchek et al., 2003; Frittelli et al., 2009;
Hird et al., 2016; Hunt et al., 1997; Ott, Heindel, et al., 2008; Stein & Dubinsky, 2011). This
pattern has been observed across numerous variables, including road test fail rates (Brown, Ott,
et al., 2005; Duchek et al., 2003; Hird et al., 2016; Hunt et al., 1997; Ott, Festa, et al., 2008) as
well as simulator collision risk and involvement (Frittelli et al., 2009; Stein & Dubinsky, 2011).
Despite this trend, results remain highly variable in terms of the areas and degree of driving
impairment that are characteristic of patients with MCI and AD. Numerous factors likely
contribute to these variable and often contradictory results, including procedural inconsistencies
across studies (e.g. road test routes and simulator scenarios, the driving situation/task of interest,

23
road test scoring, test/scenario level of difficulty, level of traffic, operationalization of variables,
etc.), the lack of standardization of MCI and AD diagnosis across studies, as well as the
heterogeneous cognitive presentation of AD and MCI. As a result of these inconsistent findings,
there are no tools or concrete guidelines to assist physicians in assessing the driving fitness of
patients (Hird et al., 2016).
Given the variability in results in the current literature, there is limited knowledge about the areas
and degree of driving impairment that are characteristic of cognitively normal drivers as well as
cognitively impaired drivers (i.e. both individuals with AD and MCI, including subtypes of
MCI). Structural and functional brain changes have been well-established in patients with MCI
and AD (Bakker, Albert, Krauss, Speck, & Gallagher, 2015; Lam, Masellis, Freedman, Stuss, &
Black, 2013; Peters et al., 2014; Sperling et al., 2010). These brain changes ultimately give rise
to the cognitive deficits that are characteristic of these populations. Given this, coupled with the
fact that driving is a highly complex and cognitively demanding task that requires the integration
of multiple brain regions (Schweizer et al., 2013), it follows that the driving impairments of
patients with MCI may be linked to the underlying brain changes associated with the disease.
Thus, understanding the brain regions associated with different aspects of driving in patients with
MCI, compared with healthy controls, would provide important information regarding the
cognitive processes involved in various aspects of driving.
1.3 Neuroimaging Methods
Neuroimaging involves a variety of techniques that are used to image the structure and function
of the nervous system. Structural neuroimaging is used to visualize physical changes in the brain,
including atrophy, microangiopathic changes and small vessel disease, ventricular enlargement,
and diffusivity (Joko et al., 2016; Kilimann et al., 2016; Krumm et al., 2015; Wirth et al., 2016).
In contrast, functional neuroimaging methods measure parameters or aspects of brain function,

24
including cerebral perfusion and glucose metabolism (Cai et al., 2016; Foster et al., 2016; Hays,
Zlatar, & Wierenga, 2016; Y. Li et al., 2016; Wirth et al., 2016; L. Xu et al., 2016). Functional
neuroimaging can also be used to capture brain function at rest or in response to various stimuli
to investigate the relationship between brain activity and cognitive function.
Structural and functional techniques have been widely used for both clinical and research
purposes in patients with MCI, AD, and related dementias (Cai et al., 2016; Foster et al., 2016;
Hays et al., 2016; Joko et al., 2016; Kilimann et al., 2016; Krumm et al., 2015; Y. Li et al., 2016;
Wirth et al., 2016; L. Xu et al., 2016). Structural imaging techniques, including computerized
tomography (CT) and magnetic resonance imaging (MRI), are used to investigate several
biomarkers commonly associated with MCI and AD. When possible, MRI is preferred over CT
due to its ability to image a variety of brain tissue properties, increased precision, and absence of
radiation. There are multiple structural biomarkers of interest in the MCI and AD populations,
including hippocampal atrophy, cortical thickness, cerebral atrophy, and microangiopathic
changes (i.e. white matter hyperintensitives). Functional biomarkers have also been identified
using positron emission tomography (PET) and single photon emission tomography (SPECT),
including decreased perfusion in the temporal, parietal, and frontal regions (Frings et al., 2015;
Herholz, 2011; Moretti, 2015). Furthermore, PET techniques can be used to measure beta
amyloid and tau protein levels in patients with AD, patients with MCI, and cognitively normal
individuals (Barthel, Seibyl, & Sabri, 2015; Bauckneht, Picco, Nobili, & Morbelli, 2015; Landau
et al., 2014; Nordberg, 2004; Tateno et al., 2015).
Both structural and functional techniques are used clinically to confirm diagnoses and to identify
the severity of disease progression. Structural and functional imaging techniques are also used
for research purposes to identify the clinical and cognitive (i.e. including task-based) correlates
of imaging findings, identify how imaging findings change with disease progression, and to
identify novel biomarkers in patients with MCI, AD, and those at risk for developing cognitive
impairment.
25
1.3.1 fMRI and Blood Oxygen Level Dependency (BOLD) Signal
Functional MRI (fMRI) is a common functional neuroimaging technique that identifies
alterations in neural metabolism through the imaging of certain signal changes in brain tissue
(Chen & Glover, 2015). These changes in neural metabolism can occur at rest, without any
mental operation (i.e. resting state fMRI), or in response to performance of a task that requires
certain cognitive or mental operations (i.e. task-based fMRI) (Chen & Glover, 2015). Both
resting state (Bai et al., 2008; Jin, Pelak, & Cordes, 2012; Z. Wang et al., 2011; Zhou, Yu, &
Duong, 2015) and task-based fMRI (Bakker et al., 2015; H.-J. Li et al., 2015) have been
increasingly utilized in research investigating cognitive changes in patients with MCI and AD.
Functional MRI uses blood oxygenation level dependent (BOLD) changes in brain tissue. When
performing a task or at rest, changes in metabolic activity (i.e. both up and down regulation) in
specific brain regions cause fluctuations in oxygen consumption in those same brain regions. The
BOLD signal measures these fluctuations in oxygen consumption (Chen & Glover, 2015; Ogawa
et al., 1992 as cited in Chen & Glover, 2015). Specifically, when there is an increase in neural
activity, there is a corresponding increase in the delivery of oxygenated hemoglobin to these
regions (Chen & Glover, 2015). At this point, the supply of oxygen is greater than the demand
for oxygen, causing an increase in the regional oxygenation for several seconds (Chen & Glover,
2015). Physiologically, the precise BOLD signal level is the result of simultaneous and complex
changes in oxygenation, blood flow, as well as blood volume (Chen & Glover, 2015; Crosson et
al., 2010). Given that oxygenated hemoglobin is diamagnetic, whereas deoxygenated
hemoglobin is paramagnetic, the BOLD signal utilizes differences in these magnetic properties to
detect changes in neuronal activity.
Typically, fMRI is performed on clinical systems that are available either at the magnetic field
strength of 1.5 Tesla (T) or 3.0 T MRI. Acquisition of fMRI data is preferable at 3.0 T (i.e. as
used in the present study) as the higher magnetic field produces greater BOLD signal and enables
higher spatial resolution.

26
1.3.2 Strengths and Limitations of fMRI versus Other Functional
Neuroimaging Modalities
Several neuroimaging modalities have been used to identify the brain regions associated with
various cognitive tasks and processes, such as fMRI, electroencephalography (EEG),
magnetoencephalography (MEG), and functional near infrared spectroscopy (fNIRS) (Gherri &
Forster, 2015; Hiroyasu & Fukushima, 2012; Karimpoor et al., 2015; Monden et al., 2015;
Morrison et al., 2016; Tschentscher & Hauk, 2016; Vlahou, Thurm, Kolassa, & Schlee, 2014).
Multiple factors are considered when evaluating the utility of functional neuroimaging
modalities, including spatial resolution, temporal resolution, susceptibility to motion and noise,
expense, harmfulness to patients or participants (e.g. presence of radiation), feasibility of
conducting a given experiment. Each modality has strengths as well as limitations.
Functional MRI has several advantages and strengths over other functional neuroimaging
modalities. One major advantage of fMRI over some techniques that requires the injection of a
radioactive agent, such as PET and SPECT, is that it is a non-invasive procedure (Crosson et al.,
2010). Another important advantage of fMRI over all other techniques, is its superior spatial
resolution for localizing brain activity in space (Crosson et al., 2010; Lev & Grant, 2000). Spatial
resolution refers to the accuracy in which brain activity can be localized in space (Crosson et al.,
2010). In fMRI, spatial resolution is based on the voxel size of image acquisition. Spatial
resolution using fMRI is usually 2 mm cubed voxels (i.e. using a 1.5 T or 3.0 T MRI). In
addition to superior spatial resolution, fMRI has an advantage in that an MRI system can be used
to acquire both structural and functional images. As a result, functional images can be overlaid
onto structural images (Crosson et al., 2010). Thus, fMRI is capable of acquiring precise
anatomical localization (Crosson et al., 2010).
Furthermore, fMRI is superior to other techniques, such as fNIRS, EEG, and MEG, in its
imaging depth. In these other imaging techniques, only surface-level cortical structures (e.g.
frontal lobes, parietal lobes, etc.) can be imaged and activity in deeper regions, including
subcortical regions, such as the hippocampus, the thalamus, and the amygdala as well as the
27
cerebellum cannot be easily measured. Many of these deep brain structures are important for
various cognitive functions, including memory, movement and coordination, and emotional
processing as required in functional tasks, such as driving (section 1.3.3). In contrast to these
other techniques, fMRI is able to image deep brain structures in addition to surface-level cortical
brain regions.
There are a few disadvantages and potential limitations associated with fMRI. Although fMRI
has a greater temporal resolution over PET (i.e. resolution of tens of seconds versus seconds),
other techniques such as EEG and MEG have a superior temporal resolution (i.e. resolution of
milliseconds) to that of fMRI. This decreased temporal resolution comes at the expense of the far
superior spatial resolution of fMRI. Although images can be acquired using smaller voxels than 2
mm, temporal resolution decreases with increased spatial resolution (i.e. smaller voxels). Thus,
when using fMRI, it is important to achieve a balance between spatial and temporal resolution
(Crosson et al., 2010).
Another limitation of fMRI is its expense (especially relative to EEG and fNIRS). Furthermore, a
group of limitations associated with fMRI is related to participant comfort. The fMRI acquisition
requires individuals to lie still, in a confined space, as MRI is very susceptible to motion. This
can be particularly difficult when investigating the brain activation patterns of cognitively
impaired and elderly populations, such as those with MCI. Furthermore, the noise produced by
BOLD acquisition is quite loud, which can increase discomfort in participants and make it
difficult for participants to hear auditory stimuli and instructions.
Although fMRI has a few notable disadvantages, as a functional neuroimaging technique it has
important advantages over other methods (Crosson et al., 2010). The temporal resolution of
fMRI is inferior to some techniques (EEG, MEG); however, its temporal resolution is overall
moderate (i.e. it is greater than other techniques, such as PET), and its spatial resolution, imaging
depth, and anatomical localization remains superior to other techniques (Crosson et al., 2010).
Furthermore, although fMRI is susceptible to motion and other artifacts, multiple robust pre-
processing techniques have been developed to correct for these noise sources and thus to increase
the BOLD signal contract to noise ratio.
28
1.3.3 Functional Neuroimaging and Driving
Driving is a highly complex daily behaviour that requires the integration of multiple cognitive
functions, including attention, executive function, visual spatial ability, psychomotor skills, and
memory. All of these cognitive functions can be affected by MCI and AD. However, the
frequency, areas, and degree of driving impairment within these populations remain unclear.
Fundamental knowledge of the underlying brain regions associated with various aspects of
driving in both cognitive impaired (i.e. MCI, AD, and related dementia) and cognitively normal
populations is important for understanding the driving impairment characteristic of these patient
populations and for the ultimate development of accurate tools to help physicians assess the
driving fitness of patients (Schweizer et al., 2013). Several studies have combined driving
assessments (e.g. driving simulation, on-road driving, caregiver reports, etc.) with various
functional neuroimaging modalities, including fMRI (Calhoun et al., 2002; Callan, Osu,
Yamagishi, Callan, & Inoue, 2009; S. C. Chung et al., 2014; Graydon et al., 2004; Hirth, Davis,
Fridriksson, Rorden, & Bonilha, 2007; Just, Keller, & Cynkar, 2008; H. S. Kim et al., 2014;
Mader et al., 2009; Schweizer et al., 2013; Spiers & Maguire, 2007; Uchiyama, Ebe, Kozato,
Okada, & Sadato, 2003; Walter et al., 2001), EEG (Dahal et al., 2014; Haufe et al., 2014; Huang,
Pal, Chuang, & Lin, 2015; Jancke & Brunner, 2008; I.-H. Kim, Kim, Haufe, & Lee, 2015; C. T.
Lin et al., 2014; C.-T. Lin, Chen, Chiu, Lin, & Ko, 2011; Papadelis et al., 2006; Sonnleitner,
Simon, Kincses, Buchner, & Schrauf, 2012), fNIRS (Harada, Nashihara, Morozumi, Ota, &
Hatakeyama, 2007; Liu, 2014; Liu, Pelowski, Pang, Zhou, & Cai, 2015; Liu, Saito, & Oi, 2012;
Tomioka et al., 2009), MEG (Fort et al., 2010; Sakihara et al., 2014; Yokosawa et al., 2013),
SPECT (Ott et al., 2000) and PET (Jeong et al., 2006; Luzzi et al., 2015), to identify the neural
networks associated with driving in cognitively normal (Calhoun et al., 2002; Just et al., 2008;
Schweizer et al., 2013; Spiers & Maguire, 2007; Walter et al., 2001) and cognitively impaired
(Luzzi et al., 2015; Ott et al., 2000; Tomioka et al., 2009) drivers. This literature is briefly
reviewed below.
Other Functional Neuroimaging Techniques and Driving
Numerous studies have used EEG to investigate brain activation patterns during driving
simulation (Bueno, Fabrigoule, Deleurence, Ndiaye, & Fort, 2012; Dahal et al., 2014; Jancke &

29
Brunner, 2008; I.-H. Kim et al., 2015; C. T. Lin et al., 2014; C.-T. Lin et al., 2011; Sonnleitner et
al., 2012) and closed-course on-road assessments (Haufe et al., 2014). The results of these
studies suggest that multiple brain regions are involved in driving, including frontal (Dahal et al.,
2014; C.-T. Lin et al., 2011; Sonnleitner et al., 2012), temporal (Dahal et al., 2014; Sonnleitner et
al., 2012), motor (C.-T. Lin et al., 2011), parietal (Sonnleitner et al., 2012), and occipital regions
(Sonnleitner et al., 2012). For example, Jancke and Brunner (2008) investigated alpha-band
activity during fast driving. Results suggested that driving fast is associated with greater alpha-
band activity and that greater risk-taking behaviour is associated with stronger alpha-band
activity in the left anterior lateral prefrontal cortex (Jancke & Brunner, 2008). Given that an
increase in alpha-band activity is associated with less hemodynamic responses, which
corresponds to less neurophysiological activation, this increase in alpha-related activity suggests
less neural activation in the left anterior lateral prefrontal cortex is associated with risk taking
(Jancke & Brunner, 2008).
Jeong and colleagues (2006) used PET and [lSF]2-deoxy-2-fluoro-D-glucose (FDG) to
investigate brain activity of healthy drivers during active (i.e. actively driving) and passive (i.e.
passively observing in the passenger seat) actual-car driving. Participants were injected with
FDG, performed the task, and then underwent PET scans immediately following the passive or
active session. Results suggested that several brain regions are recruited during active car
driving, including visual cortices, primary sensorimotor areas, premotor areas, parietal regions,
the cingulate gyrus, the parahippocampal gyrus, the thalamus, and the cerebellum. Similar brain
regions have been shown to be recruited during driving when using MEG, including visual (Fort
et al., 2010), parietal (Fort et al., 2010; Sakihara et al., 2014), temporal (Sakihara et al., 2014),
sensory (Sakihara et al., 2014) and frontal regions (Fort et al., 2010; Sakihara et al., 2014).
Functional NIRS is increasingly being used as a tool to investigate prefrontal and parietal lobe
activation (i.e. changes in the concentration of oxyhemoglobin and deoxyhemoglobin) during
driving simulation and on-road assessments (Harada et al., 2007; Liu et al., 2015, 2012; Shimizu
et al., 2009 retrieved from Liu et al., 2015; Tsunashima & Yanagisawa, 2009 retrieved from Liu
et al., 2015; Yoshino, Oka, Yamamoto, Takahashi, & Kato, 2013 retrieved from Liu et al., 2015).
The results of these studies show that activation in the prefrontal cortex increases during a car
30
following task (Liu et al., 2015; Shimizu et al., 2009 retrieved from Liu et al., 2015; Tsunashima
& Yanagisawa, 2009 retrieved from Liu et al., 2015), faster deceleration (Yoshino, Oka,
Yamamoto, Takahashi, & Kato, 2013 retrieved from Liu et al., 2015), as well as collision
avoidance (Tomioka et al., 2009). Harada and colleagues (2007) compared prefrontal activation
in elderly and young drivers and found that elderly drivers showed less variation in activation
compared to young drivers.
A few studies have used functional neuroimaging to investigate the brain activation patterns
associated with driving in patients with dementia (Luzzi et al., 2015; Ott et al., 2000; Tomioka et
al., 2009). Ott and colleagues (2000) correlated degree of driving impairment (i.e. based on
caregiver ratings) of patients with very mild, mild, and moderate AD (i.e. CDR scores 0.5, 1, and
2) with SPECT perfusion. Increased driving impairment was associated with reduced right
hemisphere perfusion, particularly in temporal-occipital regions. Similarly, Luzzi and colleagues
(2015) used PET to correlate cerebral hypometabolism with road sign knowledge and route
learning in patients with AD and semantic dementia (SD). In patients with SD, FDG uptake in
left temporal regions was correlated with road sign naming and road sign comprehension.
Furthermore, FDG uptake in the orbitofrontal cortex was correlated with road sign
comprehension. In patients with AD, FDG uptake in the posterior parahippocampal gyrus was
correlated with road sign naming and FDG uptake in the superior frontal gyrus/anterior cingulate
was correlated with performance on route learning. These results suggest that individuals with
dementia show deviations in brain activation compared to healthy drivers during tasks related to
driving (e.g. road sign test and route learning) and that different subtypes of dementia (e.g. AD
versus SD) demonstrate different patterns of activation related to driving (Luzzi et al., 2015).
Only one study has combined functional neuroimaging and a realistic driving simulator to
investigate the neural correlates of driving in patients with cognitive impairment, including MCI,
AD, and related dementia. Specifically, Tomioka and colleagues (2009) investigated the
prefrontal activation of patients with AD during a collision avoidance task. Results revealed a
correlation between a delay in braking and prefrontal activation, which was positive in healthy
controls and negative in patients with AD (Tomioka et al., 2009).

31
Functional MRI and Driving
Functional MRI has been combined with various technologies, including joystick or controller
technology (Calhoun et al., 2002; Just et al., 2008; Spiers & Maguire, 2007; Uchiyama et al.,
2003; Walter et al., 2001), passively viewing driving scenes (Callan et al., 2009; Graydon et al.,
2004; Hirth et al., 2007; H. S. Kim et al., 2014; Mader et al., 2009), as well as fully functioning
driving simulation with a wheel and pedal system (S. C. Chung et al., 2014; Schweizer et al.,
2013). Mirroring the results of EEG, PET, MEG, and fNIRS studies, the results of fMRI studies
suggest that an extensive brain network is required to drive safely (Calhoun et al., 2002; Just et
al., 2008; H. S. Kim et al., 2014; Y.-O. Li, Eichele, Calhoun, & Adali, 2012; Schweizer et al.,
2013; Spiers & Maguire, 2007; Uchiyama et al., 2003). Specifically, the parietal (Calhoun et al.,
2002; S. C. Chung et al., 2014; Graydon et al., 2004; Just et al., 2008; H. S. Kim et al., 2014; Y.-
O. Li et al., 2012; Schweizer et al., 2013; Spiers & Maguire, 2007; Uchiyama et al., 2003; Walter
et al., 2001), occipital (Calhoun et al., 2002; S. C. Chung et al., 2014; Hirth et al., 2007; Just et
al., 2008; H. S. Kim et al., 2014; Y.-O. Li et al., 2012; Mader et al., 2009; Schweizer et al., 2013;
Spiers & Maguire, 2007; Walter et al., 2001), motor (Calhoun et al., 2002; S. C. Chung et al.,
2014; Just et al., 2008; Y.-O. Li et al., 2012; Schweizer et al., 2013; Spiers & Maguire, 2007;
Uchiyama et al., 2003), premotor (Schweizer et al., 2013; Spiers & Maguire, 2007; Uchiyama et
al., 2003), cerebellar (Calhoun et al., 2002; S. C. Chung et al., 2014; Graydon et al., 2004; Just et
al., 2008; Y.-O. Li et al., 2012; Mader et al., 2009; Schweizer et al., 2013; Spiers & Maguire,
2007; Uchiyama et al., 2003; Walter et al., 2001), and frontal (Calhoun et al., 2002; S. C. Chung
et al., 2014; Graydon et al., 2004; Hirth et al., 2007; H. S. Kim et al., 2014; Y.-O. Li et al., 2012;
Mader et al., 2009; Schweizer et al., 2013; Spiers & Maguire, 2007; Uchiyama et al., 2003)
regions have been repeatedly identified as important regions involved in safe driving.
Furthermore, different brain regions may be recruited during different aspects of driving.
(Calhoun et al., 2002; Callan et al., 2009; Mader et al., 2009; Schweizer et al., 2013; Spiers &
Maguire, 2007). Specifically, increased driving speed has been shown to be associated with
decreased activity in the anterior cingulate cortex (Calhoun et al., 2002). Additionally, the
anterior cingulate as well as other areas, including the cerebellum, basil ganglia, thalamus, and
pre-motor regions, were recruited during a car-following task (Uchiyama et al., 2003). Task
performance was negatively correlated with activation in the anterior cingulate, suggesting that
32
the task required error detection and response selection (Uchiyama et al., 2003). Spiers and
Maguire (2007) investigated the brain regions involved in various driving conditions and
situations, including prepared actions (e.g. turning, reversing, stopping, and starting), planning
and monitoring traffic, collision avoidance, and processing road traffic rules. Prepared actions
were associated with activation in premotor, parietal, and cerebellar regions (Spiers & Maguire,
2007). Planning and monitoring correlated with activation in superior parietal, lateral occipital,
and cerebellar regions (Spiers & Maguire, 2007). Lateral occipital and parietal areas, the insular,
and the posterior region of the medial premotor cortex were implicated during collision
avoidance (Spiers & Maguire, 2007). Finally, processing road traffic rules was associated with
activation in the lateral prefrontal cortex (Spiers & Maguire, 2007).
A few studies (Callan et al., 2009; Schweizer et al., 2013; Spiers & Maguire, 2007) have
investigated the brain regions associated with turning at intersections. Schweizer and colleagues
(2013) used a fully immersive, ecologically valid, MR-compatible driving simulator (Kan,
Schweizer, Tam, & Graham, 2013) with a fully functioning steering wheel and pedal system (i.e.
accelerator and brake pedal) to expose participants to turning conditions that increased in
complexity, including right turns, left turns, and left turns without oncoming traffic. Executing
right turns resulted in minimal activation compared to the straight driving condition (Schweizer
et al., 2013). Left turns without traffic were associated with greater activation in posterior brain
regions, such as occipital, parietal, motor, and cerebellar regions (Schweizer et al., 2013).
Furthermore, left turns with oncoming traffic were associated with greater activation in posterior
brain regions as well as increased activation in the cingulate cortex and superior frontal gyrus.
Given the cognitively complex nature of left turns at a busy intersection, it follows that this
turning condition was associated with increased activation in brain regions implicated in
alertness, response-selection, and complex visual processing compared to more routine aspects of
driving (Schweizer et al., 2013). Similar results were obtained by Callan and colleagues (2009),
who showed that resolving uncertainty in decision making at high traffic intersections was
associated with activation in the anterior cingulate as well as the amygdala.

33
1.4 Knowledge Gaps
Currently, guidelines provided by the Canadian Medical Association are highly limited, with no
specific recommendations on how to effectively assess the driving performance of patients with
MCI or mild AD. Furthermore, there are no cognitive tools with adequate sensitivity or
specificity to assess driving safety in a clinical setting. Consequently, physicians and other
healthcare professions do not feel confident or comfortable in assessing the driving fitness of
patients with MCI and related dementias. One major factor contributing to this is the limited and
variable results of driving simulator and on-road studies investigating the performance of drivers
with MCI. A fundamental understanding of the driving impairments, and corresponding brain
activation patterns, of patients of MCI as well as the various subtypes of MCI (e.g. amnestic
single domain and amnestic multiple-domain subtypes) represents an important first step in
addressing these issues.
34
Chapter 2
Specific Research Questions and Hypotheses
2.1 Summary and Rationale
The prevalence of MCI is widespread, with approximately 10-20% of individuals aged 65 years
or older meeting diagnostic criteria (Alzheimer's Association, 2016). With the aging of the
population, this prevalence rate is projected to increase substantially. Patients with MCI exhibit
objective and subjective cognitive deficits in one or more cognitive domains (i.e. single domain
versus multiple domain MCI; amnestic versus non-amnestic MCI). Although MCI is
characterized by minor deficits in cognitive functioning, current research suggests that patients
with MCI can exhibit subtle deficits in a variety of IADLs, including managing finances, keeping
appointments, and driving (Albert et al., 2011; Aretouloi & Brandt, 2010; Artero et al., 2001;
Burton et al., 2009; Gold, 2012; K. R. Kim et al., 2009; Petersen, 2004; Reppermund et al., 2013;
Tabert et al., 2002; Winblad et al., 2004). Furthermore, patients presenting with certain subtypes
of MCI may be at a greater risk of impairment when performing complex daily behaviours
compared to other subtypes (Aretouloi & Brandt, 2010; Burton et al., 2009; Gold, 2012; K. R.
Kim et al., 2009; Reppermund et al., 2013; C. Tam et al., 2007). This is a result of the fact that
the various subtypes of MCI have different areas and degrees of cognitive impairment, likely
translating into different degrees of functional impairment. Given that effective performance on
complex tasks, such as driving, involve the integration of multiple cognitive functions, it follows
that those with impairment in multiple cognitive domains beyond memory dysfunction, including
impairments in attention, executive function, and visuospatial ability, may exhibit a greater
degree of impairment when performing these complex daily activities, including certain aspects
of driving. This has been supported by studies, which demonstrate that patients with md-MCI,
who exhibit deficits in more than one cognitive domain, may exhibit greater impairment in
performing daily tasks compared to individuals with sd-MCI, who demonstrate impairment in
only one cognitive domain (Aretouloi & Brandt, 2010; Burton et al., 2009; C. Tam et al., 2007).
35
Driving is an important and complex daily behaviour. The ability to drive safely requires the
integration of multiple motor, perceptual, and cognitive functions (e.g. attention, visual spatial
functioning, memory, and executive functioning) as well as recruitment of the brain regions
associated with these abilities. The results of fMRI studies investigating the brain activation
patterns associated with driving in healthy, young drivers consistently report activation in the
occipital, parietal, frontal, and cerebellar regions during a variety of driving tasks. Furthermore,
given the multi-faceted nature of driving, different aspects of driving, including more routine
compared to more cognitive demanding tasks, may result in different activation patterns.
Schweizer and colleagues (2013) demonstrated that in healthy young adults, executing right and
left turns without traffic were associated with activation in posterior brain regions (e.g. occipital,
parietal, motor, cerebellar areas). Cognitively demanding left turns with oncoming traffic were
associated with greater activation in these posterior brain regions as well as increased activation
in the cingulate cortex and the superior frontal gyrus (Schweizer et al., 2013).
Given that the above brain regions recruited during driving are associated with numerous
cognitive functions, it follows that patients with MCI may exhibit some degree of driving
impairment, and deviation in brain activation, compared to cognitively healthy individuals.
Current research suggests that patients with MCI tend to demonstrate no or minor impairment
across most driving outcomes, rather than definitive driving impairments (Devlin et al., 2012;
Frittelli et al., 2009; Kawano et al., 2012; Wadley et al., 2009). Despite this general trend, current
results are based on a small number of studies (Devlin et al., 2012; Frittelli et al., 2009; Kawano
et al., 2012; Wadley et al., 2009) and no study has differentiated between the subtypes of MCI
(i.e. amnestic, non-amnestic, single-domain, multiple-domain) in terms of driving performance.
Although it is important for healthcare professionals to be alert to the more subtle driving
impairments among patients with MCI, there are currently no tools or guidelines to aid in the
assessment of fitness to drive. Thus, research is urgently needed to improve the understanding of
the specific areas and degree of driving impairment, and corresponding brain activation patterns,
characteristic of patients with MCI.
Furthermore, different subtypes of MCI are associated with varying degrees and areas of
cognitive impairment. This, coupled with the fact that research has shown that different subtypes
36
of MCI, may be at an increased risk of functional impairment (Aretouloi & Brandt, 2010; Burton
et al., 2009; Gold, 2012; K. R. Kim et al., 2009; Reppermund et al., 2013; C. Tam et al., 2007),
and that driving is a highly complex and multi-faceted task (Schweizer et al., 2013), it follows
that different areas and degrees of driving impairment may be characteristic of different subtypes
of MCI. Specifically, those with md-MCI have been shown to demonstrate widespread cognitive
deficits (Petersen et al., 2001), including impairment in domains repeatedly shown to be
important in safe driving (e.g. attention, executive function, visual spatial ability). Thus, it is
critical for research to differentiate between different subtypes of MCI when investigating
driving performance. Isolating the aspects of driving that patients with MCI (i.e. MCI patients as
a whole as well as different subtypes) have the most difficulty with, as well as the critical brain
regions that are recruited during these driving situations, is an important first step in the ultimate
development of accurate assessment tools and targeted rehabilitation strategies to help assess and
retrain driving ability in patients with MCI.
2.2 Research Objectives and Hypotheses
The primary aims of this thesis are to use driving simulation to determine (1) the areas and
degree of driving difficulty characteristic of patients with MCI, including two prominent
subtypes of MCI; and (2) the brain activation patterns characteristic of patients with MCI across
driving conditions of varying levels of complexity.
2.2.1 Investigating the Areas and Degree of Driving Impairment
Characteristic of Patients with MCI and Subtypes of MCI
The first set of objectives involve using driving simulation to investigate the driving performance
of patients with MCI, as well as two different subtypes of MCI (amnestic sd-MCI and amnestic
37
md-MCI), and to compare patient performance to cognitively healthy age-matched control
participants. The following objectives and hypotheses will be addressed in Chapter 3 of the
current thesis. The objectives are:
1) To determine which aspects of driving patients with MCI exhibit difficulty compared to
healthy control drivers
2) To determine whether patients with amnestic sd-MCI and patients with amnestic md-MCI
demonstrate different driving profiles (i.e. areas and degree of driving impairment)
compared to healthy control drivers.
The hypotheses associated with these objectives are:
1) Given that patients with MCI exhibit impairments in cognitive functioning (i.e. including
attention, executive function, and visual spatial ability) and the cognitively complex
nature of driving, patients with MCI will exhibit increased driving errors (e.g. collisions,
centre line crossings, road edge excursions, stop signs missed) compared to healthy
control participants.
2) Because of the subtle nature of the cognitive deficits associated with MCI, drivers with
MCI will tend to demonstrate difficulty in more cognitively demanding aspects of driving
(e.g. performing left turns with oncoming traffic) compared to more routine aspects of
driving (e.g. performing right and left turns without traffic)
3) Given the presence of more widespread cognitive deficits (e.g. attention, executive
function, etc. in addition to memory), patients with md-MCI will exhibit greater driving
difficulty than controls, relative to those with sd-MCI, particularly during more
cognitively demanding aspects of driving (e.g. left turns with traffic)
38
2.2.2 Investigating the Brain Activation Patterns Characteristic of Patients
with MCI during Routine and Cognitively Demanding Driving Tasks
The second set of objectives involve combining fMRI and a fully immersive fMRI-compatible
driving simulator to identify the brain activation patterns characteristic of patients with MCI
while they are performing driving tasks that vary in complexity (i.e. right and left turns without
traffic, left turns with oncoming traffic). The following objectives and hypotheses will be
addressed in Chapter 4 of the thesis.
1) To compare the brain activation patterns of patients with MCI to cognitively healthy age-
and sex-matched controls during various turning conditions
2) To obtain preliminary data on the brain activation patterns of different subtypes of MCI
(i.e. md-MCI and sd-MCI) relative to healthy age- and sex-matched controls during the
same turning conditions
The hypothesis associated with these objectives are:
1) Patients with MCI and cognitively healthy controls will show reliable activation in the
brain regions previously identified as being activated during both routine and complex
aspects of driving (e.g. occipital, parietal, motor, cerebellar, and frontal regions).
2) In addition, patients with MCI will show reliable deviations in brain activation compared
to healthy control drivers, particularly during more cognitively demanding aspects of
driving (i.e. left turns with oncoming traffic), and specifically, increased activation in
frontal regions.
Given that the investigation of the activation patterns associated with subtypes of MCI (amnestic
sd-MCI and amnestic md-MCI) was preliminary and exploratory in nature, no specific
hypotheses were pre-defined.
39
Chapter 3
Driving Impairments in Patients with MCI, Including the Amnestic
Single-Domain and Multiple-Domain Subtypes of MCI
Currently, there are no guidelines or objective tools with sufficient reliability and validity to
assist healthcare professionals in assessing the driving fitness of patients with MCI. One major
factor contributing to this issue is that the areas and degree of driving impairment among patients
with MCI remain unclear. Only four studies to date have investigated the driving performance of
patients with MCI (across all studies, the total number of patients is <100), with three studies
using driving simulation (Devlin et al., 2012; Frittelli et al., 2009; Kawano et al., 2012) and one
study using an on-road assessment (Wadley et al., 2009). In general, the results of these studies
suggest that individuals with MCI exhibit minor or subtle difficulties rather than definitive and
overt driving impairments (Devlin et al., 2012; Frittelli et al., 2009; Kawano et al., 2012; Wadley
et al., 2009). Specifically, patients with MCI showed no or minimal impairment (i.e. results did
not reach statistical significance) in braking (Devlin et al., 2012; Kawano et al., 2012), stopping
at stop signs and stop lights (Devlin et al., 2012; Frittelli et al., 2009), road tracking (Kawano et
al., 2012) and performing left turns (Wadley et al., 2009). However, patients with MCI
performed significantly worse on a car following task (Kawano et al., 2012), had a shorter mean
time to collision (Frittelli et al., 2009), and were more likely to receive a less than optimal rating
on global performance as well as lane control compared to healthy control drivers (Wadley et
al., 2009).
Given the limited amount of research to date, there is a need to confirm the results of previous
studies that patients with MCI exhibit minor impairments in several aspects of driving and to
identify better the specific areas of driving in which patients with MCI may be at risk for more
severe impairment. Furthermore, given the heterogeneous nature of MCI, it is critical to
investigate the driving performance of various subtypes of MCI separately (e.g. amnestic versus
non-amnestic; single-domain versus multiple domain). Given the widespread cognitive deficits
40
associated with patients with md-MCI (Petersen, 2004; Petersen et al., 2001), including key
cognitive functions that have been shown to be implicated in driving (e.g. attention, executive
function, visual spatial ability), it follows that patients with amnestic md-MCI may be at a
greater risk of driving impairment compared to those with amnestic sd-MCI. Understanding the
areas of driving for which certain subtypes of MCI may be at an increased risk of difficulty will
lay the foundation for ultimate development of accurate screening tools, informative driving
guidelines, and effective rehabilitation strategies for patients.
3.1 Experimental Materials and Methods
3.1.1 Statement of Ethical Approval
Ethical approval for the current study was obtained from the Research Ethics Board (REB) at St.
Michael’s Hospital, Toronto Canada under REB 16-036 titled, “Investigating the driving
behaviour and underlying neural networks in aging cohorts and patients with neurological
conditions”. All participants provided written informed consent before participating in the
research study.
3.1.2 Participants
Twenty-two (22) patients with MCI (mean age = 66.8; mean years of education 15.0; Male, n =
14), including 11 patients with amnestic sd-MCI (mean age = 67.3; mean years of education
15.1; Male, n = 5) and 11 patients with amnestic md-MCI (mean age = 66.4; mean years of
education 15.0; Male, n = 8) were recruited from the Memory Disorders Clinic at St. Michael’s
Hospital. In addition, twenty (20) age-matched cognitively healthy controls (mean age = 66.7;

41
mean years of education 16.7; Male, n = 14) were recruited from the community. Although
patients and control participants were not sex- or education-matched, statistical analyses (i.e. chi-
square analysis and Kruskal-Wallis H test, respectively) revealed patients with MCI (including
the sd-MCI and md-MCI subgroups) and healthy control participants did not differ significantly
in terms of sex (X2 = 2.325, p > 0.05) or mean number of years of education (X2 = 4.758, p >
0.05). Demographic information is listed in Table 3.1.
Table 3.1. Demographic characteristics of patients with MCI and healthy controls
Healthy
Controls
(n = 20)
All MCI
Patients
(n = 22)
sd-MCI
Patients
(n = 11)
md-MCI
Patients
(n = 11)
p-value
Age, years
66.7 ± 8.2
(47-79)
66.8 ± 9.6
(50-83)
67.3 ± 9.2
(52-83)
66.4 ± 10.3
(50-81)
0.972
Education, years
16.7 ± 2.0
(14-22)
15.0 ± 2.7
(12-21)
15.1 ± 2.7
(12-21)
15.0 ± 2.7
(12-19)
0.093
Sex, n (%) Male
14 (70.0%) 13 (59.1%) 5 (45.4%) 8 (72.7%) 0.313
Note. Values reported in mean ± standard deviation (range) format unless otherwise indicated. p-
values are reported for the one-way ANOVA/Kruskal Wallis analysis (healthy control versus sd-
MCI versus md-MCI comparison). n, number of participants; % = percentage of participants;
MCI = mild cognitive impairment; sd-MCI = amnestic single-domain MCI; md-MCI = amnestic
multiple-domain MCI.
Inclusion Criteria
Both patients with MCI and healthy control participants: (1) held a valid driver’s licence, (2)
were age 45-85 years old, and (3) were fluent in English. Patients and controls with a history of
clinical depression were included if depressive symptoms were controlled. All cases of
uncontrolled depression were excluded.

42
All patients with MCI were formally diagnosed by a geriatric psychiatrist in the Memory
Disorders Clinic at St. Michael’s Hospital, based on a comprehensive patient history, as well as
the results of clinical neuroimaging (e.g. MRI, CT, SPECT to rule out other diagnoses) and
objective cognitive testing, including the Behavioural Neurological Assessment (BNA; Darvesh,
Leach, Black, Kaplan, & Freedman, 2005) and the Montreal Cognitive Assessment (MoCA;
Nasreddine et al., 2005). All patients met the National Institute on Aging-Alzheimer’s
Association criteria for MCI (Albert et al., 2011). Specifically, patients demonstrated: (1) a
concern regarding change in cognition (i.e. self-reported, reported by a caregiver, or recognized
by a clinician), (2) impairment in one or more cognitive domains, (3) preservation of
independence in functional abilities, (4) no presence of dementia (see Chapter 1, section 1.1.1,
pages 3-5 for a comprehensive summary of these diagnostic criteria). All patients classified with
sd-MCI demonstrated subjective and objective memory complaints/impairment only and patients
classified with md-MCI demonstrated subjective and objective complaints/impairments in one or
more cognitive domains (e.g. executive function, attention, visuospatial ability, etc.) in addition
to memory.
Exclusion Criteria
The following represent the exclusion criteria for both patient and control participants: (1)
history of severe neurological diagnoses (e.g. traumatic brain injury, brain tumour, Parkinson’s
disease, stroke, multiple sclerosis, Alzheimer’s disease, epilepsy, etc.), (2) history of severe
psychiatric diagnosis (e.g. schizophrenia, uncontrolled depression or anxiety, etc.), (3) severe
microangiopathic changes, (4) presence of a serious sensory or motor impairment, (5) presence
of a significant visual abnormality that was not corrected with lenses, (6) history of substance
abuse or dependence, and (7) diagnosed or treated learning disabilities. All controls who scored
less than 26 on the MoCA were also excluded from the analysis (see Chapter 3, section 3.1.3.3,
pages 49-50 for more detailed information). All inclusion and exclusion criteria were evaluated
clinically for patients by a geriatric psychiatrist and by self-report for healthy controls.

43
3.1.3 Experimental Procedures
The experimental design aimed to use driving simulation to investigate the driving performance,
and more specifically the driving impairments, of patients with MCI including individuals with
amnestic single-domain (sd-MCI) and individuals with amnestic multiple-domain (md-MCI)
MCI. Each participant (including MCI patients and healthy controls) completed (1) driving
scenarios on a portable driving simulator, (2) cognitive tests, which have been widely utilized in
the driving literature and assess a variety of cognitive domains, and (3) questionnaires assessing
mood and driving habits. Each participant completed the driving scenarios, cognitive tests, and
questionnaires on the same day. The driving scenarios took approximately 1-1.5 hours to
complete. The cognitive tests and questionnaires took approximately 1 hour to complete.
3.1.3.1 Clinical Data Collection
The relevant clinical data of all consenting patients with MCI were obtained through the online
medical record system at St. Michael’s Hospital (Soarian Clinicals, Version 4.00 SP06). The
electronic medical records, including imaging results (i.e. CT, MRI, SPECT scans), of all
individuals with MCI were screened for any history or presence of any conditions that would
warrant exclusion (see Chapter 3, section 3.1.2, pages 40-41 for inclusion and exclusion criteria).
Electronic medical records also indicated the subtype (e.g. amnestic MCI, amnestic multiple-
domain MCI) in which patients with MCI met diagnostic criteria. Subtype classification was
determined by a geriatric psychiatrist in the Memory Disorders Clinic at St. Michael’s Hospital,
based on consistent (i.e. repeated assessments) areas of impairment identified through objective
testing (BNA and/or MoCA) as well as the subjective cognitive complaints of the patients.
3.1.3.2 Driving Simulation
Although some studies have questioned the validity of driving simulation, other research studies
have supported the utility driving simulators in assessing driving performance (Bedard et al.,
2010; Frittelli et al., 2009; Lee et al., 2003; Lew et al., 2005; Mayhew et al., 2011; Reimer et al.,
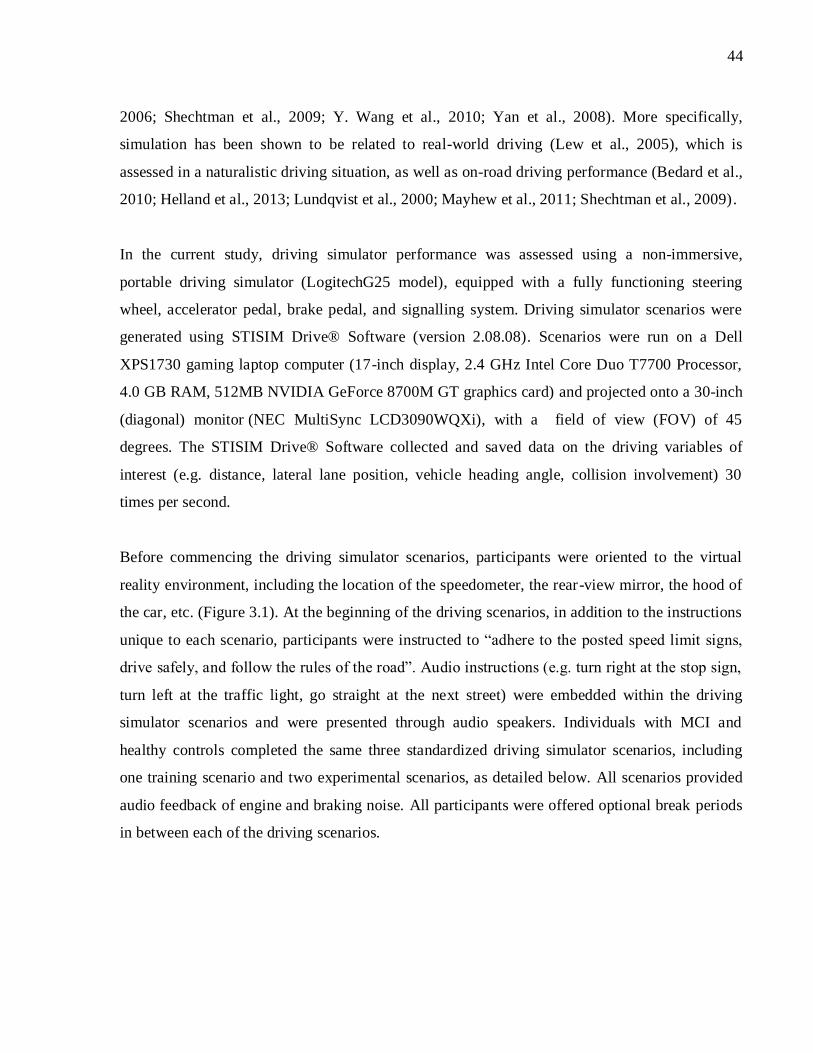
44
2006; Shechtman et al., 2009; Y. Wang et al., 2010; Yan et al., 2008). More specifically,
simulation has been shown to be related to real-world driving (Lew et al., 2005), which is
assessed in a naturalistic driving situation, as well as on-road driving performance (Bedard et al.,
2010; Helland et al., 2013; Lundqvist et al., 2000; Mayhew et al., 2011; Shechtman et al., 2009).
In the current study, driving simulator performance was assessed using a non-immersive,
portable driving simulator (LogitechG25 model), equipped with a fully functioning steering
wheel, accelerator pedal, brake pedal, and signalling system. Driving simulator scenarios were
generated using STISIM Drive® Software (version 2.08.08). Scenarios were run on a Dell
XPS1730 gaming laptop computer (17-inch display, 2.4 GHz Intel Core Duo T7700 Processor,
4.0 GB RAM, 512MB NVIDIA GeForce 8700M GT graphics card) and projected onto a 30-inch
(diagonal) monitor (NEC MultiSync LCD3090WQXi), with a field of view (FOV) of 45
degrees. The STISIM Drive® Software collected and saved data on the driving variables of
interest (e.g. distance, lateral lane position, vehicle heading angle, collision involvement) 30
times per second.
Before commencing the driving simulator scenarios, participants were oriented to the virtual
reality environment, including the location of the speedometer, the rear-view mirror, the hood of
the car, etc. (Figure 3.1). At the beginning of the driving scenarios, in addition to the instructions
unique to each scenario, participants were instructed to “adhere to the posted speed limit signs,
drive safely, and follow the rules of the road”. Audio instructions (e.g. turn right at the stop sign,
turn left at the traffic light, go straight at the next street) were embedded within the driving
simulator scenarios and were presented through audio speakers. Individuals with MCI and
healthy controls completed the same three standardized driving simulator scenarios, including
one training scenario and two experimental scenarios, as detailed below. All scenarios provided
audio feedback of engine and braking noise. All participants were offered optional break periods
in between each of the driving scenarios.
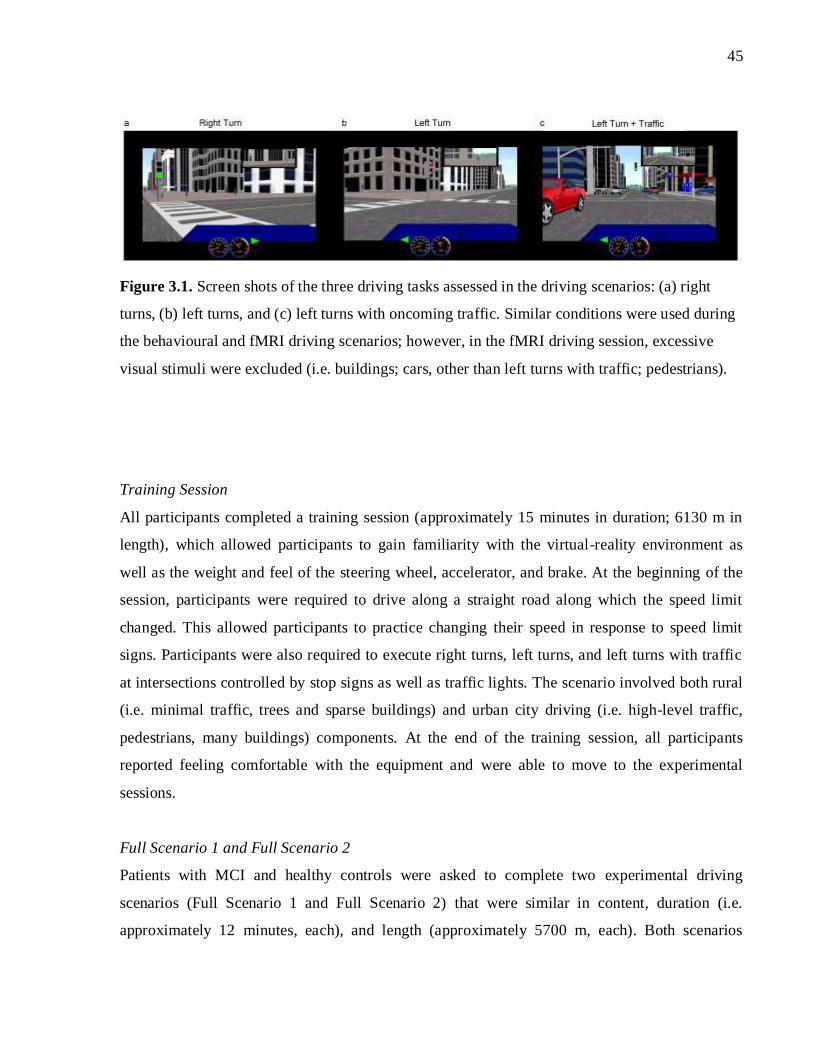
45
Figure 3.1. Screen shots of the three driving tasks assessed in the driving scenarios: (a) right
turns, (b) left turns, and (c) left turns with oncoming traffic. Similar conditions were used during
the behavioural and fMRI driving scenarios; however, in the fMRI driving session, excessive
visual stimuli were excluded (i.e. buildings; cars, other than left turns with traffic; pedestrians).
Training Session
All participants completed a training session (approximately 15 minutes in duration; 6130 m in
length), which allowed participants to gain familiarity with the virtual-reality environment as
well as the weight and feel of the steering wheel, accelerator, and brake. At the beginning of the
session, participants were required to drive along a straight road along which the speed limit
changed. This allowed participants to practice changing their speed in response to speed limit
signs. Participants were also required to execute right turns, left turns, and left turns with traffic
at intersections controlled by stop signs as well as traffic lights. The scenario involved both rural
(i.e. minimal traffic, trees and sparse buildings) and urban city driving (i.e. high-level traffic,
pedestrians, many buildings) components. At the end of the training session, all participants
reported feeling comfortable with the equipment and were able to move to the experimental
sessions.
Full Scenario 1 and Full Scenario 2
Patients with MCI and healthy controls were asked to complete two experimental driving
scenarios (Full Scenario 1 and Full Scenario 2) that were similar in content, duration (i.e.
approximately 12 minutes, each), and length (approximately 5700 m, each). Both scenarios

46
included two-way traffic, with one lane of traffic in each direction, as well as pedestrians and
buildings. Scenarios exposed participants to a variety of driving conditions that ranged in
complexity from straight driving, to right turns and left turns without traffic, to left turns with
oncoming traffic. At intersections with oncoming traffic in which drivers were instructed to turn
left, a condition that involves higher cognitive demands (Schweizer et al., 2013), participants
were required to judge accurately when it was possible to execute the manoeuvre safely. The
scenario involved both rural and urban city driving components. Speed limit signs ranged from
40 km/h to 90 km/h.
The variables of interest that were collected in this scenario included: number of collisions,
number of centre line crossings, number of road edge excursions, number of stop signs missed,
number of speed exceedances (>5 km/h over the posted speed limit sign), total number of driving
errors (i.e. the sum of the above errors), number of errors during each turning condition (i.e.
collisions, centre line crossings, road edge excursions), the percentage of the time spent out of
the legal driving lane, the percentage of time over the posted speed limit, and standard deviation
in speed. A centre line crossing occurs anytime the wheels of the driver’s vehicle make contact
with the other side of the centre line. A road edge excursion occurs every time the tires leave the
paved portion of the road (in the driver’s direction). Maintaining the vehicle over the centre line
or on the paved portion of the road contributes to the variable “percentage of time out of the legal
driving lane”. Maintaining a speed 5 km/h over the speed limit contributes to the variable
“percentage of time over the speed limit”. Number of errors during each turning condition was
reported as the average number of errors committed per one turn (i.e. average number of errors
committed per one right turn, per one left turn, and per one left turn with traffic).
Procedures to Minimize Simulator Sickness
Simulator sickness is a prominent issue in driving simulator research and assessments. An
evidence-based review conducted by Classen, Bewernitz, and Shechtman (2011) investigated the
factors contributing to simulator sickness. Results suggested that multiple participant factors
contribute, including age (Brooks et al., 2010; Domeyer et al., 2013; Matas, Nettelbeck, &
Burns, 2015), sex (Matas et al., 2015), the virtual reality environment, and the virtual reality
equipment. Specifically, individuals 70 and older were significantly more likely to experience

47
simulator sickness than individuals under the age of 50 (Classen et al., 2011). Furthermore,
women are more likely to experience simulator sickness than men. In terms of environmental
factors, previous research has suggested that decreasing the visual “choppiness” of graphics,
using fog, decreasing the complexity of visual stimuli or starting with less visually complex tasks
and moving to more complex scenarios, starting with straight driving and progressing to curves
and turns, and decreasing the field of view of the screen (i.e. a small single monitor or three-
screen monitors versus a single large monitor) can all help to decrease instances of simulator
sickness (Classen et al., 2011). Finally, activity demand factors, including the illusion of motion
when a person remains stationary and driving at high speeds may contribute to simulator
sickness (Classen et al., 2011).
Mullen, Weaver, Riendeau, Morrison, and Bedard (2010) compared the on-road driving and
cognitive performance of individuals who successfully completed driving simulation (n = 12) to
those who dropped out due to simulator sickness (n= 13). Importantly, results suggested that
individuals who were prone to simulator sickness did not perform poorer on an on-road
assessment or cognitive testing compared to individuals who were able to complete the simulated
drive without experiencing simulator sickness (Mullen et al., 2010).
To help minimize the rate of simulator sickness, the current study used a single smaller monitor
that did not span the entire field of view (FOV = 45 degrees). The training session began with
straight driving and progressed to turns and curves, started the training procedure with less
visually complex events and moved to more complex events, minimized the “choppiness” of the
visual graphics, and provided participants with brakes between each of the scenarios. In the
current study, simulator sickness was measured via verbal-self report of symptoms. Throughout
the driving simulator session, research personnel checked with each participant to ensure he/she
was not experiencing symptoms of simulator sickness.

48
3.1.3.3 Cognitive Tests and Questionnaires
Questionnaires that were administered included: a demographic questionnaire, the Driving
Habits Questionnaire (DHQ; Owsley, Stalvey, Wells, & Sloane, 1999), and the Hospital Anxiety
and Depression Scale (HADS; Zigmond & Snaith, 1983). Cognitive tests that were consistently
administered to patient and control participants included: the MoCA, the Trail Making Test Part
A (TMT-A) and Part B (TMT-B), and the Useful Field of View test (UFOV). The MoCA, TMT,
as well as the UFOV were used to compare the cognitive test performance of patients with MCI
and healthy controls.
Demographic Questionnaire
All MCI patients and controls were administered a brief demographic questionnaire that asked
participants to report: age and date of birth, handedness, highest level of education, occupation
(or previous occupation), and retirement status.
Driving Habits Questionnaire
The DHQ was adapted from a questionnaire produced by Owsley and colleagues (1999). The
DHQ represents one of the highest cited and most commonly utilized driving questionnaires that
is currently available (Ackerman, Vance, Wadley, & Ball, 2010; Croston, Meuser, Berg-Weger,
Grant, & Carr, 2009; Edwards, Bart, O’Connor, & Cissell, 2010; O’Connor, Kapust, Lin, Hollis,
& Jones, 2010; Song, Chun, & Chung, 2015). Recent research (Song et al., 2015) suggests that
the DHQ is a reliable, internally consistent, measure of self-reported driving behaviour.
Key items of interest for the current study included: number of years of driving experience, total
number of hours spent per week driving, number of hours per week driving on the highway,
number of self-reported accidents, self-reported quality of driving (1 = poor; 2 = fair; 3 =
average; 4 = good; 5 = excellent), and self-reported ratings on various difficult driving situations
(0 = no difficulty; 1 = little difficulty; 2 = moderate difficulty; 3 = severe difficulty), including
driving at night, driving on the highway, driving alone, and executing left turns with oncoming
traffic (see Table 3.2).

49
Table 3.2. Driving habits reported by patients with MCI and healthy controls
Healthy
Controls
(n = 20)
All MCI
Patients
(n = 22)
sd-MCI
Patients
(n = 11)
md-MCI
Patients
(n = 11)
p-value
Driving experience,
years
44.3 ± 12.6
(20-63)
45.9 ± 10.7
(27-65)
47.6 ± 8.6
(33-63)
44.3 ± 12.7
(27-65)
0.675†
0.801‡
Driving experience,
hours/week
6.8 ± 6.2
(0-20)
6.1 ± 4.5
(0-15)
6.4 ±3.8
(1-14)
5.7 ± 5.3
(0-15)
0.641†
0.857‡
Driving experience,
hours/week on
highway
2.1 ± 2.4
(0-10)
2.5 ± 2.5
(0-8)
3.2 ± 2.1
(0.5-8)
1.9 ± 2.7
(0-7)
0.587†
0.419‡
Self-reported quality
of driving*
4.1 ± 0.7
(3-5)
4.0 ± 0.7
(2-5)
4.3 ± 0.6
(3-5)
3.8 ± 0.7
(2-5)
0.685†
0.365‡
Self-reported
accidents
1.8 ± 2.4
(0-10)
1.7 ± 1.4
(0-5)
1.6 ± 1.4
(0-5)
1.7 ± 1.5
(0-5)
0.631†
0.883‡
Difficulty driving at
night§
0.5 ± 0.5
(0-1)
0.5 ± 0.7
(0-2)
0.1 ± 0.3
(0-1)
0.8 ± 0.8
(0-2)
0.869†
0.085‡
Difficulty with left
turns with traffic§
0.3 ± 0.5
(0-1)
0.2 ± 0.6
(0-2)
0 ± 0
(0-0)
0.4 ± 0.8
(0-2)
0.452†
0.155‡
Difficulty with
highway driving§
0.2 ± 0.4
(0-1)
0.1 ± 0.4
(0-2)
0 ± 0
0.2 ± 0.6
(0-2)
0.607†
0.440‡
Difficulty driving
alone§
0.4 ± 0.7
(0-2)
0.2 ± 0.5
(0-2)
0 ± 0
0.4 ± 0.5
(0-2)
0.355†
0.213‡
Note. Values reported in mean ± standard deviation (range) format unless otherwise indicated.
†p-value for healthy control versus all MCI patients comparison. ‡p-value for one-way
ANOVA/Kruskal Wallis analysis (healthy control versus sd-MCI versus md-MCI comparison).
*self-reported quality of driving is assessed on a 5-point Likert scale (1 = poor; 2 = fair; 3=
average; 4 = good; 5 = excellent). §self-reported level of difficulty (0 = no difficulty; 1 = little
difficulty; 2 = moderate difficulty; extreme difficulty).
n, number of participants; % = percentage of participants; MCI = mild cognitive impairment; sd-
MCI = amnestic single-domain MCI; md-MCI = amnestic multiple-domain MCI

50
Hospital Anxiety and Depression Scale (HADS)
The HADS is a self-report measure of anxiety and depression developed by Zigmond and Snaith
(1983). The HADS was designed as a brief self-assessment scale to be utilized in outpatient
general medical clinics to screen for clinically significant anxiety and depression (Zigmond &
Snaith, 1983). The assessment consists of 14 items, with seven evaluating symptoms of
depression (e.g. “I still enjoy the things I used to enjoy” and “I feel as if I am slowed down”) and
seven measuring symptoms of anxiety (e.g. “worrying thoughts go through my mind” and “I can
sit at ease and feel relaxed”). Approximately half of the items on the inventory are reverse scored
to prevent response bias. Each individual item is scored on a scale from 0 to 3, with a score of 0
corresponding to no endorsement of symptoms and a score of 3 corresponding to a high
endorsement of that particular symptom of anxiety or depression. The total score on the HADS
ranges from 0 to 21. Normative data suggests that those scoring between 0 to 7 should be
classified as “normal”, individuals scoring between 8 to 10 are classified as “borderline
abnormal”, and those scoring between 11 to 21 are classified as “abnormal”. Various research
studies have supported the clinical utility of the HADS as a measure of depression (Bocéréan &
Dupret, 2014; Fong & Ho, 2014; C.-I. Hung, Liu, Wang, Yao, & Yang, 2012; Kjaergaard,
Arfwedson Wang, Waterloo, & Jorde, 2014; Müller, Cieza, & Geyh, 2012; Turk et al., 2015) and
anxiety (Bocéréan & Dupret, 2014; Fong & Ho, 2014; Müller et al., 2012; Turk et al., 2015).
In the current study, the HADS was administered to both healthy control participants and patients
with MCI to identify and screen out any participants who may have had clinically significant
levels of depression and anxiety.
The Montreal Cognitive Assessment (MoCA)
The MoCA was developed by Dr. Zaid Nasreddine as a screening tool for patients who present
with mild cognitive complaints. Previous research suggested that the Mini-Mental Status
Examination (MMSE), one of the most widely used screening tools for dementia, lacked the
sensitivity necessary to identify patients with MCI (Nasreddine et al., 2005). Thus, the MoCA
was developed as a tool to identify patients with MCI who typically score in the normal range of
the MMSE (Nasreddine et al., 2005). The MoCA is scored out of 30, with a score of ≥26
suggesting normal cognitive functioning and a score of <26 suggesting cognitive impairment

51
associated with MCI, AD, or a related form of dementia. The MoCA assesses eight broad
cognitive domains including: visuospatial/executive function (scores range from 0-5), naming
(scores range from 0-3), attention (scores range from 0-6), language (scores range from 0-3),
abstraction (scores range from 0-2), memory delayed recall (scores range from 0-5), and
orientation (scores range from 0-6).
Research has confirmed the clinical utility and accuracy (i.e. high validity, specificity,
sensitivity) of the MoCA in a variety of clinical populations, including MCI, AD, fronto-
temporal dementia (FTD), vascular dementia, vascular cognitive impairment (VCI), and stroke
(Freitas, Prieto, Simoes, & Santana, 2014; Goldstein et al., 2014; Kaya et al., 2014; Lam,
Middleton, et al., 2013; Schweizer, Al-Khindi, & Macdonald, 2012; Smith, Gildeh, & Holmes,
2007; Van Heugten, Walton, & Hentschel, 2015; Q. Xu et al., 2014). Furthermore, the MoCA
has been recognized as an important clinical tool by the Canadian Consensus Conference for the
Diagnosis and Treatment of Dementia Guidelines for Alzheimer’s disease (Canadian Consensus
on Diagnosis and Treatment of Dementia Working Group, 2007).
In the current study, the MoCA was used to screen healthy control participants for any potential
underlying cognitive impairment. Any control participant who scored <26 on the MoCA (cut-off
suggested by Nasreddine et al., 2005), was excluded from any further participation and any
collected data were removed from the analysis. The MoCA was also used to confirm the
subtypes (i.e. amnestic single-domain versus amnestic multiple-domain MCI) assigned by the
geriatric psychiatrist at St. Michael’s Hospital to the patients who were enrolled in the current
study. The previous work of Lam and colleagues (2013) demonstrated that the MoCA subscores
correlate with neuropsychological tests of the same domain. Specifically, memory (area under
the receiver operating characteristic curve, AUC = 0.86), visuospatial (AUC = 0.79), and
executive (AUC = 0.79) subscores were relatively sensitive to impairment in their respective
domains. In the current study, the mean domain subscores of sd-MCI and md-MCI subgroups
were compared to the mean domain subscores of healthy control participants. Previous research
has confirmed the criterion validity of the MoCA subscores.

52
The Trail Making Test Part A (TMT-A) and Part B (TMT-B)
The TMT is measure of attention, speed, and mental flexibility (Strauss, Sherman, & Spreen,
2006). There are two parts to the evaluation. TMT-A requires participants to use a pen or pencil
to connect 25 encircled numbers, which are randomly distributed across the sheet of paper, in the
correct, ascending order (e.g. 1 to 2, 2 to 3, 3 to 4, 4 to 5, etc.) (Strauss et al., 2006). TMT-B
requires participants to connect 25 encircled numbers and letters, which are randomly distributed
across the sheet of paper, in alternating and ascending order (e.g. 1 to A, A to 2, 2 to B, 3 to C,
etc.) (Strauss et al., 2006). All participants were administered a practice version of TMT-A and
TMT-B before completing the experimental versions. The test administrator (M.A.H) was
responsible for timing each exercise and, in the event of an error, directing the participant to the
last correct item and asking him/her to continue from that point (Strauss et al., 2006). Scoring for
TMT-A and TMT-B was reported in terms of time (in seconds) and the number of errors.
The TMT has been widely cited in the driving literature (Hird et al., 2016; Hird, Vetivelu,
Saposnik, & Schweizer, 2014; Marshall et al., 2007). Some studies report the predictive utility of
the TMT-A (Dawson et al., 2009; Grace et al., 2005; Hunt et al., 1993; Kawano et al., 2012) and
TMT-B (Dawson et al., 2009; Kawano et al., 2012; Ott et al., 2003; Rizzo et al., 2001, 1997; Uc
et al., 2006) in patients with AD and MCI, whereas other report little or no [i.e. not statistically
significant (p>0.05) or low/weak correlation coefficient (r <0.5; Mukaka, 2012)] predictive
utility (TMT-A: Ott, Festa, et al., 2008; Uc et al., 2006; TMT-B: Grace et al., 2005; Ott, Festa, et
al., 2008; Uc et al., 2004, 2005). Thus, although some studies have shown success in predicting
the driving performance of patients with MCI and AD using the TMT-A and TMT-B, results
remain inconsistent. Given that too few studies have supported the reliability and validity of
these measures, it is difficult to translate results into clinical recommendations.
In the current study, TMT-A was administered to patient and healthy control participants as a
measure of attention, and TMT-B was administered to participants as a measure of executive
function.

53
The Useful Field of View (UFOV)
The Useful Field of View (UFOV) is defined as the visual or spatial area that is required to
complete a specific visual task (Ball & Owsley, 1993). The size of one’s visual field can vary
from person to person and as a function of task difficulty (i.e. the speed of presentation, the
degree of similarity between the target and distractor stimuli) (Ball & Owsley, 1993). The UFOV
was developed in response to the presence of visual attentional deficits in older adults that are
not accurately identified using clinical measures and that often impact everyday abilities and
tasks, including driving (Ball & Owsley, 1993; Wood & Owsley, 2014).
The UFOV measures visual awareness and it requires participants to detect, locate, and identify
rapidly a target embedded in a complex environment (Ball & Owsley, 1993). There are three
parts to the evaluation. For each part of the UFOV, the participant is presented with stimuli on
the computer screen, and the time for which the stimuli are shown becomes shorter and shorter
with each presentation. The program measures the point at which the participant can no longer
accurately see all the information that is presented on the screen. Thus, the UFOV measures the
presentation time at which the stimuli can be accurately (i.e. 75% accuracy) identified (Wood &
Owsley, 2014). Processing Speed is the first subtest of the UFOV and involves the presentation
of a central target without any other targets or distractors (Wood & Owsley, 2014). Divided
Attention is the second subtest and involves the presentation of a pair of targets with one
presented centrally and the other presented in the periphery along one of the eight cardinal
directions (Wood & Owsley, 2014). Selective Attention is the third subtest, involving the same
targets as the Divided Attention subtest with the addition of irrelevant distractor stimuli (Wood
& Owsley, 2014).
The UFOV has been used as a tool to predict unsafe driving in a variety of populations, including
older drivers (Classen, Wang, Crizzle, Winter, & Lanford, 2013; Wood, Chaparro, Lacherez, &
Hickson, 2012), patients post-stroke (Akinwuntan et al., 2002; George & Crotty, 2010), and
patients with AD (Dawson et al., 2009; Rizzo et al., 2001, 1997, Uc et al., 2004, 2005, 2006).
Similar to the results of the TMT, it remains unclear whether the UFOV is an accurate predictor
of driving performance within the AD population. Specifically, a few studies supported the
UFOV as a predictor of simulator crashes and risky behaviours (Rizzo et al., 1997; Uc et al.,

54
2006) as well as on-road safety errors (Dawson et al., 2009), whereas others found that the
UFOV was not predictive of these same variables (Rizzo et al., 2001; Uc et al., 2004, 2005). No
study has investigated the ability of the UFOV to predict driving performance within the MCI
population.
The UFOV (Version 6.1.4), including the Processing Speed, Divided Attention, and Selective
Attention subtests, was administered to MCI patients and healthy controls as a measure of vision
and attention.
3.1.4 Data Extraction and Analysis
3.1.4.1 Driving Simulator Data Extraction
All driving simulator data were extracted from the STISIM Drive® data files, which were
automatically generated and saved at the end of each driving scenario run. All data were
transferred to an Excel spreadsheet (Microsoft Office 2013) to increase the ease with which the
data were analyzed. Some variables of interest were computed automatically by the STISIM
Drive® software, including: length of run, number of speed exceedances (i.e. driving >5 km/h),
number of centre line crossings, number of road edge excursions, the percentage of time spent
out of the legal driving lane, and the percentage of time spent over the posted speed limit. Other
variables were computed in excel including: number of collisions (i.e. the sum of pedestrians hit,
vehicles hit, and off-road collisions), number of stop signs missed (i.e. failing to come to a stop
at an intersection controlled by a stop sign), total number of errors (i.e. the sum of the individual
errors across each scenario), standard deviation in speed, and number of errors (centre line
crossings, road edge excursions, and collisions) during each turning condition (per one right turn,
per one left turn, per one left turn with traffic) throughout each scenario.
In the current study, the number of turning errors were reported as the average number of errors
committed per one turn of each turning condition (i.e. average number of errors committed per
one right turn, per one left turn, per one left turn with traffic, and per one turn in general). This
was calculated by determining the number of errors committed by each participant during right

55
turns, left turns, left turns with traffic, and all turns (Value 1). Second, the number of right turns,
left turns, left turns with traffic, and total turns correctly executed by each participant was
calculated (Value 2). For each turning condition, the number of errors per one turn was
calculated by dividing Value 1 by Value 2. Finally, the number of errors per one turn was
averaged for the control group and the MCI patient group. The reason for this calculation was
two-fold: (1) there is a disproportionate representation of each turning type across the scenarios
(i.e. the total number of right turns, left turns, and left turns with traffic is not consistent). (2)
Some participants missed turns (i.e. went straight through the intersection) or turned in the
incorrect direction (e.g. turned right instead of left). As a result, the total number of “correctly
executed” turns (i.e. right turns, left turns, left turns with traffic, total turns) was variable across
participants. Thus, the average number of errors committed per one turn of each type was
calculated to provide the most accurate measure of turning errors.
All variables of interest were merged for Full Scenario 1 and Full Scenario 2 because the
scenarios were highly similar in terms of driving tasks and length of run. Thus, errors were
summed across the two scenarios.
3.1.4.2 Cognitive and Demographic Data Extraction
All cognitive and demographic data were scored and extracted into Excel spreadsheets. The
TMT-A and TMT-B errors and time, MoCA total score and subscores, and demographic
variables (i.e. age, sex, years of education, driving habits), were extracted manually from each
participant’s case report form (CRF). The UFOV was administered and scored using dedicated
computer software. Thus, scores for each subtest (i.e. Processing Speed, Divided Attention, and
Selective Attention) were automatically generated for each participant.
56
3.1.4.3 Statistical Analyses Using Statistical Package for the Social Sciences
(SPSS) Software
All variables (i.e. driving simulator, demographic, and cognitive) were separated into MCI
patient (i.e. including all MCI patients, patients with sd-MCI, and patients with md-MCI) and
healthy control groups. The means and standard deviations of each variable above were
computed for both the MCI groups and the healthy control group. All data were analyzed using
SPSS software (IBM SPSS Statistics Version 23, 64-bit edition). The Kolmogorov-Smirnov test
was used to assess the normality of each continuous variable of interest. Based on the results of
the normality tests as well as homogeneity of variance, analyses comparing patients with MCI
and healthy controls were run using an independent samples t-test (i.e. for normally distributed
data, homogeneity of variance) or the Mann-Whitney U test (i.e. for not normally distributed
data, no homogeneity of variance). In addition, all analyses comparing sd-MCI patients and md-
MCI patients with healthy controls were run using a one-way ANOVA (i.e. for normally
distributed data, homogeneity of variance) or the Kruskal–Wallis H test (i.e. i.e. for not normally
distributed data, no homogeneity of variance), followed by post-hoc testing, with Bonferroni
corrections for two comparisons (i.e. sd-MCI versus healthy controls and md-MCI versus healthy
controls). For nominal data (e.g. sex), chi-square analyses with Bonferroni corrections were run.
Most variables were not normally distributed (i.e. skewed distribution, small sample size) and,
thus, more conservative, non-parametric tests were utilized for the majority of the variables in
the current study.
Although the primary use of cognitive data was to compare the performance of patients with
MCI and healthy controls, a secondary correlation analysis was run to determine whether the
TMT-A, TMT-B, MoCA and UFOV were associated with simulated driving performance.
Specifically, TMT-A time, TMT-B time, MoCA total score, UFOV Processing Speed, UFOV
Divided Attention, and UFOV Selective Attention were correlated using the Spearman Rank
Correlation (i.e. a non-parametric test of correlations), with total simulated driving errors (i.e.
sum of collisions, stop signs missed, speed exceedances, centre line crossings, road edge
excursions) and number of centre line crossings.

57
3.2 Results
In total, 27 patients with MCI and 25 healthy controls were recruited for the current study. Five
patients with MCI (18.5%) and five healthy control drivers (20.0%) were unable to complete the
driving simulation due to simulator sickness. Therefore, one group (i.e. patients and controls)
was not disproportionally affected by simulator sickness. Although reported rates of simulator
sickness are quite variable across studies, the rates observed were consistent with ranges of
simulator sickness reported in the literature (10-80%; Mullen et al., 2010). Thus, the driving and
cognitive performance of 22 patients with MCI and 20 healthy control participants were
compared.
3.2.2 Demographic and Cognitive Presentation
As reported in Table 3.1 (Demographic Information, section 3.1.2), patients with MCI (including
all MCI patients, sd-MCI patients, and md-MCI patients) did not significantly differ from healthy
controls in terms of mean age, mean education, or sex frequency. Patients with MCI reported a
similar number of years of driving experience (45.9 vs. 44.3), number of hours driving per week
(6.1 vs. 6.8), and accidents (1.7 vs. 1.8) as healthy control participants. Furthermore, there was
no significant difference between the MCI subtypes (i.e. sd-MCI and md-MCI) and healthy
control participants across all self-reported driving variables (Table 3.2). Parametric tests were
used when data were normally distributed and there was homogeneity of variance (i.e.
independent samples t-test, one-way ANOVA); in cases where these assumptions were violated,
non-parametric tests were used (i.e. Mann-Whitney U, Kruskal Wallis).
The MoCA results of participants are reported below in Table 3.3. Overall, patients with MCI
performed worse than healthy control participants on the overall score of the MoCA (23.9 vs.
27.9, U = 15.00, p < 0.001), the visuospatial executive subscore of the MoCA (3.8 vs. 4.5, U =
100.5, p = 0.013), the attention subscore of the MoCA (5.1 vs. 5.9, U = 93.50, p = 0.007), and the
memory delayed recall subscore of the MoCA (2.4 vs. 4.3, U = 67.00, p<0.001). The Kruskal

58
Wallis H Test revealed a significant difference between MCI subtypes and healthy controls on
total MoCA score (X2 = 24.053, p < 0.001) as well as the visuospatial/executive (X2 = 7.136, p =
0.028), attention (X2 = 9.684, p = 0.008), abstraction (X2 = 10.206, p = 0.006), and memory
delayed recall (X2 = 12.478, p = 0.002) subscores of the MoCA. Post-hoc testing revealed that
patients with sd-MCI performed significantly worse than healthy controls on the MoCA overall
(24.1 vs. 27.9, U = 5.50, p < 0.001) and the memory delayed recall portion of the MoCA (2.2 vs.
4.3, U = 30.50, p = 0.004). Furthermore, patients with md-MCI performed significantly worse
than controls on the MoCA overall (23.7 vs. 27.9, U = 9.50, p < 0.001) as well as the attention
(5.0 vs. 5.9, U = 42.00, p = 0.03), abstraction (1.2 vs. 1.9, U = 43.00, p = 0.034), and the delayed
recall (2.6 vs. 4.3, U = 36.50, p = 0.012) subscores of the MoCA. Although patients with md-
MCI tended to perform worse than healthy controls on the visuospatial/executive subscore of the
MoCA, results did not maintain significance after adjusting for multiple comparisons (3.6 vs.
4.5, p = 0.074).
As expected, patients with sd-MCI (i.e. amnestic single domain impairment) performed
significantly worse compared to healthy controls on the memory delayed recall domain of the
MoCA, but not on other the other domains (i.e. attention, visuospatial/executive, abstraction,
language, etc.). Furthermore, patients with md-MCI (i.e. amnestic domain MCI with impairment
in additional cognitive domains) performed significantly worse compared to healthy controls on
the abstraction and attention domains, in addition to the memory delayed recall domain.
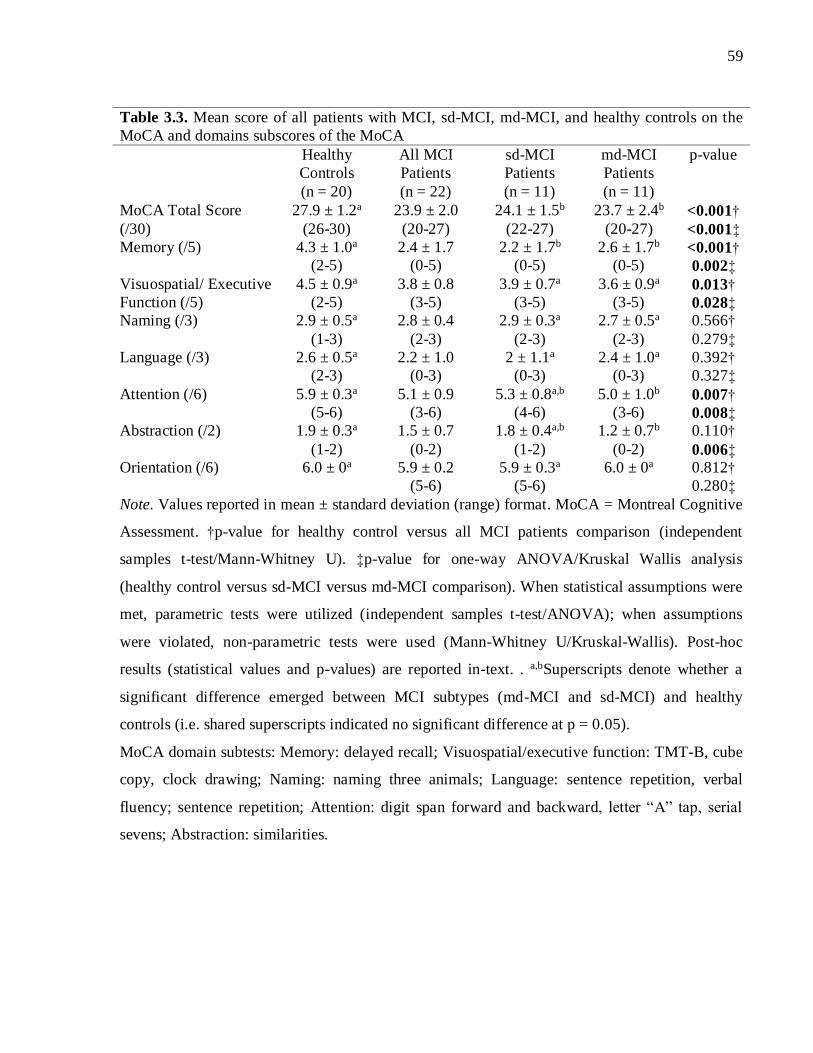
59
Table 3.3. Mean score of all patients with MCI, sd-MCI, md-MCI, and healthy controls on the
MoCA and domains subscores of the MoCA
Healthy
Controls
(n = 20)
All MCI
Patients
(n = 22)
sd-MCI
Patients
(n = 11)
md-MCI
Patients
(n = 11)
p-value
MoCA Total Score
(/30)
27.9 ± 1.2a
(26-30)
23.9 ± 2.0
(20-27)
24.1 ± 1.5b
(22-27)
23.7 ± 2.4b
(20-27)
<0.001†
<0.001‡
Memory (/5)
4.3 ± 1.0a
(2-5)
2.4 ± 1.7
(0-5)
2.2 ± 1.7b
(0-5)
2.6 ± 1.7b
(0-5) <0.001†
0.002‡
Visuospatial/ Executive
Function (/5)
4.5 ± 0.9a
(2-5)
3.8 ± 0.8
(3-5)
3.9 ± 0.7a
(3-5)
3.6 ± 0.9a
(3-5) 0.013†
0.028‡ Naming (/3) 2.9 ± 0.5a
(1-3)
2.8 ± 0.4
(2-3)
2.9 ± 0.3a
(2-3)
2.7 ± 0.5a
(2-3)
0.566†
0.279‡
Language (/3)
2.6 ± 0.5a
(2-3)
2.2 ± 1.0
(0-3)
2 ± 1.1a
(0-3)
2.4 ± 1.0a
(0-3)
0.392†
0.327‡
Attention (/6)
5.9 ± 0.3a
(5-6)
5.1 ± 0.9
(3-6)
5.3 ± 0.8a,b
(4-6)
5.0 ± 1.0b
(3-6) 0.007†
0.008‡ Abstraction (/2)
1.9 ± 0.3a
(1-2)
1.5 ± 0.7
(0-2)
1.8 ± 0.4a,b
(1-2)
1.2 ± 0.7b
(0-2)
0.110†
0.006‡ Orientation (/6)
6.0 ± 0a
5.9 ± 0.2
(5-6)
5.9 ± 0.3a
(5-6)
6.0 ± 0a
0.812†
0.280‡
Note. Values reported in mean ± standard deviation (range) format. MoCA = Montreal Cognitive
Assessment. †p-value for healthy control versus all MCI patients comparison (independent
samples t-test/Mann-Whitney U). ‡p-value for one-way ANOVA/Kruskal Wallis analysis
(healthy control versus sd-MCI versus md-MCI comparison). When statistical assumptions were
met, parametric tests were utilized (independent samples t-test/ANOVA); when assumptions
were violated, non-parametric tests were used (Mann-Whitney U/Kruskal-Wallis). Post-hoc
results (statistical values and p-values) are reported in-text. . a,bSuperscripts denote whether a
significant difference emerged between MCI subtypes (md-MCI and sd-MCI) and healthy
controls (i.e. shared superscripts indicated no significant difference at p = 0.05).
MoCA domain subtests: Memory: delayed recall; Visuospatial/executive function: TMT-B, cube
copy, clock drawing; Naming: naming three animals; Language: sentence repetition, verbal
fluency; sentence repetition; Attention: digit span forward and backward, letter “A” tap, serial
sevens; Abstraction: similarities.

60
The results from the remaining cognitive tests and questionnaires are reported below in Table
3.4. Overall, patients with MCI performed significantly slower compared to healthy controls on
TMT-A (35.2 s vs. 23.0 s, U = 92.00, p = 0.017) and TMT-B (88.3 s vs. 51.9 s, U = 93.00, p =
0.018). Performance on the subtests of the UFOV, TMT-A errors TMT-B errors, HADS Anxiety,
HADS depression, and HADs Total (Anxiety + Depression) did not significantly differ between
MCI patients and controls. The one-way ANOVA and Kruskal Wallis H Test analyses revealed a
significant difference between MCI subtypes and healthy controls on TMT-A time (X2 = 8.563, p
= 0.014), TMT-B time (X2 = 7.459, p = 0.024), HADS Anxiety (F = 4.483, p = 0.021), HADS
Depression (F = 7.515, p = 0.003), and HADS Total (X2 = 8.641, p = 0.013). Post-hoc analyses
demonstrated that patients with sd-MCI did not perform significantly worse than healthy controls
on any of the above measures. In contrast, patients with md-MCI performed significantly worse
than healthy controls on TMT-A time (41.5 s vs. 23.0 s, U = 34.00, p = 0.008), TMT-B time
(111.9 s vs. 51.9 s, U = 38.00, p = 0.016), HADS Anxiety (8.0 vs. 4.0, p = 0.020), HADS
Depression (5.9 vs 2.8, p = 0.014), and HADS Total (13.9 vs. 6.8, U = 23.00, p = 0.016). Despite
this tendency for patients with md-MCI to perform worse than healthy controls on the HADS,
with two patients scoring in the “abnormal” range on HADS Anxiety, all cases of clinical anxiety
and depression were deemed and confirmed to be stable by the referring geriatric psychiatrist.

61
Table 3.4. Mean score of all patients with MCI, sd-MCI, md-MCI, and healthy controls on the
TMT-A, TMT-B, UFOV, and HADS
Healthy
Controls
(n = 20)
All MCI
Patients
(n = 22)
sd-MCI
Patients
(n = 11)
md-MCI
Patients
(n = 11)
p-value
TMT-A time (s)
23.0 ± 5.8a
(11.1-32.8)
35.2 ± 21.0
(15.8-109.0)
27.6 ± 10.5a,b
(18.5-52.4)
41.5 ± 25.6b
(15.8-109)
0.017†
0.014‡ TMT-A errors
0 ± 0a
0.1 ± 0.4
(0-1)
0.1 ± 0.3a
(0-1)
0.2 ± 0.4a
(0-1)
0.442†
0.221‡
TMT-B time (s)
51.9 ± 23.6a
(25.9-107.5)
88.3 ± 71.8
(36.3-320.0)
59.4 ± 19.6a,b
(36.3-89.45)
111.9 ± 90.1b
(41.7-320) 0.018†
0.012‡ TMT-B errors
0.5 ± 0.8a
(0-3)
0.5 ± 1.1
(0-5)
0.2 ± 0.4a
(0-1)
0.8 ± 1.5a
(0-5)
0.988†
0.514‡
UFOV
Processing Speed
24.2 ± 16.4a
(17-87)
40.0 ± 54.1
(17-213)
25.1 ± 11.3a
53.5 ± 73.0a
(17-213)
0.199†
0.425‡
UFOV Divided
Attention
62.6 ± 65.7a
(17-257)
143.9 ± 148.5
(17-500)
91.6 ± 65.3a
(17-47)
191.4 ±
187.2a
(17-500)
0.091†
0.236‡
UFOV Selective
Attention
167.8 ± 95.9a
(47-420)
226.2 ± 126.4
(57-500)
268.1 ±
128.1a
(57-500)
173.9 ±
109.9a
(63-417)
0.121†
0.061‡
HADS Anxiety
4.0 ± 2.4a
(0-9)
6.5 ± 4.4
(0-16)
4.0 ± 2.3a,b
(1-7)
8.0 ± 4.8b
(0-16)
0.079†
0.021‡ HADS
Depression
2.8 ± 2.5a
(0-9)
4.4 ± 2.8
(0-9)
2.0 ± 1.5a,b
(0-4)
5.9 ± 2.3b
(3-9)
0.104†
0.003‡
HADS Total
6.8 ± 4.4a
(0-18)
10.8 ± 6.7
(0-23)
5.7 ± 3.6a,b
(0-10)
13.9 ± 6.3b
(4-23)
0.092†
0.013‡ Note. Values reported in mean ± standard deviation (range) format. HADS = Hospital Anxiety
and Depression Scale; TMT = Trail Making Test; UFOV = Useful Field of View. †p-value for
healthy control versus all MCI patients comparison (independent samples t-test/Mann-Whitney
U). ‡p-value for one-way ANOVA/Kruskal Wallis analysis (healthy control versus sd-MCI
versus md-MCI comparison). When statistical assumptions were met, parametric tests were
utilized (independent samples t-test/ANOVA); when assumptions were violated, non-parametric
tests were used (Mann-Whitney U/Kruskal-Wallis). Post-hoc results (statistical values and p-
values) are reported in-text. . a,bSuperscripts denote whether a significant difference emerged
between MCI subtypes (md-MCI and sd-MCI) and healthy controls (i.e. shared superscripts
indicated no significant difference at p = 0.05).

62
3.2.3 Driving Simulator Performance
3.2.3.1 Experimental Driving Scenarios (Full Scenario 1 & Full Scenario 2)
Driving Performance of Patients all Patients with MCI
The first aim of this study was to investigate and identify the driving behaviours characteristic of
patients with MCI (n = 22) as a whole (i.e. combining all subtypes of MCI together) by
identifying areas and degrees of impairment relative to healthy control drivers (n = 20).
Table 3.5 lists a summary of the main results of Full Scenario 1 and Full Scenario 2. Parametric
tests were used when data were normally distributed and there was homogeneity of variance (i.e.
independent samples t-test); in cases where these assumptions were violated, non-parametric
tests were used (i.e. Mann-Whitney U). On average, it took approximately 24 minutes for healthy
control participants (24.25 minutes) and MCI patients (24.31 minutes) to complete Full Scenario
1 and 2. The Mann-Whitney U test revealed that patients with MCI committed significantly more
errors over the simulated driving run (i.e. the sum of collisions, centre line crossings, road edge
excursions, stop signs missed, speed exceedances) compared to healthy control drivers (20.0 vs.
9.9, U = 123.00, p = 0.014). However, the only individual errors that reached statistical
significance were related to lane maintenance. Patients with MCI committed significantly more
centre line crossings (5.4 vs. 1.9, U = 132.50, p = 0.025) and spent a significantly greater
percentage of time out of the legal driving lane (2.3 vs. 0.3, U = 115.00, p = 0.008) compared to
healthy control drivers (Figure 3.1).

63
Table 3.5. Driving simulator results of Full Scenario 1 & Full Scenario 2 for patients with
MCI and controls
Healthy Controls
(n = 20)
All MCI Patients
(n = 22)
p-value
Collisions
0.3 ± 0.7
(0-2)
0.9 ± 2.1
(0-10)
0.332
Speed exceedances
6.2 ± 5.4
(0-18)
7.5 ± 4.9
(0-17)
0.276
Centre line crossings
1.9 ± 2.1
(0-7)
5.4 ± 9.2
(0-45) 0.025
Road edge excursions
0.4 ± 0.8
(0-2)
3.9 ± 9.0
(0-36)
0.131
Stop signs missed
1.0 ± 1.4
(0-4)
2.3 ± 2.1
(0-7)
0.051
Total errors
9.9 ± 5.1
(1-19)
20.0 ± 20.7
(2-104)
0.014
% time out of the legal
driving lane
0.3 ± 0.4
(0-1.7)
2.3 ± 5.7
(0-26.2) 0.008
% time over the speed
limit
2.1 ± 2.0
(0-7.49)
2.7 ± 2.1
(0.1-7.8)
0.326
SD in speed
16.2 ± 6.1
(4.8-23.4)
19.8 ± 1.6
(17.3-22.4)
0.078
Right turn errors*
0.07 ± 0.11
(0-0.33)
0.13 ± 0.15
(0-0.5)
0.195
Left turn errors*
0.04 ± 0.09
(0-0.25)
0.12 ± 0.22
(0-0.75)
0.246
Left turn + traffic errors*
0.07 ± 0.08
(0-0.25)
0.13 ± 0.22
(0-0.75)
0.284
Total turning errors*
0.07 ± 0.06
(0-0.21)
0.13 ± 0.15
(0-0.7)
0.083
Note. Values reported in mean ± standard deviation (range) format. SD = standard deviation;
Total errors = sum of collisions, speed exceedances, centre line crossings, road edge excursions,
and stop signs missed. *turning errors include: collisions, centre line crossings, road edge
excursions.

64
Figure 3.2. Maintenance of proper lane positioning across patients with MCI and healthy
controls in terms of average (A) number of centre line crossings and (B) percentage of time out
of the legal driving lane. A significant difference was found between patients with MCI and
healthy controls across both variables. Standard errors are represented in the figure by the error
bars attached to each column. *p<0.05, **p<0.01.
Although results did not reach statistical significance for the remaining individual error types
(i.e. road edge excursions, stop signs missed, speed exceedances, percentage of time over the
posted speed limit, and standard deviation in speed), patients with MCI committed each type of
error more than healthy control participants, and the within-group variability (i.e. the standard
deviation) of the MCI group was high across all variables of interest.
Patients with MCI committed almost twice as many turning errors as healthy control drivers
(0.13 vs. 0.07 errors per turn); however, these results did not reach statistical significance.
Furthermore, although patients with MCI committed more errors than healthy controls across all
driving conditions, including right turns (0.13 vs. 0.07 errors per turn), left turns (0.12 vs. 0.04
65
errors per turn), and left turns with traffic (0.20 vs. 0.07 errors per turn), these results also did not
reach statistical significance.
Driving Performance of Patients with sd-MCI and md-MCI
Given the heterogeneous presentation of MCI and that patients can demonstrate varying areas
and degrees of cognitive impairment, the second aim of the study was to investigate whether
certain areas and degrees of simulated driving impairment were characteristic of two prominent
subtypes of MCI – individuals with amnestic sd-MCI (n = 11) and individuals with amnestic md-
MCI (n = 11). The simulated driving performance of these subtypes was compared to that of
cognitively healthy control drivers (n = 20). Parametric tests were used when data were normally
distributed and there was homogeneity of variance (i.e. one-way ANOVA); in cases where these
assumptions were violated, non-parametric tests were used (i.e. Kruskal-Wallis test).
Please refer to Figure 3.2 below for a comparison of total driving errors across healthy controls,
all patients with MCI, patients with sd-MCI, and patients with md-MCI. The Kruskal-Wallis test
revealed a significant difference between MCI subtypes and healthy controls in the number of
total driving errors committed (X2 = 6.769, p = 0.034), centre line crossings committed (X2 =
8.141, p = 0.017), and percentage of time out of the legal driving lane (X2 = 8.206, p = 0.017).
Post-hoc testing revealed that patients with sd-MCI did not perform significantly worse than
healthy control drivers on any driving variable of interest. In contrast, patients with md-MCI
committed significantly more errors overall (25.4 vs. 9.9, p = 0.024), more centre line crossings
(8.2 vs. 1.9, p = 0.010), and spent a greater amount of time out of the legal driving lane (3.9 vs.
0.3, p = 0.010) compared to controls. These results suggest that the significant results found
between MCI patients as a whole compared to healthy controls (i.e. lane maintenance behaviour,
total driving errors) was likely driven by differences between the md-MCI group and healthy
controls.

66
Figure 3.3. Average number of driving errors (collisions + centre line crossings + speed
exceedances + road edge excursions + stop signs missed) across all patients with MCI, patients
with sd-MCI, patients with md-MCI, and healthy controls. A significant difference was found
between all MCI and healthy controls and with md-MCI and healthy controls, but not sd-MCI
and healthy controls. This suggest the significant difference found between MCI patients as a
whole and healthy controls was driver by the md-MCI group and not the sd-MCI group. Standard
errors are represented in the figure by the error bars attached to each column. *p<0.05.
Please refer to Figure 3.3 for a comparison of turning errors across healthy controls, patients with
sd-MCI, and patients with md-MCI. When investigating turning behaviour, the Kruskal-Wallis
test demonstrated a significant difference between MCI subtypes and healthy controls on average
number of errors committed during more cognitively demanding left turns with traffic (X2 =
9.731, p = 0.008), but not more routine right turns (X2 = 3.850, p = 0.146) and left turns (X2 =
1.345, p = 0.510). The results of post-hoc testing revealed that patients with md-MCI committed
significantly more errors than controls during left turns with traffic (0.21 vs. 0.07 errors per turn,
p = 0.028); however, patients with sd-MCI committed a similar number of errors as controls

67
during left turns with traffic (0.04 vs. 0.07 errors per turn, p = 0.451). A summary of the main
variables of interest for the control versus MCI subtype analysis across Full Scenario 1 and Full
Scenario 2 is reported in Table 3.6 below.
Figure 3.4. Average number of errors (collisions + centre line crossings + road edge excursions)
per turn across right turns, left turns, left turns with traffic, and all types of turns for healthy
control participants, patients with sd-MCI, and patients with md-MCI. A significant difference
was found between patients with md-MCI and healthy controls on the number of errors
committed during left turns with traffic. No significant difference was found between patients
with sd-MCI and healthy controls across any turning condition. Standard errors are represented
in the figure by the error bars attached to each column. *p<0.05.

68
Table 3.6. Driving simulator results of Full Scenario 1 & Full Scenario 2 for patients with
sd-MCI, patients with md-MCI, and controls
Healthy
Controls
(n = 20)
sd-MCI
Patients
(n = 11)
md-MCI
Patients
(n = 11)
p-value
Collisions
0.3 ± 0.7a
(0-2)
0.4 ± 0.5a
(0-1)
1.4 ± 2.9a
(0-10)
0.485
Speed
exceedances
6.2 ± 5.4a
(0-18)
8.6 ± 5.4a
(1-17)
6.4 ± 4.4a
(1-13)
0.377
Centre line
crossings
1.9 ± 2.1a
(0-7)
2.6 ± 2.4a,b
(0-8)
8.2 ± 12.5b
(0-45)
0.017
Road edge
excursions
0.4 ± 0.8a
(0-2)
1.2 ± 1.9a
(0-6)
6.6 ± 12.3a
(0-36)
0.278
Stop signs missed
1.0 ± 1.4a
(0-4)
1.9 ± 2.2a
(0-6)
2.7 ± 2.1a
(0-7)
0.082
Total errors
9.9 ± 5.1a
(1-19)
14.7 ± 7.8a,b
(5-28)
25.4 ± 27.9b
(2-104)
0.034
% time out of the
legal driving lane
0.3 ± 0.4a
(0-1.7)
0.7 ± 0.7a,b
(0-2.1)
3.9 ± 7.8b
(0-26.2) 0.017
% speed over the
speed limit
2.1 ± 2.0
(0-7.49)
3.2 ± 2.0
(0.4-6.5)
2.1 ± 2.2
(0.1-7.8)
0.162
SD in speed 16.2 ± 6.1
(4.8-23.4)
20.4 ± 1.4
(17.7-22.4)
19.2 ± 1.5
(17.3-21.8)
0.067
Right turn errors*
0.07 ± 0.11a
(0-0.33)
0.09 ± 0.13a
(0-0.33)
0.17 ± 0.15a
(0-0.5)
0.146
Left turn errors*
0.04 ± 0.09a
(0-0.25)
0.11 ± 0.20a
(0-0.5)
0.12 ± 0.24a
(0-0.75)
0.510
Left turn + traffic
errors*
0.07 ± 0.08a
(0-0.25)
0.04 ± 0.06a,b
(0-0.12)
0.21 ± 0.21b
(0-0.75)
0.008
Total turning
errors*
0.07 ± 0.06a
(0-0.21)
0.08 ± 0.06a
(0-0.17)
0.18 ± 0.19a
(0.04-0.7)
0.061
Note. Values reported in mean ± standard deviation (range) format. SD = standard deviation;
Total errors = sum of collisions, speed exceedances, centre line crossings, road edge excursions,
and stop signs missed. p-value reported for one-way ANOVA/Kruskal Wallis analysis. When
statistical assumptions were met, parametric tests were utilized (ANOVA); when assumptions
were violated, non-parametric tests were used (Kruskal-Wallis). Post-hoc results (statistical
values and p-values) are reported in-text. . a,bSuperscripts denote whether a significant difference
emerged between MCI subtypes (md-MCI and sd-MCI) and healthy controls (i.e. shared
superscripts indicated no significant difference at p = 0.05). *turning errors include: collisions,
centre line crossings, road edge excursions.
69
One participant with MCI (participant 8) differed from the group and was potentially an “outlier”
in terms of the total number of errors committed (i.e. 104 errors versus a group average of 20.0)
as well as number of centre line crossings committed (i.e. 45 centreline crossing versus a group
average of 5.4), and thus may have had greater difficulty than the remainder of the group in
terms of simulator performance. However, this individual (1) did not differ from the group
cognitively or in terms of mood (anxiety or depression), did not have any visual disturbances, or
present with any co-morbidities of concern, (3) did not self-report greater difficulty with real-
world driving performance or the simulated driving session and held a valid driver’s license, and
(4) all driving simulator results remained significant (including analyses comparing: MCI
patients vs. controls, sd-MCI vs. controls, md-MCI vs. controls). Thus, we opted to (and were
justified in) keep this individual’s data in the analysis. Note that this individual did not
participate in the fMRI portion of the study (i.e. Chapter 4 of the current thesis) as the participant
stated that he/she does not enjoy undergoing MRI scans.
3.2.3.2 Associations between Cognitive Test Scores and Driving Errors in
Patients with MCI
The primary purpose for administering the cognitive tests was to report and compare the scores
of patients with MCI and healthy controls. A secondary analysis was run to assess the
relationship between scores on cognitive tests and driving performance, including the mean
completion times for TMT-A and TMT-B as well as the mean scores of the UFOV subtests (i.e.
Processing Speed, Divided Attention, and Selective Attention) and MoCA total score. These
scores were correlated with mean number of total errors and number of centre line crossings
committed by patients with MCI. Given that the correlation analyses were a secondary aim of the
study, total errors and number of centre line crossings were selected retrospectively, given that
these were the two areas of driving in which patients with MCI performed worse compared to
controls. Results are reported below in Table 3.7. Results of the Spearman rank correlation
coefficient suggested a significant association between total driving errors and TMT-A time (rs =
.448, p = 0.048), UFOV Processing Speed (rs = 0.516, p = 0.017), and UFOV Divided Attention
(rs = .511, p = 0.018) in patients with MCI. Among patients with sd-MCI, results revealed a
significant correlation between UFOV Processing Speed and total driving errors (rs = .773, p =
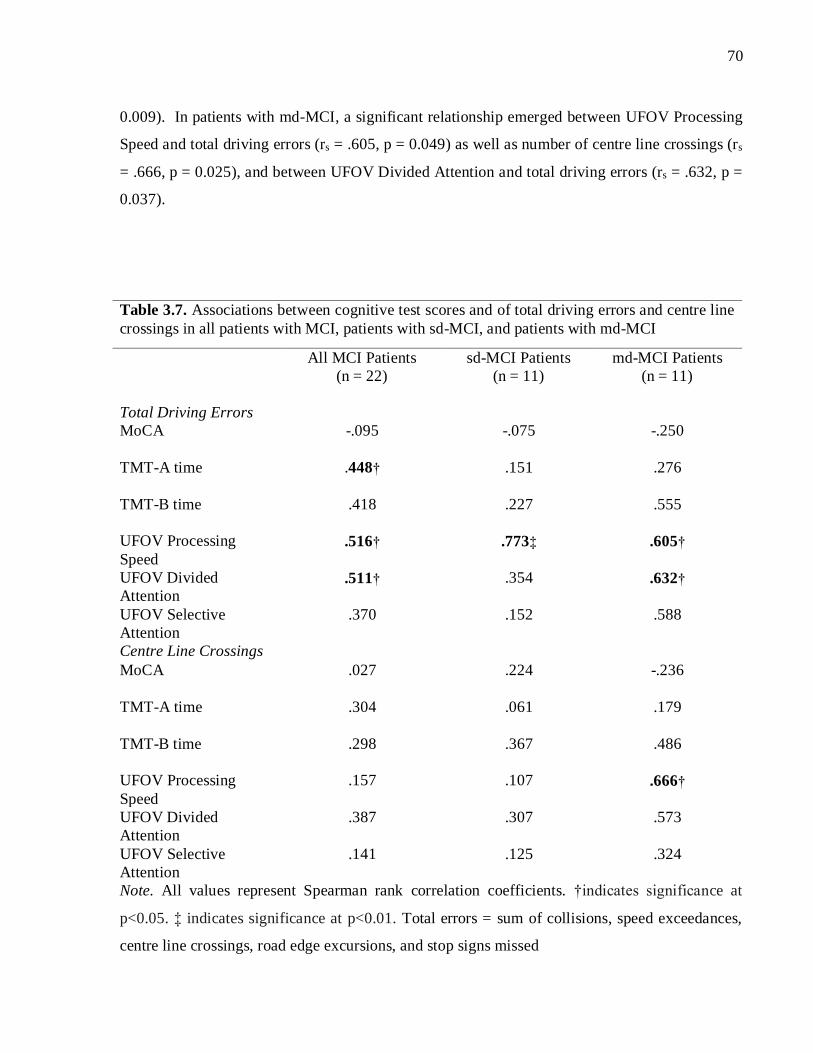
70
0.009). In patients with md-MCI, a significant relationship emerged between UFOV Processing
Speed and total driving errors (rs = .605, p = 0.049) as well as number of centre line crossings (rs
= .666, p = 0.025), and between UFOV Divided Attention and total driving errors (rs = .632, p =
0.037).
Table 3.7. Associations between cognitive test scores and of total driving errors and centre line
crossings in all patients with MCI, patients with sd-MCI, and patients with md-MCI
All MCI Patients
(n = 22)
sd-MCI Patients
(n = 11)
md-MCI Patients
(n = 11)
Total Driving Errors
MoCA
-.095 -.075 -.250
TMT-A time
.448† .151 .276
TMT-B time
.418 .227 .555
UFOV Processing
Speed
.516† .773‡ .605†
UFOV Divided
Attention .511† .354 .632†
UFOV Selective
Attention
.370 .152 .588
Centre Line Crossings
MoCA
.027 .224 -.236
TMT-A time
.304 .061 .179
TMT-B time
.298 .367 .486
UFOV Processing
Speed
.157 .107 .666†
UFOV Divided
Attention
.387 .307 .573
UFOV Selective
Attention
.141 .125 .324
Note. All values represent Spearman rank correlation coefficients. †indicates significance at
p<0.05. ‡ indicates significance at p<0.01. Total errors = sum of collisions, speed exceedances,
centre line crossings, road edge excursions, and stop signs missed

71
3.3 Discussion
Results from the current study confirm the results of previous research (Devlin et al., 2012;
Frittelli et al., 2009; Kawano et al., 2012; Wadley et al., 2009), which suggest that patients with
MCI demonstrate difficulty during some aspects of driving, including lane maintenance (Wadley
et al., 2009), whereas patients are able to maintain performance at a relatively equivalent level to
controls during other aspects of driving. Furthermore, this represents the first study to identify
driving behaviours that may be characteristic of two prominent subtypes of MCI, those with
amnestic single-domain impairment and those with amnestic multiple-domain impairment. The
results of the current study found specific differences in simulated driving performance between
these two subtypes of MCI, demonstrating that patients with md-MCI may exhibit greater
driving difficulty than patients with sd-MCI, relative to healthy controls, in general, as well as
during more cognitively demanding aspects of driving. Furthermore, the driving performance of
certain subtypes of MCI (i.e. in the case of the current study, the md-MCI group), may be
responsible for the results when you look at the group as a whole (i.e. all patients with MCI
together). A discussion specific to each of the hypotheses outlined at the beginning of this thesis
(Chapter 2, section 2.2) is detailed below.
3.3.1 Hypothesis 1: Total Errors in Patients with MCI
The results of the current study showed that patients with MCI committed over twice as many
simulated driving errors compared to healthy controls (mean = 20.0 vs. 9.9 errors; includes
collisions, centre line crossings, road edge excursions, stop signs missed, and speed
exceedances). These results are congruent with the first hypothesis outlined in Chapter 2, which
predicted that patients with MCI would demonstrate a greater number of total errors than healthy
control drivers. However, although patients with MCI committed all types of individual error
more than healthy control participants (e.g. collisions, speed exceedances, stop signs missed,
centre line crossings, road edge excursions), these results did not reach statistical significance,
with the exception of centre line crossings.
72
Thus, results revealed that the patients with MCI in the current sample had particular difficulty in
terms of lane control, as patients with MCI performed significantly worse compared to controls
across two separate measures of lane maintenance: number of centre line crossings and
percentage of time spent out of the legal driving lane. These findings are consistent with previous
research investigating the on-road driving performance of patients with MCI (Wadley et al.,
2009). Specifically, Wadley and colleagues (2009) evaluated the on-road performance of 46
patients with MCI and 56 healthy controls. Results suggested that patients with MCI may
demonstrate impairment across aspects of driving similar to those identified in the current study,
including global rating of driving performance and lane control (Wadley et al., 2009), which
were evaluated on a 5-point Likert scale (1= evaluator took control of the car, 2 = unsafe, 3 =
unsatisfactory, 4 = not optimal, 5 = optimal) by a certified driving rehabilitation specialist.
Furthermore, this finding that patients may be at risk for difficulty in lane control is particularly
important, as Ott and colleagues (2012) previously identified that maintenance of proper lane
position emerged as a factor critical to safe driving during naturalistic driving involving older
adults both with and without cognitive impairment.
3.3.2. Hypothesis 2: Turning Errors in Patients with MCI
Given the subtle nature of the cognitive deficits that are associated with MCI, it was expected
that patients would be able to maintain performance during less cognitively demanding aspects
of driving, such as right turns, but not during more demanding aspects of driving, such as left
turns with oncoming traffic, which require a more extensive set of cognitive and brain resources
(Callan et al., 2009; Schweizer et al., 2013).
The results of the current study did not support the above hypothesis. Although patients with
MCI committed approximately twice as many simulated driving errors as controls during right
turns and approximately three times as many simulated driving errors as controls during left
turns, both with and without traffic, results did not reach statistical significance. Again, similar
results were obtained during an on-road assessment (Wadley et al., 2009). Wadley and
colleagues (2009) rated performance (i.e. from not optimal to optimal) of patients with MCI

73
during right turns and left turns (not specified whether this included turns with and/or without
traffic). Results suggested that patients with MCI were not more likely to receive a less than
optimal rating than healthy control drivers during right turns. Patients with MCI were more likely
to receive a less than optimal rating compared to controls during the left turn condition; however,
after adjusting for age and sex, this result was no longer statistically significant (Wadley et al.,
2009).
The results reported by Wadley and colleagues (2009) for the left turn condition, as well as the
left turn results of the current study, did not reach statistical significance likely due to the high
degree of cognitive, and consequently driving performance, variability inherently present within
the MCI population. This variability within the MCI group is likely the result of one key factor,
which is the inherent heterogeneous presentation of MCI. Specifically, patients with MCI can
present with varying degrees and areas of cognitive impairment, which likely translate to varying
degrees and areas of driving impairment. Thus, it could be that certain patients within the MCI
population, and certain subtypes of MCI, demonstrate deficits in certain aspects of driving
relative to cognitively healthy drivers, particularly more cognitively demanding aspects of
driving (e.g. left turns with oncoming traffic). Conversely, other subtypes may not exhibit
increased impairments at all, or exhibit impairments during different aspects of driving. For
example, those with amnestic sd-MCI may be able to maintain driving performance comparably
well to healthy controls, whereas those with md-MCI, who exhibit impairment in cognitive
domains that have been repeatedly shown to be implicated in safe driving (e.g. attention,
executive function, visuospatial ability) may exhibit difficulties in driving situations that require
the integration of these functions (e.g. turning at a high traffic intersection). The current study
sought to address this issue by investigating the simulated driving performance of individuals
with amnestic sd-MCI and md-MCI.
3.3.3. Hypothesis 3: Driving Profiles of sd-MCI and md-MCI
Given the heterogeneous cognitive presentation of patients with MCI (Albert et al., 2011;
Petersen, 2004), the current study sought to identify whether the amnestic single-domain and
multiple-domain subtypes of MCI exhibit different areas and degrees of difficulty during

74
simulated driving relative to cognitively healthy adults. To our knowledge, this represents the
first study to investigate the driving impairments (using either on-road or simulated driving
assessments) characteristic of various subtypes of MCI. It was hypothesized that patients with
md-MCI would exhibit greater driving difficulty compared to controls, particularly during more
cognitively demanding aspects of driving (e.g. left turns with traffic) and that patients with sd-
MCI would perform comparably well to controls across the driving variables and conditions of
interest. This prediction was driven by the presence of more widespread cognitive deficits (e.g.
attention, executive function, in addition to memory) that are characteristic of the md-MCI
group. Furthermore, previous research has suggested that patients with md-MCI, particularly
those with memory impairment (i.e. amnestic md-MCI), may be at the greatest risk of functional
decline of all subtypes (K. R. Kim et al., 2009).
The results of the current study confirmed the above hypothesis. Post-hoc testing revealed that
patients with md-MCI committed significantly more overall errors compared to healthy controls
(i.e. collisions, centre line crossings, road edge excursions, stop signs missed, speed
exceedances). Relative to cognitively healthy drivers, patients with md-MCI committed 2.56
times the number of errors during the experimental driving simulation. Specifically, patients with
md-MCI may be at a particularly high risk of driving difficulty in lane control. This is supported
by the results showing that patients with MCI committed over four times as many centre line
crossings as healthy controls and spent a significantly greater percentage of time out of the legal
driving lane compared to controls (3.9% versus 0.3%). In addition, post-hoc analyses revealed
that patients with md-MCI committed significantly more errors than controls during left turns
with traffic. In contrast, patients with sd-MCI did not differ significantly from controls across
any of the driving variables of interest (i.e. total driving errors, collisions, centre line crossings,
turning errors, etc.), results did not reach statistical significance.
The results of the current study suggest that patients with sd-MCI and md-MCI exhibit differing
degrees of driving difficulty during compared to cognitively healthy drivers. Furthermore, the
different patterns of driving behaviour observed between subtypes is masked when you look at
all MCI patients together. When looking at the MCI patient group as a whole, results suggested
that patients with MCI in general may be at risk of driving difficulty, particularly during lane
75
maintenance. However, the subtype analysis revealed, that patients with sd-MCI showed minor
to no difficulties (i.e. results did not reach statistical significance) relative to controls across most
aspects of driving, whereas patients with md-MCI showed more significant difficulties relative to
controls, particularly during lane maintenance (i.e. increased number of centre line crossings and
time out of the legal driving lane) and demanding left turns with traffic (i.e. increased number of
lane deviations and collisions per turn). The discrepant driving profiles that emerged for sd-MCI
and md-MCI patients may be a key factor contributing to the lack of significant results as well as
the apparent variability in the turning analysis conducted for all patients with MCI (sd-MCI +
md-MCI patients). The high degree of within group variability present in this analysis, which
was identified as a factor likely contributing to the lack of significant results for left turns with
traffic condition, is likely the result of combining sd-MCI and md-MCI in the analysis.
3.3.4 Cognitive Associations of Driving Performance
TMT-A was moderately associated (rs = .448) with total driving errors in all patients with MCI
(sd-MCI + md-MCI); UFOV Processing Speed was strongly associated (rs = .516-.773) with
driving errors in patients with MCI (sd-MCI + md-MCI), sd-MCI, and md-MCI; and UFOV
Divided Attention was strongly associated (rs = .511-.632) with driving errors in patients with
MCI (sd-MCI + md-MCI) as well as patients with md-MCI. Previous research has supported the
predictive utility of TMT-A (Grace et al., 2005; Kawano et al., 2012; Ott, Festa, et al., 2008) and
the UFOV (Rizzo et al., 1997; Uc et al., 2006) in predicting driving performance in patients with
AD and MCI, including simulated driving performance (Kawano et al., 2012; Rizzo et al., 1997).
Specifically, Kawano, Iwamoto, Iidaka, and colleagues (2012) reported a significant positive
correlation between TMT-A and performance on a car-following task in patients with a-MCI and
healthy older drivers (a-MCI, n = 12; older adults, n = 26), although it was not specified whether
these patients were single-domain or multiple-domain amnestic. This finding is consistent with
the current results, which suggest a moderate correlation between TMT-A and driving errors in
patients with amnestic single-domain and multiple domain MCI (sd-MCI + md-MCI). Despite
this, other studies have reported small or not significantly significant correlations between TMT-

76
A (Uc et al., 2006) as well as the UFOV (Rizzo et al., 2001; Uc et al., 2005) and driving
performance.
Thus, there a high degree of variability in the results of cognitive predictors of driving
performance within the population of AD and MCI across research studies (Bennett, Chekaluk,
& Batchelor, 2016). This has been reported for both individual tests as well as batteries and
composite scores (Bennett et al., 2016). Due to variability in the results of associations between
cognitive test scores and driving errors in this study and previous research, as well as the lack of
evidence-based cut-off scores (Bennett et al., 2016), it is not possible to directly translate results
into a clinical setting. Thus, there remains no single tool or combination of tools, with sufficient
reliability, sensitivity, or specificity, available to assist healthcare professionals in determining
when individual patients with MCI require a formal driving assessment. Despite this, the current
results suggest that recognizing the inherent variability of the MCI population and differentiating
between different subtypes of MCI to reduce this heterogeneity is an important advancement in
the current literature. Identifying specific areas and degrees of driving impairment that are
characteristic of different subtypes of MCI may be an important first step in the ultimate
development of valid tools that can be implemented in a clinical setting.
3.3.5. Limitations
Although the current study offers important insight into the driving performance of patients with
MCI, there are a few methodological limitations. It is important to note that despite separating
sd-MCI and md-MCI patients, a high degree of within-group variability remained present for
both MCI subtypes. This was demonstrated by a consistently larger standard deviation observed
in the sd-MCI and md-MCI groups relative to the healthy control group. There are a couple of
important factors likely contributing to this persistent variability. First, for both patients with sd-
MCI and patients with md-MCI, the degree of cognitive impairment within each of the respective
cognitive domains is unique to each patient and variable across patients. For example, each
patient with sd-MCI likely had a different degree of memory impairment. Second, unique to the
md-MCI group, patients within this subtype may have exhibited cognitive impairment in

77
different cognitive domains (e.g. attention versus visuospatial function) as well as impairment in
a different number of domains (e.g. impairment in two versus three or more domains). Thus,
even though separating subtypes of MCI accounted for some of the variability inherently
characteristic of the MCI population, variability remains a critical factor influencing results
within both the amnestic sd-MCI and amnestic md-MCI subtypes.
The presence of a small sample size is a limitation observed in the vast majority of the driving
literature, particularly studies assessing the driving performance of patients with MCI. The
current study is no exception. In addition, despite the fact that Wadley and colleagues (2009)
obtained similar results to the current study in terms of the driving performance of MCI patients
as a whole, it will be important to attempt to replicate the current results that suggest different
driving profiles for various subtypes of MCI, using on-road assessments as well as other types of
driving simulators (i.e. stationary, immersive simulators). The current study provided
preliminary evidence regarding the driving profiles unique to amnestic sd-MCI and amnestic md-
MCI patients. It will be important for future research to validate these profiles as well as
determine those characteristic of other subtypes of MCI (e.g. executive sd-MCI, non-amnestic
md-MCI, etc.) as well as patients with early AD. In particular, a large-scale longitudinal study,
using both on-road and simulator technology, would be important to determine the extent to
which driving performance may deteriorate over time in patients with MCI. This would involve
assessing the driving performance, over time, of various subtypes of MCI (sd-MCI, md-MCI,
aMCI, na-MCI), including those maintain diagnostic criteria for MCI and those who go on to
develop AD or related dementia.
Finally, driving simulation has been scrutinized for being an invalid representation of driving
performance and it has been speculated that the validity of driving simulation depends on the
fidelity of the driving simulator. Despite this, the results of other studies have shown that driving
simulators are highly related to on-road driving performance (Bedard et al., 2010). Furthermore,
validation studies have supported the utility of three-screen (Bedard et al., 2010) and one-screen
driving simulators (Gibbons et al., 2014), similar to the one used in the current study, as well as
using driving simulation to evaluate lane control (Mayhew et al., 2011) and turning behaviour
(Shechtman et al., 2009). In addition, driving simulation can expose patients to complex, and

78
potentially dangerous situations in a standardized and safe environment. Thus, driving simulation
may represent the ideal technology for isolating the subtle driving impairments that are related to
mild deficits in cognitive function that may go otherwise undetected using on-road assessments.
Nevertheless, it would be important to replicate the current results using fully immersive driving
simulation as well as on-road assessments.

79
Chapter 4
Investigating the Brain Activation Patterns of Patients with MCI
during Simulated Driving Tasks
No screening assessment tool has been consistently demonstrated to be an accurate predictor of
driving within the population of MCI. Given this, coupled with the multifaceted nature of driving
and the heterogeneous presentation of MCI, it is important to understand the changes in brain
activation that are associated with MCI, as well as the different subtypes of MCI, across various
aspects of driving (i.e. from more routine to more cognitively demanding driving situations).
Previous fMRI research in cognitively healthy individuals has consistently identified that
multiple brain regions are recruited during driving, including parietal, occipital, motor, premotor,
cerebellar, and frontal regions (Calhoun et al., 2002; S. C. Chung et al., 2014; Graydon et al.,
2004; Hirth et al., 2007; H. S. Kim et al., 2014; Y.-O. Li et al., 2012; Mader et al., 2009;
Schweizer et al., 2013; Spiers & Maguire, 2007; Uchiyama et al., 2003). A few studies have used
fMRI and driving simulation in healthy individuals to investigate the brain regions recruited
during turning (Callan et al., 2009; Schweizer et al., 2013; Spiers & Maguire, 2007). Schweizer
and colleagues (2013) exposed young healthy participants to a variety of turning conditions,
including more routine right and left turns without oncoming traffic to more demanding left turns
at a high traffic intersection. Right and left turns without oncoming traffic were associated with
greater activation in posterior brain regions, including occipital, parietal, motor, and cerebellar
regions compared to straight driving, with greater activation observed during left turns than right
turns. Executing left turns with oncoming traffic was associated with greater activation in these
posterior brain regions as well as increased activation in medial and anterior regions, including
the superior frontal gyrus and the cingulate cortex (Schweizer et al., 2013). Furthermore, Callan
and colleagues (2009) reported that resolving uncertainty in decision making at busy
intersections among cognitively healthy adults was associated with increased activation in the
anterior cingulate and the amygdala. Thus, executing more cognitively complex driving

80
manoeuvres, such as turning at high traffic intersections, is associated with recruitment of a more
extensive set of brain regions, including both posterior and anterior regions.
This represents the first study to identify the brain activation patterns that are characteristic of
patients with MCI, as well as to provide preliminary evidence of the activation patterns of the
amnestic single domain (sd-MCI) and amnestic multiple-domain (md-MCI) subtypes of MCI,
during different simulated driving conditions of varying levels of complexity. Identifying the
brain regions involved in these manoeuvres (Chapter 4) will be important for understanding
which brain networks (that are related to driving) are affected by MCI.
4.1 Experimental Materials and Methods
4.1.1 Statement of Ethical Approval
Ethical approval for the current study was obtained from the Research Ethics Board (REB) at St.
Michael’s Hospital, Toronto Canada under REB 16-036 titled, “Investigating the driving
behaviour and underlying neural networks in aging cohorts and patients with neurological
conditions”. All participants provided written informed consent before participating in the
research study.
4.1.2 Participants
Sixteen (16) patients with MCI (mean age = 67.3; mean years of education 15.1; Male = 81.2%),
including six patients with amnestic sd-MCI (mean age = 68.3; mean years of education = 15.3;
Male = 66.7%) and ten patients with amnestic md-MCI (mean age = 66.7; mean years of
education 14.9; Male = 90%) were recruited from the Memory Disorders Clinic at St. Michael’s

81
Hospital. For comparison, 16 age- and sex-matched cognitively healthy controls mean age =
66.2; mean years of education 16.0; Male = 81.2%) were recruited from the community.
Inclusion and Exclusion Criteria
The inclusion and exclusion criteria for this part of the study were highly similar to the inclusion
and exclusion criteria outlined in Chapter 3 with two exceptions. One additional inclusion
criterion was fMRI-compatibility. Potential patients or healthy control participants with any
contraindications to 3.0 T MRI (e.g. claustrophobia, metal implants including stents and hip
replacements) were excluded from the fMRI and driving session. In addition, potential
participants with significant hearing loss were excluded. Participants were required to
comprehend turning instructions over the loud noise of the fMRI data acquisition and respond
correctly. Thus, it would not be possible to complete the experimental driving sessions with
significant hearing loss.
4.1.3 Experimental Procedures
The experimental design aimed to combine fMRI and a fully immersive fMRI-compatible
driving simulator to compare the brain activation of patients with MCI, including individuals
with amnestic sd-MCI (n = 6) and amnestic md-MCI (n = 10) as well as healthy control
participants across driving tasks of various levels of complexity, including right and left turns
without traffic as well as left turns with oncoming traffic. Both patients with MCI and healthy
controls completed four driving scenarios in the MRI, including two training sessions and two
experimental sessions. The entire session took approximately 1.5 hours to complete. The session
involved: (1) the pre-scanning procedure (30 minutes) and (2) the fMRI and driving simulation
session (one hour).
82
4.1.3.1 Pre-Scanning
Before the fMRI and driving session began, all participants were shown a brief PowerPoint
presentation on what to expect during the MRI session along with detailed instructions from the
research personnel. The presentation included pictures and detailed descriptions of the set-up.
Furthermore, instructions were provided on how to manipulate the equipment. Descriptions of
each of the scanning sequences and driving tasks were given. Participants were reminded of the
importance of keeping one’s head as still as possible during imaging. In addition to the
presentation, participants reviewed their MRI screening form with the MRI technologist. If
participants required corrected vision, then MR-compatible glasses were prepared with the
appropriate prescription.
4.1.3.2 fMRI and Driving Simulation Session
After the participant entered the MRI room, the research personnel described and explained the
equipment. After lying down in the magnet bore, the distance of the accelerator and brake pedals
was adjusted for optimal participant comfort. The participant was asked to press down on the
accelerator and the brake pedal to become comfortable with the weight necessary to accelerate
and brake properly. The steering wheel was adjusted so that it was in a comfortable position, and
the research personnel guided the participant through an example of a right and left turn
procedure. Pads were placed under the arms and elbows of each participant to increase comfort
and minimize limb motion that could potentially translate to head motion. Sponges were placed
in the spaces of the head coil to help minimize head motion. An adjustable mirror was placed on
the MRI head coil. Looking through the mirror allowed participants to see a screen in which the
driving scenarios (Figure 3.1) were projected using an Avotec Incorporated high resolution
projector (model SV-6011, Avotec Incorporated). The participant was then instructed on the
emergency call bell and was fitted with the fMRI head set (Avotec Incorporated, Conformal
HeadsetTM). The headset made it possible for the research personnel to communicate with the
participant between each imaging procedure and for the participant to hear the audio instructions
during the simulated driving scenarios.

83
The driving scenarios (i.e. including both training and experimental sessions) were standardized
across all participants, including both patients with MCI and healthy controls. All participants
were presented with the same intersections (i.e. including type and location), audio instructions,
levels of traffic, length of runs, etc. During the driving simulator scenarios, the audio instructions
(e.g. turn left at the stop sign”) were embedded into the scenarios and were presented to
participants approximately 100 metres (i.e. between 5-10 seconds) before each event (e.g. an
intersection controlled by a stop sign). Driving variables of interest that were collected by the
STISIM software during the fMRI and driving session included: collisions, whether participants
turned the appropriate direction at each intersection, and when each turn started and ended.
fMRI Training Sessions
The purpose of the two training sessions were for the participants to become familiar and
comfortable with the driving simulator and fMRI equipment, including the steering wheel,
accelerator, brake, the virtual reality environment within the MRI, and the sound system. Both
training sessions were approximately 6-7 minutes in length. During the first training session, no
fMRI data were collected. This allowed the participants to acclimate to the equipment with
feedback provided by the research personnel. The first training session involved straight driving
with some turning without any oncoming traffic. During the second training session, the
structural scan was acquired (see section 4.1.3.3 below). This session allowed participants to
become comfortable using the driving simulator while an MRI sequence was being run. The
second training session involved straight driving as well as right turns, left turns and left turns
with oncoming traffic. All participants reported feeling comfortable with the equipment and the
virtual reality environment prior to moving to the experimental sessions.
fMRI Experimental Sessions
After the training sessions, the fMRI experimental driving sessions were administered. Both
experimental sessions were approximately 10-12 minutes in length. The experimental driving
sessions were synchronized in time, using a trigger, so that when fMRI data acquisition began,
the driving scenario started automatically (i.e. time point “0” was the same for both the fMRI
data and the driving simulation data). Between each of the training and experimental sessions,
84
the research personnel ensured that the participants felt comfortable, felt able to proceed to the
next scenario, and that the headset was adjusted to an appropriate volume.
The experimental sessions were highly similar to the second training session and involved
straight driving as well as executing right and left turns both with and without oncoming traffic
(i.e. including other vehicles as well as pedestrians). Each turning condition was separated by
approximately 10-15 seconds of straight driving, which served as the baseline condition in the
statistical analyses. Participants were exposed to 4-7 variations of each type of turning condition.
4.1.3.3 fMRI Sequencing Protocol and Data Acquisition
The MRI scanning procedures were conducted at St. Michael’s Medical Imaging Department in
a research-dedicated 3.0 T Siemens Magnetom Syngo Skyra scanner with a 20-channel head coil.
All sequences were acquired by a certified MRI technologist. Imaging acquisition took
approximately 30-40 minutes to collect. The anatomical scan was acquired with T1-weighted
imaging (MPRAGE; echo time (TE) = 2.54 ms, TR = 2000 ms, 176 slices, thickness = 1.0 mm,
gap = 0 mm, field of view (FOV) = 256 mm, 1.0 x 1.0 x 1.0 voxels). Functional task -based (i.e.
driving simulation) MRI was acquired using T2*-weighted fast echo-planar images (EPI; echo
time (TE) = 30.0 ms, TR = 2000 ms, 32 slices, thickness = 4.0 mm, gap = 0.5 mm, field of view
(FOV) = 200 mm, 3.1 x 3.1 x 4.0 voxels).
4.1.4 Data Extraction and Analysis
Using the program MRIconvert, all Digital Imaging and Communications in Medicine (DICOM)
image files that were collected by the MRI system were converted to Neuroimaging Informatics
Technology Initiative (NIfTI) files. Functional MRI (BOLD) data pre-processing and analyses
were conducted using Preprocessing OptimizatioN Toolkit (PRONTO) software, which provides
the fast optimization of preprocessing pipelines and analyses of BOLD fMRI (Churchill, Oder, et
al., 2012; Churchill, Yourganov, et al., 2012; PRONTO User’s Manual (v 8.5), n.d.). The
85
PRONTO algorithm detects the set of preprocessing steps that is best suited for a particular
dataset and optimizes the reproducibility of post-processing analysis results (PRONTO User’s
Manual (v 8.5), n.d.; Strother et al., 2002). The results of previous research suggest that
PRONTO significantly improves signal detection, the reliability of brain activations, and the
sensitivity of brain-behaviour correlations (Churchill, Oder, et al., 2012; Churchill, Yourganov,
et al., 2012; PRONTO User’s Manual (v 8.5), n.d.).
Prior to pre-processing and analyzing the fMRI data, the onset and durations for each turning
condition (i.e. right turns, left turns, and left turns with oncoming traffic) were extracted for both
experimental sessions by research personnel. The time points were double checked to ensure that
there were no errors. These timing data were converted to PRONTO format and included the
following information: the unit in which task onset/duration was measured (i.e. seconds), the
time between scan volumes (i.e. TR = 2000 ms), the type of task paradigm (i.e. event-related
design), name of each condition (e.g. right turns, left turns, left turns with traffic), onsets for each
event within each condition (in seconds), and durations of each event within each condition (in
seconds). Straight driving served as the baseline condition in the current analysis. Thus, brain
activation of each turning condition was compared to straight driving.
4.1.4.1 Pre-Processing of fMRI Data
An in-house script was used to perform pre-processing and analyses. All scripts were run using
Matlab. A pipeline file was created for the fMRI dataset. This file specified: the name and
location of the unprocessed fMRI data to be optimized, the name and location for the final
processed and optimized outputs, the number of image volumes dropped at the start and end of
each fMRI data acquisition run (first and last two TRs), the name and location of the task
textfiles (see section 4.1.4 above), and the name and location of the 3D structural brain image.
PRONTO was used to test all combinations of a set of 12 preprocessing steps and to identify the
optimal pipeline (i.e. the one that gives the highest quality output data) for the current dataset.
Thus, multiple pipeline options were tested to ensure that the pipeline chosen optimized output
data quality. The current analysis utilized a standard, conservative pipeline (i.e. a single

86
conservative set of pre-processing steps across participants). This type of pipeline is highly
similar to standard fMRI processing pipelines. The conservative pipeline minimizes potential
noise confounds with minimal concern for signal optimization (PRONTO User’s Manual (v 8.5),
n.d.). The pre-processing steps that were utilized include: rigid-body motion correction with
optimal reference for volume section, basic outlier censoring, slice-timing correction, spatial
smoothing, temporal linear detrending, and motion parameter regression. Preprocessing steps
include both AFNI (Analysis of Functional NeuroImaging; R. Cox, 1996) and in-house
developed functions. Spatial normalization of participants to an anatomical template was
conducted using FMRIB Software Library (FSL). A General Linear Model (GLM) analysis was
conducted, which generated group masks that were used for post-hoc analyses. Based on the
results of quality control analyses, data that were preprocessed using the conservative pipeline
were chosen for post-hoc analyses.
4.1.4.3 Post-Hoc Analyses
Post-hoc analyses involved one-sample bootstrap procedures to identify the brain activation
patterns characteristic of patients with MCI, cognitively healthy controls, patients with sd-MCI,
and patients with md-MCI. Analyses were conducted and brain activation maps were generated
for the right turn, left turn, and left turn with traffic conditions for the one-sample procedures.
The appropriate cluster size threshold for the current sample of participants was determined
using FSL. Thus, voxels were subsequently adjusted for multiple comparisons at a false
discovery rate (FDR) of q = 0.05 with a minimum cluster size of 34. Visual comparisons were
made between healthy controls and patients with MCI (including subtypes of sd-MCI and md-
MCI). Images were generated and localization of activation was achieved using MRIcron
software (Rorden, 2015). Montreal Neurological Institute and Hospital (MNI) coordinates (X, Y,
and Z) and peak levels of activation were obtained for each activated region. The Automated
Anatomical Labelling (AAL) atlas was used to identify the regions of interest.
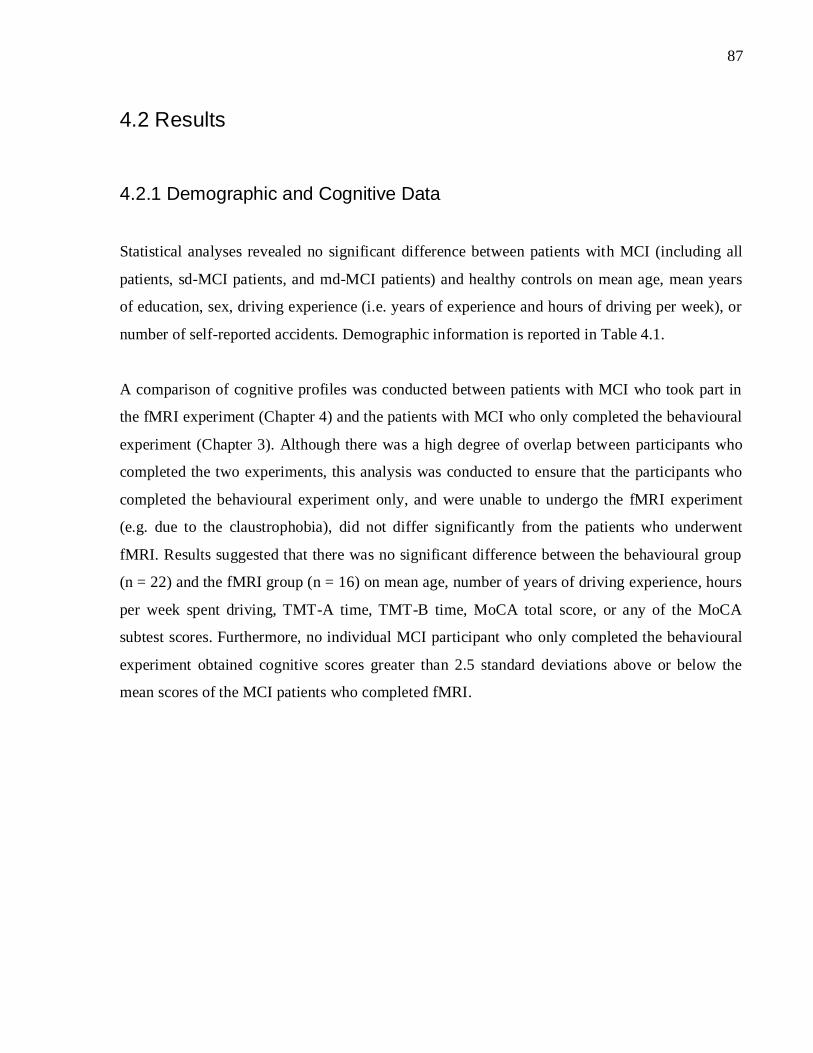
87
4.2 Results
4.2.1 Demographic and Cognitive Data
Statistical analyses revealed no significant difference between patients with MCI (including all
patients, sd-MCI patients, and md-MCI patients) and healthy controls on mean age, mean years
of education, sex, driving experience (i.e. years of experience and hours of driving per week), or
number of self-reported accidents. Demographic information is reported in Table 4.1.
A comparison of cognitive profiles was conducted between patients with MCI who took part in
the fMRI experiment (Chapter 4) and the patients with MCI who only completed the behavioural
experiment (Chapter 3). Although there was a high degree of overlap between participants who
completed the two experiments, this analysis was conducted to ensure that the participants who
completed the behavioural experiment only, and were unable to undergo the fMRI experiment
(e.g. due to the claustrophobia), did not differ significantly from the patients who underwent
fMRI. Results suggested that there was no significant difference between the behavioural group
(n = 22) and the fMRI group (n = 16) on mean age, number of years of driving experience, hours
per week spent driving, TMT-A time, TMT-B time, MoCA total score, or any of the MoCA
subtest scores. Furthermore, no individual MCI participant who only completed the behavioural
experiment obtained cognitive scores greater than 2.5 standard deviations above or below the
mean scores of the MCI patients who completed fMRI.

88
Table 4.1. Demographic characteristics of patients with MCI and healthy controls
Healthy
Controls
(n = 16)
All MCI
Patients
(n = 16)
sd-MCI
Patients
(n = 6)
md-MCI
Patients
(n = 10)
p-value
Age, years
66.2 ± 10.1
(47-83)
67.3 ± 10.2
(50-85)
68.3 ± 9.3
(59-85)
66.7 ± 11.2
(50-83)
0.969†
0.915‡
Education, years
16.0 ± 2.3
(12-20)
15.1 ± 2.9
(12-20)
15.3 ± 3.3
(12-20)
14.9 ± 2.8
(12-19)
0.361†
0.586‡
Sex, n (%) Male
13 (81.2%) 13 (81.2%) 4 (66.7%) 9 (90%) 1.000†
0.512‡
Driving experience,
years
48.3 ± 11.7
(16-65)
46.8 ± 9.9
(30-64)
48.7 ± 6.2
(43-60)
45.7 ± 11.7
(30-64)
0.699† 0.811‡
Driving experience,
hours/week
6.2 ± 6.3
(0-20)
6.2 ± 4.6
(0-15)
6.8 ± 2.8
(3-10)
5.8 ± 5.6
(0-15)
0.642†
0.640‡
Self-reported
accidents
1.1 ± 1.1
(0-3)
1.5 ± 1.3
(0-5)
1.3 ± 1.2
(0-3)
1.6 ± 1.4
(0-5)
0.491† 0.743‡
MoCA Total Score 28.1 ± 1.1a
(26-30)
24.2 ± 1.4b
(22-27)
23.8 ± 1.5b
(22-26)
24.4 ± 1.4b
(22-27)
0.000†
0.000‡
Note. Values reported in mean ± standard deviation (range) format. MoCA = Montreal
Cognitive Assessment. †p-value for healthy control versus all MCI patients comparison
(independent samples t-test/Mann-Whitney U). ‡p-value for one-way ANOVA/Kruskal Wallis
analysis (healthy control versus sd-MCI versus md-MCI comparison). When statistical
assumptions were met, parametric tests were utilized (independent samples t-test/ANOVA);
when assumptions were violated, non-parametric tests were used (Mann-Whitney U/Kruskal-
Wallis). Post-hoc results (statistical values and p-values) are reported in-text. a,bSuperscripts
denote whether a significant difference emerged between MCI subtypes (md-MCI and sd-MCI)
and healthy controls (i.e. shared superscripts indicated no significant difference at p = 0.05).
*self-reported quality of driving is assessed on a 5-point Likert scale (1 = poor; 2 = fair; 3=
average; 4 = good; 5 = excellent). §self-reported level of difficulty (0 = no difficulty; 1 = little
difficulty; 2 = moderate difficulty; extreme difficulty).
n, number of participants; % = percentage of participants; MCI = mild cognitive impairment; sd-
MCI = amnestic single-domain MCI; md-MCI = amnestic multiple-domain MCI
89
4.2.2 Functional MRI Activation during Driving Simulation
All one-sample bootstrap procedures (i.e. for patients with MCI, healthy controls, patients with
sd-MCI, and patients with md-MCI) revealed reliable and significant activation patterns in
regions previously identified as being recruited during various driving tasks (Callan et al., 2009;
Just et al., 2008; Schweizer et al., 2013), including parietal, occipital, motor, premotor,
supplemental motor, cerebellar, and frontal regions, across one or more driving conditions.
4.2.2.1 Brain Activation Patterns of Patients with MCI Relative to Healthy Control
Drivers
Right Turns
One sample bootstrap analyses revealed significant positive activation in multiple brain regions
in both healthy controls and patients with MCI, particularly in posterior and medial brain areas
(Figure 4.1). Specifically, both patients and controls showed significant positive activation,
bilaterally, in the cerebellum; superior, middle, and inferior occipital lobes; inferior and superior
parietal lobes; fusiform gyrus; calcarine fissure; lingual gyrus; anterior and middle cingulum;
pre- and post-central gyri; supplemental motor areas; precuneus; cuneus; putamen; thalamus;
insula; as well as the right inferior and middle temporal lobes, right middle and orbitofrontal
cortex, right superior frontal cortex, and the right triangular portion of the inferior frontal gyrus.
Patients with MCI showed significant positive activation in multiple regions in which controls
did not demonstrate positive activation, including: the left inferior, middle, and superior temporal
cortex; the left middle and inferior orbitofrontal cortex; and the left superior frontal cortex.
Furthermore, compared to cognitively healthy drivers, individuals with MCI showed more
recruitment of the cerebellum (primarily the left), the right middle temporal cortex, the left
middle and inferior occipital lobes, left calcarine fissure, and the left supplemental motor area.
Furthermore, cognitively healthy drivers showed negative activation bilaterally in the middle and
superior temporal lobes, the inferior occipital cortices, as well as the triangular portion of the
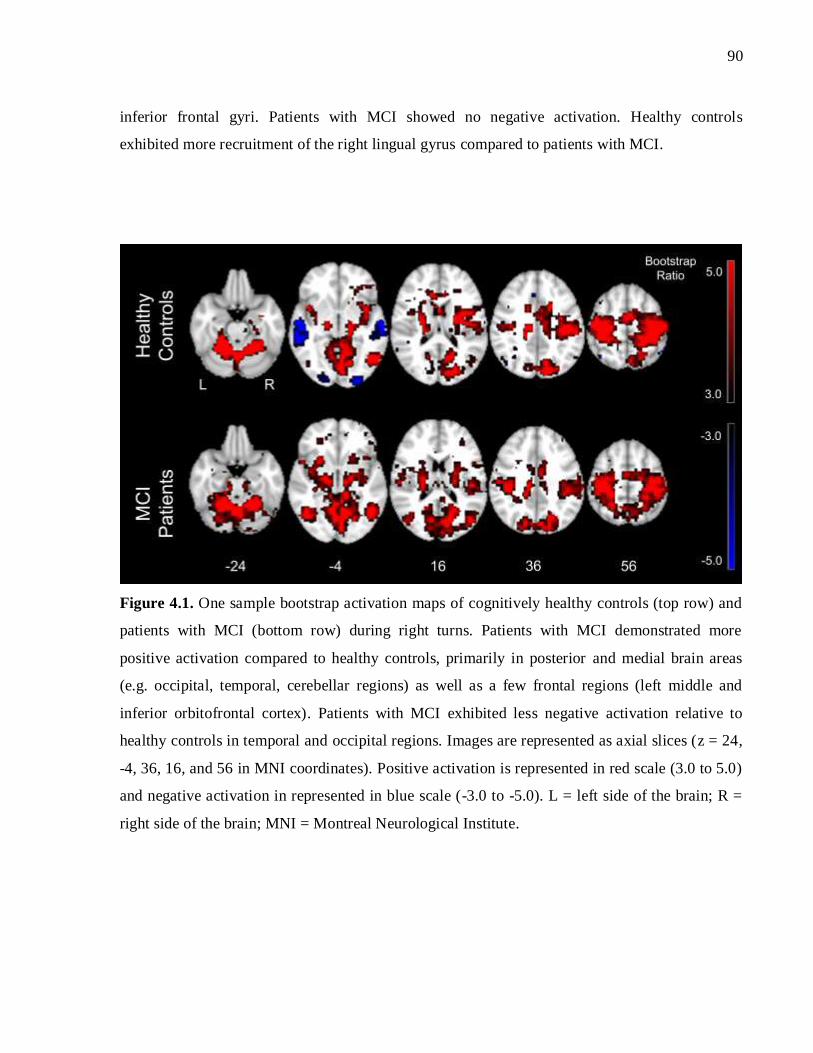
90
inferior frontal gyri. Patients with MCI showed no negative activation. Healthy controls
exhibited more recruitment of the right lingual gyrus compared to patients with MCI.
Figure 4.1. One sample bootstrap activation maps of cognitively healthy controls (top row) and
patients with MCI (bottom row) during right turns. Patients with MCI demonstrated more
positive activation compared to healthy controls, primarily in posterior and medial brain areas
(e.g. occipital, temporal, cerebellar regions) as well as a few frontal regions (left middle and
inferior orbitofrontal cortex). Patients with MCI exhibited less negative activation relative to
healthy controls in temporal and occipital regions. Images are represented as axial slices (z = 24,
-4, 36, 16, and 56 in MNI coordinates). Positive activation is represented in red scale (3.0 to 5.0)
and negative activation in represented in blue scale (-3.0 to -5.0). L = left side of the brain; R =
right side of the brain; MNI = Montreal Neurological Institute.

91
Left Turns without Traffic
Across left turns without oncoming traffic, one sample bootstrap analyses revealed significant
positive activation in multiple brain regions in both healthy controls and patients with MCI
(Figure 4.2). Specifically, both patients and controls showed significant positive activation
bilaterally in the cerebellum; superior, middle, and inferior occipital lobes; superior, middle, and
inferior temporal lobes; inferior and superior parietal lobes; fusiform gyrus; calcarine fissure;
lingual gyrus; middle cingulum; pre- and post-central gyri; supplemental motor areas; precuneus;
cuneus; putamen; thalamus; superior and middle frontal cortex; the inferior and middle
orbitofrontal cortex as well as the right insula, right triangular portion of the inferior frontal
gyrus, and left anterior cingulum.
Drivers with MCI demonstrated significant positive activation relative to controls (i.e. who did
not demonstrate significant positive activation) in the left superior medial frontal cortex, right
anterior cingulum, and the left insula. Compared to cognitively healthy drivers, individuals with
MCI appeared to show more positive activation (i.e. larger peak activation) in multiple brain
regions, including the left superior occipital cortex, the right inferior parietal cortex, left
calcarine fissure, bilateral postcentral gyri, and bilaterally in the supplemental motor area.
Controls exhibited negative activation bilaterally in the middle and superior temporal lobes and
the inferior occipital lobes as well as the left middle frontal cortex and the right triangular portion
of the inferior frontal gyrus. Patients with MCI showed no negative activation. Healthy controls
showed a larger peak activation in the left middle temporal lobe compared to drivers with MCI.
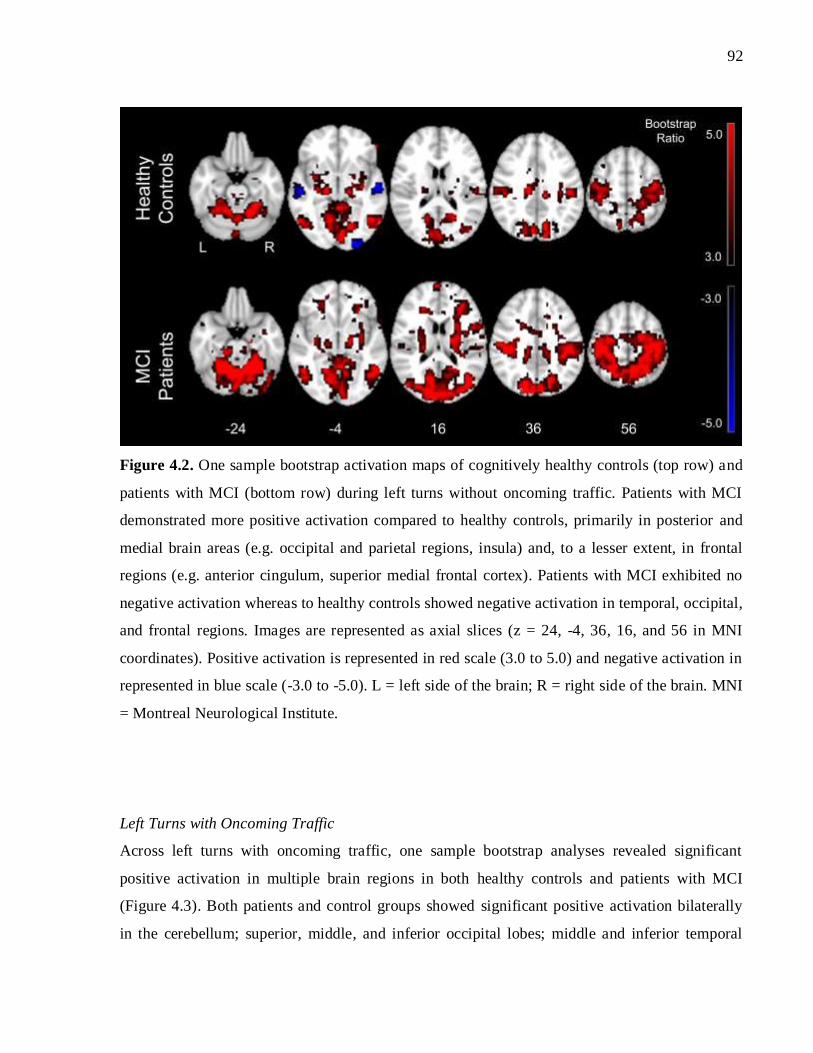
92
Figure 4.2. One sample bootstrap activation maps of cognitively healthy controls (top row) and
patients with MCI (bottom row) during left turns without oncoming traffic. Patients with MCI
demonstrated more positive activation compared to healthy controls, primarily in posterior and
medial brain areas (e.g. occipital and parietal regions, insula) and, to a lesser extent, in frontal
regions (e.g. anterior cingulum, superior medial frontal cortex). Patients with MCI exhibited no
negative activation whereas to healthy controls showed negative activation in temporal, occipital,
and frontal regions. Images are represented as axial slices (z = 24, -4, 36, 16, and 56 in MNI
coordinates). Positive activation is represented in red scale (3.0 to 5.0) and negative activation in
represented in blue scale (-3.0 to -5.0). L = left side of the brain; R = right side of the brain. MNI
= Montreal Neurological Institute.
Left Turns with Oncoming Traffic
Across left turns with oncoming traffic, one sample bootstrap analyses revealed significant
positive activation in multiple brain regions in both healthy controls and patients with MCI
(Figure 4.3). Both patients and control groups showed significant positive activation bilaterally
in the cerebellum; superior, middle, and inferior occipital lobes; middle and inferior temporal
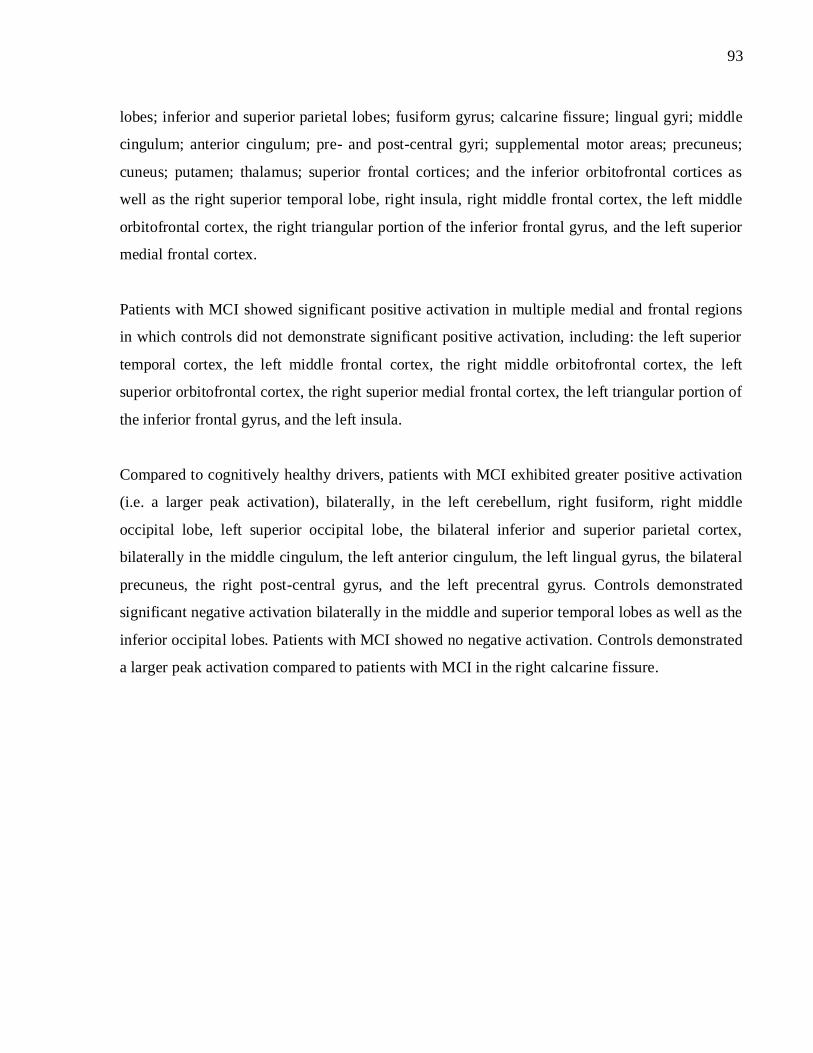
93
lobes; inferior and superior parietal lobes; fusiform gyrus; calcarine fissure; lingual gyri; middle
cingulum; anterior cingulum; pre- and post-central gyri; supplemental motor areas; precuneus;
cuneus; putamen; thalamus; superior frontal cortices; and the inferior orbitofrontal cortices as
well as the right superior temporal lobe, right insula, right middle frontal cortex, the left middle
orbitofrontal cortex, the right triangular portion of the inferior frontal gyrus, and the left superior
medial frontal cortex.
Patients with MCI showed significant positive activation in multiple medial and frontal regions
in which controls did not demonstrate significant positive activation, including: the left superior
temporal cortex, the left middle frontal cortex, the right middle orbitofrontal cortex, the left
superior orbitofrontal cortex, the right superior medial frontal cortex, the left triangular portion of
the inferior frontal gyrus, and the left insula.
Compared to cognitively healthy drivers, patients with MCI exhibited greater positive activation
(i.e. a larger peak activation), bilaterally, in the left cerebellum, right fusiform, right middle
occipital lobe, left superior occipital lobe, the bilateral inferior and superior parietal cortex,
bilaterally in the middle cingulum, the left anterior cingulum, the left lingual gyrus, the bilateral
precuneus, the right post-central gyrus, and the left precentral gyrus. Controls demonstrated
significant negative activation bilaterally in the middle and superior temporal lobes as well as the
inferior occipital lobes. Patients with MCI showed no negative activation. Controls demonstrated
a larger peak activation compared to patients with MCI in the right calcarine fissure.
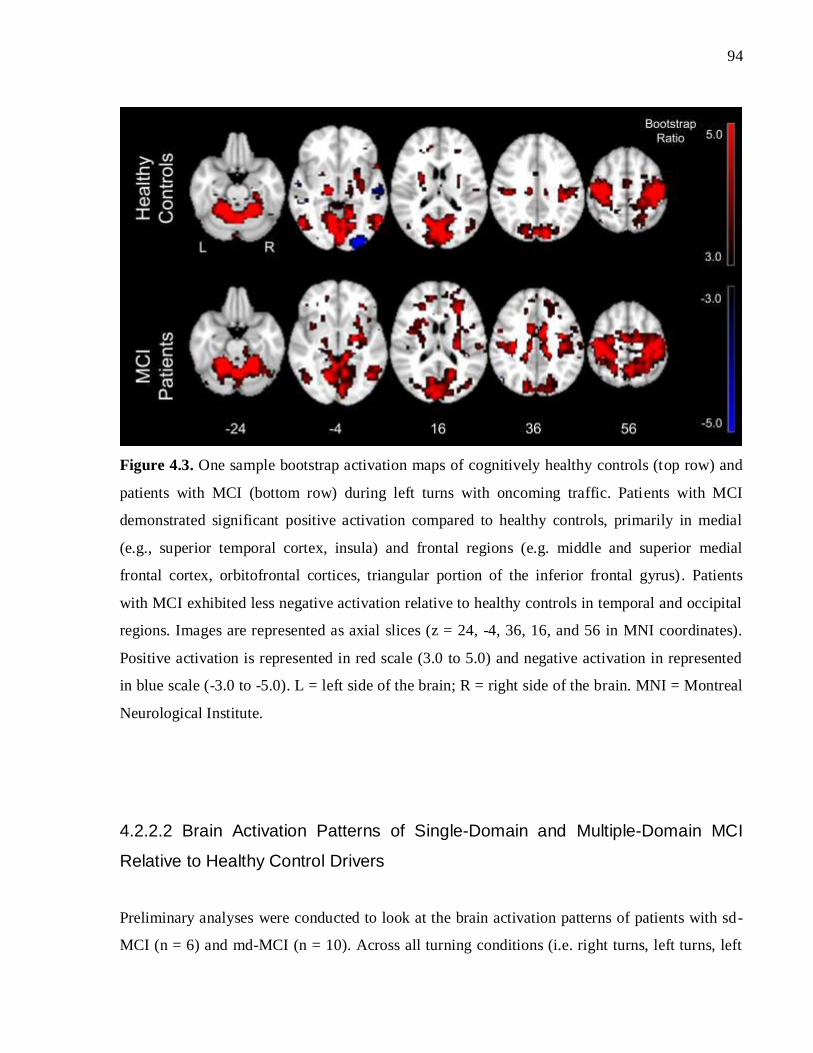
94
Figure 4.3. One sample bootstrap activation maps of cognitively healthy controls (top row) and
patients with MCI (bottom row) during left turns with oncoming traffic. Patients with MCI
demonstrated significant positive activation compared to healthy controls, primarily in medial
(e.g., superior temporal cortex, insula) and frontal regions (e.g. middle and superior medial
frontal cortex, orbitofrontal cortices, triangular portion of the inferior frontal gyrus). Patients
with MCI exhibited less negative activation relative to healthy controls in temporal and occipital
regions. Images are represented as axial slices (z = 24, -4, 36, 16, and 56 in MNI coordinates).
Positive activation is represented in red scale (3.0 to 5.0) and negative activation in represented
in blue scale (-3.0 to -5.0). L = left side of the brain; R = right side of the brain. MNI = Montreal
Neurological Institute.
4.2.2.2 Brain Activation Patterns of Single-Domain and Multiple-Domain MCI
Relative to Healthy Control Drivers
Preliminary analyses were conducted to look at the brain activation patterns of patients with sd-
MCI (n = 6) and md-MCI (n = 10). Across all turning conditions (i.e. right turns, left turns, left

95
turns with oncoming traffic), patients with sd-MCI tended to show significant positive activation
in which controls did not or a greater positive peak activation relative to cognitively healthy
control drivers. This positive activation was observed in brain regions previously identified as
being involved in driving (temporal, parietal, frontal regions). In contrast, patients with md-MCI
tended not to show significant positive activation in regions in which controls demonstrated
significant positive activation as well as lower peak activation relative to controls.
Right Turns
Both patients with sd-MCI and md-MCI demonstrated activation in areas similar to cognitively
healthy adults (see Figure 4.4)—cerebellar (bilateral); fusiform (bilateral); inferior, middle, and
superior occipital (bilateral); inferior, middle, and superior temporal (bilateral); inferior and
superior parietal (bilateral); putamen (bilateral); thalamus (bilateral); insula (left); calcarine
fissure (bilateral); lingual gyri (bilateral); cuneus (bilateral); pre- and post-central gyri (bilateral);
supplemental motor (bilateral); middle cingulum (bilateral); precuneus (bilateral); and superior
frontal (bilateral) regions. Controls exhibited negative activation bilaterally in the middle and
superior temporal lobes as well as the inferior occipital lobes.
Patients with sd-MCI showed significant positive activation in multiple brain regions, primarily
medial and frontal areas, in which controls did not demonstrate significant positive activation,
including: the left inferior, middle, and superior temporal cortex; bilateral middle frontal cortex,
the bilateral middle orbitofrontal cortex, the left inferior orbitofrontal cortex, bilateral superior
frontal cortex, bilateral medial superior frontal cortex, and the left triangular portion of the left
inferior frontal gyrus. Furthermore, patients with sd-MCI showed a larger peak activation
compared to healthy control drivers in the left cerebellum, right middle and superior temporal
cortex, left inferior occipital cortex, bilateral middle occipital cortex, left superior parietal cortex,
bilateral putamen, bilateral thalamus, bilateral insula, right triangular portion of the inferior
frontal gyrus, left lingual gyrus, bilateral anterior cingulum, bilateral cuneus, bilateral precuneus,
bilateral pre- and post-central gyri, and the right supplemental motor cortex.
In contrast, patients with md-MCI did not exhibit significant positive activation in anterior brain
regions in which controls did, including the anterior cingulum, the right inferior orbitofrontal

96
cortex, and the right triangular portion of the inferior frontal gyrus. Patients with md-MCI also
showed a lower peak activation in the right cerebellum, right superior occipital cortex, right
putamen, right pre- and post-central gyri, and right insula. However, patients with md-MCI
showed a higher peak activation relative to controls in the left inferior and superior temporal
cortex and the superior frontal cortex.

97
Figure 4.4. One sample bootstrap activation maps of cognitively healthy controls (top row),
patients with single-domain (sd-) MCI (middle row), and patients with multiple-domain (md-)
MCI (bottom row) during right turns. Patients with sd-MCI demonstrated a greater peak
activation compared to healthy controls, primarily frontal and medial regions (e.g. middle frontal
cortices, orbitofrontal cortices, anterior cingulum, middle cingulum). Patients with md-MCI
demonstrated a lower peak activation compared to healthy controls in multiple brain areas (e.g.
inferior occipital lobe, cerebellum, anterior cingulum). Patients with sd-MCI and md-MCI
exhibited less negative activation relative to healthy controls in temporal and occipital regions.
Images are represented as axial slices (z = 24, -4, 36, 16, and 56 in MNI coordinates). Positive
activation is represented in red scale (3.0 to 5.0) and negative activation in represented in blue
scale (-3.0 to -5.0). L = left side of the brain; R = right side of the brain. MNI = Montreal
Neurological Institute.

98
Left Turns without Traffic
Both patients with sd-MCI and md-MCI, as well as healthy controls, exhibited activation in
regions similar to the right turn (see Figure 4.5). Furthermore, similar to right turns, during left
turns without oncoming traffic, patients with sd-MCI showed significant positive activation in
multiple brain areas relative to controls, particularly in frontal (e.g. superior medial, middle
frontal brain regions, etc.) and medial regions (e.g. insula). In addition, patients with sd-MCI
showed a larger peak activation relative to controls in multiple brain areas (i.e. frontal, medial,
and posterior), including the bilateral cerebellum; bilateral inferior, right middle, and right
superior temporal cortex; right inferior, bilateral middle, and left superior occipital cortex, the
right inferior and bilateral superior parietal cortex; bilateral superior and right middle frontal
cortex; left middle orbitofrontal cortex; right triangular portion of the inferior frontal cortex; right
putamen; right insula, left lingual gyrus; left anterior cingulum; bilateral middle cingulum; right
cuneus, bilateral post-central gyrus; right precentral gyrus, bilateral supplemental motor area; and
right precuneus.
Also similar to the right turning condition, during left turns without oncoming traffic, patients
with md-MCI did not exhibit significant positive activation relative to controls primarily in
medial and frontal regions, including the left superior temporal cortex and the right middle
frontal cortex. Patients with md-MCI also showed a lower peak activation than controls in the
middle temporal cortex, right inferior occipital cortex, as well as the left inferior and superior
parietal cortex. However, patients with md-MCI showed a higher peak activation relative to
controls in the right middle and left superior occipital cortex, the right inferior parietal cortex,
and the right superior frontal cortex.

99
Figure 4.5. One sample bootstrap activation maps of cognitively healthy controls (top row),
patients with single-domain (sd-) MCI (middle row), and patients with multiple-domain (md-)
MCI (bottom row) during left turns without traffic. Patients with sd-MCI demonstrated
significant positive activation in regions controls did not, including primarily frontal and medial
regions (e.g. middle frontal cortex, superior medial frontal cortex, anterior cingulum, insula).
Patients with md-did not exhibit significant positive activation in anterior and medial regions in
which healthy controls did (e.g. middle frontal, superior temporal cortices). Images are
represented as axial slices (z = 24, -4, 36, 16, and 56 in MNI coordinates). Positive activation is
represented in red scale (3.0 to 5.0) and negative activation in represented in blue scale (-3.0 to -
5.0). L = left side of the brain; R = right side of the brain. MNI = Montreal Neurological
Institute.

100
Left Turns with Oncoming Traffic
Both patients with sd-MCI and md-MCI, as well as healthy controls, exhibited activation in
regions similar to the right and left turning conditions without oncoming traffic (see Figure 4.6).
Relative to healthy control drivers, patients with sd-MCI showed significant activation in
multiple anterior brain regions in which controls did not, including the left middle frontal cortex,
the right middle and bilateral superior orbitofrontal cortex, left triangular portion of the inferior
frontal cortex, bilateral inferior frontal operculum, and right superior medial frontal cortex as
well as the left insula. Thus, compared to the left turns without traffic condition, patients with sd-
MCI showed significant positive activation in more frontal brain regions compared to healthy
controls. Patients with sd-MCI also showed a higher peak activation in the right cerebellum;
bilateral fusiform; right inferior, right middle, and left superior temporal cortex; left middle and
right superior occipital cortex; bilateral inferior and superior parietal cortex; right superior and
middle frontal cortex; bilateral inferior orbitofrontal cortex; right triangular portion of the
inferior frontal gyrus; left superior medial frontal cortex; right putamen; right thalamus; right
insula; bilateral anterior and middle cingulum; bilateral supplemental motor area; right post-
central gyrus; the right cuneus; and bilateral precuneus. Patients with sd-MCI showed a lower
peak activation relative to controls in the right calcarine fissure and the left cuneus.
Patients with md-MCI did not exhibit significant positive activation in multiple brain regions
relative to controls, including posterior (e.g. right inferior occipital cortex), medial (left inferior
temporal, left putamen), and frontal brain regions (e.g. left superior medial frontal cortex, right
anterior cingulum, left superior frontal cortex, left middle and inferior orbitofrontal cortex).
Thus, compared to the left turn without traffic condition, patients with md-MCI did not exhibit
positive activation in more brain regions, primarily frontal, relative to controls. Patients also
demonstrated a lower peak activation in the left fusiform, right lingual gyrus, left postcentral
gyrus, and right precentral gyrus relative to controls. However, patients with md-MCI also
showed significant positive activation in regions in which controls did not (i.e. left middle frontal
cortex, left superior orbitofrontal cortex, left insula).
101
Figure 4.6. One sample bootstrap activation maps of cognitively healthy controls (top row),
patients with single-domain (sd-) MCI (middle row), and patients with multiple-domain (md-)
MCI (bottom row) during left turns with oncoming traffic. Patients with sd-MCI demonstrated
significant positive activation in multiple regions in which healthy controls did not, primarily
frontal regions (e.g. middle frontal cortex, orbitofrontal brain regions). Patients with md-MCI
failed to demonstrate significant positive activation in multiple brain regions compared to
controls, including posterior (e.g. inferior occipital cortex), medial (inferior temporal cortex), and
frontal regions (e.g. anterior cingulum, middle and inferior orbitofrontal regions, frontal superior
regions). Patients also showed significant positive activation in frontal (superior orbitofrontal
cortex) and medial regions (e.g. insula) in which controls did not. Images are represented as axial
slices (z = 24, -4, 36, 16, and 56 in MNI coordinates). Positive activation is represented in red
scale (3.0 to 5.0) and negative activation in represented in blue scale (-3.0 to -5.0). L = left side
of the brain; R = right side of the brain. MNI = Montreal Neurological Institute.
102
4.3 Discussion
This study is the first to (1) identify the brain activation patterns characteristic of patients with
MCI during simulated driving and (2) explore the activation patterns that are associated with
different subtypes of MCI, including amnestic sd-MCI and amnestic md-MCI. Results revealed
that patients with MCI, including single-domain and multiple-domain subtypes, demonstrate
systematic differences in brain activation compared to cognitively healthy drivers and suggest
that patients with sd-MCI and md-MCI may exhibit different patterns of brain activation, unique
to each subtype, across simulated driving conditions of varying levels of complexity.
Furthermore, the extent of deviation in activation between patients with MCI and controls
appeared to increase across driving conditions of increasing complexity (i.e. from right turns, to
left turns, to left turns with oncoming traffic). A discussion specific to each of the hypotheses
outlined at the beginning of this thesis (Chapter 2) is detailed below:
4.3.1 Hypothesis 1: Reliable Activation Patterns in Patients and Controls
It was hypothesized that both patients with MCI and cognitively healthy controls would exhibit
reliable activation in brain regions previously identified as being recruited during driving (Callan
et al., 2009; S. C. Chung et al., 2014; Just et al., 2008; Schweizer et al., 2013). The results of the
current study confirmed this hypothesis, demonstrating reliable brain activation for both patients
and controls in occipital, parietal, cerebellar, motor (including premotor and supplementary
motor), temporal, and frontal brain areas across all simulated driving conditions (i.e. right and
left turns without oncoming traffic, left turns with oncoming traffic). Both patients and controls
exhibited reliable positive activation across turning conditions in predominantly the occipital,
parietal, temporal, motor, cerebellar, and frontal regions as well as the precuneus, thalamus, and
the cingulum; whereas healthy controls exhibited reliable negative activation across turning
conditions, predominantly in the middle and superior temporal lobes as well as the inferior

103
occipital lobes. This finding supports the highly complex nature of driving, suggesting that
performing both routine and complex driving maneuvers requires the integration of brain regions
that have been implicated in motor control (e.g. primary motor cortex, cerebellum), attention
(e.g. precuneus, cingulum), visuospatial function (e.g. occipital and parietal regions), and
executive function (e.g. frontal brain regions).
These areas of activation are highly congruent with the previous work of Schweizer and
colleagues (2013), which identified the neural activation patterns associated with various turning
conditions in healthy, young adults (mean age = 25.8 years). Furthermore, these 16 healthy
young drivers (Schweizer et al., 2013) demonstrated increased and more widespread activation in
multiple brain regions as driving conditions increased in complexity (i.e. from right turns to left
turns to left turns with traffic to left turns with traffic and audio distraction). Similar results were
obtained in the cognitively healthy older, the MCI patient (i.e. when observed as a whole), and
the sd-MCI patient groups of the current study across right turns, left turns, and left turns with
oncoming traffic. In particular, the healthy control and patient groups in the current study
appeared to demonstrate a greater recruitment (i.e. significant positive activation) of frontal brain
regions across conditions, particularly left turns with oncoming traffic. This recruitment of
frontal brain regions during left turns with oncoming traffic was more substantial in patients with
MCI relative to controls.
4.3.2 Hypothesis 2: Activation Patterns Characteristic of Patients with MCI
Relative to Healthy Controls
Across all turning conditions (right turns, left turns, and left turns with oncoming traffic),
patients and controls exhibited positive activation in multiple overlapping areas (e.g. cerebellum,
occipital lobes, parietal lobes, temporal lobes, fusiform and lingual gyri, calcarine fissure, the
cingulum, cuneus, precuneus, pre- and post-central gyri, supplemental motor area, thalamus,
putamen, superior frontal cortex, and orbitofrontal regions). Across all turning conditions,
controls demonstrated negative activation in temporal (superior and middle) and occipital
104
(inferior) brain areas. Patients did not exhibit reliable negative activation across turning
conditions.
Consistent with the hypothesis, patients with MCI demonstrated deviations in brain activation
compared to healthy controls. In particular, patients with MCI showed significant positive
activation in multiple brain regions in which controls did not, and this trend was consistent
across turning conditions. Furthermore, compared to more routine turning conditions (right turns,
left turns without traffic), significant positive activation was observed in a greater number of
frontal brain regions of patients with MCI, relative to healthy controls, during left turns with
oncoming traffic (i.e. 2-3 frontal regions during right and left turns versus 5 frontal regions
during left turns with traffic). This suggests that patients with MCI recruit a more extensive set of
brain resources relative to controls, particularly frontal brain regions, as driving tasks increase in
cognitive complexity.
In keeping with the current findings, studies using fMRI to investigate the brain regions recruited
during cognitive testing (e.g. attention, executive function, visuospatial ability) in patients with
MCI have consistently supported that MCI is associated with more extensive activation in
multiple brain regions relative to healthy controls (Berger et al., 2015; Bokde et al., 2010;
Clement, Gauthier, & Belleville, 2013; Leyhe et al., 2009; C. Li, Zheng, Wang, Gui, & Li, 2009;
Yetkin, Rosenberg, Weiner, Purdy, & Cullum, 2006). Specifically, C. Li and colleagues (2009)
investigated the fMRI activation patterns associated with Stroop test performance across patients
with AD, patients with MCI, and healthy controls. Increased activation in the dorsal anterior
cingulate, bilateral middle and inferior frontal gyri, bilateral inferior parietal lobule, and the
bilateral insula was observed for MCI patients compared to controls (C. Li et al., 2009).
Similarly, Clement and colleagues (2013) reported increased brain activation in frontal brain
regions (i.e. the fronto-striatal network) in some MCI patients during a divided attention task.
These results as well as the current results support the idea that some patients with MCI recruit a
more extensive set of brain resources, including anterior brain regions, during cognitively
oriented tasks, including the Stroop test, working memory tasks, the Clock Drawing Test (CDT),
and driving.
105
The results of the current study also suggest that patients with MCI, relative to healthy controls,
may recruit more brain resources (particularly more anterior regions) as driving conditions
increase in complexity (i.e. from routine right and left turns to left turns with oncoming traffic).
This tendency to exhibit greater activation in frontal regions as task conditions increase in
demand is supported by the results of Berger and colleagues (2015). In this study, patients with
AD and MCI demonstrated increased activation in the left prefrontal network and amygdala as a
working memory task increased in difficulty (Berger et al., 2015).
The Compensation-Related Utilization of Neural Circuits Hypothesis (CRUNCH) model
suggests that at lower levels of task demands, older adults may show overactivation relative to
young adults, corresponding with preserved behavioural performance. However, when task
demands surpass the amount of resources available, older adults will show underactivation
relative to controls, and impaired performance (Angel et al., 2016). The same logic may apply
when comparing individuals with MCI to cognitively healthy older adults; patients with MCI
may show compensatory, overactivation in order to maintain task performance as well
underactivation and behavioural impairment when task demand is too great. This has been
supported in the MCI and cognitive function literature (Angel et al., 2016; Berger et al., 2015;
Clement et al., 2013). The results of Clement and colleagues (2013) suggested that increased
activation in the frontostriatal network was associated with better task performance among
patients with MCI. Furthermore, a compensatory mechanism was supported in a study in which
increased activation in prefrontal regions was observed as working memory tasks increased in
complexity (Berger et al., 2015).
In the current study, the increased activation associated with MCI patients in general relative to
controls as well as during tasks of increasing complexity may represent an attempt to compensate
to maintain task performance. The turning behaviour results of Chapter 3 suggested that drivers
with MCI did not commit significantly more errors compared to controls across any of the
turning conditions (i.e. right turns, left turns, left turns with traffic). Thus, the apparent increase
in recruitment of frontal brain resources may be compensatory in nature, in order to maintain
task performance.
106
However, there may be other explanations for the apparent deviation in activation observed for
the MCI patient group in the current study. An alternative explanation is that this additional
recruitment of frontal brain resources was not task-relevant. Thus, rather than being
compensatory in nature, the activation may have been unrelated to maintenance of performance.
This explanation seems less likely, as patients with MCI showed additional recruitment in frontal
brain regions (e.g. orbitofrontal, superior medial frontal cortex, and middle frontal cortex) that
are associated with cognitive functions known to be associated with driving, including cognitive
control, planning, and higher-order attention.
Finally, another explanation is that the observed increased recruitment of frontal resources was
pathological and represented a decreased efficiency in task performance. Although patients with
MCI did not commit significantly more turning errors compared to controls in Chapter 3, drivers
with MCI committed more errors across all turning conditions, particularly during the left turn
with oncoming traffic condition. Thus, alternatively, the deviation in brain activation of patients
with MCI compared to healthy controls (i.e. increased activation) may represent a decrease in
efficiency in driving performance (i.e. more subtle/minor difficulty, rather than overt driving
difficulty), with the greatest decrease in efficiency being observed during more cognitively
demanding aspects of driving (i.e. left turns with oncoming traffic).
4.3.3 Preliminary Results on Activation Patterns Associated with MCI
Subtypes
The current results provide initial empirical evidence regarding the brain activation patterns that
are associated with two subtypes of MCI—individuals with amnestic single-domain and
amnestic multiple-domain impairment. These preliminary results suggest that different subtypes
of MCI may be associated with considerably different brain activation patterns across driving
conditions. Specifically, whereas patients with sd-MCI tended to show significant positive
activation (across driving conditions) in multiple brain regions in which cognitively healthy

107
individuals do not, patients with md-MCI tended to show the reverse pattern—failure to show
significant activation in regions in which healthy controls demonstrate significant activation.
Patients with sd-MCI demonstrated significant positive activation in multiple brain regions
relative to controls across all turning conditions, particularly in frontal (middle, superior medial,
etc.) and medial regions (insula, temporal regions, etc.). Although this trend held across turning
conditions, this increased activation, predominantly in anterior brain regions (middle frontal
lobes, orbitofrontal regions, and superior medial frontal lobes) was more prominent in the more
cognitively demanding left turn with oncoming traffic condition. Similar to patients with sd-
MCI, patients with md-MCI did show significant positive activation in regions in which controls
did not (e.g. left middle frontal cortex during left turns with traffic); however, in contrast to
patients with sd-MCI, patients with md-MCI did not show significant activation in brain regions
that were activated in healthy controls. This pattern was observed across driving conditions,
primarily in medial and anterior brain regions, such as temporal regions and orbitofrontal
regions. Similar to patients with sd-MCI, results were most pronounced during left turns with
oncoming traffic. Thus, controls demonstrated significant positive activation in the greatest
number of frontal brain regions, relative to patients with md-MCI, during left turns with traffic.
The increased frontal and medial recruitment observed for the sd-MCI may represent (1) a
compensatory process (i.e. maintenance of task performance as discussed below), (2) activation
that is not task-relevant (i.e. unrelated to the maintenance of task performance), or (3) increased
functional changes corresponding with a decrease in efficiency of task performance. Research
conducted by Clement and colleagues (2013) supports the compensatory hypothesis.
Specifically, this group investigated the brain activation patterns that were differentially
characteristic of higher cognitive functioning patients with MCI and lower cognitive functioning
patients with MCI, relative to healthy controls, during divided attention and manipulation tasks.
Consistent with the results of the current study, different brain activation patterns emerged for
the higher cognitive functioning and lower cognitive functioning groups. Specifically, MCI
patients with higher cognitive functioning showed increased activation in the left caudate and
putamen, thalamus, bilateral anterior cingulate cortex, as well as the left middle, inferior, and
superior frontal gyri during either the manipulation or divided attention task (Clement et al.,
108
2013). Furthermore, increased activation in frontal brain regions was associated with increased
task performance, suggesting a compensatory process. These results are consistent with the sd-
MCI group of the current study, whose cognitive deficits were less extensive (i.e. only amnestic
impairment, higher MoCA scores), and who did not commit significantly more errors compared
to healthy controls across any of the turning conditions.
Clement and colleagues (2013) also reported that patients with lower cognitive functioning
showed decreased activation in the left inferior and middle frontal gyri as well as the left
occipitotemporal regions. These results are similar to the md-MCI group of the current study,
whose cognitive deficits were more extensive (i.e. multiple areas of cognitive impairment, lower
MoCA scores) than those with sd-MCI and who showed less activation in anterior and medial
brain regions across driving conditions, relative to healthy controls. Thus, the more extensive and
wide-spread cognitive deficits that are characteristic of md-MCI may be more associated with
failed recruitment of brain regions (relative to cognitively healthy individuals), whereas the
unitary deficits associated with sd-MCI may be more associated with more extensive recruitment
of brain resources (i.e. a greater number of brain regions, relative to cognitively healthy
individuals).
Alternatively, the md-MCI group may have shown more variable recruitment of brain regions
that failed to reach statistical significance across the group, with the greatest variability during
more cognitively demanding aspects of driving, such as making left turns with oncoming traffic.
The sd-MCI group was fairly homogeneous and presented with only memory deficits. However,
md-MCI is highly heterogeneous. Patients within the md-MCI group may have differed in which
cognitive domains were affected in addition to memory (e.g. attention vs. language vs.
visuospatial ability) and the number of cognitive domains affected (i.e. two vs. more areas of
cognitive impairment). As a result, there may be variability in the underlying brain network
changes across patients in this group. Thus, the tendency for patients with md-MCI to show less
recruitment in regions that were significantly activated in healthy controls may reflect a more
variable recruitment of brain regions among individuals that failed to reach statistical
significance across the md-MCI group.

109
4.3.4 Limitations
This study represents an important a fundamental step in advancing the MCI and driving
literature. The current results are the first to identify brain activation patterns that are
characteristic of a group of patients with MCI, including the two amnestic subtypes of MCI—
amnestic sd-MCI and amnestic md-MCI. Despite this important contribution to the literature,
there are important methodological limitations that warrant discussion. Similar to Chapter 3, the
current study is limited by its small sample size, particularly in the subtype fMRI analysis (i.e. 10
patients with md-MCI and 6 patients with sd-MCI). Furthermore, MCI is highly heterogeneous
in nature—in terms of cognitive presentation (i.e. the areas and degree of cognitive impairment)
and driving ability, as corroborated in the results of Chapter 3 (i.e. the high standard deviation
consistently present in the MCI group, across driving variables of interest). Thus, given the small
sample size of the current study, as well as the variable presentation of MCI, it is hard to
generalize results beyond the current sample of MCI patients to the population in general. It is
important for future research to confirm the results of the current study, particularly with a larger
sample of patients with sd-MCI and md-MCI as well as in other subtypes of MCI (discussed
further in Chapter 6: Future Directions).
The current study used fMRI to identify the brain activation patterns of patients with MCI during
various turning conditions. Given the loud noise associated with MRI scanning, potential
research participants with significant hearing loss were excluded from the current study. Hearing
loss has been shown to be associated with MCI (F. R. Lin et al., 2011; Quaranta et al., 2014), and
greater hearing loss is associated with greater impairment in cognitive functioning (F. R. Lin et
al., 2011). Exclusion of participants with significant hearing loss in this study offers a potential
confound, as those with the most significant degree of cognitive impairment may have been
omitted. The exclusion of these patients limits the generalizability of the current results to
patients with MCI who have significant hearing loss. Therefore, it is important to replicate the
current results using other imaging modalities in which exclusion of potential participants with
significant hearing loss is not warranted (e.g. EEG, fNIRS), to provide convergent validity.

110
Furthermore, individuals within the MCI patient groups (i.e. all MCI, md-MCI, sd-MCI) likely
demonstrated variability in terms of brain activation. Increased variability would be expected in
the MCI groups, as the cognitive profiles of individuals within the group are more heterogeneous
compared to the healthy control group. Thus, certain individuals with MCI (and in particular,
those with md-MCI) may have demonstrated unique patterns of brain activation across the
turning conditions. Particularly for the md-MCI patient group, there is a possibility that increased
activation was occurring for individuals within the group; however, the patterns of activation
may have differed between individuals, leading to a lack of significant positive activation for the
md-MCI group as a whole. However, for the MCI patient group as a whole as well as the sd-MCI
group, even with potentially high variation, a significant pattern of activation still emerged
amongst these groups (with proper FDR-adjustments for multiple-comparisons). Thus, even with
high variability and statistical corrections, a pattern still emerged for the group as a whole as well
as sd-MCI. A variability analysis would be important to determine (1) if variability was a factor
contributing to the lack of significant positive activation observed in the md-MCI group, (2)
whether divergent activation patterns were still prevalent for the MCI patient group as a whole as
well as the sd-MCI group.
In addition, the MCI group (particularly those with md-MCI) scored higher on the HADS (total,
anxiety, and depression), a measure of chronic anxiety and depression. Although all participants
had controlled depression and anxiety, it would be important for a future study to add symptoms
of anxiety and depression as a covariate in the fMRI analysis, to ensure that these symptoms
were not contributing to, or driving, the observed patterns of activation. Furthermore,
physiological data was not collected during the fMRI session as a measure of acute stress
response. Although collecting this data does cause some interference with the driving task (i.e.
monitor is placed on the participant’s finger while he/she is driving), it might be important for
future research to collect physiological data correct for this during the pre-processing analysis.
Despite the fact that fMRI is known for its exceptional spatial resolution, ability to acquire
structural and functional images, excellent imaging depth, and moderate temporal resolution,
MRI is highly susceptible to motion and other artifacts. To minimize the effects of motion, and
consequently optimize data, procedures were implemented both during data acquisition and data

111
analysis. During data acquisition, participants were instructed on the importance of staying still
during the scanning procedure, were given feedback on motion after the second training session
(i.e. when structural imaging was acquired), and padding was placed between each participant’s
head and the head coil. Furthermore, multiple, robust pre-processing algorithms have been
developed to correct for motion and other artifacts (e.g. physiological), which were implemented
in the current analysis (Churchill, Oder, et al., 2012). Thus, extensive procedures were used to
minimize motion artifacts.
Finally, similar to Chapter 3 of the current thesis, driving simulation has been repeatedly
scrutinized for being inferior to real-world driving. This is particularly evident in the fMRI
driving simulator set-up, which requires participants to lie down while they are driving. Thus,
current activation results are only applicable to simulated driving. It would be important to
replicate results on-road (i.e. open and closed course) as well as with fully immersive, fixed-
based driving simulators using other imaging modalities, such as EEG and fNIRS.
112
Chapter 5
General Discussion
The results of the Chapter 3 demonstrated that patients with MCI committed significantly more
overall errors during simulated driving. Further analysis showed that patients with MCI may be
at particularly risk of difficulty when maintaining lane control, as demonstrated by committing
significantly more centre line crossings and spending a greater amount of time out of the legal
driving lane compared to a group of cognitively healthy drivers. Although patients with MCI
committed more errors (collisions and lane deviations) than controls across all turning conditions
(right turns, left turns, left turns with oncoming traffic), these results did not reach statistical
significance. This finding is consistent with the results of previous research (Devlin et al., 2012;
Frittelli et al., 2009; Wadley et al., 2009), which suggest that, when looking at patients with MCI
overall as a group, patients with MCI most typically demonstrate minor driving impairments
compared to cognitively healthy drivers, including during lane maintenance.
The behavioural results of Chapter 3 of patients with MCI, as a whole, coincide well with the
neuroimaging results presented in Chapter 4. Specifically, the neuroimaging results of all
patients with MCI suggest that patients exhibit significant positive activation in multiple brain
regions, predominantly medial and frontal brain areas, relative to controls, as driving conditions
increase in complexity (i.e. from right turns to left turns to left turns with oncoming traffic).
Thus, together, the results of Chapter 3 and Chapter 4 suggest that this tendency to recruit a more
extensive set of brain resources may represent a compensatory mechanism (Berger et al., 2015)
and an attempt to maintain task performance. However, this is only a potential explanation, as
the increased activation observed for the MCI patient group may have been unrelated to task
performance or may have represented a decrease in efficiency in task performance.
Most importantly, the current results highlight the importance of looking at different subtypes of
MCI separately when evaluating driving performance, as different patterns of driving behaviour

113
can emerge between subtypes. When looking at all MCI patients together, results suggested that
MCI patients as a whole may experience driving difficulty, particularly in terms of lane
maintenance. However, the results of the subtype analysis revealed that patients with amnestic
MCI who exhibit multiple areas of cognitive impairment (i.e. those with md-MCI) may be at a
greater risk of driving difficulty (compared to healthy controls), relative to patients who
demonstrate impairment only in the domain of memory (i.e. those with sd-MCI). Specifically,
this difficulty in driving performance observed for patients with md-MCI was particularly
prominent during lane maintenance as well as more cognitively demanding aspects of driving,
such as making left turns with oncoming traffic. These results are highly congruent with the
preliminary brain activation patterns of these patient groups as well as the CRUNCH model of
compensation. Specifically, patients with sd-MCI tended to demonstrate significant positive
activation in more brain areas (predominantly medial and frontal regions) relative to healthy
controls across all driving conditions, whereas patients with md-MCI failed to show significant
activation in multiple brain regions (primarily anterior and medial regions) in which healthy
controls demonstrate significant activation. Furthermore, these trends were most pronounced in
patients during left turns with oncoming traffic, which is the most cognitively demanding driving
condition that was investigated, as it requires judgement, visual attention, and decision-making.
In particular, regions that patients with sd-MCI showed significant activation include the superior
medial frontal cortex, orbitofrontal regions, as well as the middle frontal cortex, which are
regions involved in higher-order attention, cognitive control, and planning.
Similar to the analysis looking at MCI patients in general, this greater recruitment of frontal
brain regions observed in the sd-MCI group (relative to healthy control drivers) may represent a
compensatory neural mechanism (Clement et al., 2013)—an attempt to recruit a more extensive
set of brain resources to maintain task performance, as demonstrated by committing a similar
number of errors across turning tasks, even as conditions increased in complexity. In contrast, the
failure of md-MCI group to show significant activation in regions in which cognitively healthy
drivers showed significant activation, may represent a failed attempt to compensate (Clement et
al., 2013), resulting in task impairment (Angel et al., 2016), which is exacerbated as driving
increases in complexity. The behavioural results of Chapter 3 support this, which showed that
patients with md-MCI commit more errors than healthy controls across driving conditions, and

114
most considerably (i.e. reaching statistical significance) during the most cognitively demanding
condition, left turns with oncoming traffic. Alternatively, however, individuals within the md-
MCI group may have shown more variable recruitment of brain regions that failed to reach
statistical significance across the group. Furthermore, the increased recruitment observed for the
sd-MCI group may have been unrelated to task performance or may have represented a decrease
in efficiency in task performance.
The current results highlighted the importance of separating different subtypes of MCI when
evaluating driving performance, as different patterns emerged in terms of behavioural simulated
driving performance as well as brain networks recruited during simulated driving. Providing
empirical evidence regarding the driving behaviours characteristic of two prominent subtypes of
MCI as well as the brain activation patterns associated with MCI during driving represents a
fundamental step in advancing the MCI and driving literature. Currently there are no agreed upon
guidelines or gold standard assessments to help healthcare professionals accurately assess the
driving fitness of individuals with MCI. The current results provide a preliminary understanding
of the underlying changes in brain networks associated with driving that are characteristic of
MCI. These findings lay the foundation for future research in terms of validating current
assessment tools (i.e. do the brain regions recruited during driving overlap with those recruited
during cognitive tasks?) as well as guiding the development of objective driving assessment tools
that better map onto the underlying brain changes associated with patients with MCI. The
identification and implementation of these tools will be essential in assisting healthcare
professionals to assess the driving ability of patients with MCI.
115
Chapter 6
Future Directions
This represents the first study to identify simulated driving behaviours that may be characteristic
of different subtypes of mild cognitive impairment as well as the first study to identify the neural
correlates of driving in patients with MCI. There are a few important next steps that need to be
taken in order to advance the literature on, and ultimately improve the assessment of, driving
performance in patients with MCI.
6.1 Confirming and Validating Areas and Degree of Driving
Impairment Characteristic of MCI and Subtypes of MCI
Importantly, future-large scale research, using both driving simulation and on-road assessments,
is required to confirm the results of the current study in terms of the areas and degree of driving
difficulty characteristic of patients with MCI in general as well as the amnestic multiple-domain
and single-domain subtypes of MCI. In addition, it will be important to identify and validate the
areas of driving difficulty characteristic of other subtypes of MCI (e.g. single-domain executive
and multiple-domains executive).
Driving is a highly complex and multi-faceted task. Furthermore, driving safely requires the
integration of multiple cognitive domains as well as the corresponding brain regions.
Importantly, not all aspects of driving are the same, nor do they recruit the same areas and degree
of cognition or cortical activation. Research using fMRI and driving simulation has supported
this, demonstrating that various aspects of driving are associated with specific and unique
116
patterns of brain activation. For example, the anterior cingulate cortex has been shown to be
linked to performance on a car-following task (Uchiyama et al., 2003) as well as resolving
uncertainty in decision-making at high traffic intersections (Callan et al., 2009). The superior
parietal and occipital regions have been associated with planning and monitoring (Spiers &
Maguire, 2007). Finally, the lateral prefrontal cortex has been associated with processing road
traffic rules (Spiers & Maguire, 2007). The results of these fMRI and driving studies suggest that
each aspect of driving differentially involves the recruitment of distinctive brain regions and,
consequently, cognitive functions.
Given the complex nature of driving, coupled with the heterogeneous cognitive presentations of
MCI, different subtypes of MCI are likely associated with different areas of driving difficulty.
The results of the current study support this, suggesting that patients with amnestic md-MCI
exhibit greater driving difficulty than cognitively healthy individuals, particularly during
cognitively complex aspects of driving (e.g. making left hand turns at a busy intersection) as well
as lane maintenance, whereas patients with amnestic sd-MCI do not exhibit significant
impairment. It is critical for future research to confirm this as well as to identify the areas of
driving difficulty characteristic of other subtypes of MCI. Specifically, a large-scale study should
observe the driving profile characteristic of non-amnestic single-domain subtypes (e.g. single-
domain executive) as well as the non-amnestic multiple domain subtype of MCI (e.g. multiple-
domain executive). For example, given that more complex aspects of driving (e.g. turning at a
high traffic intersection, distracted driving; Callan et al., 2009; Schweizer et al., 2013) have been
shown to be associated with recruitment of frontal brain regions, coupled with the fact that the
frontal lobes have been repeatedly shown to be implicated in executive functions, it follows that
patients with single-domain executive MCI may demonstrate impairment during more complex
and demanding aspects of driving, including left turns at busy intersections.
117
6.1.1 Importance of Converging Results of On-Road and Simulator
Assessments
Combining the results of driving simulation and on-road assessments to identify the driving
performance characteristic of patients with MCI will have important implications. Both on-road
evaluations and driving simulator assessments offer strengths in areas in which the other has
limitations. For example, on-road assessments are limited in their ability to assess a driver’s
response to complex and potentially dangerous situations (e.g. distracted driving, collision
avoidance, etc.), whereas driving simulation is capable of assessing these situations.
Furthermore, despite the fact that driving simulation has been shown to be correlated with
naturalistic driving (i.e. in a non-research setting that is not highly controlled) (Lew et al., 2005)
and on-road driving performance (Bedard et al., 2010; Helland et al., 2013; Lundqvist et al.,
2000; Mayhew et al., 2011; Shechtman et al., 2009), simulators have been scrutinized for being
less realistic compared to real-world driving (E. Chung & Dumont, 2009; de Winter et al., 2009;
Hallvig et al., 2013). In contrast to driving simulation, on-road tests have been shown to be direct
measures of driving ability (Galski et al., 1992) that offer high face validity (Akinwuntan et al.,
2005; Galski et al., 1992).
Using both on-road and simulated driving evaluations to identify the aspects of driving that
patients with MCI (including various subtypes of MCI) consistently demonstrate difficulty as
well as the aspects that are preserved will provide important convergent validity. It would also be
important for these studies to use the results of on-road assessments to assess the validity of
using driving simulation within the population of MCI. Ultimately, these results can be used to
develop and implement comprehensive driving assessments (i.e. likely those that use both
driving simulator and on-road assessment procedures), with high sensitivity and specificity, that
assess a variety of key aspects of driving that patients are known to be at risk for impairment.
This will be critical for isolating drivers with MCI who are at a risk for unsafe driving and, thus,
identifying individuals who should have their license withdrawn or restricted.

118
In particular, the current study was limited in that some non-visual cues are lacking in the
simulator (i.e. auditory, sensorimotor). These cues may be most relevant to one’s performance
during turning, braking, and lane control, which are areas of driving in which those with MCI
demonstrated difficulty compared to healthy controls. There is the potential that the lack of these
cues was more detrimental to the MCI group and contributed to the current results. Thus,
replicating the results on road (i.e. where these non-visual cues are prominent, including the
engines of oncoming vehicles), would be important in validating the results shown in the current
study.
After the areas of driving in which a patient demonstrates difficulty have been identified using a
validated driving assessment, targeted rehabilitation strategies (i.e. both cognitive and simulator-
based programs) can be developed and implemented on an individual basis, tailored to the unique
presentation of each patient. For example, if a particular patient with MCI demonstrates
difficulty with gap judgement and decision making at controlled intersections (e.g. left turns at
traffic lights) on a validated driving assessment procedure, driving simulator-based rehabilitation
strategies could be applied to help retrain this aspect of driving and improve the driving safety of
the patient. After the rehabilitation procedures are completed, the patient can be re-assessed
using the validated driving assessment. Driving is a significant source of independence and
mobility for older adults. Offering effective rehabilitation programs to retrain driving ability in
patients with MCI will potentially help reinstate the licenses of these patients and will be
important for maintaining the autonomy of these individuals. Furthermore, demonstrating the
level of responsiveness of patients with different subtypes of MCI will be important, as some
groups (e.g. those with amnestic md-MCI due to underlying AD pathology) may have
progressive conditions that make them unresponsive to the effects of training or in which training
effects may only have short-term benefits.
6.1.2 Potential Policy Implications of Driving in Patients with MCI
Although current guidelines state that moderate to severe AD or related dementia is a
contraindication to safe driving (American Medical Association, 2010; Canadian Medical
119
Assocation, 2012; Driver and Vehicle Licensing Agency, 2014), physicians and other healthcare
professionals currently have no guidelines to help assess the driving safety of patients with mild
AD or MCI. The results of the current study suggest that some patients with MCI, particularly
individuals with md-MCI, may be at higher risk for driving difficulties. Furthermore, a recent
meta-analysis conducted by Hird and colleagues (2016) showed that patients with very mild and
mild AD (CDR = 0.5, 1.0) most commonly received a pass (or safe) rating on an on-road
assessment; however, patients with AD had a fail rate 10 times greater than cognitively healthy
drivers. These results suggest that even patients with mild Alzheimer’s disease may be at risk of
driving impairment and that there should be driving guidelines specific to this patient group.
Despite this, however, there is currently a lack of data to inform driving guidelines in MCI and
mild AD.
The absence of concrete guidelines is a huge issue that needs to be addressed, so that physicians
and other healthcare professionals can better assess the driving safety of patients with MCI and
mild AD. If specific areas of impairment are identified in MCI and its various subtypes,
physicians and other healthcare professionals can ask patients and caregivers about these specific
areas of driving and whether any self-reported difficulties are present. In cases in which the
patient or caregiver report concern, or the physician suspects that performance in a certain aspect
of driving may be compromised, patients can be referred for a comprehensive, validated
assessment procedure conducted by a driving expert.
6.2 Isolating Brain Activation Patterns Associated with Driving and
Driving Impairment in MCI and Subtypes of MCI
Exacerbating the issue of limited guidelines is the lack of objective, valid screening tools to
assist physicians and other healthcare professionals in identifying patients who may be at an
increased risk for driving impairment and, consequently, should be referred for a more

120
comprehensive assessment of driving ability (Hird et al., 2016; Molnar et al., 2006). Thus, it is
critical that future research identify accurate assessment tools with high sensitivity and
specificity.
6.2.1 Confirming and Validating Current Results
The neuroimaging results of the current study represent the first step in addressing this issue.
Specifically, the current study is the first to identify the brain activation patterns characteristic of
patients with MCI, as well as explore those associated with different subtypes of MCI, across
driving tasks of varying levels of complexity. Current results suggest that patients with MCI as a
whole (significantly) activate more brain regions, particularly frontal brain regions, relative to
controls. This significant activation in frontal brain regions was observed across all aspects of
driving and increased during more cognitively demanding driving situations (i.e. left turns with
oncoming traffic). Furthermore, preliminary results suggest that sd-MCI may be associated with
greater recruitment of frontal and medial brain regions across driving conditions, whereas md-
MCI may differentially be associated with less recruitment of frontal and medial brain regions
across the same conditions. It would be important to determine whether the tendency for patients
with md-MCI to not show significant activation in brain regions that were significantly activated
by healthy controls is due to variability in the recruitment of brain regions across the group.
It is critical for future research to confirm the generalizability of the current results in a larger
sample of patients with MCI. This is particularly important for the amnestic sd-MCI and
amnestic md-MCI subtypes of MCI due to the small sample size for each group in the current
study. In addition, it would be important for future research to identify the neural activation
pattern unique to non-amnestic single domain (e.g. executive-domain) and non-amnestic multiple
domain subtypes of MCI. Furthermore, after isolating the brain activation patterns characteristic
of the various subtypes of MCI, it would be important to determine if there are certain patterns
and regions of activation consistent across all subtypes and, therefore, representative of MCI
patients in general.

121
6.2.2 Neural Correlates of Actual Driving Impairment in MCI and Cognitive
Associations with Activation Patterns
In addition to isolating the neural correlates of different aspects of driving (i.e. during turning,
car following, etc.), it is essential that research explore the brain regions associated with actual
driving impairment in patients with MCI as well as the various subtypes of MCI. Given that
cognitive tools are needed to screen patients and identify individuals who are at risk for unsafe
driving, it is essential to understand the brain regions that are implicated in actual driving
impairment. Determining the brain regions and related cognitive functions that are associated
with driving impairment would be an important next step in the isolating current cognitive tests
and potentially the development of other assessment tools that are accurate and valid predictors
of these driving impairments. The results of the behavioural portion of the current study (Chapter
3) as well as the results of Wadley and colleagues (2009) suggest that patients with MCI have
difficulty in global driving performance as well as difficulties maintaining proper lane
positioning. Current results suggested that patients with MCI, and more specifically, patients
with md-MCI, commit more centre line crossings and spend a greater percentage of time out of
the legal driving lane than cognitively healthy drivers. Given the low sample size in both studies,
and consequently the low statistical power, future research is required to confirm the current
results, further evaluate left turns to establish if this is an additional area of concern among
patients, and identify other specific areas of impairment in patients with MCI and its subtypes.
Finally, performance on assessment tools that are repeatedly utilized in the cognitive impairment
and driving literature could be correlated with the brain activation patterns that are associated
with impaired driving performance to further assess their utility. Furthermore, new cognitive
tools tapping into these brain regions could potentially be developed and validated. One
important way to validate current tools, and guide the development of future tools, is to combine
fMRI, tablet (F. Tam, Churchill, Strother, & Graham, 2011), and driving simulator technologies.
This approach can be used to determine the extent to which the brain regions recruited during
cognitive tests that are widely cited in the driving literature (e.g. TMT, Maze tests) map onto the
brain activation patterns associated with driving impairment in patients with MCI and its
subtypes.
122
Chapter 7
Conclusions
Currently there are no tools with sufficient sensitivity and specificity to assist healthcare
professionals in assessing the driving fitness of patients with MCI. Identifying the brain
activation patterns associated with simulated driving in patients with MCI represents a
fundamental and first step in the ultimate development of valid screening tools that can be used
in a clinical setting. This is the first study to identify the driving behaviours that may be
characteristic of different subtypes of MCI as well as the first study to identify the neural
correlates of simulated driving in patients with MCI. In the current study, patients with MCI, as a
whole, committed more simulated driving errors overall and during lane maintenance. This
behavioural finding is consistent with the neuroimaging results of the current study, which
showed that patients with MCI exhibited increased activation in multiple brain regions, relative
to controls, across turning conditions. In particular, patients with MCI showed increased
recruitment of frontal resources (i.e. significant positive activation in more frontal regions
relative to controls), predominantly during cognitively demanding left turns with oncoming
traffic. Given that patients with MCI demonstrated minor difficulties rather than definitive
impairment (i.e. results did not reach statistical significance) across turning conditions, this
increased frontal activation may represent a compensatory mechanism (Clement et al., 2013) and
an attempt to maintain driving performance, resulting in more mild rather than definitive driving
impairment.
In addition, current results suggest that certain subtypes of MCI (i.e. amnestic sd-MCI and md-
MCI) may be associated with different degrees of driving impairment and corresponding brain
activation patterns. Specifically, individuals with md-MCI may be at risk for more substantial
driving difficulty, particularly during more cognitively demanding aspects of driving (e.g. left
turns with oncoming traffic, lane maintenance). Furthermore, patients with md-MCI failed to
exhibit significant activation in multiple frontal and medial regions that were significantly
123
activated by cognitively healthy individuals across driving tasks. However, this finding was most
pronounced during left turns with oncoming traffic, the condition in which this patients group
exhibited the most substantial driving difficulty. In contrast, patients with sd-MCI did not
perform significantly worse than cognitively healthy drivers across any of the investigated
driving variables, and patients with sd-MCI tended to show significant positive activation in
regions, predominantly medial and frontal regions, in which healthy controls did not. This
increased recruitment of frontal brain regions was most pronounced during the left turn with
oncoming traffic condition. Both these activation patterns (i.e. those associated with sd-MCI and
md-MCI) may represent an attempt to compensate—potentially a successful compensation as
demonstrated by recruitment of a more extensive set of brain resources in the sd-MCI to maintain
task performance similar to healthy controls and a less extensive recruitment of resources in the
md-MCI drivers, potentially representing an inability to compensate and resulting in behavioural
driving impairment (Angel et al., 2016; Clement et al., 2013).
Future research is needed to: (1) confirm and validate the areas and degree of driving impairment
characteristic of patients with MCI and its various subtypes (i.e. amnestic, non-amnestic, single-
domain, multiple- domain) using both on-road and driving simulator assessments, (2) identify the
brain activation patterns associated with actual driving impairment in patients with MCI, and (3)
use these results to guide the development and validation of comprehensive driving assessment
methods. These research directions will be important for identifying objective assessment tools,
developing concrete driving guidelines, and developing targeted rehabilitation strategies to help
physicians and other healthcare professionals assess and re-train driving ability in patients with
MCI.

124
References
Ackerman, M. L., Vance, D. E., Wadley, V. G., & Ball, K. K. (2010). Indicators of self-rated
driving across 3 years among a community-based sample of older adults. Transportation
Research Part F: Traffic Psychology and Behaviour, 13(5), 307–314.
http://doi.org/10.1016/j.str.2010.08.012.Structure
Adrian, J., Postal, V., Moessinger, M., Rascle, N., & Charles, A. (2011). Personality traits and
executive functions related to on-road driving performance among older drivers. Accident;
Analysis and Prevention, 43(5), 1652–9. http://doi.org/10.1016/j.aap.2011.03.023
Akinwuntan, A. E., De Weerdt, W., Feys, H., Baten, G., Arno, P., & Kiekens, C. (2005). The
validity of a road test after stroke. Archives of Physical Medicine and Rehabilitation, 86(3),
421–426. http://doi.org/10.1016/j.apmr.2004.04.047
Akinwuntan, A. E., Devos, H., Stepleman, L., Casillas, R., Rahn, R., Smith, S., & Williams, M.
J. (2013). Predictors of driving in individuals with relapsing-remitting multiple sclerosis.
Multiple Sclerosis Journal, 19(3), 344–350. http://doi.org/10.1177/1352458512451944
Akinwuntan, A. E., DeWeerdt, W., Feys, H., Baten, G., Arno, P., & Kiekens, C. (2003).
Reliability of a road test after stroke. Archives of Physical Medicine and Rehabilitation,
84(12), 1792–1796. http://doi.org/10.1016/S0003-9993(03)00767-6
Akinwuntan, A. E., Feys, H., De Weerdt, W., Baten, G., Arno, P., & Kiekens, C. (2006).
Prediction of driving after stroke: a prospective study. Neurorehabilitation and Neural
Repair, 20(3), 417–423. http://doi.org/10.1177/1545968306287157
Akinwuntan, A. E., Feys, H., DeWeerdt, W., Pauwels, J., Baten, G., & Strypstein, E. (2002).
Determinants of driving after stroke. Archives of Physical Medicine and Rehabilitation,
83(3), 334–341. http://doi.org/10.1053/apmr.2002.29662
Akinwuntan, A. E., O’Connor, C., McGonegal, E., Turchi, K., Smith, S., Williams, M., &
Wachtel, J. (2012). Prediction of driving ability in people with relapsing-remitting multiple
sclerosis using the stroke driver screening assessment. International Journal of MS Care,
14(2), 65–70. http://doi.org/10.7224/1537-2073-14.2.65
Albert, M. S., DeKosky, S. T., Dickson, D., Dubois, B., Feldman, H. H., Fox, N. C., … Phelps,
C. H. (2011). The diagnosis of mild cognitive impairment due to Alzheimer’s disease:
Recommendations from the National Institute on Aging-Alzheimer’s Association

125
workgroups on diagnostic guidelines for Alzheimer’s disease. Alzheimer’s & Dementia, 7,
270–279. http://doi.org/10.1016/j.jalz.2011.03.008
Alzheimer's Association. (2016). Alzheimer’s & Dementia: Mild Cognitive Impairment.
Retrieved from http://www.alz.org/dementia/mild-cognitive-impairment-mci.asp
American Medical Association. (2010). Assessing and Counseling Older Drivers 2nd Edition.
Angel, L., Bastin, C., Genon, S., Salmon, E., Fay, S., Balteau, E., … Collette, F. (2016). Neural
correlates of successful memory retrieval in aging: Do executive functioning and task
difficulty matter? Brain Research, 1631, 53–71.
http://doi.org/10.1016/j.brainres.2015.10.009
Aretouloi, E., & Brandt, J. (2010). Everyday functioning in mild cognitive impairment and its
relationship with executive cognition. Internation Journal of Geriatric Psychiatry, 25, 224–
233. http://doi.org/10.1002/gps.2325.Everyday
Artero, S., Touchon, J., & Ritchie, K. (2001). Disability and mild cognitive impairment: A
longitudinal population-based study. International Journal of Geriatric Psychiatry, 16,
1092–1097. http://doi.org/10.1002/gps.477
Bai, F., Zhang, Z., Yu, H., Shi, Y., Yuan, Y., Zhu, W., … Qian, Y. (2008). Default-mode
network activity distinguishes amnestic type mild cognitive impairment from healthy aging:
A combined structural and resting-state functional MRI study. Neuroscience Letters, 438(1),
111–115. http://doi.org/10.1016/j.neulet.2008.04.021
Bakker, A., Albert, M. S., Krauss, G., Speck, C. L., & Gallagher, M. (2015). Response of the
medial temporal lobe network in amnestic mild cognitive impairment to therapeutic
intervention assessed by fMRI and memory task performance. NeuroImage: Clinical, 7,
688–698. http://doi.org/10.1016/j.nicl.2015.02.009
Ball, K., & Owsley, C. (1993). The Useful Field of View test: A new technique for evaluating
age-related declines in visual function. Journal of the American Optometric Association.
Barrash, J., Stillman, A., Anderson, S. W., Uc, E. Y., Dawson, J. D., & Rizzo, M. (2010).
Prediction of driving ability with neuropsychological tests: Demographic adjustments
diminish accuracy. Journal of the International Neuropsychological Society, 16(4), 679–
686. ELEC.
Barthel, H., Seibyl, J., & Sabri, O. (2015). The role of positron emission tomography imaging in
understanding Alzheimer’s disease. Expert Reviews of Neurotherapeutics, 15(4), 395–406.
126
http://doi.org/10.1586/14737175.2015.1023296
Bauckneht, M., Picco, A., Nobili, F., & Morbelli, S. (2015). Amyloid positron emission
tomography and cognitive reserve. World Journal of Radiology, 7(12), 475–484.
http://doi.org/10.4329/wjr.v7.i12.475
Bedard, M., Parkkari, M., Weaver, B., Riendeau, J., & Dahlquist, M. (2010). Assessment of
driving performance using a simulator protocol: Validity and reproducibility. The American
Journal of Occupational Therapy, 64(2), 336–340.
Bennett, J. M., Chekaluk, E., & Batchelor, J. (2016). Cognitive tests and determining fitness to
drive in dementia: A systematic review. Journal of the American Geriatrics Society, [Epub
ahead of print]. http://doi.org/10.1111/jgs.14180
Berger, C., Erbe, A.-K., Ehlers, I., Marx, I., Hauenstein, K., & Teipel, S. (2015). Effects of task-
irrelevant emotional stimuli on working memory processes in mild cognitive impairment.
Journal of Alzheimer’s Disease, 44(2), 439–453. http://doi.org/10.3233/JAD-141848
Bieliauskas, L. A., Roper, B. R., Trobe, J., Green, P., & Lacy, M. (1998). Cognitive measures,
driving safety, and Alzheimer’s Disease. The Clinical Neuropsychologist, 12(2), 206–212.
Bocéréan, C., & Dupret, E. (2014). A validation study of the Hospital Anxiety and Depression
Scale (HADS) in a large sample of French employees. BMC Psychiatry, 14(354), 1–11.
http://doi.org/10.1186/s12888-014-0354-0
Bokde, A. L. W., Karmann, M., Born, C., Teipel, S. J., Omerovic, M., Ewers, M., … Hampel, H.
(2010). Altered brain activation during a verbal working memory task in subjects with
amnestic mild cognitive impairment. Journal of Alzheimer’s Disease, 21(1), 103–118.
http://doi.org/10.3233/JAD-2010-091054
Brooks, J. O., Goodenough, R. R., Crisler, M. C., Klein, N. D., Alley, R. L., Koon, B. L., …
Wills, R. F. (2010). Simulator sickness during driving simulation studies. Accident Analysis
and Prevention, 42(3), 788–796. http://doi.org/10.1016/j.aap.2009.04.013
Brown, L. B., Ott, B. R., Papandonatos, G. D., Sui, Y., Ready, R. E., & Morris, J. C. (2005).
Prediction of on-road driving performance in patients with early Alzheimer’s disease.
Journal of the American Geriatric Society, 53, 94–98.
Brown, L. B., Stern, R. A., Cahn-Weiner, D. A., Rogers, B., Messer, M. A., Lannon, M. C., …
Ott, B. R. (2005). Driving scenes test of the Neuropsychological Assessment Battery (NAB)
and on-road driving performance in aging and very mild dementia. Archives of Clinical

127
Neuropsychology, 20(2), 209–215. JOUR.
Bueno, M., Fabrigoule, C., Deleurence, P., Ndiaye, D., & Fort, A. (2012). An
electrophysiological study of the impact of a Forward Collision Warning System in a
simulator driving task. Brain Research, 1470, 69–79.
http://doi.org/10.1016/j.brainres.2012.06.027
Burton, C. L., Strauss, E., Bunce, D., Hunter, M. A., & Hultsch, D. F. (2009). Functional abilities
in older adults with mild cognitive impairment. Gerontology, 55, 570–581.
http://doi.org/10.1159/000228918
Busse, A., Bischkopf, J., Riedel-Heller, S. G., & Angermeyer, M. C. (2003). Mild cognitive
impairment: prevalence and incidence according to different diagnostic criteria: Results of
the Leipzig Longitudinal Study of the Aged ( LEILA75+). British Journal of Psychiatry,
182, 449–454. http://doi.org/10.1192/bjp.02.296
Busse, A., Hensel, A., Gühne, U., Angermeyer, M. C., & Riedel-Heller, S. G. (2006). Mild
cognitive impairment: Long-term course of four clinical subtypes. Neurology, 67, 2176–
2185. http://doi.org/10.1212/01.wnl.0000249117.23318.e1
Cai, S., Chong, T., Peng, Y., Shen, W., Li, J., von Deneen, K. M., & Huang, L. (2016). Altered
functional brain networks in amnestic mild cognitive impairment: A resting-state fMRI
study. Brain Imaging and Behavior, 1–13. http://doi.org/10.1007/s11682-016-9539-0
Calhoun, V. D., Pekar, J. J., McGinty, V. B., Adali, T., Watson, T. D., & Pearlson, G. D. (2002).
Different activation dynamics in multiple neural systems during simulated driving. Human
Brain Mapping, 16(3), 158–167. http://doi.org/10.1002/hbm.10032
Callan, A. M., Osu, R., Yamagishi, Y., Callan, D. E., & Inoue, N. (2009). Neural correlates of
resolving uncertainty in driver’s decision making. Human Brain Mapping, 30(9), 2804–
2812. http://doi.org/10.1002/hbm.20710
Canadian Consensus on Diagnosis and Treatment of Dementia Working Group. (2007). 3rd
Canadian Consensus Conference on Diagnosis and Treatment of Dementia
Recommendations.
Canadian Medical Assocation. (2012). CMA driver’s guide: Determining medical fitness to
operate motor vehicles 8th edition.
Chacko, E. E., Wright, W. M., Worrall, R. C., Adamson, C., & Cheung, G. (2015). Reactions to
driving cessation: a qualitative study of people with dementia and their families.

128
Australasian Psychiatry : Bulletin of Royal Australian and New Zealand College of
Psychiatrists, 23(5), 496–9. http://doi.org/10.1177/1039856215591326
Chen, J. E., & Glover, G. H. (2015). Functional Magnetic Resonance Imaging Methods.
Neuropsychology Review, 25(3), 289–313. http://doi.org/10.1007/s11065-015-9294-9
Chung, E., & Dumont, A.-G. (2009). Transport Simulation: Beyond Traditional Approaches (1st
Ed). EPFL Press.
Chung, S. C., Choi, M. H., Kim, H. S., You, N. R., Hong, S. P., Lee, J. C., … Kim, H. J . (2014).
Effects of distraction task on driving: A functional magnetic resonance imaging study. Bio-
Medical Materials and Engineering, 24(6), 2971–2977. http://doi.org/10.3233/BME-
141117
Churchill, N. W., Oder, A., Abdi, H., Tam, F., Lee, W., Thomas, C., … Strother, S. (2012).
Optimizing preprocessing and analysis pipelines for single-subject fMRI. I. Standard
temporal motion and physiological noise correction methods. Human Brain Mapping, 33(3),
609–627.
Churchill, N. W., Yourganov, G., Oder, A., Tam, F., Graham, S. J., & Strother, S. C. (2012).
Optimizing preprocessing and analysis pipelines for single-subject fMRI: 2. interactions
with ICA, PCA, task contrast and inter-subject heterogeneity. PLoS ONE, 7(2).
http://doi.org/10.1371/journal.pone.0031147
Classen, S., Bewernitz, M., & Shechtman, O. (2011). Driving simulator sickness: An evidence-
based review of the literature. American Journal of Occupational Therapy, 65, 179–188.
http://doi.org/10.5014/ajot.2011.000802
Classen, S., & Brooks, J. (2014). Driving simulators for occupational therapy screening,
assessment, and intervention. Occupational Therapy in Health Care, 28(2), 154–162.
http://doi.org/10.3109/07380577.2014.901590
Classen, S., Wang, Y., Crizzle, A. M., Winter, S. M., & Lanford, D. N. (2013). Predicting older
driver on-road performance by means of the Useful Field of View and Trail Making Test
Part B. American Journal of Occupational Therapy, 67(5), 574–582.
http://doi.org/10.5014/ajot.2013.008136
Clement, F., Gauthier, S., & Belleville, S. (2013). Executive functions in mild cognitive
impairment: Emergence and breakdown of neural plasticity. Cortex, 49(5), 1268–1279.
http://doi.org/10.1016/j.cortex.2012.06.004

129
Coeckelbergh, T. R. ., Brouwer, W. ., Cornelissen, F. ., van Wolffelaar, P., & Kooijman, A. .
(2002). The Effect of Visual Field Defects on Driving Performance. Archives of
Opthamology, 120, 1510–1516.
Cox, D. J., Quillian, W. C., Thorndike, F. P., Kovatchev, B. P., & Hanna, G. (1998). Evaluating
driving performance of outpatients with Alzheimer disease. The Journal of the American
Board of Family Practice, 11(4), 264–271.
Cox, R. (1996). AFNI: Software for analysis and visualization of functional magnetic resonance
neuroimages. Computers and Biomedical Research, an International Journal, 29(3), 162–
173.
Crosson, B., Ford, A., McGregor, K. M., Meinzer, M., Cheshkov, S., Li, X., … Briggs, R. W.
(2010). Functional imaging and related techniques: An introduction for rehabilitation
researchers. Journal of Rehabilitation Research and Development, 47(2), 1–33.
http://doi.org/10.1682/JRRD.2010.02.0017
Croston, J., Meuser, T. M., Berg-Weger, M., Grant, E. A., & Carr, D. B. (2009). Driving
retirement in older adults with dementia. Topics in Geriatric Rehabilitation, 25(2), 154–
162. http://doi.org/10.1097/TGR.0b013e3181a103fd
Dahal, N., Nandagopal, N., Cocks, B., Vijayalakshmi, R., Dasari, N., & Gaertner, P. (2014).
TVAR modeling of EEG to detect audio distraction during simulated driving. Journal of
Neural Engineering, 11(36012), 1–14. http://doi.org/10.1088/1741-2560/11/3/036012
Darvesh, S., Leach, L., Black, S. E., Kaplan, E., & Freedman, M. (2005). The Behavioural
Neurology Assessment. Canadian Journal of Neurological Sciences, 32, 167–177.
Davis, J. D., Papandonatos, G. D., Miller, L. A., Hewitt, S. D., Festa, E. K., Heindel, W. C., &
Ott, B. R. (2012). Road test and naturalistic driving performance in healthy and cognitively
impaired older adults: Does environment matter? Journal of the American Geriatrics
Society, 60(11), 2056–2062. http://doi.org/10.1111/j.1532-5415.2012.04206.x
Dawson, J. D., Anderson, S. W., Uc, E. Y., Dastrup, E., & Rizzo, M. (2009). Predictors of
driving safety in early Alzheimer disease. Neurology, 72, 521–527.
de Winter, J. C. F., de Groot, S., Mulder, M., Wieringa, P. A., Dankelman, J., & Mulder, J. A.
(2009). Relationships between driving simulator performance and driving test results.
Ergonomics, 52(2), 137–153. http://doi.org/10.1080/00140130802277521
Dehning, M., Kim, J., Nguyen, C. M., Shivapour, E., & Denburg, N. L. (2014).
130
Neuropsychological performance, brain imaging, and driving violations in multiple
sclerosis. Archives of Physical Medicine and Rehabilitation, 95(10), 1818–1823.
http://doi.org/10.1016/j.apmr.2014.05.022
Devlin, A., McGillivray, J., Charlton, J., Lowndes, G., & Etienne, V. (2012). Investigating
driving behaviour of older drivers with mild cognitive impairment using a portable driving
simulator. Accident Analysis and Prevention, 49, 300–307.
Devos, H., Brijs, T., Alders, G., Wets, G., & Feys, P. (2013). Driving performance in persons
with mild to moderate symptoms of multiple sclerosis. Disability & Rehabilitation, 35(16),
1387–1393. http://doi.org/10.3109/09638288.2012.731468
Dobbs, A. R. (2013). Accuracy of the DriveABLE cognitive assessment to determine cognitive
fitness to drive Recherche Précision de l ’ instrument d ’ évaluation cognitive DriveABLE
pour évaluer la capacité cognitive de conduire, 59, 156–161.
Domeyer, J. E., Cassavaugh, N. D., & Backs, R. W. (2013). The use of adaptation to reduce
simulator sickness in driving assessment and research. Accident Analysis and Prevention,
53, 127–132. http://doi.org/10.1016/j.aap.2012.12.039
Driver and Vehicle Licensing Agency. (2014). DVLA’s current medical guidelines for
professionals. Retrieved from https://www.gov.uk/current-medical-guidelines-dvla-
guidance-for-professionals-conditions-s-to-u
Driving and Parkinson’s disease. (1990). The Lancet, 336(8718), 781.
Duchek, J. M., Carr, D. B., Hunt, L., Roe, C. M., Xiong, C., Shah, K., & Morris, J. C. (2003).
Longitudinal driving performance in early-stage dementia of the Alzheimer type. Journal of
the American Geriatrics Society, 51(10), 1342–1347.
Duchek, J. M., Hunt, L., Ball, K., Buckles, V., & Morris, J. C. (1998). Attention and driving
performance in Alzheimer ’ s disease. The Journals of Gerontology, 53B(2), 130–141.
Eby, D. W., & Molnar, L. J. (2010). Driving fitness and cognitive impairment: issues for
physicians. JAMA, 303(16), 1642–1643.
Edwards, J. D., Bart, E., O’Connor, M. L., & Cissell, G. (2010). Ten years down the road:
Predictors of driving cessation. Gerontologist, 50(3), 393–399.
http://doi.org/10.1093/geront/gnp127
Farias, S. T., Cahn-Weiner, D. A., Harvey, D. J., Reed, B. R., Mungas, D., Kramer, J. H., &
Chui, H. (2010). Longitudinal changes in memory and executive functioning are associated
131
with longitudinal change in instrumental activities of daily living in older adults. Clinical
Neuropsychology, 23, 446–461. http://doi.org/10.1080/13854040802360558.Longitudinal
Fitten, L. J., Perryman, K. M., Wilkinson, C. J., Little, R. J., Burns, M. M., Pachana, N., …
Ganzell, S. (1995). Alzheimer and Vascular Dementias and Driving: A Prospective
Labratory Study. JAMA, 273(17), 1360–1365.
Fong, T. C. T., & Ho, R. T. H. (2014). Testing gender invariance of the Hospital Anxiety and
Depression Scale using the classical approach and Bayesian approach. Quality of Life
Research, 23, 1421–1426. http://doi.org/10.1007/s11136-013-0594-3
Fort, A., Martin, R., Jacquet-Andrieu, A., Combe-Pangaud, C., Foliot, G., Daligault, S., &
Delpuech, C. (2010). Attentional demand and processing of relevant visual information
during simulated driving: A MEG study. Brain Research, 1363, 117–127.
http://doi.org/10.1016/j.brainres.2010.09.094
Foster, C. M., Addis, D. R., Ford, J. H., Kaufer, D. I., Burke, J. R., Browndyke, J. N., …
Giovanello, K. S. (2016). Prefrontal contributions to relational encoding in amnestic mild
cognitive impairment. NeuroImage: Clinical, 11, 158–166.
http://doi.org/10.1016/j.nicl.2016.01.008
Freeman, E. E., Gange, S. J., Munoz, B., & West, S. K. (2006). Driving status and risk of entry
into long-term care in older adults. American Journal of Public Health, 96(7), 1254–1259.
http://doi.org/10.2105/AJPH.2005.069146
Freitas, S., Prieto, G., Simoes, M. R., & Santana, I. (2014). Psychometric properties of the
Montreal Cognitive Assessment (MoCA): An analysis using the Rasch model. The Clinical
Neuropsychologist, 28, 65–83. http://doi.org/10.1080/13854046.2013.870231
Frings, L., Hellwig, S., Spehl, T. S., Bormann, T., Buchert, R., Vach, W., … Meyer, P. T.
(2015). Asymmetries of amyloid-β burden and neuronal dysfunction are positively
correlated in Alzheimer’s disease. Brain, 138, 3089–3099.
http://doi.org/10.1093/brain/awv229
Frittelli, C., Borghetti, D., Iudice, G., Bonanni, E., Maestri, M., Tognoni, G., … Iudice, A.
(2009). Effects of Alzheimer’s disease and mild cognitive impairment on driving ability : a
controlled clinical study by simulated driving test. International Journal of General
Psychiatry, 24, 232–238. http://doi.org/10.1002/gps
Galski, T., Bruno, R. L., & Ehle, H. T. (1992). Driving after cerebral damage: a model with

132
implications for evaluation. The American Journal of Occupational Therapy, 46(4), 324–32.
George, S., & Crotty, M. (2010). Establishing criterion validity of the Useful Field of View
assessment and Stroke Drivers’ Screening Assessment: comparison to the result of on-road
assessment. The American Journal of Occupational Therapy, 64(1), 114–122.
Gherri, E., & Forster, B. (2015). Independent effects of eye gaze and spatial attention on the
processing of tactile events: Evidence from event-related potentials. Biological Psychology,
109, 239–247. http://doi.org/10.1016/j.biopsycho.2015.05.008
Gibbons, C., Mullen, N., Weaver, B., Reguly, P., & Bédard, M. (2014). One- and three-screen
driving simulator approaches to evaluate driving capacity: evidence of congruence and
participants’ endorsement. American Journal of Occupational Therapy, 68(3), 344–352.
http://doi.org/10.5014/ajot.2014.010322
Gold, D. A. (2012). An examination of instrumental activities of daily living assessment in older
adults and mild cognitive impairment. Journal of Clinical and Experimental
Neuropsychology, 34, 11–34. http://doi.org/10.1080/13803395.2011.614598
Goldstein, F. C., Ashley, A. V, Miller, E., Alexeeva, O., Zanders, L., & King, V. (2014). Validity
of the montreal cognitive assessment as a screen for mild cognitive impairment and
dementia in African Americans. Journal of Geriatric Psychiatry and Neurology, 27(3),
199–203. http://doi.org/10.1177/0891988714524630
Grace, J., Amick, M. M., D’Abreu, A., Festa, E. K., Heindel, W. C., & Ott, B. R. (2005).
Neuropsychological deficits associated with driving performance in Parkinson’s and
Alzheimer’s disease. Journal of the International Neuropsychological Society, 11(6), 766–
775. JOUR. http://doi.org/10.1017/S1355617705050848.Neuropsychological
Graydon, F. X., Young, R., Benton, M. D., Genik, R. J., Posse, S., Hsieh, L., & Green, C. (2004).
Visual event detection during simulated driving: Identifying the neural correlates with
functional neuroimaging. Transportation Research Part F: Traffic Psychology and
Behaviour, 7(4–5), 271–286. http://doi.org/10.1016/j.trf.2004.09.006
Hallvig, D., Anund, A., Fors, C., Kecklund, G., Karlsson, J. G., Wahde, M., & Åkerstedt, T.
(2013). Sleepy driving on the real road and in the simulator: A comparison. Accident
Analysis and Prevention, 50, 44–50. http://doi.org/10.1016/j.aap.2012.09.033
Han, J. W., Kim, T. H., Lee, S. B., Park, J. H., Lee, J. J., Huh, Y., … Kim, K. W. (2012).
Predictive validity and diagnostic stability of mild cognitive impairment subtypes.

133
Alzheimer’s & Dementia, 8, 553–559. http://doi.org/10.1016/j.jalz.2011.08.007
Harada, H., Nashihara, H., Morozumi, K., Ota, H., & Hatakeyama, E. (2007). A comparison of
cerebral activity in the prefrontal region between young adults and the elderly while driving.
Journal of Physiological Anthropology, 26(3), 409–414. http://doi.org/10.2114/jpa2.26.409
Hargrave, D. D., Nupp, J. M., & Erickson, R. J. (2012). Two brief measures of executive
function in the prediction of driving ability after acquired brain injury. Neuropsychological
Rehabilitation, 22(4), 489–500. http://doi.org/10.1080/09602011.2012.662333
Haufe, S., Kim, J.-W., Kim, I.-H., Sonnleitner, A., Schrauf, M., Curio, G., & Blankertz, B.
(2014). Electrophysiology-based detection of emergency braking intention in real-world
driving. Journal of Neural Engineering, 11(56011), 1–8. http://doi.org/10.1088/1741-
2560/11/5/056011
Hays, C. C., Zlatar, Z. Z., & Wierenga, C. E. (2016). The Utility of Cerebral Blood Flow as a
Biomarker of Preclinical Alzheimer’s Disease. Cellular and Molecular Neurobiology, 1–13.
http://doi.org/10.1007/s10571-015-0261-z
Helland, A., Jenssen, G. D., Lervåg, L. E., Westin, A. A., Moen, T., Sakshaug, K., … Slørdal, L.
(2013). Comparison of driving simulator performance with real driving after alcohol intake:
A randomised, single blind, placebo-controlled, cross-over trial. Accident Analysis and
Prevention, 53, 9–16. http://doi.org/10.1016/j.aap.2012.12.042
Herholz, K. (2011). Perfusion SPECT and FDG-PET. International Psychogeriatrics, 23(S2),
S25–S31. http://doi.org/10.1017/S1041610211000937
Higgins, K. E., & Wood, J. M. (2005). Predicting Components of Closed Road Driving.
Optometry and Vision Science, 82(8), 647–656.
Hird, M. A., Egeto, P., Fischer, C. E., Naglie, G., & Schweizer, T. A. (2016). A systematic
review and meta-analysis of on-road, simulator, and cognitive driving assessment in
Alzheimer’s disease and mild cognitive impairment. Journal of Alzheimer’s Disease, 53,
713–729
Hird, M. A., Vesely, K. A., Christie, L. E., Alves, M. A., Pongmoragot, J., Saposnik, G., &
Schweizer, T. A. (2015). Is it safe to drive after acute mild stroke? A preliminary report.
Journal of the Neurological Sciences, 354(1–2), 46–50.
http://doi.org/10.1016/j.jns.2015.04.043
Hird, M. A., Vetivelu, A., Saposnik, G., & Schweizer, T. A. (2014). Cognitive, on-road, and

134
simulator-based driving assessment after stroke. Journal of Stroke and Cerebrovascular
Diseases, 23(10), 2654–2670. http://doi.org/10.1016/j.jstrokecerebrovasdis.2014.06.010
Hiroyasu, T., & Fukushima, A. (2012). Differences in blood flow between auditory and visual
stimuli in the Psychomotor Vigilance Task and GO/NOGO Task. Conf Proc IEEE Eng Med
Biol Soc, 1466–1469.
Hirth, V. A., Davis, B., Fridriksson, J., Rorden, C., & Bonilha, L. (2007). Cognitive performance
and neural correlates of detecting driving hazards in healthy older adults. Dementia and
Geriatric Cognitive Disorders, 24(5), 335–342. http://doi.org/10.1159/000108606
Hogan, D. B., Bailey, P., Carswell, A., Clarke, B., Cohen, C., Forbes, D., … Thorpe, L. (2007).
Management of mild to moderate Alzheimer’s disease and dementia. Alzheimer’s and
Dementia, 3(4), 355–384. http://doi.org/10.1016/j.jalz.2007.07.006
Huang, C.-S., Pal, N. R., Chuang, C.-H., & Lin, C.-T. (2015). Identifying changes in EEG
information transfer during drowsy driving by transfer entropy. Frontiers in Human
Neuroscience, 9(570), 1–12. http://doi.org/10.3389/fnhum.2015.00570
Hum, S., Cohen, C., Persaud, M., & Lee, J. (2014). Role Expectations in Dementia Care Among
Family Physicians and Specialists, 17(3), 95–102.
Hung, C.-I., Liu, C.-Y., Wang, S.-J., Yao, Y.-C., & Yang, C.-H. (2012). The cut-off points of the
Depression and Somatic Symptoms Scale and the Hospital Anxiety and Depression Scale in
detecting non-full remission and a current major depressive episode. International Journal
of Psychiatry in Clinical Practice, 16, 33–40. http://doi.org/10.3109/13651501.2011.617456
Hung, Y., Vetivelu, A., Hird, M. A., Yan, M., Tam, F., Graham, S. J., … Schweizer, T. A.
(2014). Using fMRI virtual-reality technology to predict driving ability after brain damage:
A preliminary report. Neuroscience Letters, 558, 41–46.
http://doi.org/10.1016/j.neulet.2013.10.065
Hunt, L. A., Morris, J. C., Edwards, D., & Wilson, B. S. (1993). Driving performance in persons
with mild senile dementia of the Alzheimer type. Journal of the American Geriatrics
Society, 41(7), 747–752.
Hunt, L. A., Murphy, C. F., Carr, D., Duchek, J. M., Buckles, V., & Morris, C. (1997).
Reliability of the Washington University Road Test. Archives of Neurology, 54, 707–712.
Jancke, L., & Brunner, B. (2008). Brain activation during fast driving in a driving simulator: The
role of the lateral prefrontal cortex. NeuroReport, 19(11), 7–10.

135
http://doi.org/10.1097/WNR.0b013e3283056521
Jang, R. W., Man-Son-Hing, M., Molnar, F. J., Hogan, D. B., Marshall, S. C., Auger, J., …
Naglie, G. (2007). Family physicians’ attitudes and practices regarding assessments of
medical fitness to drive in older persons. Journal of General Internal Medicine, 22(4), 531–
543. http://doi.org/10.1007/s11606-006-0043-x
Jeong, M., Tashiro, M., Singh, L. N., Yamaguchi, K., Horikawa, E., Miyake, M., … Itoh, M.
(2006). Functional brain mapping of actual car-driving using [18F] FDG-PET. Annals of
Nuclear Medicine, 20(9), 623–628.
Jin, M., Pelak, V. S., & Cordes, D. (2012). Aberrant default mode network in subjects with
amnestic mild cognitive impairment using resting-state functional MRI. Magnetic
Resonance Imaging, 30(1), 48–61. http://doi.org/10.1016/j.mri.2011.07.007
Johnson, J. E. (1999). Urban older adults and the forfeiture of a driver’s license. Journal of
Gerontological Nursing, 25(12), 12–8. Retrieved from
http://www.ncbi.nlm.nih.gov/pubmed/10711109
Joko, T., Washizuka, S., Sasayama, D., Inuzuka, S., Ogihara, T., Yasaki, T., … Amano, N.
(2016). Patterns of hippocampal atrophy differ among Alzheimer’s disease, amnestic mild
cognitive impairment, and late-life depression. Psychogeriatrics, 1–7.
http://doi.org/10.1111/psyg.12176
Just, M. A., Keller, T. A., & Cynkar, J. (2008). A decrease in brain activation associated with
driving when listening to someone speak. Brain Research, 1205, 70–80.
Kan, K., Schweizer, T. A., Tam, F., & Graham, S. J. (2013). Methodology for functional MRI of
simulated driving. Medical Physics, 40(12301), 1–12. http://doi.org/10.1118/1.4769107
Karimpoor, M., Tam, F., Strother, S. C., Fischer, C. E., Schweizer, T. a., & Graham, S. J. (2015).
A computerized tablet with visual feedback of hand position for functional magnetic
resonance imaging. Frontiers in Human Neuroscience, 9(150), 1–13.
http://doi.org/10.3389/fnhum.2015.00150
Kawano, N., Iwamoto, K., Iidaka, T., & Ozaki, N. (2012). Effects of mild cognitive impairment
on driving performance in older drivers. Journal of the American Geriatric Society, 60(7),
1379–1381.
Kaya, Y., Aki, O. E., Can, U. A., Derle, E., Kibaroğlu, S., & Barak, A. (2014). Validation of
Montreal Cognitive Assessment and discriminant power of Montreal Cognitive Assessment

136
subtests in patients With mild cognitive impairment and Alzheimer dementia in Turkish
population. Journal of Geriatric Psychiatry and Neurology, 27(2), 103–109.
http://doi.org/10.1177/0891988714522701
Kilimann, I., Hausner, L., Fellgiebel, A., Filippi, M., Würdemann, T. J., Heinsen, H., & Teipel,
S. J. (2016). Parallel Atrophy of Cortex and Basal Forebrain Cholinergic System in Mild
Cognitive Impairment. Cerebral Cortex, 1–8. http://doi.org/10.1093/cercor/bhw019
Kim, H. S., Choi, M. H., Yoon, H. J., Kim, H. J., Jeoung, U. H., Park, S. J., … Lee, B. Y. (2014).
Cerebral activation and lateralization due to the cognition of a various driving speed
difference: An fMRI study. Bio-Medical Materials and Engineering, 24(1), 1133–1139.
http://doi.org/10.3233/BME-130913
Kim, I.-H., Kim, J.-W., Haufe, S., & Lee, S.-W. (2015). Detection of braking intention in diverse
situations during simulated driving based on EEG feature combination. Journal of Neural
Engineering, 12(16001), 1–12. http://doi.org/10.1088/1741-2560/12/1/016001
Kim, K. R., Lee, K. S., Cheong, H. K., Eom, J. S., Oh, B. H., & Hong, C. H. (2009).
Characteristic profiles of instrumental activities of daily living in different subtypes of mild
cognitive impairment. Dementia and Geriatric Cognitive Disorders, 27, 278–285.
http://doi.org/10.1159/000204765
Kjaergaard, M., Arfwedson Wang, C. E., Waterloo, K., & Jorde, R. (2014). A study of the
psychometric properties of the Beck Depression Inventory-II, the Montgomery and Asberg
Depression Rating Scale, and the Hospital Anxiety and Depression Scale in a sample from a
healthy population. Scandinavian Journal of Psychology, 55, 83–89.
http://doi.org/10.1111/sjop.12090
Klavora, P., Heslegrave, R. J., & Young, M. (2000). Driving skills in elderly persons with stroke:
Comparison of two new assessment options. Archives of Physical Medicine and
Rehabilitation, 81(6), 701–705. http://doi.org/10.1053/apmr.2000.6285
Koepsell, T. D., & Monsell, S. E. (2012). Reversion from mild cognitive impairment to normal
or near-normal cognition: Risk factors and prognosis. Neurology, 79, 1591–1598.
http://doi.org/10.1212/WNL.0b013e31826e26b7
Kotterba, S., Orth, M., Eren, E., Fangerau, T., & Sindern, E. (2003). Assessment of driving
performance in patients with relapsing-remitting multiple sclerosis by a driving simulator.
European Neurology, 50(3), 160–164. http://doi.org/10.1159/000073057

137
Kotterba, S., Widdig, W., Brylak, S., & Orth, M. (2005). Driving after cerebral ischemia – a
driving simulator investigation. Wiener Medizinische Wochenschrift, 155(15–16), 348–353.
http://doi.org/10.1007/s10354-005-0191-3
Krumm, S., Kivisaari, S. L., Probst, A., Monsch, A. U., Reinhardt, J., Ulmer, S., … Taylor, K. I.
(2015). Cortical thinning of parahippocampal subregions in very early Alzheimer’s disease.
Neurobiology of Aging, 38, 188–196. http://doi.org/10.1016/j.neurobiolaging.2015.11.001
Lafont, S., Marin-Lamellet, C., Paire-Ficout, L., Thomas-Anterion, C., Laurent, B., &
Fabrigoule, C. (2010). The wechsler digit symbol substitution test as the best indicator of
the risk of impaired driving in Alzheimer disease and normal aging. Dementia and Geriatric
Cognitive Disorders, 29(2), 154–163.
Lam, B., Masellis, M., Freedman, M., Stuss, D. T., & Black, S. E. (2013). Clinical, imaging, and
pathological heterogeneity of the Alzheimer’s disease syndrome. Alzheimer’s Research &
Therapy, 5(1), 1–14. http://doi.org/10.1186/alzrt155
Lam, B., Middleton, L. E., Masellis, M., Stuss, D. T., Harry, R. D., Kiss, A., & Black, S. E.
(2013). Criterion and convergent validity of the montreal cognitive assessment with
screening and standardized neuropsychological testing. Journal of the American Geriatrics
Society, 61, 2181–2185. http://doi.org/10.1111/jgs.12541
Landau, S. M., Thomas, B. A., Thurfjell, L., Schmidt, M., Margolin, R., Mintun, M., … Jagust,
W. J. (2014). Amyloid PET imaging in Alzheimer’s disease: A comparison of three
radiotracers. European Journal of Nuclear Medicine and Molecular Imaging, 41(7), 1398–
1407. http://doi.org/10.1007/s00259-014-2753-3
Lee, H. C., Cameron, D., & Lee, A. H. (2003). Assessing the driving performance of older adult
drivers: On-road versus simulated driving. Accident Analysis and Prevention, 35, 797–803.
Leinberger, R. L., Janz, N. K., Musch, D. C., Niziol, L. M., & Gillespie, B. W. (2013).
Discussing Driving Concerns With Older Patients. JAMA Ophthalmology, 131(2), 205–212.
http://doi.org/10.1001/2013.jamaophthalmol.106
Lengenfelder, J., Schultheis, M. T., Al-Shihabi, T., Mourant, R., & DeLuca, J. (2002). Divided
attention and driving. Journal of Head Trauma Rehabilitation, 17(1), 26–37.
http://doi.org/10.1097/00001199-200202000-00005
Lev, M. H., & Grant, P. E. (2000). MEG versus BOLD MR imaging: Functional imaging , the
next generation? American Journal of Neuroradiology, 21(8), 1369–1370.
138
Lew, H. L., Poole, J. H., Lee, E. H., Jaffe, D. L., Huang, H.-C., & Brodd, E. (2005). Predictive
validity of driving-simulator assessments following traumatic brain injury: A preliminary
study. Brain Injury, 19(3), 177–188. http://doi.org/10.1080/02699050400017171
Leyhe, T., Erb, M., Milian, M., Eschweiler, G. W., Ethofer, T., Grodd, W., & Saur, R. (2009).
Changes in cortical activation during retrieval of clock time representations in patients with
mild cognitive impairment and early Alzheimer’s disease. Dementia and Geriatric
Cognitive Disorders, 27(2), 117–132. http://doi.org/10.1159/000197930
Li, C., Zheng, J., Wang, J., Gui, L., & Li, C. (2009). An fMRI stroop task study of prefrontal
cortical function in normal aging, mild cognitive impairment, and Alzheimer’s disease.
Current Alzheimer Research, 6(6), 525–530.
Li, H.-J., Hou, X.-H., Liu, H.-H., Yue, C.-L., He, Y., & Zuo, X.-N. (2015). Toward systems
neuroscience in mild cognitive impairment and Alzheimer’s disease: a meta-analysis of 75
fMRI studies. Human Brain Mapping, 36(3), 1217–32. http://doi.org/10.1002/hbm.22689
Li, Y., Wang, X., Li, Y., Sun, Y., Sheng, C., Li, H., … Han, Y. (2016). Abnormal Resting-State
Functional Connectivity Strength in Mild Cognitive Impairment and Its Conversion to
Alzheimer’s Disease. Neural Plasticity, 1–12. http://doi.org/10.1155/2016/4680972
Li, Y.-O., Eichele, T., Calhoun, V. D., & Adali, T. (2012). Group study of simulated driving
fMRI data by multiset canonical correlation analysis. Journal of Signal Processing Systems,
68(1), 31–48. http://doi.org/10.1016/j.biotechadv.2011.08.021.Secreted
Liddle, J., Bennett, S., Allen, S., Lie, D. C., Standen, B., & Pachana, N. a. (2013). The stages of
driving cessation for people with dementia: needs and challenges. International
Psychogeriatrics / IPA, 25, 2033–46. http://doi.org/10.1017/S1041610213001464
Liddle, J., Tan, A., Liang, P., Bennett, S., Allen, S., Lie, D. C., & Pachana, N. A. (2015). “The
biggest problem we’ve ever had to face”: how families manage driving cessation with
people with dementia. International Psychogeriatrics, 1–14.
http://doi.org/10.1017/S1041610215001441
Lin, C. T., Chuang, C. H., Huang, C. S., Tsai, S. F., Lu, S. W., Chen, Y. H., & Ko, L. W. (2014).
Wireless and wearable EEG system for evaluating driver vigilance. IEEE Transactions on
Biomedical Circuits and Systems, 8(2), 165–176.
http://doi.org/10.1109/TBCAS.2014.2316224
Lin, C.-T., Chen, S.-A., Chiu, T.-T., Lin, H.-Z., & Ko, L.-W. (2011). Spatial and temporal EEG
139
dynamics of dual-task driving performance. Journal of Neuroengineering and
Rehabilitation, 8(11), 1–13. http://doi.org/10.1186/1743-0003-8-11
Lin, F. R., Ferrucci, L., Metter, E. J., An, Y., Zonderman, A. B., & Resnik, S. M. (2011).
Hearing loss and cognition in the Baltimore Longitudinal Study of Aging.
Neuropsychology, 25(6), 763–770. http://doi.org/10.1016/j.stem.2009.04.002.The
Lincoln, N. B., Taylor, J. L., Vella, K., Bouman, W. P., & Radford, K. a. (2010). A prospective
study of cognitive tests to predict performance on a standardised road test in people with
dementia. International Journal of Geriatric Psychiatry, 25(5), 489–96.
http://doi.org/10.1002/gps.2367
Liu, T. (2014). Positive correlation between drowsiness and prefrontal activation during a
simulated speed-control driving task. NeuroReport, 25, 1316–1319.
http://doi.org/10.1097/WNR.0000000000000265
Liu, T., Pelowski, M., Pang, C., Zhou, Y., & Cai, J. (2015). Near-infrared spectroscopy as a tool
for driving research. Ergonomics, 139(January), 1–12.
http://doi.org/10.1080/00140139.2015.1076057
Liu, T., Saito, H., & Oi, M. (2012). Distinctive activation patterns under intrinsically versus
extrinsically driven cognitive loads in prefrontal cortex: A near-infrared spectroscopy study
using a driving video game. Neuroscience Letters, 506(2), 220–224.
http://doi.org/10.1016/j.neulet.2011.11.009
Logsdon, R. G., Teri, L., & Larson, E. B. (1992). Driving and Alzheimer’s Disease. Journal of
General Internal Medicine, 7, 583–588.
Lopez, O. L., Becker, J. T., Chang, Y.-F., Sweet, R. A., DeKosky, S. T., Gach, H. M., … Kuller,
L. H. (2012). Incidence of dementia in mild cognitive impairment in the cardiovascular
health study cognition study. Neurology, 79, 1599–1606.
http://doi.org/10.1001/archneur.64.3.416
Lundqvist, A., Gerdle, B., & Ronnberg, J. (2000). Neuropsychological aspects of driving after a
stroke -- in the simulator and on the road. Applied Cognitive Psychology, 14, 135–150.
Luzzi, S., Cafazzo, V., Damora, A., Fabi, K., Fringuelli, F. M., Ascoli, G., … Reverberi, C.
(2015). The neural correlates of road sign knowledge and route learning in semantic
dementia and Alzheimer’s disease. Journal of Neurology, Neurosurgery, and Psychiatry,
86(6), 595–602. http://doi.org/10.1136/jnnp-2014-309477

140
Mader, M., Bresges, A., Topal, R., Busse, A., Forsting, M., & Gizewski, E. R. (2009). Simulated
car driving in fMRI-Cerebral activation patterns driving an unfamiliar and a familiar route.
Neuroscience Letters, 464(3), 222–227. http://doi.org/10.1016/j.neulet.2009.08.056
Marottoli, R. A., CFM, de L., Glass, T. A., Williams, C. S., Cooney, L. M. J., & Berkman, L. F.
(2000). Consequences of driving cessation: decreased out-of-home activity levels. The
Journals of Gerontology. Series B, Psychological Sciences and Social Sciences, 55(6),
S334–S340.
Marottoli, R. A., Mendes de Leon, C. F., Glass, T. A., Williams, C. S., Cooney, L. M., Berkman,
L. F., & Tinetti, M. E. (1997). Driving cessation and increased depressive symptoms:
Prospective evidence from the New Haven EPESE. Journal of the American Geriatric
Society, 45, 202–206.
Marshall, S. C., Demmings, E. M., Woolnough, A., Salim, D., & Man-Son-Hing, M. (2012).
Determining fitness to drive in older persons: a survey of medical and surgical specialists.
Canadian Geriatrics Journal : CGJ, 15(4), 101–19. http://doi.org/10.5770/cgj.15.30
Marshall, S. C., & Gilbert, N. (1999). Saskatchewan physicians’ attitudes and knowledge
regarding assessment of medical fitness to drive. Canadian Medical Association Journal,
160(12), 1701–1704.
Marshall, S. C., Molnar, F., Man-Son-Hing, M., Blair, R., Brosseau, L., Finestone, H. M., …
Wilson, K. G. (2007). Predictors of driving ability following stroke: a systematic review.
Topics in Stroke Rehabilitation, 14(1), 98–114. http://doi.org/10.1310/tsr1401-98
Matas, N. A., Nettelbeck, T., & Burns, N. R. (2015). Dropout during a driving simulator study: A
survival analysis. Journal of Safety Research, 55, 159–169.
http://doi.org/10.1016/j.jsr.2015.08.004
Mayhew, D. R., Simpson, H. M., Wood, K. M., Lonero, L., Clinton, K. M., & Johnson, A. G.
(2011). On-road and simulated driving: Concurrent and discriminant validation. Journal of
Safety Research, 42(4), 267–275. http://doi.org/10.1016/j.jsr.2011.06.004
Mazer, B. L., Korner-Bitensky, N. A., & Sofer, S. (1998). Predicting ability to drive after stroke.
Archives of Physical Medicine and Rehabilitation, 79(7), 743–750.
McKay, C., Rapport, L. J., Coleman Bryer, R., & Casey, J. (2011). Self-evaluation of driving
simulator performance after stroke. Topics in Stroke Rehabilitation, 18(5), 549–561.
http://doi.org/10.1310/tsr1805-549

141
McKhann, G. M., Knopman, D. S., Chertkow, H., Hyman, B. T., Jack, C. R., Kawas, C. H., …
Phelps, C. H. (2011). The diagnosis of dementia due to Alzheimer’s disease:
Recommendations from the National Institute on Aging and the Alzheimer’s Association
workgroup. Alzheimer’s & Dementia, 7(3), 263–269.
http://doi.org/10.1016/j.jalz.2011.03.005
Mitchell, A. J., & Shiri-Feshki, M. (2009). Rate of progression of mild cognitive impairment to
dementia - meta-analysis of 41 robust inception cohort studies. Acta Psychiatrica
Scandinavica, 119, 252–265. http://doi.org/10.1111/j.1600-0447.2008.01326.x
Molnar, F. J., Patel, A., Marshall, S. C., Man-Son-Hing, M., & Wilson, K. G. (2006). Clinical
utility of office-based cognitive predictors of fitness to drive in persons with dementia: a
systematic review. Journal of the American Geriatrics Society, 54(12), 1809–1824.
http://doi.org/10.1111/j.1532-5415.2006.00967.x
Monden, Y., Dan, I., Nagashima, M., Dan, H., Uga, M., Ikeda, T., … Yamagata, T. (2015).
Individual classification of ADHD children by right prefrontal hemodynamic responses
during a go/no-go task as assessed by fNIRS. NeuroImage: Clinical, 9, 1–12.
http://doi.org/http://dx.doi.org/10.1016/j.nicl.2015.06.011
Moretti, D. V. (2015). Association of EEG, MRI, and regional blood flow biomarkers is
predictive of prodromal Alzheimer’s disease. Neuropsychiatric Disease and Treatment, 11,
2779–2791. http://doi.org/10.2147/NDT.S93253
Morris, J. C. (1993). The Clinical Dementia Rating (CDR): Current version and scoring rules.
Neurology, 43(11), 2412–2414.
Morris, J. C., & Price, J. L. (2001). Pathologic correlates of nondemented aging, mild cognitive
impairment, and early-stage Alzheimer’s disease. Journal of Molecular Neuroscience, 17,
101–118. http://doi.org/10.1385/JMN:17:2:101
Morris, J. C., Storandt, M., Miller, J. P., McKeel, D. W., Price, J. L., Rubin, E. H., & Berg, L.
(2001). Mild cognitive impairment represents early-stage Alzheimer disease. Archives of
Neurology, 58, 397–405. http://doi.org/10.1001/archneur.58.3.397
Morrison, M. A., Churchill, N. W., Cusimano, M. D., Schweizer, T. A., Das, S., & Graham, S. J.
(2016). Reliability of task-based fMRI for preoperative planning: A test-retest study in brain
tumor patients and healthy controls. PloS One, 1–25.
http://doi.org/10.6084/m9.figshare.2068371

142
Motta, K., Lee, H., & Falkmer, T. (2014). Post-stroke driving: examining the effect of executive
dysfunction. Journal of Safety Research, 49, 33–38. http://doi.org/10.1016/j.jsr.2014.02.005
Mukaka, M. M. (2012). Statistics corner: A guide to appropriate use of correlation coefficient in
medical research. Malawi Medical Journal, 24(3), 69–71.
http://doi.org/10.1016/j.cmpb.2016.01.020
Mullen, N. W., Weaver, B., Riendeau, J. A., Morrison, L. E., & Bedard, M. (2010). Driving
performance and susceptibility to simulator sickness: Are they related? American Journal of
Occupational Therapy, 64, 288–295.
Müller, R., Cieza, A., & Geyh, S. (2012). Rasch analysis of the Hospital Anxiety and Depression
Scale in spinal cord injury. Rehabilitation Psychology, 57(3), 214–223.
http://doi.org/10.1037/a0029287
Nasreddine, Z. ., Phillips, N. ., Bedirian, V., Charbonneau, S., Whitehead, V., Collin, I., …
Chertkow, H. (2005). The Montreal Cognitive Assessment (MoCA): A brief screening tool
for mild cognitive impairment. Journal of the American Geriatrics Society, 53(4), 695–699.
Nordberg, A. (2004). PET imaging of amyloid in Alzheimer’s disease. Lancet Neurology, 3,
519–527. http://doi.org/10.1016/S1474-4422(04)00853-1
O’Connor, M. G., Kapust, L. R., Lin, B., Hollis, A. M., & Jones, R. N. (2010). The 4Cs (crash
history, family concerns, clinical condition, and cognitive functions): A screening tool for
the evaluation of the at-risk driver. Journal of the American Geriatrics Society. ELEC, M.
G. O’Connor, Cognitive Neurology Unit KS-02301, 330 Brookline Ave., Boston, MA
02215, United States. E-mail: [email protected]: Blackwell Publishing Inc.
(350 Main Street, Malden MA 02148, United States).
Ogawa, S., Tank, D. W., Menon, R., Ellermann, J. M., Kim, S. G., Merkle, H., & Ugurbil, K.
(1992). Intrinsic signal changes accompanying sensory stimulation: functional brain
mapping with magnetic resonance imaging. Proceedings of the National Academy of
Sciences of the United States of America, 89(13), 5951–5955.
http://doi.org/10.1073/pnas.89.13.5951
Ott, B. R., Festa, E. K., Amick, M. M., Grace, J., Davis, J. D., & Heindel, W. C. (2008).
Computerized maze navigation and on-road performance by drivers with dementia. Journal
of Geriatric Psychiatry and Neurology, 21(1), 18–25.
Ott, B. R., Heindel, W. C., Papandonatos, G. D., Festa, E. K., Davis, J. D., Daiello, L. A., &

143
Morris, J. C. (2008). A longitudinal study of drivers with Alzheimer disease. Neurology,
70(14), 1171–1178.
Ott, B. R., Heindel, W. C., Whelihan, W. M., Caron, M. D., Piatt, A. L., & DiCarlo, M. A.
(2003). Maze test performance and reported driving ability in early dementia. Journal of
Geriatric Psychiatry and Neurology, 16(3), 151–155.
Ott, B. R., Heindel, W. C., Whelihan, W. M., Caron, M. D., Piatt, A. L., & Noto, R. B. (2000). A
single-photon emission computed tomography imaging study of driving impairment in
patients with Alzheimer’s disease. Dementia and Geriatric Cognitive Disorders, 11(3),
153–160.
Ott, B. R., Papandonatos, G. D., Davis, J. D., & Barco, P. P. (2012). Naturalistic validation of an
on-road driving test of older drivers. Human Factors, 54(4), 663–674.
http://doi.org/10.1177/0018720811435235
Owsley, C., Stalvey, B., Wells, J., & Sloane, M. E. (1999). Older drivers and cataract: Driving
habits and crash risk. The Journals of Gerontology: MEDICAL SCIENCES, 54(4), M203–
M211. http://doi.org/10.1093/gerona/54.4.M203
Papadelis, C., Kourtidou-Papadeli, C., Bamidis, P. D., Chouvarda, I., Koufogiannis, D., Bekiaris,
E., & Maglaveras, N. (2006). Indicators of sleepiness in an ambulatory EEG study of night
driving. Annual International Conference of the IEEE Engineering in Medicine and Biology
- Proceedings, 1, 6201–6204. http://doi.org/10.1109/IEMBS.2006.259614
Peters, F., Villeneuve, S., & Belleville, S. (2014). Predicting progression to dementia in elderly
subjects with mild cognitive impairment using both cognitive and neuroimaging predictors.
Journal of Alzheimer’s Disease, 38, 307–318. http://doi.org/10.3233/JAD-130842
Petersen, R. C. (2004). Mild cognitive impairment as a diagnostic entity. Journal of Internal
Medicine, 256, 183–194. http://doi.org/10.1001/archneur.62.7.1160
Petersen, R. C., Doody, R., Kurz, A., Mohs, R. C., Morris, J. C., Rabins, P. V, … Winblad, B.
(2001). Current concepts in mild cognitive impairment. Archives of Neurology, 58, 1985–
1992.
Petersen, R. C., Smith, G. E., Waring S, C., Ivnik, R. J., Tangalos, E. G., & Kokmen, E. (1999).
Mild cognitive impairment: Clinical characterization and outcome. Archives of Neurology,
56, 303–308.
PRONTO User’s Manual (v 8.5). (n.d.).
144
Pusswald, G., Moser, D., Gleiß, A., Janzek-Hawlat, S., Auff, E., Dal-Bianco, P., & Lehrner, J.
(2013). Prevalence of mild cognitive impairment subtypes in patients attending a memory
outpatient clinic-comparison of two modes of mild cognitive impairment classification.
Results of the Vienna Conversion to Dementia Study. Alzheimer’s and Dementia, 9, 366–
376. http://doi.org/10.1016/j.jalz.2011.12.009
Quaranta, N., Coppola, F., Casulli, M., Barulli, O., Lanza, F., Tortelli, R., … Logroscino, G.
(2014). The prevalence of peripheral and central hearing impairment and its relation to
cognition in older adults. Audiology and Neurotology, 19(suppl 1), 10–14.
http://doi.org/10.1159/000371597
Ragland, D. R., Satariano, W. A., & MacLeod, K. E. (2005). Driving cessation and increased
depressive symptoms. Journals of Gerontology Series a-Biological Sciences and Medical
Sciences, 60(3), 399–403.
Ramkhalawansingh, R., Keshavarz, B., Haycock, B., Shahab, S., & Campos, J. L. (2016). Age
differences in visual-auditory self-motion perception during a simulated driving task.
Frontiers in Psychology, 7(595), 1–12. http://doi.org/10.3389/fpsyg.2016.00595
Reimer, B., D’Ambrosio, L. a, Coughlin, J. E., Kafrissen, M. E., & Biederman, J. (2006). Using
self-reported data to assess the validity of driving simulation data. Behavior Research
Methods, 38(2), 314–324. http://doi.org/10.3758/BF03192783
Reppermund, S., Brodaty, H., Crawford, J. D., Kochan, N. A., Draper, B., Slavin, M. J., …
Sachdev, P. S. (2013). Impairment in instrumental activities of daily living with high
cognitive demand is an early marker of mild cognitive impairment: the Sydney Memory and
Ageing Study. Psychological Medicine, 43, 2437–2445.
http://doi.org/10.1017/S003329171200308X
Riener, A. (2010). Assessment of simulator fidelity and validity in simulator and on-the-road
studies. International Journal on Advances in Systems andMeasurements, 3(3), 110–124.
Rizzo, M., McGehee, D. V, Dawson, J. D., & Anderson, S. N. (2001). Simulated car crashes at
intersections in drivers with Alzheimer disease. Alzheimer Disease and Associated
Disorders, 15(1), 10–20.
Rizzo, M., Reinach, S., McGehee, D., & Dawson, J. (1997). Simulated car crashes and crash
predictors in drivers with Alzheimer disease. Archives of Neurology, 54, 545–551.
Roberts, R., & Knopman, D. S. (2013). Classification and epidemiology of MCI. Clinics in

145
Geriatric Medicine, 29, 753–72. http://doi.org/10.1016/j.cger.2013.07.003
Rorden, C. (2015). MRIcron. Retrieved from www.mricro.com
Sakihara, K., Hirata, M., Ebe, K., Kimura, K., Yi Ryu, S., Kono, Y., … Yorifuji, S. (2014).
Cerebral oscillatory activity during simulated driving using MEG. Frontiers in Human
Neuroscience, 8(975), 1–9. http://doi.org/10.3389/fnhum.2014.00975
Schweizer, T. A., Al-Khindi, T., & Macdonald, R. L. (2012). Mini-Mental State Examination
versus Montreal Cognitive Assessment: Rapid assessment tools for cognitive and functional
outcome after aneurysmal subarachnoid hemorrhage. Journal of the Neurological Sciences,
316, 137–140. http://doi.org/10.1016/j.jns.2012.01.003
Schweizer, T. A., Kan, K., Hung, Y., Tam, F., Naglie, G., & Graham, S. J. (2013). Brain activity
during driving with distraction: An immersive fMRI study. Frontiers in Human
Neuroscience, 7, 53. http://doi.org/10.3389/fnhum.2013.00053
Shechtman, O., Awadzi, K. D., Classen, S., Lanford, D. N., & Joo, Y. (2010). Validity and
critical driving errors of on-road assessment for older drivers. American Journal of
Occupational Therapy, 64(2), 242–251. http://doi.org/10.5014/ajot.64.2.242
Shechtman, O., Classen, S., Awadzi, K., & Mann, W. (2009). Comparison of driving errors
between on-the-road and simulated driving assessment: a validation study. Traffic Injury
Prevention, 10(4), 379–385. http://doi.org/10.1080/15389580902894989
Shimizu, T., Hirose, S., Obara, H., Yanagisawa, K., Tsunashima, H., Marumo, Y., … Taira, M.
(2009). Measurement of frontal cortex brain activity attributable to the driving workload
and increased attention. SAE International Journal of Passenger Cars -- Mechanical
Systems, 21, 736–744.
Shua-Haim, J. A., & Gross, J. S. (1996). A simulated driving evaluation for patients with
Alzheimer’s disease. American Journal of Alzheimer’s Disease and Other Dementia, 11,
32–37.
Smith, T., Gildeh, N., & Holmes, C. (2007). The Montreal Cognitive Assessment: Validity and
utility in a memory clinic setting. Canadian Journal Of Psychiatry, 52(5), 329–332.
Song, C.-S., Chun, B.-Y., & Chung, H.-S. (2015). Test-retest reliability of the driving habits
questionnaire in older self-driving adults. Journal of Physical Therapy Science, 27, 3597–
3599.
Sonnleitner, A., Simon, M., Kincses, W. E., Buchner, A., & Schrauf, M. (2012). Alpha spindles
146
as neurophysiological correlates indicating attentional shift in a simulated driving task.
International Journal of Psychophysiology, 83(1), 110–118.
http://doi.org/10.1016/j.ijpsycho.2011.10.013
Sperling, R. A., Dickerson, B. C., Pihlajamaki, M., Vannini, P., LaViolette, P. S., Vitolo, O. V.,
… Johnson, K. A. (2010). Functional alterations in memory networks in early alzheimer’s
disease. NeuroMolecular Medicine, 12(1), 27–43. http://doi.org/10.1007/s12017-009-8109-
7
Spiers, H. J., & Maguire, E. A. (2007). Neural substrates of driving behaviour. NeuroImage, 36,
245–255.
Stanney, K. ., Kingdon, K. ., & Kennedy, R. . (2002). Dropouts and aftereffects: Examining
general accessibility to virtual environment technology. Proceedings of the Human Factors
and Ergonomics Society Annual Meeting, 46, 2114–2118.
Stein, A. C., & Dubinsky, R. M. (2011). Driving simulator performance in patients with possible
and probable Alzheimer’s disease. Annals of Advances in Automotive Medicine, 55, 325–
334.
Stephan, B. C. M., Minett, T., Pagett, E., Siervo, M., Brayne, C., & McKeith, I. G. (2013).
Diagnosing mild cognitive impairment (MCI) in clinical trials: A systematic review. BMJ
Open, 3, e001909. http://doi.org/10.1136/bmjopen-2012-001909
Strauss, E., Sherman, E. M. ., & Spreen, O. (2006). A compendium of neuropsychological tests:
Administration, norms, and commentary (3rd ed). New York, NY: Oxford University Press.
Strother, S. C., Anderson, J., Hansen, L. K., Kjems, U., Kustra, R., Sidtis, J., … Rottenberg, D.
(2002). The quantitative evaluation of functional neuroimaging experiments: The NPAIRS
data analysis framework. NeuroImage, 15(4), 747–771.
http://doi.org/10.1006/nimg.2001.1034
Tabert, M. H., Albert, S. M., Borukhova-Milov, L., Camacho, Y., Pelton, G., Liu, X., …
Devanand, D. P. (2002). Functional deficits in patients with mild cognitive impairment:
Prediction of AD. Neurology, 58, 758–764.
Tam, C., Lam, L., Chiu, H., & Lui, V. (2007). Characteristic profiles of instrumental activities of
daily living in Chinese older persons with mild cognitive impairment. American Journal of
Alzheimer’s Disease and Other Dementias, 22, 211–217.
Tam, F., Churchill, N. W., Strother, S. C., & Graham, S. J. (2011). A new tablet for writing and

147
drawing during functional MRI. Human Brain Mapping, 32(2), 240–8.
http://doi.org/10.1002/hbm.21013
Tateno, A., Sakayori, T., Kawashima, Y., Higuchi, M., Suhara, T., Mizumura, S., … Okubo, Y.
(2015). Comparison of imaging biomarkers for Alzheimer’s disease: Amyloid imaging with
[18F]florbetapir positron emission tomography and magnetic resonance imaging voxel-
based analysis for entorhinal cortex atrophy. International Journal of Geriatric Psychiatry,
30, 505–513. http://doi.org/10.1002/gps.4173
Tomioka, H., Yamagata, B., Takahashi, T., Yano, M., Isomura, A. J., Kobayashi, H., & Mimura,
M. (2009). Detection of hypofrontality in drivers with Alzheimer’s disease by near-infrared
spectroscopy. Neuroscience Letters, 451(3), 252–256.
Trobe, J. D., Waller, P. F., Cook-Flannagan, C. A., Teshima, S. M., & Bieliauskas, L. A. (1996).
Crashes and violations among drivers with Alzheimer disease. Archives of Neurology, 53,
411–416.
Tschentscher, N., & Hauk, O. (2016). Frontal and parietal cortices show different spatiotemporal
dynamics across problem-solving stages. Journal of Cogntive Neuroscience, 1–13.
http://doi.org/10.1162/jocn
Tsunashima, H., & Yanagisawa, K. (2009). Measurement of brain function of car driver using
functional near-infrared spectroscopy (fNIRS). Computational Intelligence and
Neuroscience, 164958, 1–13. http://doi.org/10.1155/2009/164958
Turk, D. C., Dworkin, R. H., Trudeau, J. J., Benson, C., Biondi, D. M., Katz, N. P., & Kim, M.
(2015). Validation of the Hospital Anxiety and Depression Scale in patients with acute low
back pain. The Journal of Pain, 16(10), 1012–1021.
http://doi.org/http://dx.doi.org/10.1016/j.jpain.2015.07.001
Uc, E. Y., Rizzo, M., Anderson, S. W., Shi, Q., & Dawson, J. D. (2004). Driver route-following
and safety errors in early Alzheimer disease. Neurology, 63(5), 832–837.
Uc, E. Y., Rizzo, M., Anderson, S. W., Shi, Q., & Dawson, J. D. (2005). Driver landmark and
traffic sign identification in early Alzheimer’s disease. Journal of Neurology, Neurosurgery,
and Psychiatry, 76(6), 764–768.
Uc, E. Y., Rizzo, M., Anderson, S. W., Shi, Q., & Dawson, J. D. (2006). Unsafe rear-end
collision avoidance in Alzheimer’s disease. Journal of the Neurological Sciences, 251, 35–
43. http://doi.org/10.1016/j.jns.2006.08.011
148
Uchiyama, Y., Ebe, K., Kozato, A., Okada, T., & Sadato, N. (2003). The neural substrates of
driving at a safe distance: A functional MRI study. Neuroscience Letters, 352, 199–202.
Van Heugten, C. M., Walton, L., & Hentschel, U. (2015). Can we forget the Mini-Mental State
Examination? A systematic review of the validity of cognitive screening instruments within
one month after stroke. Clinical Rehabilitation, 29(7), 694–704.
http://doi.org/10.1177/0269215514553012
Vlahou, E. L., Thurm, F., Kolassa, I.-T., & Schlee, W. (2014). Resting-state slow wave power,
healthy aging and cognitive performance. Scientific Reports, 4(5101), 1–6.
http://doi.org/10.1038/srep05101
Wadley, V. G., Okonkwo, O., Crowe, M., Vance, D. E., Elgin, J. M., Ball, K. K., & Owsley, C.
(2009). Mild cognitive impairment and everyday function: an investigation of driving
performance. Journal of Geriatric Psychiatry and Neurology, 22(2), 87–94.
Walter, H., Vetter, S. C., Grothe, J., Wunderlich, A. P., Hahn, S., & Spitzer, M. (2001). The
neural correlates of driving. Brain Imaging, 12(8), 1763–1767.
http://doi.org/10.1097/00001756-200106130-00049
Wang, Y., Mehler, B., Reimer, B., Lammers, V., D’Ambrosio, L. a, & Coughlin, J. F. (2010).
The validity of driving simulation for assessing differences between in-vehicle
informational interfaces: A comparison with field testing. Ergonomics, 53(3), 404–420.
http://doi.org/10.1080/00140130903464358
Wang, Z., Yan, C., Zhao, C., Qi, Z., Zhou, W., Lu, J., … Li, K. (2011). Spatial patterns of
intrinsic brain activity in mild cognitive impairment and Alzheimer’s disease: A resting-
state functional MRI study. Human Brain Mapping, 32(10), 1720–1740.
http://doi.org/10.1002/hbm.21140
Ward, A., Arrighi, H. M., Michels, S., & Cedarbaum, J. M. (2012). Mild cognitive impairment:
disparity of incidence and prevalence estimates. Alzheimer’s & Dementia, 8, 14–21.
http://doi.org/10.1016/j.jalz.2011.01.002
Winblad, B., Palmer, K., Kivipelto, M., Jelic, V., Fratiglioni, L., Wahlund, L.-O., … Petersen, R.
C. (2004). Mild cognitive impairment--beyond controversies, towards a consensus: Report
of the International Working Group on mild cognitive impairment. Journal of Internal
Medicine, 256, 240–246. http://doi.org/10.1111/j.1365-2796.2004.01380.x
Windsor, T. D., & Anstey, K. J. (2006). Interventions to reduce the adverse psychosocial impact

149
of driving cessation on older adults. Clinical Interventions in Aging, 1(3), 205–211.
http://doi.org/10.2147/ciia.2006.1.3.205
Windsor, T. D., Anstey, K. J., Butterworth, P., Luszcz, M. a, & Andrews, G. R. (2007). The role
of perceived control in explaining depressive symptoms associated with driving cessation in
a longitudinal study. The Gerontologist, 47(2), 215–223.
http://doi.org/10.1093/geront/47.2.215
Wirth, M., Pichet Binette, A., Brunecker, P., Ko be, T., Witte, A. V., & Flo el, A. (2016).
Divergent regional patterns of cerebral hypoperfusion and gray matter atrophy in mild
cognitive impairment patients. Journal of Cerebral Blood Flow & Metabolism, 1–11.
http://doi.org/10.1177/0271678X16641128
Wood, J. M., Chaparro, A., Lacherez, P., & Hickson, L. (2012). Useful field of view predicts
driving in the presence of distracters. Optometry and Vision Science, 89(4), 373–381.
http://doi.org/10.1097/OPX.0b013e31824c17ee
Wood, J. M., Lacherez, P., & Tyrrell, R. A. (2014). Seeing pedestrians at night: Effect of driver
age and visual abilities. Ophthalmic and Physiological Optics, 34(4), 452–458.
http://doi.org/10.1111/opo.12139
Wood, J. M., & Owsley, C. (2014). Useful field of view test. Gerontology, 60(4), 315–318.
http://doi.org/10.1159/000356753
Wood, J. M., Tyrrell, R. a, & Carberry, T. P. (2005). Limitations in drivers’ ability to recognize
pedestrians at night. Human Factors, 47(3), 644–53.
http://doi.org/10.1518/001872005774859980
World Health Organization. (2015). Dementia Fact Sheet. Retrieved from
http://www.who.int/mediacentre/factsheets/fs362/en/
Xu, L., Wu, X., Li, R., Chen, K., Long, Z., Zhang, J., … Yao, L. (2016). Prediction of
progressive mild cognitive impairment by multi-modal neuroimaging biomarkers. Journal
of Alzheimer’s Disease, 1–12. http://doi.org/10.3233/JAD-151010
Xu, Q., Cao, W. W., Mi, J. H., Yu, L., Lin, Y., & Li, Y. S. (2014). Brief screening for mild
cognitive impairment in subcortical ischemic vascular disease: A comparison study of the
Montreal Cognitive Assessment with the Mini-Mental State Examination. European
Neurology, 71, 106–114. http://doi.org/10.1159/000353988
Yamin, S., Stinchcombe, A., & Gagnon, S. (2015). Deficits in attention and visual processing but

150
not global cognition predict simulated driving errors in drivers diagnosed with mild
Alzheimers disease. American Journal of Alzheimer’s Disease and Other Dementias, 31(4),
351–360. http://doi.org/10.1177/1533317515618898
Yan, X., Abdel-Aty, M., Radwan, E., Wang, X., & Chilakapati, P. (2008). Validating a driving
simulator using surrogate safety measures. Accident Analysis and Prevention, 40(1), 274–
288. http://doi.org/10.1016/j.aap.2007.06.007
Yetkin, F. Z., Rosenberg, R. N., Weiner, M. F., Purdy, P. D., & Cullum, C. M. (2006). fMRI of
working memory in patients with mild cognitive impairment and probable Alzheimer’s
disease. European Radiology, 16(1), 193–206. http://doi.org/10.1007/s00330-005-2794-x
Yokosawa, K., Watanabe, T., Kikuzawa, D., Aoyama, G., Takahashi, M., & Kuriki, S. (2013).
Amplitude modulation of alpha-band rhythm caused by mimic collision: MEG study.
Proceedings of the Annual International Conference of the IEEE Engineering in Medicine
and Biology Society, 6187–6190. http://doi.org/10.1109/EMBC.2013.6610966
Yoshino, K., Oka, N., Yamamoto, K., Takahashi, H., & Kato, T. (2013). Correlation of
prefrontal cortical activation with changing vehicle speeds in actual driving: a vector-based
functional near-infrared spectroscopy study. Frontiers in Human Neuroscience, 7(895), 1–9.
http://doi.org/10.3389/fnhum.2013.00895
Yuen, H. K., Gillespie, M. B., Barkley, R. A., Day, T. A., Bandyopadhyay, D., & Sharma, A. K.
(2007). Driving performance in patients with cancer in the head and neck region: A pilot
study. Archives of Otolaryngology, 133(9), 904–909.
http://doi.org/10.1001/archotol.133.9.904
Zhou, Y., Yu, F., & Duong, T. Q. (2015). White matter lesion load is associated with resting
state functional MRI activity and amyloid PET but not FDG in mild cognitive impairment
and early Alzheimer’s Disease patients. Journal of Magnetic Resonance Imaging, 41(1),
102–109. http://doi.org/10.1002/jmri.24550
Zigmond, A. S., & Snaith, R. P. (1983). The hospital anxiety and depression scale. Acta
Psychiatrica Scandinavica, 67, 361–370. http://doi.org/10.1111/j.1600-
0447.1983.tb09716.x