investigating the e ect of “defect co-fix” on quality...
TRANSCRIPT
Journal of Systems and Software 00 (2014) 1–18
JournalLogo
Investigating the Effect of “Defect Co-fix” on Quality AssuranceResource Allocation: A Search-based Approach
Hadi Hemmatia, Meiyappan Nagappanb, Ahmed E. Hassanc
[email protected], [email protected], [email protected]
aDepartment of Computer Science, University of Manitoba, CanadabDepartment of Software Engineering, Rochester Institute of Technology, USA
cSchool of Computing, Queen’s University, Canada
Abstract
Allocation of resources to pre-release Quality Assurance (QA) tasks, such as source code analysis, peer review, and testing, isone of the challenges faced by a software project manager. The goal is to find as many defects as possible with the availableQA resources prior to the release. This can be achieved by assigning more resources to the more defect-prone artifacts, e.g.,components, classes, and methods. The state-of-the-art QA resource allocation approaches predict the defect-proneness of anartifact using the historical data of different software metrics, e.g., the number of previous defects and the changes in the artifact.Given a QA budget, an allocation technique selects the most defect-prone artifacts, for further investigation by the QA team.While there has been many research efforts on discovering more predictive software metrics and more effective defect predictionalgorithms, the cost-effectiveness of the QA resource allocation approaches has always been evaluated by counting the numberof defects per selected artifact. The problem with such an evaluation approach is that it ignores the fact that, in practice, fixing asoftware issue is not bounded to an artifact under investigation. In other words, one may start reviewing a file that is identified asdefect-prone and detect a defect, but to fix the defect one may modify not only the defective part of the file under review, but alsoseveral other artifacts that are somehow related to the defective code (e.g., a method that calls the defective code). Such co-fixes(fixing several defects together) during analyzing/reviewing/testing of an artifact under investigation will change the number ofremaining defects in the other artifacts. Therefore, a QA resource allocation approach is more effective if it prioritizes the artifactsthat would lead to the smallest number of remaining defects.
Investigating six medium-to-large releases of open source systems (Mylyn, Eclipse, and NetBeans, two releases each), wefound that co-fixes happen quite often in software projects (30-42% of the fixes modify more than one artifact). Therefore, in thispaper, we first introduce a new cost-effectiveness measure to evaluate QA resource allocation, based on the concept of “remainingdefects” per file. We then propose several co-fix-aware prioritization approaches to dynamically optimize the new measure, basedon the historical defect co-fixes. The evaluation of these approaches on the six releases shows that a) co-fix-aware QA prioritizationapproaches improve the traditional defect prediction-based ones, in terms of density of remaining defects per file and b) co-fix-aware QA prioritization can potentially benefit from search-based software engineering techniques.
c© 2013 Published by Elsevier Ltd.
Keywords: Quality Assurance, Prioritization, Defect prediction, Co-fix, Search-based algorithm
1. Introduction
Typical pre-release software Quality Assurance (QA) activities involve tasks such as code inspection, peer review,and testing of software artifacts. The goal of these QA activities is detecting and fixing defects before they are
1

/ Journal of Systems and Software 00 (2014) 1–18 2
perceived as failures by the users. Allocating pre-release QA resources to the QA tasks, is one of the critical duties ofa software project manager. Resources are always limited and managers need to prioritize their resources and fix asmany defects as possible, within a limited time, before release. Some bugs are already identified by the developmentteam, while unit/integration testing. So if there is any known unfixed bugs in the system, they will get priority to befixed (by fault localization and debugging). However, many other bugs may slip through the initial testing. The goalof the QA team, at this stage, is ensuring that the existing QA budget is wisely spent, even if there is no reported bugyet. Therefore, the QA team, usually estimates riskiness of each artifact (e.g., classes) and prioritize the artifact forfurther QA investigations (which mostly is a combination of inspection and testing before each release).
One of the current practices for estimating riskiness, which is well studied in the literature, is using defect pre-diction approaches [1, 2]. Such approaches usually estimate the number of defects per artifact1 (e.g., components,classes, and methods). These estimates are then used, to prioritize the allocation of resources to the most defect-proneartifacts. In this paper, we call this process, QA prioritization.
To improve QA prioritization, several prediction techniques and many product/process/social metrics have beenstudied on many software systems [1, 2]. A QA prioritization is typically evaluated by its effectiveness in terms ofproperly assigning resources to the artifacts that contain more defects. A typical effectiveness measure for evaluating aQA prioritization approach is the number of defects per file. Assume we are prioritizing source code files of a systemfor further QA investigation. Assume the top three most defective files (A, B, and C) contain (20, 15, and 10) defects,respectively. The most effective QA prioritization approach would rank the files as A, B, and then C (i.e., from mostto least number of defects). This ranking assures that with any budget between one to three files to investigate, theQA task hits the areas of the code with the most number of defects.
Assume that the investigation of A’s defects results in modifying some other files due to code dependency ofthe defects. In other words, while fixing the defects of A, several defects of other files are also fixed. We call thisphenomenon, a co-fix. Now consider a scenario where 10 of B’s defects are already fixed by the time that we aredone fixing A’s defects and none of the C’s defects are touched. The traditional effectiveness measure (the originalnumber of defects per file) still insists that B is the next best choice for QA allocation. However, B only contains fiveremaining defects, whereas C still has ten untouched defects.
In this paper, we first argue that the current effectiveness measure, based on the number of defects per file, is notthe best evaluation mechanism for QA prioritization, due to the co-fixes. We then study six medium-to-large releasesof open source systems (Mylyn, Eclipse, and NetBeans; two releases each), and realize that there are several casesof co-fix in these releases (30-42% of the fixes modify more than one file2). To consider the co-fix effect on thedefect-proneness of artifacts, in this paper, we first introduce a new cost-effectiveness measure for QA prioritization,Density of Remaining Defects (DRD), per artifact (per file, in our case). We use density rather than absolute numberof defects, since it better captures the cost involved in detecting/repairing of the defects per artifact [3, 4, 5, 6, 7].However, the novelty of DRD is in introducing the concept of remaining defects vs. all defects, as the effectivenessmeasure.
To optimize the new cost-effectiveness measure for QA prioritization (DRD), we propose a novel approach forranking files, which dynamically updates the ranks, based on the current remaining defects per file (co-fix-awareapproach). We then compare two variations of a traditional QA prioritization approach: TradNum (sorting files basedon their number of predicted defects) [8, 9, 10, 11] and TradDens (sorting files based on their density of predicteddefects) [3, 4, 5, 6, 7] with two different variations of our co-fix-aware approach CoFixNum (a co-fix-aware rankingbased on the number of predicted defects) and CoFixDens (a co-fix-aware ranking based on the density of predicteddefects).
To empirically evaluate the performance of our proposed approaches, we study, in particular, the following re-search question:
RQ: Can we improve the cost-effectiveness of traditional QA prioritization, using a co-fix-aware approach?
Applying the four approaches (TradNum, TradDens, CoFixNum, and CoFixDens) on the releases of the opensource systems, we show that CoFixDens is significantly more effective than the alternatives in ranking files with
1Granularity of the artifacts depends on many factors such as the availability of historical data, the cost of QA per artifact, and the QA policiesin place in the project.
2Since all these systems are in Java, each main class is usually a separate file. So the granularity of artifacts in our analysis can be consideredas file or class level.
2

/ Journal of Systems and Software 00 (2014) 1–18 3
higher DRDs, in most of our case studies. We also show the feasibility of search algorithms on this research domain,by investigating the applicability of a simple hill climbing local search algorithm for QA resource prioritization andcomparing it with the CoFixDens approach. Therefore, the contributions of this paper can be summarized as:
1. Introducing the concept of remaining defects as the basis for measuring the effectiveness of QA resource prior-itization.
2. Introducing the concept of co-fix-awareness to dynamically rank source code files.3. Proposing two co-fix-aware ranking algorithms (CoFixNum, and CoFixDens).4. Empirically comparing several QA resource prioritization algorithms.5. Investigating the applicability of heuristic-based search algorithms on QA resource prioritization.
2. The effect of co-fix on QA prioritization: Motivating example
Figure 1 is an example from the browsing package in Eclipse version 3.0. As it is shown, an issue/bug, with an id of63036, was fixed by repairing three defective files (PackagesViewHierarchalContentProvider.java, PackagesViewFlat-ContentProvider.java, and JavaBrowsingPart.java). This is an example of co-fix, where several source code defects indifferent files are repaired together during one single fix commit. Co-fixes may have several reasons. One reason, isthat several defects are logically related to a single issue, i.e., fixing the issue requires fixing all the related defects. Aco-fix may also happen due to code dependencies. For example, two defects in two methods of two distinct classesneed to be fixed together, since one method is calling the other. Regardless of the cause, one may study the defectco-fix distribution among artifacts (source code files in this paper) and its effect on the QA prioritization.
As an example of co-fix distribution, let us look at four fixes that affect three files from the Netbeans project asfollows:
• Fix 1: Date: Dec 14 2011 - Comment: fixing Bug #199806 Provide bridge between remote file system andVCS - fix rename
Defect 1 in File A: dlight.remote.impl/src/org/netbeans/modules/remote/impl/fs/RemoteDirectory.java
Defect 4 in File B: dlight.remote.impl/src/org/netbeans/modules/remote/impl/fs/RemoteFileObjectBase.java
• Fix 2: Date: Nov 09 2011 - #204798: resolving a memory leak in AnnotationHolder, where the holder waskept for files that were opened in the diff pane - using EditorRegistry rather than the EditorCookie.Observable.
Defect 6 in File C: spi.editor.hints/src/org/netbeans/modules/editor/hints/AnnotationHolder.java
• Fix 3: Date: Dec 13 2011 - fixing Bug #199806 Provide bridge between remote file system and VCS - addisReadonly, move, refresh interceptor methods
Defect 2 in File A: dlight.remote.impl/src/org/netbeans/modules/remote/impl/fs/RemoteDirectory.java
Defect 5 in File B: dlight.remote.impl/src/org/netbeans/modules/remote/impl/fs/RemoteFileObjectBase.java
• Fix 4: Date: Aug 26 2011 - Comment: Fixing #200670 Confused by ADE symlinks
Defect 3 in File A: dlight.remote.impl/src/org/netbeans/modules/remote/impl/fs/RemoteDirectory.java
To depict the co-fix distribution, in this paper, we use a matrix called defect matrix. The rows are source code filesand columns represent fixes (note that we call a commit that modifies one or more defects in one or more files as a fix).Each cell represents a defect. A co-fix happens when there is more than one defect per column, i.e., when multiplefiles are modified in the same fix.
Therefore our defect matrix in the above example, has three rows (File A, File B, and File C) and six defects(Defect 1 - 6), which are fixed in four commits (Fix 1, 2, 3, and 4). Defect 1 (in File A) and Defect 4 (in File B) needto be fixed together in Fix 1 as do Defect 2 (in File A) and Defect 5 (in File B) for Fix 3. However, Defect 3 (in FileA) and Defect 6 (in File C) are fixed alone (Fix 2, and Fix 4 respectively). Table 1 represents the defect matrix of thisexample.
Let us first explain how a traditional approach sorts these three files. The traditional approach first estimates thenumber of defects per file using several product/process/social metrics, such as the file size, complexity, churn, number
3

/ Journal of Systems and Software 00 (2014) 1–18 4
Table 1. Defect matrix representing the association of each individual defect to each individual fix and file in the Netbeans example.
Fix 1 Fix 2 Fix 3 Fix 4
File A Defect 1 - Defect 2 Defect 3File B Defect 4 - Defect 5 -File C - Defect 6 - -
Figure 1. An example of Fix-Defect relationship from Eclipse version 3.0 browsing package. For the sake of simplicity, for each file, only thedefects related to the fix is shown.
of developers, etc. Assume the prediction is perfect and we exactly know that File A has three defects followed by FileB with two and File C with only one defect. Then the prioritization phase simply suggests assigning QA resources onFile A, B, and C, in the same exact order. Assume the QA budget only suffices two files to be investigated. Then Aand B will be selected and five defects out of six are (potentially) detected. However, a closer look at the defect matrixtells us that fixing Defect 1 already has fixed Defect 4 and fixing Defect 2 has also resulted in fixing Defect 5. Thismeans that by the time that File A is repaired, we already have caught all defects of File B and assigning QA resourceto File B after repairing File A is not going to detect any remaining defect.
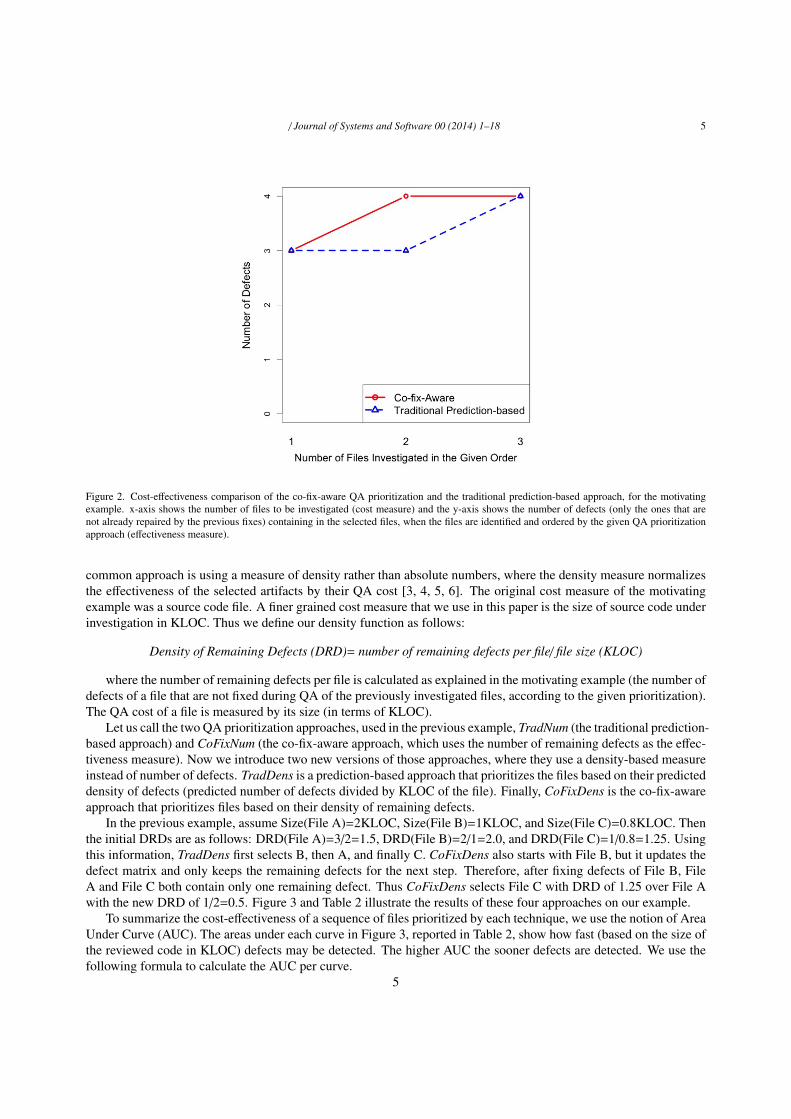
Our proposed QA prioritization approach solves this problem using the co-fix information predicted from histor-ical data. Again assume we have a perfect prediction technique that provides us with the exact information aboutco-fixes (the defect matrix). The new prioritization approach selects the top most defective file (File A), as the firstchoice. However, for the next file it knows the co-fix effect and therefore selects the file from an updated defect matrix(File C with one vs. File B with zero remaining defect). Therefore, with the same QA budget of two files, we havedetected/repaired four remaining defects (all original six defects) vs. three remaining defects that are caught with thesame budget using the traditional orderings. Figure 2 compares the two approaches when the QA budget is 1, 2, and3 files. The x-axis represents the number of files that goes under QA investigation (cost measure) and y-axis showsthe number of remaining defects (effectiveness measure). Recall that this effectiveness measure, for every file underinvestigation, counts all the defects of the file that are not already repaired.
Note that repairing defects 4 and 5 requires extra effort, while reviewing File A. This extra effort is not originallybudgeted under File A’s review cost. This is the nature of the QA tasks and no matter what prioritization techniqueis being used one might deal with defects that require co-fixes in other artifacts. However, we expect that the fixeson other artifacts require minor effort, since the issue is already detected and at least partially solved, while analyz-ing/reviewing/testing of the original artifact.
3. Co-fix-aware QA prioritization
In the motivating example of the previous section, the QA cost of different files is considered the same. However,in reality, this is not the case. Therefore, a more accurate prioritization should also take the QA cost into account. A
4
/ Journal of Systems and Software 00 (2014) 1–18 5
Figure 2. Cost-effectiveness comparison of the co-fix-aware QA prioritization and the traditional prediction-based approach, for the motivatingexample. x-axis shows the number of files to be investigated (cost measure) and the y-axis shows the number of defects (only the ones that arenot already repaired by the previous fixes) containing in the selected files, when the files are identified and ordered by the given QA prioritizationapproach (effectiveness measure).
common approach is using a measure of density rather than absolute numbers, where the density measure normalizesthe effectiveness of the selected artifacts by their QA cost [3, 4, 5, 6]. The original cost measure of the motivatingexample was a source code file. A finer grained cost measure that we use in this paper is the size of source code underinvestigation in KLOC. Thus we define our density function as follows:
Density of Remaining Defects (DRD)= number of remaining defects per file/ file size (KLOC)
where the number of remaining defects per file is calculated as explained in the motivating example (the number ofdefects of a file that are not fixed during QA of the previously investigated files, according to the given prioritization).The QA cost of a file is measured by its size (in terms of KLOC).
Let us call the two QA prioritization approaches, used in the previous example, TradNum (the traditional prediction-based approach) and CoFixNum (the co-fix-aware approach, which uses the number of remaining defects as the effec-tiveness measure). Now we introduce two new versions of those approaches, where they use a density-based measureinstead of number of defects. TradDens is a prediction-based approach that prioritizes the files based on their predicteddensity of defects (predicted number of defects divided by KLOC of the file). Finally, CoFixDens is the co-fix-awareapproach that prioritizes files based on their density of remaining defects.
In the previous example, assume Size(File A)=2KLOC, Size(File B)=1KLOC, and Size(File C)=0.8KLOC. Thenthe initial DRDs are as follows: DRD(File A)=3/2=1.5, DRD(File B)=2/1=2.0, and DRD(File C)=1/0.8=1.25. Usingthis information, TradDens first selects B, then A, and finally C. CoFixDens also starts with File B, but it updates thedefect matrix and only keeps the remaining defects for the next step. Therefore, after fixing defects of File B, FileA and File C both contain only one remaining defect. Thus CoFixDens selects File C with DRD of 1.25 over File Awith the new DRD of 1/2=0.5. Figure 3 and Table 2 illustrate the results of these four approaches on our example.
To summarize the cost-effectiveness of a sequence of files prioritized by each technique, we use the notion of AreaUnder Curve (AUC). The areas under each curve in Figure 3, reported in Table 2, show how fast (based on the size ofthe reviewed code in KLOC) defects may be detected. The higher AUC the sooner defects are detected. We use thefollowing formula to calculate the AUC per curve.
5

/ Journal of Systems and Software 00 (2014) 1–18 6
Figure 3. Cost-effectiveness comparison (effectiveness: number of remaining defects – cost: KLOC of the code under investigation) of four QAprioritization approaches, for the motivating example.
AUC = 100 ∗
n−1∑i=1
( di+di+12 ∗ (li+1 − li))
dn ∗ ln
Where n is the number of files in the sequence, di is the total number of distinct defects that can be detected byreviewing the top i files in the given order in the sequence, and li is the total lines of code of the first i files from thegiven sequence. Basically, AUC is in the range of 0 to 100, exclusively. The sooner the defects are detected whilereviewing, the closer AUC gets to 100. A very similar measure (APFD) [12, 13, 14] has been used by the test caseprioritization community for many years when they assess the cost-effectiveness of different ranking algorithms.
In the example of Figure 3, the AUC of TradNum=100*(0.5*(3+3)(3.0-2.0) + 0.5*(3+4)(3.8-3.0))/(4*3.8)=38%.The same way, AUC of TradDens, CoFixNum, and CoFixDens are 51%, 45%, and 59%, respectively, which suggestthat co-fix-awareness, specifically if it pairs with density-awareness, will results the best rankings. To compare andcontrast the AUC values of the different QA prioritization techniques, we report both the raw AUCs (like the abovevalues) and the percentages of deference between two AUCs (%∆), which calculates as follows:
∆(µ1, µ2) =µ1 − µ2
µ2
For instance, in the above example, %∆(CoFixDens,TradNum)=(59-38)/38=55, which reads as CoFixDens im-proves TradNum by 55%.
In the next section we will apply all the four QA prioritization techniques on several large open source systems andcompare the results using AUCs and %∆s . To ease the readability of the paper, we summarize, the key terminologydefined/reused in this paper, in the summary box, just before the experiment section.
6

/ Journal of Systems and Software 00 (2014) 1–18 7
Table 2. The order of files and the area under curve (AUC) for the four QA prioritization techniques of Figure 3.
Sequence AUC
TradNum <File A, File B, File C> 38%CoFixNum <File A, File C, File B> 51%TradDens <File B, File A, File C> 45%
CoFixDens <File B, File C, File A> 59%
Summary of the key terms defined in this paper.
• Defect: a single fault in one source code file.
• Bug/Issue: a user perceivable failure of the software that is caused by adefective code. One bug/issue may be the result of several defects in multiplefiles.
• Fix: a commit that repairs one or more defects. Usually a fix repairs a bug,but it can also be composed of several bug repairs.
• Co-fix: a fix that repairs more than one defect, in different files.
• QA prioritization: ranking software artifacts such as compo-nents/classes/methods, before release, to be assigned for further QAinvestigation such as inspection, testing, and code review. Note that thepost-release fixing of reported bugs, which usually is initiated by the bugreports, is not part of this type of QA and thus outside of the scope of thispaper.
• Remaining defects: the defects of a class/file that are not repaired duringthe QA investigation of the prior classes/files. Number of remaining defectsis the basis of our effectiveness measure for evaluating QA prioritizationapproaches.
• Co-fix-awareness: dynamically updating the rank of unreviewed files basedon co-fixes happened while reviewing the prior file, in a given sequence.
• Density of remaining defects (DRD): number of remaining defects per file/
file size (KLOC) – DRD is our cost-effectiveness measure for evaluating QAprioritization approaches.
4. Case Study Setup
In this section, we explain the systems under study and the data collection procedure.Systems under study: To study the effect of co-fix on QA prioritization, we setup an experiment with three
medium to large-scale open source systems: Mylyn, Eclipse, and NetBeans. These systems are selected to a) cover atleast more than one application domain (Eclipse and NetBeans: IDEs and Mylyn: task management application), b)cover a range of software size (from Mylyn version 2.0 around 200K LOC to NetBeans version 5.5.1 around 4,200KLOC), and c) cover a range of systems with different ratios of defective files to all files (73% of all files in both versionsof Mylyn are defective and only 1% of all files in NetBeans version 5.0 contain defects). Table 3 describes the basicinformation about the six releases. The table shows the release dates, the size of the systems, ratio of defective files toall files, the total number of fixes, the total number of defects and their distribution among the files.
Data collection: In this experiment, in order to collect the defect data from the systems under study, we use the“Syntactic Analysis” part of the SZZ algorithm [15]. For every commit log message associated to a set of files, we
7

/ Journal of Systems and Software 00 (2014) 1–18 8
Table 3. The subjects of the study (Mylyn versions 2.0 and 3.0, Eclipse versions 2.1 and 3.0, and Netbeans versions 5.0 and 5.5.1).Mylyn Eclipse Netbeans
V2.0 V3.0 V2.1 V3.0 V5.0 V5.5.1Release date 24.06.07 25.06.08 27.03.03 25.06.04 31.01.06 24.04.07
Number of files 1,262 1,522 7,888 10,593 9,760 21,996Percentages of defective files 73% 73% 9% 14% 1% 6%
Total lines of code 198K 244K 988K 1,306K 2,057K 4,247KMean lines of code per file 156.9 160.9 125.2 123.3 210.8 193.1
Median lines of code per file 89 93 54 51 119 106Total number of fixes 700 457 625 1,562 65 977
Total number of defects 3,247 2,802 1,371 3,198 137 2,102Max number of defects per file 63 21 18 35 4 36Mean number of defects per file 2.6 1.8 0.17 0.3 0.01 0.1
Median number of defects per file 2 2 0 0 0 0
Table 4. Percentages of fixes with more than one defect (co-fixes).
% of fixes with more than one defect
Mylyn V2.0 37%V3.0 42%
Eclipse V2.1 31%V3.0 31%
Netbeans V5.0 30%V5.5.1 33%
search for keywords related to defects and fixes. The exact regular expression used in this paper is (in the format of remodule of Python [16]):
(bug(#)[0 − 9] ∗ |pr[0 − 9] ∗ |show bug.cgi\?id = [0 − 9] ∗ |#[0 − 9]∗)AND ( f ix| f ixes| f ixed| f ixing) AND (bugs|de f ects|patch)
If we determine that a particular commit is a fix, then we assign the fix to all files of that commit (one defectper file). The assumption here is that all those files have been changed because they were defective. Of course thistechnique is not perfect. Some commits might be misclassified as fixes and some fixes might be missed. Somefiles may be considered defective while they are not and vice versa. Data collection and data cleansing are amongthe research topics that many mining software repository researchers are interested in [17]. In this paper, we usethe above approach as a basic commonly used technique [18, 19] for detecting fixes from version control systems,acknowledging that the accuracy of data collection can be improved by further research.
We also acknowledge that not all files that are committed together in a fix are dependant and deal with oneissue/bug. In fact, a study by Herzig and Zeller has shown that 15% of the co-changed files are not related [20]to one bug. However, it worth mentioning that our technique do not require a distinction between multiple bugs inone fix. This is due to the fact that co-fix-awareness only cares about the existence of co-fix not the reason behindit. In other words, whether there are multiple related/unrelated bugs in the fix or there is only one bug in the fix,does not matter. What matters is that the fix has repaired several defects in multiple files together (co-fixed) and theprioritization algorithm should be aware of that. In fact, the only data collection inaccuracies that affect our studyare a) misclassification of fixes b) missing fixes and c) when different changes in one commit are not actually done atthe same time (e.g., in the case of batch commits of older changes). Data collection procedure, in general, has beendiscussed in the threats to the validity section (Section 6), as well.
To keep the control variables limited in our case studies, we reuse the product and process metrics and exactly8

/ Journal of Systems and Software 00 (2014) 1–18 9
replicate the defect prediction approaches from our previous study [3], so that we can focus on the co-fix-awarenessrather than experimenting with the metrics or prediction techniques. Interested readers can find the details about themetrics and the prediction algorithms in the cited paper [3].
5. Results of the case study
In this section, we first report a preliminary analysis to motivate our study of co-fix-aware QA prioritization. Wethen present the approach and results related to our research question.
5.1. Preliminary Analysis: How much co-fix are there in the real world software projects?
Motivation: This question serves as the motivation for the entire study. We aim to provide supporting evidenceabout our claim that in practice several defects are fixed together. This is important, since if there are many cases ofdefect co-fix then we need to look at its impact on the cost-effectiveness of QA prioritization approaches.
Approach: To answer this question, we look at the number of files committed per fix. We assume that allthese files are affected by the fix and therefore the related defect of the file is repaired when the corresponding fixis committed. For each individual fix, we count the number of files that are in the commit. This way, we collectthe number of defects per fix (recall that defects are per file, but one fix can affect several files, i.e., contain severaldefects). Then we look at the distribution of defects per fix.
Results: To have a better understanding of the percentage of fixes that repair multiple defects, distribution ofdefects among fixes is reported in Table 4, as the percentages of fixes that affect more than one file. The statistics fromthese six releases reveal that 30-42% of the fixes contain at least two defects. Interestingly, this range is not very wideregardless of the system’s size and their ratio of defective files to all files. Therefore, considering that at least 30-42%of the fixes contain more than one defect, we conclude that there are many cases of defect co-fix. Thus, co-fix-awareQA prioritization should be studied.
In our study, 30-42% of the time one fix consists of more than one defect. Thismotivates us to study the effect of co-fix on cost-effectiveness of QA prioritization.
5.2. Research Question (RQ): Can we improve the cost-effectiveness of traditional QA prioritization, using a co-fix-aware approach?
Motivation: The preliminary study revealed that there are many cases of co-fix (30-42%), in our case studies. Aswe discussed in our motivating example in section 2, co-fixes can potentially impact the number/density of remainingdefects per file and thus change the optimal QA prioritization. Therefore, in this study, we want to empirically evaluatesuch an impact.
Approach: To answer the RQ, we compare four QA prioritization techniques: TradNum, as the main baseline ofcomparison (example usage of this technique can be found at [21, 19]), TradDens as the second baseline (exampleusage of this technique can be fund at [3]), which only deffers from TradNum by its cost measure (number of defectsper file vs. density of defects per file), and two co-fix-aware options, CoFixNum, and CoFixDens, which again theirdifference is to use the density or raw numbers. The pseudocode of a co-fix-aware approach is presented below:
9

/ Journal of Systems and Software 00 (2014) 1–18 10
Pseudocode of co-fix-aware file prioritization.– input: defect matrix (M[n][m]); where n is the number of files and m is thenumber of fixes– output: prioritized files (rankedList[n])
1. while there exists an unranked file(a) sort all unranked files descendingly based on either the number of de-
fects (for CoFixNum) or the DRD measure per file (for CoFixDens)(b) take the top file from the list (File X) and add it to the rankedList(c) update the matrix
i. For all File X defects in M[X][] identify the fixes (Fix Y) they arerepaired at.
ii. For each Fix Y (M[][Y]), remove all defects of the fix from thematrix.
2. return rankedList
In this paper, DRD’s (the explanation here are all about CoFixDens, which uses DRD, as the evaluation metric.The procedure is exactly the same for CoFixNum except DRD is replaced with the raw number of remaining defectsper file) are calculated based on the defect matrix of the previous release (our implicit assumption is files that usedto be fixed together, in the previous release, will be again show up in a co-fix in the next release). A Greedy searchfirst selects the file with the highest DRD. Then the defect matrix is updated (all defects that are fixed together withthe current file’s defects are removed from the matrix). Then these two steps are repeated until the last file is selected.TradNum on the other hand, predicts (with a logistic regression model) the number of defects per file, using commonproduct and process metrics, explained in our previous study [3]. Then it prioritizes the files by selecting the mostdefective (estimated) files first, until all files are selected. The detail of this approach can be found in [3].
It worth mentioning that all four approaches use the historical data from the previous release to predict someinformation about the future release that are later used for the QA prioritization. TradNum and TradDens predictthe number/density of defects and use it for prioritization and CoFixNum and CoFixDens predict the co-fixes in theformat of defect matrix. However, predictions used in TradNum and TradDens are more advanced and accurate, dueto several studies that has been done already in this field (defect prediction). Co-fix-aware approaches simply use thedefect matrix from the previous release and assume that there is high correlation between the previous co-fixes andthe next release co-fixes. Therefore, co-fix prediction is clearly a potential domain that can be advanced, in the future,by the defect prediction community.
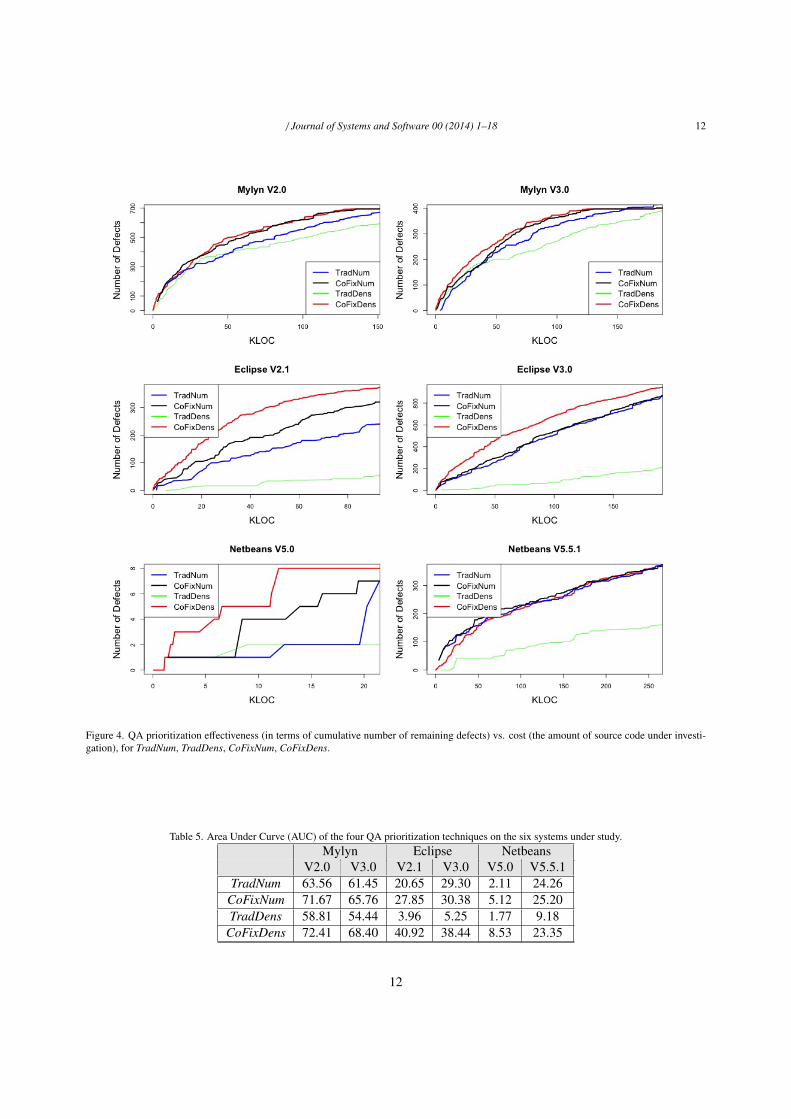
Results: Figure 4 reports the effectiveness of our QA prioritization techniques (in terms of the number of remain-ing defects) vs. effort (in terms of the size of the source code under investigation). Each graph shows the resultsfor a sequence of ordered files by one of the four prioritization techniques. Essentially, each graph shows how manymore remaining defects potentially can be fixed as one increases the QA budget, following the given prioritization ofsource files. Note that Figure 4 does not show the results for the entire file set. We set a cut-off called cap per system,depending on the size of defective code in the history. For example, if 50% of the code was defective in the previousversion, we only show up to 50% of the prioritized files in Figure 4. The main reason to set this specific cut-off valueis that all our algorithms act randomly after cap. This is due to the fact that the employed heuristics are based on thedefective code from history. Therefore, the tails of the ranks are always filled with files that are estimated to have nodefects in a random order. As a result, the actual effect of our techniques and their differences should only be analyzedin the head of the rank up to the cap. Besides cap any improvement is by chance. It also worth mentioning that thoughwe can only rank a portion (up to cap) of the files effectively, but this is not a limitation, since in practice, one is neverinterested in reviewing all the existing files in the project, unless the project is very small, which in that case there isnot any need for QA prioritization in the first place.
Though the “completely random part” of the ranks have been removed, we still have some randomness in eachalgorithm (e.g., when two files have the exact same size and the same number of remaining defects per file, thealgorithms break the tie, randomly). Graphs in Figure 4 represent the median of 30 executions of the same techniqueon the same data, with different random seeds.
10

/ Journal of Systems and Software 00 (2014) 1–18 11
A first look at the results suggests that our approach outperforms the traditional approach, in terms of cost-effectiveness, for most systems (except Netbeans V5.5.1), where the differences are minor. In some cases such asthe two versions of Mylyn, CoFixNum’s performance does not seem to be overly dominated by the density-basedversion of our approach, CoFixDens. Nevertheless, CoFixDens is the best in five out of six cases. The results in caseof Netbeans V5.5.1 is very close for CoFixDens, CoFixNum, and TradNum. To better understand the results, we usethe AUC and ∆ measures, defined in the section 3. We also apply statistical tests on the results to assess the statisticalsignificances.
Table 5 shows the raw AUCs (area under curve measure) for all four QA prioritization techniques, per system understudy. AUC provides a better measure to summarize the cost-effectiveness of a ranking algorithm than the graphs inFigure 4. For example, imagine we compare TradDens and TradNum in Mylyn V2.0, in Figure 4. All we can say isnon is completely dominating the other one. However, we can not say whether TradDens has improved TradNum ornot, since TradDens curve goes up and down the TradNum depending on the exact size of code we are reviewing. AUCprovides one single value that summarizes all these ups and downs. Looking at the AUC values tells us that CoFixDensdefinitely outperforms TradNum, in the five first cases. CoFixNum is very close to CoFixDens, in the Mylyn case,but acts worse in the other three systems. The only case that CoFixDens is weaker than the traditional approach isNetbeans V5.5.1, where indeed the other co-fix-aware approach, CoFixNum, outperforms TradNum, However, seemslike practically all three cases are quite close.
To get a higher confidence on the findings, we need to make sure that the differences between the techniques arenot due to the chance. To do so, we test the statistical significance of the results using Mann-Whitney U test (alsoknown as the Mann-Whitney-Wilcoxon test) on the AUCs from 30 runs of each technique. The Mann-Whitney U testhas the advantage over the t-test that the sample populations need not be normally distributed (non-parametric). If thep-value of the test is below a significance threshold, 0.01 in our case, then the difference between the two techniquesis considered statistically significant. The results of the tests showed that the p-values of all paired comparisons of thetechniques are, indeed, very smaller than 0.01, supporting the claim that the differences is not by chance. Even forcases that visually looked very close, the p-values are still negligible. This is partly due to the fact that there is littlerandomness in these algorithms. Indeed, the only source of randomness is the tie cases (multiple files with the samesize all having the same number of predicted defects, but different number of actual defects).
Though, statistical test increase our confidence on the results, we still need to examine whether the improvementsare actually practically significant or not. To assess the practical improvements, we use the ∆(µ1, µ2) measure thatwe have introduced in Section 3. Table 6 shows all ∆(CoFixDens, µ2), per system under test, where µ2 is all theother three prioritization approaches. This results helps us understand the practical impact of CoFixDens, in terms ofpercentages of AUC improvements. ∆ comparisons show that CoFixDens can improve TradNum (the better baselineof comparison among the two traditional approaches we studied) from 11.31% to 304% in five out of six cases weexamined, which definitely is practically significant results. The only case that CoFixDens is not improving TradNumis Netbeans V5.5.1. A plausible reason can be the huge code base size, over 4 million lines of code, with a relativelysmall defective portion 6%, this characteristics may reduces the accuracy of co-fix identification based on historicaldata.
Overall, the three analysis of this section (based on raw data of Figure 4, AUCsof Table 5, and percentages of AUC improvements of Table 6) suggest that co-fix-awareness, in general, and the density-based version of it in particular, improvethe current practice of QA prioritization.
5.3. Search-based QA prioritization
So far, all the four QA prioritization techniques that we have discussed in the paper, rank the files using a Greedyalgorithm. In this section, we explain how one can formulate the QA prioritization problem as a search problem. Wewill also show one simple application of a search algorithm on this domain. Note that the aim of this section is notimproving the results of CoFixDens but it is rather to show the feasibility of search-based QA prioritization.
A search-based QA prioritization technique consists of a) an encoding of the individuals, b) a fitness function andc) an optimization algorithm to optimize the fitness function for the given individuals in search space. One of the bestsuited encodings that one can choose for this problem is representing a solution as a sequence of files. This way the
11
/ Journal of Systems and Software 00 (2014) 1–18 12
Figure 4. QA prioritization effectiveness (in terms of cumulative number of remaining defects) vs. cost (the amount of source code under investi-gation), for TradNum, TradDens, CoFixNum, CoFixDens.
Table 5. Area Under Curve (AUC) of the four QA prioritization techniques on the six systems under study.Mylyn Eclipse Netbeans
V2.0 V3.0 V2.1 V3.0 V5.0 V5.5.1TradNum 63.56 61.45 20.65 29.30 2.11 24.26
CoFixNum 71.67 65.76 27.85 30.38 5.12 25.20TradDens 58.81 54.44 3.96 5.25 1.77 9.18
CoFixDens 72.41 68.40 40.92 38.44 8.53 23.35
12

/ Journal of Systems and Software 00 (2014) 1–18 13
Table 6. The percentages of AUC improvements (∆) that CoFixDens can provide over TradNum, CoFixNum, and TradDens on the six systemsunder study.
Mylyn Eclipse NetbeansV2.0 V3.0 V2.1 V3.0 V5.0 V5.5.1
TradNum 13.92% 11.31% 98.16% 31.19% 304.27% -3.75%CoFixNum 1.03% 4.01% 46.93% 26.53% 66.6% -7.34%TradDens 23.13% 25.64% 933.34% 632.19% 381.92% 154.36%
goal would be finding the most-cost effective sequence of files. As we discussed in the previous section, there canbe many ways for evaluating the cost-effectiveness of a QA prioritization technique. AUC was among the measuresthat we have used for our assessments in the previous section. To define our fitness function, we can also use theAUC measure. The only difference between using AUC as an evaluation measure vs. using AUC as fitness function isthat AUC as an evaluation measure will be based on the actual defects per file, in the current release. However, AUCas a fitness function is a heuristic based on the defect data from the old release. Having a finiteness function and arepresentation for the individuals, one can apply several search algorithms to optimize the fitness function.
In this paper, as one of the most basic search algorithms, we have used a local Hill Climbing (HC) search, toshow the feasibility of applying search algorithms for QA prioritization. The pseudocode for this algorithm is shownbellow.
Pseudocode of CoFixHC, a Hill Climbing based co-fix-aware file prioritization.
– input1: defect matrix (M[n][m]) ; where n is the number of files and m is the number of fixes.– input2: an initial solution (IS[n]); in this paper the initial solution is the CoFixDens’s output.– output: prioritized files (rankedList[n])
1. BestAUC=0; noImprovement=FALSE2. until noImprovement==TRUE OR iterationCount >MaxIteration (10 in this paper)
(a) for X times (X=50 in this paper)i. select a random file in IS (IS[a])
ii. for Y times (Y=1000 in this paper)A. select a random file in IS (IS[b]); where a , bB. create a neighbour for IS (IS ′) by switching IS[a] and IS[b]
iii. Find the best neighbour (bestIS ′) with the highest AUC (currentAUC), as defined in thepaper
(b) if BestAUC <currentAUC then BestAUC = currentAUC and IS <– bestIS ′
(c) else noImprovement=TRUE3. return rankedList
Basically, the algorithm will start from an initial sequence of files, which is either randomly generated or can bethe output of any of the existing four prioritization techniques (in this paper, the initial solution is the output ofCoFixDens). Then in each iteration the algorithm will find the best neighbour of the current solution. A neighbouris a sequence of files that is generated by switching two files in the sequence. Investigating all neighbours of a givensequence is very costly (the number of neighbours=n*(n-1)/2; where n is the number of files in the sequence). Inthis paper we have limited the neighbour investigation to 50*1000 (50 random files in the sequence are selected and1000 neighbours per selected file is chosen for switching). If the fitness value of the best neighbour is higher than thecurrent individual’s fitness value, then the search will move to the neighbour and starts another iteration. The processwill continue until there is no improvement anymore or up to a max iteration limit.
Table 7 shows the AUC improvements of the HC-based technique (CoFixHC) vs. CoFixDens (∆(CoFixHC,CoFixDens)).Again all the p-values for non-zero cells are still less than 0.1, which mean that the differences between CoFixHC andCoFixDens are statisticaly significant. However, it is also clear from the table that CoFixHC’s improvements, if there
13

/ Journal of Systems and Software 00 (2014) 1–18 14
Table 7. The percentages of AUC improvements (∆) that CoFixHC can provide over CoFixDens, on the six systems under study.Mylyn Eclipse Netbeans
V2.0 V3.0 V2.1 V3.0 V5.0 V5.5.1∆(CoFixHC,CoFixDens) 0% 0.10% 0.05% 0% 0.47% 1.97%
is any, are not practically significant. Nevertheless, as mentioned before, the goal of this section is not trying to im-prove CoFixDens. The main goal is rather to encourage, SBSE researchers to invest in this new domain of problems.
It is also worth mentioning that all improvements discussed in this paper come with a price, which is the executiontime overhead. Thus the efficiency of the proposed approaches depends on the time complexity of the new algorithms.For example, in this paper, the cost of CoFixDens is up to NumberOfFiles times more than TradDens. This is due tothe dynamic nature of the approach, where after each rank assignment per artifact the ranking algorithm should berepeated. One can think of some performance optimization techniques that caches some previously calculated resultsto avoid re-ranking unaffected artifacts. However, we did not study such performance improvements in this paper.Search algorithms also impose extra cost, compared to simple greedy algorithms. Our search algorithm in this paper,Hill Climbing, is a very basic technique, which is not very costly (each full rank assignment takes a few seconds).However, using more sophisticated search algorithms may have efficiency concerns as well. Though efficiency can bean issue in realtime ranking systems, in our context, QA prioritization, the ranking algorithm will be executed oncebefore every planned inspection (usually before each release or may be couple of times per release). So an overheadin the range of few minutes or even few hours is negligible, if the QA effectiveness is improved. Therefore, we didnot focus on the efficiency of the approaches in this paper.
Search-based approaches fit very well to the QA prioritization problem. The AUCmeasure calculated based on the historical co-change data can be a potential fitnessfunction to optimize. We have applied a simple Hill Climbing local search to showthe feasibility of this approach. Though the results improved a greedy search-basedapproach, but the improvements are not practically significant. Thus we invite thesearch based software engineering community to further investigate this searchproblem.
6. Threats to the validity of the results
In this paper, we assume that co-fix data is accurate, in a sense that we don’t miss fixes and we do not misclassifynon-bug-repairing commits as fixes. In addition, we assume that the fixes that are committed at the same time, indeed,have been submitted at the same time. None of these assumptions are always held. In practice, fixes are missed,misclassified, or committed as a batch after the actual submission time. All these inaccuracies, threatens the constructvalidity of the study. We tried to alleviate this threat by being consistent with other defect prediction research [15]. Inaddition, as discussed, studies [20] have shown that the inaccuracies are not very high, for example 15% of co-changesare not dependent to each other based on a study by Herzig and Zeller [20]. Nevertheless, this study, like many otherstudies in the mining software repository field, can benefit from more accurate data collection processes.
We also assume that all defects have the same impact on the quality, but a better approach would be prioritizingfiles such that high impact defects fixed first [21]. We also assume QA investigation of a file results in fixing all defectsof the file, which is not the case in real world. Therefore, estimating the probability of fixing a defect during the QAprocess may help better designing a QA prioritization. This problem should also be further investigated with respectto re-opened defects. Finally, our results rely on six releases of three open source systems. The systems are realworld large-scale software systems with actual change histories. Irrespective of the system, we believe that co-fixesare a regular phenomenon in software maintenance. However, replicating our study in various domains (open sourceand proprietary) as many times as possible is of course desirable to gain higher confidence in our results and betterunderstand their limitations.
14

/ Journal of Systems and Software 00 (2014) 1–18 15
7. Related work
When there is a lack of resources that can be dedicated to a software development activity, managers often haveto prioritize which task to address first. These activities can occur either pre-release or post-release. In the post-release phase, the QA task is usually triggered by the reported issues. Issues are prioritized based on their severity anddepending on the QA budget some of them will be fixed first. Once the set of issues to be fixed are chosen, then faultlocalization techniques can be used to determine which set of files would have to be looked at for fixing a specificreported issue [22, 23, 24]. These techniques reduce the time needed to find the origin of an issue, and hence reducethe time needed to fix it. The QA process usually continues with debugging the defect, modifying the code change,and running regression tests.
In this paper, however, we are focused on the prioritization of files in the pre-release phase. Unlike the prioritiza-tion in the post-release phase, we do not have reported issues for the current release. Therefore, source-code analysis,peer review, and testing, are often performed to identify defects in the source code of the software system. However,such resources are also limited and managers have to prioritize the different parts of the system, so that the resourcescan be effectively allocated. Test case prioritization [12, 13, 25, 26], operational profiling [27, 28, 29], and defectprediction are some of the ways to prioritize.
In this paper, we focus on the defect prediction-based approaches for QA prioritization, which we call themtraditional QA prioritization approaches. In these approaches, different metrics are collected about the static (e.g.Total Lines Of Code, Code Complexity, etc.) and dynamic (e.g. Pre-release defects, and Code Churn) nature of thesoftware and its development. Then statistical models or data mining techniques are applied to the data collected inorder to predict the source code level defects in files [21]. Typically in defect prediction techniques, the models aretrained on data from the previous version of the software. The independent variables in the model are the softwaremetrics collected for each file, and the dependent variable is the number of post-release defects per file. Then usingthe independent variables of the future version, these models predict the numbers of defects for the future version ofthe software [19]. From this prediction, the files are prioritized (sorted) for resource allocation [2]. We explain fourtypes of prioritization approaches below:
• Classification: Techniques like logistic regression, or decision trees are used to determine the probability offinding a defect in a file. Using this probability we can prioritize the files [21].
• Regression: Models such as linear regression predict the number of defects in each file. We then prioritize filesin decreasing order of expected defects. Fenton and Neil [2] and Hall et.al. [30], present a summary of these twodefect prediction techniques and the various metrics that are used in the models to prioritize different artifactssuch as components, modules, files, and methods.
• Effort aware models: Prioritize files while factoring the effort required in identifying the defect [3, 7]. Themotivation for these approaches is based on the fact that large files have more defects than small files butrequire more effort. Therefore, these approaches suggest density-based prioritization.
• Top Files: Hassan and Holt [31], and Kim et.al. [32], propose techniques that do not provide a complete prioritylist of the files in the software system, but rather just point to the top few files that are most likely to havedefects. The motivation for their work is that, a development team will have resources to only check a very fewfiles. Hence they focus on predicting a few very defective files very accurately, instead of providing a completeranked list of files.
Search-based approaches and defect prediction: Harman [33] discuses the relationship between search-basedsoftware engineering and predictive modeling. He identifies 11 broad areas where search-based approaches can helppredictive modelling. He also points out that using search algorithms for predicting number of defects is rarely studiedin the literature. One of the rare case is by Afzal et.al. [34]. They used search-based approaches and several otherapproaches for predicting fault-prone modules [35]. More recently, Canfora et.al. [36] have applied a multi-objectivesearch algorithm to predict defect across projects.
However, all current defect prediction techniques, including the search-based ones, ignore that several defectsin different files may be repaired in one fix. Thus, in practice, the co-fix may impact the number of remainingdefects per file and may change the optimal ordering of the files with respect to the actual remaining defects to repair.
15

/ Journal of Systems and Software 00 (2014) 1–18 16
Therefore, in this paper, we take a co-fix-aware approach and show the applicability of search-based techniques onQA prioritization.
There are also some closely related topics that are not directly relevant to QA prioritization but have been asource of inspiration and motivation for our work, e.g., co-change/ change coupling [37] and search-based projectmanagement/planning [37].
D’Ambros et. al. [38], and Shihab et. al. [21] show that co-changes in software artifacts such as source code filesare related to software defects. Similarly, Cataldo et. al. [39], also found that when source code across files are related,then such files are more likely to contain defects. Kouroshfar further explores the effects of different characteristics ofco-changes to software defects. More recently, Mondal et. al. [40] look into automatically determining the strengthof coupling among co-changed files. All the above studies strongly support the fact that files co-change often and thatthey are co-changed for defects. Hence, our study complements the above work, and examines the effect of co-fix onfile prioritization.
The extension of our original approach, CoFixDens, to a search-based approach, CoFixHC, was inspired by theseveral existing work on search-based resource allocation in the context of project management and planning. Table11 of the survey paper by Harman et. al. [37] summarizes the related work on search-based management activities.For example, Chang et.al. [41] introduced a search-based task scheduling approach that determines near-optimalresource allocation solution, using Genetic Algorithms. Xiao and Afzal [42] apply a multi-objective GA on bug fixingactivities, where limitations on human resources should be considered when scheduling. Ferrucci et.al. applies amulti-objective genetic algorithm to balance project risks and duration against overtime , so that software engineerscan better plan overtime [43].
There is also many search-based test prioritization techniques [44] that take very similar approach for prioritizingthe allocation of QA resource to the test cases (to execute), rather than source files (to be reviewed). The search-basedapproach for QA prioritization, which is one of the contributions of this paper, is heavily inspired by these work(especially search-based test case prioritization approaches). However, applying these ideas in the pre-release QAresource allocation context, and combining it with the co-fix-awareness ideas is novel.
8. Conclusion and future direction of research
Resource allocation is a critical task in software project management. Current prediction-based QA prioritizationapproaches help identify the defective areas of the software system. These approaches usually return an ordered listof files that are predicted to be more defective, thus requiring the allocation of additional QA resources. In this paper,we criticize the current practice of evaluating QA prioritization (counting total number of defects per file, ignoringwhether they have been already fixed during the QA process so far or not) and argue that a more accurate effectivenessmeasure is the number of remaining (unfixed) defects per file. Such a number actually changes during the QA process,due to co-fixing of related defects in other files. We provided some evidence, based on six case studies, that 30-42%of the fixes repair at least one defect from another file other than the one under investigation. Therefore, we proposeda co-fix-aware QA prioritization that updates the number of remaining defects per file after each fix. Empiricalresults show that our proposed approach improves the performance of the current practice of QA prioritization interms of cost-effectiveness. We also showed how the problem of QA prioritization can be reformulated as a typicalsearch problem and generalized our approach by applying a simple hill climbing local search on the case studies.This paper motivates studying a new research domain for search-based software engineering that combines defectprediction research with search-based software engineering, to improve QA prioritization. This paper also provides anew direction for the defect prediction research community to focus on predicting co-fixes, which helps improve thefinal outcome of QA prioritization efforts. In the future we plan to investigate techniques for predicting co-fixes andapply more advanced search algorithms such as NSGA-II, in our context.
References
[1] N. E. Fenton, M. Neil, A critique of software defect prediction models, IEEE Trans. Softw. Eng. 25 (5) (1999) 675–689.[2] T. Hall, S. Beecham, D. Bowes, D. Gray, S. Counsell, A systematic review of fault prediction performance in software engineering, IEEE
Transactions on Software Engineering 99 (PrePrints).
16

/ Journal of Systems and Software 00 (2014) 1–18 17
[3] Y. Kamei, S. Matsumoto, A. Monden, K. ichi Matsumoto, B. Adams, A. E. Hassan, Revisiting common bug prediction findings usingeffort-aware models, Software Maintenance, IEEE International Conference on 0 (2010) 1–10.
[4] T. Mende, R. Koschke, Revisiting the evaluation of defect prediction models, in: Proceedings of the 5th International Conference on PredictorModels in Software Engineering, PROMISE ’09, ACM, New York, NY, USA, 2009, pp. 7:1–7:10.
[5] E. Arisholm, L. C. Briand, Predicting fault-prone components in a java legacy system, in: Proceedings of the 2006 ACM/IEEE InternationalSymposium on Empirical Software Engineering, ISESE ’06, ACM, New York, NY, USA, 2006, pp. 8–17.
[6] E. Shihab, Y. Kamei, B. Adams, A. E. Hassan, Is lines of code a good measure of effort in effort-aware models?, Inf. Softw. Technol. 55 (11)(2013) 1981–1993.
[7] T. Mende, R. Koschke, Effort-aware defect prediction models, in: Proceedings of the 2010 14th European Conference on Software Mainte-nance and Reengineering, CSMR ’10, IEEE Computer Society, Washington, DC, USA, 2010, pp. 107–116.
[8] E. Shihab, Z. M. Jiang, W. M. Ibrahim, B. Adams, A. E. Hassan, Understanding the impact of code and process metrics on post-releasedefects: A case study on the eclipse project, in: Proceedings of the 2010 ACM-IEEE International Symposium on Empirical SoftwareEngineering and Measurement, ESEM ’10, ACM, New York, NY, USA, 2010, pp. 4:1–4:10.
[9] T. Zimmermann, N. Nagappan, Predicting defects using network analysis on dependency graphs, in: Proceedings of the 30th InternationalConference on Software Engineering, ICSE ’08, ACM, New York, NY, USA, 2008, pp. 531–540.
[10] A. Marcus, D. Poshyvanyk, R. Ferenc, Using the conceptual cohesion of classes for fault prediction in object-oriented systems, IEEE Trans.Softw. Eng. 34 (2) (2008) 287–300.
[11] S. Neuhaus, T. Zimmermann, C. Holler, A. Zeller, Predicting vulnerable software components, in: Proceedings of the 14th ACM Conferenceon Computer and Communications Security, CCS ’07, ACM, New York, NY, USA, 2007, pp. 529–540.
[12] G. Rothermel, R. J. Untch, C. Chu, Prioritizing test cases for regression testing, IEEE Trans. Softw. Eng. 27 (10) (2001) 929–948.[13] S. Elbaum, A. Malishevsky, G. Rothermel, Test case prioritization: a family of empirical studies, Software Engineering, IEEE Transactions
on 28 (2) (2002) 159 –182.[14] S. W. Thomas, H. Hemmati, A. E. Hassan, D. Blostein, Static test case prioritization using topic models, Empirical Softw. Engg. 19 (1) (2014)
182–212.[15] J. Sliwerski, T. Zimmermann, A. Zeller, When do changes induce fixes?, in: Proceedings of the 2005 international workshop on Mining
software repositories, MSR ’05, ACM, New York, NY, USA, 2005, pp. 1–5.[16] Python Software Foundation, Re module of python (2012).
URL http://docs.python.org/library/re.html
[17] H. Hemmati, S. Nadi, O. Baysal, O. Kononenko, W. Wang, R. Holmes, M. W. Godfrey, The msr cookbook: Mining a decade of research,in: Proceedings of the 10th Working Conference on Mining Software Repositories, MSR ’13, IEEE Press, Piscataway, NJ, USA, 2013, pp.343–352.URL http://dl.acm.org/citation.cfm?id=2487085.2487150
[18] M. D’Ambros, M. Lanza, R. Robbes, Evaluating defect prediction approaches: A benchmark and an extensive comparison, Empirical Softw.Engg. 17 (4-5) (2012) 531–577.
[19] A. E. Hassan, Predicting faults using the complexity of code changes, in: Proceedings of the 31st International Conference on SoftwareEngineering, IEEE Computer Society, 2009, pp. 78–88.
[20] K. Herzig, A. Zeller, The impact of tangled code changes, in: Proceedings of the 10th Working Conference on Mining Software Repositories,MSR ’13, IEEE Press, Piscataway, NJ, USA, 2013, pp. 121–130.URL http://dl.acm.org/citation.cfm?id=2487085.2487113
[21] E. Shihab, A. Mockus, Y. Kamei, B. Adams, A. E. Hassan, High-impact defects: A study of breakage and surprise defects, in: Proceedingsof the 19th ACM SIGSOFT Symposium and the 13th European Conference on Foundations of Software Engineering, ESEC/FSE ’11, 2011,pp. 300–310.
[22] D. Andrzejewski, A. Mulhern, B. Liblit, X. Zhu, Statistical debugging using latent topic models, in: Proceedings of the 18th Europeanconference on Machine Learning, ECML ’07, Springer-Verlag, Berlin, Heidelberg, 2007, pp. 6–17.
[23] T. M. Chilimbi, B. Liblit, K. Mehra, A. V. Nori, K. Vaswani, Holmes: Effective statistical debugging via efficient path profiling, 2009 IEEE31st International Conference on Software Engineering (2009) 34–44.
[24] B. Liblit, M. Naik, A. X. Zheng, A. Aiken, M. I. Jordan, Scalable statistical bug isolation, in: Proceedings of the 2005 ACM SIGPLANconference on Programming language design and implementation, PLDI ’05, ACM, New York, NY, USA, 2005, pp. 15–26.
[25] H. Hemmati, L. Briand, A. Arcuri, S. Ali, An enhanced test case selection approach for model-based testing: an industrial case study, in:Proceedings of the eighteenth ACM SIGSOFT international symposium on Foundations of software engineering, FSE ’10, ACM, New York,NY, USA, 2010, pp. 267–276.
[26] Z. Li, M. Harman, R. M. Hierons, Search algorithms for regression test case prioritization, IEEE Trans. Software Eng. 33 (4) (2007) 225–237.[27] J. Musa, Operational profiles in software-reliability engineering, Software, IEEE 10 (2) (1993) 14 –32.[28] A. E. Hassan, D. J. Martin, P. Flora, P. Mansfield, D. Dietz, An industrial case study of customizing operational profiles using log compression,
in: Proceedings of the 30th international conference on Software engineering, ICSE ’08, ACM, New York, NY, USA, 2008, pp. 713–723.[29] M. Nagappan, K. Wu, M. A. Vouk, Efficiently extracting operational profiles from execution logs using suffix arrays, in: Proceedings of the
2009 20th International Symposium on Software Reliability Engineering, ISSRE ’09, IEEE Computer Society, Washington, DC, USA, 2009,pp. 41–50.
[30] IEEE Standard Association, Ieee standard glossary of software engineering terminology, IEEE Std 610.12-1990 (1990) 1.[31] A. E. Hassan, R. C. Holt, The top ten list: Dynamic fault prediction, in: Proceedings of the 21st IEEE International Conference on Software
Maintenance, ICSM ’05, IEEE Computer Society, Washington, DC, USA, 2005, pp. 263–272.[32] D. Kim, X. Wang, S. Kim, A. Zeller, S. Cheung, S. Park, Which crashes should i fix first?: Predicting top crashes at an early stage to prioritize
debugging efforts, Software Engineering, IEEE Transactions on 37 (3) (2011) 430 –447.[33] M. Harman, The relationship between search based software engineering and predictive modeling, in: Proceedings of the 6th International
Conference on Predictive Models in Software Engineering, ACM, 2010, p. 1.
17
/ Journal of Systems and Software 00 (2014) 1–18 18
[34] W. Afzal, R. Torkar, R. Feldt, Search-based prediction of fault count data, in: Search Based Software Engineering, 2009 1st InternationalSymposium on, IEEE, 2009, pp. 35–38.
[35] W. Afzal, Using faults-slip-through metric as a predictor of fault-proneness, in: Software Engineering Conference (APSEC), 2010 17th AsiaPacific, 2010, pp. 414–422.
[36] G. Canfora, A. De Lucia, M. Di Penta, R. Oliveto, A. Panichella, S. Panichella, Multi-objective cross-project defect prediction, in: SoftwareTesting, Verification and Validation (ICST), 2013 IEEE Sixth International Conference on, 2013, pp. 252–261.
[37] M. Harman, S. A. Mansouri, Y. Zhang, Search-based software engineering: Trends, techniques and applications, ACM Comput. Surv. 45 (1)(2012) 11:1–11:61.
[38] M. D’Ambros, M. Lanza, R. Robbes, On the relationship between change coupling and software defects, in: Proceedings of the 2009 16thWorking Conference on Reverse Engineering, WCRE ’09, IEEE Computer Society, 2009, pp. 135–144.
[39] M. Cataldo, A. Mockus, J. Roberts, J. Herbsleb, Software dependencies, work dependencies, and their impact on failures, Software Engineer-ing, IEEE Transactions on 35 (6) (2009) 864–878.
[40] M. Mondal, C. Roy, K. Schneider, Improving the detection accuracy of evolutionary coupling by measuring change correspondence, in:Software Maintenance, Reengineering and Reverse Engineering (CSMR-WCRE), 2014 Software Evolution Week - IEEE Conference on,2014, pp. 358–362.
[41] C. Chang, C. Chao, S.-Y. Hsieh, I. Alsalqan, Spmnet: a formal methodology for software management, in: Computer Software and Applica-tions Conference, 1994. COMPSAC 94. Proceedings., Eighteenth Annual International, 1994, pp. 57–.
[42] J. Xiao, W. Afzal, Search-based resource scheduling for bug fixing tasks, in: Search Based Software Engineering (SSBSE), 2010 SecondInternational Symposium on, 2010, pp. 133–142.
[43] F. Ferrucci, M. Harman, J. Ren, F. Sarro, Not going to take this anymore: Multi-objective overtime planning for software engineering projects,in: Software Engineering (ICSE), 2013 35th International Conference on, 2013, pp. 462–471.
[44] H. Hemmati, A. Arcuri, L. Briand, Achieving scalable model-based testing through test case diversity, ACM Trans. Softw. Eng. Methodol.22 (1) (2013) 6:1–6:42.
18