investigating the perceived impacts of the hotel rating...
TRANSCRIPT

THE RELATIONSHIP OF THE HOTEL RATING
SYSTEM AND SERVICE QUALITY
A CASE STUDY OF
THE ‘THAILAND HOTELS STANDARD’
By
YEAMDAO NARANGAJAVANA
Bachelor of Business Administration Assumption University
Bangkok, Thailand 1997
Master of Art Bournemouth University
Bournemouth, United Kingdom 1999
Submitted to the Faculty of the Graduate College of the
Oklahoma State University in partial fulfillment of
the requirements for the degree of
DOCTORAL OF PHILOSOPHY May, 2007

THE RELATIONSHIP OF THE HOTEL RATING
SYSTEM AND SERVICE QUALITY
A CASE STUDY OF
THE ‘THAILAND HOTELS STANDARD’
Dissertation Approved:
Dr. Bo Hu Dissertation Advisor
Dr. Hailin Qu
Dr. Jerrold Leong
Dr. Ken Eastman
Dr. A. Gordon Emslie
Dean of the Graduate College
ii

ACKNOWLEDGEMENTS
I am deeply appreciated my advisor, Dr. Bo Hu, who guided me throughout the
dissertation process even though we are half-the-world far from each other. Thank you
for your dedication, patience, friendliness, encouragement, and support. My appreciation
also goes to Dr. Hailin Qu, Chairman of my dissertation committee, for understanding my
limitation as an international student. Special thanks are also for other committee
members, Dr. Jerrold Leong and Dr. Ken Eastman.
I am greatly indebted to Walailak University, which provided a scholarship for
advancing my knowledge. Also, I would like to express gratitude to Dr. Gosa Areeya,
Dean of Institute of Management, and Associate Professor Somnuek Auejeerapongpan,
former Dean of Institute of Management for their support and guidance. Sincerely thanks
to my colleagues at Walailak University, especially Ajarn Rungrawee Jitpakdee, Ajarn
Onanong Cheableam, Ajarn Sukumal Klamseangsai, Ajarn Pawit Tansakul, Mr.
Narongchai Chairaksa, Miss Hataikarn Nundetch for your great support, since returning
from coursework in the United States. I also thank many other colleagues whom I do not
mention their name here.
Additionally, I would like to thank my OSU colleagues who gave me wonderful
experiences while studying at Oklahoma State University. Special thanks for Pimtong
Tavitiyaman for being a close friend and all your help for running all activities while I
was not at OSU. Thank you, Prapaporn Kiattikulwattana, my roommate, and other Thai
iii

friends from the OSU Thai Student Association. Also thank you, Dr.Shahrim Abkarim
and others HRAD colleagues.
Last but not least, I would like to thank my family: my parents, Yinnatee Kaosiri
and Unnop Narangajavana, for giving me life, love, caring, and believing in me. My
sister, Yeamduan Narangajavana Garrigos, for happiness we had in our childhood. Dr.
Kanop Ketchart, thank you for your love and support.
Without these people, I could have not finished all the requirements for the degree
of Doctoral of Philosophy from Oklahoma State University. Thank you all.
iv

TABLE OF CONTENTS
Chapter Page CHAPTER I. INTRODUCTION ----------------------------------------------------------------1 Background of Thai Tourism and Hospitality Industry ------------------------------1 Service Quality in Thai Tourism and Hospitality Industry --------------------------3 The Thailand Hotels Standard-----------------------------------------------------------4 Significance of the Study ----------------------------------------------------------------7 Objectives of the Study-------------------------------------------------------------------8 CHAPTER II. LITERATURE REVIEW ----------------------------------------------------- 10 Hotel Rating ----------------------------------------------------------------------------- 10 Definitions of Hotel Rating System ----------------------------------------- 10 Characteristics of Hotel Ratings Systems----------------------------------- 12 The Survey of Existing Hotel Rating Systems ----------------------------- 14 The U.S. Hotel Rating Systems ---------------------------------------------- 15 Britain’s Hotel Rating Systems----------------------------------------------- 18 China’s Hotel Rating System------------------------------------------------- 20 The Importance of Hotel Rating Systems----------------------------------- 22 Service Quality -------------------------------------------------------------------------- 23 Definition of Service----------------------------------------------------------- 23 Definition of Quality----------------------------------------------------------- 28 Definition of Service Quality------------------------------------------------- 33 Service Quality Measurement ------------------------------------------------ 37 Service Quality in Hospitality Industry ------------------------------------- 44 Service Quality Measurement in Hospitality Industry -------------------- 49 Hotel Rating, Service Quality, and Hotel Performance ---------------------------- 55 Conceptual Framework----------------------------------------------------------------- 57 Hypotheses------------------------------------------------------------------------------- 58 CHAPTER III. METHODOLOGY------------------------------------------------------------ 60 Research Framework ------------------------------------------------------------------- 60 Research Design------------------------------------------------------------------------- 62 Sampling Plan --------------------------------------------------------------------------- 62 Target Population -------------------------------------------------------------- 62 Sample Size --------------------------------------------------------------------- 63
v

Sampling Methods ------------------------------------------------------------- 64 Survey Administration ----------------------------------------------------------------- 66 Instrument-------------------------------------------------------------------------------- 68 Pilot Study ------------------------------------------------------------------------------- 70 Content Validity------------------------------------------------------------------------- 71 Reliability -------------------------------------------------------------------------------- 71 Data Analysis ---------------------------------------------------------------------------- 73 Descriptive Analysis----------------------------------------------------------- 74 Independence Sample T-Test------------------------------------------------- 74 Factor Analysis ----------------------------------------------------------------- 75 Analysis of Variance----------------------------------------------------------- 76 Canonical Correlation Analysis ---------------------------------------------- 77 CHAPTER IV. RESULTS---------------------------------------------------------------------- 79 Sample Description --------------------------------------------------------------------- 79 The Perceived Influences of the Hotel Rating System ----------------------------- 84 Perceptions at the Industry Level -------------------------------------------- 84 Perceptions at the Property Level -------------------------------------------- 86 Hypothesis Testing:
Differences of the Perceived influences of the Thailand Hotels Standard on Hotels’ Application Status ------------------------------------------------ 88
Hypothesis Testing: Differences of the Perceived influences of the Thailand Hotels Standard on Hotels’ Certification Status ----------------------------------------------- 92
Factor Analysis of Service Quality Improvement ---------------------------------- 96 Hypothesis Testing:
Service Quality Improvement and Star Rating Level -----------------------102 Hypothesis Testing:
Service Quality Improvement and Hotel Chain Affiliation-----------------104 Hypothesis Testing:
Service Quality Improvement and Hotel Performance Changes-----------105 Discussion of Findings ----------------------------------------------------------------113 Summary of Hypotheses Testing ----------------------------------------------------126 CHAPTER V. CONCLUSION---------------------------------------------------------------129 Summary --------------------------------------------------------------------------------129 Implications-----------------------------------------------------------------------------132 Limitations of the Study---------------------------------------------------------------141 Recommendation for Future Work --------------------------------------------------143 BIBLIOGRAPHY ------------------------------------------------------------------------------146
vi

APPENDICES-----------------------------------------------------------------------------------160 Appendix A- World’s Top Tourism Earners ---------------------------------------160
Appendix B - World’s Top Tourism Destinations (absolute numbers) ---------161 Appendix C - World’s Top Tourism Destinations by Number of Rooms ------162 Appendix D - Pilot Test Questionnaire (English)----------------------------------163 Appendix E - Pilot Test Questionnaire (Thai)--------------------------------------170 Appendix F - Questionnaire (English) ----------------------------------------------177 Appendix G - Questionnaire (Thai)--------------------------------------------------184 Appendix H - IRB Approval----------------------------------------------------------191
vii

LIST OF TABLES
Table Page
1 Summary of Three Hotel Rating Systems -------------------------------------------------- 21
2 Understanding the Nature of the Service Act ---------------------------------------------- 24
3 The Four Major Quality Eras----------------------------------------------------------------- 31
4 Comparison of Service Quality Instruments in Hospitality Industry-------------------- 52
5 Response Rate---------------------------------------------------------------------------------- 67
6 Reliability Coefficients for Scales ----------------------------------------------------------- 73
7 Hotel Category and Chain Affiliation------------------------------------------------------- 80
8 Hotel Size and Length of Operation--------------------------------------------------------- 81
9 The Sample’s Involvement with the Hotel Rating System ------------------------------- 83
10 Successful Applications of Each Proposed Star Level ---------------------------------- 84
11 The Perceived Influences of the Hotel Rating System at the Industry Level--------- 85
12 The Perceived Influences of the Hotel Rating System at the Property Level -------- 87
13 The Perceived Influences of the Hotel Rating System at the Industry Level by
Application Status --------------------------------------------------------------------------- 89
14 The Perceived Influences of the Hotel Rating System at the Industry Level by
Application Status --------------------------------------------------------------------------- 91
15 The Perceived Influences of the Hotel Rating System at the Property Level by
Certification Status -------------------------------------------------------------------------- 93
16 The Perceived Influences of the Hotel Rating System at the Property Level by
Certification Status -------------------------------------------------------------------------- 95
17 Dimensions of Service Quality Improvement -------------------------------------------- 98
18 T-Tests of Service Quality Improvement by Star Level--------------------------------103
19 T-Tests of Service Quality Improvement by Chain Affiliation -----------------------103
20 Measures of Overall Model Fit for Canonical Correlation Analysis -----------------107
21 Calculation of the Redundancy Indices for the First Canonical Function -----------109
viii

22 Calculation of the Redundancy Indices for the Second Canonical Function --------109
23 Calculation of the Redundancy Indices for the Third Canonical Function ----------110
24 Overall Results of Canonical Correlation Analysis ------------------------------------110
25 Canonical Loadings in the Canonical Functions ----------------------------------------111
ix

LIST OF FIGURES Figure Page
1 The Service Business as a system ----------------------------------------------------------- 26
2 The Perceived Service Quality Model ------------------------------------------------------ 34
3 Service Quality Gap Model ------------------------------------------------------------------ 37
4 Conceptual Framework ----------------------------------------------------------------------- 57
5 Research Framework -------------------------------------------------------------------------- 61
x

CHAPTER 1
INTRODUCTION
BACKGROUND OF THAI TOURISM AND HOSPITALITY INDUSTRY
As one of the major tourist destinations in Asia-Pacific, Thailand enjoys the
growth of its tourism industry and the revenue generated by international tourists mainly
from East Asia, Europe, and the Americas (TAT, 2003). In 2003, the World Tourism
Organization (WTO) ranked Thailand the third top tourism earner in Asia followed by
China and Hong Kong (China) (WTO, n.d.) (See Appendix A). Additionally, Thailand
was ranked Asia’s fourth top-tourism destination in terms of the number of international
tourist arrivals behind China, Hong Kong (China), and Malaysia (WTO, n.d.) (See
Appendix B). Regarding accommodation capacity, the WTO placed Thailand the third
for Asia’s top tourism destination measured by the number of rooms in 2003 (WTO, n.d.)
(See Appendix C). This prominent standing was accomplished by strong support from
the Thai government and by rigorous marketing and promotional plans of the Tourism
Authority of Thailand (TAT), a national tourism organization with a history of more than
40 years. In addition, the Thai tourism industry has been growing along with the Thai
economy.
Despite the incidents and crises that have occurred over the decades, tourism
remains one of the major sectors contributing prosperity to the Thai economy. According
1

to TAT statistics, since the Gulf War in 1991 the number of international tourist arrivals
has been continuously increasing except in 2003, when the number decreased 7.36%.
This decrease was attributed to the Severe Acute Respiratory Syndrome (SARS)
epidemic in Asia and the Iraqi War (TAT, 2004a; TAT, 2004b). Additionally, the revenue
flowing in from inbound tourism has been growing in terms of Thai currency with the
exception of a decreasing rate of 4.39% in 2003. Despite the challenges that the Thai
tourism industry is facing, the TAT aims to generate at least 20 million international
tourist arrivals by the year 2008 (Sritama, 2004).
According to the TAT (n.d.a), in today’s roller-coaster world, Thailand had the
stability, consistency, and long-term growth prospects that hoteliers desired. Furthermore,
accessibility to Thailand has been improving due to routing expansion of both Thai and
other international airlines, deregulation of the aviation industry, linkage of transportation
networks, and the opening of Bangkok’s new international airport – Suvarnabhumi (TAT,
n.d.a). Because of these advancements, Thai tourism has attracted a large amount of both
Thai and foreign capital for investment, making it one of the foremost dynamic industries
in Thailand.
Many international hotel operators and investors see opportunities of high
investment returns not only in Bangkok, the capital city of Thailand, but also in other
tourist destinations, particularly the beach town provinces (TAT, n.d.a: Schneider, n.d.).
Some international hotel brands, including Accor, Sheraton, Hilton, Marriott, Crowne
Plaza, and Le Meridien, are expanding vigorously by constructing new resorts in
Southern Thailand, a paradise of sun, sand, and sea (TAT, n.d.a). Schneider also noted
the presence of global chain hotel companies challenges the operation and management
2

of non-brand-affiliated hotels, raises staff turnover, and increases costs as they are forced
to upgrade to compete with the quality provided by the big players (Schneider, n.d.).
SERVICE QUALITY IN THAI TOURISM AND HOSPITALITY INDUSTRY
Recently, there has been a trend for internationalization of Thai hotels and resorts
(Schneider, n.d.). The increasing number of boutique hotels in major tourist destinations
is an example of the quality trend in Thailand. Not only are the Thai hotels facing the
challenges to upgrade their service quality to compete with the international chain hotels,
but the entire Thai hotel industry also has to compete with other countries. Mr.Vichit Na
Ranong, Chairman of the Tourism Council of Thailand, expressed concerns over the
intense competition among ASEAN countries to recover tourism losses in 2003
(“Economic Review”, 2003). Therefore, service quality is expected to increase Thai
hotel businesses’ capability for either domestic or international competition.
Thailand has implemented several national quality-improvement programs to
motivate Thai hotel and tourism entrepreneurs to recognize and improve the service
quality. The TAT has launched several programs for quality improvements such as the
Thailand Tourism Award, the Green Leaves Award, and the Thailand Hotels Standard.
These quality programs exemplify the efforts to improve the quality of hotels and tourism
businesses in Thailand. The Thailand Hotels Standard, the key focus of this study,
involves all aspects of quality in the hotel sector.
3

THE THAILAND HOTELS STANDARD
According to the data collected by WTO in 2003, Thailand has the third largest
accommodation capacity in Asia with a total of 321,000 guestrooms in hotels and similar
establishments (WTO, n.d.). Not only does the potential of the Thai tourism industry
attract a number of international chain hotels for investment, but also many
small/medium local entrepreneurs entered this industry. Undoubtedly, these locally
owned small/medium hotels have difficulty in competing with the international giants.
The quality of services offered by these hotels is the fundamental issue that can lead to
either failure or success of the businesses.
Prior to the development of a national hotel quality rating program, Thailand was
one of a few major travel destination countries without a standard hotel rating system
(Intarakomalyasut, n.d.). The Tourism Authority of Thailand (TAT), the Thai Hotel
Association (THA), and the Association of Thai Travel Agents (ATTA) collaborated
under the project of “World Class Standard” to establish a quality standard for the hotel
industry, which served as a pilot project to standardize the Thai tourism industry (THA,
TAT, & ATTA, n.d.). The program, which was entitled “Thailand Hotels Standard”, uses
stars as symbols to certify the quality of hotel properties.
The development of a reliable hotel standard was expected to improve both the
efficiency and the effectiveness of hotel operation and management and to grant equal
recognition to both Thai-owned and managed hotels as well as international chain hotels.
The TAT stated the Thailand Hotels Standard allowed tour operators and customers to
recognize hotels with non-renown brand names and trust the ratings, which assisted them
in identifying what levels of standard they should expect from the hotel (TAT, n.d.a).
4

Hence, customers could evaluate their expectations from the service performance of the
hotel they selected. The goals of the Thailand Hotels Standard were expected to be
recognized as the following (THA, TAT, & ATTA, n.d., p. 5):
To raise the overall standards of Thai hotels by benchmarking and
aligning local standards with internationally-accepted standards and
practices;
To promote healthy competition within the Thai tourism industry and
achieve higher quality of service and management;
To encourage the participation of hotels in Bangkok as well as in the four
regions of Thailand;
To inspire international confidence and gain increasing international
acceptance in the services offered and the management of Thai hotels; and
To raise the visibility and awareness of newly certified hotel and resort
properties among tour operators, individual travelers and tourists in
Thailand and abroad.
Additionally, to attain the established goals, six objectives of the Thailand Hotels
Standard were set as guidelines, which included (THA, TAT, & ATTA, n.d., p. 5):
To establish a tangible and reliable hotel standard;
To encourage fair practice and equally protect consumers as well as hotels;
To promote superior service, efficient administration and efficient and
effective utilization of natural resources;
5

To develop a set of standards that accurately reflects the physical
characteristics of a property and offers a clear indicator of its ‘marketing
value;
To raise awareness of the ongoing development of the Thailand Hotels
Standard;
To build a firm foundation and promote the sustainable growth of the Thai
hotel industry.
Hotels’ participation in the Thailand Hotels Standard project is voluntary. A
qualified hotel property must have a valid and legal hotel operation license and have been
in operation in Thailand for more than a year. In addition, the hotel has to accept the
certifications criteria by the Thailand Hotels Standard and pay certification fees. The
major factors that are taken into consideration include physical structure, quality of
service, and maintenance. The hotel is inspected and scored in the three areas covering
the standard of construction and facilities, the standard of maintenance, and the standard
of service. The minimum scores are set for each five star rating as quality levels of the
Thailand Hotels Standard. One star indicates the lowest level of hotel quality and five
stars indicates the highest level of hotel quality.
The committee’s evaluation of each hotel is both subjective and objective. The
committee of the Thailand Hotels Standard consists of representatives from TAT, THA,
ATTA and academic institutions offering hotel management programs (THA, TAT, &
ATTA, n.d.). The Thailand Hotels Standard certification is offered every year. If the
total scores of the three criteria (the standard of construction and facilities, the standard of
maintenance and cleanliness, and the standard of service) of a hotel passes the minimum
6

score requirements, a hotel will be certified with the proposed star rating level of the
Thailand Hotels Standard. If it fails, the hotel will be offered three alternatives including
canceling the application, accepting the results for certifying a lower star level, or making
improvements within 180 days for re-inspection.
The Foundation of Standard and Human Resources Development in Service and
Tourism Industry, a non-profit organization representing the cooperation between the
private and public sector, was founded to administer all the aspects involved in the
implementation of the Thailand Hotels Standard (THA, TAT, & ATTA, n.d.). In March
2004, the foundation officially launched the Thailand Hotels Standard certification
program and awarded the first 84 hotels with 2-5 star ratings after the evaluation of 110
voluntary hotel participants (TAT, n.d.b). It was anticipated that with the adaptation of
internationally accepted star rating models and its systematic administration, the Thailand
Hotels Standard would be an effective instrument to enhance the overall service quality
of the Thai hotel industry.
SIGNIFICANCE OF THE STUDY
As the Thailand Hotels Standard is still at its infancy, little is known about its
effects or relationship with service quality of the hotel industry in Thailand. Identifying
the perceptions of hotel operators toward the Thai hotel rating system may help the
tourism-related organizations develop strategies for hotel establishments to participate in
the hotel rating system and increase service quality. The study’s finding is expected to
reveal the improvement of hotel service quality as a result of implementing the hotel
rating system. The study is also expected to enhance the competitiveness of the Thai
7

hotel industry by facilitating lodging properties moving up to a higher level of service
quality. The service quality movement of the entire hotel industry would provide
assurance of positive travel experience in Thailand. At the property level, the hotel
managers decide whether to apply for the hotel rating or not. The results will be
published in academic and industrial conferences and journals to further discuss the
impacts of the hotel rating system.
OBJECTIVES OF THE STUDY
The purpose of the study is to investigate the relationship of the hotel rating
system and service quality. This research focuses on the Thailand Hotels Standard that
has recently been launched to improve service quality in the Thai hotel industry. Hotel
managers’ perspectives were examined because they had the authority to make a decision
to apply for the hotel standard certification and make initiatives in the hotels leading to a
movement in the industry. Also, they were presumed to understand their customers
through their frontline employees. To achieve the purpose of the study, ten specific
objectives were proposed as follows:
1. To measure the perceived influences of the hotel rating system on the hotel
industry in general as well as hotel properties;
2. To examine the differences of perceived influences of the Thailand Hotels
Standard on the hotel industry as well as hotel properties between the
applicant hotels and the non-applicant hotels;
8

3. To examine the differences of perceived influences of the Thailand Hotels
Standard on the hotel industry as well as hotel properties between the star-
rating certified hotels and the non-star-rating certified hotels;
4. To identify the dimensions of service quality improvement as a result of the
implementation of the Thailand Hotels Standard;
5. To compare the service quality improvement among hotels at different star
rating levels;
6. To compare the service quality improvement between independent hotels and
chain affiliated hotels; and
7. To examine the relationship among service quality improvement and hotel
performance changes.
The following chapter presents a review of previous research on two major areas -
hotel rating systems and service quality. Chapter Three describes the research methods
used in this study. Chapter Four presents findings and discussion of the study. Lastly,
Chapter Five summarizes the content presented in this study and presents
recommendations as the application of the study.
9

CHAPTER 2
LITERATURE REVIEW
HOTEL RATING
Definitions of Hotel Rating System
According to Collins Concise Dictionary (1998, p. 1109), rating is defined as “a
classification according to order or grade and as ranking”. Consequently, hotel rating can
be described as a classification of hotels according to grade and rank. Often, there is
confusion regarding the terminology used in hotel rating. Callan (1989) attempted to
identify the differences between classification and grading. Classification involved
assessing the tangible elements of the service mix and qualitative grading was concerned
with the intangible elements. Subsequently, Callan’s review paper described clear
definitions of terms used by the British hotel classification schemes as following (Callan,
1994, p. 11):
Registration: A listing or ‘register’ of establishments which may or may not require minimum standards. Most countries require conformity with public health, fire and safety legislation, which indicates some minimum requirements.
Classification: A grouping together of different types of serviced accommodation differentiated by criteria of physical facilities. Because ‘hotels’ provide a broad spectrum of facilities, they are often classified into five, six or even seven categories. Other types of serviced accommodation such as guest houses have a more limited range of facilities and may, therefore, have fewer categories; commonly two or three.
10

Grading: Often used as a general term, sometimes to mean ‘classification’ but more widely accepted to mean ‘quality grading’, namely a more subjective assessment of the quality of those facilities and services objectively assessed under ‘classification’.
The scope of the joint study conducted by the World Tourism Organization (WTO)
and the International Hotel and Restaurant Association (IH&RA) was limited only to
hotels and similar establishments. The study excluded other types of accommodations
such as holiday centers, holiday homes, youth hostels, holiday camps, camping,
caravanning sites, and time-shares. For this study, the researcher follows the definition of
hotel classification as defined by the WTO and the IH&RA. However, the term “hotel
rating” is used instead of “hotel classification” or “hotel grading.” The definition,
according to the WTO and the IH&RA (2004), was as follows:
‘The classification of accommodation establishments denotes a system, duly published, in which accommodation establishments of the same type (e.g. hotels, motels, and inns) have been conventionally broken down into classes, categories or grades according to their common physical and service characteristics and established at government, industry or other private levels. (p. 9).
The European Standardization Committee (CEN-the Comité Européen de
Normalisation) established the standard of tourism terminology in which
‘accommodation’ referred to hotels and other types of tourism accommodation (WTO &
IH&RA, 2004). It further clarified the term “accommodation rating: classification
scheme” as “a system providing an assessment of the quality standards and provision of
facility and/or service of tourist accommodation, typically within five categories, often
indicated by one to five symbols” (p. 68).
11
The Characteristics of Hotel Rating Systems
There were two major systems for more than 100 hotel rating systems worldwide
including official and non-official systems (Brook, 1989 & WTO, 1985 cited in Qing and
Liu, 1993). The official hotel-rating systems were established and conducted by a
government agency and obliged to follow the compulsory and regulatory basis. On the
contrary, private organizations (hotel or tourism associations, the national/regional
automobile associations, or private companies) operated non-official hotel-rating systems
normally on a voluntary basis. Some national tourism and hotel associations required
their members evaluated by their rating system and graded with one of the five-levels.
The purpose of the official system was mainly to control the lodging tariff and taxes,
whereas no social obligation was found for the non-official system (WTO & IH&RA,
2004). Callan (1994) specified some hotels tended to oppose the compulsory grading
scheme because they were concerned for bureaucratic interference. In contrast,
customers would expect the protection of guaranteed quality from the official system.
A hotel rating system embraced two standards, including a basic registration
standard and a grading standard. The basic registration standard was the basic
requirement a hotel property had to meet; it was the minimum quality requirement. The
grading standard was the quality grading that compared a hotel to others, and it was the
higher quality standard a hotel can achieve. Callan (1993) compared UK quality grading
systems. His comparisons of each rating system were conducted by analyzing
classification and quality grades assessment, but other minor criteria could not be
compared because they were varied in detail. However, to communicate the quality level
a hotel achieved, a variety of grading symbols were used; for example stars, crowns,
12

diamonds, suns, or letters. The universally recognized symbol was the stars as the
majority of countries with at least a hotel rating system used the stars to represent grades
of their rating systems (Callan, 1993: WTO & IH&RA, 2004).
Callan’s analysis (1995) presented the hotel grading classification in the U.K.
applied two measures. First, hotels and other similar establishments were classified into
types of accommodations. Second, the hotels were subdivided into levels of quality
grading. Like other products, an effective hotel rating system needed to be consistently
fine-tuned. Callan (1992) noted the major reasons for change in a Jersey’s hotel grading
scheme. They included: 1) offering a more understandable grading scheme to both
customers and hoteliers; 2) improper shape of quality-hotel frequency distribution due to
being outdated; 3) useful as marketing tool; and 4) too much reliance on subjective
assessment. Callan (1989) also referred to the report of Horwath and Horwath, which
stated customer needs should be the grading scheme’s priorities and should be placed
above the hotel operator’s needs.
Furthermore, cultural differences seemed to play a major role in developing an
effective hotel classification scheme. Exploring China’s hotel-rating system, Yu (1992)
examined the criteria used in the hotel evaluation of the China National Tourism
Administration (CNTA) and markedly commented it was impossible for a host country to
adopt the entire standardization of hotel operation and management because of cultural
differences and perceptions of the country. Similarly, WTO and IH&RA’s study (2004)
pointed out a national or regional classification scheme recognized the importance of
cultural differences between states that extensively affected services and facilities,
marketing, and purpose of travel. Moreover, they strongly recommended the
13
consolidation of diversity, not uniformity, to achieve sustainable tourism. Furthermore,
Callan (1992) mentioned that individual priorities of consumers resulted in a grading
scheme that was different from others in terms of assessment, but in which the
fundamentals of the scheme remained the same.
The Survey of Existing Hotel Rating Systems
In 2004, a joint study on hotel classification between the World Tourism
Organization (WTO) and the International Hotel and Restaurant Association (IH&RA)
virtually published the survey results of various existing hotel classification throughout
the world. One hundred and eight countries replied to their questionnaires. They
surveyed the hotel classification schemes from both public sector respondents like the
National Tourism Organizations (NTOs) and private sectors respondents like the National
Hotel Associations. The ultimate goal of the study was to develop a single hotel grading
scheme which could be used internationally in order to create benefits for both customers
and tourism service providers. Simply, the joint study attempted to reduce the perplexity
caused to both parties by the huge number of hotel rating systems. A number of tourists
were confused by the hotel ratings as every travel service had one’s own rating system,
and they had to learn the differences between these rating systems and decide which
sources were trustworthy (Daily, 2004).
The joint study reviewed various administrations and the criteria of hotel rating
systems used in different countries. For example, many countries required mandatory
classification of all hotels. Some countries needed only licenses to operate the hotels and
the others demanded no classifications in order to operate. In addition, some countries
14

adopted classification systems from neighboring countries. For instance, Sweden utilized
the Danish hotel rating system. Beyond the national hotel rating systems, many countries
had been trying to form a regional hotel classification as a standard to be referred by
neighboring countries in Scandinavia, Southeast Asia, Middle East and Europe. In the
global perspective, the WTO and the IH&RA had been studying and developing the
universal hotel classification.
The U.S. Hotel Rating Systems
The review of existing hotel classification systems by WTO and the IH&RA
(2004) disclosed more than 100 systems were used in different countries worldwide.
Only a few hotel-rating systems were exemplified here. The American hotel industry
was dynamic and the hotel rating systems were highly developed. However, there was no
official hotel rating system, only non-official systems existed. The three most popular
US hotel rating systems were provided by AAA (Diamond rating), Mobil (Star rating),
and Utell (Official Hotel Guide-OHG). Following are the summaries of the three US
hotel rating systems:
The American Automobile Association (AAA) used diamonds to rate each hotel
property. (WTO & IH&RA, 2004, pp. 74-75).
American Automobile Association (AAA) “Diamond” ratings One Diamond
These establishments typically appeal to the budget-minded traveler. They provide essential, no-frills accommodations. They meet the basic requirements pertaining to comfort, cleanliness and hospitality. Two Diamond
These establishments appeal to the traveler seeking more than the basic accommodations. There are modest enhancements to the overall physical
15
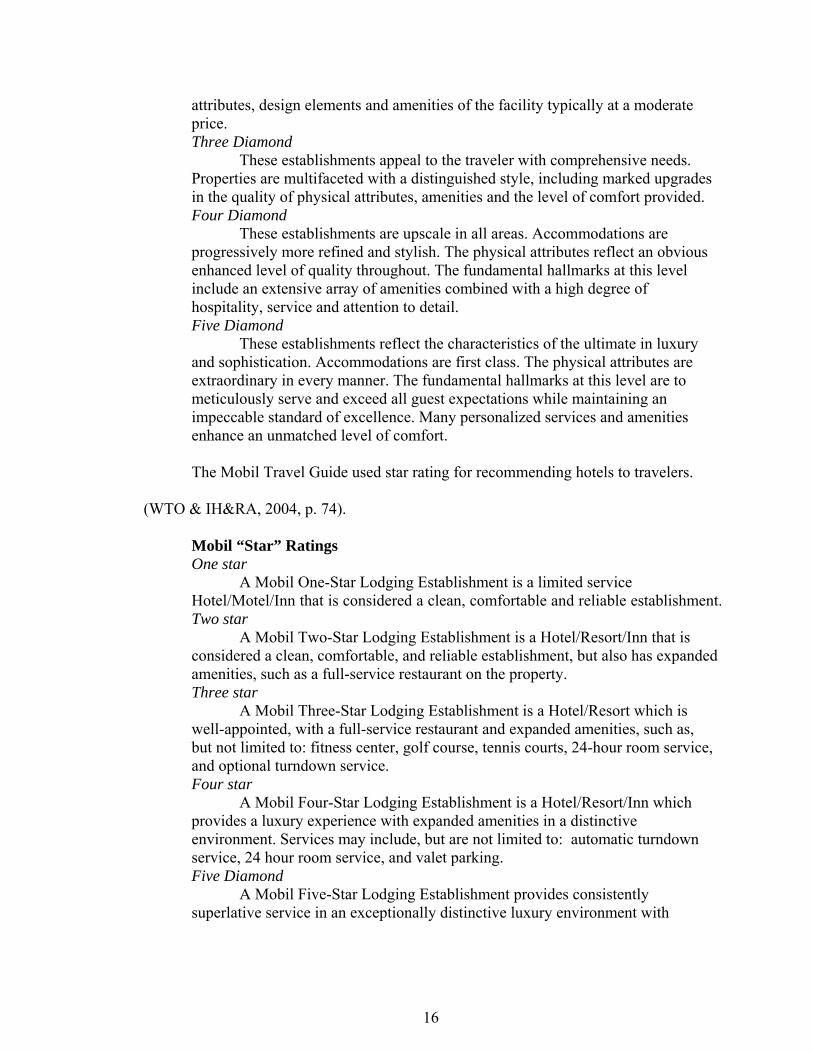
attributes, design elements and amenities of the facility typically at a moderate price. Three Diamond
These establishments appeal to the traveler with comprehensive needs. Properties are multifaceted with a distinguished style, including marked upgrades in the quality of physical attributes, amenities and the level of comfort provided. Four Diamond
These establishments are upscale in all areas. Accommodations are progressively more refined and stylish. The physical attributes reflect an obvious enhanced level of quality throughout. The fundamental hallmarks at this level include an extensive array of amenities combined with a high degree of hospitality, service and attention to detail. Five Diamond
These establishments reflect the characteristics of the ultimate in luxury and sophistication. Accommodations are first class. The physical attributes are extraordinary in every manner. The fundamental hallmarks at this level are to meticulously serve and exceed all guest expectations while maintaining an impeccable standard of excellence. Many personalized services and amenities enhance an unmatched level of comfort. The Mobil Travel Guide used star rating for recommending hotels to travelers.
(WTO & IH&RA, 2004, p. 74).
Mobil “Star” Ratings One star
A Mobil One-Star Lodging Establishment is a limited service Hotel/Motel/Inn that is considered a clean, comfortable and reliable establishment. Two star
A Mobil Two-Star Lodging Establishment is a Hotel/Resort/Inn that is considered a clean, comfortable, and reliable establishment, but also has expanded amenities, such as a full-service restaurant on the property. Three star
A Mobil Three-Star Lodging Establishment is a Hotel/Resort which is well-appointed, with a full-service restaurant and expanded amenities, such as, but not limited to: fitness center, golf course, tennis courts, 24-hour room service, and optional turndown service.
Four star A Mobil Four-Star Lodging Establishment is a Hotel/Resort/Inn which
provides a luxury experience with expanded amenities in a distinctive environment. Services may include, but are not limited to: automatic turndown service, 24 hour room service, and valet parking. Five Diamond A Mobil Five-Star Lodging Establishment provides consistently superlative service in an exceptionally distinctive luxury environment with
16
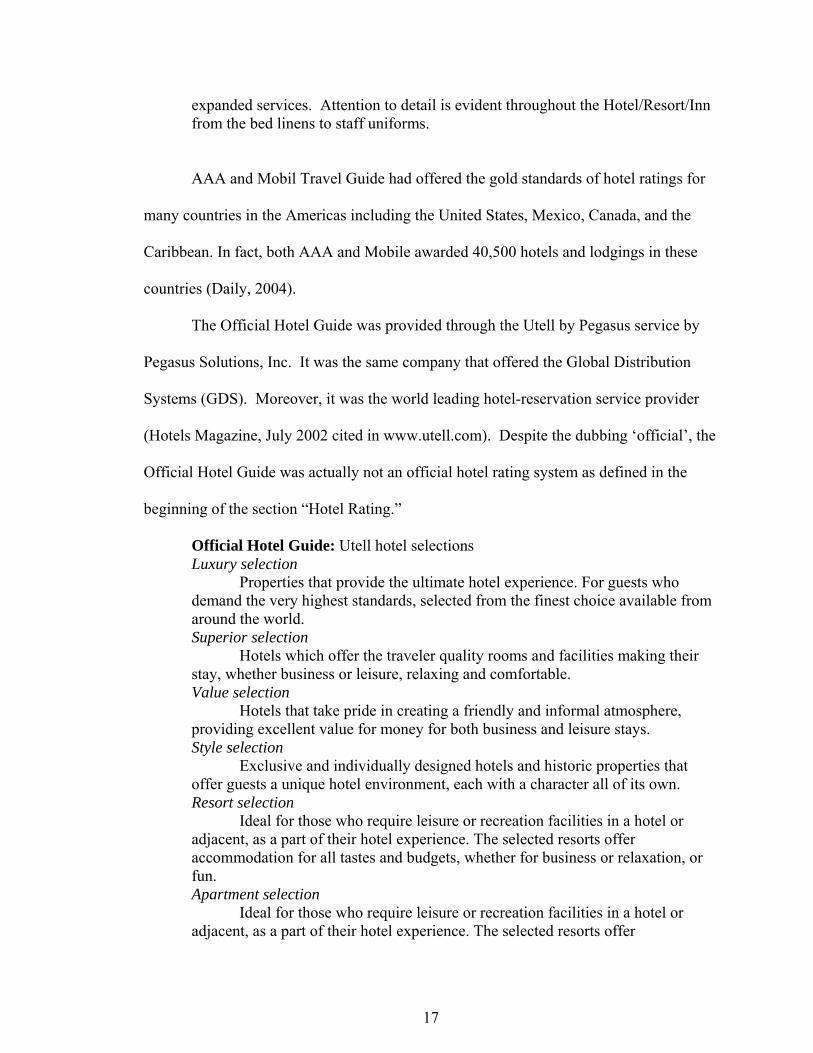
expanded services. Attention to detail is evident throughout the Hotel/Resort/Inn from the bed linens to staff uniforms.
AAA and Mobil Travel Guide had offered the gold standards of hotel ratings for
many countries in the Americas including the United States, Mexico, Canada, and the
Caribbean. In fact, both AAA and Mobile awarded 40,500 hotels and lodgings in these
countries (Daily, 2004).
The Official Hotel Guide was provided through the Utell by Pegasus service by
Pegasus Solutions, Inc. It was the same company that offered the Global Distribution
Systems (GDS). Moreover, it was the world leading hotel-reservation service provider
(Hotels Magazine, July 2002 cited in www.utell.com). Despite the dubbing ‘official’, the
Official Hotel Guide was actually not an official hotel rating system as defined in the
beginning of the section “Hotel Rating.”
Official Hotel Guide: Utell hotel selections Luxury selection Properties that provide the ultimate hotel experience. For guests who demand the very highest standards, selected from the finest choice available from around the world. Superior selection Hotels which offer the traveler quality rooms and facilities making their stay, whether business or leisure, relaxing and comfortable. Value selection Hotels that take pride in creating a friendly and informal atmosphere, providing excellent value for money for both business and leisure stays.Style selection Exclusive and individually designed hotels and historic properties that offer guests a unique hotel environment, each with a character all of its own. Resort selection Ideal for those who require leisure or recreation facilities in a hotel or adjacent, as a part of their hotel experience. The selected resorts offer accommodation for all tastes and budgets, whether for business or relaxation, or fun. Apartment selection Ideal for those who require leisure or recreation facilities in a hotel or adjacent, as a part of their hotel experience. The selected resorts offer
17
accommodation for all tastes and budgets, whether for business or relaxation, or fun. Airport selection A range of hotels conveniently positioned near the major airports of the world. Each with the key attribute of being within a 10km zone of the airport, many offer shuttle services.
Britain’s Hotel Rating Systems
In Britain, there were a number of hotel classification schemes offered by private
organizations and the regional tourist boards. For example, the English Tourist Board
(ETB) awarded crowns for rating hotels in England, whereas the Automobile Association
(AA) and the Royal Automobile Club (RAC) rated tourist accommodation by a star
system with different criteria and judgment (Conway, 2004). As a result, the same
property could have three different levels of ratings from these rating systems. The
variety of these schemes in the same destination confused the consumers. A joint
promotional campaign among the AA, RAC and ETB had recently developed a new
harmonized hotel-classification scheme (Conway, 2004: the British Hospitality
Association (BHA) cited in WTO & IH&RA, 2004). However, Conway stated the three
organizations would continue making their own accommodation guides but the results
were less likely to differ from one another. The following is the description of star-based
system of the new joint hotel rating schemes (BHA cited in WTO & IH&RA, 2004, p.76).
Hotel Classification (Stars) One Star Hotels
Hotels in this classification are likely to be small and independently owned with a family atmosphere. Services may be provided by the owner and family on an informal basis. There may be a limited range of facilities and meals may be fairly simple. Lunch, for example, may not be served. Some bedrooms
18

may not have en-suite bath/shower rooms. Maintenance, cleanliness and comfort should, however, always be of an acceptable standard. Two Star Hotels
In this classification hotels will typically be small to medium sized and offer more extensive facilities than at the one star level. Some business hotels come into the two star classification and guests can expect comfortable, well equipped, overnight accommodation, usually with an en-suite bath/shower room. Reception and other staff will aim for a more professional presentation than at the one star level, and offer a wider range of straightforward services, including food and drink. Three Star Hotels
At this level, hotels are usually of a size to support higher staffing levels, and a significantly greater quality and range of facilities than at the lower star classifications. Reception and the other public rooms will be more spacious and the restaurant will normally also cater for non-residents. All bedrooms will have fully en-suite bath and shower rooms and offer a good standard of comfort and equipment, such as a hair dryer, direct dial telephone, and toiletries in the bathroom. Some room service can be expected, and some provision for business travelers. Four Star Hotels
Expectations at this level include a degree of luxury as well as quality in the furnishings, decor and equipment, in every area of the hotel. Bedrooms will also usually offer more space than at the lower star levels, and well-designed, co-ordinated furnishings and decor. The en-suite bathrooms will have both bath and fixed shower. There will be a high enough ratio of staff to guests to provide services like porterage, 24-hour room service, laundry and dry cleaning. The restaurant will demonstrate a serious approach to its cuisine. Five Star Hotels
Here you should find spacious and luxurious accommodations throughout the hotel, matching the best international standards. Interior design should impress with its quality and attention to detail, comfort and elegance. Furnishings should be immaculate. Services should be formal, well supervised and flawless in attention to guests' needs, without being intrusive. The restaurant will demonstrate a high level of technical skill, producing dishes to the highest international standards. Staff will be knowledgeable, helpful, well versed in all aspects of customer care, combining efficiency with courtesy. Guest House Classification (Diamonds)
The Diamond awards assess guest accommodation at five levels of quality, from one Diamond at the simplest, to 5 Diamonds at the luxury end of the spectrum.
19

China’s Hotel Rating System
According to Yu’s study (1992), China’s rating criteria included six categories: 1)
architecture and level of service, 2) facilities, 3) maintenance, 4) sanitation and hygiene,
5) service quality, and 6) guest satisfaction. The first five criteria were evaluated by the
inspectors of the National Hotel Evaluation Committee (NHEC), whereas the guest
satisfaction scores were obtained from conducting a guest survey by NHEC at all
participating hotels. There were three stages in China’s star rating procedure. First, as an
entry requirement, the managers or owners of hotels had to evaluate and decide the
category of their hotels. Next, the NHEC evaluated each hotel for the entry requirements.
If the minimum requirements were met, then hotels could apply for that star rating. In the
subsequent process, the NHEC inspected and evaluated the hotels in line with the six
criteria mentioned previously. Finally, when the scores derived from these six criteria
were summed up, the NHEC awarded the qualifying hotels one of the five star categories.
Additionally, Yu pointed out the criteria for rating guest satisfaction was unclear
as the NHEC did not provide a specific scoring system required for each star-rating
category. Quin and Liu (1993) indicated other limitations that China’s hotel rating
system had inconsistent scoring requirements, unspecified service requirements, and a
lack of incentives to maintain continuous standards. Instead, it overemphasized physical
facilities and left little space for service quality.
Table 1 presents the comparisons of the Chinese Star Rating System, the AAA
Diamond Rating System, and the Thailand Hotels Standard (star rating system).
According to the assessment of hotel rating in China by Qing and Liu (1993), the hotel
20

rating system in Thailand was examined with their existing rating systems used between
Chinese system and the AAA system.
TABLE 1
SUMMARY OF THREE HOTEL RATING SYSTEMS
Item Chinese Star Rating System
AAA Diamond Rating System
Thailand Hotels Standard
Authority Official, CNTA* Government agency
Non-official, professional association
Non-official, non-profit organization (unity of private and public tourism-related organization)
Participation Mandatory, all tourist lodgings
Voluntary, AAA* members
Voluntary, both member and non-member of THA*
Rating purpose Management, Marketing national standards
Consumers information, Marketing
Consumer protection, Marketing, National standards, Sustainability
Rating method Rating without classification
Classifying before rating
Rating without classification
Scoring Mostly quantitative point system
Qualitative, non-point system
Totally quantitative point system
Inspection Large number of inspectors with short training session
Small number of full-time hotel professionals with experience
Small number of full-time hotel professionals with experience
Guest satisfaction
One of the decisive elements of rating
Informally considered
Non-existence
Service requirement
General, list items, not specific actions
Specific action requirement
General, list items, not specific actions
Source: Adapted from Qing and Liu, (1993)
Note* CNTA – China National Tourism Administration AAA - American Automobile Association THA – Thai Hotel Association
21

The Importance of Hotel Rating Systems
The hotel rating or classification systems offered benefits to various sectors. The
WTO & IH&RA (2004) pointed out the benefits to travel agency, tour operators, hotel
industry, government and consumers. The hotel classification systems facilitated the
travel agents’ tasks of hotel selection for their customers. They also indicated that major
tour operators such as First Choice, Thomson Holidays, Airtours, and Thomas Cook had
their own hotel classifications to assist in the tour operations and their marketing.
In addition, the hotel companies used another form of classification which was
known as “branding” (WTO & IH&RA, 2004). It conveyed both qualitative and
quantitative grading of the hotel properties to their customers. For the country or states’
benefits, the hotel rating or classification system allowed the government to control the
hotel industry with tariff and taxes and met basic requirement of safety and hygiene.
The consumers also benefited from an easy comparison between hotels in various
destinations which compete in a healthy fashion. The customer, nevertheless, did not
perceive the grades of any hotel rating system as a strongly important indicator in the
selection of a hotel (Callan, 1995). Even leisure hotel customers had considered it more
important than other types of customers. They identified the hotel rating as only a
moderately important tool in selecting a hotel. Callan also revealed statistics proving
two-thirds of customers in three to five star (or other symbols) hotels used a rating system
more often than those in one and two star levels. He also commented that whatever the
classification and grading schemes were, they were beneficial to both the customers and
the hotel industry for assistance in improving facilities and service quality at a given price.
22

As a result, it was proposed that hotel rating system was correlated with improving
service quality.
SERVICE QUALITY
Definition of Service
Service had been studied by multi-academic disciplines including operations
management, marketing, human resource management, organizational behavior. From
the economic perspective, Haksever, Render, Russell, and Murdick (2000) defined
service as “economic activity that produce time, place, form, or psychological utilities” (p.
3). They described further that services could save customers’ time (e.g. maid service),
provide convenient outlets (e.g. department stores), provide more usable form of
information (e.g. database service), and provide psychological refreshment (e.g. holiday
service).
From an operational perspective, service was viewed as a process where input
was processed to output. Morris and Johnston as cited in Lovelock (1991) specified three
types of inputs: customers, materials, and information. Lovelock (1991 & 2001)
proposed that services has three components - people processing, possession processing,
and information processing - and later added mental stimulus processing. Table 2
provides examples of these services.
23

TABLE 2
UNDERSTANDING THE NATURE OF THE SERVICE ACT
Who or What is the Direct Recipient of the Service? What is the Nature of the Service Act? People Possessions
Tangible Actions
People processing (service directed at people’s bodies): Passenger transportation Health care Lodging Beauty salons Physical therapy Fitness center Restaurant/bars Barbers Funeral services
Possession processing (services directed at physical possessions): Freight transportation Repair and maintenance Warehousing/storage Office cleaning services Retail distribution Laundry and dry cleaning Refueling Landscaping/gardening Disposal/recycling
Intangible Actions Mental stimulus processing (services directed at people’s minds): Advertising/PR Arts and entertainment Broadcasting/cable Management consulting Education Information services Music concerts Psychotherapy Religion Voice telephone
Information processing (services directed at intangible assets): Accounting Banking Data processing Data transmission Insurance Legal services Programming Research Securities investment Software consulting
Source: Lovelock (2001, p.38)
Service had been commonly viewed as the opposite side of goods along a
continuum. Analyzing the categories of products on a product continuum that was titled
‘a tangibility spectrum’, Shostack (1977) as cited in Reisinger (2001a) classified services
according to the degree of intangibility. Berry (1980) specified from the intangibility
perspective that goods were referred to as an object, a device, or a thing, whereas service
24

was a deed, a performance, or an effort. In practice, it was difficult to completely
separate service from goods. Goods purchase was almost always accompanied by
supporting services. Similarly, service purchase was almost always accompanied by
supporting goods (Haksever et al., 2000). To distinguish the differences between
services and goods, Lovelock (1991) provided seven generic differences between goods
and services in a marketing domain which included nature of the product, greater
involvement of customers in the process, people as part of the product, greater difficulties
in maintaining quality control standards, absence of inventories, relative importance of
the time factor, and the structure of distribution channels. Gronroos (1990) distinguished
services into two dimensions: a technical outcome dimension and a functional outcome
dimension. The technical outcome dimension was the type (what) of service delivered to
consumers. The functional outcome dimension was the process (how) by which service
is delivered. Most of service and service quality literatures examined the later dimension.
Service was also perceived as a system which a service organization must provide.
The service system comprises service operations system, service marketing system, and
service delivery system (Lovelock, 1991). The service system is demonstrated in Figure
1. The operations system embraced resources to create services and run the service
operations. The resources included personnel, facilities, and equipment. First, the
service marketing system incorporated marketing efforts and activities for the service
delivery system. Next, the service delivery system involved place, time, and method to
provide services. Lastly, the service marketing system was included in the service
delivery system.
25

Service A
Service B
Customer A
Customer B
Technical Core
Physical support
Contact personnel
Service Operations System
Service Delivery System
Not visible to customer
Visible to customer
Direct interactions Indirect interactions
FIGURE 1: THE SERVICE BUSINESS AS A SYSTEM
Source: Lovelock, 1991, p.14 adapted from Eric Langeard, John E. G. Bateson, Christopher H. Lovelock, and Pierre Eiglier, Services Marketing: New Insights form Consumers and Managers, Cambridge, Mass./ Marketing Science Institute, 1981.
In addition, services had been distinguished from goods by considering the degree
to which the four unique characteristics of services exist. They were intangibility,
inseparability, heterogeneity, and perishability. A number of researchers documented
these characteristics in their studies (Zeithaml, Parasuraman, & Berry, 1985). Based on
Zeithaml et al (1985), Hoffman and Bateson (1997, pp. 24-35) defined these
characteristics as following:
The intangibility: A distinguishing characteristic of services that makes them unable to be touched or sensed in the same manner as physical goods. Inseparability: A distinguishing characteristic of services that reflects the interconnection among the service provider, the customer involved in receiving the service, and other customers sharing the service experience. Heterogeneity: A distinguishing characteristic of services that reflects the variation in consistency from one service transaction to the next. Perishability: A distinguishing characteristic of services in that they cannot be saved, their unused capacity cannot be reserved, and they cannot be inventoried.
26

Challenges created by these characteristics did not only play significant roles for
developing service strategies of service organizations, but they also made it difficult for
customers to evaluate services and their quality. All of these characteristics are seen in
the hospitality services.
Reisinger (2001a) described hospitality as the provision of accommodation and
catering (food and beverage) services for guests that included both tourists and local
residents. The author also mentioned the quality of hospitality services implying that
guests were to be treated with empathy, kindness, and friendliness, and there was also a
concern for their well-being and satisfaction. In addition, Reisinger (2001b) stated that a
few tourism and hospitality services were either purely tangible or intangible. They were
mixtures of products and services; most had high degrees of intangibility. The customers
could not use all the five senses prior to the purchase. The hospitality services were
produced and consumed simultaneously; therefore, they required the presence of both
hospitality provider and customer. The services varied over times, persons, moods of
both parties. Lastly, it was also impossible to store or save them for future purchase.
Furthermore, Reisinger (2001b) explained the evaluation of services that existed
in three stages: pre-consumption, consumption, and post-consumption. In the pre-
consumption stage, consumers made a choice among alternatives, but they rarely had
cues to evaluate the service attribute before consuming. The causes might be that only a
single brand was offered or the inability to get sufficient pre-purchase information. In the
consumption stage, consumers started comparing the expectation and the experience; this
action continued into the post-consumption stage. Although the service provided to the
27

consumers mostly consisted of a series of actions and interactions, they evaluated the
whole process, rather than evaluated each one separately.
Definition of Quality
In an attempt to cover quality in all sectors, Garvin (1988) brought together the
definitions of quality described by scholars from fields as diverse as philosophy,
economics, marketing, and operations management. He classified the quality definitions
into five categorized perspectives. First, Transcendent perspective viewed quality as an
innate excellence, which could be recognized only through experience. It could not be
defined precisely, and thus it offered little practical guidance. Second, Product-based
perspective viewed quality as precise and measurable quantities. It was highly effective
on an objective nature, but failed in measuring subjective attributes. Third, User-based
perspective considered quality from an individual customer’s perspective which was
highly subjective. Fourth, Manufacturing-based perspective viewed quality from
production process or supply side by setting up a specification and considering product
conformance. However, it recognized consumer’s interest rather than simplifying the
production process. Fifth, Value-based perspective viewed quality as the result of a
balance between service performance and price or “affordable excellence” (p. 46).
Haksever et al. (2000) noted that these categories reflected the application of quality in
business functions.
Schneider and White (2004) commented that the quality based on philosophical
(transcendent) approach was useless for research and practice since it was inexplicable
and unquantifiable. In addition, defining quality from a technical (manufacturing or
28

objective) approach was well-suited to standardized products since it focused on the
objective and the readily measurable. Moreover, the user-based approach was more
attractive in order to define the quality of services because it was more appropriate to the
subjective terms and the characteristics of service. They further suggested that because
most services were supplied in a combination with goods, the technical approach should
measure the what of services whereas the user-based approach was fitted for measuring
the quality of the how of services.
Garvin (1988) also identified eight dimensions of quality as a framework for
analysis. He stated that these dimensions provided the disaggregating concept of quality
for businesses to attain and focus on some harmonizing dimensions because some of
them could be achieved with the expense of the other. The eight dimensions were
described as the followings (pp. 50-59):
Performance refers to the primary operating characteristics of a product or service. Features refer to the secondary characteristics that supplement the product’s basic functioning. Reliability refers to the probability of a product’s malfunctioning or failing within a specified period of time. Conformance refers to the degree to which a product’s design and operating characteristics meet pre-established standards. Durability refers to the amount of use one gets from a product before it physically deteriorates or before it breaks down. Serviceability refers to the speed, courtesy, competence, and ease of repair. Aesthetics refers to how a product looks, feels, sounds, tastes, or smells (most subjective). Perceived Quality refers to indirect measures of quality comparison by using perception of quality i.e. images, advertising, and brand names rather than the reality itself (most subjective).
Quality concept emerged far back in human history. In the eighteenth and
nineteenth centuries, the importance of quality became apparent to the world, starting
with the simple inspection by artisans and skilled craftsmen to more complicated
29

30
statistical quality control and quality assurance in manufacturing companies (Garvin,
1988). The statistical quality control included process control (using simple statistical
techniques) and sampling techniques (checking a limited number of items within an
acceptable range of defects).
Beyond the statistical point of view, quality control was extended to quality
assurance that engaged quantifying the costs of quality, total quality control, reliability
engineering, and zero defects. The costs of quality were controlled based on the premise
that failure costs could be reduced significantly by investing in quality improvement
(Juran, 1951 as cited in Garvin, 1988). Rather than performance by the manufacturing
department only to achieve quality in three main functions – new design control,
incoming material control and product or ship floor control – the concept of total quality
control necessitated the co-operation of multiple departments (Feigenbaum, 1956 as cited
in Garvin, 1988). Reliability engineering was the control of quality that is anchored in
probability theory and statistics with the assurance of acceptable product performance
over time (the Department of Defense, 1950 as cited by Garvin, 1988). Zero defects
introduced by Martin Company as cited in Gavin (1988), awarded incentives to workers
for lowering defects. Then a new approach to quality achievement, a so-called strategic
quality management, was developed to respond to the needs of broader quality scope.
Strategic quality management was the extension of the preceding quality movements. It
was more comprehensive because it incorporated profitability and business strategies that
were associated with competitive needs, customer viewpoint, and continuous quality
improvement. Table 3 summarizes the quality movements as previously mentioned.

TABLE 3
THE FOUR MAJOR QUALITY ERAS
Stage of the Quality Movement
Identifying Characteristics
Inspection Statistical Quality Control Quality Assurance Strategic Quality Management
Primary concern
Detecting a problem to be solved
Control a problem to be solved
Coordinating a problem to be solved, but one that is attacked proactively
Strategic impact a competitive opportunity
Emphasis
Product uniformity
Product uniformity with reduced inspection
The entire production chain, from design to market, and the contribution of all functional groups, especially designers, to preventing quality failures
The market and consumer needs
Methods
Gauging and measurement Statistical tools and techniques
Programs and systems Strategic planning, goal-setting, and mobilizing the organization
Role of quality professionals
Inspection, sorting, counting, and grading
Troubleshooting and the application of statistical methods
Quality measurement, quality planning, and program design
Goal-setting, education and training, consultative work with other departments, and program design
31

Stage of the Quality Movement
Identifying Characteristics
Inspection Statistical Quality Control Quality Assurance Strategic Quality Management
Who has responsibility for quality?
The inspection department The manufacturing and engineering departments
All documents, although top management is only peripherally involved in designing, planning, and executing quality policies
Everyone in the organization, with top management exercising strong leadership
Orientation and approach
“inspects in” quality “controls in” quality “builds in” quality “manages in” quality
Source: Gavin, 1988, p. 37
32

Definition of Service Quality
According to the previous section, this study reviews the service quality from the
user-based approach which focuses on satisfying the customers’ quality need. Scholars
have recognized and discussed service quality during the past few decades. Numerous
service quality literature has studied conceptualization, measurement, implementation,
and management of the service quality. In this research, only the service quality concept
and measurement are examined. The concept of service quality was established after
there had been a growing interest in the quality of goods served. Garvin (1988) was
among the first scholars who examined the quality concepts to cover both goods and
service as described in the preceding section.
Service quality was originally cultivated in the marketing context in which the
customer was the focal point of the movement. As previously mentioned, Garvin (1988)
explained the perceived quality as the subjective perception of quality through indirect
measures of quality comparison. Investigating the service quality development, Gronroos
(1993) stated service quality had been developed based on the confirmation/
disconfirmation concept of service quality he introduced in the “perceived service
quality” model in 1982. The notion of the model explained that the perceived service
quality was the result of comparing the real experience with the expectation of a customer
before consuming the service. The model is illustrated in figure 2. The perceived service
quality is positive when the experience goes beyond the expectation and vice versa when
expectations are not met. Additionally, he asserted customers had subjective views for
the quality of service, thus an individual’s meaning of good quality might be different
from others. The empirical study of Callan (1989) similarly recognized that in general
33

people had diverse perceptions of the service quality definition as a result of their
experiences, thus the service quality was obviously impossible to measure.
Experienced Quality
Image
Expected Quality
Marketing Communication
Image Word-of-mouth Customer needs
Total Perceived Quality
Process/ Functional Quality: How
Outcome/ Technical Quality: What
FIGURE 2: THE PERCEIVED SERVICE QUALITY MODEL Source: Gronroos, 1990, p. 41 as cited in Gronroos, 1993
Based on the perceived service quality concept Parasuraman et al. (1985) applied
premises from other previous studies to form their model of service quality. The ideas
included a consumer had difficulty in evaluating service quality rather than goods quality,
that a perception of service quality was developed from a comparison of consumer
expectation with actual service performance, also quality evaluation involved the
evaluation of both the process and outcome of service delivery (Gronroos, 1982;
Lehtinen and Lehtinen, 1982; Lewis and Boom, 1983; Sasser, Olsen, and Wyckoff, 1978
as cited in Parasuraman et al., 1985).
34

Consequently, the conceptual model study of Parasuraman et al. (1985) presented
10 original determinants which included reliability, responsiveness, competence, access,
courtesy, communication, credibility, security, understanding/knowing the customer, and
tangibles. In their succeeding study, using the SERVQUAL measured some of these
determinants were combined and only five dimensions remained (Parasuraman et al.,
1988). The five dimensions consisted of reliability, responsiveness, assurance, empathy,
and tangibles. The definitions of these five dimensions are as follows (Parasuraman et al.,
1988, p. 23):
Reliability is defined as the ability to perform the promised service dependably and accurately.
Responsiveness is defined as the willingness to help customers and provide prompt service.
Assurance is defined as the knowledge and courtesy of employees and their ability to inspire trust and confidence.
Empathy is defined as caring, individualized attention the firm provides its customers.
Tangibles concerns physical facilities, equipment, and appearance of personnel.
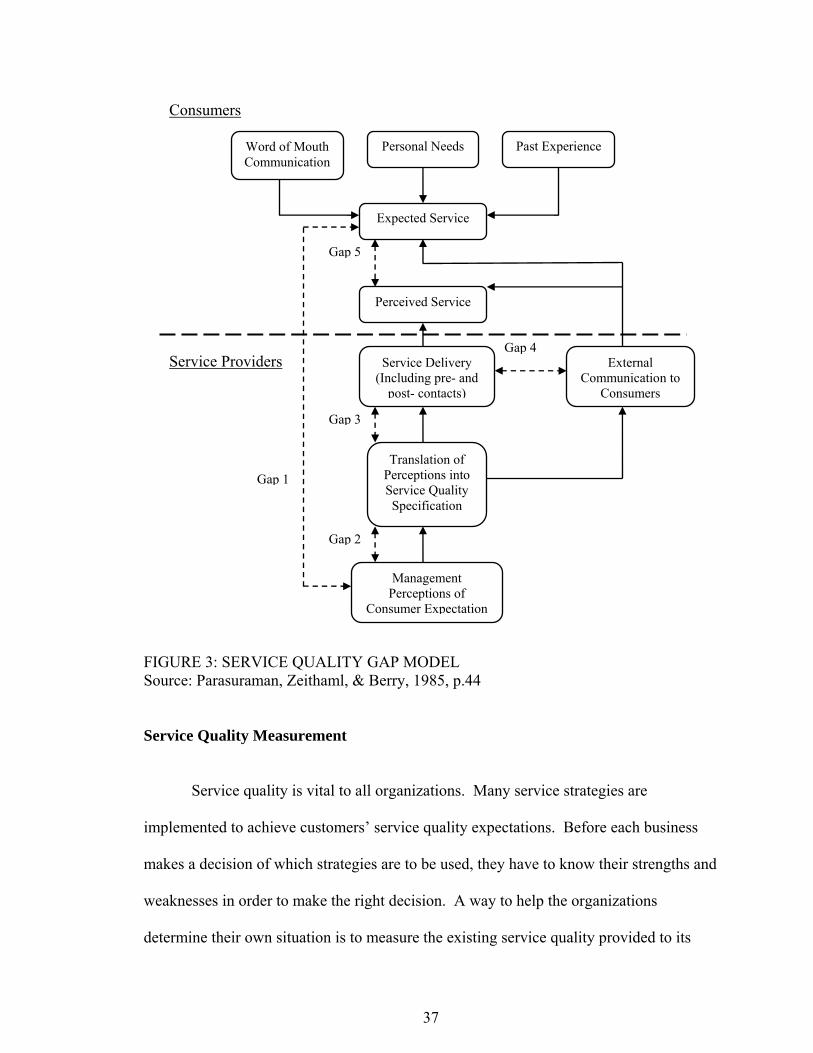
In the exploratory research of Parasuraman et al. (1985), a conceptual gap model
of service quality was developed based on the difference between expectation and
experience or the so-called “perceived service quality.” It was derived by comparing
customer expectation and perceived service performance. The fundamental notion was
that the service quality was perceived as an overall evaluation or attitude toward an entity.
The gap model explained the existence of five service quality gaps due to differences
between service quality sources. The five gaps included: (Gap 1) Customer expectations
versus management perceptions of customer expectations; (Gap 2) Translation of
perceptions into service quality specifications versus management perceptions of
35

customer expectations; (Gap 3) Service delivery versus service quality specifications;
(Gap 4) External communications to customers versus service delivery; and (Gap 5)
Customer service quality expectations versus customer service quality perceptions
(Figure 3). The perceived service quality (Gap 5) is the function of Gap1 through Gap 4.
Haksever, Render, Russell, and Murdick (2000) cited some risks of the gap model
application found in several studies. They opined that customers always had expectations
of high quality and those services that involved credence characteristics caused difficulty
in service quality evaluation.
The gap model was intentionally developed to apply to a broad range of service
industries. Scholars preferred specific measurements to evaluate the service quality of a
certain industry. Also, Brown and Swartz (1989) recommended using a simpler model
for professional services. However, the gap model was the basis for the development of
many service quality measurements. More details of research studies on service quality
measurements applied in various services industries are mentioned in the following
section.
36
Word of Mouth Communication
Personal Needs Past Experience
Expected Service
Service Delivery (Including pre- and
post- contacts)
External Communication to
Consumers
Consumers
Service Providers
Management Perceptions of
Consumer Expectation
Gap 5
Gap 3
Gap 2
Gap 1
Gap 4
Translation of Perceptions into Service Quality Specification
Perceived Service
FIGURE 3: SERVICE QUALITY GAP MODEL Source: Parasuraman, Zeithaml, & Berry, 1985, p.44
Service Quality Measurement
Service quality is vital to all organizations. Many service strategies are
implemented to achieve customers’ service quality expectations. Before each business
makes a decision of which strategies are to be used, they have to know their strengths and
weaknesses in order to make the right decision. A way to help the organizations
determine their own situation is to measure the existing service quality provided to its
37

customers. Several methods are used including customer satisfaction measurement,
measurement by the critical incident technique, performance measurement, and attribute-
based measurement. As the study focused on the attribute-based measurement, therefore
expectation-perception approach (SERVQUAL) and only-performance approach
(SERVPERF) were described. Soutar (2001) specified the most commonly used
measurement of service quality was the SERVQUAL.
The quantitative multi-attribute measurement was developed in response to the
global quality-perception definition of service quality. The multi-attribute measurement
is another alternative that measures individual quality attributes of the service quality
rather than measuring only overall perception of the service offerings or measuring the
indirect service quality through customer satisfaction. The measurement starts with
establishing a list of related quality attributes and then is assessed by the service
provider’s respondents. Stauss (1993) reported that multi-attribute measurement in a
periodical monitoring program provided greater contributions to the management of
service organizations. The most well-known and contributing-to-service industries
attribute-based measurement of service quality is the SERVQUAL instrument. More
details are provided in the following section.
Stauss (1993) pointed out three limitations of using the attribute-based
measurement of service quality. First, it was possible that the attributes in the
questionnaire represented subjective point of view. Second, there was likeliness that
some customer quality perception might be missed. Third, the questionnaire did not
designate specific behaviors opposing to the episodic nature of service.
38

Schneider and White (2004) suggested the perception-expectation measurement
of service quality provided practical and research benefits. By using the perception-
expectation measure, the practitioners knew which dimensions needed to be improved.
For the research benefit, the perception-expectation measure offered opportunities for the
researchers to track the service quality.
- The SERVQUAL Measurement
Although the measurement of service quality was hard to pin down due to the
service characteristics involving intangibility, perishability, inseparability, and
heterogeneity (Lovelock, 1981: Gronroos, 1990: Zeithaml and Bitner, 1996), researchers
had continuously investigated and contributed to this area. Among others, Parasuraman,
Zeithaml, and Berry have been widely recognized for their service quality battery. Their
significant contribution was the development of a service quality measurement, called
“SERVQUAL”, based on the original conceptual gap model of service quality
(Parasuraman et al., 1985; Parasuraman et al., 1988: Parasuraman, et al, 1991). The
SERVQUAL was seen as a generic service-quality measurement tool for services
industries (Lovelock, 2001). Each containing 22 items in two parts, the SERVQUAL
was a questionnaire that examined customers’ perceived service quality by measuring
customer expectation in the first portion, and their perceived service performance in the
second portion. The last section of point allocation weighed the five proposed attributes.
Customer expectation and perception were measured on a 7-point scale ranging from
1=Strongly Disagree to 7=Strongly Agree. The SERVQUAL instrument had been
39

primarily developed to measure service quality in general; therefore, the developers
recommended minor changes for a specific organization or industry.
The SERVQUAL was criticized for its validity, predictive power, and length.
The validity of some dimensions was doubted but the original developers argued their
dimensions were conceptually distinguished, but somewhat interrelated. The empirical
research by Carmen (1990) commented on the validity and applicability of the
SERVQUAL instrument. Its dimensions were criticized for not being generic enough
that they could be used without adding new items or factors which were considered
potentially important to the quality of given service firms. The empirical findings of
Cronin and Taylor (1992) found the inconsistency of item scales defining service quality
in different industries. In fact, Parasuraman and colleagues had recognized this limitation
and suggested other researchers to consider minor modifications of their instrument to a
particular service industry.
Additionally, service organizations with multiple service functions were
recommended to use the instrument separately to evaluate the service quality of each
function (Carmen, 1990). Concerns over handling the expectations were also noted
because the expectation responses were not practically effective. The method of asking
respondents was questionable. Specifically, a problem might occur from some
respondents who might be unable to establish the expectation due to a new experience or
no communication with other sources.
The extension of arguments over the SERVQUAL provided more insights into the
evaluation of service quality. Cronin and Taylor (1992 & 1994) further argued that the
SERVQUAL was an inappropriate instrument due to its inadequate conceptualization and
40

operationalization of service quality. Likewise, Teas (1993 & 1994) pointed out
conceptual and operational flaws of the SERVQUAL, particularly its validity.
Parasuraman et al. (1994) argued that the concerns of Cronin and Taylor, and Teas over
the validity and other suspected deficiencies of the SERVQUAL were not warranted.
Despite these debates, more studies were conducted and made the measure more well-
established.
Hoffman and Bateson (1997) mentioned the critique about the predictive power of
the SERVQUAL (measuring both expectation and perception): that its ability to predict
customer purchase intention was less than the modified instrument that measured only the
perception of service performance. Service quality required customer satisfaction as a
mediating variable that affected purchase intention. Cronin & Taylor (1992, p.65) stated,
“service quality is an antecedent of consumer satisfaction and that consumer satisfaction
exerts a stronger influence on purchase intentions than does service quality.” They
suggested for managerial purpose the customer satisfaction program should be more
emphasized than strategies that focused exclusively on service quality.
Because of the length of the questionnaire, the SERVQUAL made service
managers reluctant to adopt it for their firms. Because of the 44-item instrument formed
by two parallel parts creating unnecessary repetition, Cronin (1992: 1994) and Brady,
Cronin, and Brand (2002) preferred the use of only perception of service performance to
measure service quality. However, Parasuraman et al. (1994) argued that measuring both
sides could provide more valuable diagnostic tools for management to discover which
dimensions should be improved by considering the gap scores.
41

Despite the critiques, the SERVQUAL has been widely applied in various service
industries. The review research on this issue by Buttle (1996) summarized the discussions
and application of the SERVQUAL in a number of industries as follows (p. 8).
Published studies include tire retailing (Carman, 1990) dental services (Carman, 1990), hotels (Saleh and Ryan, 1992) travel and tourism (Fick and Ritchie, 1991), car servicing (Bouman and van der Wiele, 1992), business schools (Rigotti and Pitt, 1992), higher education (Ford et al., 1993; McElwee and Redman, 1993), hospitality ( Johns, 1993), business-to-business channel partners (Kong and Mayo, 1993), accounting firms (Freeman and Dart, 1993), architectural services (Baker and Lamb, 1993), recreational services (Taylor et al., 1993), hospitals (Babakus and Mangold, 1992; Mangold and Babakus, 1991; Reidenbach and Sandifer-Smallwood, 1990; Soliman, 1992; Vandamme and Leunis, 1993; Walbridge and Delene, 1993), airline catering (Babakus et al., 1993a), banking (Kwon and Lee, 1994; Wong and Perry, 1991) apparel retailing (Gagliano and Hathcote, 1994) and local government (Scott and Shieff, 1993). There have also been many unpublished SERVQUAL studies. In the last two years, the author has been associated with a number of sectoral and corporate SERVQUAL studies: computer services, construction, mental health services, hospitality, recreational services, ophthalmological services, and retail services. In addition, a number of organizations, such as the Midland and Abbey National banks have adopted it.
- The SERVPERF Measurement (Performance-based measure)
Although many studies supported the SERVQUAL, the use of gap scores was
opposed. The empirical research of Cronin and Taylor (1992) suggested measuring
service quality only perceptions of the service experience. For more consistent results of
the analysis of a structural model, they recommended using “SERVPERF” -a modified
SERVQUAL instrument to measure service quality. Instead of measuring both customer
expectations and perceptions as in the SERVQUAL, the SERVPERF was operationalized
by only one part of the perceived performance on the differently labeled 7-point scale. It
did not assess the gap scores between expectation and perception as the expectation does
not exist in the SERVPERF. Therefore, by excluding the measurement of customer
42

expectation, a total of only 22 items remained in the new measure. Cronin and Taylor
concluded that the SERVPERF was a superior service quality measurement in
comparison to the SERVQUAL. In addition, the results demonstrated that the new
measure had more predictive power on the overall service quality judgment than the
original instrument.
In response to Cronin and Taylor (1992), the SERVQUAL developers insisted on
the superiority of their measurement and criticized the use of the SERVPERF for
practical issues. The claim made by Cronin and Taylor about the practitioners preferring
simpler measurement of overall satisfaction/perceived quality through solely the
performance of the business was countered by the contention that a widespread
preference did not necessarily support their claim of superiority (Parasuraman et al.,
1994). They also stressed the practical values of the SERVQUAL for providing rich
information and as a diagnostic tool to isolate the weak points of service quality.
Moreover, they asserted that superior diagnostic value made up for the loss in predictive
power.
Cronin and Taylor (1994) defended that the SERVPERF also provided practical
values to managers. They alleged that the performance-based measure of service quality
could offer a longitudinal index of the service quality perceptions, relative to time and
customer subgroups. Their final thoughts did not commit them to remain supportive to
the SERVQUAL, yet remained confident of their SERVPERF. However, both measures
were found to have insignificant differences in their performance of prediction in the
study conducted by Quester and Romaniuk (1997) and Angur, Nataraajan, and Jahera
(1999).
43

Service Quality in Hospitality Industry
Literature involving service quality in the hospitality industry can be categorized
into three major groups: human resource related, strategy and management related, and
service quality measurement issues. Some examples of the service quality articles related
to the human resource management are illustrated as follows. Lewis (1989) and Cannon
(2002) studied the implementation of internal service as the essence of high-service
quality improvement in the hospitality industry. The study of team building among hotel
employees was considered to improve customer relations and address operational
problems, which resulted in service quality improvement (Berger & Vanger, 1986).
Barbee and Bott (1991) investigated hospitality management’s employee treatment to
improve service quality delivered by their employees. Employee empowerment was also
a vital issue with regard to service quality in hospitality industry. Lashley (1995)
examined the employee empowerment in hospitality operations to improve the
performance of front-line staff through empowerment initiatives shaped by managerial
motives and perceptions. Due to the association with the service quality delivery and
management, interpersonal work conflict stress and response were explored by Ross
(1995). His subsequent research investigated potential employees’ problem solving
styles to predict their responses (Ross, 1996). Similarly, Garavan (1997) studied
interpersonal skills training for improving quality service interactions. A number of
researchers examined various aspects of the relationship between performance and
service quality in hospitality industry (Cheung & Law, 1998: Worsfold, 1999: Southern,
1999: Haynes & Fryer, 2000: Maxwell & Lyle, 2002).
44

For the second group, a variety of subtopics related to the service organization’s
strategy and management were explored. Research concerning organizational culture to
enhance hospitality organizations includes Davidson (2003) and Luk (1997). Yasin &
Zimmerer (1995) and Kozak & Rimmington (1998) studied benchmarking for achieving
hospitality service quality. Maxwell, McDougall, and Blair (2000) discussed the service
quality opportunity that was derived from managing diversity in hospitality organizations.
The research associated with the study of total quality management in hospitality areas
includes the studies of Randall and Senior (1994), and O’Neill, Watson, and McKenna
(1994). Another subgroup involving developments in the service strategy are Bowen
(1997), Denburg and Kleiner (1993), and Enz and Siguaw (2000). These research studies
are only a few among many.
The last group of service quality literature involves the measurement of service
quality. Many researchers in this domain applied the SERVQUAL or modified
instrument to identify the perception of service quality in the hospitality industry
(Douglas, Connor, 2003: Juwaheer & Ross, 2003: Antony, Antony, & Ghosh, 2004:
Ndhlovu & Senguder, 2002: Chen, Ekinci, Riley, Yoon, & Tjelflaat, 2001: Tsang & Qu,
2000: Ingram & Daskalakis, 1999: Mei, Dean, & White, 1999: Gabbie & O’Neill, 1996:
Webster & Hung, 1994: Saleh & Ryan, 1991). Another group concerns the constructs of
service quality measurement combined with those using other techniques. This group
includes Getty & Getty (2003), Olorunniwo, Hsu, & Udo (2003), Ekinci & Riley (1999),
Stauss & Weinlich (1997), Randall & Senior (1992), and Wisner & Corney (1997).
Service quality is extremely important to today’s businesses, particularly those in
the hospitality industry. The industry simply cannot survive without delivering satisfied
45

quality of their services. A survey of Canadian hospitality found that service quality was
the most popular subject for education and training programs (Shaw & Patterson, 1995).
Knutson (1988) and Haksever, Render, Russell, and Murdick (2000) rationalized the
essentials of service quality including higher customer loyalty, higher market share,
higher returns to investors, loyal employees, lower costs, and lesser vulnerability to price
competition. Based on academic literatures, Wuest (2001) reported similar impacts of
service quality in tourism, hospitality, and leisure businesses which were improving guest
convenience; enhancing service provider’s image; ensuring customer security; generating
traffic linking to profits, saving costs, and higher market share; and establishing a
competitive edge, and customer demand. They were specifically explained in the
following statements:
“Services such as accessible rest rooms, refreshment vending, shuttle service, and comfortable seating add to guest convenience, enjoyment, and satisfaction and indirectly encourage guests to extend their stay … Full service hotels provide almost every imaginable service to their guests … Protective services such as adequate lighting, security staff, emergency medical facilities, guest room locks, sprinklers, and clearly marked exits instill [safety] confidence… Satisfied guests will be more likely to extend their stay, return to the destination, and recommend the property to other potential guests … With creative ideas and a strong understanding of the needs and desires of their guest hospitality service providers are developing innovative, extensive service strategies … By providing specific services [such as cable television, newspaper delivery, coffee, room service, fitness facilities, and laundry/dry cleaning], businesses can generate demand among certain target markets …”. (pp. 56-57).
Denburg and Hleiner (1993) emphasized the importance of a company’s provision
of excellence service quality. They reported, “Service excellence is the best way for a
company to sustain a competitive advantage in today’s competitive global market”. They
mentioned that technology made companies’ products similar and that excellent quality
of their service could help differentiate them in their market. To achieve such excellent
46

service quality, a company needed to understand their customer’s expectations. Then,
they could design and develop its service improvement program. The program had to
include the issues of customer segmentation, service culture, listening to customers,
recruitment and training of service personnel, empowerment to their people, and
appraisal system.
Small hotels also recognized the service quality. However, they tended to use
basic and simple strategies to control the quality of their services. According to Callan
(1989), almost one third of small country-based UK hotels inspected their quality of
services by establishing particular service standards. A few hotels (15%) used
anonymous transactions to inspect their service quality. From those who monitored their
service quality, half of them informed their staff about the monitoring transaction and
almost all were reported to discuss the results with the staff. The communication
between the hotel owner/management and the staff demonstrates that the hotel operators
understand the need for employee involvement in delivering service quality.
Additionally, if the hotel companies improved interpersonal communication, they could
achieve better service standards, increase profits and repeat businesses through better
service and high customer satisfaction, greater employee pride and sense of ownership,
and lower staff turnover (Creelman, 1992).
Service quality in hospitality has been studied from different approaches. The
total quality management (TQM) and the gap analysis model are two examples. The gap
analysis approach is the foundation for a number of research studies regarding service
quality in hospitality. The most popular product from this approach is the SERVQUAL
instrument, as previously discussed. Many researchers in the hospitality field have
47
contributed to knowledge development from this approach (Saleh & Ryan, 1991:
Knutson, Stevens, Wullaert, Patton, and Yokoyama, 1991: Mei, Dean, & White, 1999:
Getty & Getty, 2003: Ekinci & Riley, 1999). Another approach that is based on TQM
found in Randall & Senior (1992).
Based on TQM, the study of Randall and Senior (1992) employed the Perceptual
Blueprinting technique to examine quality standard achievement of hospitality services.
The technique was used to identify the failing points in the service delivery system as
perceived by both the customers and the employees. The study revealed that there was
little employee consultation in designing service quality, although the employee is a
critical part of TQM. In addition, Nick (1993) summarized that a consensus on total
commitment by management, employee ownership and empowerment, a strong sense of
mission, communications, training and customer care were necessary for quality
management in the hospitality industry.
Getty and Thompson (1994) tested the relationship between quality, satisfaction,
and recommending behavior of customers in making lodging decisions. There were three
conclusions to their study. First, the results showed that the dimensions of service quality
have a stronger relationship with the overall perceptions of quality than the satisfaction
does. Second, opposing Parasuraman et al. (1988) they discovered that reliability failed
to be the most important dimension of service quality. Their contradiction was justified
because of the addition of more generic items and inadequate exposure of customers to
the services provided by a specific property. Third, there was no significant direct effect
on satisfaction based on the perceptions of overall quality as previously assuming
reciprocal effect between these two variables.
48

For the attempts of the hospitality industry to attain service quality as sustainable
competitive advantage, O’Neill (2001) affirmed that hospitality organizations were
actively receptive to service quality initiatives, such as the British Standards Institute, the
European Quality Award, the Malcolm Baldrige National Quality Award, and the
Edwards Deming prize. In addition, the hospitality organizations paid close attention to
raising the service quality through investment in human resources development.
Furthermore, a suggestion was made for hospitality professionals to incorporate the
measurement of service quality in their quality improvement program in order to
understand customers’ perceptions of actual service delivered and to stay ahead of the
customers by anticipating their needs. Enz and Siguaw (2000) examined the best
practices in service quality among the US hospitality industry. Only a small number of
hotel operations focused specifically on service excellence, which they did extremely
well for one or more service issues; creating a service culture; building an empowered
service-delivery system; facilitating a customer listening orientation; and developing
responsive service guarantees.
Service Quality Measurement in Hospitality Industry
In the field of hospitality, the measurement of service quality was derived from
the concept and studies of service quality experts. A number of studies applied or
modified the SERVQUAL instrument to measure service quality in the hospitality
industry. Several specific instruments were developed based on the SERVQUAL. Lee
and Hing (1995) supported the SERVQUAL application in measuring service quality
because it was relatively simple and inexpensive; provided benefits to entrepreneurs for
49

developing better tailored marketing; and was comparable in tracking the service quality
of different firms in the same business sector.
The study of Saleh and Ryan (1991) attempted to apply the SERVQUAL model
within the hospitality industry. Initially, assuming the same five dimensions of the
developers, the result of their study however showed a somewhat different construct from
the original model of the SERVQUAL. The factor analysis of the study combined
tangibles, reliability, responsiveness, and assurance dimensions of the original model into
“conviviality”, the first factor of Saleh and Ryan’s study, which explained roughly 63%
and the remaining four factors (tangibles, reassurance, avoid sarcasm, and empathy)
accounted for another 16%. They justified that different constructs might occur when
using a 5-point scale instead of a 7-point scale as in the original research, and the
invalidity of questions concerning tangibles.
In the same year, “LODGSERV”, a modified SERVQUAL instrument, was
developed to measure hotel guests’ expectations of service quality and experience by
using a 26-item index. It resulted in the same five dimensions (Knutson, Stevens,
Wulaert, Patton, and Yokoyama, 1991). Later, Stevens, Knutson, and Patton (1995)
developed another version of SERVQUAL in the restaurant setting called “DINESERV”.
It was a tool for measuring service quality in restaurants. In the more specific goal of
assessing the service quality, Lee and Hing (1995) attempted to assess the application of
the SERVQUAL in the fine-dining restaurant sector. In 1999, another extension of the
SERVQUAL scale was introduced in the hospitality industry, called “HOLSERV” (Mei,
Dean, & White, 1999). In the HOLSERV study, a 27-item scale with a separate overall
service quality was administered. This led to the extraction of three dimensions including
50

51
employee (behaviour and appearance), tangibles, and reliability. Ekinci and Riley (1999)
proposed the application of the Q-sort technique in the context of service quality
evaluation in hotels to validate the dimensions of the established models of service
quality. Using the same approach as the SERVQUAL, a more recent study presented the
development of a reliable and valid quantitative quality measuring tool that allowed hotel
operators to measure their customers’ perception of service performance. It was named
“Lodging Quality Index” (LQI). The LQI study found tangibility, reliability (includes
original reliability and credibility dimension), responsiveness, confidence (includes
original competence, courtesy, security, and access dimensions), and communication
(includes original communications and understanding dimensions). Table 4 provides
short descriptions of the service quality instruments in the hospitality area (Getty & Getty,
2003).

TABLE 4
COMPARISON OF SERVICE QUALITY INSTRUMENTS IN HOSPITALITY INDUSTRY
SERVQUAL (1991) Saleh & Ryan (1991) LODGSERV (1991) HOLSERV (1999) LQI (2003) Data Collection
Customers of a telephone co., two insurance cos., and two banks in USA
Guests at a downtown 400- room four-star hotel in Canada
Adults who had stayed in a hotel/motel at least 3 nights during the previous year
Guests of five hotels in Australia, ranking three to five star
Frequent-traveler business owners who were members of their local Chamber of Commerce in 12 US cities
Sample size 290-487 in 5 companies
200 guests and 17 management staff
201 persons
155 guests 222 -229 respondents
Response rate
17-25% 85% Not available 15.5 % 18.5 - 19.1%
Items 22 items modified from the original SERVQUAL (1988)
33 items modified from Martin (1996), which measured service quality in restaurant context (originally based on the SERVQUAL)
26 items modified from the SERVQUAL by Parasuraman et al. (1986) The study focused on only the expectation side.
27 items modified from the SERVQUAL (1991)
26 items modified from the SERVQUAL (1988)
Questionnaire Format
2 parts: Perception and Expectation, and a part of point-allocation importance
2 parts: Perception and Expectation
1 part: Expectation
1 column customized format for comparison between Perception and Expectation, and a separate part of overall service quality
1 part: Perceived performance
52

SERVQUAL (1991) Saleh & Ryan (1991) LODGSERV (1991) HOLSERV (1999) LQI (2003) Response scale
7-point scale for both parts and a constant-sum comparative-ratings scale (100 points) for measuring the importance
5-point scale 7-point scale 7-point scale for the comparison and 10-point scale for the overall measurement
Not specified in the scale development process. No specific point scale is suggested for its application
Questionnaire administration
Mailing survey
On-site survey Telephone survey In-site survey Mailing survey
Data analysis procedure for assessing factor structure
Principal-axis factor analysis followed by oblique rotation
Factor analysis Confirmatory factor analysis
Factor analysis followed by varimax rotation
Principal components extraction
Findings: -Reliability coefficients (Cronbach’s alphas)
0.80 to 0.93
0.74 to 0.77
0.92
0.97
High
-Final number of dimensions
5 dimensions: Tangibles, Reliability, Assurance, Responsiveness, Assurance, and Empathy
5 dimensions: Conviviality, Tangibles, Reassurance, Avoid Sarcasm, and Empathy
5 dimensions: Reliability, Assurance, Responsiveness, Tangibles, and Empathy
3 dimensions: Employee, Tangibles, and Reliability
5 dimensions: Tangibility Reliability, Responsiveness, Confidence, and Communication
53

SERVQUAL (1991) Saleh & Ryan (1991) LODGSERV (1991) HOLSERV (1999) LQI (2003) -Explained variance
57% to 71%
78.57% Not available 64.74% Not available
Application
Measuring service quality based on the comparison of customers’ perception and expectation for service business in general
Measuring only customers’ expectations in hotel industry
Multiple regression analysis showing Employee as the best predictor, followed by Tangibles and Reliability
A new instrument to measure service quality in lodging industry, not limited by the SERVQUAL dimensions
Source: Adapted from Parasuraman et al., 1991
54

HOTEL RATING SYSTEMS, SERVICE QUALITY, AND HOTEL PERFORMANCE
As defined by various organizations, the term ‘hotel rating’ can be summarized as
the classification of lodging establishments according to both qualitative and quantitative
attributes. Research by the WTO and the IH&RA (2004) stated that the hotel rating
systems were developed with the intention of protecting consumers. Later, the focus
shifted to consumer information. Currently, competitive marketing pushes local and
international hotels to seek standardization and tools to guarantee their service quality.
One of the answers to the hotels’ need is a reliable hotel rating system, which proves,
ranks, and certifies the hotels’ quality and facilities at a given level.
According to the WTO and the IH&RA (2004), more than 100 hotel rating
systems worldwide are reported, which confuses customers’ decision on reliability of
ranking. In addition, although tour operation companies and travel agencies had their
own hotel rating systems for facilitating their selection of accommodation choice for their
customers (WTO & IH&RA, 2004), by having their own rating system in hotel booking
websites negated the hotel standard (Grossman, 2004). Countries with more than one
hotel rating system confused customers in making a choice, particularly when the same
hotel was assigned different rating levels (Daily, 2004). There was, however, an
attempt to evaluate hotel rating systems offered in the same country (UK). The attempt
was to identify which rating system represented the most accurate recognition of service
quality. However, this did not succeed since a range of minor details varied across rating
systems resulting in too wide spread to compare (Callan, 1989). Therefore, the
comparisons could not be made.
55
Additional research by Fernandez and Bedia (2004) studied whether a hotel rating
system in Spain was a good indicator of hotel quality. Their findings showed that based
on values of expectations, perceptions and differences of perceptions and expectation, the
ranking of the hotel groups did not correspond to the ranking of star rating category. In
addition, they found that customers from highest category hotels were more demanding
resulting in negative differences between perceptions and expectations.
Regarding the relationship with hotel performance, hotel rating systems were
perceived to be vital to the hotel industry and individual property in terms of marketing in
comparison to other aspects. In a survey study of small country hotels and hotels awards
scheme were a measurement of service quality, Callan (1989) discovered that hotel
operators valued the classification awards and grading as promotional assets, and the
classification schemes provided significant amount of business to the hotels.
Furthermore, Vallen and Vallen (2005) cited there was an approximately 20% increase in
sales of top rating hotels in Mobile Guide and 40% increase of business in the small
hotels rated in AAA. Based on his study, it was proposed that the hotel rating
functioning as a promotional tool was associated with the growth of hotel business as
measured by volume of sales and occupancy rate.
Finally, hotel rating was perceived as a pricing tool for hotel business. Israeli
and Uriely (2000) studied the impact of star ratings and corporate affiliations on hotel
room prices in Israel. Empirically, the significant result of the chi-square test verified
that the star ratings and the hotel corporate affiliations were dependent of each other and
they were related with the use of uniform naming strategy. Each property was named in
the same manner with one brand name (e.g. Jerusalem Hilton, Tel Aviv Hilton).
56

Additionally, the test of the linear regression model showed that a large part of the price
variation could be accounted for by the influence of the star rating. Thus, they
interpreted that the star rating system was a significant predictor of a hotel’s pricing
decision. To support this conclusion, Lollar (1990) stated that once a hotel was awarded
and the more stars the hotel had, the higher the room rate was. With the support of their
studies, it was interesting to discover what influence the star rating would have in Thai
hotel industry. Therefore, these led the researcher to propose an examination of the
relationship among hotels’ participation in the hotel rating system, their service quality
improvement, and hotel performance changes as measured by average daily room rate
(price), sales, and occupancy rate.
Service Quality Improvement
Hotel Performance Changes
Hotel Rating System
FIGURE 4: CONCEPTUAL FRAMEWORK
Summary
In summary, the literature suggested the hotel rating system was conceptually one
of many instruments the hotel industry used as a guideline to reach the expected service
quality level. Specifically, the hotel rating systems throughout the world were not
identical which confused consumers about the quality grading in each system. The
assumption of this study emerged that the hotel rating system might not completely
correspond to the service quality concept as the service quality seemed to be more
abstract in its constructs than did in the constructs of some hotel rating system. Figure 4
57
contains the conceptual framework, which is proposed from a review of literature on
hotel rating systems and service quality. The figure displays the concept that the hotel
rating systems is related to the service quality improvement, and that service quality
improvement is associated with changes in hotel performance. Therefore, the hotel rating
system can encourage hotel operators to improve their service quality leading to changes
in hotel performance.
HYPOTHESES
The study of the relationship of the hotel rating system and service quality
improvement proposed to test the hypotheses of the objective 2, 3, 5, 6, and 7 as follows;
Objective 2: To examine the differences of perceived influences of the Thailand Hotels
Standard on the hotel industry as well as hotel properties between the applicant hotels and
the non-applicant hotels.
Hypothesis 1: There is no significant difference in the perceived influences of the
Thailand Hotels Standard on the hotel industry as well as hotel properties between the
applicant hotels and the non-applicant hotels.
Objective 3: To examine the differences of perceived influences of the Thailand Hotels
Standard on the hotel industry as well as hotel properties between the star-rating certified
hotels and the non-star-rating certified hotels.
58

Hypothesis 2: There is no significant difference in the perceived influences of the
Thailand Hotels Standard on the hotel industry as well as hotel properties between the
star-rating certified hotels and the non-star-rating certified hotels.
Objective 5: To compare the service quality improvement among hotels at different star
rating levels.
Hypothesis 3: There is no significant difference in the service quality improvement
among hotels at different star-rating levels.
Objective 6: To compare the service quality improvement between independent hotels
and chain-affiliated hotels.
Hypothesis 4: There is no significant difference in the service quality improvement
between independent hotels and chain-affiliated hotels.
Objective 7: To examine the relationship among service quality improvement and hotel
performance changes.
Hypothesis 5: There is no significant relationship among service quality improvement
and hotel performance changes.
59

CHAPTER 3
METHODOLOGY
INTRODUCTION
This chapter describes the methods used to conduct the research. Specifically, it
details the research framework, research design, sampling plan, data collection,
instrument, and data analysis. Next, the pilot study, validity and reliability are clarified to
ensure the suitability of the study instrument.
RESEARCH FRAMEWORK
The research framework is presented in Figure 5. My purpose is to investigate the
relationship of the hotel rating system on service quality, a case study of the Thailand
Hotels Standard in Thailand. By administering the survey questionnaire, the data
regarding the perception of the hotel rating system on the hotel industry as a whole and
hotel properties, the changes in service quality improvement, and the hotel information
were collected and analyzed as described in the next section.
60

(Obj 1) Perceived influences of hotel rating system toward the hotel industry as well as hotel properties
(Obj 7) The relationships among service quality improvement and hotel performance changes
(Obj 2) Difference in the perceived influences toward the hotel industry hotels
as well as hotel properties between applicant hotels & non-applicant hotels
(Obj 3) Difference in the perceived influences toward the hotel industry hotels
as well as hotel properties between certified hotels & non-certified hotels
(Obj 4) Dimensions of service quality improvement
(Obj 5) Difference in service quality improvement among hotels at different star levels
(Obj 6) Difference in service quality improvement between independent hotels and chain hotels
Questionnaire Survey
Descriptive Statistics
t-test t-test
Factor Analysis
Applicant Hotels
Non-Applicant
Hotels
Certified Hotels
Non-Certified Hotels
1 star
Independent Hotels
ANOVA
t-test
Canonical Correlation Analysis
Service Quality Improvement - Service Delivery - Hotel Employees - Guest Facilities & Surroundings - Prestige
Chain Hotels 2 star
3 star 4 star
5 star
Hotel Performance Changes - Sales - Price - Occupancy
Figure 5: Research Framework
61
RESEARCH DESIGN
This exploratory and descriptive study attempts to examine the perception of hotel
rating system on service quality in the Thai hotel industry. Data was obtained by
conducting a cross-sectional survey. A structured self-administered questionnaire was
developed to collect the data from hotel managers in Thailand as the target population
during April-May 2006.
SAMPLING PLAN
Target Population
The target population of the study was the general managers or their
representatives of hotel properties that have been in operation for at least one year in
Thailand. In guesthouses or small hotels, the owners of the business would complete the
questionnaire themselves.
Many people perceived ‘hotel’ as a multi-storied structure having sleeping rooms
with private bathrooms and a number of amenities in each rentable room and at least a
restaurant serving its guests. In fact, there are several kinds of hotels available in today’s
market, including guesthouses, resorts, motels, all-suites, and convention hotels. They all
were established for the same basic purpose that was to supply lodging (and food) to
travelers. Thus, this study aimed to examine the perception of the managers randomly
selected from all lodging establishments in Thailand.
As a result, the term ‘hotel’ used in this study refers to any establishment that
provided accommodation usually on a short-term basis, no matter if it offered additional
62

guest services or not. This definition was established to provide a measurement of all
levels and categories of hotels in Thailand. According to the accommodation directory of
the Tourism Authority of Thailand (2002), there were approximately 5,000 hotels and
similar establishments in Thailand.
Sample Size
Israel (2003) summarized that there were four strategies to decide sample size
including (1) census for small populations, (2) imitating a sample size of similar studies,
(3) applying formulas to calculate a sample size, and (4) using published tables. The first
strategy ‘census’ was appropriate for the population of 200 or less. It allowed collecting
data from all subjects, thus eliminating sampling error that occurred because only a part
of the population was directly contacted. This strategy, however, was impossible when
conducting research on a larger population and when cost was a factor. Secondly,
imitating a sample size of similar studies saved time for the current research.
Nonetheless the major drawback was the risk of repeating errors that were made in
determining the sample size for another study; however, if the procedure were convincing,
they were included. Thirdly, applying the calculation methods for determining a sample
size allowed the researcher to achieve the necessary sample size for a different
combination of levels of precision, confidence, and variability of a particular study.
Fourthly, using published tables saved time for the researcher because calculating a
number of sample sizes for different given set of criteria was made available.
According to the table of sample size for a given population size published in
Sekaran (2003), the sample size to be drawn from an approximate population size of
63

5,000 lodging establishments appearing on the website of the TAT was 357. The
calculation was assumed that the desired level of precision (e) was set at 5% by
conventional guidelines and as commonly appropriate for a research in social or
behavioral sciences (Shavelson, 1996). Additionally, Israel (2003) recommended adding
10-30% to the needed number of respondents to compensate for non-responses.
A pilot test of this research showed a response rate of 29%. In case of achieving
lower response rate when collecting the real data, a new response rate of 25% was
estimated. Thus, the sample size increased to 1,428 or roughly 1,500 respondents. This
number included all 119 hotels that are certified for star rating by the Thailand Hotels
Standard, all 337 THA hotel members excluding those 105 repeated hotel-name appeared
on the star rating hotel directory of the Thailand Hotels Standard, and a sample of 1,044
non-THA members listed in the TAT hotel directory.
Sampling Methods
The sampling methods exercised a census and a simple random sampling. The
sampling frame was derived from three sources including the certified hotel directory of
the Thailand Hotels Standard, the hotel membership directory of Thai Hotel Association
(THA), and the accommodation directory of the Tourism Authority of Thailand (TAT),
given that hotel properties with at least one-year operation were contacted.
The entire award-winning hotels from the directory of the Thailand Hotels
Standard was first included in the sampling frame as it guaranteed the maximum number
of the subjects that had been directly affected by the certified star-rating. There were 119
hotels listed in the directory along with the star levels ranging from two to five stars; 7
64
two-star hotels, 36 three-star hotels, 48 four-star hotels, and 28 five-star hotels. None of
the hotels was certified for one star. Recognizing that the majority of the certified hotels
were also members of the THA, the researcher deleted the new selected hotel when it
repeated any of the 119 hotels.
The second source was the THA membership directory as they represented the
hotels serving highly acceptable quality. This source supplied an additional 337
uncertified star-rating hotels resulting from removing the repetitive 105 certified star-
rating hotels from the total of 442 registered hotel members in the Thai Hotel Association.
The last source taken and placed in the sampling frame was the TAT hotel
directory. The majority of hotels from this source characterized from small and medium
hotels serving low or commonly acceptable quality level to luxury five-star hotels. There
were approximately 5,000 hotels and similar establishments available in the directory
listed by the location only. From this group, the hotel characteristics are as follows. First,
some of these hotels were members of the THA and were already certified with one of
the star levels. Second, some properties were members of the THA but were not been
certified with any star level. Lastly, some hotels were neither involved with the THA
membership nor applied for the Thailand Hotels Standard. Therefore, a sample of hotels
selected in this stage was included only when the new hotels did not repeat the hotels
drawn from earlier stages, which were obtained from the Thailand Hotels Standard and
the THA membership directory, respectively. The remaining 1,044 hotels were selected
by exercising a simple random sampling, performed by the SPSS program on the function
of random sample of cases.
65

Survey Administration
The study collected primary data from the hotel managers in Thailand during
April-May 2006. The data collection was administered through mailing survey and
telephone follow-ups when necessary. A self-administered questionnaire was mailed
with three cover letters; first from the president of the Thailand Hotel Association, second
from the secretary of the committee of the Foundation of Standard and Human Resources
Development in Service and Tourism Industry for the Thailand Hotels Standard, and
lastly from the researcher giving an introduction of the study and instruction to complete
the questionnaire.
After mailing the questionnaires, the researcher contacted the hotel managers
whose name appeared on the Thailand Hotels Standard list and the THA membership list
by telephone to ask if they had received the questionnaires. If so, they were encouraged
to be a part of the study. If not, an introduction about the survey was given. A few
weeks later, two follow-up phone calls were made to remind the hotel managers
particularly those from the Thailand Hotels Standard list and the THA membership list.
Several reasons were given by the hotel managers for not participating in the survey
including 1) they did not receive the questionnaire 2) their businesses were closed 3)
they changed their business or property for other purposes 4) they were afraid that their
businesses were too small to be a part of the study. For the first reason, the researcher
called them back again in a week to check for late questionnaires. For the fourth reason,
the hotel managers were encouraged that their data was as important as all other types
and levels of hotel to this study. The two other reasons were ignored and not included in
the study.
66

Responses
Among the 1,500 questionnaires distributed to a randomly selected sample of
hotel managers in Thailand, 354 completed surveys were received and the response rate
was 23.6%. Due to incorrect mailing addresses and business closures, 40 surveys were
returned. Out of the 354 surveys, six questionnaires had over 50% information missing
and were excluded from data analysis. Therefore, a total of 308 surveys were valid. A
variable on the questionnaire which asked for the number of capital registered to measure
hotel size was deleted as a majority of the respondents refused to provide the data. They
left questions blank for the following reasons: mainly due to business’ confidential
information, no authority to provide the data, not knowing the number, and registering
the business as sole proprietorship in which the Civil and Commercial Code did not
require capital registration.
TABLE 5
RESPONSE RATE
Number Percent Number of questionnaires distributed 1,500 100 Number of returned questionnaires 354 23.6 Number of questionnaires containing more than
50% missing values 6 0.4
Number of non-response 40 2.7 Number of usable response 308 20.5
67

INSTRUMENT
The instrument used in this study was a self-administered questionnaire. The
questionnaire was undisguised-structured to employ the benefits of a standardized
structure. The greatest benefits of using an undisguised-structured were the ease of
administration and the reliability that the respondents answered similarly to the same
exact questions (Churchill & Brown, 2004). Two forms of questions were used including
fixed-alternative questions as a majority and a few open-ended questions. The
questionnaire was written in both Thai and English in order to ensure both Thai and
foreign managers could understand and answer all the questions.
The questionnaire consisted of two sections (Appendix E and F). Section 1
collected data concerning the hotel managers’ perceived impacts of the hotel rating
system ‘the Thailand Hotels Standard’. Section 2 collected general information of the
hotel property.
There were nine questions in section 1. The first six questions examined the
respondents’ awareness of the Thailand Hotels Standard, experience, and plan of
application. Their answers were both dichotomous and multichotomous except when
they needed to specify the ‘reason’ in an open-ended form. Question 7 and 8 asked the
hotel managers to indicate the level of their agreement with the statements concerning the
perceived or expected impacts of the Thailand Hotels Standard at the industry level and
the property level, respectively. The statements in question 7 and 8 were taken from the
“benefits” and “objectives” statements of the Thailand Hotels Standard. The level of the
agreement ranged from 1 representing strongly disagree to 7 representing strongly agree.
Question 9 explored the extent to which each hotel property had changed or might have
68

changed attributes in support of an application for certification by the Thailand Hotels
Standard. Fifty-four attributes were obtained from 36 major attributes used for
evaluation by the Thailand Hotels Standard scheme and another 18 attributes from the
SERVQUAL, excluding similar attributes. The reason of combining the measure of
Thailand Hotels Standard and the SERVQUAL measure was that the Thailand Hotels
Standard did not specify specific behaviors of hotel’s service delivery as Stauss (1993)
indicated it as a limitation of using the attribute-based measurement of service quality.
The responses varied from 1 indicating minimum changes to 7 indicating maximum
changes with 0 indicative of no change.
In section 2, 12 questions investigated general hotel information. The first four
questions asked for the hotel size, category, ownership pattern (chain affiliation), and
length of its operation under the current name. The hotel size and length of its operation
were answered in the open-ended form of response. The response of hotel category was
dichotomous, either business or resort. The ownership pattern (chain affiliation) had
three alternatives: international hotel chain, Thai hotel chain, or independent hotel.
Question 5-8 asked to indicate the level of the hotel’s performance in the year 2005 for
hotels that were not officially certified by the Thailand Hotels Standard or the year before
being certified by the Thailand Hotels Standard for hotels that had been officially
certified by the Thailand Hotels Standard. Question 7-12 asked to indicate the
anticipated level of the hotel’s performance in the year 2006 for hotels that had not yet
officially certified by the Thailand Hotels Standard or the year after being certified by the
Thailand Hotels Standard for hotels that had been officially certified by the Thailand
69
Hotels Standard. The responses ranged from 1 signifying least successful to 7 signifying
most successful.
PILOT STUDY
A pilot study of a sample of 75 hotel managers was conducted to test the internal
consistency of the perceived impacts of the Thailand Hotels Standard on the hotel
industry in general and on each hotel property and the measure of attributes that had been
changed or might be changed in support of an application for certification under the
Thailand Hotels Standard. The anticipated response rate was initially set at 40% or 30
responses. However, only a total of 22 hotel managers returned the completed
questionnaire or approximately 29% of response rate. The reliability coefficients were
shown 0.9700 to 0.9769 meaning that the measures were highly reliable.
About 52% of the responses were resorts serving tourists and not much different
proportion (48%) were business hotels. Almost two-thirds were independent hotels,
whereas the percentage of international hotel chains and Thai hotel chains were 24% and
14% respectively. Almost 70% had implemented some other service quality
improvement other than following the criteria of the Thailand Hotels Standard. More
than 86% of the respondents were aware of the Thailand Hotels Standard. Half of the
respondents had applied for the star rating evaluation by the Thailand Hotels Standard.
Among those being the applicants, half of the respondents had applied for four-star
evaluation, 20% had applied for five-star evaluation, and a few had ever applied for
three- and two- star evaluation. None of them applied for one-star grading. Eighty
percent of these applicants achieved their proposed level of the star-rating. For those
70
whose hotel failed the evaluation, half accepted the evaluation result at a lower star level
than had applied. Seventy percent of those whose hotel did not apply for the Thailand
Hotels Standard admitted that they had no plan to apply for the star rating at all. Another
30% had a plan to apply for it within three years.
CONTENT VALIDITY
According to Churchill and Brown (2004), “content validity is the adequacy with
which the important aspects of the characteristics are captured by the measure” (Churchill
& Brown, 2004, p.333). Simply, the content validity ensured the instrument fully
included the important features of the construct that was being measured. To achieve the
content validity, a review of literature was conducted to find the important variables
related to the constructs of both service quality and hotel rating systems. Additionally,
the measure of service quality used in this study was adopted from the well-established
measurement of the SERVQUAL and the adaptation of internationally accepted hotel
rating model. Prior to collecting the data, the questionnaire was reviewed by professors
in the hospitality field and professionals in the Thai hotel industry. Corrections and
adjustments were made according to their suggestions.
RELIABILITY
Churchill and Brown (2004, p. 335) defined reliability as an “ability of a measure
to obtain similar scores for the same object, trait, or construct across time, across
different evaluation, or across the items forming the measure”. They also explained the
71

two types of reliability which were an inter-judge reliability and an internal consistency.
The inter-judge reliability of a measure was operated when different subjects evaluated a
single object. An internal consistency was another reliability used to determine the
correlation of items in the measure. This study observed only the internal consistency
because the study asked for a score from each respondent toward a statement. The
internal consistency allowed the researcher to check if each respondent’s scores of
different parts in the measurement appeared in a similar pattern. The coefficient alpha,
generally known as Cronbach’s alpha, indicated that the internal consistency existed.
Nunnally (1978, p. 245) as cited in Pedhazur & Schmelkin (1991) suggested “reliabilities
of .7 or higher will suffice.” Thus, the greater the coefficient alpha is, the more reliable
the measurement is.
The reliability analysis of the collected data revealed that the scales had an
internal consistency supported by highly satisfied alpha value (see Table 6). The scale
used to measure the perceived impacts of the hotel rating system on the industry in
general containing 7 items had the alpha value of 0.9447. The scale measuring the
perceived impacts of the hotel rating system on each hotel property having 14 items
generated the Cronbach’s Alpha value of 0.9692. Fifty-four items determined changes in
the service quality improvement resulted in the alpha value of 0.9854. The last scale to
assess hotel performance changes quantified by three items produced the alpha value of
0.8567. All scales had the alpha value greater than 0.7, thus the measurement of the
study was sufficiently reliable.
72

TABLE 6
RELIABILITY COEFFICIENTS FOR SCALES
Scales Number of Items Alpha Value Perceived impacts of the hotel rating system on
the industry in general 7 0.9447
Perceived impacts of the hotel rating system on individual hotel property
14 0.9692
Service quality improvement 54 0.9854 Hotel performance changes 3 0.8567
DATA ANALYSIS
The statistical package for social sciences (SPSS) was used to analyze all the data.
The study applied four statistical techniques to analyze and interpret the data including
descriptive analysis, exploratory factor analysis, independent sample t-test, analysis of
variance and canonical correlation analysis.
Specifically, the logical procedure started with profiling the sample. Next, the
first objective was examined with descriptive statistics. The second and third objectives
examined the differences of the perception of the Thailand Hotels Standard on the hotel
industry as well as hotel properties by the application status (between the applicant hotels
and the non-applicant hotels) and the certification status (between the certified hotels and
the not-certified hotels) of the hotel sample. The fourth objective was attained by factor
analysis. The underlying dimensions of the service quality improvement derived from
the factor analysis were used for the analyses in the next objectives. The fifth objective
compared the service quality improvement at different star rating hotels. Similarly, the
sixth objective assessed the service quality improvement between the affiliated hotels and
the non-affiliated hotels. The last objective also used the service quality improvement
73

factors to explore the relationships with the hotel performance changes which measured
by volume of sales, average daily room rate, and occupancy.
Descriptive Analysis
Descriptive analysis was used to assess the data to answer the first and second
objectives, which assessed the perceptions of hotel rating system on the hotel industry in
general and on the hotel property level. Descriptive statistics were used to determine the
measures of central tendency (mean) and measures of the variation of the characteristics
in this survey study (range and standard deviation) in order to describe the distribution of
responses on each variable (Churchill & Brown, 2004). In addition, the frequency
analysis was used to describe the distribution of hotel’s general information
Independence Sample T-Test
To analyze data involving categorical and continuous measure, the independence
sample t-test was used for the third to sixth and ninth objectives. It was a between-
subject design that required a subject being observed in one time and one cell of the
design (Shavelson, 1996). This statistical technique helped to answer the question if the
two samples of interest came from the same population. This means that it was
commonly used to test the difference between two group means arose by chance or
represented a true difference between populations (Shavelson, 1996) and when there were
a categorical independent variable and a continuous dependent variable (Churchill &
Brown, 2004). The t-test was recommended because the technique would be useful in a
74

situation when there was likelihood for a causal relationship between a categorical
independent variable and a continuous dependent variable (Churchill and Brown, 2004).
Factor Analysis
Factor analysis was used to identify underlying dimensions of hotel operator’s
perceptions of service quality changes that had been or might have been made in order
for certification of the hotel rating system. Factor analysis is an interdependence
technique to find inter-correlations among numerous variables by considering all
variables simultaneously, not to predict a dependent variable (Hair, Anderson, Tatham, &
Black, 2004). The factor analysis allows identification of underlying dimensions of
service quality changes to meet the standard of the Thailand Hotels Standard.
R-type factor analysis was applied to analyze a set of variables, not respondents,
to derive the underlying dimensions. The variables were obtained from the well-
established SERVQUAL measure and the major variables listed in the evaluation form of
the Thailand Hotels Standard. The variables were measured on metric scale of 0-7
indicating no change (0), and minimum (1) to maximum (7) levels of change.
Generally, the sample size needed for factor analysis should not be less than 50
cases, with a preferred number of 100 or more cases (Hair, Anderson, Tatham, & Black,
2004). Although, a minimum number of 10 observations per a variable are more
preferable, researchers found five observations per a variable as the acceptable number of
observations required for the factor analysis (Hair, Anderson, Tatham, & Black, 2004).
The assumption of factor analysis was tested by the Bartlett test of sphericity (a
statistical test for the overall significance of all correlations within a correlation matrix),
75
and the measure of sampling adequacy (a statistical test for suitability to apply the factor
analysis technique) (Hair, Anderson, Tatham, & Black, 2004).
The factor model applied in the study was principal component analysis to
identify the latent dimensions and use them in subsequent analysis. The principal
component analysis forms a linear combination of variables to extract the maximum
variance of the variables (Garson, 2006). Hair, Anderson, Tatham, & Black (2004) states
that the component factor model yields the smallest number of factors explaining the
greatest amount of variance in the original set of variables. With the principal component
analysis, the researcher considered applying the latent root criterion or eigenvalues
greater than one as the criterion to consider the number of factor to be significant. The
notion of considering eigenvalues greater than one was that each factor would account for
the variance of at least a single variable. In addition, the analysis applied an orthogonal
factor rotation with the intention each factor would be independent with one another.
The derived factors were used in further analysis in the form of summated scales taken
from calculating mean of variables loaded on each factor.
Analysis of Variance
Analysis of variance (ANOVA) was used to test the hypothesis of objective 8,
which examined the difference between each measure of the service quality improvement
among the hotels at different star rating levels (one- to five stars). Hair, Anderson,
Tatham, & Black (2004) specified that the technique was more efficient than t-tests when
there was more than two groups to be considered due to the decrease of the type-I error-
rejecting a true null hypothesis. The ANOVA model compared the amount of dispersion
76

found on each of the groups to the total amount of dispersion in the data. The study
applied univariate analysis of variance for one dependent variable was compared by one
or more factors and/or variables. The dependent variable was each measure of service
quality improvement consisting of service delivery, hotel employees, guest facilities and
surroundings, and prestige. The independent variable was the hotels in the five-star
rating levels.
The assumptions of analysis of variance included independence of cases,
normality, and homogeneity of variances. The independence of cases was incorporated
in the research design. The normality of the distribution in each group was checked by
using the Kolmogorov-Smirnov and Shapiro-Wilk normality tests. The homogeneity of
variances was verified by using Levene’s test.
Canonical Correlation Analysis
Canonical correlation analysis was used to identify any relationship among the
two set of variables consisting of measures of service quality improvement and hotel
performance changes. It was the most generalized multivariate analysis which facilitated
the collective analysis of relationships among multiple dependent variables and multiple
independent variables (Hair, Anderson, Tatham, & Black, 2004). The measures of service
quality improvement were the summated factor values obtained from the average of
attributes that were significantly loaded on each factor. Both the MANOVA procedure
and the CANCORR macro in the Statistical Package for the Social Sciences (SPSS) were
performed in the syntax to run the canonical correlation analysis.
77
Hair, Anderson, Tatham, and Black (2004) recommended having at least 10 cases
per variable to avoid overfitting the data. The number of canonical functions to be
obtained was equal to the less number of variables in either independent or dependent
variable set. The first canonical function accounted for the most variance in the set of
variables. The succeeding canonical function explained the most remaining variance. To
select which canonical functions to be interpreted, three criteria were considered
including statistical significance, magnitude of relationships, and redundancy measure of
shared variance. Hair, Anderson, Tatham, & Black (2004) believed that considering only
a single criterion was insufficiently reliable. Therefore, the researcher checked all three
criteria.
The interpretation for the results of the canonical analysis was carried out by
considering canonical loading (canonical structure correlation) which was the simple
linear correlation between an original variable and its canonical variate (Hair, Anderson,
Tatham, & Black, 2004). A high canonical loading provided more contribution to the
canonical variate. Examining canonical weight was disregarded due to its criticism as in
the used of beta weight in regression technique and instability when applying to other
sample.
78

CHAPTER 4
RESULTS
INTRODUCTION
This chapter presents the results of data analysis in four stages. The first stage
includes profiling the sample and describing the perceived influences of the hotel rating
system on the entire hotel industry and hotel properties. In the second stage, factory
analysis is presented for identifying the underlying dimensions of service quality
improvement. Next, statistical differences on service quality improvement are shown
regarding the application status and the certification status. Lastly, the canonical
correlation analysis was applied to determine the relationships among the set of service
quality improvement and the set of hotel performance changes.
SAMPLE DESCRIPTION
As shown in Table 7, among the 308 hotel respondents, more than half (55%)
were business hotels located in downtown areas primarily serving business travelers. The
others were resorts near tourist attractions whose target market was mainly pleasure
travelers. About 80% of the hotels were independent properties, while the others were
hotels operated under chain affiliation. Among the 64 chain affiliated hotels, 21
79

properties were under international chain brands and 43 properties were associated with
Thai chains, accounting for 6.9% and 14.1% of the total respondents respectively.
TABLE 7
HOTEL CATEGORY AND CHAIN AFFILIATION
Frequency Percent Hotel Category
• Business 168 54.9 • Resort 138 45.1
Total 306 100.0 Hotel Chain Affiliation
• Chain hotels 64 21.0 o International hotel chain 21 6.9 o Thai hotel chain 43 14.1
• Independent hotels 242 79.0 Total 306 100.0
Table 8 exhibits the descriptive statistics of hotel size and length of the operation
under the current name. The size of the hotel properties sampled ranged from 3
guestrooms to 1,200 guestrooms. More than half were small hotels containing not more
than 100 guest rooms. Approximately 40% were medium-sized hotels offering between
101-200 guest rooms. Only 9% of the hotel sample was large hotel properties owning
more than 200 guest rooms. The average number of guestrooms was 135. The number
of employees hired corresponds to the hotel size, ranging from one person to 1,000
persons. The average number of full-time employees was 126 persons.
As required for this study, the hotels have been in operation at least one year. The
maximum number of years a hotel has operated was 46 years. Almost 45% had been in
the hotel industry for less than 10 years. The second largest group is the hotel business
with the experience between 11-20 years for 39%. Approximately 16% had run their
80

business for more than 20 years. The average length of the hotel operation was almost 14
years.
TABLE 8
HOTEL SIZE AND LENGTH OF OPERATION
N Min Max Mean Standard Deviation
Hotel size: • Number of guestrooms 300 3 1,200 135.17 141.985 • Number of full-time employees 298 1 1,000 126.49 159.045
Length of hotel operation under the current name
287 1 46 13.74 9.765
Frequency Percent
Hotel size: 1 – 100 guest rooms (Small) 161 53.5 101 – 200 guest rooms (Medium) 113 37.5 More than 200 guest rooms (Large) 27 9.0
Total 301 100.0 Length of hotel operation: 1 – 10 years 135 44.9 11 – 20 years 117 38.9 21 – 30 years 30 10.0 More than 30 years 19 6.2
Total 301 100.0
Table 9 presents the number of the respondents’ involvement with the hotel
rating system. Most respondents (87%) were aware of the Thailand Hotels Standard,
which was the first official Thai hotel rating system. However, only a quarter of the hotel
respondents had ever applied for the certification of the Thailand Hotels Standard.
Regardless if they apply or not, a majority (81%) had already implemented a service
quality improvement program other than following the criteria of the Thailand Hotels
Standard. Simply, most of them had performed at least a type of service quality control
for their business.
81

Table 9 also presents the frequency and percent of the proposed star levels of the
hotel respondents and their successful application in total. The majority of the hotel
applicants applied for three- to five- star evaluation. Nearly 27% of the respondents
applied for the three-star evaluation. Half of the hotel applicants proposed for the four-
star evaluation. About 14% of them submitted an application for the five-star evaluation.
Around 80% of all the applicants were awarded with the star rating certification of the
Thailand Hotels Standard. Table 10 displays the number of successful and failed hotels
in their application for the proposed star level. Most hotel applicants that had applied for
two- to five- star evaluation received the certification for their proposed star rating
evaluation. Only a few of them failed the evaluation.
The subsequent actions of the hotels which applied for the star rating and failed
the evaluation are shown in Table 9. The hotels which failed to meet the minimum
requirement of the Thailand Hotels Standard for each proposed star level took subsequent
actions. Three quarters insisted the determination to attain the proposed star-rating that
they had applied. They chose either to improve their property to meet the standard of the
proposed level within 180 days before re-inspection or to cancel the application in order
to have more time for renovation, rather than to accept the evaluation result of certifying
at a lower star level. A few percentages were in the process of hotel rating evaluation to
be certified and announced the following year. Of those hotels which failed the
evaluation and decided to cancel the application preferred to delay the application for
more than three years or never apply for it again. None of them would like to apply
within three years.
82
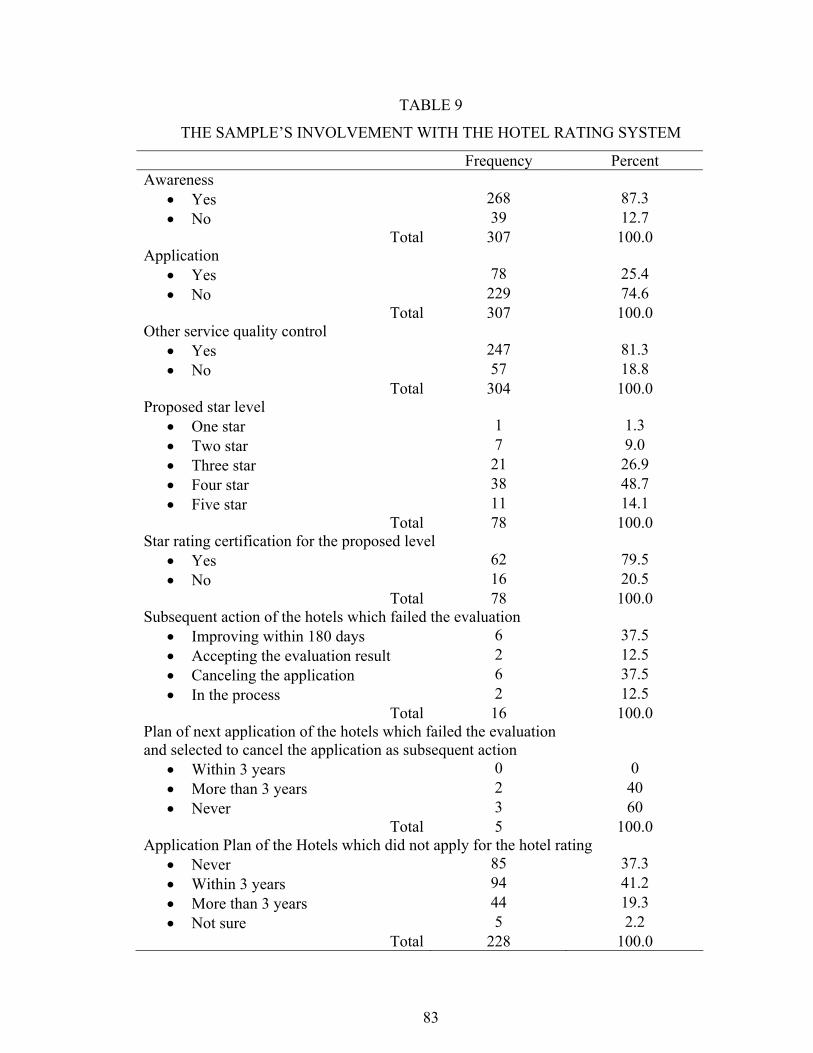
TABLE 9
THE SAMPLE’S INVOLVEMENT WITH THE HOTEL RATING SYSTEM
Frequency Percent Awareness
• Yes 268 87.3 • No 39 12.7
Total 307 100.0 Application
• Yes 78 25.4 • No 229 74.6
Total 307 100.0 Other service quality control
• Yes 247 81.3 • No 57 18.8
Total 304 100.0 Proposed star level
• One star 1 1.3 • Two star 7 9.0 • Three star 21 26.9 • Four star 38 48.7 • Five star 11 14.1
Total 78 100.0 Star rating certification for the proposed level
• Yes 62 79.5 • No 16 20.5
Total 78 100.0 Subsequent action of the hotels which failed the evaluation
• Improving within 180 days 6 37.5 • Accepting the evaluation result 2 12.5 • Canceling the application 6 37.5 • In the process 2 12.5
Total 16 100.0 Plan of next application of the hotels which failed the evaluation and selected to cancel the application as subsequent action
• Within 3 years 0 0 • More than 3 years 2 40 • Never 3 60
Total 5 100.0 Application Plan of the Hotels which did not apply for the hotel rating
• Never 85 37.3 • Within 3 years 94 41.2 • More than 3 years 44 19.3 • Not sure 5 2.2
Total 228 100.0
83

The application plan of the hotels that did not apply for the star rating is shown in
table 9 as well. More than 40% of the hotels that had not yet applied for the certification
of the Thailand Hotels Standard intended to apply for the star rating within three years.
Approximately 37% would never apply for the star rating. Approximately 19% planned
to apply for the star rating more than 3 years. Only 2% did not decide whether and when
to apply for the hotel star rating scheme.
TABLE 10
SUCCESSFUL APPLICATIONS OF EACH PROPOSED STAR LEVEL
The Proposed Star Level Yes No Total N % N % N %
• One star 0 0 1 100.0 1 100.0 • Two star 6 85.7 1 14.3 7 100.0 • Three star 16 76.2 5 23.8 21 100.0 • Four star 30 78.9 8 21.1 38 100.0 • Five star 10 90.9 1 9.1 10 100.0
Total 62 79.5 16 20.5 78 100.0
THE PERCEIVED INFLUENCES OF THE HOTEL RATING SYSTEM
Perceptions at the industry level
Table 11 exhibits the mean and standard deviation (SD) of the attributes to
measure the perceived influences of the hotel rating system on the hotel industry in
general. As shown in the table, the hotel managers agreed with all the statements
regarding the perceived influences of the hotel rating system on the hotel industry in
general, supported by high overall mean scores at 5.75 and the mean scores ranging from
5.54 to 5.94 on the 7 point scale (1 = strongly disagree to 7 = strongly agree).
84

They agreed mostly in terms of the ability of the hotel rating system to increase
hotel operators’ awareness of the continuous development of hotel standards in Thailand
(Mean = 5.94, SD = 1.30). The next highest score (Mean = 5.88, SD = 1.23) is that the
hotel rating system was able to provide guests accurate service expectations of the hotels’
products and services. The third highest mean (Mean = 5.86, S.D. = 1.24) is that the
hotel rating system was able to provide a reliable benchmark for hotel operations. The
fourth rating indicates the agreement that it helped to improve the quality of hotels in
Thailand (Mean = 5.75, S.D. =1.35). Next, the rating system was perceived to enhance
sustainable growth in the hotel industry (Mean = 5.70, S.D. = 1.43). The agreements of
the last two perceived influences that the hotel rating provided standards for fair
competition in the hotel industry and for guaranteeing fair value to guests were slightly
lower (Mean = 5.58, S.D. = 1.43 and Mean = 5.54, S.D. = 1.40, respectively).
Interestingly, the rating system revealed a common impression from the hotel managers
perspective, they agreed the Thailand Hotels Standards was imminent and an important
instrument that would advance the Thai hotel industry.
TABLE 11
THE PERCEIVED INFLUENCES OF THE HOTEL RATING SYSTEM AT THE INDUSTRY LEVEL
N Mean Standard Deviation
Increasing hoteliers’ awareness of the continuous development of hotel standards in Thailand.
305 5.94 1.30
Allowing guests have accurate service expectations. 305 5.88 1.23 Providing a reliable benchmark for hotel operations. 304 5.86 1.24 Improving the quality of hotels in Thailand. 304 5.75 1.35 Enhancing sustainable growth in the hotel industry. 305 5.70 1.43 Providing standards for fair competition in the hotel
industry. 304 5.58 1.43
Providing standards for guaranteeing fair value to guests. 305 5.54 1.40 Overall perceived influences on the hotel industry in
general 305 5.75 1.16
85

Perceptions at the property level
Table 12 exhibits descriptive statistics of the perceived influences of the Thailand
Hotels Standard on hotel properties, perceived by the managers of hotels that had applied
for the evaluation, and expected by the managers of hotels with no experience with the
application for the hotel rating evaluation. The statistics shows high mean scores similar
to their perceived influences of the hotel rating system toward the hotel industry as a
whole. The range of mean scores is 5.75 to 5.22 and overall mean is 5.47 indicating that
their agreement to the statements concerning the perceived influences of the Thailand
Hotels Standard on their own property is at ‘somewhat agree’ to ‘agree’ level. In
particular, they had positive perceived influences that the hotel rating system could
provide benefits for each property in terms of the management commitment to service
quality (Mean = 5.75), promotion and advertising (Mean = 5.68), brand recognition
(Mean = 5.67), standards of service (Mean = 5.62), standards for hotel premises (Mean =
5.58), employee commitment to service quality (Mean = 5.48), value of products and
services (Mean = 5.47), a superior marketing position (Mean = 5.45), efficiency in
administration (Mean = 5.39), business growth (Mean = 5.34), the expectation of
customers’ needs (Mean = 5.34), an equitable competitive marketing situation (Mean =
5.30), price levels (Mean = 5.28), and repeat business (Mean = 5.22). No variable
received mean score lower than 5.
86

TABLE 12
THE PERCEIVED INFLUENCES OF THE HOTEL RATING SYSTEM AT THE PROPERTY LEVEL
N Mean Standard Deviation
Increasing management commitment to service quality.
305 5.75 1.30
Helping hotel's promotion and advertising. 305 5.68 1.35 Aiding in brand recognition. 305 5.67 1.38 Improving standards of service. 305 5.62 1.22 Providing the standards for hotel premises, amenities,
and surroundings. 303 5.58 1.39
Increasing employee commitment to service quality. 305 5.48 1.42 Increasing the value of products and services. 305 5.47 1.34 Providing a superior marketing position. 304 5.45 1.45 Allowing efficiency in administration. 303 5.39 1.36 Helping to increase business growth. 303 5.34 1.44 Providing the hotel with the expectation of customers'
needs. 305 5.34 1.38
Providing an equitable competitive marketing situation.
304 5.30 1.46
Increasing hotel price levels. 302 5.28 1.48 Increasing repeat business. 303 5.22 1.45 Overall perceived influences on individual hotel 305 5.47 1.17
87

DIFFERENCES OF THE PERCEIVED INFLUENCES OF THE THAILAND HOTELS STANDARD
ON HOTELS’ APPLICATION STATUS
The differences of hotel managers’ perceived influences regarding the Thailand
Hotels Standard were examined in relation to hotels’ application status. The seven
measures of the hotel managers’ perceived influences of the hotel rating system on the
industry in general and the 14 measures representing the managers’ perceived influences
of the hotel rating system on hotel properties were dependent variables and the hotels’
application status was the independent variable. To examine perception differences
between the hotels which applied for the hotel rating and the hotels, and did not applied
for the hotel rating, the independence sample t-tests were performed to check the
significance of mean differences. Levene’s test was considered for equality of variances.
Table 13 presents the mean scores, standard deviations, mean differences, and t-
tests of the hotel managers’ perceived influences of the Thailand Hotels Standard
regarding whether they have ever applied for the hotel rating evaluation. Four mean
differences were statistically significant at a significance level of 0.05 and a mean
difference was statistically significant at 0.10. The significant mean differences at α 0.05
included ‘improve the quality of hotels in Thailand’ (t = 2.01, p ≤ 0.05), ‘allows guest to
have accurate service expectations’ (t = 2.78, p ≤ 0.05), ‘provide standards for
guaranteeing fair value to guests’ (t = 2.57, p ≤ 0.05), and ‘increase hotel operators’
awareness of the continuous development of hotel standards in Thailand’ (t = 3.01, p ≤
0.05). The statement with significant mean difference at alpha level of 0.10 is ‘provide
standards for fair competition in the hotel industry’ (t = 1.85, p ≤ 0.10).
88

Accordingly, hypothesis 1 was rejected indicating there were significant
differences of the hotel managers’ perceived influences of the Thailand Hotels Standard
on the hotel industry between the hotels which applied for the hotel rating and the hotels
which did not apply for the hotel rating. Table 13 shows that the applicant hotels had
higher levels of agreement for the statements concerning the hotel rating system on the
industry in general than the hotels which did not apply for the hotel rating.
TABLE 13
THE PERCEIVED INFLUENCES OF THE HOTEL RATING SYSTEM AT THE INDUSTRY LEVEL BY APPLICATION STATUS
Applicants
(N=77)
Non Applicants (N=227)
Mean Difference T
Sig. (2-tailed)
Mean S.D. Mean S.D.
Improve Thai hotels' quality
6.00 1.15 5.68 1.41 0.32 2.01 0.046*
Provide a reliable benchmark
6.01 1.03 5.81 1.30 0.20 1.36 0.175
Fair competition 5.82 1.20 5.50 1.50 0.31 1.85 0.065** Accurate service
expectation 6.17 0.94 5.79 1.30 0.38 2.78 0.006*
Guaranteeing fair value
5.86 1.10 5.45 1.47 0.41 2.57 0.011*
Sustainable growth 5.86 1.35 5.66 1.46 0.20 1.04 0.300 Awareness of the
continuous service quality development
6.27 0.97 5.84 1.38 0.43 3.01 0.003*
Overall 6.00 0.94 5.68 1.22 0.32 2.41 0.017* * p < 0.05, ** p < 0.10
89

Table 14 reveals the differences in the perceived influences of the Thailand Hotels
Standard on each hotel property between the hotels which applied for the hotel rating and
the hotels which did not applied for the hotel rating. The t-test revealed 5 mean
differences significant at the level of 0.05 and 3 mean differences significant at the level
of 0.10. At the 0.05 level, the hotels that applied for the hotel rating evaluation agree
more with the statements than the hotels that had never applied for it for the following
attributes; ‘help to improve standards of service’ (t = 2.34, p ≤ 0.05), ‘increase
management commitment to service quality’ (t = 2.37, p ≤ 0.05), ‘provide the hotel with
the expectation of customers’ needs’ (t = 2.28, p ≤ 0.05), ‘provide an equitable
competitive marketing situation’ (t = 2.20, p ≤ 0.05), and ‘increase repeat business’ (t =
2.34, p ≤ 0.05). The three mean significant differences at level 0.10 were ‘provide the
standards for hotel premises, amenities, and surroundings’ (t = 1.83, p ≤ 0.10), ‘increase
employee commitment to service quality’ (t = 1.88, p ≤ 0.10), and ‘help to increase
business growth’ (t = 1.75, p ≤ 0.10).
The hypothesis 1 was rejected indicating there were significant differences in the
perceived influences of the Thailand Hotels Standard on individual hotel properties
between the hotels that applied for the hotel rating and the hotels that did not apply for
the hotel rating.
90

TABLE 14
THE PERCEIVED INFLUENCES OF THE HOTEL RATING SYSTEM
AT THE PROPERTY LEVEL BY APPLICATION STATUS
Applicants
(N=77)
Non Applicants (N=227)
Mean Difference T Sig.
Mean S.D. Mean S.D. Standards for hotel
premises, amenities, & surroundings
5.83 1.22 5.50 1.43 0.33 1.83 0.068**
Improve standards of service
5.91 1.04 5.54 1.25 0.37 2.34 0.020*
Increase the value of products & services
5.68 1.20 5.41 1.38 0.27 1.51 0.133
Increase hotel price levels
5.50 1.40 5.22 1.50 0.28 1.44 0.151
Increase employee commitment to service quality
5.73 1.21 5.41 1.47 0.32 1.88 0.062**
Increase management commitment to service quality
6.03 1.10 5.66 1.35 0.37 2.37 0.019*
Provide hotel the expectation of customers' needs
5.65 1.16 5.24 1.44 0.41 2.28 0.023*
Provide an equitable competitive marketing situation
5.58 1.18 5.21 1.53 0.37 2.20 0.029*
Help hotel's promotion & advertising
5.81 1.34 5.64 1.35 0.17 0.94 0.349
Aid in brand recognition
5.74 1.30 5.66 1.40 0.08 0.44 0.662
Superior marketing position
5.51 1.46 5.44 1.44 0.07 0.36 0.722
Efficiency in administration
5.53 1.23 5.35 1.39 0.18 1.02 0.310
Increase repeat business
5.52 1.14 5.13 1.53 0.39 2.34 0.021*
Increase business growth
5.57 1.23 5.27 1.49 0.30 1.75 0.082**
Overall 5.68 1.01 5.41 1.21 0.28 1.80 0.072** * p < 0.05, ** p < 0.10
91

DIFFERENCES OF THE PERCEIVED INFLUENCES OF THE THAILAND HOTELS STANDARD
ON HOTELS’ CERTIFICATION STATUS
The independent sample t-test was applied to test the mean differences of hotel
managers’ perceived influences of the Thailand Hotels Standard on the hotel industry
between the star-rating certified hotels and the non-star-rating certified hotels. Table 15
shows mean scores and standard deviations of the hotels that were certified and not
certified with any star rating. The significant mean differences were identical to the
results of the applicant and non-applicant hotels. Specifically, the hotels that were
certified under the Thailand Hotels Standard had perceived the hotel rating system more
beneficial than the hotels that were not certified for the following attributes; ‘improve the
quality of hotels in Thailand’ (t = 3.26, p ≤ 0.05), ‘provide standards for fair competition
in the hotel industry’ (t = 2.03, p ≤ 0.05), ‘allow guests have accurate service
expectations’ (t = 3.07, p ≤ 0.05), ‘provide standards for guaranteeing fair value to
guests’ (t = 3.01, p ≤ 0.05), ‘increase hotel operators’ awareness of the continuous
development of hotel standards in Thailand’ (t = 3.65, p ≤ 0.05) and ‘provide a reliable
benchmark’ (t = 1.72, p ≤ 0.10). As a result, hypothesis 2 was rejected indicating there
were significant difference in the perceived influences of the Thailand Hotels Standard on
the hotel industry between the star-rating certified hotels and the non-star-rating certified
hotels.
92

TABLE 15
THE PERCEIVED INFLUENCES OF THE HOTEL RATING SYSTEM
AT THE INDUSTRY LEVEL BY CERTIFICATION STATUS
Certified (N=62)
Not Certified (N=243)
Mean Difference T
Sig. (2-tailed)
Mean S.D. Mean S.D. Improve Thai
hotels' quality 6.16 1.01 5.65 1.41 0.51 3.26 0.001*
Provide a reliable benchmark
6.06 0.99 5.81 1.29 0.26 1.72 0.088**
Fair competition 5.87 1.21 5.50 1.48 0.37 2.03 0.044*
Accurate service expectation
6.23 0.91 5.79 1.28 0.44 3.07 0.003*
Guaranteeing fair value
5.95 1.12 5.44 1.44 0.51 3.01 0.003*
Sustainable growth 5.94 1.34 5.65 1.45 0.29 1.42 0.157
Awareness of the continuous service quality development
6.35 0.87 5.84 1.37 0.52 3.65 0.000*
Overall 6.08 0.91 5.67 1.21 0.41 2.98 0.004*
* p < 0.05, ** p < 0.10
93

To examine perception differences of the influence of the Thailand Hotels
Standard on hotel properties between the star-rating certified hotels and the non-star-
rating certified hotels, the independent sample t-test was also applied. Mean scores and
standard deviations of the perceived influences of the Thailand Hotels Standard on each
hotel property assessed by both hotels that were certified and not certified with star rating
were presented in Table 16.
The only mean difference with significance level of 0.10 was ‘provide the
standards for hotel premises, amenities, and surroundings’ (t = 1.67, p ≤ 0.10). It was
also found that the certified hotels saw the perceived influences of the Thailand Hotels
Standard toward hotel properties more favorable than those hotels that had not been
certified with the star rating system on the following attributes, ‘help to improve
standards of service’ (t = 2.16, p ≤ 0.05), ‘increase the value of products and services’ (t
= 2.00, p ≤ 0.05), ‘increase hotel price levels’ (t = 2.32, p ≤ 0.05), ‘increase employee
commitment to service quality’ (t = 2.26, p ≤ 0.05), ‘increase management commitment
to service quality’ (t = 2.68, p ≤ 0.05), ‘provide an equitable competitive marketing
situation’ (t = 2.53, p ≤ 0.05), ‘increase repeat business’ (t = 2.45, p ≤ 0.05), and ‘help to
increase business growth’ (t = 2.36, p ≤ 0.05).
The significant t-scores caused the rejection of the null hypothesis 4, which tested
if there was no significant difference in the perceived influences of the Thailand Hotels
Standard, on individual hotel property between the star-rating certified hotels and the non
star-rating certified hotels.
94

TABLE 16
THE PERCEIVED INFLUENCES OF THE HOTEL RATING SYSTEM
AT THE PROPERTY LEVEL BY CERTIFICATION STATUS
Certified (N=62)
Not Certified (N=243)
Mean Difference T Sig.
Mean S.D. Mean S.D.
Standards for hotel premises, amenities, & surroundings
5.84 1.24 5.51 1.42 0.33 1.67 0.096**
Improve standards of service
5.92 1.03 5.55 1.25 0.37 2.16 0.032*
Increase the value of products & services
5.77 1.15 5.40 1.38 0.38 2.00 0.047*
Increase hotel price levels
5.67 1.30 5.18 1.51 0.49 2.32 0.021*
Increase employee commitment to service quality
5.81 1.21 5.40 1.46 0.41 2.26 0.026*
Increase management commitment to service quality
6.10 1.10 5.66 1.33 0.44 2.68 0.008*
Provide hotel the expectation of customers' needs
5.71 1.18 5.24 1.41 0.47 2.40 0.009*
Provide an equitable competitive marketing situation
5.66 1.17 5.21 1.51 0.45 2.53 0.013*
Help hotel's promotion & advertising
5.82 1.35 5.64 1.35 0.18 .964 0.336
Aid in brand recognition
5.84 1.27 5.63 1.41 0.21 1.07 0.288
Superior marketing position
5.57 1.44 5.42 1.45 0.15 0.72 0.471
Efficiency in administration
5.56 1.26 5.34 1.38 0.22 1.14 0.255
Increase repeat business
5.56 1.14 5.14 1.51 0.43 2.45 0.016*
Increase business growth
5.68 1.20 5.25 1.48 0.42 2.36 0.020*
Overall 5.75 1.00 5.40 1.20 0.35 2.12 0.035* * p < 0.05, ** p < 0.10
95
FACTOR ANALYSIS OF SERVICE QUALITY IMPROVEMENT
The fourth objective which was to identify the dimensions of service quality
improvement, as a result of the implementation of the Thailand Hotels Standard was
accomplished by running the factor analysis. In this factor analysis, when considering
the total number of 308 respondents for 54 variables, yielded the proportion of cases to a
variable as 5.7:1. The analysis included 170 respondents for the hotels that applied for
the Thailand Hotels Standard and the hotels planning to apply for the hotel rating system
within three years. These selected respondents represented the sampled group of interest
which was likely to make an improvement with the introduction of the Thailand Hotels
Standard.
The assumption of the factor analysis was verified by statistical tests including the
Bartlett test of sphericity and the measure of sampling adequacy (MSA). Variables that
were factor analyzed required some degree of multicollinearity (Hair, Anderson, Tatham,
& Black, 2004). The correlation matrix of the variables showed that there were sufficient
correlations among these variables for the application of the factor analysis. The Bartlett
test of sphericity was used to assess the overall statistical significance of the correlations
within the correlation matrix (Hair, Anderson, Tatham, & Black, 2004). In this study, the
Bartlett test of sphericity had an approximate chi-square value of 12,389, at a significant
level of 0.000, indicating that there were significant correlations among at least some
variables in the matrix. MSA measured the appropriateness to the application of the
factor analysis. The measure of sampling adequacy, ranging from 0 to 1; MSA value of
this analysis was 0.951. According to the general guidelines quoted in Hair, Anderson,
Tatham, & Black (2004), the MSA value of 0.951 was considered meritorious. Therefore,
96

the factor analysis could be perfectly applied to the data in spite of a relatively small
proportion of observations per variable.
The latent root criterion revealed five significant factors of service quality
improvement perceived by hotel managers in Thailand in relation to the Thailand Hotels
Standard. The analyzed factors explained 81.031% of the total variance of the variable
input. The percentage was fairly high when considering an acceptable level of 60% or
less of the total variance explained by the factor solution in social sciences (Hair,
Anderson, Tatham, & Black, 2004).
To interpret the factor and select the final factor solution, a VARIMAX
orthogonal rotation was used as it provided clearer separation of factors. The VARIMAX
method provided straightforwardness of the interpretation due to the evaluation of the
correlation between variables and factors approaching ± 1. Next, the significance of
factor loadings was taken into consideration. The consideration ensured both practical
and statistical significance. According to the criterion assessing the practical and
statistical significance, 42 variables were retained for their high factor loadings on a
single factor and 12 variables were disregarded.
In the last factor solution, the exploratory factor analysis resulted in four factors
with eigenvalues above one explaining 81.04 % of the total variance (Table 17). Based on
the representative items, the four factors were named as “Service Delivery”, “Hotel
Employees”, “Guest Facilities and Surroundings”, and “Prestige”. The reliability
coefficients of the four factors ranged from 0.85 to 0.99.
97
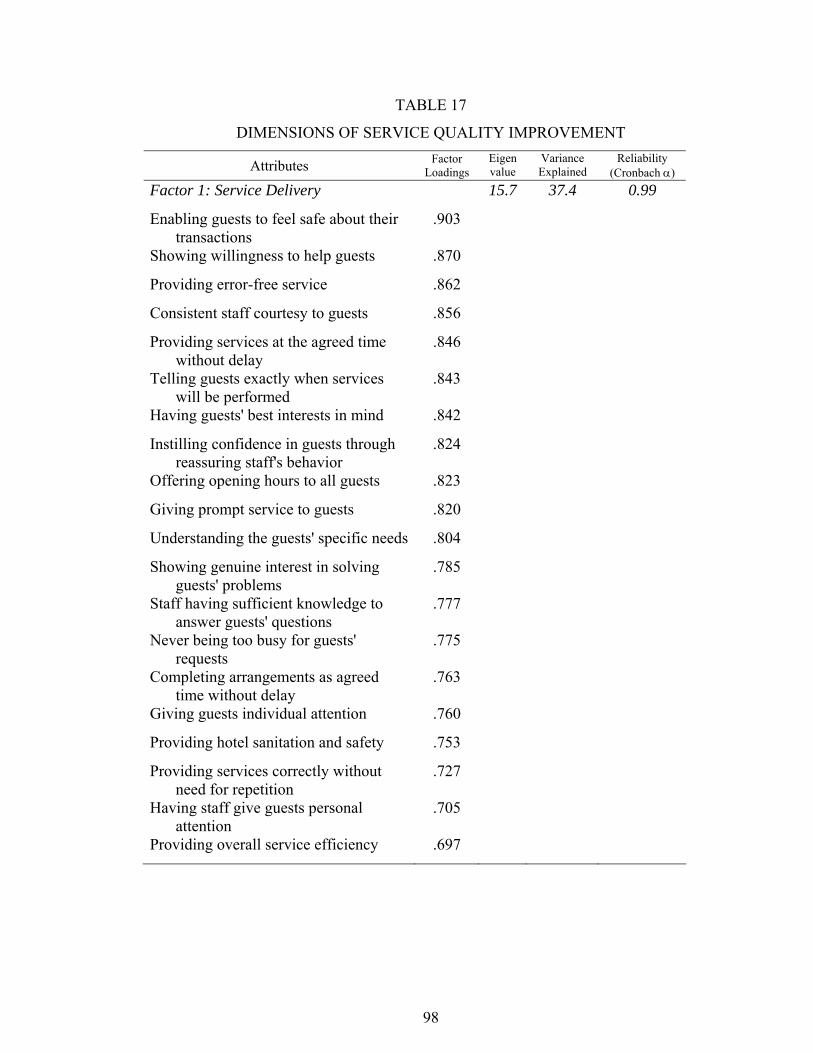
TABLE 17
DIMENSIONS OF SERVICE QUALITY IMPROVEMENT
Attributes Factor Loadings
Eigen value
Variance Explained
Reliability (Cronbach α)
Factor 1: Service Delivery 15.7 37.4 0.99
Enabling guests to feel safe about their transactions
.903
Showing willingness to help guests .870
Providing error-free service .862
Consistent staff courtesy to guests .856
Providing services at the agreed time without delay
.846
Telling guests exactly when services will be performed
.843
Having guests' best interests in mind .842
Instilling confidence in guests through reassuring staff's behavior
.824
Offering opening hours to all guests .823
Giving prompt service to guests .820
Understanding the guests' specific needs .804
Showing genuine interest in solving guests' problems
.785
Staff having sufficient knowledge to answer guests' questions
.777
Never being too busy for guests' requests
.775
Completing arrangements as agreed time without delay
.763
Giving guests individual attention .760
Providing hotel sanitation and safety .753
Providing services correctly without need for repetition
.727
Having staff give guests personal attention
.705
Providing overall service efficiency .697
98

Attributes Factor Loadings
Eigen value
Variance Explained
Reliability (Cronbach α)
Factor 2: Hotel Employees 9.6 22.8 0.98
Improving employees' foreign language ability
.820
Providing quality service by receptionists .810
Providing quality service by cashiers .783
Providing quality service by bellboys .777
Improving employees' personality .775
Improving employees' discipline .770
Improving language ability, menu recommendation, and restaurant management by restaurant manager and staff
.765
Improving service manner, discipline, language ability and serving efficiency of waiters/waitresses
.755
Improving employees' service manner .731
Improving guest room cleaning service .711
Improving employees' dress .693
Factor 3: Guest Facilities and Surroundings 5.6 13.4 0.93
Improving surroundings .760
Improving location/physical structure .723
Improving lobby .707
Improving guest rooms .652
Improving restaurants .648
Improving business center & facilities .616
Improving parking .607
Improving public, health & entertainment facilities
.581
Factor 4: Prestige 3.2 7.5 0.85
Receiving awards from international contests
.843
Receiving awards from domestic contests .810
Providing services to VIPs .768 Note: Total variance explained: 81%
99

Factor 1 Service Delivery covers almost all statements used in the SERVQUAL
measure with some modifications plus the overall service efficiency used as an attribute
found in the measure of Thailand Hotels Standard. The factor expresses common
characteristics of whatever the services in the hotel are handled properly and efficiently.
Twenty statements covered factor 1, they consisted of enabling guests to feel safe about
their transactions, showing willingness to help guests, providing error-free service,
providing staff courtesy to guests, providing services at the agreed time without delay,
telling exactly when services will be performed, having guests’ best interests in mind,
instilling confidence in guests through reassuring staff’s behavior, offering opening hours
to all guests, understanding guests’ specific needs, showing genuine interest in solving
guests’ problems, staff having sufficient knowledge to answer guests’ questions, never
being too busy for guests’ requests, completing arrangements as agreed time without
delay, giving guests individual attention, providing hotel sanitation and safety, providing
services correctly without need for repetition, having staff give guests personal attention,
and providing overall service efficiency. All factor loadings are 0.697 or higher. The
factor explains 37.4% of total variance in the original variables, and reliability coefficient
is 0.99. The high coefficient alpha may be caused by obtaining the attributes from the
well established measure (the combination of the SERVQUAL measure and the measure
of the Thailand Hotels Standard).
Factor 2 Hotel Employees describes competence of hotel employees in relation to
services delivered in the operation departments. The factor contains 11 statements used
in the measure of the Thailand Hotels Standard including improving employees' foreign
language ability, providing quality of services by receptionists, providing quality of
100

services by cashiers, providing quality of services by bellboys, improving employees'
personality, improving employees' discipline, improving language ability, menu
recommendation, and restaurant management by restaurant manager and staff, improving
service manner, discipline, language ability and serving efficiency of waiters/waitresses,
improving employees' service manner, improving guest room cleaning service, and
improving employees' dress. The factor loadings are from 0.693 to 0.820. The factor
accounts for another 22.8% of the total variance with an alpha coefficient of 0.98.
Factor 3 Guest Facilities and Surroundings represents improving physical
facilities and surroundings in hotels. The factor explains 13.4% of the total variance with
the reliability coefficient of 0.93. It consisted of eight attributes including improving
surroundings, location/physical structure, lobby, guest rooms, restaurants, business center
and facilities, parking, and public, health and entertainment facilities.
Factor 4 Prestige signifies the three attributes, which provide recognition to hotels.
They include the statements of receiving awards from international contests, receiving
awards from domestic contests, and providing services to VIPs. They represent the last
7.5% of the total variance with an alpha coefficient of 0.85.
The four factors subsequently formed a summated scale. They were used as the
measures of service quality improvement in determining differences in service quality
improvement in hotels among different star rating levels and between independent hotels
and chain hotels. In addition, these factors were applied as the measures of service
quality improvement in the examination of the latent relationship with hotel performance
changes.
101
SERVICE QUALITY IMPROVEMENT AND STAR RATING LEVEL
The fifth objective which aimed to compare the service quality improvement and
the hotels’ star rating level applied the analysis of variance (ANOVA). The study
analyzed only four-star levels (two- to five- star levels) excluding one-star hotels because
there was no one-star hotel passing the evaluation of the Thailand Hotels Standard. The
independent variable was the star level including two to five stars, whereas the dependent
variables were the four factors derived from the factor analysis of the service quality
improvement consisting of service delivery, hotel employees, guest facilities and
surroundings, and prestige.
ANOVA results are recorded in Table 18. The statistics revealed all non-
significance. Therefore, the fifth null hypothesis was accepted supporting that there was
no significant difference in the service quality improvement among different star-level
hotels. It was evident that the hotel’s star-rating level was not related to the service
quality improvement. Further, it explained that the hotels that were certified with any
star level by the Thailand Hotels Standard did improve the four aspects of service quality
improvement including service delivery, hotel employees, guest facilities and
surroundings, and prestige at the same level of improvement to be certified for their
proposed star levels.
102

TABLE 18
T-TESTS OF SERVICE QUALITY IMPROVEMENT BY STAR LEVEL
2-star 3-star 4-star 5-star
F Sig.
Mean (S.D) Mean (S.D) Mean (S.D) Mean (S.D)
Factor 1 Service delivery
5.12 (2.2) 4.85 (1.6) 4.55 (2.1) 4.26 (2.8) 0.307 0.820
Factor 2 Hotel employees
5.75 (1.2) 4.92 (1.5) 5.05 (1.9) 4.39 (2.7) 0.991 0.416
Factor 3 Guest facilities & surroundings
4.05 (1.0) 4.43 (1.6) 4.83 (1.8) 3.36 (2.4) 1.479 0.248
Factor 4 Prestige
3.47 (1.6) 3.71 (2.0) 3.81 (1.8) 3.48 (2.3) 0.117 0.950
TABLE 19
T-TESTS OF SERVICE QUALITY IMPROVEMENT BY CHAIN AFFILIATION
Chain- Affiliated
Hotels (N=41)
Non-Chain Affiliated
Hotels (N=111)
Mean Difference t Sig.
Mean S.D. Mean S.D.
Factor 1 Service delivery
4.42 2.18 4.80 1.65 -0.38 -1.01 .317
Factor 2 Hotel employees
4.70 2.06 5.12 1.34 -0.41 -1.23 .224
Factor 3 Guest facilities & surroundings
4.41 1.85 4.55 1.61 -0.14 -.46 .644
Factor 4 Prestige
3.48 1.98 3.59 1.87 -0.11 -.33 .743
103

SERVICE QUALITY IMPROVEMENT AND HOTEL CHAIN AFFILIATION
The sixth objective determined the difference in service quality improvement and
the hotel chain affiliation. The independent sample t-test was used to test the mean
differences between independent hotels and chain hotels. The independent variable was
the chain affiliation and the dependent variables were service delivery, hotel employees,
guest facilities and surroundings, and prestige as extracted in factor analysis of the
service quality improvement. Only the hotels that applied for the evaluation of the hotel
rating system and the hotels that planned to apply within three years were considered.
Table 19 reports t-tests of the mean differences in the service quality
improvement between chain hotels and independent hotels. The result disclosed all non-
significance between these hotels. This indicated that chain affiliation was not associated
with the service quality improvement implying that the service quality improvement were
conducted by all hotels in Thailand, not only the chain-affiliated hotels but also
independent (non-chain-affiliated) hotels. Therefore, the fourth null hypothesis was
failed to reject indicating that there was no significant difference in service quality
improvement between independent hotels and chain hotels.
104
SERVICE QUALITY IMPROVEMENT AND HOTEL PERFORMANCE CHANGES
The seventh objective examined the relationship between hotel performance
changes and service quality improvement. Canonical correlation analysis was employed
to study the relationship between sets of multiple dependent variables and sets of multiple
independent variables. The independent variable set contained the four factors derived
from factor analysis including 1) Service delivery, 2) Hotel employees, 3) Guest facilities
and surroundings, and 4) Prestige. The dependent variable set comprised three variables
measuring the degree of the perceived hotel performance changes which were
operationalized by volume of sales, average daily room rate, and level of hotel occupancy.
The negative impacts of sample size may occur in the application of the canonical
correlation analysis when the sample size is too small or too large. The sample size of at
least 10 observations per variable needed in the canonical correlation analysis was
recommended to avoid ‘overfitting’ the data to the specific sample (Hair, Anderson,
Tatham, & Black, 2004). The set of four independent variables yielded an acceptable
proportion of the number of observation per variable, which were about 30 observations
per variable.
The canonical correlation analysis of the three measures of hotel performance
changes and the four factors of service quality improvement generated three canonical
functions as the maximum number that could be extracted. There were equal to the
minimum number of variables in the dependent variable set. Each canonical function had
two canonical variates; one for the set of dependent variables and another for the set of
independent variables. The strength of relationship between these two variates was
termed as the canonical correlation (Rc). In Table 20, the canonical correlations range
105

from 0.321 to 0.127. The first canonical function has the canonical correlation of 0.321.
The canonical correlations of the second and third canonical functions were 0.270 and
0.127, respectively. The small canonical correlations presented a low level of association
between dependent variables and independent variables in each canonical function.
Hair, Anderson, Tatham, & Black (2004) recommended three criteria to consider
for canonical function for interpretation. “The authors believe that the use of a single
criterion such as the level of significance is too superficial” (Hair, Anderson, Tatham, &
Black, 2004, p.450). The first criterion was the level of significance. Generally, an
accepted significance level was 0.05 indicating that the two sets of variables were
significantly associated by canonical correlation. Instead of testing each individual
canonical function separately, several multivariate tests including Wilks’ Lambda,
Hotelling’s Trace, Pillai’s Trace, and Roy’s gcr were used to evaluate all functions
simultaneously. Table 20 also presents multivariate tests’ values, F-statistic, and
probability of the canonical correlation analysis. The results showed that the combined
canonical functions were statistically significant at the 0.05 level. In addition, it displays
the significance test of each canonical function extracted from the canonical correlation
analysis. Out of the three canonical functions, only the first is statistically significant at
0.05, while the second canonical function is statistically significant at 0.10. Due to the
exploratory nature of this study, the 0.10 level was used as the criterion of model
significance.
The second criterion was the practical significance reflected by the magnitude of
the canonical relationship. Garson (2006) indicated that a canonical function, as an
arbitrary rule of thumb, would be interpreted if its canonical correlation was equal or
106

greater than 0.30. The first canonical function in the study had the canonical correlation
at 0.321. The second canonical function had the canonical correlation approximately
0.30 which was sufficient to be of interest. Lastly, the third had the canonical correlation
quite lower than 0.30.
TABLE 20
MEASURES OF OVERALL MODEL FIT FOR CANONICAL CORRELATION
ANALYSIS
Canonical Correlation Analysis Canonical Function
Canonical Correlation (Rc)
Canonical R2
F-Statistic Probability
1 0.321 0.103 1.985 0.025 2 0.270 0.073 1.803 0.099 3 0.127 0.016 0.950 0.390
Multivariate Tests of Significance Statistic Value Approximate
F-Statistic Probability
Wilks’ Lambda 0.818 1.985 0.025 Pillai’s Trace 0.192 1.986 0.025
Hotelling’s Trace 0.210 1.973 0.026 Roy’s gcr 0.103
The third criterion was the redundancy measure of shared variance. The
redundancy measured the shared variance in a canonical variate that could be explained
by the variance of the other canonical variate in each canonical function (Hair, Anderson,
Tatham, & Black, 2004). This is the product of average canonical loadings squared
multiplied by the canonical roots. High redundancy index indicates a high predictability
of the canonical variate to explain the other set in a given canonical function. Normally,
researchers were interested in the redundancy analysis of how well the independent
107

canonical variate extracted the variance in the dependent canonical variate (Hair,
Anderson, Tatham, & Black, 2004; Garson, 2006).
In the study, the redundancy indices for the first canonical function are exhibited
in Table 21. The analysis showed that the redundancy index of the dependent variate was
0.0168 or approximately 2%. Table 22 shows the calculation of the redundancy indices
for the second canonical function, which resulted in the variance proportion of 0.054 or
about 5%. The redundancy indices of the third canonical function is presented in Table
23, indicating only 0.002 or less than 1% of the variance proportion in the dependent
variate that was explained by the independent variate. The low redundancy resulted from
the small amount of average loading squared and the only 10% of the canonical roots.
There was no generally accepted guideline specifying the minimum redundancy index,
for confirmation of theoretical and practical significance to the research problem (Hair,
Anderson, Tatham, & Black, 2004). However, researchers accepted a minimum
redundancy index of 2% or even 1.5% as meaningful canonical variate (Baloglu & Uysal,
1996; Oh et al., 1995 quoted in Baloglu, Weaver, & McCleary, 1998). Therefore, in light
of the redundancy index, the first two canonical functions were taken into consideration
because their redundancy indices were greater than 1.5%.
Furthermore, the result showed in Table 24 specified that the total redundancy is
0.073 or 7.3% of the variance in the dependent set. The first canonical function
accounted for 23.29%, and the second explained 73.97% equaling 97.26% of the total
redundancy. Due to the first two functions contributing for the most part to the total
redundancy, it supported the interpretation of these functions.
108

By evaluating these three criteria, the null hypothesis 5 was rejected. There was
significant relationship found between the service quality improvement and the hotel
performance changes.
TABLE 21
CALCULATION OF THE REDUNDANCY INDICES FOR THE FIRST CANONICAL FUNCTION
Variate/ Variables Canonical Loading
Canonical Loading Squared
Average Loading Squared
Canonical R2
Redundancy Index
Dependent Variables (Hotel Performance Changes) Change in Sales - 0.692 0.4789 Change in ADR 0.099 0.0098 Change in Occupancy - 0.029 0.0008 Dependent Variate 0.4895 0.1632 0.103 0.017Independent Variables (Service Quality Improvement) Service Delivery - 0.616 0.3795 Hotel Employees - 0.342 0.1170 Guest Facilities &
Surroundings - 0.331 0.3036
Prestige - 0.821 0.6740 Independent Variate 1.4741 0.3685 0.103 0.038
TABLE 22
CALCULATION OF THE REDUNDANCY INDICES FOR THE SECOND CANONICAL FUNCTION
Variate/ Variables Canonical Loading
Canonical Loading Squared
Average Loading Squared
Canonical R2
Redundancy Index
Dependent Variables (Hotel Performance Changes) Change in Sales 0.722 0.521 Change in ADR 0.905 0.819 Change in Occupancy 0.931 0.867 Dependent Variate 2.207 0.736 0.073 0.054Independent Variables (Service Quality Improvement) Service Delivery 0.301 0.091 Hotel Employees 0.804 0.646 Guest Facilities &
Surroundings 0.668 0.446
Prestige 0.375 0.141 Independent Variate 1.324 0.331 0.073 0.023
109

TABLE 23
CALCULATION OF THE REDUNDANCY INDICES FOR THE THIRD CANONICAL FUNCTION
Variate/ Variables Canonical Loading
Canonical Loading Squared
Average Loading Squared
Canonical R2
Redundancy Index
Dependent Variables (Hotel Performance Changes) Change in Sales - 0.018 0.000 Change in ADR - 0.414 0.171 Change in Occupancy - 0.363 0.132 Dependent Variate 0.303 0.101 0.016 0.002Independent Variables (Service Quality Improvement) Service Delivery 0.367 0.135 Hotel Employees 0.378 0.143 Guest Facilities &
Surroundings - 0.216 0.047
Prestige 0.064 0.004 Independent Variate 0.329 0.082 0.016 0.001
TABLE 24
OVERALL RESULTS OF CANONICAL CORRELATION ANALYSIS
Canonical Function 1 2 3 Canonical correlation 0.321 0.270 0.127 Eigenvalues/Canonical roots 0.103 0.073 0.016 Percentage of variance explained Service quality improvement 0.368 0.331 0.082 Cumulative percentage 0.368 0.699 0.781 Hotel performance changes 0.163 0.735 0.101 Cumulative percentage 0.163 0.898 0.999 Redundancy Service quality improvement 0.038 0.023 0.001 Cumulative percentage 0.038 0.061 0.062 Hotel performance changes 0.017 0.054 0.002 Cumulative percentage 0.017 0.071 0.073
Proportion of Total Redundancy in the Dependent Set (%)
23.29 73.97 2.74
Cumulative proportion of total redundancy in the dependent set (%)
23.29 97.26 100.00
The consideration of the three criteria including the level of significance, the
magnitude of canonical correlation, and the redundancy was finalized to interpret only
110

the first two canonical functions. In Table 24, the first two canonical functions accounted
for almost 90% of the variation in the variable set of hotel performance changes and
about 70% variation in the set of service quality improvement variables. While hotel
performance changes accounted for 6% of the variance (redundancy) in service quality
improvement, an approximate amount 7% of variation (redundancy) in hotel performance
changes was explained by the variability in service quality improvement. Simply stated,
when the independent variables were collectively taken into the analysis, they explained
about 7% of variance shared among the dependent variables.
TABLE 25
CANONICAL LOADINGS IN THE CANONICAL FUNCTIONS
Canonical Loadings 1 2 3 Correlations between the dependent variables and their canonical variates (Hotel Performance Changes) Change in Sales - 0.692 0.722 Change in Average Daily Room Rate 0.905 Change in Occupancy 0.931 Correlations between the independent variables and their canonical variates (Service Quality Improvement) Service Delivery - 0.616 Hotel Employees 0.804 Guest Facilities & Surroundings - 0.551 0.668 Prestige - 0.821
Table 25 contains the canonical loadings or structure correlations of variables in
the dependent and independent canonical variates. To describe the relationship between
the independent and dependent measures, canonical loadings greater than absolute value
of ± 0.50 according to the guidelines for identifying significant factor loadings based on
111

sample size that was accepted by the canonical correlation analysis were considered for
interpretation of the variate in Table 25 (Hair, Anderson, Tatham, & Black, 2004).
The results exposed the different structure of the variable sets looming in the
dependent relationship. The first canonical function suggested that change in sales was
significantly and positively correlated with change in prestige, change in delivery, and
change in hotel employees. The second canonical function indicated that change in
occupancy, change in average daily room rate, and change in sales was significantly and
positively related to change in hotel employees and change in guest facilities and
surroundings. The canonical correlation result also showed that change in sales and
change in guest facilities and surroundings did provide significant contribution to the
multivariate relationship among the service quality measures and the hotel performance
measures.
The first dependent variate containing only one dependent variable (change in
sales) had a variance of 48% with the canonical loading of – 0.692. When examining the
rank order in the first canonical function, the canonical loadings of the independent
variables were ranged from prestige (– 0.821), service delivery (– 0.616) and guest
facilities and surroundings (– 0.551).
The second dependent variate had a high shared variance of 74% among all the
three dependent variables. In the second canonical function, positive relationship was
also found among the independent and dependent variates. The variables providing the
most importance in the second independent variate were hotel employees (0.804) and
guest facilities and surroundings (0.668).
112

DISCUSSION OF FINDINGS
Sample Profile
A sample of 308 respondents representing 21% response rate of hotel operators in
Thailand provided the data to be analyzed for the study. The number of business hotels
and resorts was approximately comparable (55% and 45%). From the total number of
respondents, the majority was independent hotels. A small number of hotels were
operated under chain hotel companies (Thai chain hotels 14% and international chain
hotels 7%). The sample varied in size covering small hotels of only three guestrooms to
grand hotels supplying 1,200 guestrooms. The size of hotel observed by the number of
guestrooms was associated with the number of full-time employees varying from one to
1,000 persons. The majority is small and medium sized hotel containing less than 200
guestrooms. The average length of hotel operation under the current name was almost 14
years. Most of the hotels had been established for less than 20 years.
Almost all of the hotel managers were aware of the Thailand Hotels Standard as
the national hotel-rating system. However, only a quarter applied for the hotel rating
system to evaluate their hotel business. Although it succeeded in its name recognition, it
achieved less in drawing a greater number of hotels to the evaluation system. The reason
may be the hotel rating system was launched only a few years ago. As a result, only a
small number of hotels had participated in the hotel star rating scheme. The time
limitation of implementing the hotel rating system made it impractical for performing the
hotel star rating campaign throughout the entire industry. Additionally, the benefits and
incentives may not be widely spread or allocated properly for the hotels in each grading
113

level. Among the hotels that applied for the hotel star rating, almost all applied for the
top three star levels (3-5 stars). Thus, while the majority of the hotels that perceived
themselves as three- to five- star hotels were able to seek benefits from the national hotel
rating system, a few hotels that perceived themselves as one- to two- star hotels saw the
hotel rating system insignificant to their business. As a result, the one- and two-star
hotels showed little interest to get involved in the system. According to the study of
Callan (1995), the majority of customers in 3-5 star hotels used star rating more often
than the customers in 1-2 star hotels. The finding of this study also showed
corresponding results with Callan’s study in which the top three-star rating were more
popularly accepted by both hotel businesses and customers than the bottom two-star
rating levels.
Most hotels that applied for the hotel rating were awarded with the certification of
their proposed star level. Three quarters of the failed applicants persisted to achieve their
goal of the proposed star level by deciding either to improve their property to meet the
minimum requirements within 180 days before re-inspection or to cancel the application
of that year. The cancelled application would be restored in more than three years or
would be cancelled completely. However, when looking at the application plan of the
hotels that had not yet applied for the hotel rating system, over half did plan to participate
in the hotel rating system. The majority of them planned to apply within close proximity
of time (three years). Only a few of the non-applicant hotels would apply for the hotel
rating after the next three years. The findings related to the non-applicant hotels’ plan for
the hotel rating indicated a high possibility of a number of hotels’ participation with the
Thailand Hotels Standard.
114
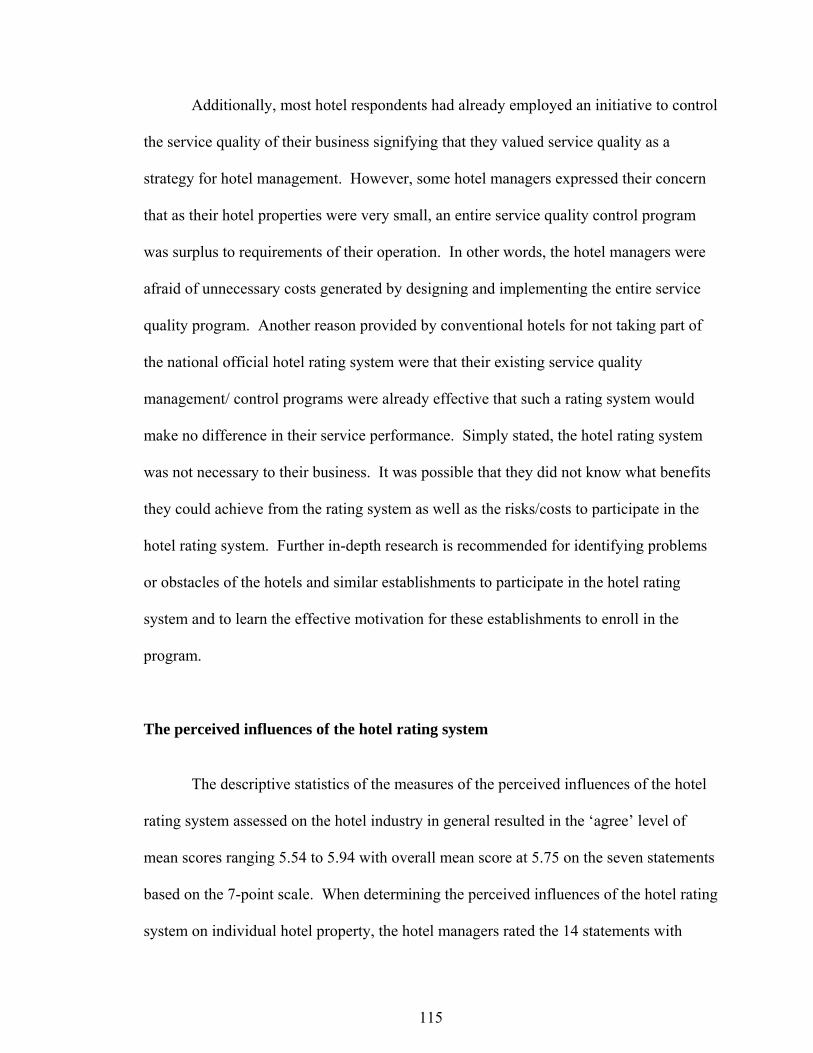
Additionally, most hotel respondents had already employed an initiative to control
the service quality of their business signifying that they valued service quality as a
strategy for hotel management. However, some hotel managers expressed their concern
that as their hotel properties were very small, an entire service quality control program
was surplus to requirements of their operation. In other words, the hotel managers were
afraid of unnecessary costs generated by designing and implementing the entire service
quality program. Another reason provided by conventional hotels for not taking part of
the national official hotel rating system were that their existing service quality
management/ control programs were already effective that such a rating system would
make no difference in their service performance. Simply stated, the hotel rating system
was not necessary to their business. It was possible that they did not know what benefits
they could achieve from the rating system as well as the risks/costs to participate in the
hotel rating system. Further in-depth research is recommended for identifying problems
or obstacles of the hotels and similar establishments to participate in the hotel rating
system and to learn the effective motivation for these establishments to enroll in the
program.
The perceived influences of the hotel rating system
The descriptive statistics of the measures of the perceived influences of the hotel
rating system assessed on the hotel industry in general resulted in the ‘agree’ level of
mean scores ranging 5.54 to 5.94 with overall mean score at 5.75 on the seven statements
based on the 7-point scale. When determining the perceived influences of the hotel rating
system on individual hotel property, the hotel managers rated the 14 statements with
115

average scores from 5.22 to 5.75 and overall mean score at 5.47 indicating somewhat
agree to agree level. The numbers show favorable perceptions of the hotel managers
toward the influence of the Thailand Hotels Standard at the level of the industry in
general and the individual hotel property. These measurements confirm the comment
Callan (1995) made to the effect of whatever the star rating system it was beneficial to
both the customers and the hotel industry for assistance in improving facilities and
service quality.
The t-tests results show significant differences in the perceived influences of the
Thailand Hotels Standard at the industry level between the hotels that applied for the
hotel rating system and those hotels that did not apply for it as well as between the hotels
that were certified by the Thailand Hotels Standard and those that were not certified at all.
The sample group that applied for the hotel rating system and the sample group that were
certified with the star rating were overlapping, thus showed identical significant
differences. Both groups believed that the Thailand Hotels Standard could increase hotel
operators’ awareness of the continuous development of hotel standards in Thailand;
provide standards for guaranteeing fair value to guests; allow guests have accurate
service expectations; provide standards for fair competition in the hotel industry; and
improve the quality of hotels in Thailand more than the group that did not applied for the
hotel rating system and the group that was not certified with the star rating. The overall
result suggested that the hotels that had participated in the Thailand Hotels Standard
perceived more benefits of the hotel rating system on the hotel industry in general than
those hotels that had not participated in the scheme.
116

The hotels that participated in the hotel rating system were more concerned for
the development of the entire hotel sector than non-participants. This indicates that the
participants of the Thailand Hotels Standard understood the benefits of the rating system
valuing for the stakeholders in the hospitality industry. The understanding can create a
more harmonized atmosphere in the hotel industry. Thus the entire industry is equipped
with the effective coordination to compete with the hotel industry of other countries or
destinations that provide similar products and services.
At the property level, the perceived influences of Thailand Hotels Standard
revealed significant differences between the hotels that applied for the rating system and
those hotels that did not apply for it as well as between the hotels that were certified with
the proposed star-rating and the hotels that were not certified with any star-rating. The
results showed similar significant differences except the perceived influences of the hotel
rating system which were to increase the value of products and services, the hotel price
levels and marketing-related attributes. The participants of the Thailand Hotels Standard
including the hotels that applied for hotel rating and those that were certified with the
stars perceived that the hotel rating system provided the standards for physical structure,
improved the standards of service, increased employee and management commitment to
service quality, provided hotels the expectation of customers’ needs, provided an
equitable competitive marketing situation. It also increased repeat business and its
business growth increased than the hotels that did not apply for the hotel rating or that
were not certified with any star. These perceptions include having a benchmark for
quality each hotel could rely on, a tool for quality management in the property, and a tool
for enhancing business performance.
117
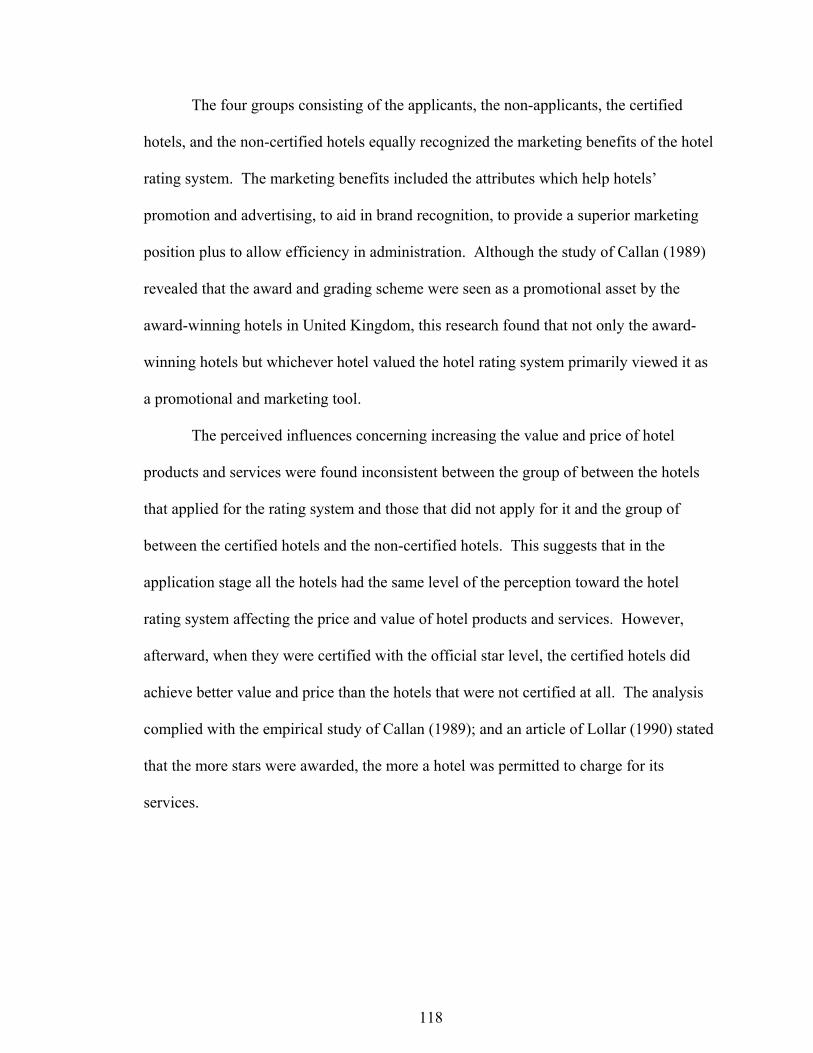
The four groups consisting of the applicants, the non-applicants, the certified
hotels, and the non-certified hotels equally recognized the marketing benefits of the hotel
rating system. The marketing benefits included the attributes which help hotels’
promotion and advertising, to aid in brand recognition, to provide a superior marketing
position plus to allow efficiency in administration. Although the study of Callan (1989)
revealed that the award and grading scheme were seen as a promotional asset by the
award-winning hotels in United Kingdom, this research found that not only the award-
winning hotels but whichever hotel valued the hotel rating system primarily viewed it as
a promotional and marketing tool.
The perceived influences concerning increasing the value and price of hotel
products and services were found inconsistent between the group of between the hotels
that applied for the rating system and those that did not apply for it and the group of
between the certified hotels and the non-certified hotels. This suggests that in the
application stage all the hotels had the same level of the perception toward the hotel
rating system affecting the price and value of hotel products and services. However,
afterward, when they were certified with the official star level, the certified hotels did
achieve better value and price than the hotels that were not certified at all. The analysis
complied with the empirical study of Callan (1989); and an article of Lollar (1990) stated
that the more stars were awarded, the more a hotel was permitted to charge for its
services.
118

Dimensions of service quality improvement
The combination of attributes used in the evaluation form of the Thailand Hotels
Standard and the attributes in the SERVQUAL measurement was factor analyzed to
identify the dimensions of service quality improvement in consequence of
implementation of the Thailand Hotels Standard. The final solution generated four
factors namely according to the size of eigenvalues as ‘service delivery’ (15.7), ‘hotel
employees’ (9.6), ‘guest facilities and surroundings’ (5.6), and ‘prestige’ (3.2).
The structure result was different from the original dimensions of the
SERVQUAL and other studies of service quality as the purpose of this analysis was to
identify the dimensions of service quality improvement, or the changes that had been
made on the specified attributes necessitated to be evaluated by the hotel rating system in
support of an application for certification of the Thailand Hotels Standard. The first
factor named ‘service delivery’ as their variables represented how efficiently the hotel
services were delivered to the guests. It included the ‘reliability’, ‘responsiveness’,
‘assurance’ and ‘empathy’ dimensions of service quality found in the SERVQUAL
measurement (Parasuraman et al., 1988). Its detail involved safe transaction, willingness
to help, error-free service, courtesy, the agreed time of services, telling when to perform
the service, guests’ best interest in mind, service confidence, opening hours, prompt
service, guests’ specific needs, genuine interest for problem solving, staff’s knowledge,
never busy for guests, completing service without delay, individual attention, sanitation,
correct services, personal attention, and overall service efficiency. The ‘service delivery’
dimension extracted in this study was also found in ‘conviviality’, ‘reassurance’ and
‘empathy’ dimension in the study of Saleh and Ryan (1991); ‘reliability’, ‘assurance’,
119

responsiveness’, and ‘empathy’ dimensions in the study of Knutson, Stevens, Wulaert,
Patton, and Yokoyama (1991); ‘reliability’ dimensions by Mei, Dean, & White (1999);
and ‘reliability’, ‘responsiveness’, ‘responsiveness’, ‘confidence’, and ‘communication’
in the study of Getty and Getty (2003). When considering another point of view, these
variables also reflected the intangibles of hotel service which could lead to favoritism,
unless the inspectors are well-trained and informed about the description of different
scores rating each attribute.
The second factor named ‘hotel employees’ referred to the competency of
individual hotel employees to improve the service quality of the hotel. Though it
represented the intangible aspect of service quality similar to what were represented in
the first factor, it was more related to individual person’s qualification appropriate to
work in the hotel profession including language ability, services performed on duty,
personality, discipline, service manner, and their uniforms. The ‘hotel employees’
dimension extracted in this study was also found as the ‘employee’ dimension in the
study of Mei, Dean, & White (1999), covering hotel employees’ appearance and behavior.
The third factor labeled as ‘guest facilities and surroundings’ characterized
similarly to the ‘tangible’ dimension found in the SERVQUAL measurement. The
improvement of the hotel tangibles included surroundings, location/physical structure,
lobby, guestrooms, restaurants, business center and facilities, parking lot, and public,
health, and entertainment facilities. It was the only tangible aspect existing in this factor
analysis of the service quality improvement. The guest facilities and surroundings
dimension covers attributes embedded in ‘tangibles’ dimension of the SERVQUAL
(Parasuraman et al., 1988), Saleh and Ryan (1991), Knutson, Stevens, Wulaert, Patton,
120

and Yokoyama (1991), Mei, Dean, & White (1999), and ‘tangibility’ dimension by Getty
and Getty (2003).
The fourth factor called ‘prestige’ involved recognition of the hotel from
receiving awards from international or domestic contests in relation to the hotel
profession and service to national and well-known international celebrities. This factor
was not found in the original dimensions of service quality. Although the factor helped
in classifying hotels into exclusively different quality grading, it could be questioned how
the hotels define these well-known persons.
As summarized these four factors were the main facets to which the hotels in
Thailand paid attention to improve and prepare for the hotel rating of the Thailand Hotels
Standard. The five original dimensions of service quality were incorporated into the first
three dimensions of service quality improvement by the hotels in Thailand (service
delivery, hotel employees, and guest facilities and surroundings). However, it
emphasized the importance of hotel employees apart from the efficiency of the hotel
service delivery. This demonstrates that it is impossible to ignore the quality of hotel
employees when grading the hotels. The new significant dimension for the hotel rating
system titled prestige was not found in other studies of hospitality’s service quality (Saleh
& Ryan, 1991; Knutson, Stevens, Wulaert, Patton, and Yokoyama, 1991; Mei, Dean, &
White, 1999; Ekinci and Riley, 1999). This might be due to combining the major
attributes used in the Thailand Hotels Standard with the SERVQUAL attributes. The
implication is that a hotel rating system should not only assess how efficiently hotel
services were delivered but also the recognition of their customers’ social class.
121

Service quality improvement and star-rating level
The exploratory study of the relationship between the measures of service quality
improvement and hotel’s star-rating level was examined by applying t-test. The statistics
result revealed insignificant differences in service delivery, hotel employees, guest
facilities and surroundings, and prestige as measures of service quality improvement
between each star rating level consisting of two- to five-star level. The one-star hotel was
not analyzed because there were no hotels awarded as a one-star hotel. This indicated
that there was no relationship between service quality improvement and hotel’s star-
rating level.
The results showed that the changes in each dimension of service quality
improvement in order to be certified by the Thailand Hotels Standard were not associated
with hotel’s star-rating level. It meant that the hotels in each star-rating level were
interested in the hotel rating system and made the same level of improvement in their
service delivery, hotel employees, guest facilities and surroundings, and prestige. Any
campaign launched to encourage the hotel industry in Thailand to participate in the
Thailand Hotels Standard could attract hotels from whatever star-level in the industry.
Finally, they would all contribute to the continuous development of service quality in the
Thai hotel industry.
Service quality improvement and hotel chain affiliation
The relationship between service quality improvement and hotel chain affiliation
was assessed by using t-test. The test focused on the examination of the differences
122

found in the four dimensions of service quality improvement between the hotels operated
by chain affiliation and the hotels independently-operated from any hotel chain company.
It revealed that the differences were not statistically significant. They would occur by
chance. Thus, the service quality improvement was not related to the hotel chain
affiliation.
The findings implied the Thailand Hotels Standard encouraged both the chain-
affiliated hotels and the independent hotels to improve their business and make changes
to their service delivery, hotel employees, guest facilities and surroundings, and prestige.
Known for having an advantage of financial support by the chain company to reinvest in
their properties, the chain-affiliated hotels were able to achieve the star-rating
certification. The independent hotels, which typically had limited capital, also made the
improvement in their properties to attain the star-rating certification. Promotions from
the Thailand Hotels Standard encourage continuous development of service quality in
both two hotel groups.
Service quality improvement and hotel performance changes
The canonical correlation analysis revealed a significant relationship between the
service quality improvement measures and the hotel performance measures. The result
did correspond to the notion of Callan (1989) that hotel rating schemes were helpful to
both hotel guests and the industry by encouraging hoteliers to improve facilities and
quality of service.
The canonical results of the study exposed strong positive relationships in both
canonical functions. As shown in the first canonical function, change in prestige, change
123

in service delivery, and change in guest facilities and surroundings were significantly and
positively related with change in sales. When hotels made more improvement in the
prestige of the hotel, more improvement in their service delivery to guests, and more
improvement in their guest facilities and surroundings, a higher change in sales could be
expected. It was observed that only the change in sales was significant to the first
dependent variate but not the change in average daily room rate and the change in
occupancy. This suggests that the change in sales might be attributed to non-room
revenues which might include food and beverage sales, catering sales, facilities rental,
and laundry service.
In the second canonical function a significant and positive relationship was found
between change in hotel employees and change in guest facilities and surroundings as
independent measures and change in occupancy, change in average daily room rate, and
change in sales as dependent measures. This implies that hotels that demand greater
hotel performance changes measured in the forms of occupancy, average daily room rate
(price), and sales, have to improve more on the hotel employee aspects and guest
facilities and surrounding aspects. By focusing on only two aspects of service quality
improvement, the hotels can ensure better hotel performance changes. Furthermore, it
signified that the two high loading independent variables tended to demonstrate a
stronger relationship with the change in occupancy and the change in average daily room
rate than the change in sales. This indicates that when guests perceived hotel’s
departmental employees communicating and working efficiently and mannerly at their
work station and saw or experienced with new guest facilities and surroundings, the
124

guests were pleased to extend their stay at the hotel and willing to pay for a higher price
yielding more revenue to the hotel.
Obviously, guest facilities and surroundings provided significant contribution to
both independent variates as well as the measure of change in sales was a significant
dependent variable in the two canonical functions. An improvement of guest facilities
and surroundings was clearly visible to the eyes of hotel guests due to its nature of
tangibility; therefore, it was easily perceived by the guests. This tangible perception
would encourage an increase in the volume of sales indicating the provision of significant
amount of business to the hotel as a result of physical improvement on the hotel property.
These findings supported the study of Callan (1989) in which hotel grading systems were
seen as promotional assets producing significant levels of business, in particular
supplying valuable sales contribution. Although the research was performed on
investigating small country hotels, the canonical result of this study proved true for the
entire hotel industry in Thailand.
While the first canonical function did not show a relationship between the
improvement in hotel employees and dependent measures of change in average daily
room rate and change in occupancy, their relationship was found in the second canonical
function. It implied that the improvement in hotel employees dimension was
significantly and positively related with the hotel performance changes variables that
were related to rooms operation as a key activity of hotel business.
Of significance, while the improvement in guest facilities and surroundings was
important to both canonical functions of the service quality improvement and the hotel
performance changes; it concerned the physical or tangible attributes of the hotel. The
125

other three measures of service quality improvement consisting of prestige, service
delivery, and hotel employees were significantly loaded on a single canonical function
suggesting that these intangible attributes were essential to provide service experiences to
what hotel guests expected, which would in turn contribute to any or all measures of hotel
performance changes.
SUMMARY OF HYPOTHESIS TESTING
Hypotheses testing of the objectives 2, 3, 5, 6, and 7 are summarized as follows;
Objective 2: To examine the differences of perceived influences of the Thailand Hotels
Standard on the hotel industry as well as hotel properties between the applicant hotels and
the non-applicant hotels.
Hypothesis 1: There is no significant difference in the perceived influences of the
Thailand Hotels Standard on the hotel industry as well as hotel properties between the
applicant hotels and the non-applicant hotels.
Result: There are significant differences in the perceived influences of the Thailand
Hotels Standard on the hotel industry as well as hotel properties between the applicant
hotels and the non-applicant hotels.
Objective 3: To examine the differences of perceived influences of the Thailand Hotels
Standard on the hotel industry as well as hotel properties between the star-rating certified
hotels and the non-star-rating certified hotels.
126

Hypothesis 2: There is no significant difference in the perceived influences of the
Thailand Hotels Standard on the hotel industry as well as hotel properties between the
star-rating certified hotels and the non-star-rating certified hotels.
Result: There are significant differences in the perceived influences of the Thailand
Hotels Standard on the hotel industry as well as hotel properties between the star-rating
certified hotels and the non-star-rating certified hotels.
Objective 5: To compare the service quality improvement among hotels at different star
rating levels.
Hypothesis 3: There is no significant difference in the service quality improvement
among hotels at different star-rating levels.
Result: There is no significant difference in the service quality improvement among
hotels at different star-rating levels.
Objective 6: To compare the service quality improvement between independent hotels
and chain-affiliated hotels.
Hypothesis 4: There is no significant difference in the service quality improvement
between independent hotels and chain-affiliated hotels.
Result: There is no significant difference in the service quality improvement between
independent hotels and chain-affiliated hotels.
Objective 7: To examine the relationship among service quality improvement and hotel
performance changes.
127

Hypothesis 5: There is no significant relationship among service quality improvement
and hotel performance changes.
Result: There is significant relationship among service quality improvement and hotel
performance changes.
128
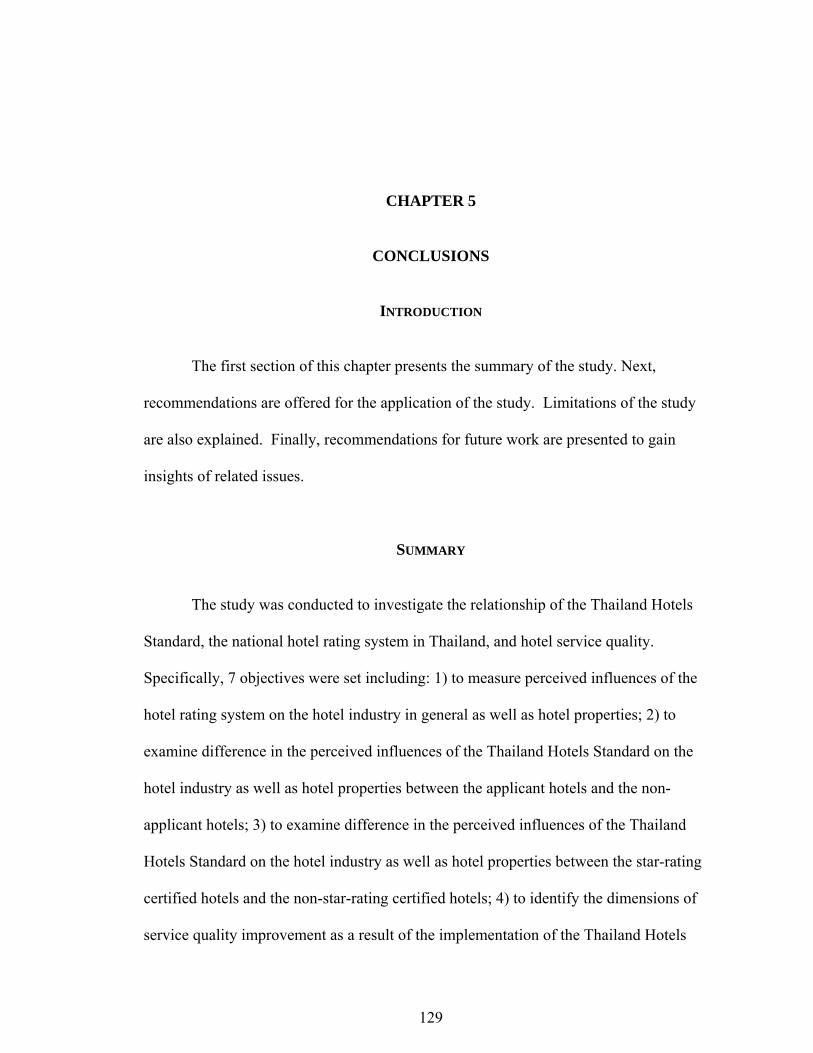
CHAPTER 5
CONCLUSIONS
INTRODUCTION
The first section of this chapter presents the summary of the study. Next,
recommendations are offered for the application of the study. Limitations of the study
are also explained. Finally, recommendations for future work are presented to gain
insights of related issues.
SUMMARY
The study was conducted to investigate the relationship of the Thailand Hotels
Standard, the national hotel rating system in Thailand, and hotel service quality.
Specifically, 7 objectives were set including: 1) to measure perceived influences of the
hotel rating system on the hotel industry in general as well as hotel properties; 2) to
examine difference in the perceived influences of the Thailand Hotels Standard on the
hotel industry as well as hotel properties between the applicant hotels and the non-
applicant hotels; 3) to examine difference in the perceived influences of the Thailand
Hotels Standard on the hotel industry as well as hotel properties between the star-rating
certified hotels and the non-star-rating certified hotels; 4) to identify the dimensions of
service quality improvement as a result of the implementation of the Thailand Hotels
129
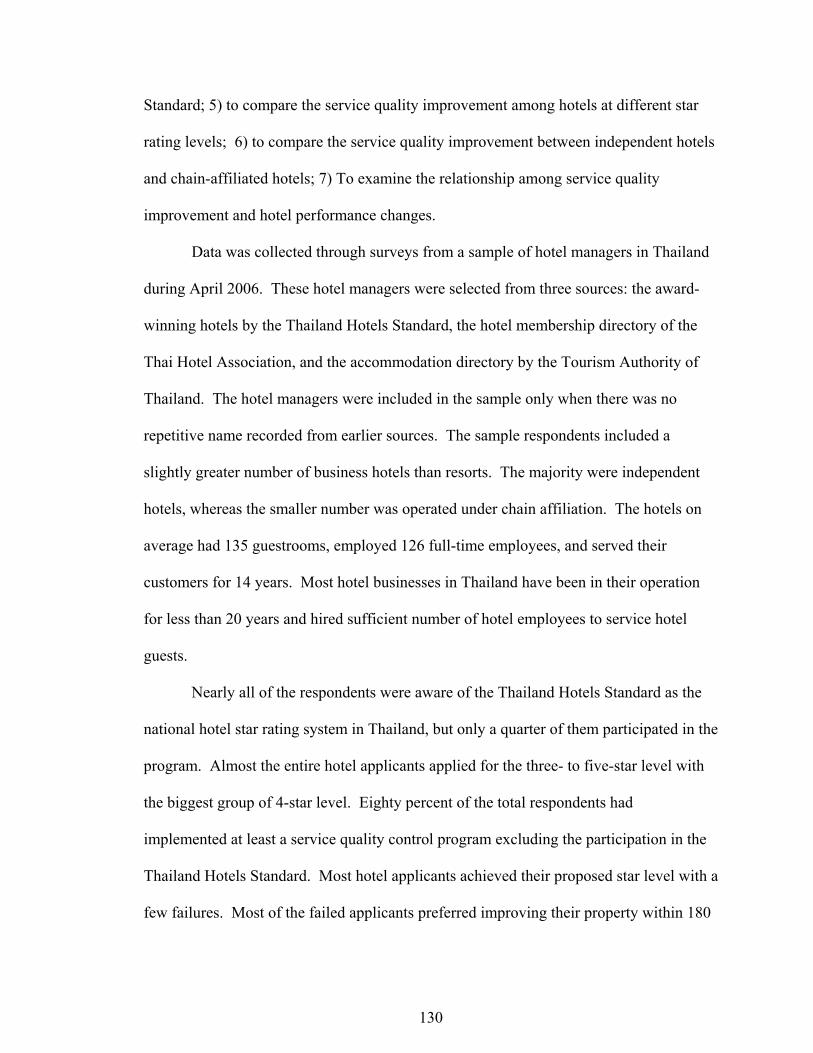
Standard; 5) to compare the service quality improvement among hotels at different star
rating levels; 6) to compare the service quality improvement between independent hotels
and chain-affiliated hotels; 7) To examine the relationship among service quality
improvement and hotel performance changes.
Data was collected through surveys from a sample of hotel managers in Thailand
during April 2006. These hotel managers were selected from three sources: the award-
winning hotels by the Thailand Hotels Standard, the hotel membership directory of the
Thai Hotel Association, and the accommodation directory by the Tourism Authority of
Thailand. The hotel managers were included in the sample only when there was no
repetitive name recorded from earlier sources. The sample respondents included a
slightly greater number of business hotels than resorts. The majority were independent
hotels, whereas the smaller number was operated under chain affiliation. The hotels on
average had 135 guestrooms, employed 126 full-time employees, and served their
customers for 14 years. Most hotel businesses in Thailand have been in their operation
for less than 20 years and hired sufficient number of hotel employees to service hotel
guests.
Nearly all of the respondents were aware of the Thailand Hotels Standard as the
national hotel star rating system in Thailand, but only a quarter of them participated in the
program. Almost the entire hotel applicants applied for the three- to five-star level with
the biggest group of 4-star level. Eighty percent of the total respondents had
implemented at least a service quality control program excluding the participation in the
Thailand Hotels Standard. Most hotel applicants achieved their proposed star level with a
few failures. Most of the failed applicants preferred improving their property within 180
130

days otherwise canceling the application of the current year, rather than accepting the
result of a lower star level. This information supports the fact most hotels sampled took
the initiatives to improve their service quality. Although many hotels had not yet applied
for the Thailand Hotels Standard, most of them indicated strong interest.
The hotel managers had fairly favorable perceptions of the influences of the
Thailand Hotels Standard on individual properties and the hotel industry in general. It
was found the hotels that applied for the star rating or certified with star rating agreed
more favorably with the importance of the hotel rating system. The participants valued
more benefits of the Thailand Hotels Standard at both the industry level and the property
level than the non-participants.
An exploration of the underlying constructs of improvement in hotel service
quality revealed four dimensions: service delivery, hotel employees, guest facilities and
surroundings, and prestige. These four dimensions represented the key interests Thai
hotels considered in making changes to be qualified for the evaluation of the proposed
star rating.
It was found there was no significant difference in the four dimensions consisting
of service delivery, hotel employees, guest facilities and surroundings, and prestige
among the star rating levels. In essence, it indicated that the hotels awarded different star
levels had made similar level of changes to improve their properties. The finding also
revealed that there was no significant difference in the four dimensions of service quality
improvement between chain-affiliated hotels and independent hotels. Correspondingly,
the independent hotels had made changes to improve their properties at an equal level to
the chain hotels indicating that despite the limitations of business administration, the
131

independent hotels had tried hard to be certified with the proposed star level as well as
the chain hotels that were more advantageous for business administration and capital
access (Vallen & Vallen, 2005).
Canonical correlation analysis discovered significant relationship between four
dimensions of service quality improvement and three measures of performance changes.
Two of the three canonical functions were significant. A relationship was found between
the improvements in service delivery, hotel employees, and guest facilities and
surroundings as independent variables and change in sales as a dependent variable.
Another strong relationship was also found between change in hotel employees and
change in guest facilities and surroundings as independent variables and all dependent
measures including change in occupancy, change in price, and change in sales. In
addition, change in sales and change in guest facilities and surroundings were important
for both two relationships.
IMPLICATIONS
Implications for the Foundation of Standard and Human Resources Development in
Service and Tourism Industry
As supported by hypothesis 1, there were significant differences in the perceived
influences of the Thailand Hotels Standard on the hotel industry as well as hotel
properties between the applicant hotels and the non-applicant hotels. It is suggested the
non-applicant hotels be educated on the importance of the hotel rating system toward the
hotel industry regarding the perceived influences of the hotel rating system toward
improving the quality of hotels in Thailand: providing standards for fair competition in
132
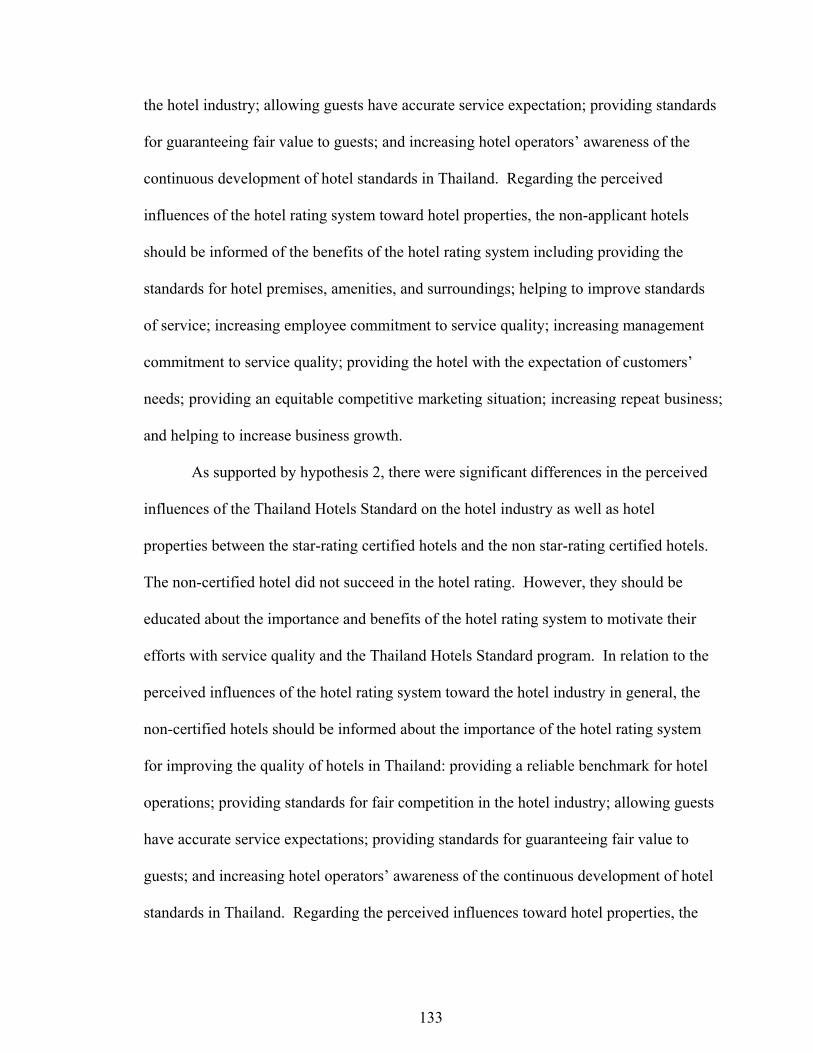
the hotel industry; allowing guests have accurate service expectation; providing standards
for guaranteeing fair value to guests; and increasing hotel operators’ awareness of the
continuous development of hotel standards in Thailand. Regarding the perceived
influences of the hotel rating system toward hotel properties, the non-applicant hotels
should be informed of the benefits of the hotel rating system including providing the
standards for hotel premises, amenities, and surroundings; helping to improve standards
of service; increasing employee commitment to service quality; increasing management
commitment to service quality; providing the hotel with the expectation of customers’
needs; providing an equitable competitive marketing situation; increasing repeat business;
and helping to increase business growth.
As supported by hypothesis 2, there were significant differences in the perceived
influences of the Thailand Hotels Standard on the hotel industry as well as hotel
properties between the star-rating certified hotels and the non star-rating certified hotels.
The non-certified hotel did not succeed in the hotel rating. However, they should be
educated about the importance and benefits of the hotel rating system to motivate their
efforts with service quality and the Thailand Hotels Standard program. In relation to the
perceived influences of the hotel rating system toward the hotel industry in general, the
non-certified hotels should be informed about the importance of the hotel rating system
for improving the quality of hotels in Thailand: providing a reliable benchmark for hotel
operations; providing standards for fair competition in the hotel industry; allowing guests
have accurate service expectations; providing standards for guaranteeing fair value to
guests; and increasing hotel operators’ awareness of the continuous development of hotel
standards in Thailand. Regarding the perceived influences toward hotel properties, the
133

non-certified hotels should also be alerted about the benefits of the hotel rating including
providing the standards for hotel premises, amenities, and surroundings; helping to
improve standards of service; increasing the value of products and services; increasing
hotel price levels; increasing employee commitment to service quality; increasing
management commitment to service quality; providing the hotel with the expectation of
customers’ needs; providing an equitable competitive marketing situation; increasing
repeat business; and helping to increase business growth.
As supported by hypothesis 3, there was no significant difference in the service
quality improvement among hotels at different star rating levels. It describes that hotels
from lower star levels improve their service quality as well as hotels from higher star
levels. The rationale is that service quality improvements in lower star rated hotels
attempts to comply with the same level of quality improvements such as service delivery,
hotel employees, guest facilities and surroundings, and prestige, with higher star rated
hotels. Therefore, it is recommended involvement with the Thailand Hotels Standard
would increase service quality regardless of a hotel’s star level. This suggests the
Thailand Hotels Standard motivate hotels in all star levels to take a serious movement
toward service quality improvement and to stimulate their involvement with the hotel
rating system. However, it is advantageous for the foundation to listen to the needs and
examine the perceived influences of the hotels from each star level regarding the criteria
used for evaluation and the method it administers. The examination of the hotel
managers’ perception from all star levels allows the foundation to realize their position
for strengths and weaknesses from the hotel operators’ perspectives. Ultimately, the
134

foundation is able to develop a strategy that meets the hotel industry’s situation and
future development.
As supported by hypothesis 4, there was no significant difference in the service
quality improvement between independent hotels and chain-affiliated hotels. It suggests
both chain and independent hotels believe that participation in the Thailand Hotels
Standard has improved their service quality. Hence, both independent hotels and chain
hotels should be encouraged for the service quality improvement in service delivery,
hotel employees, guest facilities and surroundings, and prestige to achieve star rating
certification by the Thailand Hotels Standard. Incidentally, the chain hotels are backed
by its parent company and have brand recognition, the best management talent,
economies of scale, access to capital, and expertise in site selection (Vallen & Vallen,
2005). The advantages of the chain hotels are far more competitive than the independent
hotels. Research of the WTO & IH&RA (2004) stated that the major international hotel
chains preferred classification by branding to hotel (star) ratings as branding provides
target customers, price tier, brand positioning, brand essence, customer value proposition,
and hotel benefits and features to facilitate hotel companies’ marketing strategy
development. Therefore, a recommendation regarding hotel companies’ branding is that
the Thailand Hotels Standard should offer star rating for brands of hotel chain companies
in addition to offer star rating for individual properties. This recommendation is made to
individualize the star rating for the hotel business and to enhance the hotel rating’s value
to the chain hotels.
The demographic profile of hotel respondents reported that most hotel
respondents were independently-operated hotels, either business hotels or resorts, small
135

to medium size, and operated less than 20 years. Specifically, eighty percent of the hotel
respondents were independent hotels. Fifty-five percent of the total was business hotels,
whereas the remaining percentage was resorts. About ninety percent were small and
medium sized hotels (53% small-sized hotels and 37% medium-sized hotels).
Approximately eighty four percent had been in their operation for less than 20 years
(45% operated within their first 10 years and 39% operated between the eleventh and
twentieth year). This information helps the Foundation for Standard and Human
Resource Development in Hospitality Industry or other relevant parties to encourage the
majority of hotels to participate in the hotel rating system. A consideration of these
small- and medium-sized independently-owned hotels’ entrepreneurship was capital
limitation (Vallen & Vallen, 2005). Therefore, these hotels must be guided to control and
manage their service quality with cost consciousness. Otherwise, the hotels may
disregard the participation in the Thailand Hotels Standard and could lead to failure in the
service quality improvement in this hotel group.
A number of hotels showed strong interests in the Thailand Hotels Standard and
its hotel rating system, although some had never applied for the hotel rating. This finding
suggests the Foundation for Standard and Human Resource Development in Hospitality
Industry and regional representatives should take a proactive role to promote and
encourage hotels and similar establishments to be part of the hotel rating system. For
example, the foundation may request the hotel interested in applying for the hotel rating
system to register for service quality improvement programs or workshops. The
registration signified a commitment in action, yet it does not require them to seek ratings
immediately or create apathy toward the hotel standard.
136

Additionally, the foundation should consider planning and promoting benefits and
incentives that are specifically designed for hotels at each star level, as hotels at each star
level have different characteristics, requirements, and constraints. The findings indicated
that the majority of hotel applicants applied for three- to five-star rating, while hotels at
one- and two-star levels showed little interest in getting involved in the system.
Although the one- and two-star hotels offer the limited services and quality to customers,
the customers still expect these hotels’ services to meet the minimum but acceptable
quality level. According to Dr. Suvit Yodmani, the Minister of the Ministry of Tourism
and Sports, the backpackers are considered quality tourists as they stay in the country
longer than other types of tourists. Their spending directly benefits the locals,
particularly small shops, bars, restaurants, and guesthouses. They also are more willing
to understand local people and cultures than tourists on a tour bus (Ross, 2007). With the
importance of the backpackers who normally stay at guest houses or small hotels, it is
worthy to focus on this accommodation sector to improve its service quality through
conforming the requirements of the appropriate star level of the Thailand Hotels Standard.
Thus, the foundation may consider working extensively to motivate this hotel sector to
seek star rated to guarantee a standard of its star level.
Furthermore, a recommendation is offered for allowing feedback from hotel
guests to the Foundation for Standard and Human Resource Development in the
Hospitality Industry for the guests’ experience with the star rated hotels and for
confirmation of their perception whether the hotels perform services corresponding to the
star quality level. Feedback allows the foundation to re-assess the hotels’ service quality
as well as the performance of the hotel rating system. In addition, the foundation is able
137

to know what the travelers’ expectations are and their perception toward the hotels’
quality in Thailand. This will lead to the development of more efficient strategies for the
hotel rating system and the trends of service quality in the Thai hotel industry. The
communication channel for hotel guests’ feedback may include a self-administered
service quality questionnaire or online survey, a self-administered service quality
questionnaire at the international airports, and a call center for the Thailand Hotels
Standard. It is similar to the guest satisfaction survey conducted by the Chinese hotel
rating system, which is a decisive element in the hotel rating (Qing and Liu, 1993). The
survey should be conducted by the hotel rating system’s staff not by the hotel staff.
According to Yu (1992) and Quin and Liu (1993), it is important that the criteria for
rating guest satisfaction is clear and has consistent scoring requirements. Further
recommendation is the Foundation for Standard and Human Resource Development in
Hospitality Industry provide incentives for hotel customers participating in the survey for
higher response rate in the survey data collection.
Implications for the hotel industry
As supported by hypothesis 5, there was a statistically significant relationship
between service quality improvement and hotel performance changes. Additionally, a
positive relationship was found between the set of service quality improvement
consisting of change in prestige, change in service delivery, and change in guest facilities
and surroundings and hotel performance change measured by change in sales. The
relationship implied that change in sales might be influenced by non-room revenues, as
hotel performances measured by average daily room rate and occupancy rate, which were
138

related to room sales, were not significant. The implication is that when hotels plan to
increase non-room revenues, the hotels should enhance prestige, improve service delivery,
and upgrade guest facilities and surroundings. First, the enhancement of prestige can be
obtained through winning international or domestic contests as well as having
opportunities to serve celebrities. Next, improvement in service delivery can be gained
by emphasizing departmental service production stage and the delivery stage is error-free.
Finally, upgrading guest facilities and surroundings can be made through redesign,
reconstruction, innovation, and physical expansion.
Additionally, the findings showed the relationship between the set of service
quality improvement consisting of change in hotel employees and change in guest
facilities and surroundings and the set of hotel performance changes comprising change
in occupancy, change in price, and change in sales. Meaning the improvement in hotel
employees’ quality and competency and the improvement in guest facilities and
surroundings should increase all three measures of hotel performance changes including
price, occupancy rate, and sales. This relationship suggests when hotels focus on
improving their hotels’ employees in addition to upgrading guest facilities and
surroundings; the hotels can expect greater hotel performance measures of room and non-
room services.
Based on the relationship found in the fifth hypothesis testing, hotel employees
and guest facilities and surroundings are the keys to hotel business’ performance.
Therefore, a recommendation for hotel businesses is in order to succeed in the application
for the hotel rating by the Thailand Hotels Standard, their hotel employees must first be
taken into consideration and then upgrade their guest facilities and surroundings.
139

Specifically, hotel employees should be well-qualified from recruitment and continue
professional training with work-knowledge and appropriate service manners. Upgrading
guest facilities and surroundings can be made through redesign, reconstruction,
innovation, and expansion. The improvements in these two factors are effective for the
application of star rating by the Thailand Hotels Standard and for the hotels’ performance
changes.
SUMMARY OF STRATEGIES
Based on the implications offered, strategies are summarized as following:
Motivate hotel businesses to seek star rating by the Thailand Hotels Standard
a. Provide service quality improvement program with cost consciousness to
small-medium sized and independent hotels.
b. Take a proactive role in reaching hotel establishments to be part of the
Thailand Hotels Standard.
c. Provide incentives for hotels’ participation with the Thailand Hotels Standard,
particularly one- and two-star hotels.
d. Allow feedback from hotel guests to the Foundation for Standard and Human
Resource Development in Hospitality Industry.
e. Educate the non-applicant hotels on the importance and benefits of the hotel
rating system toward the hotel industry as well as hotel properties.
f. Educate the non-certified hotels on the importance and benefits of the hotel
rating system toward the hotel industry as well as hotel properties.
140

g. Motivate hotels in all star levels to seriously make a movement toward service
quality improvement and to stimulate their involvement with the hotel rating
system.
h. Encourage both independent hotels and chain hotels for the service quality
improvement in service delivery, hotel employees, guest facilities and
surroundings, and prestige to achieve star rating certification by the Thailand
Hotels Standard.
i. Offer star rating for brands of hotel chain companies in addition to offer star
rating for individual properties.
Be certified with the star rating by the Thailand Hotels Standard
a. A hotel should enhance prestige, improve service delivery, and upgrade guest
facilities and surroundings for greater hotel performance changes on non-
room revenues.
b. A hotel should focus on improving their hotels’ employees plus upgrading
guest facilities and surroundings for greater hotel performance changes on
both room and non-room services.
LIMITATIONS
The application of this research’s findings acknowledges the limitations as
follows. First, sample prejudice may exist. The target population of the study referred to
all lodging establishments in Thailand. Among approximately 5,000 hotels and similar
establishments, only about 400 hotels registered with the Thai Hotel Association. The
majority of the accommodations consist of small hotels and guest houses. The contact
141

names were obtained by the name of each establishment without considering the number
of rooms on each property. The number of small and medium properties outweighs the
number of large properties. As a result, the perception from the hotel managers of the
small and medium-sized hotels might prevail over the perception from the hotel managers
of the large hotels.
Second, the target population size of star-awarded hotels is small. Because the
Thailand Hotels Standard has only been in operation for a few years, promoting the star
rating campaign throughout the entire country would not be feasible. Accordingly, it
limited the number of hotel applicants to participate in the hotel star rating scheme and
affected the response rate from this group.
Thirdly, non-response bias may affect the results of this study. As the period of
distributing the questionnaires was during the tourism high season in Thailand, the hotel
managers might have been too busy to complete the six-page questionnaire. As a result,
the response rate was low (20.5%).
Fourthly, measurement bias may occur. Since the questionnaire is the attribute-
based measurement, it is possible it may overlook some respondents’ quality perceptions
as mentioned by Stauss (1993). However, the attributes used in the questionnaire were
assumed to be valid as they were drawn from the well-established measurement of
SERVQUAL and the measurement of the Thailand Hotels Standard, which was well-
designed based on the internationally accepted hotel rating model.
Finally, mono-source bias may affect the study’s findings as data was collected
only from the hotel managers’ perspective, excluding customers and other related parties’
perspectives.
142

RECOMMENDATION FOR FUTURE WORK
Through in-depth interviews with hoteliers, future research is recommended to
identify hidden obstacles that inhibit hotels and similar establishments from participating
in the Thailand Hotels Standard. Some hotel managers expressed their concern that being
a star rated hotel would increase price and decrease the number of their repeat customers.
Theoretically, having a star rating will allow a hotel to increase the price of its services is
supported by this study. Conversely, why did some of the hoteliers still have the
perception that increasing price as a result of the hotel rating would lessen their repeat
customers? An in-depth interview can reveal covert facts so as to identify an effective
motivation for these hotel managers to be a part of the star rated hotels.
As the number of certified star-rating hotels is small due to the recent adoption of
Thailand Hotels Standard, future studies could have larger population of the certified
star-rating hotels. Replicating this study is suggested to examine if there is a different
result by a different period of time and the increasing number of the population. Indeed,
the retention of the star-level by awarded star-rating hotels is of special interest and
examination. How do the star rated hotels still keep the star level? How long will the
hotels be listed on the list of star rated hotels? Is it possible that some hotels will keep
their star rating for a while to have their hotel names widely recognized and then
discontinue their status in the Thailand Hotels Standard? Are there factors such as an
annual fee affecting the retention of hotels’ status in the Thailand Hotels Standard?
As mentioned previously, data collection of this study was conducted during
tourism high season in Thailand. Future researchers can try collecting data in low season
143
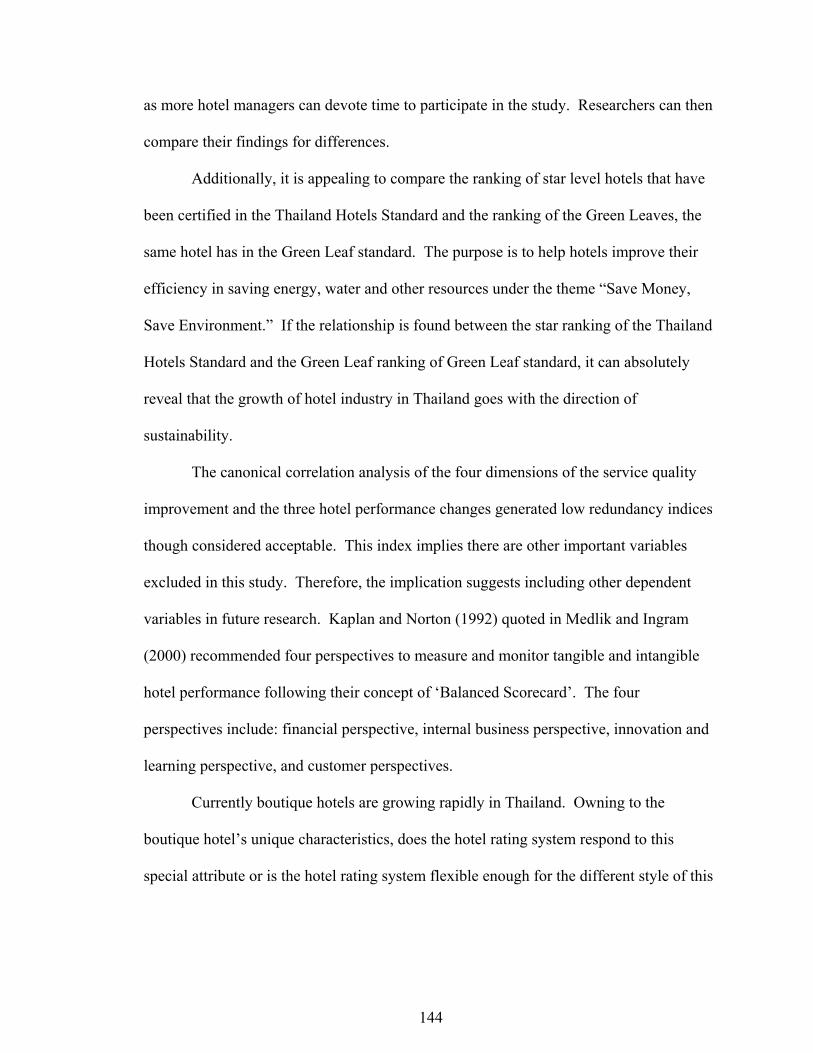
as more hotel managers can devote time to participate in the study. Researchers can then
compare their findings for differences.
Additionally, it is appealing to compare the ranking of star level hotels that have
been certified in the Thailand Hotels Standard and the ranking of the Green Leaves, the
same hotel has in the Green Leaf standard. The purpose is to help hotels improve their
efficiency in saving energy, water and other resources under the theme “Save Money,
Save Environment.” If the relationship is found between the star ranking of the Thailand
Hotels Standard and the Green Leaf ranking of Green Leaf standard, it can absolutely
reveal that the growth of hotel industry in Thailand goes with the direction of
sustainability.
The canonical correlation analysis of the four dimensions of the service quality
improvement and the three hotel performance changes generated low redundancy indices
though considered acceptable. This index implies there are other important variables
excluded in this study. Therefore, the implication suggests including other dependent
variables in future research. Kaplan and Norton (1992) quoted in Medlik and Ingram
(2000) recommended four perspectives to measure and monitor tangible and intangible
hotel performance following their concept of ‘Balanced Scorecard’. The four
perspectives include: financial perspective, internal business perspective, innovation and
learning perspective, and customer perspectives.
Currently boutique hotels are growing rapidly in Thailand. Owning to the
boutique hotel’s unique characteristics, does the hotel rating system respond to this
special attribute or is the hotel rating system flexible enough for the different style of this
144

hotel type? Therefore, a study to examine the effectiveness of the hotel rating system in
correspondence to the changing hotel industry structure is suggested.
Regarding the star rating users or hotel guests, future research should examine the
importance and role of the Thailand Hotels Standard plays in their perception of hotel
selection in the Thai tourism market. In addition, the difference between Thai customers
and foreign customers toward the use of star rating should be investigated. Thus, hotels
serving mainly Thai tourists and hotels serving primarily foreign tourists will be able to
make a decision to hold their rating status in the Thailand Hotels Standard and to apply
the star rating status in their marketing strategies. Finally, a future study should identify
how well the star rating system’s criteria reflects the criteria formed in the hotel
customers’ mind.
145

BIBLIOGRAPY
Angur, M. G., Nataraajan, R., & Jahera, J. S. Jr. (1999). Service quality in the banking
industry: an assessment in a developing economy. International Journal of Bank
Marketing, 17(3), 116-123.
Antony, J., Antony, F. J., & Ghosh, S. (2004). Evaluation service quality in a UK chain: a
case study. International Journal of Contemporary Hospitality Management,
16(6), 380-384.
Baloglu, S. & Uysal, M. (1996). Market segments of push and pull motivations: A
canonical correlation approach. International Journal of Contemporary
Hospitality Management, 8(3). pg 32.
Baloglu, S., Weaver, P., & McCleary, K. W. (1998). Overlapping product-benefit
segments in the lodging industry: A canonical correlation approach. International
Journal of Contemporary Hospitality Management, 10(4). 159-166.
Barbee, C. & Bott, V. (1991). Customer treatment as a mirror of employee treatment.
S.A.M. Advanced Management Journal, 56(2), 27-32.
Berger, F. & Vanger, R. (1986). Building your hospitality team. Cornell Hotel and
Restaurant Administration Quarterly, 26(4), 82-90.
Berry, L. L. (1980). Services marketing is different. Business, May-June.
146

Bowen, J. T. (1997). A market-driven approach to business development and service
improvement in the hospitality industry. International Journal of Contemporary
Hospitality Management, 9(7), 334-344.
Brady, M. K., Cronin, J. J., & Brand, R. R. (2002). Performance-only measurement of
service quality: A replication and extension. Journal of Business Research, 55,
17-31.
Brown, S. W. & Swartz, T. (1989). A gap analysis of professional service quality.
Journal of Marketing. 53(April), 92-98.
Buttle, F. (1996). SERVQUAL: review, critique, research agenda. European Journal of
Marketing, 30(1), 8-32.
Callan, R. J. (1989). Small country hotels and hotel award schemes as a measurement of
service quality. The Service Industries Journal, 9(2), 223-246.
Callan, R. J. (1992). Jersey’s hotel grading scheme: An idiosyncratic approach.
International Journal of Contemporary Hospitality Management, 4(3), 30-36.
Callan, R. J. (1993). An appraisal of UK hotel quality grading schemes. International
Journal of Contemporary Hospitality Management, 5(5), 10-18.
Callan, R. J. (1994). Statutory hotel registration and grading: A review. International
Journal of Contemporary Hospitality Management, 6(3), 11-17.
Callan, R. J. (1995). Hotel classification and grading schemes, a paradigm of utilization
and user characteristics. International Journal of Hospitality Management,
14(3/4), 271-283.
Cannon, D. F. (2002). Expanding paradigms in providing internal service. Managing
Service Quality, 12(2), 87-99.
147

Carman, J. M. (1990). Consumer perceptions of service quality: An assessment of the
SERVQUAL dimensions. Journal of Retailing, 66(1), 33-55.
Chen, J. S., Ekinci, Y., Riley, M., Yoon, Y., & Tjeflaat, S. (2001). What do Norwegians
think of US lodging services? International Journal of Contemporary Hospitality
Management, 13(6), 280-283.
Cheung, C. & Law, R. (1998). Hospitality service quality and the role of performance
appraisal. Managing Service Quality, 8(6), 402-406.
Churchill, G. A. & Brown, T. J. (2004). Basic Marketing Research (5th ed.). USA: South-
Western.
Collins Concise Dictionary of the English Language (3rd ed.). (1998). Great Britain:
Caledonian International Book Manufacturer.
Collins Concise Dictionary. (1998). London: HarperCollins Publishers.
Conway, H. (2004). United to make the grade. Travel Weekly, Retrieved November 17,
2004, from http://www.travelweekly.co.uk
Creelman, J. (1992). Word of mouth. Managing Service Quality, 2(5), 299-301.
Cronin, J. J. Jr. & Taylor, S. A. (1992). Measuring service quality: A reexamination and
extension. Journal of Marketing. 56(July), 55-68.
Cronin, J. J. Jr. & Taylor, S. A. (1994). SERVPERF versus SERVQUAL: Reconciling
performance-based and perceptions-minus-expectations measurement of service
quality. Journal of Marketing, 58(January), 125-131.
Daily, L. (2004). Making sense of hotel ratings. Retrieved November, 7, 2004, from
http://www.viamagazine.com/top_stories/articles/Hotel_Ratings04.asp
148

Davidson, M. C. G. (2003). Does organizational climate add to service quality in hotels?
International Journal of Contemporary Hospitality Management, 15(4/5), 206-
213.
Denburg, M. D. & Kleiner, B. H. (1993). How to provide excellent company customer
service. International Journal of Contemporary Hospitality Management, 5,(4),
iii-vi.
Douglas, L. & Connor, R. (2003). Attitudes to service quality—the expectation gap.
Nutrition and Food Science, 33(3/4), 165-172.
Ekinci, Y., & Riley, M. (1999). Measuring hotel quality: Back to basics. International
Journal of Contemporary Hospitality Management, 11(6), 287-293.
Enz, C. A. & Siguaw, J. A. (2000). Best practices in service quality. Cornell Hotel and
Restaurant Administration Quarterly, 41(5), 20-29.
Fernandez, M. C. L. & Bedia, A. M. S. (2004). Is the hotel classification system a good
indicator of hotel quality? An application in Spain. Tourism Management. 25,
771-775.
Gabbie, O. & O’Neill, M. A. (1996). SERVQUAL and the Northern Ireland hotel sector:
A comparative analysis – part 1. Managing Service Quality, 6(6), 25-32.
Garavan, T. N. (1997). Interpersonal skills training for quality service interactions.
Industrial and Commercial Training, 29(3), 70-77.
Garson, G. D. (2006). Canonical Correlation. Retrieved September 10, 2006, from
http://www2.chass.ncsu.edu/garson/PA765/canonic.htm
Garvin, D. A. (1988). Managing Quality: The Strategic and Competitive Edge. New
York, The Free Press.
149
Getty J. M. & Thompson, K. N. (1994). The relationship between quality, satisfaction,
and recommending behavior in lodging decisions. Journal of Hospitality &
Leisure Marketing, 2(3), 3-22.
Getty, J. M. & Getty, R. L. (2003). Lodging quality index (LQI): Assessing customers’
perceptions of quality delivery. International Journal of Contemporary
Hospitality Management, 15(2), 94-104.
Gronroos, C. (1990). Service management and marketing: Managing the moments of
truth in service competition. Lexington, MA: Lexington Books.
Gronroos, C. (1993). Quality comes to service. In E. E. Scheuing & W. F. Christopher
(Eds.). The Service Quality Handbook (pp. 17-24). New York, USA: AMACOM.
Grossman, D. (2004, March 8). Confusion is the star of hotel rating systems. USA today.
Retrieved September 12, 2004, from
http://www.usatoday.com/travel/columnist/grossman/2004-03-05-
grossman_x.htm.
Hair, J. F., Anderson, R. E., Tatham, R. L., & Black, W. C. (1998). Multivariate data
analysis (5th ed.). Upper Saddle River, New Jersey: Prentice Hall.
Haksever, C., Render, B., Russell, R. S., & Murdick, R. G. (2000). Service Management
and Operations (2nd ed.). New Jersey: Prentice Hall.
Haynes, P. & Fryer, G. (2000). Human resources, service quality and performance: a case
study. International Journal of Contemporary Hospitality Management, 12(4),
240-248.
Hoffman, K. D. & Bateson, J. E. G. (1997). Essentials of Services Marketing. USA:
Dryden Press.
150

Ingram, H. & Daskalakis, G. (1999). Measuring quality gaps in hotels: the case of Crete.
International Journal of Contemporary Hospitality Management. 11(1), 24-30.
Intarakomalyasut, N. (n.d.). Year-end 2001 Economic Review: Sept 11 blights dream of
tourist-led recovery. Retrieved September 23, 2004, from
http://bangkokpost.net/yearend2001/tourism.html
Israel, G. D. (June, 2003). Determining sample size. PEOD6, one of a series of the
Agricultural Education and Communication Department, Florida Cooperative
Extension Service, Institute of Food and Agricultural Sciences, University of
Florida. Retrieved January 16, 2006 from
http://edis.ifas.ufl.edu/BODY_PD006#FOOTNOTE_2
Israeli, A. A. & Uriely, N. (2000). The impact of star ratings and corporate affiliation on
hotel room prices in Israel. Tourism and Hospitality Research, 2(1), 27-36.
Knutson, B. J. (1988). Frequent travelers: Making them happy and bringing them back.
Cornell Hotel and Restaurant Administration Quarterly, 29(1), 83-87.
Knutson, B., Stevens, P., Wullaert, C., Patton, M., & Yokoyama, F. (1991). LODGSERV:
A service quality index for the lodging industry. Hospitality Research Journal,
14(2), 277-284.
Kozak, M. & Rimmington, M. (1988). Benchmarking: destination attractiveness and
small hospitality business performance. International Journal of Contemporary
Hospitality Management, 10(5), 184-188.
Lashley, C. (1995). Towards an understanding of employee empowerment in hospitality
services. International Journal of Contemporary Hospitality, 7(1), 27-32.
151

Lee, Y. L. & Hing, N. (1995). Measuring quality in restaurant operations: an application
of the SERVQUAL instrument. International Journal of Hospitality Management,
14(3-4), 293-310.
Lollar, C. (1990). The Hotel Rating Game. Travel and Leisure, 20(7), 64-67.
Lovelock, C. (2001). Services Marketing: People, Technology, Strategy (4th ed.). Upper
Saddle River, New Jersey: Prentice Hall.
Lovelock, C. H. (1981). Why marketing management needs to be different for services.
In Donnelly, J. and George, W. (Eds.). Marketing of Service). Chicaco, IL:
American Marketing.
Lovelock, C. H. (1991). Services Marketing (2nd ed.). Englewood Cliffs, New Jersey:
Prentice Hall.
Luk, S. T. K. (1997). An examination of the role of marketing culture in service quality.
International Journal of Contemporary Hospitality Management, 9(1), 13-20.
Maxwell, G. & Lyle, G. (2002). Strategic HRM and business performance in the Hilton
group. International Journal of Contemporary Hospitality Management, 14(5),
251-252.
Maxwell, G., McDougall, M. & Blair, S. (2000). Managing diversity in the hotel sector:
the emergence of a service quality opportunity. Managing Service Quality, 10(6),
367-373.
Medlik, S. & Ingram, H. (2000). The Business of Hotels. Great Britain: Butterworth-
Heinemann.
Mei, A. W. O., Dean, A. M., & White, C. J. (1999). Analysing service quality in the
hospitality industry. Managing Service Quality, 9(2), 136-143.
152

Ndhlovu, J. & Senguder, T. (2002). Gender and perception of service quality in the hotel
industry. Journal of American Academy of Business, 1(2), 301-307.
Nick, J. (1993). Quality management in the hospitality industry: Part 3-Recent
development. International Journal of Contemporary Hospitality Management,
5(1), 10-15.
O’Neill, M. (2001). Measuring service quality and customer satisfaction. In J.
Kandampully, C. Mok, & B. Sparks (Eds.), Service Quality Management in
Hospitality, Tourism, and Leisure (pp. 159-191). New York: Haworth Press.
O’Neill, M. A., Watson, H. & Mckenna, M. A. (1994). Service quality in the Northern
Ireland hospitality industry: A quality perspective. Managing Service Quality,
4(3), 36-42.
Olorunniwo, F. Hsu, M. K., & Udo, G. J. (2003). Operationalizing the service quality
construct: The case of the lodging industry. Services Marketing Quarterly, 24(4),
57.
Parasuraman, A., Zeithaml, V. A., & Berry, L. L. (1985). A conceptual model of service
quality and its implications for future research. Journal of Marketing, 49(Fall),
41-50.
Parasuraman, A., Zeithaml, V. A., & Berry, L.L. (1988). SERQUALSERVQUAL: A
multiple-item scale for measuring consumer perceptions of service quality.
Journal of Retailing, 64(1), 12-40.
Parasuraman, A., Zeithaml, V. A., & Berry, L.L. (1991). Refinement and reassessment of
the SERQUALSERVQUAL scale. Journal of Retailing, 67(4), 420-450.
153

Parasuraman, A., Zeithaml, V. A., & Berry, L.L. (1994). Reassessment of expectations as
a comparison standard in measuring service quality: Implications for further
research. Journal of Marketing, 58(January), 111-124.
Pedhazur, E. J. & Schmelkin, L. P. (1991). Measurement, Design, and Analysis: An
Integrated Approach. Hillsdale, New Jersey, Lawrence Erlbaum Associates.
Pleumarom, A. (1999). Foreign takeover of Thailand’s Tourism industry. Third World
Network Briefing Paper for CSD7. 2. Retrieved September 23, 2004, from
http://www.twnside.org.sg/title/takeover.htm
Qing, L. Z. & Liu, J. C. (1993). Assessment of the hotel rating system in China. Tourism
Management, 14(6), 440-452.
Quester, P. G. & Romaiuk, S. (1997). Service quality in the Australian advertising
industry: a methodological study. The Journal of Services Marketing, 11(3), 180-
192.
Randall, L. & Senior, M. (1992). Measuring quality in hospitality services. International
Journal of Contemporary Hospitality Management, 4(2), VI-VIII.
Randall, L. & Senior, M. (1994). A model for achieving quality in hospitality hotel
services. International Journal of Contemporary Hospitality Management, 6(12),
68-74.
Reisinger, Y. (2001a). Concepts of tourism, hospitality, and leisure services. In J.
Kandampully, C. Mok, & B. Sparks (Eds.), Service Quality Management in
Hospitality, Tourism, and Leisure (pp. 1-14). New York: Haworth Press.
154

Reisinger, Y. (2001b). Unique characteristics of tourism, hospitality, and leisure services.
In J. Kandampully, C. Mok, & B. Sparks (Eds.), Service Quality Management in
Hospitality, Tourism, and Leisure (pp. 15-49). New York: Haworth Press.
Ross, D. (2007, March 1). A case for backpackers. Bangkok post. Retrieved March 25,
2007, from http://www.bangkokpost.net
Ross, G. F. (1995). Interpersonal stress reactions and service quality responses among
hospitality industry employees. The Services Industries Journal, 15(3), 314-331.
Ross, G. F. (1996). Reception staff and the guest complaint: problem-solving response
styles among potential employees. International Journal of Contemporary
Hospitality Management, 8(3), 39-44.
Saleh, F. & Ryan, C. (1991). Analysing service quality in the hospitality industry using
the SERVQUAL model. The Service Industries Journal, 11(3), 324-345.
Schneider, M. (n.d.). Diethelm Travel’s Thailand Tourism Review 2003: Hotel
developments in full swing again. Retrieved October 14, 2004, from
http://www.bangkokpost.com/tourism2003/hotel.html
Sekaran, U. (2003). Research Methods for Business. India: John Wiley & Sons.
Shavelson, R. J. (1996). Statistical Reasoning for the Behavioral Sciences (3rd ed.). USA:
Pearson Customer Publishing.
Shaw, M. & Patterson, J. (1995). Management-development programs: A Canadian
perspective. Cornell Hotel and Restaurant Administration Quarterly, 36(1), 34-39.
Soutar, G. N. (2001). Service quality, customer satisfaction, and value: An examination
of their relationships. In J. Kandampully, C. Mok, & B. Sparks (Eds.), Service
155

Quality Management in Hospitality, Tourism, and Leisure (pp. 97-110). New
York: Haworth Press.
Southern, G. (1999). A systems approach to performance measurement in hospitality.
International Journal of Contemporary Hospitality Management, 11(7), 366-376.
Sritama, S. (2004, June 12). TAT: 20m tourists by 2008 [Electronic version]. The Nation.
Retrieved September 10, 2004, from http://www.nationmultimedia.com
Stauss, B. & Weinlich, B. (1997). Process-oriented measurement of service quality
applying the sequential incident technique. European Journal of Marketing, 31(1),
33-55.
Stauss, B. (1993). Using the critical incident technique in measuring and managing
service quality. In E. E. Scheuing & W. F. Christopher (Eds.). The Service Quality
Handbook (pp. 408-427). New York, USA: AMACOM.
Stevens, P., Knutson, B., & Patton, M. (1995). DINESERV: A tool for measuring service
quality in restaurants. Cornell Hotel and Restaurant Administration Quarterly,
36(2), 56-60.
Teas, R. K. (1993). Expectations, performance, evaluation, and consumers’ perception of
quality. Journal of Marketing, 57(October), 18-34.
Teas, R. K. (1994). Expectations as a comparison standard in measuring service quality:
An assessment of a reassessment. Journal of Marketing, 58(January), 132-139.
Thai Hotel Association (n.d.). Index of member hotels. Retrieved October 16, 2004, from
http://www.thaihotels.org/indexOfMember.asp
Thai Hotel Association (THA), Tourism Authority of Thailand (TAT), & Association of
Thai Travel Agents (ATTA). (n.d.). Thailand Hotels Standard. Bangkok.
156

Tourism Authority of Thailand [TAT], (2002). Accommodation Search. Retrieved
January 14, 2006 from
http://www.tat.or.th/thai/search_fromclass.php?search_type=4
Tourism Authority of Thailand [TAT], (2004a). International Tourist Arrivals by Country
of Residence. Tourism Statistics: International. Retrieved September 23, 2004
from http://www2.tat.or.th/stat/download/0103/res-1.xls
Tourism Authority of Thailand [TAT], (2004b). Situation 2003. Tourism Statistics.
Retrieved September 23, 2004 from
http://www2.tat.or.th/stat/web/static_index.php
Tourism Authority of Thailand [TAT], (n.d.a). Hotels and resorts in Thailand: New trends
and developments. A News room Special Report. Retrieved September 23, 2004
from http://www.tatnews.org/others/2200.asp
Tourism Authority of Thailand [TAT], (n.d.b). Launch of the “Thailand Hotels
Standard”: ‘Star Rating’ awarded to Thai hotels. Retrieved September 23, 2004
from http://www.tatnews.org/tourism_news/2134.asp
Tsang, N. & Qu, H. (2000). Service quality in China’s hotel industry: A perspective from
tourists and hotel management. International Journal of Contemporary
Hospitality Management, 12(5), 316-326.
Vallen, G. K. & Vallen, J. J. (2005). Check-in, Check-out: Managing hotel Operations
(7th ed.). New Jersy: Pearson Prentice Hall.
Wanted: Big spenders. (2004). Economic Review: Year-end 2003. Retrieved October 3,
2004, from http://www.bangkokpost.net/yearend2003/tourism2.html.
157

Webster, C. & Hung, L. C. (1994). Measuring service quality and promoting decentring.
The TQM Magazine, 6(5), 50-55.
Wisner, J. D., Corney, W. J. (1997). An empirical study of customer comment card
quality and design characteristics. International Journal of Contemporary
Hospitality Management, 9(3), 110.
World Tourism Organization (WTO) & International Hotel and Restaurant Association
(IH&RA). (2004, April). The Joint WTO & IH&RA Study on Hotel Classification.
Retrieved September 2, from http://www.world-
tourism.org/quality/E/events/conf_apr04/wtoihra_hcstudy.pdf
World Tourism Organization [WTO], (n.d.). Tourism Market Trends. Facts & Figures:
Information, Analysis, and Know-how. Retrieved October 14, 2004, from
http://www.world-tourism.org/facts/tmt.html
Worsfold, P. (1999). HRM, performance, commitment and service quality in the hotel
industry. International Journal of Contemporary Hospitality Management, 11(7),
340-348.
Wuest, B. S. (2001). Service quality concepts and dimensions pertinent to tourism,
hospitality, and leisure services. In J. Kandampully, C. Mok, & B. Sparks (Eds.),
Service Quality Management in Hospitality, Tourism, and Leisure (pp. 51-66).
New York: Haworth Press.
Yasin, M. M. & Zimmerer, T. W. (1995). The role of benchmarking in achieving
continuous service quality. International Journal of Contemporary Hospitality
Management, 7(4), 27-32.
158

159
Yu, L. (1992). Seeing Stars: China’s hotel-rating system. Cornell Hotel and Restaurant
Administration Quarterly, 33(5), 24-27).
Zeithaml, V. A. & Bitner, M. J. (1996). Services Marketing. New York: McGraw-Hill.
Zeithaml, V. A., Parasuraman, A., & Berry, L. L. (1985). Problems and Strategies in
Services Marketing. Journal of Marketing, 49(Spring), 33-46.

APPENDIX A WORLD’S TOP TOURISM EARNERS
Rank International Tourism Receipts (US$) Change (%) Market share Population 2002
Receipts per capita
2000 2001 2002 2001/2000 2002/2001 2002 (million) (US$) World 473 459 474 -2.9 3.2 100 6,228 76 1 United States 82.4 71.9 66.5 -12.8 -7.4 14.0 288 231 2 Spain 31.5 32.9 33.6 4.5 2.2 7.1 40 837 3 France 30.8 30.0 32.3 -2.5 7.8 6.8 60 539 4 Italy 27.5 25.8 26.9 -6.2 4.3 5.7 58 465 5 China 16.2 17.8 20.4 9.7 14.6 4.3 1,279 16 6 Germany 18.5 18.4 19.2 -0.3 4.0 4.0 82 233 7 United Kingdom 19.5 16.3 17.6 -16.7 8.0 3.7 60 294 8 Austria 9.9 10.1 11.2 1.9 11.1 2.4 8 1,375 9 Hong Kong (China) 7.9 8.3 10.1 5.0 22.2 2.1 7 1,385 10 Greece 9.2 9.4 9.7 2.4 3.1 2.1 11 915 160 11 Canada 10.8 10.8 9.7 -0.6 -10.0 2.0 32 304 12 Turkey 9.4 7.4 9.0 -21.7 22.0 1.9 67 134 13 Mexico 8.3 8.4 8.9 1.3 5.4 1.9 103 86 14 Australia 8.5 7.6 8.1 -9.8 6.1 1.7 20 414 15 Thailand 7.5 7.1 7.9 -5.5 11.7 1.7 64 124 16 Netherlands 7.2 6.7 7.7 -6.8 14.6 1.6 16 480 17 Switzerland 7.6 7.3 7.6 -3.5 4.4 1.6 7 1,045 18 Belgium 6.6 6.9 6.9 4.7 -0.2 1.5 10 671 19 Malaysia 4.6 6.4 6.8 39.7 6.4 1.4 23 299 20 Portugal 5.3 5.5 5.9 4.2 7.5 1.2 10 587 21 Denmark 4.0 4.6 5.8 13.9 25.8 1.2 5 1,078 22 Indonesia 5.7 5.4 -5.9 231 24 23 Republic of Korea 6.8 6.4 5.3 -6.4 -17.2 1.1 48 110 24 Singapore 6.0 5.1 4.9 -15.6 -2.9 1.0 4 1,108 25 Poland 6.1 4.8 4.5 -21.1 -6.5 0.9 39 117
Source: World Tourism Organization (WTO) (Data as collected by WTO September 2003)

APPENDIX B WORLD’S TOP TOURISM DESTINATIONS (ABSOLUTE NUMBERS)
Rank Series International Tourists Arrivals
(million) Change (%) Market
share Population
2002 Arrivals per 100
of 2000 2001 2002 2001/2000 2002/2001 2002 (million) Population World 687 684 703 -0.5 2.7 100 6,228 11 1. France TF 77.2 75.2 77.0 -2.6 2.4 11.0 60 129 2. Spain TF 47.9 50.1 51.7 4.6 3.3 7.4 40 129 3. United States TF 50.9 44.9 41.9 -11.9 -6.7 6.0 288 15 4. Italy TF 41.2 39.6 39.8 -3.9 0.6 5.7 58 69 5. China TF 31.2 33.2 36.8 6.2 11.0 5.2 1,279 3 6. United Kingdom VF 25.2 22.8 24.2 -9.4 5.9 3.4 60 40 7. Canada TF 19.6 19.7 20.1 0.3 1.9 2.9 32 63 8. Mexico TF 20.6 19.8 19.7 -4.0 -0.7 2.8 103 19 9. Austria TCE 18.0 18.2 18.6 1.1 2.4 2.6 8 228 10. Germany TCE 19.0 17.9 18.0 -6.9 0.6 2.6 82 22 11. Hong Kong (China) VF 13.1 13.7 16.6 5.1 20.7 2.4 7 227 12. Hungary VF/2 15.6 15.3 15.9 -1.5 3.5 2.3 10 158 13. Greece TF 13.1 14.1 14.2 7.3 0.9 2.0 11 133 14. Poland TF 17.4 15.0 14.0 -13.8 -6.8 2.0 39 36 15. Malaysia TF 10.2 12.8 13.3 25.0 4.0 1.9 23 59 16. Turkey TF 9.6 10.8 12.8 12.5 18.5 1.8 67 19 17. Portugal TF 12.1 12.2 11.7 0.6 -4.1 1.7 10 116 18. Thailand TF 9.6 10.1 10.9 5.8 7.3 1.5 64 17 19. Switzerland TF 11.0 10.8 10.0 -1.8 -7.4 1.4 7 137 20. Netherlands TCE 10.0 9.5 9.6 -5.0 1.0 1.4 16 60 21. Russian Federation TF 7.0 7.4 7.9 5.3 7.3 1.1 145 5 22. Saudi Arabia TF 6.6 6.7 7.5 2.1 11.7 1.1 24 32 23. Sweden CE/T 2.7 7.2 7.5 160.5 4.3 1.1 9 84 24. Singapore TF 6.9 6.7 7.0 -2.8 4.0 1.0 4 157 25. Croatia TCE 5.8 6.5 6.9 12.2 6.1 1.0 4 158
Source: World Tourism Organization (WTO) (Data as collected by WTO September 2003)
161

APPENDIX C WORLD’S TOP TOURISM DESTINATIONS BY NUMBER OF ROOMS
Rank Number of Rooms in Hotels and Similar Establishment (1000) Chang (%) Market Share
Average annual growth (%)
1990 1995 1998 1999 2000 2001 00/99 01/00 2001 90-00 95-01 World 12,718 14,753 16,224 16,605 17,,199 17,423 3.6 1.3 100 3.1 2.8 1. United States 3,066 3,500 3,900 3,900 4,100 4,200 5.1 2.4 24.1 2.9 3.1 2. Japan 1,412 1,540 1,570 1,580 1,574 1,572 -0.4 -0.1 9.0 1.1 0.3 3. Italy 938 944 950 956 966 976 1.1 1.0 5.6 0.3 0.5 4. Germany 776 833 869 877 885 1.0 0.9 5.1 2.2 5. China 294 486 765 889 948 816 6.6 -13.9 4.7 12.4 9.0 6. Spain 498 565 586 677 3.1 7. France 547 612 587 584 589 600 1.0 1.9 3.4 0.7 -0.3 8. United Kingdom 553 9. Mexico 334 370 397 420 422 452 0.5 7.2 2.6 2.4 3.4 10. Canada 280 330 359 367 2.4 2.1 4.6 11. Thailand 169 256 279 280 319 321 13.9 0.5 1.8 6.6 3.8 12. Greece 233 282 304 308 312 317 1.1 1.5 1.8 3.0 2.0 13. Austria 318 310 302 309 305 310 -1.4 1.8 1.8 -0.4 0.0 14. Indonesia 132 193 231 248 253 259 1.8 2.6 1.5 6.7 5.0 15. Australia 157 170 182 190 195 198 2.5 1.6 1.1 2.2 2.6 16. Russian Federation 206 214 194 188 17. Turkey 81 133 150 153 155 177 1.8 13.6 1.0 6.7 4.8 18. Argentina 109 112 162 162 166 168 2.3 1.2 1.0 4.3 7.0 19. Switzerland 147 144 141 141 141 141 0.1 -0.2 0.8 -0.4 -0.3 20. Malaysia 45 76 108 109 135 131 22.9 -2.8 0.8 11.6 9.4 21. Egypt 48 65 83 94 114 121 21.1 6.3 0.7 9.1 10.9 22. Peru 53 98 104 115 107 9.7 -6.9 0.6 8.0 23. Tunisia 58 81 92 96 99 103 2.9 4.1 0.6 5.4 4.1 24. Sweden 82 90 94 95 96 99 1.7 3.3 0.6 1.6 1.7 25. Portugal 79 90 95 95 98 99 2.4 1.4 0.6 2.1 1.6
Source: World Tourism Organization (WTO) (Data as collected by WTO September 2003)
162

APPENDIX D
PILOT TEST QUESTIONNAIRE
(ENGLISH)
163

164

165

166

167

168

169

APPENDIX E
PILOT TEST QUESTIONNAIRE
(THAI)
170

171

172

173

174

175

176

APPENDIX F
QUESTIONNAIRE
(ENLISH)
177

178

179

180
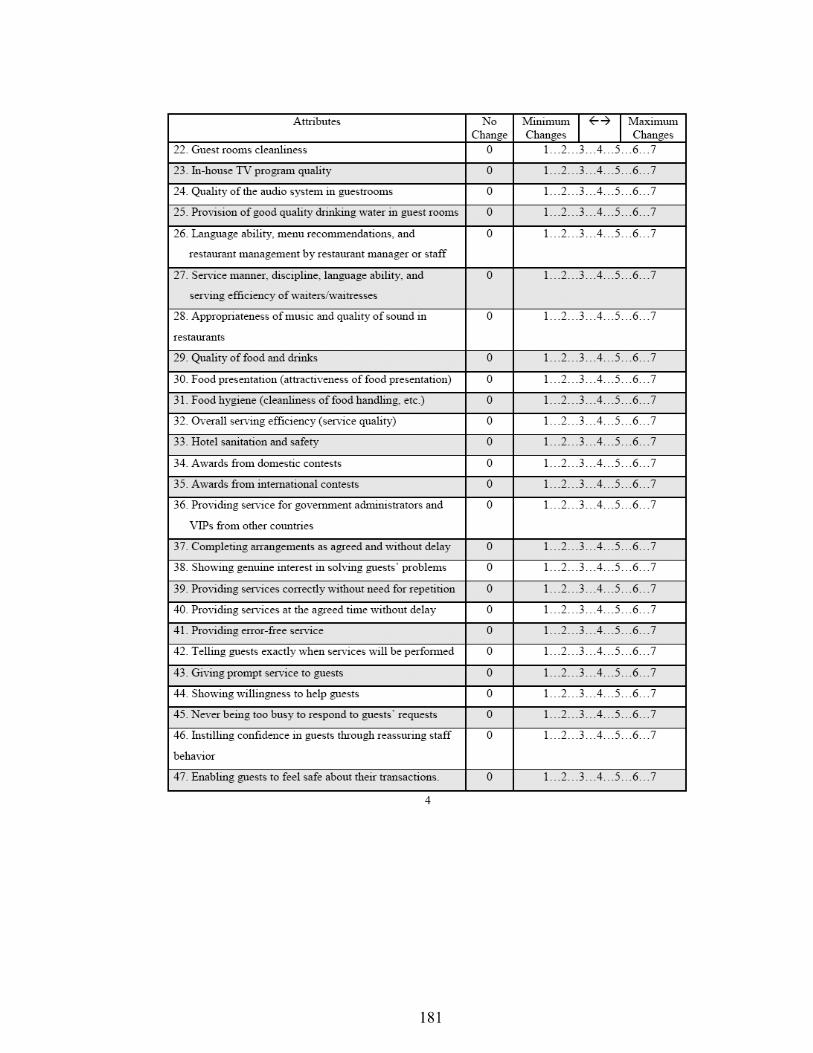
181

182
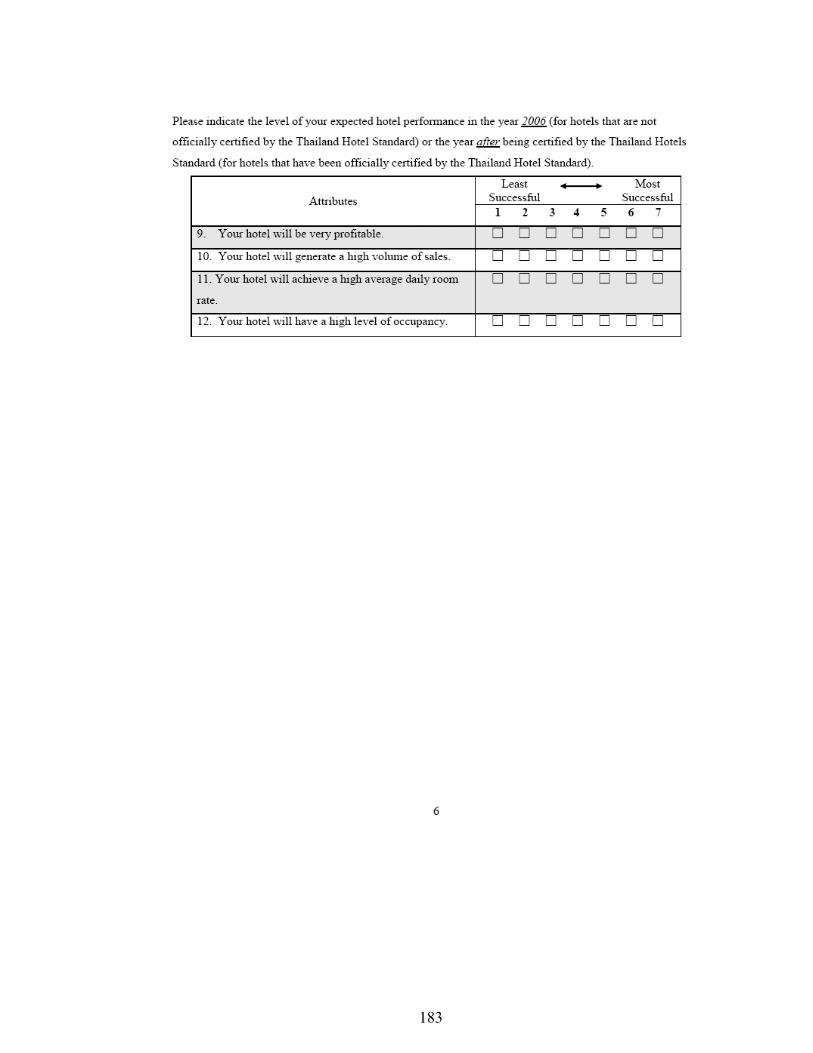
183

APPENDIX G
QUESTIONNAIRE
(THAI)
184

185

186

187

188

189
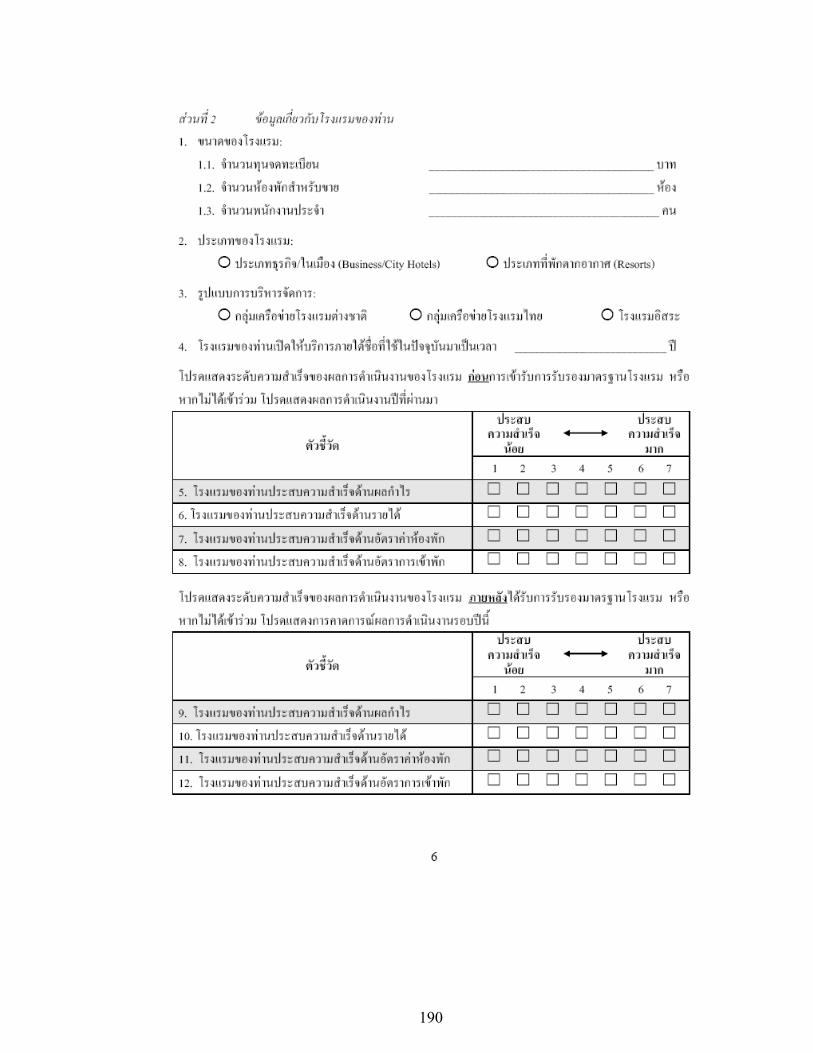
190

APPENDIX H
IRB APPROVAL
191

192

VITA
Yeamdao Narangajavana
Candidate for the Degree of
Doctoral of Philosophy
Dissertation: THE RELATIONSHIP OF THE HOTEL RATING SYSTEM AND SERVICE QUALITY: A CASE STUDY OF THE ‘THAILAND HOTELS STANDARD’
Major Field: Human Environmental Sciences Bibliographical: Education: Graduated from Samakkeevittayakom High School, Chiangrai,
Thailand 1993; received Bachelor of Business Administration degree in Hotel Management from Assumption University, Bangkok, Thailand, 1997. Completed the requirements for the Master of Art degree with a major in Tourism and Hospitality Management at Bournemouth University, Bournemouth, the United Kingdom, (September, 1999). Completed the Requirements for the Doctoral of Philosophy degree at Oklahoma State University in May, 2007.
Experience: Trainee in Reception and Reservation Division, Dusit Island Resort
Hotel, Thailand, 1997; Employed by Walailak University, Institute of Management as a lecturer, 1999 to present, as a Tourism Management Program Coordinator, 2000-2002, and as a Hotel Manager at Walailak Hospitality Center, 2000-2002.
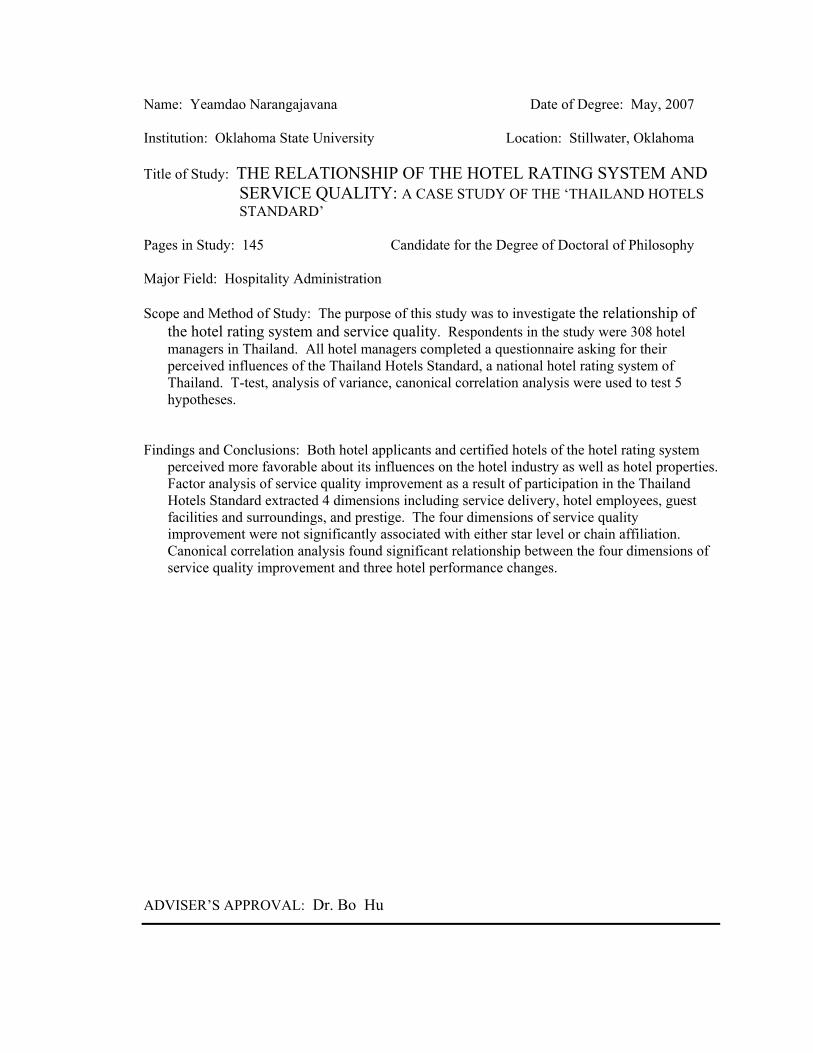
Name: Yeamdao Narangajavana Date of Degree: May, 2007
Institution: Oklahoma State University Location: Stillwater, Oklahoma
Title of Study: THE RELATIONSHIP OF THE HOTEL RATING SYSTEM AND SERVICE QUALITY: A CASE STUDY OF THE ‘THAILAND HOTELS STANDARD’
Pages in Study: 145 Candidate for the Degree of Doctoral of Philosophy
Major Field: Hospitality Administration
Scope and Method of Study: The purpose of this study was to investigate the relationship of the hotel rating system and service quality. Respondents in the study were 308 hotel managers in Thailand. All hotel managers completed a questionnaire asking for their perceived influences of the Thailand Hotels Standard, a national hotel rating system of Thailand. T-test, analysis of variance, canonical correlation analysis were used to test 5 hypotheses.
Findings and Conclusions: Both hotel applicants and certified hotels of the hotel rating system perceived more favorable about its influences on the hotel industry as well as hotel properties. Factor analysis of service quality improvement as a result of participation in the Thailand Hotels Standard extracted 4 dimensions including service delivery, hotel employees, guest facilities and surroundings, and prestige. The four dimensions of service quality improvement were not significantly associated with either star level or chain affiliation. Canonical correlation analysis found significant relationship between the four dimensions of service quality improvement and three hotel performance changes.
ADVISER’S APPROVAL: Dr. Bo Hu