investigation into the causes and possible remedies for
TRANSCRIPT

University of Southern Queensland
Faculty of Engineering and Surveying
Investigation into the causes and possible remedies
for the registered surveyor shortage in regional
Queensland.
A dissertation submitted by
Anthony Day
In fulfilment of the requirements of
Course ENG4111 AND 4112 Research Project
Towards the degree of
Bachelor of Spatial Science
Submitted: October 29, 2009
2
ABSTRACT
Aims: The aims of the research were to identify whether there is a shortage of
Surveyors in regional Queensland, the impacts of a Surveyor shortage, the
demographics of registered Surveyors and Spatial Science Students, the processes of
becoming a registered Surveyor and ways of increasing Surveyor numbers in
Regional Queensland.
Methodology: A literature review was conducted on the shortage of Surveyors in
regional Queensland and the process of becoming a registered Surveyor.
Professionals within the industry were also consulted on these matters. A
questionnaire was then designed to meet the aims of the research and distributed to
Spatial Science students studying at the University of Southern Queensland and
Queensland University of Technology online.
Outcomes and Benefits: There is a shortage of Surveyors in regional Queensland
that may have a substantial impact on the industry. Increasing enrollment numbers
through improved marketing to high school students has been identified as an
effective remedy to address Surveyor shortages.There are also ways of enticing
Spatial Science students into taking up positions in regional Queensland upon
graduation.

3
DISCLAIMER PAGE
University of Southern Queensland
Faculty of Engineering and Suverying
Limitations of Use
The Council of the University of Southern Queensland, its Faculty of Engineering and Surveying, and the
staff of the University of Southern Queensland, do not accept any responsibility for the truth, accuracy or
completeness of material contained within or associated with this dissertation.
Persons using all or any part of this material do so at their own risk, and not at the risk of the Council of
the University of Southern Queensland, its Faculty of Engineering and Surveying or the staff of the
University of Southern Queensland.
This dissertation reports an educational exercise and has no purpose or validity beyond this exercise. The
sole purpose of the course “Project and Dissertation” is to contribute to the overall education within the
student’s chosen degree programme. This document, the associated hardware, software, drawings, and
other material set out in the associated appendices should not be used for any other purpose; if they are so
used, it is entirely at the risk of the user
Professor Frank Bullen
Dean
Faculty of Engineering and Surveying
ENG4111 Research Project Part 1 &
ENG4112 Research Project Part 2
4
CANDIDATES CERTIFICATION
I certify that the ideas, designs and experimental work, results, analysis and
conclusions set out in this dissertation are entirely my own efforts, except where
otherwise indicated and acknowledged.
I further certify that the work is original and has not been previously submitted for
assessment in any other course or institution, except where specifically stated.
Anthony James Day
Student Number: 0050055183
Anthony James Day date: 29/10/2009

5
ACKNOWLEDGEMENTS
This research was carried out under the principle supervision of Mr Shane Simmons.
I thank him for his continued guidance throughout the course of the research.
Thank you to the surveying students of the University of Southern Queensland and
Queensland University of Technology for taking the time to complete the questionnaire.
Their input was vital to the research and is greatly appreciated.
Special thanks also go to Peter Murphy, Tom Williams and Ged Welsh for their time
and support given towards this research
6
TABLE OF CONTENTS
Contents Page
ABSTRACT 2
CANDIDATES CERTIFICATION 4
ACKNOWLEDGEMENTS 5
LIST OF FIGURES 8
LIST OF TABLES 8
LIST OF APPENDICES 69
CHAPTER 1 - INTRODUCTION
1.1 Project Topic 10
1.2 Project Aim 10
1.3 Project Background 10
1.4 Research Objectives 11
1.5 Definition of Regional Queensland 12
1.6 Conclusions: Chapter 1 12
CHAPTER 2 - LITERATURE REVIEW 2.1 Introduction 13
2.2 Registration Process 13
2.3 The Impact of the Latest Mining Boom 19
2.4 Job Recruitment 20
2.5 Graduate Recruitment 21
2.6 Movement of Youth Toward Cities 22
2.7 Technological Advances in Surveying 23
2.8 Registered Surveyor Demographic 26
2.9 Changes in Economic Conditions Throughout 2008-2009 28
2.10 Women in Spatial Science 29
2.11 Graduate Numbers from Queensland Universities 30
2.12 Marketing of Surveying as a Career 30
7
2.13 Shortage of Surveyors across Australia 32
2.14 Impact of a Surveyor Shortage 32
2.15 Conclusion 33
CHAPTER 3 - METHODOLOGY 3.1 Methodology 35
3.2 Assumptions 35
3.3 Questionnaire 35
3. Constraints 36
CHAPTER 4 – QUESTIONNAIRE FINDINGS AND ANALYSIS
4.1 Respondents 37
4.2 Gender 37
4.3 University, Study Mode and Stage of Course Completion 38
4.4 Rating of Job Prospects Upon Graduation 39
4.5 Reasons for Enrolling in a Surveying Course at University 40
4.6 Student Employment 42
4.7 Skills, Personal Attributes and Employability 46
4.8 Student Demographics 49
4.9 Student Employment Expectations 51
CHAPTER 5 – CONCLUSION AND RECOMMENDATIONS
5.1 Key Findings 61
5.2 Increasing Enrolment Rates 62
5.3 Attracting Graduates to Regional Areas 64
5.4 Conclusion 65
List of References 66
APPENDICES
Specification 67 Questionnaire 68
8
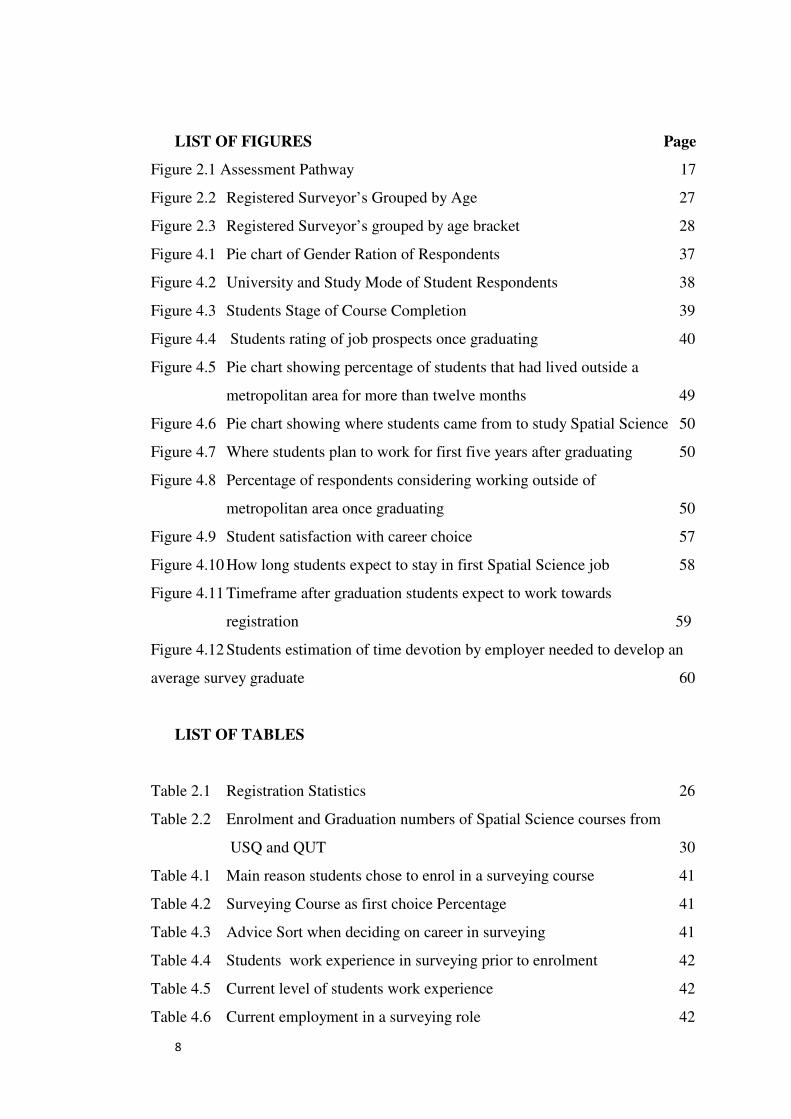
LIST OF FIGURES Page
Figure 2.1 Assessment Pathway 17
Figure 2.2 Registered Surveyor’s Grouped by Age 27
Figure 2.3 Registered Surveyor’s grouped by age bracket 28
Figure 4.1 Pie chart of Gender Ration of Respondents 37
Figure 4.2 University and Study Mode of Student Respondents 38
Figure 4.3 Students Stage of Course Completion 39
Figure 4.4 Students rating of job prospects once graduating 40
Figure 4.5 Pie chart showing percentage of students that had lived outside a
metropolitan area for more than twelve months 49
Figure 4.6 Pie chart showing where students came from to study Spatial Science 50
Figure 4.7 Where students plan to work for first five years after graduating 50
Figure 4.8 Percentage of respondents considering working outside of
metropolitan area once graduating 50
Figure 4.9 Student satisfaction with career choice 57
Figure 4.10 How long students expect to stay in first Spatial Science job 58
Figure 4.11 Timeframe after graduation students expect to work towards
registration 59
Figure 4.12 Students estimation of time devotion by employer needed to develop an
average survey graduate 60
LIST OF TABLES
Table 2.1 Registration Statistics 26
Table 2.2 Enrolment and Graduation numbers of Spatial Science courses from
USQ and QUT 30
Table 4.1 Main reason students chose to enrol in a surveying course 41
Table 4.2 Surveying Course as first choice Percentage 41
Table 4.3 Advice Sort when deciding on career in surveying 41
Table 4.4 Students work experience in surveying prior to enrolment 42
Table 4.5 Current level of students work experience 42
Table 4.6 Current employment in a surveying role 42

9
Table 4.7 Likelihood of continuing with this firm 43
Table 4.8 Employer offered concession to facilitate study 43
Table 4.9 Feasible and helpful concessions employers could offer 44
Table 4.10 Survey work planned in first five years after graduation 45
Table 4.11 Survey work planned for majority of career 45
Table 4.12 Rating of importance of skills and personal attribute to employers of
university graduates 46
Table 4.13 Rating of own employability skills at this time 48
Table 4.14 Rating of factors that influence when searching for work 52
Table 4.15 Factors that influence the decision making process 53
Table 4.16 Rating expectations of working life in students ideal job 55
Table 4.17 Students preference of salary versus work opportunities and conditions 56
Table 4.18 Change in student’s expectations since enrolling 57
Table 4.19 Industry incentives that could have tempted students to study alternative
course 58

10
CHAPTER 1
INTRODUCTION
1.1 Project Topic Investigation into the cause and possible remedies for the registered
surveyor shortage in regional Queensland
1.2 Project Aim
The aim of the project is to investigate the current shortage of endorsed surveyors in
regional Queensland; the implications of the skills shortage and the outlook for the
future of endorsed surveyor numbers.
1.3 Project Background
The role of professional surveyors throughout Australia encompasses many
facets of the construction, mining, gas, exploration and land development industries as
well as mapping, GIS and land boundary surveys.
According to the Surveyors Board of Queensland, there is only a total of 1482
registered persons (including corporations) as of 30 June 2007, while QLD has a
population above 4.2 million (Surveyors Board of Queensland 2007a, p.7). The
relatively small number of professionals means that job and salary surveys often
overlook the surveying industry as an individual entity. The wide variety of work that
Surveyor’s conduct also makes research data difficult to conduct and representing
meaningful statistics is complex (Welsh, G 2008, pers. comm., 8 July).
Little research can be found about the numbers of Surveyors needed to service
Queenslands mining, engineering and cadastral survey needs or the outlook of Surveyor
numbers for the future. Due to the small number of Surveyors, it is hard to gauge in real
terms whether areas throughout Queensland have Surveyor shortages.
With a small workforce, large infrastructure and mining projects can place short-
term stress on surveying businesses. Manager of the Townsville branch of Brazier Motti
Surveyors, Peter Murphy states that “Businesses find it difficult to gauge how long
11
construction booms will last; therefore in times of rapid growth find it difficult to offer
long-term employment to Surveyor employees without running the risk of over
expanding” (Murphy, PJ 2008, pers. comm., 14 June).
The volume of Surveyor work statewide can be closely linked with the economic
growth throughout the state. Booms in mining, construction and infrastructure all
require Surveyors with experience and expertise (Murphy, PJ 2008, pers. comm., 14
June). Townsville Hays Recruitment manager, Ged Welsh (2008, pers. Comm., 8 July)
states that “Due to this close relationship a link between similar occupations that
surveyors directly associate with such as town/urban planners, project managers and
civil engineers can be used to gain a larger pool of data to analyse job and salary
statistics” .)
1.4 Research Objectives
The construct of this research comprised of identifying if there really is a surveying
shortage in regional Queensland. Through conversations with a number of consulting
Surveyors and job recruitment agencies it was concluded that there is indeed a
substantial shortfall. Many also made generalisations about the aging of registered
Surveyors and all commented that they had not seen any concrete statistics to back this
up.
Surveying businesses in regional areas have also had great difficulty in filling
graduate positions within their organisations. Competition with the large salaries and
attractive fly in/fly out rosters offered by mining companies has made recruitment of the
limited number of graduates even more difficult (Murphy, PJ 2008, pers. comm., 14
June).

12
The aim of this research is to determine:
• how profound the professional skills shortages in regional areas are
• the demographic profile of surveyors with endorsements in Queensland
• the implications of a Surveyor shortage
• what job incentives induce university graduates when looking for
employment
• whether Spatial Science students are willing to work in regional areas
• strategies for businesses to attract university graduates to regional areas and
• strategies for increasing enrollment numbers in surveying courses
The project also aims to outline the registration process for surveyors in Queensland.
1.5 Definition of Regional Queensland
For the purpose of the dissertation, the term, regional Queensland, is defined as
those areas 300km or further outside of Brisbane. This area has been intentionally
defined to exclude Toowoomba in this research. This is due to survey students residing
there to undertake their degree at The University of Southern Queensland (USQ).
1.6 Conclusions: Chapter 1
This dissertation aims to highlight the extent of the skills shortage in regional
Queensland with emphasis on the surveying industry. The research is expected to result
in recommendations and remedies to address the Surveyor shortage in regional
Queensland. A review of the literature for this research will also identify the tertiary
education and registration process for surveyors in Queensland.
13
CHAPTER 2
LITERATURE REVIEW
2.1 Introduction
This chapter will review the literature to establish the need for research into the
shortage of registered Surveyors in Regional Queensland.
2.2 Registration Process
The Surveyors Act 2003, is the governing legislation that deals with upholding
standards in the surveying industry to protect the public. The Surveyors Act 2003, s3,
(Queensland Government 2003, pp. 11-12) states:
“(1) The purposes of this Act are—
(a) to protect the public by ensuring surveys are carried out
by registrants in a professional and competent way; and
(b) to uphold the standards of practice within the
profession; and
(c) to maintain public confidence in the profession.
(2) The purposes are to be achieved mainly by—
(a) establishing the Surveyors Board of Queensland; and
(b) providing for the registration of persons under this Act;
and
(c) imposing obligations on persons in relation to the
practice of the profession;”
Surveyor’s have an individual responsibility to maintain the integrity of the industry
by practising ethically and professionally to maintain public confidence in the profession
and ultimately public confidence in property rights. The Surveyors Board of
Queensland, has been established to govern the registration and obligations of surveyors
and to act as a link between the community and Surveyors (Queensland Government
2003).

14
The introduction of the Surveyors Act 2003, required the Surveyors Board of
Queensland to introduce a competency based assessment system. The Surveyors Act
2003 s9, (Queensland Government 2003, p.13). states that the board has the following
functions:
“(a) to establish competency frameworks for qualifying
persons for registration and registration endorsements;
(b) to accredit entities for assessing the competency of
persons under the competency frameworks;
(c) to assess applicants for registration and registration
endorsements;
(d) to register persons and issue registration certificates;
(e) to keep a register of registrants;”
Surveyors Act 2003 s39 also discusses the requirements of the Surveyors Board in
relation to competency based assessment, it states that:
“(1) The board must establish the competency frameworks
appropriate for the qualifications, skills, knowledge and
experience needed for—
(a) registration as a surveyor, surveying graduate or
surveying associate; or
(b) a registration endorsement.
(2) In establishing a competency framework, the board must
consult with the entities considered by the board as having
appropriate knowledge and experience in the relevant type of
surveying.
(3) A competency framework is a statutory instrument, but is not
Subordinate legislation” (Queensland Government 2003, p. 27).

15
The Surveyors Board of Queensland has developed the relevant competency
framework specifying the required qualifications, skills, knowledge and experience for
registration or endorsement. There are three different categories for which the Board
offers registration:
• Registration as a surveying associate
• Registration as a surveying graduate
• Registration as a surveyor, including endorsement on that registration
(Queensland Government 2003, p. 25).
The Surveyors Act 2003 (Queensland Government 2003, p. 103).Schedule
Dictionary states “competency means the qualifications, skills, knowledge and
experience for—
(a) Registration as a surveyor, surveying graduate or
Surveying associate; or
(b) a registration endorsement.”
It is a requirement that all competency frameworks are made available on the
Surveyor’s Board website. The role of the assessment process is to examine the
applicant against the competency framework appropriate to the registration that is
sought. Competency assessment is evidence collected from workplace performance and
is assessed against a competency framework (Campbell 2007, pp. 2-13).
The Surveyor’s Board assessment process typically consists of three stages. The
applicant must first provide documentary evidence, then completion of the Professional
Assessment Project; followed by a panel interview (Campbell 2007, p. 2).
Documentary evidence is used to demonstrate applicants qualifications, skills,
knowledge and experience that satisfy the framework standards. Fortunately,
Queensland universities provide degrees that have been mapped against the competency
framework. Applicants with degrees from other states and overseas need to provide
certified copies of academic records and evidence of all individual subjects to
demonstrate knowledge and skills that have been obtained to satisfy the framework
(Campbell 2007, pp. 8-9).

16
The professional assessment project is an opportunity for the applicant to display
their competencies while being observed by the assessor (Campbell 2007, p,11). The
project should be based around work that the applicant undertakes regularly for the
business or authority that the applicant is employed. An external assessor assesses the
applicant’s performance and competency in ethical/professional, administrative and
technical matters on behalf of the board (Campbell 2007, pp. 2-12). Figure 1 is taken
from Campbell (2007, p. 10)shows the assessment pathway during the registration
Process.

17
Figure 1: Assessment Pathway
(Campbell 2007, p. 10)

18
2.3 The Impact of the Latest Mining Boom
The unprecedented mining and construction boom Queensland has experienced over
the last 10 years has lead to a building of large skills shortages across many industries.
Colliers International research director, Rory McLeod (2008), estimates that “there are
$9 billion worth of mining and energy exploration projects in progress around the state”
as of October 2008.
The majority of these projects are spread throughout regional Queensland. All stages
of this development require direct surveying expertise. Through staking out and locating
exploration sites, surveying mining leases, development of mining infrastructure and
then the following daily operation of mines. (Jay, P 2008, pers. comm., 19 September)
Upgrades of rail and road networks and port infrastructure have been key elements
necessary for the growth of mining exports for Australia. Major projects include the
$190 million Townsville Port Access Road Project currently under construction; the
X21, X25 and X50 expansion of Abbot Point Coal terminal running from 2007 until
December 2010 and the expansion of the Dalrymple Bay coal terminal to 85 million
tonnes per annum. The Dalrymple Bay Coal Terminal facility exports coal from over 20
of Queensland’s Coal mines such as Blair Athol, Oaky Creek, Burton, Moranbah and
Peak Downs. (Queensland Government a n.d.)
Queensland also has several large refineries that require surveyor expertise for
upgrades and development such as Yabulu Nickel Refinery, Xstrata Copper refinery and
Sun Metals Zinc refinery in Townsville and the Boyne Smelters, the Yarwun refinery,
and Queensland Alumina refinery in Gladstone. (Queensland Government a n.d.)
Some of the indirect consequences of the mining boom have been the rapid expansion of
regional towns in boom areas (Queensland Government b n.d.). Development of
sustainable infrastructure to accommodate the influx of residents has been restricted due
to inflexibility in Council planning schemes and the lack of land development
professionals in regional areas to service the community’s needs. Shortages of vacant
land and service providers have lead to huge inflation of property prices in towns such
as Moranbah, Collinsville, Mackay and Townsville. (Wilson, P 2009, pers. comm.,
March 31)

19
The lack of skilled land development professionals has had real social impact on
regional towns engulfed by the mining boom. (Wilson, P 2009, pers. comm., March 31)
The social impact of mining booms on regional towns has been so severe the
Queensland Government has developed the Mining Town Sustainable Growth
Management Framework. The impacts include dramatically increased costs of living,
housing shortages and stressed services and facilities such as health care. This
framework “will support local governments, state agencies, mining companies and
communities to undertake a process to develop strategies to address the impacts of the
'boom and bust' cycles.” (Queensland Government b n.d.)
2.4 Job Recruitment
Hays 2007 salary survey has indicated that engineers and construction professionals
are still being enticed by big dollars offered in the mining industry. The Hays survey
also notes “a drain of good talent to the resource sector as well as to Dubai, the UK and
Asia” (Hays 2007, p. 98). Consequently, there have been large salary increases during
2006-2007 in the resource rich states of Queensland and Western Australia. Regional
areas are seeing a large skills shortage that is leading to large salary increases in order to
entice professionals to the area. Hays (2007, p. 98) report stated “Townsville, a highly
resource rich region, experienced solid rises with many salaries now on par with those in
South East Queensland”.
Across the construction and property sector in Queensland, the volume of
infrastructure and building work was high. The Hays (2007, p. 98) survey reports that
“vacancy activity was high and reports of four or five job offers per candidate were not
uncommon.” This phenomenon is somewhat typical of the surveying industry. The
number of surveying jobs offered through Hays Recruitment over the past four years has
grown significantly without marked improvement in market share. In 2005, 111
positions were filled, in 2006, 157, in 2007, 396 and to 30 April 2008, 141 positions
have been filled (Welsh, G 2008, pers. comm., 8 July).
The Salary Survey reports Surveyors in Queensland working in metalliferous mines
can expect salaries from $85,000 up to $130,000 for Chief Surveyors, excluding
20
superannuation and additional benefits. Surveyors working in the coal industry earn
$80,000-110,000 excluding superannuation and benefits (Hays 2007, pp. 112-114).
2.5 Graduate Recruitment
Cadastral and construction surveying firms in regional areas can find themselves in
direct competition with mining companies when seeking to recruit graduate Spatial
Science students. Major mining companies such as Rio Tinto, BHP, Barrick and Thiess
all offer vacation work for university students and 2 year graduate programs.
Government departments and private surveying firms can find competing for the limited
number of university graduates very difficult. This can be attributed to graduates being
offered attractive fly in/ fly out work rosters and large salary packages working in the
mining environment. (Welsh, G 2008, pers. comm., 8 July)
Attracting university graduates to apply for jobs in regional areas can be difficult. Of
those that apply, many are offered multiple jobs in their local area close to the
universities that they have studied at. Ged Welsh states “We find attracting graduates
that are willing to move away from South East Queensland very difficult.” (Welsh, G
2008, pers. comm., 8 July) It is almost impossible for private businesses to compete
with mining companies on salary; however we can work harder to demonstrate quality
career paths, lifestyle and job satisfaction benefits. (Murphy, PJ 2008, pers. comm., 14
June)
Mining companies such as Barrick Gold, seek surveyors with some mining
experience, but most with 1 to 2 years experience can fulfill the majority of the day to
day survey requirements in both underground and open cut mining operations. The
majority of survey set-out is a one man operation, though training graduates can be used
to speed up any survey set-out and pickup while eliminating safety risks of working
alone. Osborne Mine manager Phil Jay states, “The cost of training graduates in the
mining environment can be offset through productivity gains in the department. After a
couple of months, survey graduates can also be used to cover short term staff shortages
due to illness and annual leave as long as a senior surveyor can review their work on
change over days” (Jay, P 2008, pers. comm., 19 September).

21
2.6 Movement of Youth Towards Cities
There are only two universities in Queensland where Spatial Science can be studied,
USQ and Queensland University of Technology (QUT). They are both located in south
east Queensland. One of these, USQ, does offer an external study option.
This project research aims to identify where students originate from before they start
their study and where they plan to start fulltime employment once graduating. The
report by Hillman and Rothman (2007) “Longitudinal Survey of Australian Youth”
focuses on a group of young people living in non-metropolitan areas as they finish
secondary school and prepare for further education, training and employment. The
“Longitudinal Survey of Australian Youth” aimed to identify the influences that entice
young people to move to metropolitan areas such as:
• access to education and subsequent employment
• opportunity to assert their independence
• meet new people and gain new experiences
The report suggests that leaving these areas for education and employment is not a
spontaneous one; rather it is a decision that it is “developed over a period of time and
within the context of other decisions about one’s future, including educational and
occupational aspirations and expectations” (Hillman & Rothman 2007, p.22). The report
found that pursuing educational opportunities was a significant influence on the
likelihood that a young person would relocate to major cities.
This research project aims to identify if young people are leaving regional areas to
study a Spatial Science course in Brisbane or Toowoomba, study for four years; and if
they are then willing to uproot again and return to a regional area. If so, how much
incentive do they need to relocate again and what career goals are they hoping to
achieve.
Many students studying fulltime also work concurrently in a surveying role. Often
they start as a chainmen, then work up to an instrument hand. This enables students to
build valuable connections and contacts in the industry. This also provides benefits for
surveying firms. Surveying firms that employ students have the chance to identify the
22
value individual students represent to their company and have the first opportunity to
offer them employment on a fulltime basis.
Companies in regional areas first have to establish contact with students, then
identify if they have the ability to enhance their business; and finally try to recruit them
on a full time basis. From the outset, surveying firms that are not close to Toowoomba
or Brisbane, where students study on campus, are at a disadvantage.
Surveying firms in regional areas do have the option to recruit students living locally
who wish to study externally on a part time basis. If a student began studying part time
externally, completing the recommended two subjects a semester, they would take 8
years to complete their Bachelor of Spatial Science. If a business planned to develop
qualified employees in this respect, they would need to have great faith in their staff
retention levels. The next option would be to recruit students with a proportion of their
study complete. Students can work fulltime and study part time to complete their
degrees.
If surveying firms plan to recruit graduates from USQ and QUT they need to have a
clear understanding of what percentage of students are willing to relocate; and if they
are what key factors will be the most enticing and hence, increase their chances of
recruitment.
2.7 Technological Advances in Surveying
Technological advances over the last twenty years have revolutionised the day to day
operations of surveying. Computer aided design software used in the office has
revolutionised the drafting, design and setout calculations. In the field, digital levels,
programmable calculators, and total stations have a range of features including
calculation features, robotics, EDM and reflectorless capabilities. The most influential
advancement in the last five to ten years has been Global Positioning Systems (GPS)
technology. Although static GPS achieves greater accuracy, the advances and take up of
Real Time Kinematics (RTK) GPS has transformed the surveying and construction
industry (Williams, T 2009, pers. comm., 27 March).

23
RTK rovers have many applications for surveyors. From detail pickup to set out,
cadastral surveys and more. The speed and accuracy has made this technology an
essential tool to compete on construction projects. RTK GPS capabilities are perfect for
road construction, especially in the embankment material stages. The accuracy is suffice
to provide setout of lower layers and drainage construction. This technology has been
adapted to use for machine guidance. This enables almost any earthmoving equipment
to receive automatic location and elevation data instantaneously around the construction
site. Graders, bulldozers, excavators and compactors can all work with computer
operated bucket and blade control systems (Williams, T 2009, pers. comm., 27 March).
The latest software such as GSC900 from Trimble and GX 60 from Topcon offers a
simple interface for operators to construct earthwork projects. For increased accuracy,
Trimble ATS and Topcons LPS, use total stations that track prisms located on machines.
This technology eliminates the need for almost all traditional staking in earthworks
projects (Williams, T 2009, pers. comm., 27 March).
Abigroup, Seymour Whyte and Leightons are all currently using 900MHz RTK
systems that when combined with software such as Trimble’s Site Vision Office allow
the following:
• Upload of design information to machines from office to machine via UHF
• Monitor all machine movement in real time, speed, direction, total distance
travelled
• Receive grader blade conformance reports in minutes
• Send messages to machine operators
• Operation over the internet from anywhere in the world
(Williams, T 2009, pers. comm., 27 March).
On the 6.5 kilometer Eastern Access Corridor, the second stage of the Townsville
Port Access Road project, the road is almost entirely being constructed using machine
guidance. The following technology is being used:
• 3 x GPS Grader Machine Guidance for embankment
• 2 x Grader ATS sub grade and pavement infill’s
• 2 x Excavator GPS Machine Guidance (1 to be confirmed)
• 1 x fixed in car RTK for Main Roads inspector, SCS 900 software
24
• 15 x in car GPS loaded with chainages, environmental clearance zones and
footprint for +-5m accuracy.
• Site Vision Office combined with 900 MHz Machine Guidance systems.
(Williams, T 2009, pers. comm., 27 March).
Seymour Whyte Survey Manager, Tom Williams, uploads design and conducts
volume reports for two major projects in Townsville from his office in Brisbane
(Williams, T 2009, pers. comm., 27 March).Once control networks are established,
labourers simply need to do a resection to setup machine ATS. Once established, control
network maintenance is a small weekly, or even monthly task. The only surveying
necessary on earthworks will be settlement plate monitoring, conformance reports and
pavement, asphalt and line work set-out (Williams, T 2009, pers. comm., 27 March).
When analysing the required numbers of surveyors to service regional areas, it is
imperative to consider the latest advances in technology and how they will affect the
surveying industry. Advances in technology have driven huge increases in effiency in
surveying, especially using RTK GPS and machine guidance systems. Due to the
expense in setting up this technology, full impact across the surveying industry is yet to
be felt. This certainly needs to be considered when analysing any perceived shortages in
the surveying industry.
Large companies that have purchased and paid for the equipment on previous
projects are becoming more price competitive and are subsequently forcing more
companies to invest in the technology. Seymour Whyte is currently conducting a report
into cost savings achieved with this technology. It is hoped that when tendering, they
will be able to accurately price the savings into projects. This technology does not
remove the need for Surveyors. The technology requires technicians with experience to
setup and run the equipment however, greatly reduces the volume of field work. Thus,
the number of surveying man-hours during bulk earthwork projects (Williams, T 2009,
pers. comm., 27 March).

25
2.8 Registered Surveyor Demographic
Table 2.1 shows the registration statistics from the 2008 Queensland Board of
Surveyors annual report (2008, p. 7). Analysing the registration statistics, there has been
no statistically significant change in surveyor numbers over the last five years. There is a
noticeable variation from year to year; however no distinct trends are obvious.
Table 2.1: Registration Statistics
Registration Types 2005-2006 2006-2007 2007-2008
Surveying Associates 191 193 209
Surveying Graduates 207 245 262
Registered Surveyors
Individuals 786 756 735
Individuals without endorsements 37 31 34
Registered Surveyors-Cadastral Endorsement
Individuals 626 613 617
Corporations 116 116 117
Registered Surveyors-Engineering
Endorsement
Individuals 124 124 120
Corporations 9 10 10
Registered Surveyors-Hydrographic
Endorsement
Individuals 5 5 5
Registered Surveyors-Mining Endorsement (A)
Individuals 52 51 48
Corporations 1 1 1
Registered Surveyor-Mining Endorsement (O)
Individuals 17 18 19
Registered Surveyors-Consulting Endorsement
Individuals 292 291 278
Corporations 120 118 118
Total 412 409 396
Total registered persons (including
corporations) 1493 1483 1501
(Surveyors Board of Queensland 2008, p. 7)
In 2007, the Surveyor’s Board of Queensland asked Surveyors in Queensland to
supply their age for research purposes. There were 334 out of a possible 776
respondants that were willing to provide their date of birth. The average age of the
registered Surveyors that responded was 48.
Figure 2 shows the sum of the registered persons who are the same age. This chart
shows a distinct building-up of registered Surveyor numbers up until the age of 40.
There is a distinct drop off in the number of Surveyors aged 40 to 47. The number of

26
registered Surveyors of the same age increases until age 54. The numbers then start to
decrease rapidly as the age approaches retirement age. This figure shows the large
number of surveyors around the 50-55 age bracket.
Figure 2.1: Registered Surveyor’s Grouped by Age
The data was grouped into age brackets as shown in the pie chart in figure 2.2.
Encouragingly, 17% of registered Surveyors were made up of 35-39 year olds. The
number in the 40-44 year age bracket dropped to 12% and increased again to 15% being
registered Surveyors in the 45-49 year age bracket. The reason for the drop in Surveyor
numbers during the 40 year age group does not appear obvious; although it may be due
to the poor economic conditions during the early 1990’s limiting the opportunities and
weakening the outlook for the industry.
Figure 2.2: Registered Surveyor’s grouped by age bracket

27
In the first quarter of 2009, the Department of Education, Employment and
Workplace Relations, rated the occupation of Surveyor as having a labour shortage. The
report stated that: “the high level of investment and planned infrastructure development
across the state, indicates that demand for surveyors looks set to continue” (DEEWR
2009). The report also noted that supply from immigration and tertiary education was
failing to meet demand. During the 2007-2008 year, 64 self-identified Surveyors
migrated to Queensland (DEEWR 2009).
The study conducted by DEEWR (2009) found that “only 60% of advertised
vacancies for Surveyors in Queensland were filled within six weeks of advertising.” The
report also noted “employers outside the mineral resources sector reported difficulties
attracting Australian applicants due to their inability to match the remuneration offered
by that sector.” Long periods taken to fill vacancies and strong competition from the
resources sector have also been reported from survey businesses and job recruiters in
initial research into the project.
Understanding the current age statistics for the surveying industry is crucial to help
identify the extent of any current skills shortage and developing strategies to alleviate
the shortage into the future. Accurate data representing the surveying industry has been
difficult to obtain and therefore necessitates that more research be undertaken.
2.9 Changes in Economic Conditions Throughout 2008-2009
For the previous 10 years until 2007-2008, Australia’s Gross Domestic Product grew
at an average annual increase of 2.2%, from $41,000 to $51,000 (Australian Bureau of
Statistics). In the second half of 2008, the world economy crashed in what has become
known as the Global Financial Crisis. The Australian Bureau of Statistics reports that
“In the context of the global economic downturn, GDP fell by 0.1% on a trend basis
during the last quarter of 2008.” In the twelve months to June 2009, Australia’s terms of
trade fell 11.6% (Australian Bureau of Statistics. As the surveying industry is spread
across exploration, mining, construction and land development, the economic conditions
have had a substantial impact.
The research topic for this project was decided on in March 2008. During the last 18
months the economic conditions in Australia have change considerably. It is envisaged

28
that the changed employment outlook will have an effect on students outlook and
confidence and therefore may impact on responses to the student questionnaire.
However, this expected change in opinion and perspective does not make the data any
less valid as it is reporting the current environment students are living in.
2.10 Women in Spatial Science
The high ratio of men to women in the construction industry has been documented
(NAIWIC). This gender imbalance is currently being tackled through institutions such
as the National Association of Women in Construction (NAWIC). Their mission is:
• To raise the profile of women working in the construction industry
• To be a positive instrument for change in the construction industry
• To meet, support and network with other women in the construction industry
NAWIC is an example of an institution that gives support to women and promotes
the construction industry at high school level through to women of any age looking for a
career change. Women make up 50% of the population and are valuable human
resources that can be utilised to address skills shortages in the industry. (Welsh, G
2008, pers. comm., 8 July)
An internal review of membership in the Surveying Science Institute in 2006 found
that only 8.5% of its members were women (Landmark 2008, p. 5). The institute then
decided to conduct a survey of working women in the industry across Australia and New
Zealand. In all, there were 277 participants in the survey. The following was reported:
• 61% were 35 or younger
• 60% were working in the government sector
• 66% of respondents were working in the GIS/spatial analysis discipline
• Only 14% identified themselves as Surveyors
• 53% had undergraduate degrees
• 35% had postgraduate degrees

29
This research shows that the ratio of women to men working in the Spatial Science
industry is very low. More needs to be done to encourage women to become involved in
the industry, which in turn may help reduce the skills shortage.
2.11 Graduate Numbers from Queensland Universities
Table 2.2 shows the number of graduates from both QUT and USQ over the past 4
years. In 2005, there was a total of 24 graduates from the 4 year bachelor degree;
followed the next year by 31, 29 and 27 in 2008. To maintain the current number of
registered Surveyors under the age of 55 for the next ten years, at least 12 graduates per
year need to become registered Surveyors. As of 2008, there were 262 registered
graduates in Queensland. No statistics have been found showing what percentages of
these graduates have completed the 3 or 4 year degree.
Table 2.2: Enrolment and Graduation numbers of Spatial Science courses from USQ
and QUT
Program 2005 2006 2007 2008
Enrolments
ADSS ADegSpatialScience USQ 122 160 230 289
BSPS BSpatialScience USQ 113 127 145 167
BSST BSpatialScienceTech USQ 100 99 118 133
MSPS MSpatial Science USQ 0 1 4 1
Graduations
ADSS ADegSpatialScience USQ 6 13 17 17
BSPS BSpatialScience USQ 6 12 10 15
BSST BSpatialScienceTech USQ 11 17 12 12
MSST MSpatialScienceTechnology USQ 1
PS47 B Surveying QUT 18 19 19 12
2.12 Marketing of Surveying as a Career
Professor John Hannah from the University of Otago, has conducted research into
marketing of surveying as a career to increase enrolments into universities in New
Zealand. Hannah (2006, p. 6) states that “few know or understand the knowledge and
skills possessed by Surveyors or where and how Surveyors contribute to society.” A
marketing campaign aimed at all high school students throughout New Zealand using a

30
professionally produced career video, promotional brochures and active marketing from
the high school’s Liaison Officer at the University of Otago was undertaken in 1995.
This resulted in a 32% increase in applications for entry into the Bachelor of
Surveying degree at Otago University. The following year, the same marketing
campaign was not undertaken and the applications fell straight back to pre 1996 levels.
The marketing campaign was reinstated the following year and university applications
began to grow again. Every high school career advisor in the country is now routinely
mailed information packs about surveying as a career.
The key messages the university markets are:
• the superb career opportunities for Surveyors
• the ideal inside/outside job mix
• wonderful variety of work
• excellent professional remuneration (added in 2006)
Hannah has also identified that the percentage of surveying students drawn from
smaller rural cities and areas is typically between 60-70%. In 2001, approximately 57%
of New Zealand’s population lived in large cities. Hannah (2006, p. 9) states, “Clearly
this does not match the distribution of population.” Approximately 30% of students
come from Dunedin, the home of the School of Surveying. This group is largely
attributed to the high profile the School of Surveying has in the area and that the area
has the most effective marketing. Taking this into consideration it becomes very clear
that in New Zealand Surveying has a large appeal to students of a rural background
(Hannah 2006, pp. 8-12).

31
2.13 Shortage of Surveyors Across Australia
The shortage of Surveyors in regional Queensland is not an isolated phenomena. In
2003 Mr Richard Torbay, member for Northern Tablelands, introduced a private
members statement into the Parliament of New South Wales outlining a Surveyor
shortage in NSW. In his speech he outlined the following:
• The average age of registered Surveyors in NSW was 51.5
• 1550 registered Surveyors in 1991, fell to under 1000 in 2003
• The number of graduates seeking registration fell 12% in the 1990’s
• Estimated in 2003, more than 65% were expected to retire within the next 10
years
• Incentives were needed to boost student numbers
(Torbay, R 2005)
2.14 Impact of a Surveyor Shortage
The term “skills shortage” is used widely in the media and can have many different
meanings. For the purpose of this research project the definitions adopted are taken from
the SkillsInfo website which is an initiative of the Department of Education,
Employment and Workplace Relations. Skills info (Australian Government n.d.) defines
a skill shortage as when employers are, “unable to fill or have considerable difficulty in
filling vacancies for an occupation.” Skills shortages can occur within specialisations of
an occupation. For example, within the Surveying industry there may be shortages of
cadastral Surveyors while there may be ample Mine Surveyors. The supply of skills can
vary for reasons such as attractiveness of particular employment, the ageing of a
workforce, undersupply of new recruits entering the industry (Australian Government
n.d.).
Recruitment difficulties are when employers are unable to attract and recruit
sufficient suitable employees. There may be an adequate supply of skilled workers, but
employers are unable to attract them. Difficulties in attracting employees can be caused
by geographic location, unsatisfactory work hours and conditions, ineffective
advertising and poor working conditions (Shah & Burke 2003, p. v).
32
Occupations can experience difficulties when there is a skills gap. SkillsInfo
(Australian Government n.d.) states, “Skill gaps exist where existing employees lack the
required qualifications, experience and/or specialised skills to meet the firm’s skill
needs for an occupation”. Skill gaps are pertinent to the Surveying industry as
employee’s range from chainmen, instrument hands through to associates, graduates and
registered Surveyors.
Market indicators of skills shortages can be
• Hours of overtime/short-time worked by people in the industry
• Employment vacancy’s
• Flow of new entrants and leavers
• Level of subcontracting
• Levels of immigration
• Hiring standards
(Australian Government n.d.).
Skills shortages in surveying can result in overworking and increased stress for
existing employees. Overworking can lead to mistakes, encourage shortcuts and lead to
burn out. New comers can be fast tracked into positions that expose their skills gap. If
senior Surveyors become too busy they may not have the time to help mentor graduates
and pass on their valuable knowledge. Not enough registered Surveyors can lead to
bottle necks in land developments, construction and mining projects which in turn can
place further pressure on employees (Welsh, G 2008, pers. comm., 8 July).
It is important to realise that becoming a registered Surveyor is a long and testing
process that can take many years after graduating from a bachelor degree. The current
education and work experience process to satisfy competencies and gain endorsements,
requires existing registered Surveyors to help mentor and develop aspiring graduates. If
a shortage of registered Surveyors becomes acute in regional Queensland, the ability of
the remaining registered Surveyors to mentor and develop graduates will become
impaired. At the same time it is imperative that the surveying board maintains required
competency levels to maintain public confidence in the cadastre.

33
2.15 Conclusion
It is important to realise that many sectors are recruiting Surveying graduates. With a
limited pool of graduates, some are going to miss out in the boom times. Identifying
exactly what graduate’s desire, may help employers attract suitable graduates to their
business. Losing promising graduates to the dollars of mining industry is seen by some
as a loss to the future of the Cadastral and Engineering disciplines. In order for there to
be a long term increase in registered Surveyors in Regional Queensland, there needs to
be an increase in graduates attracted to Cadastral and Engineering jobs.
34
CHAPTER 3
METHODOLOGY
3.1 Methodology
This chapter details the methodology undertaken to achieve the research objectives
of the project as outlined in chapter 1.
3.2 Assumptions
This project assumes all research data gathered through participants in the
questionnaire is accurately and honestly answered.
3.3 Questionnaire
A questionnaire was developed as a basis for research for the dissertation. The
questionnaire was designed to identify student’s opinions and perspectives on the
university education process, employment opportunities in the surveying industry and
future goals upon entering the workforce.
The questionnaire is designed for university students and recent graduates. In an
attempt to gain as many respondents as possible, the questionnaire was placed online to
allow participants to complete it quickly with little effort. The results are obtained
instantly as the answers are automatically emailed to the researcher upon completion.
The basis for the questionnaire is to help understand some of the following opinions
and demographic profile of university students and graduates:
• Main reasons for enrolling in a surveying course at university
• When did students first come into contact with the profession of surveying?
• Did students have work experience in the profession prior to study?
• Do students undertake surveying for vacation employment?
• Do employers offer any concessions to help students work and study?
• What concessions would be the most feasible and helpful?
• Are students prepared to move for work upon graduation?
• What are the most important factors that influence job preference?

35
The intention of the questionnaire is to combine many variables and define a
demographic profile. It is anticipated this profile will provide a clear picture of how
typical surveying students have made and will make on enrolment, studying options and
future employment.
Provided consistent data can be collated, it is envisaged that the research can be used
to identify incentives that will attract university graduates to regional areas and further
more encourage graduates to work towards becoming registered.
Identifying the main reasons for students enrolling in university may also help in
developing a marketing strategy to boost student enrolment and decrease drop out rates.
Government and industry scholarships as well as Higher Education Contribution
Scheme exemptions may be a viable scheme to recommend.
The questionnaire also aims to identify if students have moved from regional areas
to study on campus. If students are moving from regional areas to study, becoming
settled over their education period, then are no longer prepared to move away; the
university locations may be contributing to the problem.
3.4 Constraints
The main focus of this project is to investigate the causes for the shortage of
registered Surveyors in regional Queensland. This problem has not been well researched
previously; therefore the resources available are very limited.
36
CHAPTER 4
QUESTIONNAIRE FINDINGS AND ANALYSIS
4.1 Respondents
The web link for the questionnaire was sent to students at QUT and USQ in the
second week of August. The students had one month to complete the questionnaire
online. The vast majority of questionnaires were received in the first week after
distribution. In total 171 valid questionnaires were received. It was hoped that at least 60
completed questionnaires would be returned to allow analysis and provide meaningful
statistics for the purpose of the research project. Receiving 171 respondents was well
above expectation and provided a platform to produce statistically significant results.
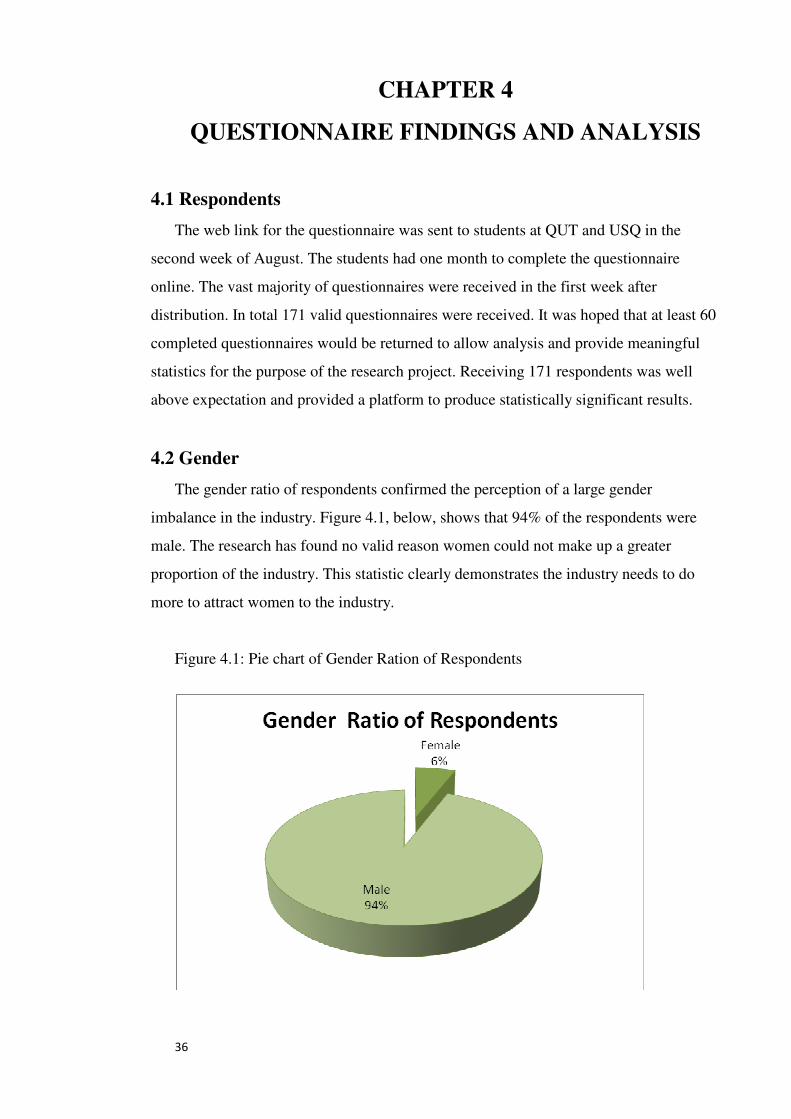
4.2 Gender
The gender ratio of respondents confirmed the perception of a large gender
imbalance in the industry. Figure 4.1, below, shows that 94% of the respondents were
male. The research has found no valid reason women could not make up a greater
proportion of the industry. This statistic clearly demonstrates the industry needs to do
more to attract women to the industry.
Figure 4.1: Pie chart of Gender Ration of Respondents

37
4.3 University, Study Mode and Stage of Course Completion
Figure 4.2 is a pie chart showing the breakdown of university and study mode of the
student respondents. The largest group with 67% of the student respondents, studied
externally from USQ on a part time basis. The second largest group with 23% were
students studying fulltime at QUT. QUT only offers the option of on campus study.
USQ offers both external and on campus study options. The popularity of USQ’s
external course is reflected with over 67% of respondents studying externally on a part
time basis, less than 4% externally full time and 6% of respondents study full time on
campus.
Figure 4.2: University and Study Mode of Student Respondents
Figure 4.3 is a pie chart showing what stage of completing their degree the students
were at. 43% of respondents were close to completing there course, with 31% around
the middle, 18% at the beginning and 8% already graduated. The research shows the
majority (74%) of students are half way or closer to finishing their course.
Unfortunately the research cannot prove whether this is due to the fact students in
this bracket were more interested in participating in the research, or whether students
take longer to finish off the final stage of their degree and therefore make up a greater
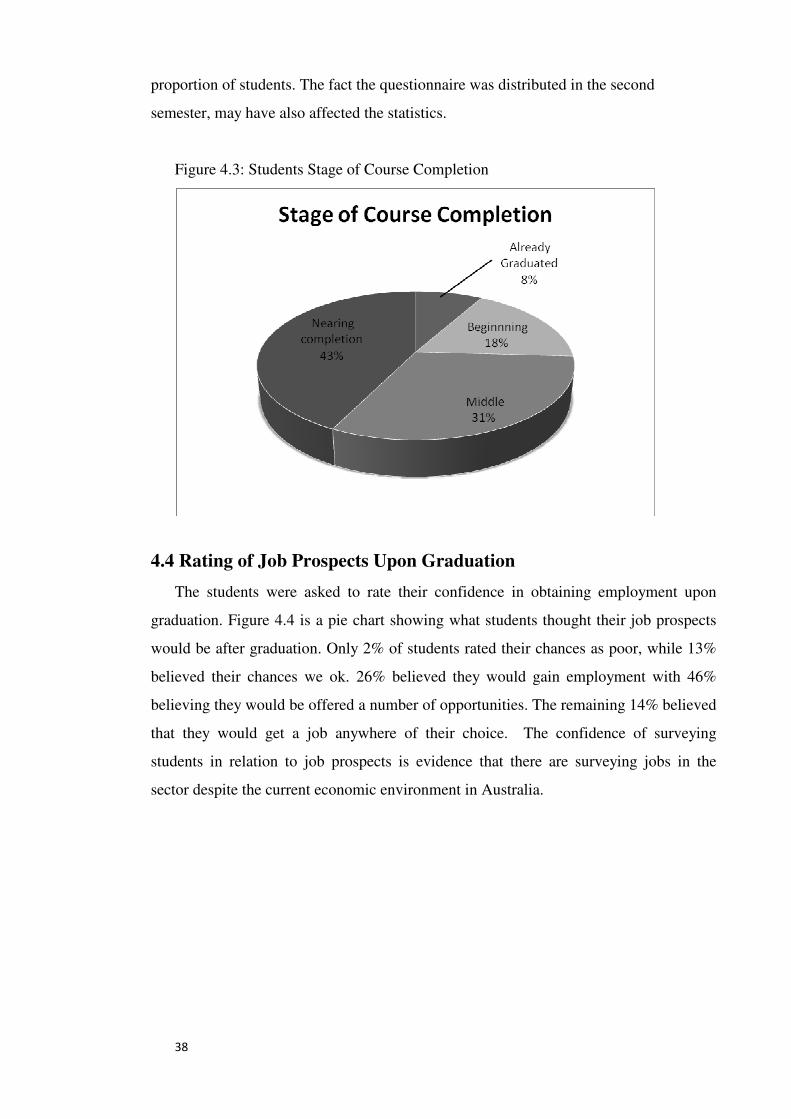
38
proportion of students. The fact the questionnaire was distributed in the second
semester, may have also affected the statistics.
Figure 4.3: Students Stage of Course Completion
4.4 Rating of Job Prospects Upon Graduation
The students were asked to rate their confidence in obtaining employment upon
graduation. Figure 4.4 is a pie chart showing what students thought their job prospects
would be after graduation. Only 2% of students rated their chances as poor, while 13%
believed their chances we ok. 26% believed they would gain employment with 46%
believing they would be offered a number of opportunities. The remaining 14% believed
that they would get a job anywhere of their choice. The confidence of surveying
students in relation to job prospects is evidence that there are surveying jobs in the
sector despite the current economic environment in Australia.

39
Figure 4.4: Students rating of job prospects once graduating
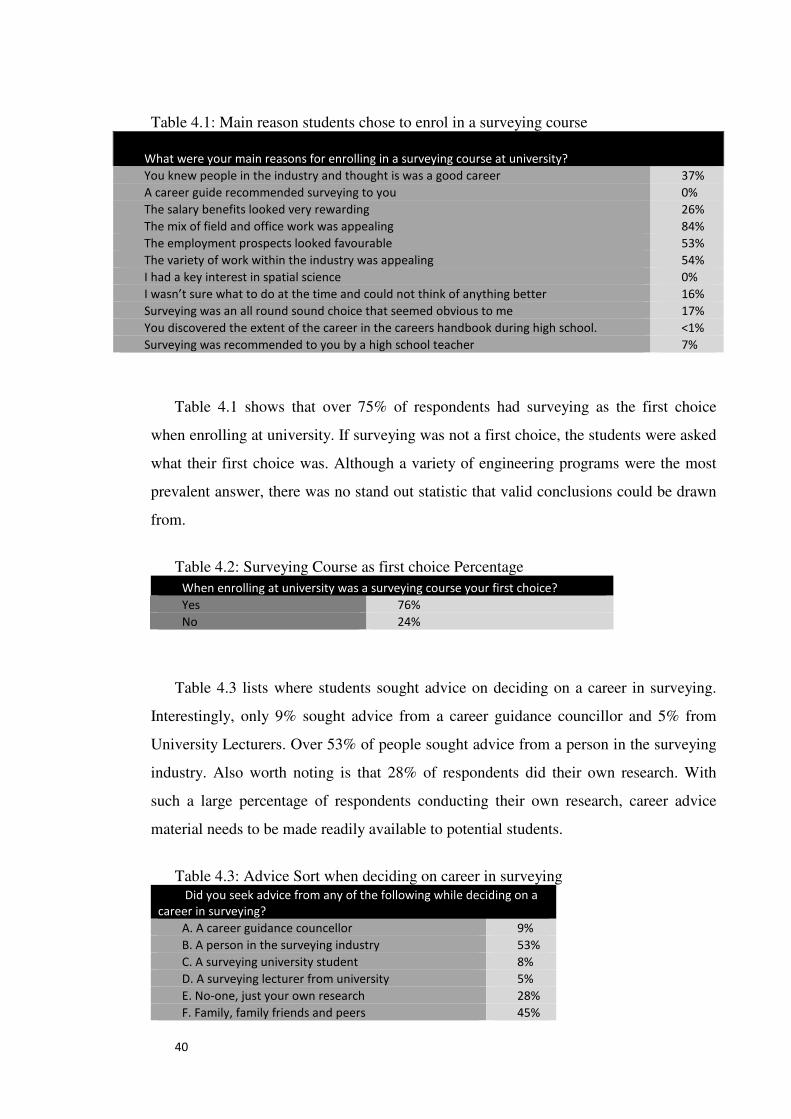
4.5 Reasons for Enrolling in a Surveying Course at University
Identifying the range of reasons students chose to study surveying was important to
develop a framework to target and attract potential surveying students to the surveying
industry. The students were asked to select the main reasons for enrolling in a surveying
course at university. The results are shown below in table 3. Remarkably 37% of
respondent’s knew people in the industry and thought it was a good career. Over 50%
believed the employment prospects were favourable and the variety of work within the
industry was appealing. The stand out statistic was that 84% of respondents were
attracted by the mix of field and office work. With such a massive proportion of
students attracted to the career due to the mix of office and outdoor work, this career
attraction needs to be promoted among any potential students.
Out of 171 respondents, only 1 participant chose ‘discovered the extent of the career
in the careers handbook during high school’ and not one participant attributed a career
guide for recommending surveying to them as a main reason for enrolling in a surveying
course.
40
Table 4.1: Main reason students chose to enrol in a surveying course
What were your main reasons for enrolling in a surveying course at university?
You knew people in the industry and thought is was a good career 37%
A career guide recommended surveying to you 0%
The salary benefits looked very rewarding 26%
The mix of field and office work was appealing 84%
The employment prospects looked favourable 53%
The variety of work within the industry was appealing 54%
I had a key interest in spatial science 0%
I wasn’t sure what to do at the time and could not think of anything better 16%
Surveying was an all round sound choice that seemed obvious to me 17%
You discovered the extent of the career in the careers handbook during high school. <1%
Surveying was recommended to you by a high school teacher 7%
Table 4.1 shows that over 75% of respondents had surveying as the first choice
when enrolling at university. If surveying was not a first choice, the students were asked
what their first choice was. Although a variety of engineering programs were the most
prevalent answer, there was no stand out statistic that valid conclusions could be drawn
from.
Table 4.2: Surveying Course as first choice Percentage
When enrolling at university was a surveying course your first choice?
Yes 76%
No 24%
Table 4.3 lists where students sought advice on deciding on a career in surveying.
Interestingly, only 9% sought advice from a career guidance councillor and 5% from
University Lecturers. Over 53% of people sought advice from a person in the surveying
industry. Also worth noting is that 28% of respondents did their own research. With
such a large percentage of respondents conducting their own research, career advice
material needs to be made readily available to potential students.
Table 4.3: Advice Sort when deciding on career in surveying
Did you seek advice from any of the following while deciding on a
career in surveying?
A. A career guidance councellor 9%
B. A person in the surveying industry 53%
C. A surveying university student 8%
D. A surveying lecturer from university 5%
E. No-one, just your own research 28%
F. Family, family friends and peers 45%
41
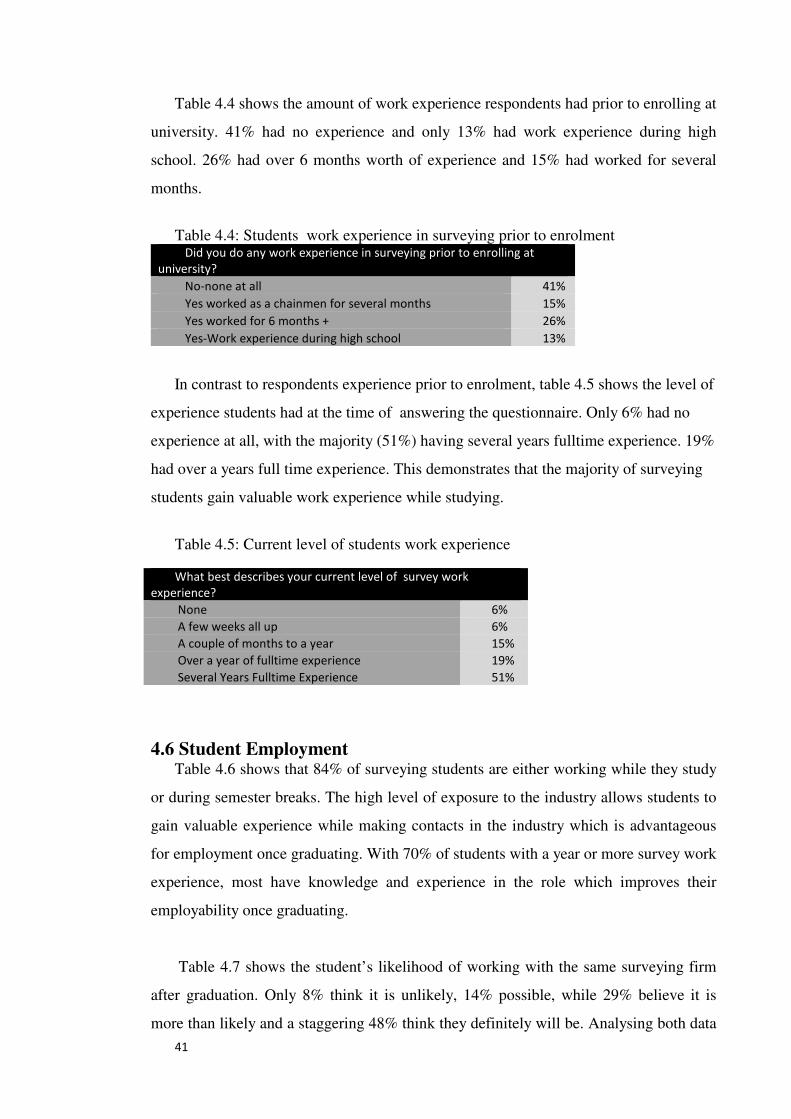
Table 4.4 shows the amount of work experience respondents had prior to enrolling at
university. 41% had no experience and only 13% had work experience during high
school. 26% had over 6 months worth of experience and 15% had worked for several
months.
Table 4.4: Students work experience in surveying prior to enrolment
Did you do any work experience in surveying prior to enrolling at
university?
No-none at all 41%
Yes worked as a chainmen for several months 15%
Yes worked for 6 months + 26%
Yes-Work experience during high school 13%
In contrast to respondents experience prior to enrolment, table 4.5 shows the level of
experience students had at the time of answering the questionnaire. Only 6% had no
experience at all, with the majority (51%) having several years fulltime experience. 19%
had over a years full time experience. This demonstrates that the majority of surveying
students gain valuable work experience while studying.
Table 4.5: Current level of students work experience
4.6 Student Employment Table 4.6 shows that 84% of surveying students are either working while they study
or during semester breaks. The high level of exposure to the industry allows students to
gain valuable experience while making contacts in the industry which is advantageous
for employment once graduating. With 70% of students with a year or more survey work
experience, most have knowledge and experience in the role which improves their
employability once graduating.
Table 4.7 shows the student’s likelihood of working with the same surveying firm
after graduation. Only 8% think it is unlikely, 14% possible, while 29% believe it is
more than likely and a staggering 48% think they definitely will be. Analysing both data
What best describes your current level of survey work
experience?
None 6%
A few weeks all up 6%
A couple of months to a year 15%
Over a year of fulltime experience 19%
Several Years Fulltime Experience 51%
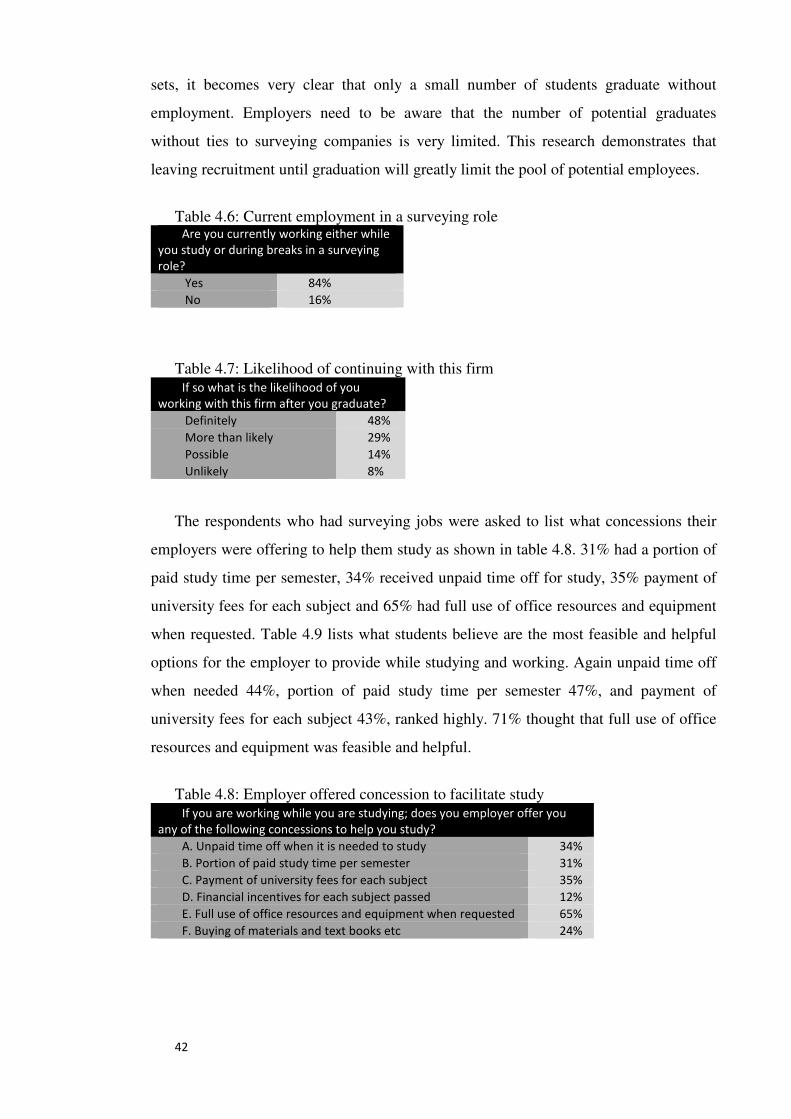
42
sets, it becomes very clear that only a small number of students graduate without
employment. Employers need to be aware that the number of potential graduates
without ties to surveying companies is very limited. This research demonstrates that
leaving recruitment until graduation will greatly limit the pool of potential employees.
Table 4.6: Current employment in a surveying role
Are you currently working either while
you study or during breaks in a surveying
role?
Yes 84%
No 16%
Table 4.7: Likelihood of continuing with this firm
If so what is the likelihood of you
working with this firm after you graduate?
Definitely 48%
More than likely 29%
Possible 14%
Unlikely 8%
The respondents who had surveying jobs were asked to list what concessions their
employers were offering to help them study as shown in table 4.8. 31% had a portion of
paid study time per semester, 34% received unpaid time off for study, 35% payment of
university fees for each subject and 65% had full use of office resources and equipment
when requested. Table 4.9 lists what students believe are the most feasible and helpful
options for the employer to provide while studying and working. Again unpaid time off
when needed 44%, portion of paid study time per semester 47%, and payment of
university fees for each subject 43%, ranked highly. 71% thought that full use of office
resources and equipment was feasible and helpful.
Table 4.8: Employer offered concession to facilitate study
If you are working while you are studying; does you employer offer you
any of the following concessions to help you study?
A. Unpaid time off when it is needed to study 34%
B. Portion of paid study time per semester 31%
C. Payment of university fees for each subject 35%
D. Financial incentives for each subject passed 12%
E. Full use of office resources and equipment when requested 65%
F. Buying of materials and text books etc 24%

43
Table 4.9: Feasible and helpful concessions employers could offer
Which of the following do you believe are feasible and helpful for your
employer to offer you while you study and work?
A. Unpaid time off when it is needed to study 44%
B. Portion of paid study time per semester 47%
C. Payment of university fees for each subject 43%
D. Financial incentives for each subject passed 35%
E. Full use of office resources and equipment when requested 71%
F. Buying of materials and text books etc 36%

44
Table 4.10 shows what best describes the type of work students plan to do for the
first five years after graduation. Table 4.11 demonstrates what best describes the type of
work students plan to do for the majority of their career in surveying. The only notable
shift was a 6% drop-off from mining surveying and a 6% increase in cadastral and
engineering surveying. This suggests a proportion of students plan to start their career in
the mining environment and move across to cadastral and engineering later in their
career. 19% of respondents planned to work the majority of their career in cadastral
surveying, with a further 38% working in both cadastral and engineering.
Table 4.10: Survey work planned in first five years after graduation
Table 4.11: Survey work planned for majority of career What best describes the type of survey work
you plan to do for the majority of your career in
surveying?
Cadastral 19%
Cadastral and Engineering 38%
Engineering Surveying 16%
GIS 2%
Hydrographic Surveying 4%
Mine Surveying 18%
What best describes the type of survey
work you plan to do for the first five years after
you graduate?
Cadastral 19%
Cadastral and Engineering 32%
Engineering Surveying 18%
GIS 2%
Hydrographic Surveying 5%
Mine Surveying 24%
45
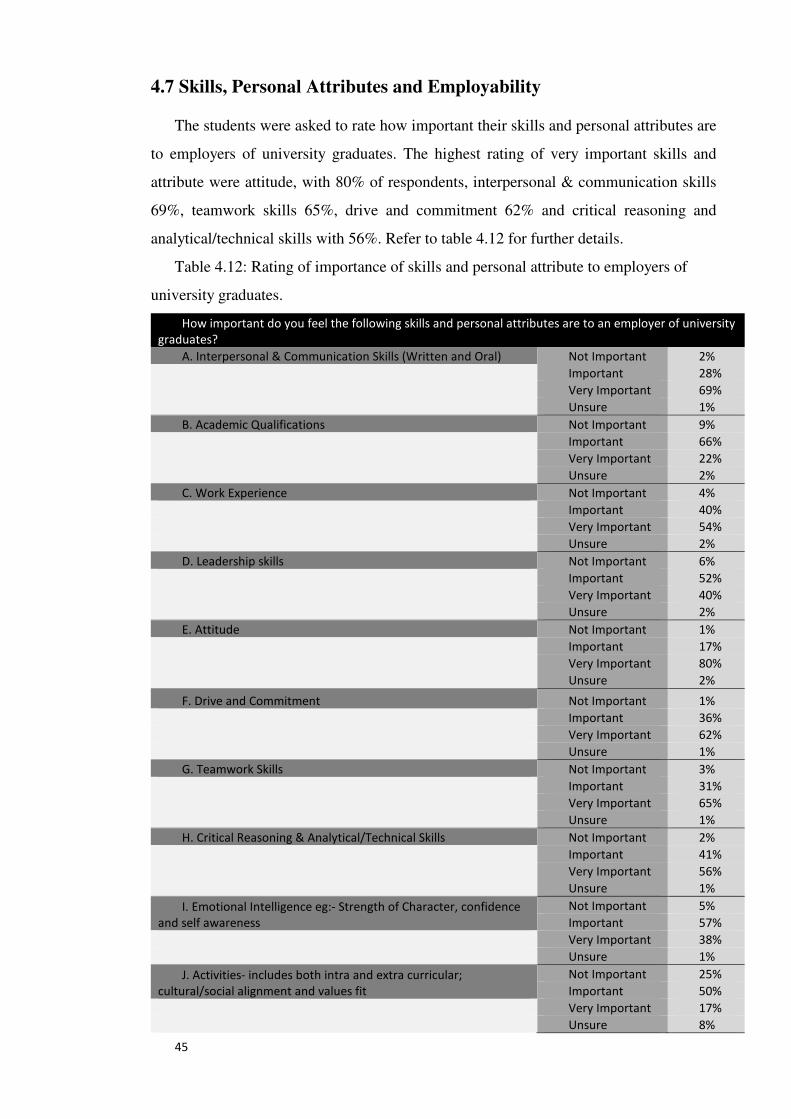
4.7 Skills, Personal Attributes and Employability The students were asked to rate how important their skills and personal attributes are
to employers of university graduates. The highest rating of very important skills and
attribute were attitude, with 80% of respondents, interpersonal & communication skills
69%, teamwork skills 65%, drive and commitment 62% and critical reasoning and
analytical/technical skills with 56%. Refer to table 4.12 for further details.
Table 4.12: Rating of importance of skills and personal attribute to employers of
university graduates.
How important do you feel the following skills and personal attributes are to an employer of university
graduates?
A. Interpersonal & Communication Skills (Written and Oral) Not Important 2%
Important 28%
Very Important 69%
Unsure 1%
B. Academic Qualifications Not Important 9%
Important 66%
Very Important 22%
Unsure 2%
C. Work Experience Not Important 4%
Important 40%
Very Important 54%
Unsure 2%
D. Leadership skills Not Important 6%
Important 52%
Very Important 40%
Unsure 2%
E. Attitude Not Important 1%
Important 17%
Very Important 80%
Unsure 2%
F. Drive and Commitment Not Important 1%
Important 36%
Very Important 62%
Unsure 1%
G. Teamwork Skills Not Important 3%
Important 31%
Very Important 65%
Unsure 1%
H. Critical Reasoning & Analytical/Technical Skills Not Important 2%
Important 41%
Very Important 56%
Unsure 1%
I. Emotional Intelligence eg:- Strength of Character, confidence
and self awareness
Not Important 5%
Important 57%
Very Important 38%
Unsure 1%
J. Activities- includes both intra and extra curricular;
cultural/social alignment and values fit
Not Important 25%
Important 50%
Very Important 17%
Unsure 8%

46
Table 4.12 shows students rating on how they believe their employability skills are
at this time. Few students believed that any of their employability skills were not so
strong in any of the skill sets. The majority of students thought their skills in
communication, teamwork, self management, problem solving, planning and organising,
technology, learning, initiative and enterprise were somewhat strong or stronger.
Overall, the students ranked their employability skills highly in all categories. There
were no major correlations that can be drawn from differences in employability skill
levels from student ranking, as the spread was close across all listed skills. The lowest
ranking was in regards to technical skills resulting from the course with 46% rating as
good and 12% as not so strong. Overall the students believed their employability skills
were of a high standard across the skills set.

47
Table 4.13: Rating of own employability skills at this time How strong do you believe your employability skills are at this time in relation
to the following?
A. Communication Non-Existent 0%
Not So Strong 4%
Good 39%
Somewhat Strong 37%
Very Strong 21%
B. Teamwork Non-Existent 0%
Not So Strong 2%
Good 27%
Somewhat Strong 42%
Very Strong 29%
C. Self Management Non-Existent 0%
Not So Strong 8%
Good 26%
Somewhat Strong 36%
Very Strong 30%
D. Problem sovling Non-Existent 0%
Not So Strong 2%
Good 29%
Somewhat Strong 42%
Very Strong 27%
E. Planning and Organising Non-Existent 0%
Not So Strong 9%
Good 29%
Somewhat Strong 41%
Very Strong 21%
F. Technology Non-Existent 0%
Not So Strong 10%
Good 38%
Somewhat Strong 35%
Very Strong 18%
G. Learning Non-Existent 0%
Not So Strong 1%
Good 37%
Somewhat Strong 43%
Very Strong 18%
H. Initiative and Enterprise Non-Existent 0%
Not So Strong 5%
Good 36%
Somewhat Strong 38%
Very Strong 21%
I. Technical Skills resulting from your
course Non-Existent 1%
Not So Strong 12%
Good 46%
Somewhat Strong 34%
Very Strong 7%

48
4.8 Student Demographics
One of the main goals of the questionnaire was to identify where students had
originated from prior to beginning study and where they are most likely to live after
graduation. Identifying whether moving from regional areas to study and not returning is
a factor contributing to the shortage of Surveyors in regional Queensland was another
aim. Students were asked if they had lived for twelve months outside of a metropolitan
area. Figure 4.5 shows that 73% of the students had lived outside of a metropolitan area
for at least twelve months of their lives. The students were also asked what best
describes where they lived in the 2 years prior to starting university. Figure 4.6 shows
that 55% of students came from a regional area prior to commencing tertiary education.
The students were then asked where they plan to work in the first 5 years after
graduating. Interestingly, Figure 4.7 shows the majority of students, 53%, are mostly
likely to work in a regional area in Australia; with 62% of those in regional Queensland.
It is important to note that because USQ offers external studying options many of the
students live and study outside of Queensland.
The students were also asked if they were considering working outside of a
metropolitan area once they graduate. Figure 4.8 shows that a high proportion (41%) of
respondents definitely plan to work outside of a metropolitan area once graduating from
university. Interestingly, 44% will consider the options, 8% will look at but are unlikely
to accept a position outside of metropolitan areas and only 7% definitely will not. This
clearly demonstrates that the majority of students are willing to consider starting their
careers in regional areas.
Figure 4.5: Pie chart showing percentage of students that had lived outside a
metropolitan area for more than twelve months

49
Figure 4.6: Pie chart showing where students came from to study Spatial Science
Figure 4.7: Where students plan to work for first five years after graduating
Figure 4.8: Percentage of respondents considering working outside of a metropolitan
area once graduating

50
4.9 Student Employment Expectations
Students were asked to rank the importance of a variety of factors that will influence
their decisions when looking for work as shown in table 4.14. The guarantee that you
will be helped towards becoming registered (38%), had the highest percentage of very
important rating, long term job stability with 36% of respondents, the personality of
bosses/employees 29%, salary offered 28%, closely followed by career advancement
opportunities with 26%. Low rating factors were the size of the survey firm with 40%
ranking as irrelevant and ‘the size of the town/city you would be living in’ 26%, the cost
and hassle of moving 25%, and finally climate, temperature and working conditions
with 17% of respondents classifying this factor as irrelevant. The latter three illustrate a
willingness for a proportion of students to seek their ideal job and preparedness to
consider the options despite the conditions.

51
Table 4.14: Rating of factors that influence when searching for work
Of the following, rank the importance of factors that will influence you when you look for
work after graduating from university?
The Salary Offered Irrelevant 1%
Desirable 9%
Necessary 13%
Important 49%
Very Important 28%
The Distance from family and friends Irrelevant 12%
Desirable 21%
Necessary 15%
Important 30%
Very Important 21%
The Survey equipment and software used by business Irrelevant 9%
Desirable 15%
Necessary 28%
Important 35%
Very Important 13%
The climate, temperature and working conditions Irrelevant 17%
Desirable 24%
Necessary 28%
Important 23%
Very
Important 7%
The size of the survey firm Irrelevant 40%
Desirable 24%
Necessary 20%
Important 14%
Very Important 4%
Career advancement opportunities within a survey firm Irrelevant 8%
Desirable 14%
Necessary 20%
Important 32%
Very Important 26%
Long term job stability Irrelevant 2%
Desirable 9%
Necessary 14%
Important 39%
Very Important 36%

52
Table 4.14 Continued…
Of the following, rank the importance of factors that will influence you when you look for work
after graduating from university?
The personality of bosses/employees Irrelevant 2%
Desirable 6%
Necessary 12%
Important 49%
Very Important 29%
The type of projects that you will be likely to be working on Irrelevant 4%
Desirable 16%
Necessary 17%
Important 44%
Very Important 19%
The size of the town/city that you will be living in Irrelevant 26%
Desirable 24%
Necessary 22%
Important 21%
Very Important 7%
The cost and hassle of relocating Irrelevant 25%
Desirable 19%
Necessary 20%
Important 20%
Very Important 16%
Ongoing training offered by employers Irrelevant 4%
Desirable 12%
Necessary 20%
Important 41%
Very Important 22%
Guarantee that you will be helped towards becoming
registered Irrelevant 8%
Desirable 13%
Necessary 10%
Important 32%
Very Important 38%
With 77% of students ranking salary as important or higher, the crux of the
next question was to identify how students would consider salary compared to other
components in their decision making process as shown in table 4.15. It was
hypothesised that when asking students straight out what was the single most important
factor when looking for a job, that salary would rank as the most important. Along with
long term job stability, this has been proved to be correct. However, table 4.15 shows
that when asked if other factors can be more important in the decision making process
than salary, the students do also consider other components. 94% agreed or strongly
agreed that they would consider the overall package offered as well as just the salary.
Students were divided over whether ongoing training and development was more
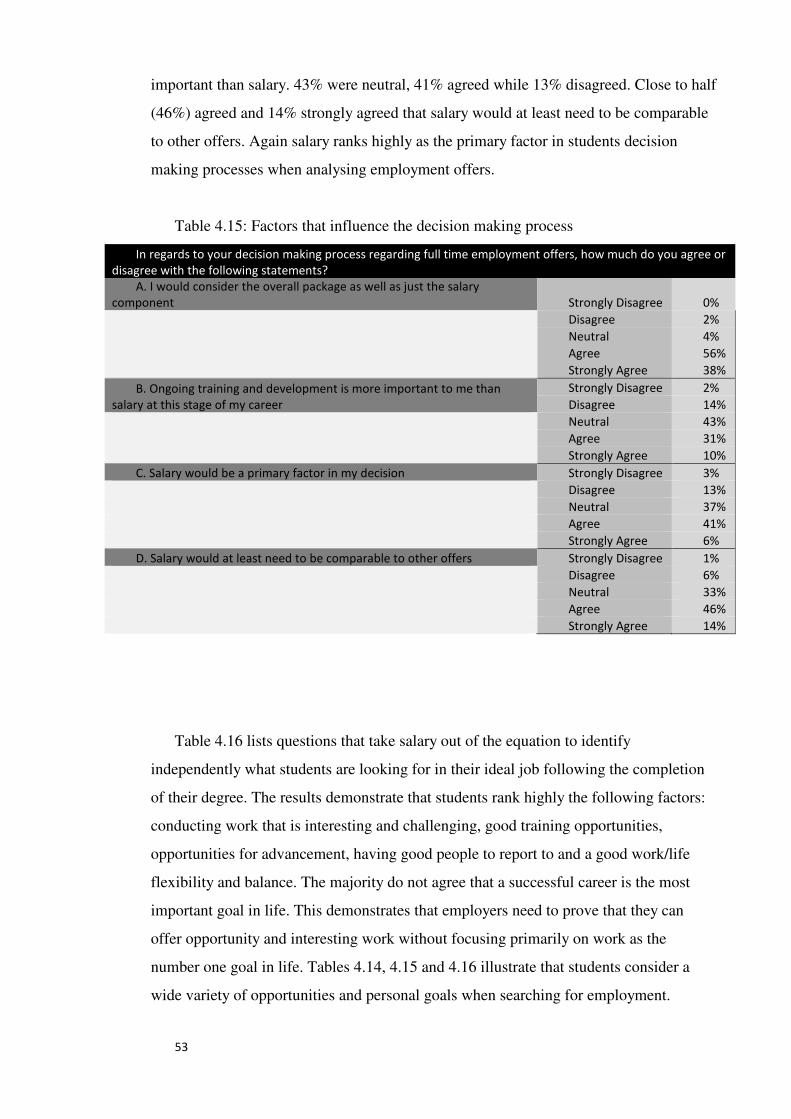
53
important than salary. 43% were neutral, 41% agreed while 13% disagreed. Close to half
(46%) agreed and 14% strongly agreed that salary would at least need to be comparable
to other offers. Again salary ranks highly as the primary factor in students decision
making processes when analysing employment offers.
Table 4.15: Factors that influence the decision making process
In regards to your decision making process regarding full time employment offers, how much do you agree or
disagree with the following statements?
A. I would consider the overall package as well as just the salary
component Strongly Disagree 0%
Disagree 2%
Neutral 4%
Agree 56%
Strongly Agree 38%
B. Ongoing training and development is more important to me than
salary at this stage of my career
Strongly Disagree 2%
Disagree 14%
Neutral 43%
Agree 31%
Strongly Agree 10%
C. Salary would be a primary factor in my decision Strongly Disagree 3%
Disagree 13%
Neutral 37%
Agree 41%
Strongly Agree 6%
D. Salary would at least need to be comparable to other offers Strongly Disagree 1%
Disagree 6%
Neutral 33%
Agree 46%
Strongly Agree 14%
Table 4.16 lists questions that take salary out of the equation to identify
independently what students are looking for in their ideal job following the completion
of their degree. The results demonstrate that students rank highly the following factors:
conducting work that is interesting and challenging, good training opportunities,
opportunities for advancement, having good people to report to and a good work/life
flexibility and balance. The majority do not agree that a successful career is the most
important goal in life. This demonstrates that employers need to prove that they can
offer opportunity and interesting work without focusing primarily on work as the
number one goal in life. Tables 4.14, 4.15 and 4.16 illustrate that students consider a
wide variety of opportunities and personal goals when searching for employment.
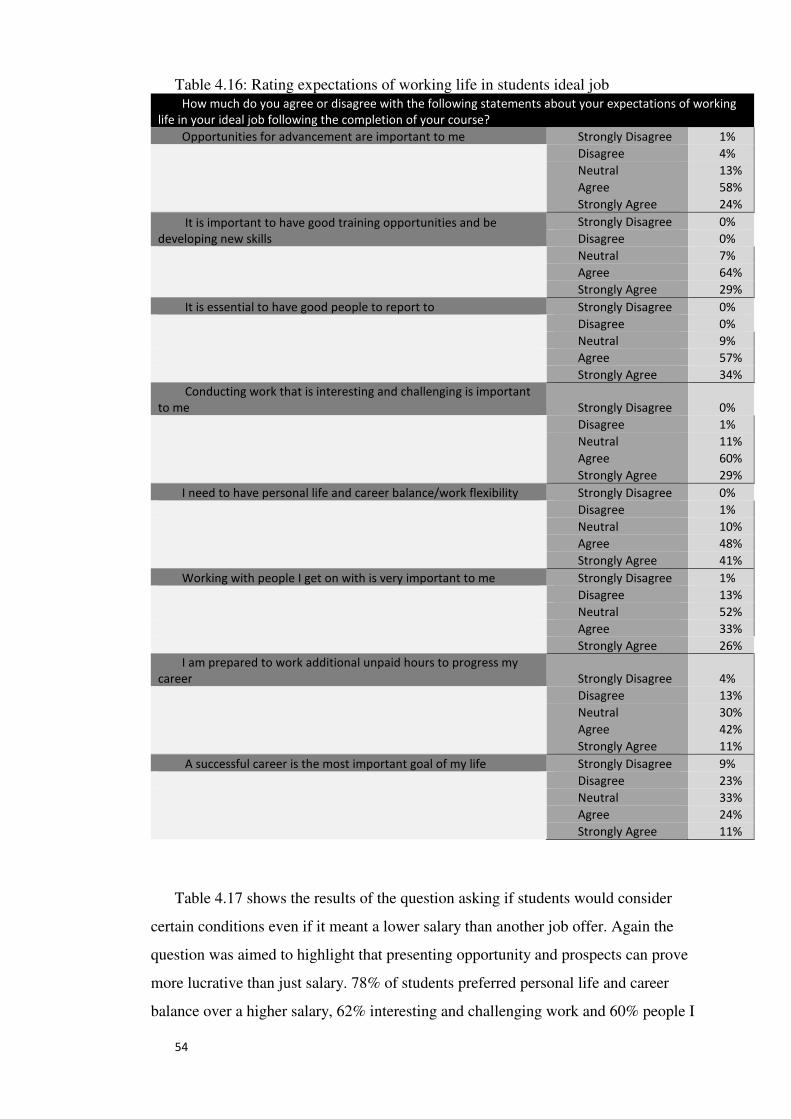
54
Table 4.16: Rating expectations of working life in students ideal job How much do you agree or disagree with the following statements about your expectations of working
life in your ideal job following the completion of your course?
Opportunities for advancement are important to me Strongly Disagree 1%
Disagree 4%
Neutral 13%
Agree 58%
Strongly Agree 24%
It is important to have good training opportunities and be
developing new skills
Strongly Disagree 0%
Disagree 0%
Neutral 7%
Agree 64%
Strongly Agree 29%
It is essential to have good people to report to Strongly Disagree 0%
Disagree 0%
Neutral 9%
Agree 57%
Strongly Agree 34%
Conducting work that is interesting and challenging is important
to me Strongly Disagree 0%
Disagree 1%
Neutral 11%
Agree 60%
Strongly Agree 29%
I need to have personal life and career balance/work flexibility Strongly Disagree 0%
Disagree 1%
Neutral 10%
Agree 48%
Strongly Agree 41%
Working with people I get on with is very important to me Strongly Disagree 1%
Disagree 13%
Neutral 52%
Agree 33%
Strongly Agree 26%
I am prepared to work additional unpaid hours to progress my
career Strongly Disagree 4%
Disagree 13%
Neutral 30%
Agree 42%
Strongly Agree 11%
A successful career is the most important goal of my life Strongly Disagree 9%
Disagree 23%
Neutral 33%
Agree 24%
Strongly Agree 11%
Table 4.17 shows the results of the question asking if students would consider
certain conditions even if it meant a lower salary than another job offer. Again the
question was aimed to highlight that presenting opportunity and prospects can prove
more lucrative than just salary. 78% of students preferred personal life and career
balance over a higher salary, 62% interesting and challenging work and 60% people I
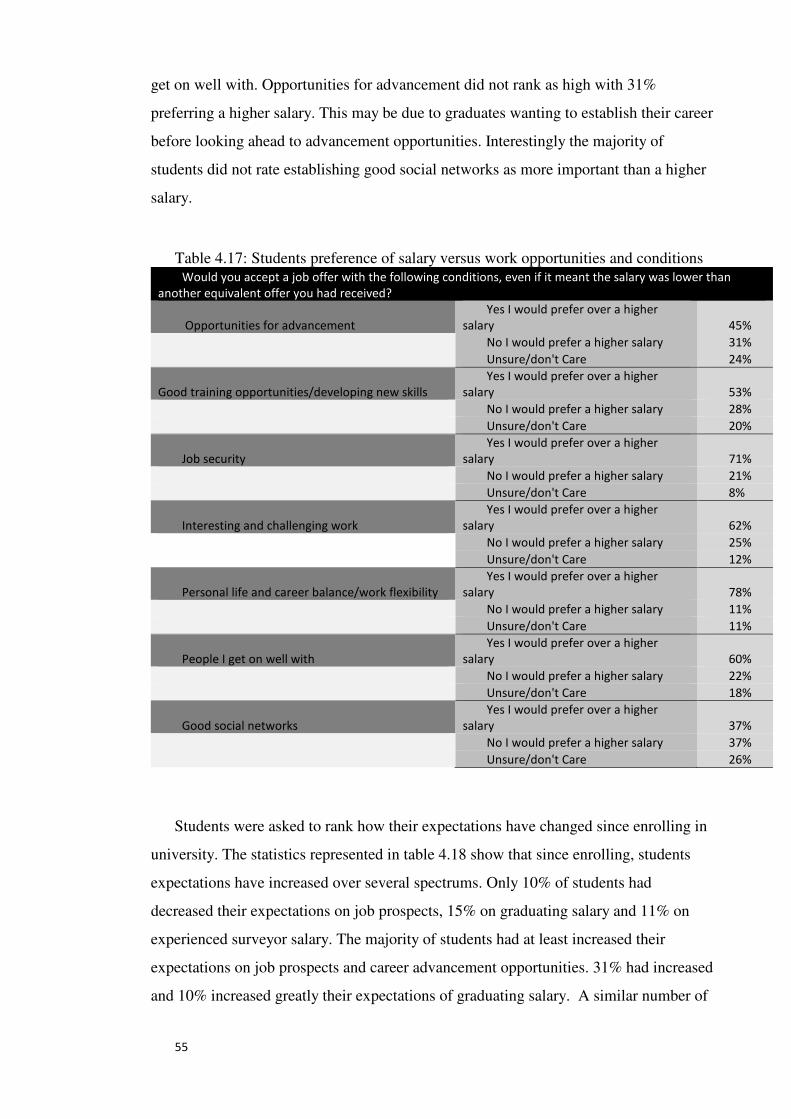
55
get on well with. Opportunities for advancement did not rank as high with 31%
preferring a higher salary. This may be due to graduates wanting to establish their career
before looking ahead to advancement opportunities. Interestingly the majority of
students did not rate establishing good social networks as more important than a higher
salary.
Table 4.17: Students preference of salary versus work opportunities and conditions Would you accept a job offer with the following conditions, even if it meant the salary was lower than
another equivalent offer you had received?
Opportunities for advancement
Yes I would prefer over a higher
salary 45%
No I would prefer a higher salary 31%
Unsure/don't Care 24%
Good training opportunities/developing new skills
Yes I would prefer over a higher
salary 53%
No I would prefer a higher salary 28%
Unsure/don't Care 20%
Job security
Yes I would prefer over a higher
salary 71%
No I would prefer a higher salary 21%
Unsure/don't Care 8%
Interesting and challenging work
Yes I would prefer over a higher
salary 62%
No I would prefer a higher salary 25%
Unsure/don't Care 12%
Personal life and career balance/work flexibility
Yes I would prefer over a higher
salary 78%
No I would prefer a higher salary 11%
Unsure/don't Care 11%
People I get on well with
Yes I would prefer over a higher
salary 60%
No I would prefer a higher salary 22%
Unsure/don't Care 18%
Good social networks
Yes I would prefer over a higher
salary 37%
No I would prefer a higher salary 37%
Unsure/don't Care 26%
Students were asked to rank how their expectations have changed since enrolling in
university. The statistics represented in table 4.18 show that since enrolling, students
expectations have increased over several spectrums. Only 10% of students had
decreased their expectations on job prospects, 15% on graduating salary and 11% on
experienced surveyor salary. The majority of students had at least increased their
expectations on job prospects and career advancement opportunities. 31% had increased
and 10% increased greatly their expectations of graduating salary. A similar number of

56
students were found to have increased expectations on career advancement opportunities
and experienced surveyor salary.
Table 4.18: Change in student’s expectations since enrolling
Since enrolling in university how have your expectations on your career
changed?
A. Job prospects Greatly decreased 1%
Decreased 9%
Unchanged 39%
Increased 33%
Increased Greatly 17%
Graduating Salary Greatly decreased 1%
Decreased 14%
Unchanged 44%
Increased 31%
Increased Greatly 10%
Experienced surveyor salary Greatly decreased 1%
Decreased 10%
Unchanged 43%
Increased 32%
Increased Greatly 13%
Career advancement opportunities Greatly decreased 1%
Decreased 7%
Unchanged 35%
Increased 41%
Increased Greatly 16%
Figure 4.9 represents students satisfaction with their career choice. Encouragingly
for the industry, 50% were satisfied with their choice and 43% were very satisfied.
These statistics are a great representation of optimism for students entering into the
Spatial Science industry.
Figure 4.9: Student satisfaction with career choice

57
The students were asked whether a range of incentives could have tempted them to
study an alternative course. This question was aimed to identify what incentives students
believe are the most enticing. Table 4.19 lists the students selections. The most popular
were offers for industry sponsored cadetships with 41%, 35% for increased graduate
salaries offered, and offers of scholarships or bursaries followed with 32% selecting this
option. Almost 25% believe industry representatives giving talks during high school
could have tempted them.
Table 4.19: Industry incentives that could have tempted students to study alternative course
Do you believe any of the following could have tempted you to study an alternative university
course?
Offer of scholarships or bursaries 32%
Industry representatives giving talks to you during high school 23%
Career guidance councillor's within high schools recommending alternatives 12%
Offers for industry sponsored cadetships 41%
Industry funded marketing of alternative careers during high school 13%
Increased graduate salaries offered 35%
Students were asked how long they expected to stay in their first job once they
graduate. This question was included to help give employers an idea of how long
students plan to stay in the job and potentially alleviate concerns some may have about
making investments in graduates. Figure 4.10 illustrates that more than 37% expect to
stay less than 3 years. 27% expect to stay 3-5 years. An even share of 18% of students
expect to stay 5-10 years and 10+ years. Importantly this question has shown that 63%
expect to stay at least 3 years in their first place of employment.
Figure 4.10: How long students expect to stay in first Spatial Science job

58
Students were asked in what timeframe after graduating do they expect to begin
working towards registration and gaining endorsements. Figure 4.11 illustrates that only
14% did not intend to work towards registration. 43% intended to begin within the first
year, with a further 23% in 1-3 years. The data from this question displays an eagerness
for students to commence working towards registration at the beginning of their careers
and gain recognition through the appropriate bodies; in Queensland, this body is the
Board of Surveyors.
Figure 4.11: Timeframe after graduation students expect to work towards
registration
Students were asked to estimate how much time they believe employers would need
to devote to help develop the average Spatial Science graduate. This question was
designed to try and find out how much support time students expect to need. The
premise for the question was that students may feel daunted at the thought of starting
fulltime work without enough support from managing staff. Figure 4.12 shows that 54%
of students expect that the average student would need 3+ hours of support a week. 30%
believe they will need 5+ hours. This demonstrates the need for employers to understand
that graduates themselves believe they will need support. It also highlights to employers

59
the need for them to ensure that they offer enough support to reassure potential
employees in the recruitment process.
Figure 4.12: Students estimation of time devotion by employer needed to develop an
average survey graduate

60
CHAPTER 5
CONCLUSION AND RECOMMENDATIONS
5.1 Key findings
The research has identified that there is in fact a registered surveyor shortage in
regional Queensland. With 46% of registered surveyors being over the age of 50 the
problem needs to be addressed in the short term. The only long term solution is to
increase the number of graduate surveyors so the potential pool of talent to go on and
become registered is increased. As shown over time as the shortage increases the
financial reward for becoming registered and gaining endorsements will become greater.
If there is enough qualified graduates to fill this void the problem can be addressed in
the medium term.
The key findings from the report are:
• Massive gender imbalance in the spatial science workforce
• Students are attracted to the spatial science industry because they know people in
the industry, the variety of work, the employment prospects and the mix of office
and field work
• When deciding on a career in surveying students are most likely to seek advice
from people in the industry, family, friends and peers; as well as do their own
research
• More than half have some work experience before they enrol
• 84% work in a surveying role either while they study or during breaks and 77%
of those students are more than likely to continue working for that employer
after they graduate
• 57% of students plan to work the majority of their career with a substantial
cadastral component of work
• Students rate their employability skills at this time as good or better for virtually
all skills
61
• 73% of students have lived outside of a metropolitan area for 12 months or more
• 55% of students students come from regional areas in the 2 years prior to
commencing university
• 53% are likely to live and work in regional areas after graduating
• 85% of students will consider working outside of metropolitan areas upon
graduation
• When looking for employment students want the guarantee of the following:-
that help will be provided to become registered, long term job stability, good
personality of bosses and appropriate salary.
• The majority of students prefer training opportunities, job security, people they
get along with, career work/life balance and interesting work over salary
• 50% of students are satisfied and 43% very satisfied with their career choice
• 63% of students expect to stay in their first full time job longer than three years
• 43% of students intended to work towards registration in the first year after
graduation
• 54% of students expect the average student will need more than 3+ hours of
support a week from their employer for development
5.2 Increasing Enrolment Rates
A continued push is needed to increase enrolment and graduation rates at both QUT
and USQ. The following recommendations are essential to increase university
enrolments:
• Address the gender imbalance through support and mentoring programmes based
on programmes in place for women in construction
Women are valuable human resources that are massively under-utilised in the
Spatial Science industry. There is also a potential to increase enrolment numbers
through marketing.
• Provide more online material for potential students to find when researching
careers
62
Almost a third of students do their own research when deciding on a career.
Attractive, informative and up to date websites need to be created and maintained
representing the Spatial Science industry as a whole. Potential students need to be able
to find all the information they need to make a career decision with a simple web search.
• Provide and educate career guidance councillors in high schools
Not one student attributed enrolling in surveying to a career guidance councillor and
only 9% sort advice of one. Research in New Zealand has clearly shown that educating
career guidance councillors and providing them with information packs increases the
exposure of the surveying industry to high school students.
• Market the Spatial Science industry to high school students
37% of students attributed the main reason they enrolled in surveying as being
because they knew someone in the industry. This suggests that Surveyors themselves are
one of the best marketers of the career. With approximately 1500 registered Surveyors
(including corporations) they make up only 0.03% of Queensland’s population. This
also suggests that unless you know a Surveyor your chances of enrolling in surveying
are greatly reduced; more than likely due to the lack of understanding of what a
Surveyor does. This points to a much needed marketing campaign to educate students in
the later years of high school.
Educational packs could be used to target active students with good mathematical
skills that would suit a career in Spatial Science. Targeting and educating students
effectively would attract better suited students that would be less likely to drop out. The
research also suggests that people from regional areas are far more likely to choose a
career in Spatial Science. Marketing needs to attract intelligent people who enjoy a mix
of indoor and outdoor work.

63
5.3 Attracting Graduates to Regional Areas
The research findings show that students are willing to consider moving to regional
areas to begin their careers. Employers need to provide a clear outline of what their
business can offer to potential graduate employees. Students have identified that the
most important factors they are looking for are:
• Long term job stability
• Competitive Salary
• Career advancement opportunities
• A guarantee that they will be helped towards becoming registered
• Ongoing training
• The personality of bosses/employees
• The type of projects they will be working on
Although salary was listed by students as the second most influential factor most are
willing to consider lower salaries for the following:
• Good training/developing new skills
• Job security
• Work/life balance
• People that they get on well with
The most important factor for employers in regional areas to consider is that
84% of all students work in a surveying role either while they study or during breaks
and 77% of those students are more than likely to continue working for that employer
after they graduate. Therefore, employers need to understand that the chances of
recruiting a student graduating from university that does not already have a job are very
slim. It is recommended that employers in regional areas:
• Make contact with students early in their degree
• Offer work experience during semester breaks

64
• Offer to employ students in their final years and offer to help them both
financially and through study support for their remaining subjects
Students have suggested that the most beneficial and feasible concessions to
facilitate study are:
• Full use of office resources and equipment when requested 71%
• Portion of study leave per semester 47%
• Unpaid time off when it is needed to study 44%
• Payment of university fees for each subject 43%
The author does not recommend attempting to put employees through a four year
degree part time and expecting to retain them once they graduate. The length of time
involved in completing the entire course part time and the stress caused by full time
work and part time study makes the expectation of keeping the employee for 8+ years
unlikely. However it is recommended that employers encourage and support unqualified
instrument hand/chainmen to study if they are interested; to help build skills in the
industry, more than simply to benefit their own business.
65
5.4 Conclusion
The research has found that there is a Surveyor shortage in regional Queensland, it
has been due to the growth of the mining industry, population increases, growth in
construction, and the ageing registered Surveyor population. The implications of the
skills shortage are loss of valuable industry knowledge, bottle necks in land
development, mining and construction projects, and an increased workload on the
remaining registered Surveyors. Provided graduate numbers can be increased and then
maintained, there is willingness in the current Spatial Science students to move to
regional areas and progress towards registration. Recruiting, mentoring and developing
graduates in regional areas is the only solution to alleviate the current shortage of
registered Surveyors in regional Queensland.

66
LIST OF REFERENCES
Australian Government n.d., Understanding skills shortages [online], Available: http://www.skillsinfo.gov.au/skills/SkillsIssues/UnderstandingSkillShortages/ Accessed 7 August 2009. DEEWR n.d. Department of Education, Employment and Workplace Relations [online], Available: www.deewr.gov.au Accessed 27 May 2009. Hannah, J 2006, ‘Australasia’s surveying skills crisis – is it marketing failure?, Shaping
the change, XXIII FIG Congress, Munich Germany, pp. 1-14. Hillman, K & Rothman, S 2007, Movement of non-metropolitan youth towards cities, Australian Council for Educational Research, Camberwell.
Campbell, G (ed) 2007, Applicant Handbook, Surveying Board of Queensland, Australia.
Shah, C & Burke, G 2003, Skills shortages: concepts, measurement and implications, Monash University Centre for the Economics and Education of Training, Australia.
Simmons, S n.d., Demographics of practices, University of Southern Queensland, Toowoomba. Surveyors Board of Queensland 2008, Annual Report, Surveyors Board of Queensland,
Australia.
Queensland Government 2003, Surveyors Act, Queensland Government, Brisbane.
Queensland Government a n.d., Ports Corporation of Queensland [online], Availbale: http://www.pcq.com.au/ Accessed 27 April 2009.
Queensland Government b n.d., Framework for Queensland mining towns [online], Available: http://www.dip.qld.gov.au/processes-frameworks/framework-for-queensland-mining-towns.html Accessed 27 April 2009.
Torbay, R 2005, Private Members Statements, Parliament of New South Wales, Australia.
Hays 2007, 2007 Salary Survey, Hays, Australia.
NAWIC n.d., National Association of Women in Construction [online], Available: http://www.nawic.com.au/ Accessed: 27 May 2009. Victorian Spatial Council 2008, ‘It’s time to put your hand up’, Landmark, no. 31, p. 5.
67
Appendix A
Appendix B

68

69

70

71

72

73