investigation of primary students’ opinions about … · asia-pacific forum on science learning...
TRANSCRIPT

Asia-Pacific Forum on Science Learning and Teaching, Volume 13, Issue 2, Article 7, p.1 (Dec., 2012)Mustafa METİN
Investigation of primary students’ opinions about using performance assessment in science and technologycourse with respect to the different variables
Copyright (C) 2012 HKIEd APFSLT. Volume 13, Issue 2, Article 7 (Dec., 2012). All Rights Reserved.
Investigation of primary students’ opinions about using performance assessment in science and technology course
with respect to the different variables
Mustafa METİN
Bozok University, Faculty of Education 66200, Yozgat, TURKEY
E-mail: [email protected]
Received 2 Apr., 2012
Revised 29 Nov., 2012
Contents
o Abstract
o Introduction
o Methodology
o Sample
o Instrument
o Analysis of data
o Findings
o Discussion and conclusion
o References
Abstract
The aim of study is to investigate opinions of primary students about using performance assessment in science and technology course with respect to the different variables. This study was carried out fall semester of 2012 with 1810 students who educated primary schools in three different provinces of northeast in Turkey. Survey methodology was used in this study. Data was gathered with a questionnaire which was developed and provided to reliability and validity by

Asia-Pacific Forum on Science Learning and Teaching, Volume 13, Issue 2, Article 7, p.2 (Dec., 2012)Mustafa METİN
Investigation of primary students’ opinions about using performance assessment in science and technologycourse with respect to the different variables
Copyright (C) 2012 HKIEd APFSLT. Volume 13, Issue 2, Article 7 (Dec., 2012). All Rights Reserved.
researcher. As a result of this study, it was determined that students have positive opinions about using performance assessment and portfolio in science and technology course. Although it was found significant difference (p<0.05) between grade level and all sub-scale of questionnaire, no significant difference were found (p>0.05) between gender and students’ opinions about using performance assessment expect POSP sub-scale. In addition to there are significant difference (p<0.05) between graduation type of students’ mother, fathers and students opinions about using performance assessment in science and technology course.
Keywords: Instructional Curriculum, Measurement-Assessment, Alternative Assessment, Performance assessment, Science and Technology Course, Primary students
Introduction
Many countries improve or renovate their instructional curriculum based on new educational approaches and developments in science and technology. In the last decade workings of renewal and updating the instructional curriculum have been conducted in Turkey. First key stage 1 instructional curriculum was changed in 2005 and key stage 2 instructional curriculums was upgraded and put into practice gradually between 2006 and 2008. New instructional curriculums were adapted to the constructivist learning approach. Hence, current views of learning and instruction in schools that emphasis student-centered, constructive teaching and learning require assessment systems to be changed to "go with" the content and style of teaching-learning experienced by students (Marzano, Pickering and McTighe, 2003; Özmen, 2004). One of most important reason of this change in measurement and assessment practices is due to educational reform in the world and Turkey is emphasizing the teaching and assessment of higher-level cognitive skills (Parshall et al, 2000; Çepni, 2007; Kutlu et al, 2008).
Measurement and assessment is one of the indispensable elements in instructional curriculum and educational process. Measurement and assessment can be employed for many educational purposes such as determining student attainment, evaluation of instructional curriculum, level of efficiency of instructional methods, deficiency and difficulty of learning (Baykul 2000; İşman, 2005; Çepni et al., 2005). Yıldırım (2006) says that the purpose of measurement-assessment is to increase the instructional quality, to convert the knowledge learnt in classroom, into the practice. It is needed

Asia-Pacific Forum on Science Learning and Teaching, Volume 13, Issue 2, Article 7, p.3 (Dec., 2012)Mustafa METİN
Investigation of primary students’ opinions about using performance assessment in science and technologycourse with respect to the different variables
Copyright (C) 2012 HKIEd APFSLT. Volume 13, Issue 2, Article 7 (Dec., 2012). All Rights Reserved.
to define the developments on the students to improve along with the instructional curriculum and to organize the suitable experiences (Coffey et al., 2005).
For this purpose various measurement and assessment techniques are used. Those techniques are generally based on the understanding of instructional strategy and methods used in in acquisition of educational standards. After cognitive and constructivist methods and techniques’ impact upon the learning was proved by the experimental studies, the process of teaching-learning has been dealt with all its dimensions (Çoklar et al., 2009). The Constructivist approach, emphasizing that every individual relates new knowledge to former knowledge and constructs the new knowledge uniquely so as far as possible teaching methods and techniques must be diversified, stresses that students must be given the multiple evaluation opportunities in which they perform their knowledge, skills and attitudes (MNE, 2005). It seems to be impossible to carry out this situation through the traditional assessment understanding. Therefore performance assessment approach which is handy to develop high level cognitive skills such as solving problem, critical thinking, analytic thinking, empathizing, deciding and creativeness, has been adopted (Çepni, 2007; Metin, 2008, Metin, 2010, Metin and Demiryürek, 2009, Kutlu et al., 2008).
It is important in performance assessment to define what skills the students have, what performance and development they execute while they are using those skills (Airasian, 2001). Hence the tasks requiring high level thinking skills are given to the students not basic, simple and plain tasks (Bransford; 1979; Logan, 1996; Linn and Gronlund; 2000; Kutlu et al., 2008). The basic purpose in that is to develop solving problem, critical thinking, creativeness skills (Kutlu et al., 2008). In addition the performance assessment provides the students to find their suggestions by exposing them to real problems (Baron, 1991; Çepni et al., 2005; Kim, 2005) rather than reminding knowledge in their memory. In this way contribution is made to their skills of problem solving. When they encounter a real problem, group working and cooperative learning can be provided.
In literature, it were expressed that performance assessment can be used to assess from multiple perspectives and assess transfer of skills and integration of content (Çepni, 2007; Kutlu et al., 2008), engages student in active learning (Airasian, 2001; Logan, 1996; Linn and Gronlund, 2000), can promote student creativity and can be summative or formative (Kubiszyn and Borich, 1993; Khattri, Reve and Kane, 1998; Airasian 2001; Metin, 2008), can promote student motivation (Metin and Birişçi, 2011), may allow probes to gain clearer picture of student understanding (Linn and

Asia-Pacific Forum on Science Learning and Teaching, Volume 13, Issue 2, Article 7, p.4 (Dec., 2012)Mustafa METİN
Investigation of primary students’ opinions about using performance assessment in science and technologycourse with respect to the different variables
Copyright (C) 2012 HKIEd APFSLT. Volume 13, Issue 2, Article 7 (Dec., 2012). All Rights Reserved.
Gronlund, 2000), can provide an avenue for student self-assessment and reflection (Airasian, 2001; Metin,2008; Metin and Birişçi, 2011, Çepni, 2007; Kutlu et al., 2008). In addition to performance assessment help students to improvement of writing skill, self-expression skill (Kubiszyn and Borich, 1993; Khattri, Reve and Kane, 1998; Airasian 2001; Birgin 2003; Çepni, 2007; Metin, 2008), presentation skill (Kubiszyn and Borich, 1993; Airasian, 2001; Aslanoğlu and Kutlu, 2003; Çepni et al.,, 2005; Çepni, 2007), inquiry skills (Khattri, Reve and Kane, 1998; Morgil et al., 2004; Metin, 2008), problem solving skill (Baron, 1991; Çepni et al., 2005; Kim, 2005), science process skill (Airasian, 2001; Morgil et al., 2004; Çepni et al., 2005) and high level thinking skill (Bransford; 1979; Logan, 1996; Linn and Gronlund, 2000; Çepni et al., 2005; Kutlu et al., 2008). Furthermore, it were expressed that performance assessment is effective concept learning (Slater, 1996; Morgil et al., 2004; Çepni et al., 2005; Çepni, 2007; Metin, 2008) and overcoming misconceptions (Morgil et al., 2004; Metin, 2008).
When it investigates benefit of performance assessment on students, it is important to define opinions of students about performance assessment. In literature, when it was seen studies related to performance assessment, these studies focus on giving theoretical knowledge about performance assessment and portfolio (Kubiszyn and Borich, 1993; Khattri, Reve and Kane, 1998; Airasian 2001; Çepni, 2007, Birgin, and Baki, 2007; Kutlu et al., 2008; Baron, 1991; Linn and Gronlund, 2000; Çepni et al., 2005), effect of portfolio on students achievement and attitude (Slater, 1996), effects of performance assessment and portfolio on students and teachers (Khattri, Reeve and Kane, 1998; Morgil et al., 2004, Metin, 2008) and teachers’ opinions about performance assessment and portfolio (Metin, 2011; Metin and Birişçi, 2011, Korkmaz and Kaptan, 2005; Birgin, 2003; Birgin, 2008, Metin and Demiryürek, 2009). But there are a few studies related to determine primary students’ opinions about using performance assessment in science and technology course. So, it is believed that this study provide an important contribution to researchers studies on performance assessment.
The aim of study is to investigate opinions of primary students about using performance assessment in science and technology course. In accordance with this objective, the study specifically focuses on the following research questions:
What do students think about effects of performance assessment? What do students have positive beliefs about using performance assessment in
science and technology course?
Asia-Pacific Forum on Science Learning and Teaching, Volume 13, Issue 2, Article 7, p.5 (Dec., 2012)Mustafa METİN
Investigation of primary students’ opinions about using performance assessment in science and technologycourse with respect to the different variables
Copyright (C) 2012 HKIEd APFSLT. Volume 13, Issue 2, Article 7 (Dec., 2012). All Rights Reserved.
What do students have negative opinions about using performance assessment in science and technology course?
What do students encounter difficulties to preparing performance task in science and technology course?
What do students opinions about using portfolio in science and technology course?
Is there a difference between students’ opinions about using performance assessment in science and technology course and genders?
Is there a difference between students’ opinions about using performance assessment in science and technology course and grade levels?
Is there a difference between students’ opinions about using performance assessment in science and technology course and graduation type of mother?
Is there a difference between students’ opinions about using performance assessment in science and technology course and graduation type of father?
Methodology
The aim of study is to investigate opinions of primary students about using performance assessment in science and technology course. This research was carried out in fall semester of 2012. Survey methodology was used in this study. Surveys can be useful when a researcher wants to collect data on phenomena that cannot be directly observed (Karasar, 2005, Cresswel, 2002). Besides, surveys are used to describe attitudes, opinions, behaviours or characteristics of a group (Çepni, 2005).
Sample
This study was carried out fall semester of 2012 with 1810 students who educated primary schools in three different provinces of northeast in Turkey. Universe of this study consist of 9820 students and forty primary schools. When sample of study were selected, it was determined that ten schools have so many students in different social economic level. Questionnaire was administered students of these schools educated 4 through 8 grade level and participate in research willingly.
According to gender variable, 53.8% male and 46.2 % female students participated in the study. Grade level variable consist of 27.6 % 4th, 25% 5th, 15.1% 6th, 16.1 7th and 16.1 8th grade. Graduation type of mother variable consists of; 4.5% unschooled, 41% Elementary school, 21% Middle schools, 21% High schools and 12.5%

Asia-Pacific Forum on Science Learning and Teaching, Volume 13, Issue 2, Article 7, p.6 (Dec., 2012)Mustafa METİN
Investigation of primary students’ opinions about using performance assessment in science and technologycourse with respect to the different variables
Copyright (C) 2012 HKIEd APFSLT. Volume 13, Issue 2, Article 7 (Dec., 2012). All Rights Reserved.
University graduated. According to graduation type of father variable are 2.5% unschooled, 20% Elementary school, 22.5% Middle schools, 32.9% High schools and 22.7% University graduated. In addition to According to monthly family income variable, 35.7 % of students’ families have $250-$500, 33.8 % have $500-$750, 33.8 % have $750-$1000 and 17.7 % have over $1000 income.
Instrument
In the research, a questionnaire used to collect data consisted of two parts. In the first part, there are some demographic questions as independent variables such as gender, grade level, graduation type of mother and father and family income variable. In the second part, there is a questionnaire which determinate to students’ opinions on performance assessment.
In this study, the questionnaire was developed through the use of five stage model proposed by (Karasar, 2005). In the first stage, many studies related to performance assessment were examined in order to determine the statements about performance assessment and how a questionnaire can be developed (Adanalı, 2008; Algan, 2008; Kanatlı, 2008; Metin, 2008; Metin, 2010; Metin and Demiryürek, 2009; Metin and Özmen, 2009; Metin and Özmen, 2010; Metin, 2011, Metin and Birişçi, 2011; Birgin, 2008, Birgin, 2003; Kan, 2007). After examining, it was carried out interview with 10 students in different grade level and they were asked to five questions about the performance assessment. The five main questions were as follows: 1) “What do you think about effects of performance assessment on students?” 2) “What do students have positive beliefs about performance assessment?” 3) “What do you have negative opinions about performance assessment?” 4) “What do you encounter difficulties to preparing performance task?” and 5) “What do you opinions about portfolio”. These interview and literature helped constitute the item pool.
In the second stage, after interview and reviewing, an item pool was developed which consisted of 50 statements about performance assessment. There were 28 positive and 22 negative statements in the item pool of draft questionnaire. After deciding on the items, an initial item pool was generated and 50 items were put on a five-point rating scale using classifications like “strongly disagree,” “disagree,” “undecided,” “agree” and “strongly agree.”
In the third stage, for the purpose of content validation, an initial draft of the instrument with 50 items on a five-point rating scale was given to a group of four

Asia-Pacific Forum on Science Learning and Teaching, Volume 13, Issue 2, Article 7, p.7 (Dec., 2012)Mustafa METİN
Investigation of primary students’ opinions about using performance assessment in science and technologycourse with respect to the different variables
Copyright (C) 2012 HKIEd APFSLT. Volume 13, Issue 2, Article 7 (Dec., 2012). All Rights Reserved.
education experts in the fields of language, educational psychology, and educational measurement. Their opinions helped to determine whether the selected items were valid items for assessing students’ opinions about performance assessment. Having received feedback from experts, 15 items were deleted because they were found unsuitable in terms of clarity. According to expert opinions, it was decided that this questionnaire consists of five sub-scales. First sub-scale called on effect of performance assessment on students consists of ten items. Second sub-scale called on positive opinions of students on performance assessment consists of six items. Third sub-scale called on negative opinions of students on performance assessment consists of six items. Fourth sub-scale called on encounter difficulties to preparing performance task consists of five items. Fifth sub-scales called on opinions of students on portfolio consist of eight items.
In the fourth stage, the final draft of the attitude scale with 35 items was administered to 1810 students for calculating validity and reliability of the attitude scale. Students’ responses were entered in an excel file created for further analyses.
In the last stage, the data collected from the 1810 students in the study was analyzed by means of factor analysis and reliability analysis through the use of SPSS 11.5. Before conducting the factor analysis of the scale, the Kaiser–Meyer Olkin (KMO) measurement of sampling adequacy and Barlett’s test were calculated to evaluate whether the sample was large enough to apply a satisfactory factor analysis and was examined to determine appropriateness of factor analysis. The KMO sampling adequacy test statistic was 0.848. This value is higher than the threshold value of 0.01 (Kline, 1994). Barlett’s test of Spherincity statistic was significant [3191.18 (p< 0.01)]. Results of KMO and Barlett’s test appear to support the validity of the factor analysis usage for this study. These five factors of questionnaire explained 65.425% of the total variance. This value is appropriate to consider that other work focused on opinions showed lower explained variance (Kline, 1994: 41%). Besides reliability analysis was performed for each of the emerged sub-scales, and the Cronbach alpha correlation coefficients were used. Then, the Cronbach alpha correlation coefficients were calculated among these factors. It was discovered that general reliable coefficient was 0.92.
Analysis of data
Students’ responses to the questionnaire were statistically analyzed according to gender and grade level variables via SPSS 11.5 software. It is just like five point
Asia-Pacific Forum on Science Learning and Teaching, Volume 13, Issue 2, Article 7, p.8 (Dec., 2012)Mustafa METİN
Investigation of primary students’ opinions about using performance assessment in science and technologycourse with respect to the different variables
Copyright (C) 2012 HKIEd APFSLT. Volume 13, Issue 2, Article 7 (Dec., 2012). All Rights Reserved.
scale and each statement were labeled as 5=completely agree, 4=mostly agree, 3=medium level agree, 2=slightly agree and 1=disagree. Positive attributions were graded as 5-1 and negative attributions were graded as 1-5 questionnaire. Ranges of agreement with the attributions on the questionnaire was determined by using (n-1)/n formula and after calculations the interval width of the range between 1 through 5 was calculated as 0.8. The interval width of 1.00-1.80 showed disagree, the 1.81-2.60 intervals showed slightly agree, the 2.61-3.40 interval showed medium level agree, the 3.41-4.20 interval showed mostly agree, and the 4.21-5.00 interval showed completely agree of agreement with the statements on questionnaire. The mean (x) percentages (%) and frequency (f) scores were computed for each attribution. In the study, some parametric tests such as t-test; one-way analysis of variance (ANOVA) based on p=0.05 significance level were used to clarify the significance of the differences on means. LSD test was used in order to determine source of the differences on means in ANOVA.
Findings
The aim of study is to investigate opinions of primary students in different level, gender graduation type of students’ mother and father about using performance assessment in science and technology course. For this aim, the questionnaire was performed students. It is showed that results of the questionnaire have five sub-scales in tables.
Frequency, percentage and means of students’ answer regarding attributions of first sub-scale called on “effects of performance assessment on students” were given in table 1.
As seen table 1, it can see that mean score of 10 attributions in effects of performance assessment on students subscale are between 3.13 and 3.78. This result revealed that eight attributions in this sub-scale are in “Agree” category and the others are in “Undecided” category. Higher average of these attributions in
Agree category are “Performance tasks provide produce new ideas for me” ( x =
3.78), “Performance tasks help to improvement of myself” ( x = 3.76),
“Performance tasks are effective to learning of topics” ( x = 3.73), “Performance
tasks improve to presentation skills of my” ( x = 3.70) and “Performance tasks
improve to inquiry skills of my” ( x = 3.68). Higher average of these attributions in undecided category are “Performance tasks develop to computer usage skills of

Asia-Pacific Forum on Science Learning and Teaching, Volume 13, Issue 2, Article 7, p.9 (Dec., 2012)Mustafa METİN
Investigation of primary students’ opinions about using performance assessment in science and technologycourse with respect to the different variables
Copyright (C) 2012 HKIEd APFSLT. Volume 13, Issue 2, Article 7 (Dec., 2012). All Rights Reserved.
my ” ( x = 3.13) and “Performance tasks increase relationship my friends” ( x = 3.28).
Table 1 Frequency, percentage and means of students’ answers regarding attributions of first sub-scale
Effects of performance assessment on students (EPS) St
ron
g D
isag
ree
Dis
agre
e
Un
dec
ided
Agr
ee
Stro
ng
Agr
ee
Mea
ns
(x̄)
f % f % f % f % f %
1 Performance tasks help to improvement of myself 290 16 130 7.2 132 7.3 426 23.5 832 46 3.76
2 Performance tasks provide produce new ideas for me 242 13.4 120 6.6 208 11.5 460 25.4 780 43.1 3.78
3 Performance tasks develop to computer usage skills of my 396 21.9 284 15.7 310 17.1 334 18.5 486 26.9 3.13
4 Performance tasks provide to execute self-assessment 290 16 162 9 284 15.7 396 21.9 678 37.5 3.56
5 Performance tasks increase relationship my friends 340 18.8 214 11.8 370 20.4 388 21.4 498 27.5 3.28
6 Performance tasks are effective to learning of topics 262 14.5 134 7.4 254 14 340 18.8 820 45.3 3.73
7 Performance tasks provide to me cooperation with my friends
286 15.8 152 8.4 302 16.7 364 20.1 706 39 3.58
8 Performance tasks improve to self-expression skills of my 314 17.3 158 8.7 262 14.5 380 21 696 38.5 3.54
9 Performance tasks improve to presentation skills of my 240 13.3 174 9.6 218 12 440 24.3 738 40.8 3.7
10 Performance tasks improve to inquiry skills of my
286 15.8 142 7.8 220 12.2 372 20.5 790 43.6 3.68
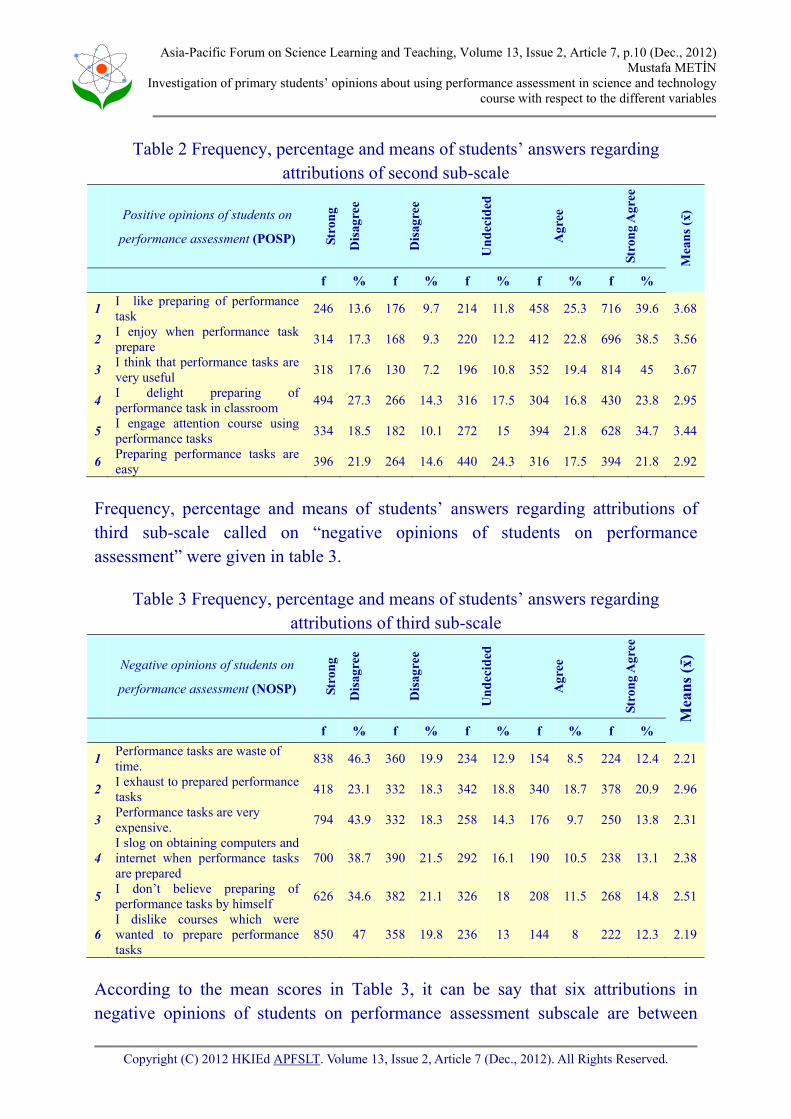
Frequency, percentage and means of students’ answers regarding attributions of second sub-scale called on “positive opinions of students on performance assessment” were given in table 2.
As a seen table 2, it can determine that mean score of 6 attributions in positive opinions of students on performance assessment subscale are between 2.92 and 3.68. This result revealed that four attributions in this sub-scale are in “Agree” category and the others are in “Undecided” category. Higher average of these attributions in Agree category are “I like preparing of performance task” (x̄ = 3.68), “I think that performance tasks are very useful” (x̄ = 3.67), “I enjoy when performance task prepare” (x̄ = 3.56) and “I engage attention course using performance tasks” (x̄ = 3.56). Higher average of these attributions in undecided category are “I delight preparing of performance e task in classroom” (x̄ = 2.95) and “Preparing performance tasks are easy” (x̄ = 2.92).
Asia-Pacific Forum on Science Learning and Teaching, Volume 13, Issue 2, Article 7, p.10 (Dec., 2012)Mustafa METİN
Investigation of primary students’ opinions about using performance assessment in science and technologycourse with respect to the different variables
Copyright (C) 2012 HKIEd APFSLT. Volume 13, Issue 2, Article 7 (Dec., 2012). All Rights Reserved.
Table 2 Frequency, percentage and means of students’ answers regarding attributions of second sub-scale
Positive opinions of students on
performance assessment (POSP) Stro
ng
Dis
agre
e
Dis
agre
e
Un
dec
ided
Agr
ee
Stro
ng
Agr
ee
Mea
ns
(x̄)
f % f % f % f % f %
1 I like preparing of performance task 246 13.6 176 9.7 214 11.8 458 25.3 716 39.6 3.68
2 I enjoy when performance task prepare 314 17.3 168 9.3 220 12.2 412 22.8 696 38.5 3.56
3 I think that performance tasks are very useful 318 17.6 130 7.2 196 10.8 352 19.4 814 45 3.67
4 I delight preparing of performance task in classroom 494 27.3 266 14.3 316 17.5 304 16.8 430 23.8 2.95
5 I engage attention course using performance tasks 334 18.5 182 10.1 272 15 394 21.8 628 34.7 3.44
6 Preparing performance tasks are easy 396 21.9 264 14.6 440 24.3 316 17.5 394 21.8 2.92
Frequency, percentage and means of students’ answers regarding attributions of third sub-scale called on “negative opinions of students on performance assessment” were given in table 3.
Table 3 Frequency, percentage and means of students’ answers regarding attributions of third sub-scale
Negative opinions of students on
performance assessment (NOSP) Stro
ng
Dis
agre
e
Dis
agre
e
Un
dec
ided
Agr
ee
Stro
ng
Agr
ee
Mea
ns
(x̄)
f % f % f % f % f %
1 Performance tasks are waste of time. 838 46.3 360 19.9 234 12.9 154 8.5 224 12.4 2.21
2 I exhaust to prepared performance tasks 418 23.1 332 18.3 342 18.8 340 18.7 378 20.9 2.96
3 Performance tasks are very expensive. 794 43.9 332 18.3 258 14.3 176 9.7 250 13.8 2.31
4 I slog on obtaining computers and internet when performance tasks are prepared
700 38.7 390 21.5 292 16.1 190 10.5 238 13.1 2.38
5 I don’t believe preparing of performance tasks by himself 626 34.6 382 21.1 326 18 208 11.5 268 14.8 2.51
6 I dislike courses which were wanted to prepare performance tasks
850 47 358 19.8 236 13 144 8 222 12.3 2.19
According to the mean scores in Table 3, it can be say that six attributions in negative opinions of students on performance assessment subscale are between

Asia-Pacific Forum on Science Learning and Teaching, Volume 13, Issue 2, Article 7, p.11 (Dec., 2012)Mustafa METİN
Investigation of primary students’ opinions about using performance assessment in science and technologycourse with respect to the different variables
Copyright (C) 2012 HKIEd APFSLT. Volume 13, Issue 2, Article 7 (Dec., 2012). All Rights Reserved.
2.19 and 2.96. This result revealed that five attributions in this sub-scale are in “Disagree” category and the other is in “Undecided” category. Higher average of these attributions in disagree category are “I dislike courses which were wanted to prepare performance tasks” (x ̄ = 2.19), “Performance tasks are waste of time” (x̄ = 2.21), “Performance tasks are very expensive” (x̄ = 2.31) and “I slog on obtaining computers and internet when performance tasks are prepared” (x̄ = 2.38). Higher average of these attributions in undecided category is “I exhaust to prepared performance tasks” (x̄ = 2.96).
Frequency, percentage and means of students’ answers regarding attributions of fourth sub-scale called on “encounter difficulties to preparing performance task” were given in table 4.
Table 4 Frequency, percentage and means of students’ answers regarding attributions of fourth sub-scale
Encounter difficulties to
preparing performance task (EDPP) St
ron
g D
isag
ree
Dis
agre
e
Un
dec
ided
Agr
ee
Stro
ng
Agr
ee
Mea
ns
(x̄)
f % f % f % f % f %
1 Preparing performance tasks embarrass recreational with friends and family
766 42.3 426 23.5 222 12.3 170 9.4 226 12.5 2.26
2 I don’t find topics wanted to preparing performance tasks in internet resource
554 30.6 442 24.6 302 16.7 248 13.7 264 14.6 2.57
3 I don’t attain necessary equipments related to performance task
684 37.8 398 22 276 15.2 216 11.9 236 13 2.4
4 Performance assessment are difficult and trying as much as preparing himself
588 32.5 398 22 524 17.9 190 10.5 310 17.1 2.91
5 I don’t identify anybody to help me for preparing performance tasks
890 49.2 346 19.1 192 10.6 154 8.5 228 12.6 2.16
When it is investigated table 3, it can see that five attributions in encounter difficulties to prepare performance task subscale are between 2.16 and 2.91. This result revealed that five attributions in this sub-scale are in “Disagree” category and the other is in “Undecided” category. Higher average of these attributions in disagree category are “I don’t identify anybody to help me for preparing performance tasks” (x ̄ = 2.16), “Preparing performance tasks embarrass recreational with friends and family” (x̄ = 2.26), “I don’t attain necessary equipments related to performance task” (x̄ = 2.4) and “I don’t find topics wanted

Asia-Pacific Forum on Science Learning and Teaching, Volume 13, Issue 2, Article 7, p.12 (Dec., 2012)Mustafa METİN
Investigation of primary students’ opinions about using performance assessment in science and technologycourse with respect to the different variables
Copyright (C) 2012 HKIEd APFSLT. Volume 13, Issue 2, Article 7 (Dec., 2012). All Rights Reserved.
to preparing performance tasks in internet resource” (x̄ = 2.57). Higher average of these attributions in undecided category is “Performance assessment are difficult and trying as much as preparing himself” (x ̄ = 2.91).
Frequency, percentage and means of students’ answers regarding attributions of fifth sub-scale called on “opinions of students on portfolio” were given in table 5.
Table 5 Frequency, percentage and means of students’ answers regarding attributions of fifth sub-scale
Opinions of students on portfolio (OSP) St
ron
g D
isag
ree
Dis
agre
e
Un
dec
ided
Agr
ee
Stro
ng
Agr
ee
Mea
ns
(x̄)
f % f % f % f % f % 1 I enjoy preparing portfolio 364 20.1 174 9.6 276 15.2 364 20.1 632 34.9 3.4
2 Portfolio provide to see all applications of my 302 20.7 164 9.1 346 19.1 410 22.7 588 32.5 3.45
3 Portfolio improve to responsibility emotion of my 308 17 160 8.8 286 15.8 388 21.4 668 36.9 3.52
4 I can see my improvement thanks to portfolio 276 15.2 194 10.7 300 16.6 400 22.1 640 35.4 3.52
5 Collection of studies in portfolio is very difficult 640 35.4 372 20.5 284 15.7 192 10.6 322 17.8 3.45
6 My exam anxiety are decrease with portfolio application 638 35.2 290 16 402 22.2 184 10.2 296 13.4 2.56
7 I can see my friends’ study with portfolio 322 17.8 216 11.9 414 21.9 378 20.9 480 26.5 3.26
8 I obtain different aspect on topic with portfolio
284 15.7 200 11 370 20.4 378 20.9 578 31.9 3.42
As a seen table 5, it can determine that mean score of 8 attributions in opinions of students on portfolio subscale are between 2.56 and 3.52. This result revealed that six attributions in this sub-scale are in “Agree” category, one attribution is in “Undecided” category and one attribution is in “Disagree” category. Higher average of these attributions in Agree category are “I can see my improvement thanks to portfolio” (x̄ = 3.52), “Portfolio improve to responsibility emotion of my” (x̄ = 3.52), “Portfolio provide to see all applications of my” (x̄ = 3.45) and “Collection of studies in portfolio is very difficult ” (x ̄ = 3.45). Attribution in Undecided category is “I can see my friends’ study with portfolio” (x̄ = 3.26) and Attribution in Disagree category is “My exam anxiety are decrease with portfolio application” (x ̄ = 2.56).

Asia-Pacific Forum on Science Learning and Teaching, Volume 13, Issue 2, Article 7, p.13 (Dec., 2012)Mustafa METİN
Investigation of primary students’ opinions about using performance assessment in science and technologycourse with respect to the different variables
Copyright (C) 2012 HKIEd APFSLT. Volume 13, Issue 2, Article 7 (Dec., 2012). All Rights Reserved.
In order to determine whether students’ opinions on performance assessment scores differed between genders of students, an independent-sample t-test was conducted. The independent-sample t-test scores can be seen in Table 6.
Table 6 Independent sample t-test scores in terms of genders Gender variable
male (n=974) female (n=836)
sd sd t p
EPS 35.40 9.363 36.16 9.903 -1.178 .666
POSP 20.09 5.801 20.36 6.296 -0.678 .045
NOSP 21.10 5.143 21.84 5.133 -2.145 .779
EDPP 17.55 4.473 18.57 4.419 -3.421 .709
OSP 26.31 6.679 26.92 6.915 -1.341 .453
The independent-sample t-test scores in table 6 show that there are significant differences between the students’ POSP (t=-0.678; p<0.05) sub-dimensions in terms of gender. However there are no significant differences between the students’ EPS (t=-1.178; p>0.05), NOSP (t=-2.145; p>0.05), EDPP (t=-3.421; p>0.05) and OSP (t=-1.341; p>0.05). According to the scores, female teachers have a little bit more positive opinions (x=20.36) towards performance assessment than males (x=20.09).
In order to see whether students’ opinions about performance assessment scores differed in terms of grade level of students, one-way between-groups ANOVA test was conducted. Table 7 provides the descriptive statistics on grade level of students.
Table 7 Summary of one way ANOVA on grade level of students Grade level
4th (n=500) 5th (n=452) 6th (n=274) 7th (n=292) 8th (n=292)
sd sd sd sd sd F p
EPS 37.92 9.487 38.03 8.043 35.76 9.076 31.95 9.751 32.30 10.33 18.01 .000
POSP 21.77 5.616 21.86 5.377 20.39 5.288 17.17 6.353 17.88 6.173 25.62 .000
NOSP 22.62 5.101 22.34 5.112 21.03 5.020 19.84 4.887 20.03 4.911 12.02 .000
EDPP 18.98 4.475 18.23 4.407 17.37 4.686 17.27 4.371 17.41 4.195 5.562 .000
OSP 27.99 6.681 28.64 6.020 27.00 6.054 23.82 6.824 23.43 6.779 24.12 .000

Asia-Pacific Forum on Science Learning and Teaching, Volume 13, Issue 2, Article 7, p.14 (Dec., 2012)Mustafa METİN
Investigation of primary students’ opinions about using performance assessment in science and technologycourse with respect to the different variables
Copyright (C) 2012 HKIEd APFSLT. Volume 13, Issue 2, Article 7 (Dec., 2012). All Rights Reserved.
According to the mean scores in Table 7, students in 4th grade level have higher score on NOSP (x ̄ =22.62) and EDPP (x ̄ =18.98), students in 5th grade level have higher score on EPP (x̄ =38.03), POSP (x ̄ =21.86) and OSP (x ̄ =28.64) sub-scales than the others students. As seen result in Table 7, The ANOVA test scores showed that in the term of students grade level, there are statistically difference at the p<.05 level in all sub-scales. In order to find out the source of the differences in students’ opinions on performance assessment in the term of grade level of students, LSD test was used and scores are shown in Table 8.
Table 8 LSD test scores on grade level
EPS POSP NOSP EDPP OSP
Grade level Se p Se p Se p Se p Se p
4
5 .851 .904 .526 .864 .461 .545 .407 .064 .594 .271
6 .986 .028 .609 .024 .534 .003 .471 .001 .688 .151
7 .966 .000 .597 .000 .524 .000 .461 .000 .674 .000
8 .966 .000 .597 .000 .524 .000 .461 .001 .674 .000
5
4 .851 .904 .526 .864 .461 .545 .407 .064 .594 .271
6 1.01 .024 .620 .018 .544 .016 .480 .074 .700 .019
7 .985 .000 .608 .000 .534 .000 .470 .041 .687 .000
8 .985 .000 .608 .000 .534 .000 .470 .082 .687 .000
6
4 .986 .028 .609 .024 .534 .003 .471 .001 .688 .151
5 1.01 .024 .620 .018 .544 .016 .480 .074 .700 .019
7 1.11 .001 .681 .000 .598 .048 .527 .842 .770 .000
8 1.11 .002 .681 .000 .598 .097 .527 .941 .770 .000
7
4 .966 .000 .597 .000 .524 .000 .461 .000 .674 .000
5 .985 .000 .608 .000 .534 .000 .470 .041 .687 .000
6 1.11 .001 .681 .000 .598 .048 .527 .842 .770 .000
8 1.09 .748 .671 .288 .588 .745 .519 .782 .757 .606
8
4 .966 .000 .597 .000 .524 .000 .461 .001 .674 .000
5 .985 .000 .608 .000 .534 .000 .470 .082 .687 .000
6 1.11 .002 .681 .000 .598 .097 .527 .941 .770 .000
7 1.09 .748 .671 .288 .588 .745 .519 .782 .757 .606
As a seen in Table 8 source of the difference in EPS and POSP subscales arise from between students in fourth-sixth, fourth-seventh, fourth-eighth grade and fifth-sixth, fifth-seventh, fifth-eighth and sixth- seventh, sixth-eighth grade levels(p<0.05). Besides, source of the difference in NOSP and EDPP subscales arise from between

Asia-Pacific Forum on Science Learning and Teaching, Volume 13, Issue 2, Article 7, p.15 (Dec., 2012)Mustafa METİN
Investigation of primary students’ opinions about using performance assessment in science and technologycourse with respect to the different variables
Copyright (C) 2012 HKIEd APFSLT. Volume 13, Issue 2, Article 7 (Dec., 2012). All Rights Reserved.
students in fourth-sixth, fourth-seventh, fourth-eighth grade and fifth-seventh grade levels(p<0.05). Furthermore, source of the difference in OSP and NOSP subscales arise from between students in fifth-sixth, fifth-eighth and sixth-seventh grade levels(p<0.05). In addition to source of the difference in OSP subscale arises from between students in fourth-seventh, fourth-eighth grade, fifth-seventh and sixth-eighth grade levels(p<0.05).
In order to determine whether students’ opinions on performance assessment scores differed between graduation type of students’ mother, one-way between-groups ANOVA test was conducted. Table 9 provides the descriptive statistics on graduation type of students’ mother.
Table 9 Summary of one way ANOVA on graduation type of students’ mother Graduation type of mother
US
(n=82) ES
(n=742) MS
(n=380)
HS (n=380)
Uni (n=226)
x̄ sd x̄ sd x̄ sd x̄ sd x ̄ s d F p
EPS 34.90 8.130 36.21 9.358 34.59 9.927 35.35 9.988 37.19 9.667 1.71 .146
POSP 18.93 5.777 20.62 5.828 19.90 6.295 19.75 6.324 20.65 5.780 1.45 .217
NOSP 20.76 5.458 21.45 4.899 21.07 5.142 21.43 5.432 22.32 5.332 1.25 .287
EDPP 17.98 4.661 17.88 4.339 17.61 4.616 18.04 4.564 19.16 4.348 2.33 .054
OSP 25.39 6.127 26.55 6.327 25.60 7.051 27.02 7.329 28.12 6.877 2.99 .018
US: Unschooled, ES, Elementary Schools; MS: Middle schools, HS: High Schools and Uni: University
According to the mean scores in Table 9, students mothers graduate from university have higher score on EPS (x ̄ =37.19), POSP (x̄ =20.65) (NOSP (x̄ =22.32), EDPP (x̄ =19.16) and OSP (x ̄ =28.12) sub-scales than the others students. Besides students mothers unschooled have lover score sub-scales than the others students in these sub-scales.
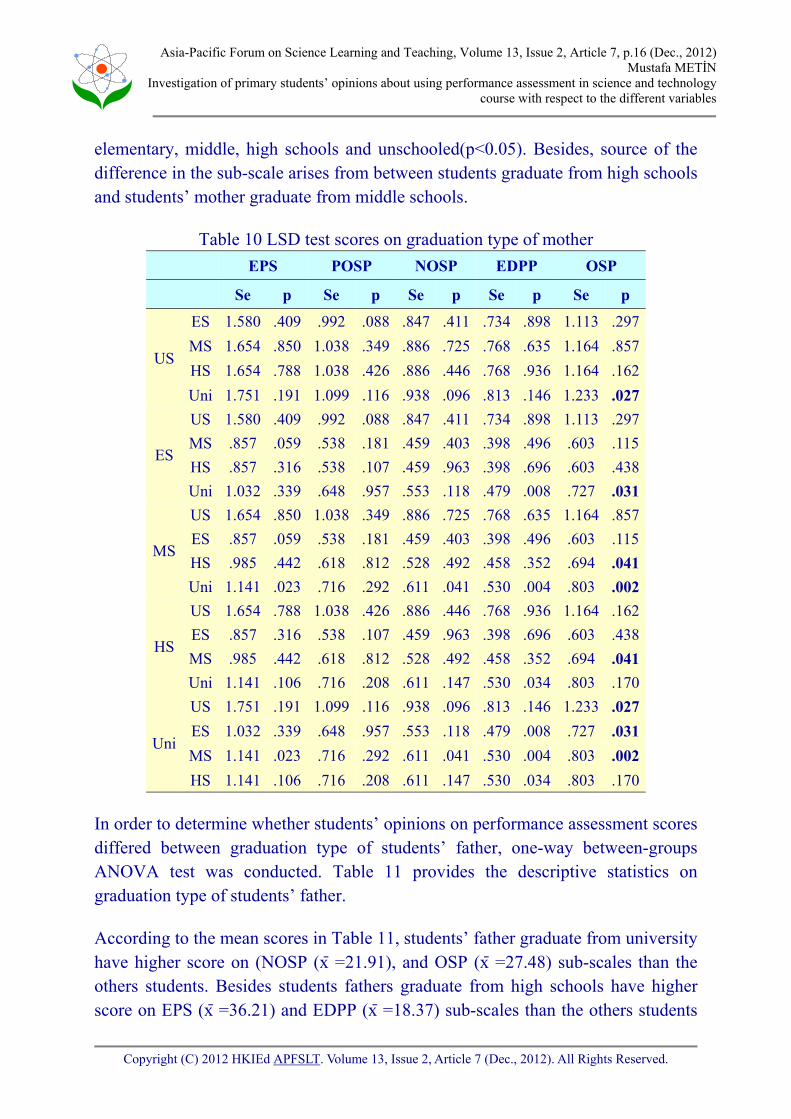
The ANOVA test scores showed that in the term of students’ mother graduate type, there are statistically difference at the p<.05 level in OSP sub-scale. In order to find out the source of the differences in students’ opinions on performance assessment in the term of students’ mother graduate type, LSD test was used and scores are shown in Table 10.
As a seen in Table 10 source of the difference in OSP sub-scale arise from between students mothers graduate from university and students’ mother graduate from
Asia-Pacific Forum on Science Learning and Teaching, Volume 13, Issue 2, Article 7, p.16 (Dec., 2012)Mustafa METİN
Investigation of primary students’ opinions about using performance assessment in science and technologycourse with respect to the different variables
Copyright (C) 2012 HKIEd APFSLT. Volume 13, Issue 2, Article 7 (Dec., 2012). All Rights Reserved.
elementary, middle, high schools and unschooled(p<0.05). Besides, source of the difference in the sub-scale arises from between students graduate from high schools and students’ mother graduate from middle schools.
Table 10 LSD test scores on graduation type of mother
EPS POSP NOSP EDPP OSP
Se p Se p Se p Se p Se p
US
ES 1.580 .409 .992 .088 .847 .411 .734 .898 1.113 .297
MS 1.654 .850 1.038 .349 .886 .725 .768 .635 1.164 .857
HS 1.654 .788 1.038 .426 .886 .446 .768 .936 1.164 .162
Uni 1.751 .191 1.099 .116 .938 .096 .813 .146 1.233 .027
ES
US 1.580 .409 .992 .088 .847 .411 .734 .898 1.113 .297
MS .857 .059 .538 .181 .459 .403 .398 .496 .603 .115
HS .857 .316 .538 .107 .459 .963 .398 .696 .603 .438
Uni 1.032 .339 .648 .957 .553 .118 .479 .008 .727 .031
MS
US 1.654 .850 1.038 .349 .886 .725 .768 .635 1.164 .857
ES .857 .059 .538 .181 .459 .403 .398 .496 .603 .115
HS .985 .442 .618 .812 .528 .492 .458 .352 .694 .041
Uni 1.141 .023 .716 .292 .611 .041 .530 .004 .803 .002
HS
US 1.654 .788 1.038 .426 .886 .446 .768 .936 1.164 .162
ES .857 .316 .538 .107 .459 .963 .398 .696 .603 .438
MS .985 .442 .618 .812 .528 .492 .458 .352 .694 .041
Uni 1.141 .106 .716 .208 .611 .147 .530 .034 .803 .170
Uni
US 1.751 .191 1.099 .116 .938 .096 .813 .146 1.233 .027
ES 1.032 .339 .648 .957 .553 .118 .479 .008 .727 .031
MS 1.141 .023 .716 .292 .611 .041 .530 .004 .803 .002
HS 1.141 .106 .716 .208 .611 .147 .530 .034 .803 .170
In order to determine whether students’ opinions on performance assessment scores differed between graduation type of students’ father, one-way between-groups ANOVA test was conducted. Table 11 provides the descriptive statistics on graduation type of students’ father.
According to the mean scores in Table 11, students’ father graduate from university have higher score on (NOSP (x ̄ =21.91), and OSP (x̄ =27.48) sub-scales than the others students. Besides students fathers graduate from high schools have higher score on EPS (x ̄ =36.21) and EDPP (x ̄ =18.37) sub-scales than the others students

Asia-Pacific Forum on Science Learning and Teaching, Volume 13, Issue 2, Article 7, p.17 (Dec., 2012)Mustafa METİN
Investigation of primary students’ opinions about using performance assessment in science and technologycourse with respect to the different variables
Copyright (C) 2012 HKIEd APFSLT. Volume 13, Issue 2, Article 7 (Dec., 2012). All Rights Reserved.
in these sub-scales. The ANOVA test scores showed that in the term of students’ father graduate type, there are statistically difference at the p<.05 level in NOSP sub-scale. In order to find out the source of the differences in students’ opinions on performance assessment in the term of students’ father graduate type, LSD test was used and scores are shown in Table 12.
Table 11 Summary of one way ANOVA on graduation type of students’ father graduation type of students’ father
US
(n=46)
ES
(n=362)
MS
(n=408)
HS
(n=596)
Uni
(n=398)
x̄ sd x̄ sd x̄ sd x̄ sd x ̄ sd F p
EPS 35.30 8.647 34.46 9.323 36.08 9.067 36.21 9.951 35.95 10.01 1.082 .364
POSP 18.78 5.600 19.59 5.837 21.02 5.665 20.29 6.143 20.00 6.394 1.808 .125
NOSP 19.91 5.923 21.34 4.377 20.59 5.164 21.90 5.092 21.91 5.650 2.935 .020
EDPP 16.65 5.175 17.90 4.002 17.50 4.788 18.37 4.321 18.31 4.646 1.949 .100
OSP 26.04 5.612 25.82 6.262 26.16 6.427 26.81 7.101 27.48 7.201 1.759 .135
Table 12 LSD test scores on graduation type of father
EPS POSP NOSP EDPP OSP
Se p Se p Se p Se p Se p
US
ES 2.129 .691 1.333 .544 1.135 .210 .988 .209 1.501 .883 MS 2.115 .714 1.325 .091 1.128 .547 .982 .391 1.491 .937 HS 2.081 .663 1.303 .247 1.109 .073 .966 .075 1.467 .602 Uni 2.118 .759 1.326 .359 1.129 .078 .983 .093 1.493 .336
ES
US 2.129 .691 1.333 .544 1.135 .210 .988 .209 1.501 .883 MS .982 .099 .615 .120 .523 .156 .456 .381 .692 .625 HS .906 .053 .568 .217 .483 .242 .421 .257 .639 .123 Uni .988 .130 .619 .509 .527 .281 .459 .370 .696 .117
MS
US 2.115 .714 1.325 .091 1.128 .547 .982 .391 1.491 .937 ES .982 .099 .615 .120 .523 .156 .456 .381 .692 .625 HS .874 .879 .547 .181 .466 .005 .406 .131 .616 .294 Uni .958 .897 .600 .088 .511 .010 .445 .069 .676 .051
HS
US 2.081 .663 1.303 .247 1.109 .073 .966 .075 1.467 .602 ES .906 .053 .568 .217 .483 .242 .421 .257 .639 .123 MS .874 .879 .547 .181 .466 .005 .406 .131 .616 .294 Uni .880 .771 .551 .597 .469 .997 .409 .872 .621 .278
Uni
US 2.118 .759 1.326 .359 1.129 .078 .983 .093 1.493 .336 ES .988 .130 .619 .509 .527 .281 .459 .370 .696 .117 MS .958 .897 .600 .088 .511 .010 .445 .069 .676 .051 HS .880 .771 .551 .597 .469 .997 .409 .872 .621 .278
Asia-Pacific Forum on Science Learning and Teaching, Volume 13, Issue 2, Article 7, p.18 (Dec., 2012)Mustafa METİN
Investigation of primary students’ opinions about using performance assessment in science and technologycourse with respect to the different variables
Copyright (C) 2012 HKIEd APFSLT. Volume 13, Issue 2, Article 7 (Dec., 2012). All Rights Reserved.
As a seen in Table 12 source of the difference in NOSP sub-scale arise from between students’ father graduate from middle schools and students’ father graduate from, high schools and University(p<0.05).
Discussion and conclusion
The aim of study is to determine opinions of students about using performance assessment in science and technology course with respect to the gender, grade level, graduation type of students’ mother and father variables. So, in this study, firstly; it was investigated that what is the overall profile of students’ opinions about using performance assessment in science and technology course. Then, it was examined that whether there are effects students’ gender, grade level, graduation type of students’ mother and father variables on their opinions about using performance assessment in science and technology course. Therefore, results of this study were collected five categories. These categories were called as effects of performance assessment on students, positive and negative opinions of students on performance assessment, encounter difficulties to preparing performance task, opinions of students on portfolio, effects of students’ gender grade level, graduation type of students’ mother and father variables on their opinions related to performance assessment.
Effects of performance assessment on students: One of the results in this study, students thinks that performance assessment have positive effects on them. Students believe that performance assessment developed presentation, inquiry, creativity skills of students and help to effective learning to topics. Besides, it was seen that students agreed some expression such as students like preparing performance task; performance assessment was provided advantage themselves, students have great pleasure from preparing performance task and lesson used performance task arouse interest to students. Students have these opinions related to performance assessment are possible. When it was investigate many studies in literature, these studies were revealed that performance assessment help students to improvement of writing skill, self-expression skill and presentation skill (Kubiszyn and Borich, 1993; Khattri, Reve and Kane, 1998; Airasian 2001; Çepni, 2007; Metin, 2008) inquiry skills (Khattri, Reve and Kane, 1998; Morgil et al., 2004; Metin, 2008), problem solving skill (Linn and Baker, 1996; Madaus, 1994; Resnick and Resnick, 1992; Shepard, 2000; Wiggins, 1993; Baron, 1991), science process skill (Airasian, 2001; Morgil et al., 2004; Çepni et al., 2005) and high level thinking skill (Bransford; 1979; Logan,
Asia-Pacific Forum on Science Learning and Teaching, Volume 13, Issue 2, Article 7, p.19 (Dec., 2012)Mustafa METİN
Investigation of primary students’ opinions about using performance assessment in science and technologycourse with respect to the different variables
Copyright (C) 2012 HKIEd APFSLT. Volume 13, Issue 2, Article 7 (Dec., 2012). All Rights Reserved.
1996; Linn and Gronlund, 2000; Çepni et al., 2005; Kutlu et al., 2008). Furthermore, it were expressed that performance assessment is effective concept learning (Slater, 1996; Morgil et al., 2004; Çepni et al., 2005; Çepni, 2007; Metin, 2008) and overcoming misconceptions (Morgil et al., 2004; Metin, 2008). There are many studies in national and international literature was similar to results of this study. According to result of this study, it is said that students think that performance assessment is positive effect to improvement of students.
Positive and negative opinions of students on performance assessment: According to means score in table 2, It can be understood that that students like preparing of performance task, think that performance tasks are very useful, enjoy when performance task prepare and engage attention course using performance tasks. Besides it is determined that students are disagree some negative expressions related to performance assessment including “I dislike courses which were wanted to prepare performance tasks”, “Performance tasks are waste of time”, “Performance tasks are very expensive” and “I slog on obtaining computers and internet when performance tasks are prepared”. According to these expressions, it is said that students have positive believes about performance assessment. Similarly Khattri, Reve and Kane, (1998); Adanalı (2008); Metin (2008) and Orhan (2007) revealed that students have positive attitude, students believe that performance assessment is useful for them, students willing to preparing performance tasks. It is understood from students’ respond that students have not negative opinions or a few negative opinions about performance assessment. Although students have not negative opinions about performance assessment in this study, many researchers expressed disadvantage of performance assessment such as performance assessment is very expensive, is very difficult, takes too much time, is waste of time is not appropriate for each students, especially learning capacity are very poor and using forms are excessive (Airasian, 2000; Airasian 2001; Linn and Gronlund, 2000; Çepni et al., 2005; Kutlu et al, 2008, Çepni, 2007; Metin and Demiryürek, 2009). It can be said that teachers are important influence that students in the study have not any negative opinions about performance assessment. Certainly, only students have positive belief regarding performance assessment is not enough to application of performance assessment in the classroom. It was necessary that teachers belief to positive effects of performance assessment on students.
Encounter difficulties to preparing performance task: According to means score in table 3, It was determined that students’ response some attributions in encounter difficulties to preparing performance task subscale such as “I don’t identify anybody

Asia-Pacific Forum on Science Learning and Teaching, Volume 13, Issue 2, Article 7, p.20 (Dec., 2012)Mustafa METİN
Investigation of primary students’ opinions about using performance assessment in science and technologycourse with respect to the different variables
Copyright (C) 2012 HKIEd APFSLT. Volume 13, Issue 2, Article 7 (Dec., 2012). All Rights Reserved.
to help me for preparing performance tasks”, “Preparing performance tasks embarrass recreational with friends and family”, “I don’t attain necessary equipments related to performance task” and “I don’t find topics wanted to preparing performance tasks in internet resource” are in disagree category. According to this result, it can be said that students have any problems when prepared performance assessment. But in the literature, students were not prepared performance task. Also, there are some studies, it asserted that mother and fathers of students prepared performance tasks of students (Metin, 2010; Adanalı, 2008; Kutlu et al., 2008)
Opinions of students on portfolio: In the study, it was seen that students have some positive and negative opinions about portfolio. Students expressed that portfolio provide to developed responsibility sense, monitored self-development and all of studies. Similarly, Birgin, (2003), Adanalı (2008) Airasian, (2001), Metin, (2010), Birgin (2008), Birgin and Baki, (2007) revealed that portfolio provide to develop responsibility sense of students and monitor peer and self-development. It was determined that students have negative opinions together with positive opinions about portfolio. Students think that portfolio is not decrease example anxiety of students. On the contrary in this study this result is found, there are some study revealed that portfolio is decrease example anxiety of students (Birgin, 2003; Kutlu et al., 2008; Çepni, 2007, Metin, 2010; Airasian, 2001; Linn and Gronlund, 2000). This conditions result from application of portfolio ineffectively in the classroom. Although teachers said to portfolio is used to assess students’ development, teachers are continue to old customs and assess to students as summary assessment. This result was supported to studies of Adanalı (2008), Algan, (2008), Kanatlı (2008); Metin (2010); Metin and Demiryürek, (2009); Güven and Eskitürk, (2007).
Another negative opinion of students about portfolio, students were expressed that it was difficult to save performance tasks in portfolio. Actually, it is difficult that students save many performance tasks in portfolio. Many researchers were supported to this expression. Birgin, (2003), Kutlu et al., (2008), Çepni, (2007), Metin, (2010), Airasian, (2001), Linn and Gronlund, (2000), Kan, (2007) were denoted that one of the restriction of portfolio is difficult to save performance task in a term. There are some researchers to suggest for electronic portfolio in order to elimination of this restriction (Birgin, 2003; Korkmaz and Kaptan, 2005; Kutlu et al., 2008).
Effects of students’ gender, grade level, graduation type of students’ mother and father variables on students’ opinions: There are significant differences between the positive opinions of students on performance assessment

Asia-Pacific Forum on Science Learning and Teaching, Volume 13, Issue 2, Article 7, p.21 (Dec., 2012)Mustafa METİN
Investigation of primary students’ opinions about using performance assessment in science and technologycourse with respect to the different variables
Copyright (C) 2012 HKIEd APFSLT. Volume 13, Issue 2, Article 7 (Dec., 2012). All Rights Reserved.
sub-dimensions in terms of gender. According to the scores, female teachers have a little bit more positive opinions towards performance assessment than males. This conditions result from achievement of female students preparing performance task more than male students. This result was supported by Zhang et al (1999). This study was revealed that female students more achievement than male students when performance task were prepared in the classroom.
According to test scores in the term of students’ grade level, there are statistically difference in all sub-scales of questionnaire. Source of the difference in four sub-scales expect opinions of students on portfolio sub-scale arise from between students in fourth and sixth, seventh and eighth grade level. This result showed that students in fourth grade have more positive opinions than the others students. Besides it can be said that all students in different grade level have same opinions on portfolio. In addition to, Source of the difference in four sub-scales expect encounter difficulties to preparing performance task sub-scale arise from between students in fifth and sixth, seventh and eighth grade level. This result showed that students in fifth grade have more positive opinions than the others students. Besides it can be said that all students in different grade level same encounter difficulties to preparing performance. As seen results of study, it can be said that students in fourth and fifth grade level have more positive opinions on performance assessment than students in sixth, seventh and eighth grade level and students in sixth grade level have more positive opinions on performance assessment than students in seventh and eighth grade level. It can be understood from the results that when experiences of students regarding performance assessment are increase, opinions of students about performance assessment are increaser positively. This result was supported by Airasian (2001) and Metin (2010). These researchers were expressed that when performance assessment was applied consistently in the classroom, students developed positive opinions towards performance assessment and begun to enjoy performance assessment. In this regard, it can effect to students enjoying of students on performance assessment can be effected that experience of students in fourth and fifth grade level towards performance assessment are anymore than others students.
It was determined that in the term of students’ mother graduate type, there is statistically different significant in opinions of students on portfolio sub-scale. Source of the difference in the sub-scale arise from between students mothers graduate from university and students’ mother graduates from elementary, middle, high schools and unschooled. Besides, source of the difference in the sub-scale arise from between students graduate from high schools and students’ mother graduate

Asia-Pacific Forum on Science Learning and Teaching, Volume 13, Issue 2, Article 7, p.22 (Dec., 2012)Mustafa METİN
Investigation of primary students’ opinions about using performance assessment in science and technologycourse with respect to the different variables
Copyright (C) 2012 HKIEd APFSLT. Volume 13, Issue 2, Article 7 (Dec., 2012). All Rights Reserved.
from middle schools. Students’ mother graduate from university have more positive opinions on portfolio than the others students. Furthermore, students’ mother graduates from high schools have more positive opinions on portfolio than the students’ mother graduates from middle schools. In other words, the students whose parents’ educational level is high give more importance to their portfolio file than other students do. It is possible that the ıf mothers, responsible for their children development, are conscious, they have positive contribution. The conscious mothers support their children to do homework and try guiding as well as they helps their children in every field. It is believed that this situation contributes to success belief of children and flourishing positive attitude towards the performance tasks.
According to scores in the term of students’ father graduate type; there is statistically difference in negative opinions of students on performance assessment sub-scale. Source of the difference in NOSP sub-scale arise from between students’ father graduate from middle schools and students’ father graduate from, high schools and University(p<0.05). According to those findings it is seen that the students whose fathers graduated from university or high-school have more positive thoughts than the students whose fathers graduated from key stage 2, do. It is stated that ıf the parents requiring active role in both the performance assessment approach and the traditional assessment approach, undertake necessary responsibilities, they will make contribution to student achievement (Birgin, 2003, Çepni, 2007; Kutlu et al, 2008). It is thought that the students whose fathers graduated from university, are such directed more consciously and supported by their fathers that they have less negative thoughts about the performance assessment than the other students.
References
Airasian P.W. (2001). Classroom assessment: Concepts and application. New York: McGraw-Hill.
Adanalı, K. (2008). Alternative Assessment in Social Science: The Evaluation of Alternative Assessment Practices in 5th Grade Social Science Lessons. Unpublished Master Dissertation, Social science Institute of Çukurova University, Adana.
Algan, S. (2008). An Analysis on Measurement and Assessment of Social Studies Teaching Program of 6th and 7th Grade in Primary Schools in Terms of Opinions of The Teachers. Unpublished Master Dissertation, Social science Institute of Çukurova University, Adana.
Aslanoğlu, A.E. & Kutlu, Ö.,(2003) Öğretimde Sunu Becerilerinin Değerlendirilmesinde Dereceli Puanlama Anahtarı (Rubric) Kullanılmasına İlişkin Bir Araştırma, Ankara Üniversitesi Eğitim Fakültesi Dergisi, 36, (1-2), 25-36.
Asia-Pacific Forum on Science Learning and Teaching, Volume 13, Issue 2, Article 7, p.23 (Dec., 2012)Mustafa METİN
Investigation of primary students’ opinions about using performance assessment in science and technologycourse with respect to the different variables
Copyright (C) 2012 HKIEd APFSLT. Volume 13, Issue 2, Article 7 (Dec., 2012). All Rights Reserved.
Baron J. B. (1991). Performance assessment: Blurring the edges of assessment, curriculum, and instruction. In: Kulm G, Malcolm SM (eds.), Science assessment in the service of reform. Washington, DC: American Association for the Advancement of Science, pp. 247-266.
Baykul, Y., (2000). Eğitimde ve Psikolojide Ölçme: Klasik Test Teorisi ve Uygulaması, ÖSYM Yayınları, Ankara.
Birgin O. (2003). Investigation of the Application Level of a Computer Based Portfolio. Unpublished Master Dissertation, Science Institute of Karadeniz Technical University, Trabzon
Birgin, O. & Baki, A. (2007). The Use of Portfolio to Assess Student’s Performance. Journal of Turkish Science Education, 4, (2), 75-90.
Birgin, O. (2008). Students’ Views about the Application of Portfolio Assessment as an Alternative Assessment Method. Journal of Turkish Educational Science, 6(1), 1-24.
Bransford, J. D., (1979). Human cognition: Learning, understanding, and remembering. Belmont, CA: Wadsworth.
Coffey, J. E., Sato, M. & Thıebault, M. (2005). Classroom Assessment Up Close – and personal. Teacher Development, 9(2), 169-184.
Creswell, J.W. (2002). Educational Research: Planning, Conducting, and Evaluating Quantitative and Qualitative Research. Upper Saddle River, Merrill Prentice Hall: New Jersey.
Çepni S, Ayas, A., Akdeniz, A.R, Özmen, H., Yiğit, N., & Ayvacı, H,.(2005) Kuramdan Uygulamaya Fen ve Teknoloji Öğretimi, Pegema Yayıncılık 4. Baskı.
Çepni, S. (2007). Assessment of performances. In. Karip, E. (Ed.), Measurement and Assessment. Pegema Publication, First Edition.
Çoklar, A.N., Vural, L., & Şahin, Y.L. (2009). Approaches in Measurement and Evaluatıon and Self-Effıcacy in the Use of Technology for Measurement and Evaluation for Pre-service Teachers. Adıyaman University Journal of Social Science, 2(3), 35-54.
Güven, B. & Eskitürk, M. (2007). Using Techniques and Methods of Primary Pre-Service Teachers in Measurement and Assessment. 16th National Educational Science Congress.
İşman, A. ( 2005). Measurement and Assessment in Turkish Educational Systems. Pegema Publication, First Edition.
Kan, A. (2007). Portfolio Assessment. Hacettepe University Journal of Education, 32, 133-144
Kanatlı, F. (2008). The Evaluation of Classroom Teachers' Opinions on the Alternative Techniques of Assessments and Measurements. Unpublished Master Dissertation, Social science Institute of Mustafa Kemal University, Hatay.
Karasar, N. (2005). Scientific Research Methods. Nobel Publication, 15th Edition. Kim S. (2005). Effects of implementing performance assessment on student learning:
Meta-analysis using Hlm. Unpublished Doctoral Dissertation, The Pennsylvania State University.
Khattri, N., Reeve, A.L., & Kane, M.B. (1998). Principles and practices of performance assessment. Mahwah, NJ: Lawrence Erlbaum Associates.
Kline, P. (1994). An Easy Guide To Factor Analysis. London: Routledge. Korkmaz, H. & Kaptan F., (2005) An Investigation on Using Electronic Portfolio for
Assessing Students’ Development in Science Education. The Turkish Online Journal of Educaton Technology, 4 (1), 13.

Asia-Pacific Forum on Science Learning and Teaching, Volume 13, Issue 2, Article 7, p.24 (Dec., 2012)Mustafa METİN
Investigation of primary students’ opinions about using performance assessment in science and technologycourse with respect to the different variables
Copyright (C) 2012 HKIEd APFSLT. Volume 13, Issue 2, Article 7 (Dec., 2012). All Rights Reserved.
Kubıszyn, T. & Borıch, G. (1993). Educational Testing and Measurement: Classroom Application and Practice. HarperCollinsCollegePublishers, Fourth Edition.
Kutlu O, Dogan C, & Karakaya I. (2008). Öğrenci başarısının belirlenmesi performansa ve portfolyoya dayalı durum belirleme [Determination of Students’ achievement: performance and portfolio Based Assessment], Pegema Publication, First Edition Ankara.
Linn, R. L., & Baker. E. L. (1996). Can performance-based student assessments be psychometrically sound?, In J. B. Babon & D. P. Wolf (Eds.), Performance-based student assessment: Challenges and possibilities. Chicago, IL: University of Chicago press.
Linn, R. L., & Gronlund, N. E. (2000). Measurement and assessment in teaching. Upper Saddle River, NJ: Merrill.
Logan, C. R., (1996). The Relationship Between İnstruction and Assessment, Unpublished Doctoral dissertation. The Pennsylvania State University, Pennsylvania, USA
Madaus, G. F. (1994). A technological and historical consideration of equity issues associated with proposals to change the nation’s testing policy. Harvard Educational Review, 64(1), 76-91.
Marzano, R.J., Pickering, D. & McTighe, J. (2003). The changing face of educational assessment. www.ascd.org/publications/books/61193179/chapter1.html (Accessed: May 2007).
MNE (Ministry of National Education of Turkey) (2006). İlköğretim fen ve teknoloji dersi (6–8 sınıflar) öğretim programı[Elementary school science and technology curriculum (grades 6–8)], Ankara, Turkey.
Metin, M. (2008). Investigation of Performance Assessment’s Effect on Pre-Service Teachers, Contemporary education journal, 354, 28-35
Metin, M. & Demiryürek, G. (2009). Opinions of Turkish Teachers about Measurement- Assessment Approach of Renewed Turkish Education Programmes. Ondokuz Mayıs University Journal Of Education, 28, 37-51.
Metin, M. & Özmen, H. (2009). Determination of Teachers’ In-Service Education (Inset) Needs on Performance Assessment: A sample from Artvin Provenience, Last Development on Science, Social and Environmental Education, Giresun University, Faculty of Education.
Metin M. (2010). Effectiveness of Preparing In-service Training programs for Science and Technology Teachers on Performance Assessment. Unpublished Doctoral Dissertation, Science Institute of Karadeniz Technical University, Trabzon.
Metin M. & Özmen, H. (2010). Determination of Science and Technology Teachers’ In-Service Education (Inset) Needs on Performance Assessment. Kastamonu Educational Journal, 18 (3), 819-838.
Metin, M. & Birişçi, S. (2010). Pre-Service Teachers’ Opinions on Effects of Performance - Based Assessment: A Sample of “Environmental Problem. The Journal of Turkish Educational Sciences, 8 (3), 527-567.
Metin, M. (2011). The examinations of teachers’ attitude towards performance assessment with respect to the different variables. Energy Education Science and Technology Part B: Social and Educational Studies, 3(3): 269-284.
Metin, M. & Birişçi, S. (2011). Opinions of Primary Teachers in Different Branch about Alternative Assessment. Education and Science, 36(159), 140-153.

Asia-Pacific Forum on Science Learning and Teaching, Volume 13, Issue 2, Article 7, p.25 (Dec., 2012)Mustafa METİN
Investigation of primary students’ opinions about using performance assessment in science and technologycourse with respect to the different variables
Copyright (C) 2012 HKIEd APFSLT. Volume 13, Issue 2, Article 7 (Dec., 2012). All Rights Reserved.
Metin, M. & Özmen, H. (2011) Investigating Opinions of Teachers about Performance Assessment Respect to the Gender and Branch Variables. Journal of Turkish Science Education, 8 (4), 3-17.
Morgil, I., Cingör, N., Erökten, S., & Yavuz, S. (2004), Portfolio Application in Computer Based Chemistry Education. The Turkish Journal of Educational Technology, 3(2), 15.
Orhan, A. T. (2007). Exploring the Alternative Assessment Strategies by Considering Primary School Pre-Service Teachers’ and Students’ Dimensions. Unpublished Doctoral Dissertation, Educational Science Institute of Gazi University, Ankara.
Özmen, H., (2004). Learning theories and the constructivist learning supported with technology in science teaching. The Turkish Online Journal of Educational Technology, 3(1), 14.
Parshall, C. G., Davey, T., & Pashley, P. J. (2000). Innovative item types for computerized testing. In W. J. van der Linden & C. Glas (Eds.), Computerized adaptive testing: Theory and practice. Boston: Kluwer.
Resnick, L. B., & Resnick, D. P. (1992). Assessing the thinking curriculum: New tools for educational reform. In B. R. Gifford, & M. C. O’Connor. (Eds.), Changing assessments: alternative views of aptitude, achievement, and instruction. Norwell, MA: Kluwer Academic Publishers
Shepard, L. A. (2000). The role of classroom assessment in teaching and learning (CSE Technical Report. No. 517). Los Angeles: UCLA Center for Research on Evaluation, Standards, and Student Testing.
Slater, T.F. (1996). The Effectiveness of Portfolio Assessments in Science. Journal of College Science Teaching, 26(5), 315-318.
Wiggins, G. (1993). Assessment: Authenticity, context, and validity. Phi Delta Kappan, 83, 200-214.
Yıldırım, A. (2006). Opinions about measurement and assessment in secondary schools (Samples of Diyarbakir and Elazığ), Unpublished Master Dissertation, Social science Institute of Elazığ University, Elazığ.
Zhang, L. Wilson, L. & Manon, J. (1999). An Analysis of Gender Differences on Performance Assessment in Mathematics--A Follow-Up Study. Eric Document: ED431791.