investigation on pedestrian pelvis loading … · investigation on pedestrian pelvis loading...
TRANSCRIPT

INVESTIGATION ON PEDESTRIAN PELVIS LOADING MECHANISMS USING FINITE ELEMENT SIMULATIONS
Yukou Takahashi1, Shunji Suzuki1, Miwako Ikeda1, Yasuaki Gunji1
1Honda R&D Co., Ltd. Automobile R&D Center
ABSTRACT The objective of this study was to investigate mechanisms of pedestrian pelvis loading due to impact from various vehicle front ends using finite element (FE) human and vehicle models. Three types of vehicles were chosen to represent different loading patterns to the pelvis of a pedestrian. Full-scale car-pedestrian impact simulations using these vehicle models were performed with different pedestrian conditions to identify major factors of pelvis loading for different loading patterns. In addition, FE simulations using an isolated pelvis model were run to clarify factors of determining pelvis internal load distributions when subjected to different loading patterns. The results suggested that inertial contributions from the upper body and the contralateral lower limb need to be accurately incorporated when evaluating pelvis injuries in pedestrians struck by various types of vehicles. Keywords: PEDESTRIANS, PELVIS, MECHANICS, HUMAN BODY, FINITE ELEMENT METHOD PEDESTRIAN PROTECTION has drawn a significant social attention world wide in recent years. According to the latest international accident statistics from the OECD database (International Road Traffic and Accident Database, 2009), pedestrian fatalities accounted for 8-35% in European countries, 12% in the US, 13% in Canada, 13% in Australia, 37% in South Korea, and 33% in Japan of all traffic fatalities in 2008. In Japan, the number of pedestrian fatalities (1,976) has now become even greater than that of passenger car occupants (1,269). Under these circumstances, a world-wide effort has been dedicated to enhance pedestrian safety and a global technical regulation (gtr) on pedestrian safety has been adopted by the World Forum for Harmonization of Vehicle Regulations (UNECE/WP29) in November, 2008. Kikuchi et al. (2008) investigated PCDS (Pedestrian Crash Data Study) database in the US and ITARDA (Institute for Traffic Accident Research and Data Analysis) database in Japan, and found that head and lower limb (including the pelvis) injuries are most frequent in AIS2+ pedestrian injuries in both databases. In addition, they also examined the distribution of AIS2+ pelvis and lower limb injuries by vehicle type from the PCDS database, and found that in pedestrian accidents with SUVs/minivans, pelvis fracture is by far the most frequent type of injury, accounting for approximately 40% of all AIS2+ pelvis and lower limb injuries, while tibia/fibula fractures are most frequent with sedans. Pelvis fractures could result in significant threat to life due to major blood loss because pelvic fractures resulting from high-energy blunt mechanisms of injury are at considerable risk for major hemorrhagic sequelae secondary to disruption of the intimate relationship between the arterial vascular supply and the pelvic sidewall, disruption of the rich presacral venous plexus (retroperitoneal hemorrhage), and/or fracture of the vascular cancellous bone within the pelvis (Eastridge et al., 1997). For this reason, even though a high frequency of pelvis fractures is seen only in collisions with SUVs/minivans, mitigation of pelvis fractures has been one of the major issues in pedestrian protection. Although a number of past studies focused on pedestrian pelvis fractures, the mechanism of pedestrian pelvis fractures has not been well understood. Hamada et al. (2003) performed finite element (FE) simulations using a human FE model representing a pedestrian in a standing position and a simplified vehicle front end model representing various geometries to investigate correlation between human pelvis injuries and an existing test procedure for pedestrian thigh and pelvis injuries developed by EEVC (European Enhanced Vehicle safety Committee). Although they clarified the effect of vehicle geometry on pelvis loading including energy absorbed by a vehicle front structure, the mechanism of human pelvis loading and its representation using the existing subsystem impactor have not been discussed. Snedeker et
IRCOBI Conference - Hanover (Germany) - September 2010 169

al. (2005) performed human model FE simulations and full body PMTO (Post Mortem Test Object) tests to validate the human model and propose modifications to the EEVC upper leg test protocol. Although they discussed the results of bone surface strain measurements on the superior pubic ramus, femoral neck and femoral mid-shaft from the FE simulations and experiments, they did not further investigate mechanism of pelvis loading due to which these strains were generated. In addition, they only discussed minor modifications to the EEVC test procedure based on the bonnet leading edge height and published failure criteria from previous studies, without examining validity of the use of the upper legform relative to pelvis loading mechanisms from the FE simulations using a detailed human FE model. The goal of this study was to investigate mechanisms of pedestrian pelvis loading due to impact from various vehicle front ends using FE human and vehicle models. Three types of vehicles were chosen to represent different loading patterns to the pelvis of a pedestrian. Full-scale car-pedestrian impact simulations using these vehicle models were performed with different pedestrian conditions to identify major factors of determining pelvis loading for different loading patterns. In addition, FE simulations using an isolated pelvis model were run to clarify factors of determining pelvis internal load distributions when subjected to different loading patterns. METHODOLOGY HUMAN FE MODEL : In the current study, all the FE simulations were run using PAM-CRASH. The human FE model used in this study for investigating pedestrian pelvis loading mechanisms was based on the one developed by Kikuchi et al. (2006) representing a mid-sized male anthropometry. The pelvis of the baseline model was further modified such that lateral impact responses match up with the results of the dynamic lateral loading tests using isolated human pelves performed by Salzar et al. (2008). Fig. 1 compares the modified model used in the current study with the original pelvis model from Kikuchi et al. (2006). Since the geometry of the original pelvis model was created using CT scans from a human body that may not be a representative of a mid-sized male pelvis geometry, the overall width of the pelvis was scaled to 262 mm taken from the anthropometric data developed by the University of Michigan Transportation Research Institute (Robbins, 1983) to accurately represent the anthropometry of a mid-sized male. The average mesh size of the pelvis model was approximately 9 mm. The geometry and material property of the hip joint ligaments were modified based on the anatomy book (Gray’s anatomy, 1995) and Stewart et al. (2002), respectively, to minimize moment generated around the hip joint when the lower limb
Kikuchi et al.
Anterior View Posterior View
Modified Model
Fig. 1 – Comparison of Pelvis Model
LigamentCartilage
Kikuchi et al.
Anterior View Posterior View
Modified Model
Fig. 1 – Comparison of Pelvis Model
LigamentCartilage
170 IRCOBI Conference - Hanover (Germany) - September 2010

is adducted relative to the pelvis. The geometry of the ligaments around the sacro-iliac (SI) joint was modified based on the anatomy book (Gray’s anatomy, 1995), and their stiffness was taken from that of the hip joint ligaments. The sacrum originally modeled as a rigid body was modeled using shell elements representing the cortical bone. Due to the complexity of the geometry of the sacrum, the mechanical contribution of the trabecular bone inside the cortical layer was lumped into the cortical layer to avoid distortion of the elements and maintain quality of the mesh for model robustness. The thickness of 1.8 mm was chosen for the sacrum such that good match was obtained between responses from the experiment and FE simulation in iliac loading. The geometry of the symphysis pubis was modified based on CT scans of a human pelvis and the data from Vix et al. (1970). The width of the symphysis pubis was set at 5.6 mm and 4.0 mm on the anterior and posterior sides, respectively. The material property of the symphysis pubis was determined such that force-deflection response in compression up to the deflection of 0.8 mm matches that from Dakin et al. (2001) as performed by Kikuchi et al. (2006), while a stiffer region was incorporated for larger deflection to represent bottoming of the symphysis pubis. The articular cartilage represented by solid elements was added to both the SI joint and the acetabulum. The thickness of these cartilaginous layers was determined by referring to the anatomy book (Gray’s anatomy, 1995) and Walker (1992). Due to the lack of information available from the literature, the same material property as that of the symphysis pubis was applied to the cartilage except the stiffer region representing the bottoming. The same material property was applied to the pelvic bone and the sacrum. The Young’s modulus of the bone was taken from the original model, and other material parameters including the yield stress, ultimate stress and ultimate strain were determined during the model validation process against the experiment performed by Salzar et al. (2008). Bone fracture was represented by using the element elimination option with a total strain criterion in PAM-CRASH. It was found that the resulting ultimate stress and strain were within the range of variations from the experimental results by Kemper et al. (2008). In addition, kinematics of the full body model has been validated in sedan and SUV impacts as performed by Kikuchi et al. (2008), confirming that all the trajectories are within the trajectory corridors. PELVIS MODEL VALIDATION : In addition to the pelvis model validation performed by Kikuchi et al. (2006), the modified pelvis model was further validated against recently performed dynamic lateral loading tests of isolated human pelves by Salzar et al. (2008). Fig. 2 shows the schematics of the test set-up. A 76.6 kg drop impactor impacted a transfer beam to which a loading surface to a pelvis specimen was attached. Loads were applied to either the iliac wing or the acetabulum, and load paths through the sacrum and the pubis were separated by cutting the contralateral side of the pelvis to measure posterior (through the sacrum) and anterior (through the pubis) reaction forces individually. As a loading surface, a metallic ball and a padded rigid plate were used for acetabulum and iliac loading tests, respectively. Six dynamic tests were run for each of the two loading configurations. The average impact velocities were 2.8 and 1.9 m/s for the acetabulum and iliac loading tests, respectively. The pubic rami fractured in all of the acetabulum loading tests. In the iliac loading tests, two specimens sustained pelvis fracture (at the SI joint and the sacrum) and four subjects sustained laxity or dislocation of the SI joint. The distribution of the load transmitted through the anterior and posterior load paths were 64% and 36% in acetabulum impacts, and 11% and 89% in iliac wing impacts. In order to provide validation data for the modified pelvis model, force-deflection response corridors were developed based on the test results from Salzar et al. (2008). For the iliac impact tests, the results from two out of six specimens (tests #11 and #16) were not used due to significant difference in the geometry of the pelvis. All the data were geometrically scaled to a mid-sized male using 262 mm of the overall width of the pelvis, as performed in pelvis model scaling. Due to variability introduced in the experimental set-up including a small gap between the impact surface and the loading location on the pelvis, it was not possible to align the onset of the pelvis loading appropriately. For this reason, test data after the reaction force reached 100 N for the acetabulum impacts, or 500 N for the iliac impacts, were used. The data up to the first peak of the reaction forces were used for the corridor development, assuming that the drop of the force was associated with failure of bones or ligaments. In iliac impacts, only very small anterior reaction forces were
IRCOBI Conference - Hanover (Germany) - September 2010 171
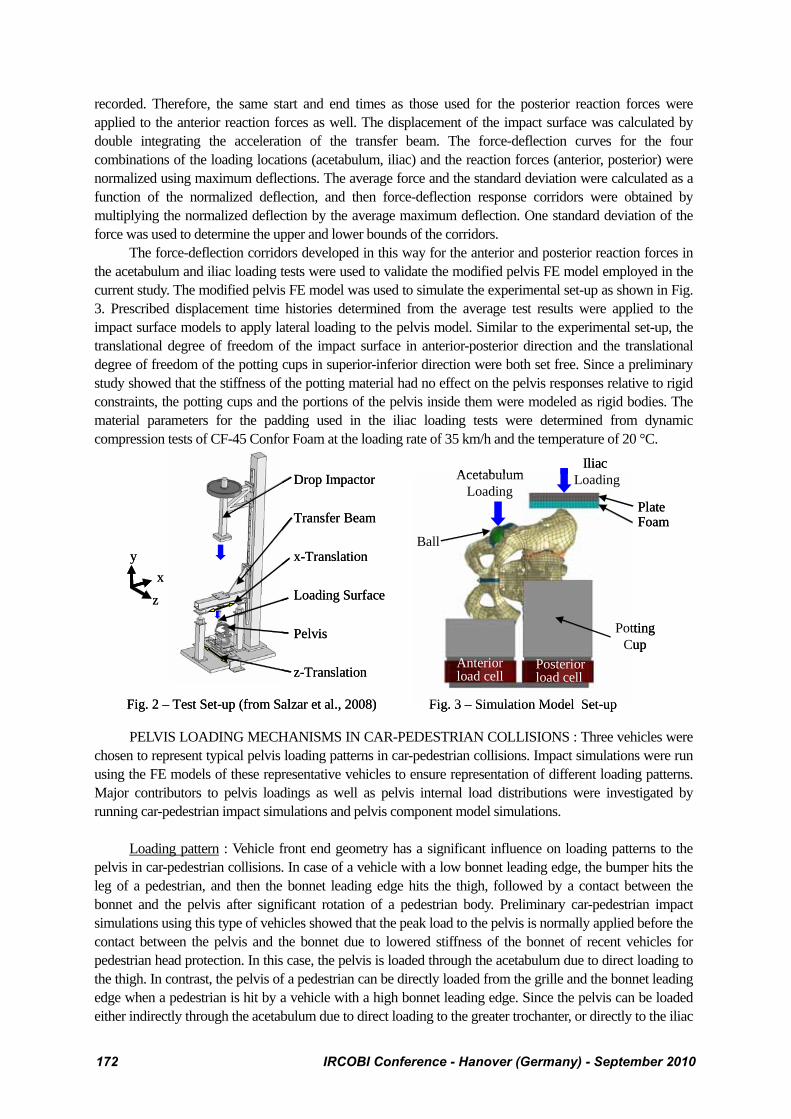
recorded. Therefore, the same start and end times as those used for the posterior reaction forces were applied to the anterior reaction forces as well. The displacement of the impact surface was calculated by double integrating the acceleration of the transfer beam. The force-deflection curves for the four combinations of the loading locations (acetabulum, iliac) and the reaction forces (anterior, posterior) were normalized using maximum deflections. The average force and the standard deviation were calculated as a function of the normalized deflection, and then force-deflection response corridors were obtained by multiplying the normalized deflection by the average maximum deflection. One standard deviation of the force was used to determine the upper and lower bounds of the corridors.
The force-deflection corridors developed in this way for the anterior and posterior reaction forces in the acetabulum and iliac loading tests were used to validate the modified pelvis FE model employed in the current study. The modified pelvis FE model was used to simulate the experimental set-up as shown in Fig. 3. Prescribed displacement time histories determined from the average test results were applied to the impact surface models to apply lateral loading to the pelvis model. Similar to the experimental set-up, the translational degree of freedom of the impact surface in anterior-posterior direction and the translational degree of freedom of the potting cups in superior-inferior direction were both set free. Since a preliminary study showed that the stiffness of the potting material had no effect on the pelvis responses relative to rigid constraints, the potting cups and the portions of the pelvis inside them were modeled as rigid bodies. The material parameters for the padding used in the iliac loading tests were determined from dynamic compression tests of CF-45 Confor Foam at the loading rate of 35 km/h and the temperature of 20 °C.
PELVIS LOADING MECHANISMS IN CAR-PEDESTRIAN COLLISIONS : Three vehicles were chosen to represent typical pelvis loading patterns in car-pedestrian collisions. Impact simulations were run using the FE models of these representative vehicles to ensure representation of different loading patterns. Major contributors to pelvis loadings as well as pelvis internal load distributions were investigated by running car-pedestrian impact simulations and pelvis component model simulations.
Loading pattern : Vehicle front end geometry has a significant influence on loading patterns to the pelvis in car-pedestrian collisions. In case of a vehicle with a low bonnet leading edge, the bumper hits the leg of a pedestrian, and then the bonnet leading edge hits the thigh, followed by a contact between the bonnet and the pelvis after significant rotation of a pedestrian body. Preliminary car-pedestrian impact simulations using this type of vehicles showed that the peak load to the pelvis is normally applied before the contact between the pelvis and the bonnet due to lowered stiffness of the bonnet of recent vehicles for pedestrian head protection. In this case, the pelvis is loaded through the acetabulum due to direct loading to the thigh. In contrast, the pelvis of a pedestrian can be directly loaded from the grille and the bonnet leading edge when a pedestrian is hit by a vehicle with a high bonnet leading edge. Since the pelvis can be loaded either indirectly through the acetabulum due to direct loading to the greater trochanter, or directly to the iliac
Loading Surface
Fig. 2 – Test Set-up (from Salzar et al., 2008)
z
xy x-Translation
Drop Impactor
z-Translation
Transfer Beam
Pelvis
Ball
Plate
Potting Cup
Iliac LoadingAcetabulum
Loading
Anteriorload cell
Posteriorload cell
Fig. 3 – Simulation Model Set-up
Foam
Loading Surface
Fig. 2 – Test Set-up (from Salzar et al., 2008)
z
xy x-Translation
Drop Impactor
z-Translation
Transfer Beam
Pelvis
Ball
Plate
Potting Cup
Iliac LoadingAcetabulum
Loading
Anteriorload cell
Posteriorload cell
Fig. 3 – Simulation Model Set-up
Foam
172 IRCOBI Conference - Hanover (Germany) - September 2010

wing, the following three different loading patterns can be envisioned: A. Pelvis loading through the acetabulum due to direct loading to the leg and thigh B. Pelvis loading through the acetabulum due to direct loading to the greater trochanter C. Pelvis direct loading to the iliac wing associated with direct loading to the greater trochanter
Although loading patterns A and B are similar, these patterns may produce different pelvis loadings due to proximity of the greater trochanter to the pelvis. When the iliac wing is directly loaded by the bonnet leading edge, normally vehicle front structures below the leading edge loads the greater trochanter simultaneously. Three different representative vehicles were chosen to represent the three loading patterns (hereafter called the sedan, SUV and minivan). Car-pedestrian impact simulations were performed using FE models of these three vehicles and a human FE model developed by Kikuchi et al. (2008) with the pelvis model replaced by the modified model. The impact speed was set at 40 km/h and the pedestrian was hit laterally from the left. Fig. 4 shows the simulation models for the three vehicles at the time of initial contact and the time of peak load applied to the pelvis. A gravitational field was applied to the pedestrian model. The lower limbs were rotated about the latero-medial axis by 10° with the right limb forward to represent a gait stance. In case of the sedan, no direct loading was applied to the pelvis before the peak pelvis load was reached. For the SUV, the greater trochanter was loaded by the bonnet leading edge. When hit by the minivan, both the greater trochanter and the iliac wing were loaded by the bonnet leading edge (iliac wing) and the lower structure (greater trochanter). Based on this observation, these three car-pedestrian impact simulations were used as a baseline of the investigation of pedestrian pelvis loading mechanisms. Major contributors to pelvis loading : The motion of the pelvis of a pedestrian when hit by a vehicle is governed by the following integral form of equation of motion: where m represents the equivalent mass of the pelvis, v represents the velocity of the pelvis, F represents the external force applied to the pelvis, and dt represents the time duration of the application of the force. The initial velocity of the pelvis was assumed to be zero. Since the load applied to the pelvis from the upper body and the lower limbs are loads inside a pedestrian body, only external forces applied from a vehicle front structure were considered to constitute F, and the effect of the internal forces were lumped in the effective mass. This equation can be interpreted that F is determined by v, dt, and m. Since loading to a pedestrian at the height of the pelvis from a vehicle front structure provides geometric constraint to the pelvis motion, the results of the baseline car-pedestrian impact simulations were analyzed in terms of correlation between vehicle front shape and v and dt. From equation (1), the other
dtFmv ∫= (1)dtFmv ∫= (1)
Initial
Peak PelvisLoad
Sedan SUV Minivan
Fig. 4 – Full Scale Impact Simulation Models for Sedan, SUV and Minivan
Initial
Peak PelvisLoad
Sedan SUV Minivan
Fig. 4 – Full Scale Impact Simulation Models for Sedan, SUV and Minivan
IRCOBI Conference - Hanover (Germany) - September 2010 173
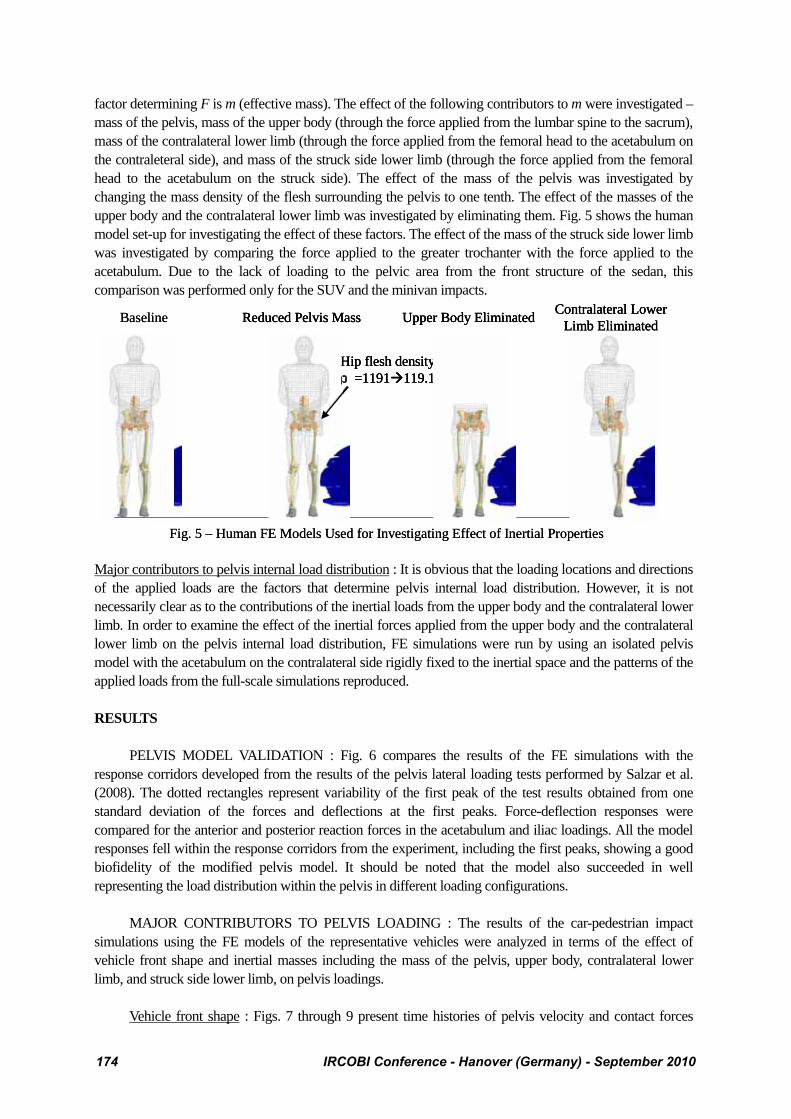
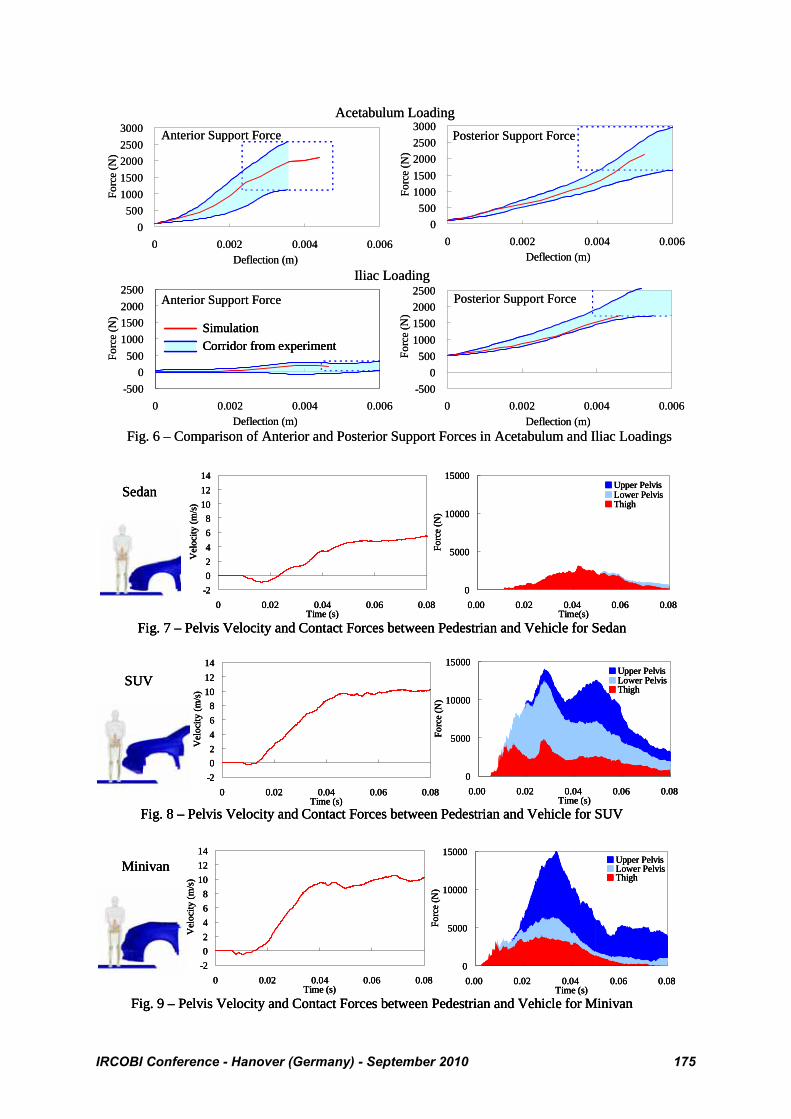
factor determining F is m (effective mass). The effect of the following contributors to m were investigated – mass of the pelvis, mass of the upper body (through the force applied from the lumbar spine to the sacrum), mass of the contralateral lower limb (through the force applied from the femoral head to the acetabulum on the contraleteral side), and mass of the struck side lower limb (through the force applied from the femoral head to the acetabulum on the struck side). The effect of the mass of the pelvis was investigated by changing the mass density of the flesh surrounding the pelvis to one tenth. The effect of the masses of the upper body and the contralateral lower limb was investigated by eliminating them. Fig. 5 shows the human model set-up for investigating the effect of these factors. The effect of the mass of the struck side lower limb was investigated by comparing the force applied to the greater trochanter with the force applied to the acetabulum. Due to the lack of loading to the pelvic area from the front structure of the sedan, this comparison was performed only for the SUV and the minivan impacts. Major contributors to pelvis internal load distribution : It is obvious that the loading locations and directions of the applied loads are the factors that determine pelvis internal load distribution. However, it is not necessarily clear as to the contributions of the inertial loads from the upper body and the contralateral lower limb. In order to examine the effect of the inertial forces applied from the upper body and the contralateral lower limb on the pelvis internal load distribution, FE simulations were run by using an isolated pelvis model with the acetabulum on the contralateral side rigidly fixed to the inertial space and the patterns of the applied loads from the full-scale simulations reproduced. RESULTS PELVIS MODEL VALIDATION : Fig. 6 compares the results of the FE simulations with the response corridors developed from the results of the pelvis lateral loading tests performed by Salzar et al. (2008). The dotted rectangles represent variability of the first peak of the test results obtained from one standard deviation of the forces and deflections at the first peaks. Force-deflection responses were compared for the anterior and posterior reaction forces in the acetabulum and iliac loadings. All the model responses fell within the response corridors from the experiment, including the first peaks, showing a good biofidelity of the modified pelvis model. It should be noted that the model also succeeded in well representing the load distribution within the pelvis in different loading configurations. MAJOR CONTRIBUTORS TO PELVIS LOADING : The results of the car-pedestrian impact simulations using the FE models of the representative vehicles were analyzed in terms of the effect of vehicle front shape and inertial masses including the mass of the pelvis, upper body, contralateral lower limb, and struck side lower limb, on pelvis loadings. Vehicle front shape : Figs. 7 through 9 present time histories of pelvis velocity and contact forces
Baseline Reduced Pelvis Mass
Hip flesh density:ρ=1191 119.1
Upper Body Eliminated Contralateral Lower Limb Eliminated
Fig. 5 – Human FE Models Used for Investigating Effect of Inertial Properties
Baseline Reduced Pelvis Mass
Hip flesh density:ρ=1191 119.1
Reduced Pelvis Mass
Hip flesh density:ρ=1191 119.1
Upper Body EliminatedUpper Body Eliminated Contralateral Lower Limb Eliminated
Contralateral Lower Limb Eliminated
Fig. 5 – Human FE Models Used for Investigating Effect of Inertial Properties
174 IRCOBI Conference - Hanover (Germany) - September 2010
0500
10001500200025003000
0 0.002 0.004 0.006Deflection (m)
Forc
e (N
)
-5000
5001000150020002500
0 0.002 0.004 0.006Deflection (m)
Forc
e (N
)
0500
10001500200025003000
0 0.002 0.004 0.006Deflection (m)
Forc
e (N
)
Posterior Support Force
SimulationCorridor from experiment
Acetabulum Loading
Iliac Loading
Anterior Support Force
-5000
5001000150020002500
0 0.002 0.004 0.006Deflection (m)
Forc
e (N
)
Fig. 6 – Comparison of Anterior and Posterior Support Forces in Acetabulum and Iliac Loadings
Anterior Support Force Posterior Support Force
0500
10001500200025003000
0 0.002 0.004 0.006Deflection (m)
Forc
e (N
)
-5000
5001000150020002500
0 0.002 0.004 0.006Deflection (m)
Forc
e (N
)
0500
10001500200025003000
0 0.002 0.004 0.006Deflection (m)
Forc
e (N
)
Posterior Support Force
SimulationCorridor from experimentSimulationCorridor from experiment
Acetabulum Loading
Iliac Loading
Anterior Support Force
-5000
5001000150020002500
0 0.002 0.004 0.006Deflection (m)
Forc
e (N
)
Fig. 6 – Comparison of Anterior and Posterior Support Forces in Acetabulum and Iliac Loadings
Anterior Support Force Posterior Support Force
Fig. 9 – Pelvis Velocity and Contact Forces between Pedestrian and Vehicle for Minivan
-202468
101214
0 0.02 0.04 0.06 0.08Time (s)
Vel
ocity
(m/s)
Minivan
0
5000
10000
15000
0.00 0.02 0.04 0.06 0.08Time (s)
Forc
e (N
)
Upper PelvisLower PelvisThigh
Fig. 7 – Pelvis Velocity and Contact Forces between Pedestrian and Vehicle for Sedan
Sedan
0
5000
10000
15000
0.00 0.02 0.04 0.06 0.08Time(s)
Forc
e (N
)
Upper PelvisLower PelvisThigh
-202468
101214
0 0.02 0.04 0.06 0.08Time (s)
Vel
ocity
(m/s)
Fig. 8 – Pelvis Velocity and Contact Forces between Pedestrian and Vehicle for SUV
SUV
0
5000
10000
15000
0.00 0.02 0.04 0.06 0.08Time (s)
Forc
e (N
)
Upper PelvisLower PelvisThigh
-202468
101214
0 0.02 0.04 0.06 0.08Time (s)
Vel
ocity
(m/s)
Fig. 9 – Pelvis Velocity and Contact Forces between Pedestrian and Vehicle for Minivan
-202468
101214
0 0.02 0.04 0.06 0.08Time (s)
Vel
ocity
(m/s)
Minivan
0
5000
10000
15000
0.00 0.02 0.04 0.06 0.08Time (s)
Forc
e (N
)
Upper PelvisLower PelvisThigh
Fig. 9 – Pelvis Velocity and Contact Forces between Pedestrian and Vehicle for Minivan
-202468
101214
0 0.02 0.04 0.06 0.08Time (s)
Vel
ocity
(m/s)
Minivan
0
5000
10000
15000
0.00 0.02 0.04 0.06 0.08Time (s)
Forc
e (N
)
Upper PelvisLower PelvisThigh
Fig. 7 – Pelvis Velocity and Contact Forces between Pedestrian and Vehicle for Sedan
Sedan
0
5000
10000
15000
0.00 0.02 0.04 0.06 0.08Time(s)
Forc
e (N
)
Upper PelvisLower PelvisThigh
-202468
101214
0 0.02 0.04 0.06 0.08Time (s)
Vel
ocity
(m/s)
Fig. 7 – Pelvis Velocity and Contact Forces between Pedestrian and Vehicle for Sedan
Sedan
0
5000
10000
15000
0.00 0.02 0.04 0.06 0.08Time(s)
Forc
e (N
)
Upper PelvisLower PelvisThigh
-202468
101214
0 0.02 0.04 0.06 0.08Time (s)
Vel
ocity
(m/s)
Fig. 8 – Pelvis Velocity and Contact Forces between Pedestrian and Vehicle for SUV
SUV
0
5000
10000
15000
0.00 0.02 0.04 0.06 0.08Time (s)
Forc
e (N
)
Upper PelvisLower PelvisThigh
-202468
101214
0 0.02 0.04 0.06 0.08Time (s)
Vel
ocity
(m/s)
Fig. 8 – Pelvis Velocity and Contact Forces between Pedestrian and Vehicle for SUV
SUV
0
5000
10000
15000
0.00 0.02 0.04 0.06 0.08Time (s)
Forc
e (N
)
Upper PelvisLower PelvisThigh
-202468
101214
0 0.02 0.04 0.06 0.08Time (s)
Vel
ocity
(m/s)
IRCOBI Conference - Hanover (Germany) - September 2010 175

between the pedestrian and the vehicle in the direction of vehicle travel obtained from the impact simulations using the three representative vehicle models (sedan, SUV and minivan). Contact forces were divided into three components – contact of the vehicle front structure with the thigh, lower pelvis (between the lower end of the greater trochanter and the middle of the pelvis) and upper pelvis (upper half of the pelvis). In case of the sedan, only the thigh was loaded and the pelvis was accelerated to 3.4 m/s by the time of the peak load of 3.1 kN at 43 ms. In case the SUV, the thigh and the lower pelvis were loaded with much smaller load to the upper pelvis, and the pelvis was accelerated to 5.1 m/s, by the time of the peak load of 14.1 kN at 28 ms. As for the minivan, all of the thigh and the lower and upper pelves were loaded and the pelvis was accelerated to 8.3 m/s by the time of the peak load of 15.2 kN at 34 ms. In the sedan impact, due to the lack of the pelvis engagement as shown in Fig. 4, velocity change of the pelvis was smaller and duration to the peak load was longer than the other two vehicles, resulting in much smaller peak load, as suggested by equation (1). In contrast, in the SUV and minivan impacts, the pelvis was engaged by the front end of the vehicles as shown in Fig. 4, and velocity change of the pelvis was larger with shorter duration to the peak load, resulting in much larger peak load. In addition, the distribution of the load applied from the vehicle front end significantly differed between the SUV and the minivan due to the difference in the height of the bonnet leading edge. Inertial mass : Figs. 10 through 12 show time histories of contact forces between the pedestrian and the vehicle obtained from the impact simulations using the combinations of the three representative vehicle models and the human models shown in Fig. 5. The leftmost graphs represent the results of the baseline simulations without any changes to the human model. Any changes in inertial mass of a human body did not significantly affect the load distributions for all the vehicles, suggesting that the load distributions depend largely on vehicle front shape rather than inertial properties of a pedestrian. The decrease in the masses of the pelvis and the contralateral lower limb significantly decreased the peak load for all the vehicles. The reduction of the density of the pelvis flesh decreased the peak load by 31 % for the sedan, 24 % for the SUV, and 34 % for the minivan. The elimination of the contralateral lower limb decreased the peak load by 42 % for the sedan, 16 % for the SUV, and 24 % for the minivan. In contrast, the lack of the mass of the upper body did not significantly affect the peak load in the SUV and minivan impacts, while the peak load was increased with the sedan by 71 %. Fig. 13 shows the kinematics of the pedestrian in the sedan impact at 45 ms for the human models with and without the upper body, along with the comparison of the time histories of energy absorbed by the bonnet skin and stiffener for the human models with and without the upper body. The kinematics comparison shows that due to the lack of the upper body, the thigh leaned more against the bonnet, leading to more energy absorption of the bonnet skin and stiffener. In order to examine the effect of the mass of the struck side lower limb, Fig. 14 compares the time histories of the lower and upper pelvis contact forces and the contact force between the femoral head and the acetabulum in the direction of vehicle travel for the SUV and minivan impacts. For both vehicles, no significant difference is seen between the lower pelvis (greater trochanter) contact force and the acetabulum contact force up to the onset of the upper pelvis contact force. This suggests that the contribution of the inertia of the struck side lower limb to pelvis loading is negligible. MAJOR CONTRIBUTORS TO PELVIS INTERNAL LOAD DISTRIBUTION : Fig. 15 shows the contours of the pelvis maximum equivalent stress at the time of peak stress from the baseline impact simulations using the three vehicle models. Since the hip joint ligaments apply load to the pelvis and the contribution of the hip joint ligament force is relatively large in the sedan impact, the applied load to the acerabulum included the ligament force. The arrows in the figure represent the direction of the applied loads, and the magnitude and angle of the loads were also noted. In a collision with the sedan, the peak stress was 86 MPa generated at the superior pubic ramus on the struck side. The direction of the load applied to the acetabulum was downward (-64° from the horizontal direction) with the magnitude of 1.0 kN. In the SUV impact, the peak acetabulum force was applied laterally (8°) with the magnitude of 4.6 kN. The applied load to the ilium was 1.2 kN. In contrast, when hit by the minivan, the load applied to the acetabulum (1.3 kN)
176 IRCOBI Conference - Hanover (Germany) - September 2010
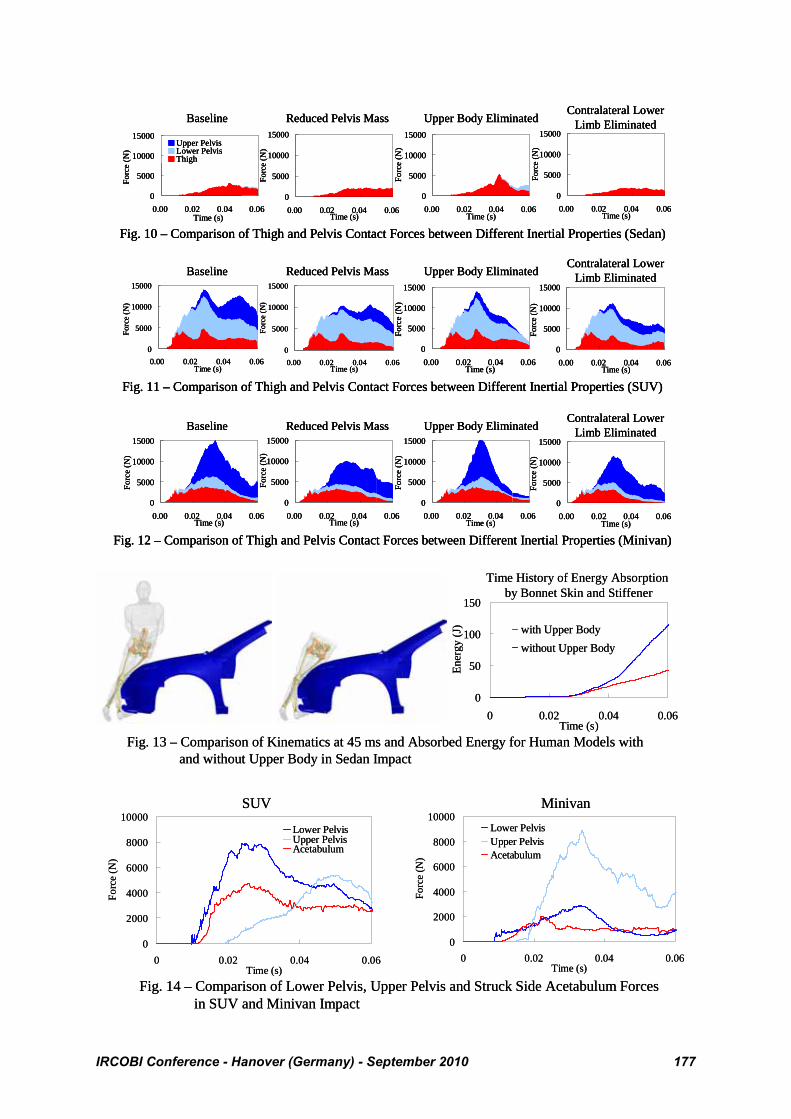
Fig. 10 – Comparison of Thigh and Pelvis Contact Forces between Different Inertial Properties (Sedan)
Baseline Reduced Pelvis Mass Upper Body EliminatedContralateral Lower
Limb Eliminated
0
5000
10000
15000
0.00 0.02 0.04 0.06Time (s)
Forc
e (N
)
0
5000
10000
15000
0.00 0.02 0.04 0.06Time (s)
Forc
e (N
)
Upper PelvisLower PelvisThigh
0
5000
10000
15000
0.00 0.02 0.04 0.06Time (s)
Forc
e (N
)
0
5000
10000
15000
0.00 0.02 0.04 0.06Time (s)
Forc
e (N
)
Fig. 11 – Comparison of Thigh and Pelvis Contact Forces between Different Inertial Properties (SUV)
0
5000
10000
15000
0.00 0.02 0.04 0.06Time (s)
Forc
e (N
)
0
5000
10000
15000
0.00 0.02 0.04 0.06Time (s)
Forc
e (N
)
0
5000
10000
15000
0.00 0.02 0.04 0.06Time (s)
Forc
e (N
)
0
5000
10000
15000
0.00 0.02 0.04 0.06Time (s)
Forc
e (N
)
Baseline Reduced Pelvis Mass Upper Body EliminatedContralateral Lower
Limb Eliminated
Fig. 12 – Comparison of Thigh and Pelvis Contact Forces between Different Inertial Properties (Minivan)
0
5000
10000
15000
0.00 0.02 0.04 0.06Time (s)
Forc
e (N
)
0
5000
10000
15000
0.00 0.02 0.04 0.06Time (s)
Forc
e (N
)
0
5000
10000
15000
0.00 0.02 0.04 0.06Time (s)
Forc
e (N
)
0
5000
10000
15000
0.00 0.02 0.04 0.06Time (s)
Forc
e (N
)
Baseline Reduced Pelvis Mass Upper Body EliminatedContralateral Lower
Limb Eliminated
Fig. 10 – Comparison of Thigh and Pelvis Contact Forces between Different Inertial Properties (Sedan)
Baseline Reduced Pelvis Mass Upper Body EliminatedContralateral Lower
Limb Eliminated
0
5000
10000
15000
0.00 0.02 0.04 0.06Time (s)
Forc
e (N
)
0
5000
10000
15000
0.00 0.02 0.04 0.06Time (s)
Forc
e (N
)
Upper PelvisLower PelvisThigh
0
5000
10000
15000
0.00 0.02 0.04 0.06Time (s)
Forc
e (N
)
0
5000
10000
15000
0.00 0.02 0.04 0.06Time (s)
Forc
e (N
)
Fig. 11 – Comparison of Thigh and Pelvis Contact Forces between Different Inertial Properties (SUV)
0
5000
10000
15000
0.00 0.02 0.04 0.06Time (s)
Forc
e (N
)
0
5000
10000
15000
0.00 0.02 0.04 0.06Time (s)
Forc
e (N
)
0
5000
10000
15000
0.00 0.02 0.04 0.06Time (s)
Forc
e (N
)
0
5000
10000
15000
0.00 0.02 0.04 0.06Time (s)
Forc
e (N
)
Baseline Reduced Pelvis Mass Upper Body EliminatedContralateral Lower
Limb Eliminated
Fig. 12 – Comparison of Thigh and Pelvis Contact Forces between Different Inertial Properties (Minivan)
0
5000
10000
15000
0.00 0.02 0.04 0.06Time (s)
Forc
e (N
)
0
5000
10000
15000
0.00 0.02 0.04 0.06Time (s)
Forc
e (N
)
0
5000
10000
15000
0.00 0.02 0.04 0.06Time (s)
Forc
e (N
)
0
5000
10000
15000
0.00 0.02 0.04 0.06Time (s)
Forc
e (N
)
Baseline Reduced Pelvis Mass Upper Body EliminatedContralateral Lower
Limb Eliminated
Fig. 13 – Comparison of Kinematics at 45 ms and Absorbed Energy for Human Models with and without Upper Body in Sedan Impact
Time History of Energy Absorption by Bonnet Skin and Stiffener
0
50
100
150
0 0.02 0.04 0.06Time (s)
Ener
gy (J
) with Upper Bodywithout Upper Body
Fig. 13 – Comparison of Kinematics at 45 ms and Absorbed Energy for Human Models with and without Upper Body in Sedan Impact
Time History of Energy Absorption by Bonnet Skin and Stiffener
0
50
100
150
0 0.02 0.04 0.06Time (s)
Ener
gy (J
) with Upper Bodywithout Upper Body
Fig. 14 – Comparison of Lower Pelvis, Upper Pelvis and Struck Side Acetabulum Forces in SUV and Minivan Impact
MinivanSUV
0
2000
4000
6000
8000
10000
0 0.02 0.04 0.06Time (s)
Forc
e (N
)
Lower PelvisUpper PelvisAcetabulum
0
2000
4000
6000
8000
10000
0 0.02 0.04 0.06Time (s)
Forc
e (N
)
Lower PelvisUpper PelvisAcetabulum
IRCOBI Conference - Hanover (Germany) - September 2010 177

was much lower than the load applied to the ilium (6.8 kN). In addition, in the SUV impact where a large part the applied load was transmitted through the acetabulum, the maximum stress was seen at the superior pubic ramus (209 MPa) on the struck side. On the contrary, in the minivan impact where a larger part of the applied load was transmitted through the ilium, the maximum stress at the superior pubic rami on the contralateral side (174 MPa) was even slightly larger than that on the struck side (166 MPa) due to the distribution of the applied load through different load paths (anterior load path through the pubis and posterior load path through the sacrum). The effect of the inertial forces from the upper body and the contraleteral lower limb on the pelvis stress distribution was further investigated by applying loads proportional to the loads at peak stress from the sedan, SUV and minivan impacts in the same directions at the locations presented in Fig. 15 to an isolated pelvis model. The acetabulum on the contralateral side was fixed to the inertial space. Fig. 16 shows the stress distributions of the pelvis when the loads proportional to the loads at peak stress from the sedan, SUV and minivan impacts were applied in the same directions. As a reference, the stress contours from the baseline simulations are also presented. The comparison between the contours from the full-scale simulations and the component simulations shows that the stress distribution is similar, regardless of the difference in boundary conditions (inertial forces applied to the acetabulum on the contralateral side and the top of the sacrum vs. rigid constraint of the acetabulum on the contralateral side). This suggests that the major factors determining pelvis internal stress distribution are the magnitude, direction and location of the applied load. DISCUSSION The results of the investigation of the effect of the upper body mass showed that the lack of the mass of the upper body did not significantly affect the pelvis loading in the SUV and minivan impacts, while it
0
40
80
120
160
200
1033N-64deg.@34ms
Max Equivalent Stress (MPa)Sedan
Fig. 15 – Pelvis Stress Distributions at Peak Applied Load for Sedan, SUV and Minivan
4570N8deg.@26ms
SUV Minivan
1289N-22deg.@29ms
Pelvis Upper6819N 7deg.
PelvisUpper1231N22deg.
0
40
80
120
160
200
0
40
80
120
160
200
1033N-64deg.@34ms
Max Equivalent Stress (MPa)Sedan
Fig. 15 – Pelvis Stress Distributions at Peak Applied Load for Sedan, SUV and Minivan
4570N8deg.@26ms
SUV Minivan
1289N-22deg.@29ms
Pelvis Upper6819N 7deg.
PelvisUpper1231N22deg.
Fig. 16 – Comparison of Pelvis Stress Contours between Full-scale and Component Simulations for Sedan, SUV and Minivan Impacts
SUVFull-scale Pelvis Component
MinivanFull-scale Pelvis Component
SedanFull-scale Pelvis Component
Fixed to inertial space
Fig. 16 – Comparison of Pelvis Stress Contours between Full-scale and Component Simulations for Sedan, SUV and Minivan Impacts
SUVFull-scale Pelvis Component
MinivanFull-scale Pelvis Component
SedanFull-scale Pelvis Component
Fixed to inertial space
178 IRCOBI Conference - Hanover (Germany) - September 2010
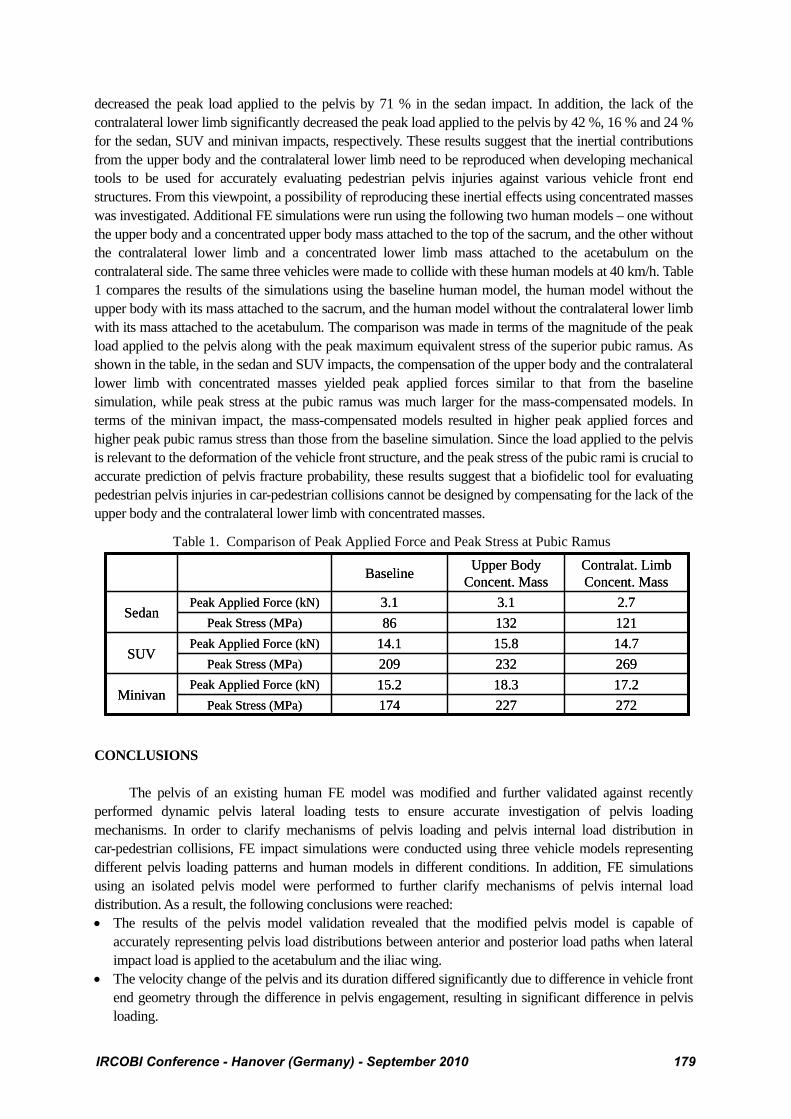
decreased the peak load applied to the pelvis by 71 % in the sedan impact. In addition, the lack of the contralateral lower limb significantly decreased the peak load applied to the pelvis by 42 %, 16 % and 24 % for the sedan, SUV and minivan impacts, respectively. These results suggest that the inertial contributions from the upper body and the contralateral lower limb need to be reproduced when developing mechanical tools to be used for accurately evaluating pedestrian pelvis injuries against various vehicle front end structures. From this viewpoint, a possibility of reproducing these inertial effects using concentrated masses was investigated. Additional FE simulations were run using the following two human models – one without the upper body and a concentrated upper body mass attached to the top of the sacrum, and the other without the contralateral lower limb and a concentrated lower limb mass attached to the acetabulum on the contralateral side. The same three vehicles were made to collide with these human models at 40 km/h. Table 1 compares the results of the simulations using the baseline human model, the human model without the upper body with its mass attached to the sacrum, and the human model without the contralateral lower limb with its mass attached to the acetabulum. The comparison was made in terms of the magnitude of the peak load applied to the pelvis along with the peak maximum equivalent stress of the superior pubic ramus. As shown in the table, in the sedan and SUV impacts, the compensation of the upper body and the contralateral lower limb with concentrated masses yielded peak applied forces similar to that from the baseline simulation, while peak stress at the pubic ramus was much larger for the mass-compensated models. In terms of the minivan impact, the mass-compensated models resulted in higher peak applied forces and higher peak pubic ramus stress than those from the baseline simulation. Since the load applied to the pelvis is relevant to the deformation of the vehicle front structure, and the peak stress of the pubic rami is crucial to accurate prediction of pelvis fracture probability, these results suggest that a biofidelic tool for evaluating pedestrian pelvis injuries in car-pedestrian collisions cannot be designed by compensating for the lack of the upper body and the contralateral lower limb with concentrated masses. CONCLUSIONS The pelvis of an existing human FE model was modified and further validated against recently performed dynamic pelvis lateral loading tests to ensure accurate investigation of pelvis loading mechanisms. In order to clarify mechanisms of pelvis loading and pelvis internal load distribution in car-pedestrian collisions, FE impact simulations were conducted using three vehicle models representing different pelvis loading patterns and human models in different conditions. In addition, FE simulations using an isolated pelvis model were performed to further clarify mechanisms of pelvis internal load distribution. As a result, the following conclusions were reached: • The results of the pelvis model validation revealed that the modified pelvis model is capable of
accurately representing pelvis load distributions between anterior and posterior load paths when lateral impact load is applied to the acetabulum and the iliac wing.
• The velocity change of the pelvis and its duration differed significantly due to difference in vehicle front end geometry through the difference in pelvis engagement, resulting in significant difference in pelvis loading.
269232209Peak Stress (MPa)
17.218.315.2Peak Applied Force (kN)Minivan
272227174Peak Stress (MPa)
14.715.814.1Peak Applied Force (kN)SUV
12113286Peak Stress (MPa)2.73.13.1Peak Applied Force (kN)
Sedan
Contralat. Limb Concent. Mass
Upper Body Concent. MassBaseline
269232209Peak Stress (MPa)
17.218.315.2Peak Applied Force (kN)Minivan
272227174Peak Stress (MPa)
14.715.814.1Peak Applied Force (kN)SUV
12113286Peak Stress (MPa)2.73.13.1Peak Applied Force (kN)
Sedan
Contralat. Limb Concent. Mass
Upper Body Concent. MassBaseline
Table 1. Comparison of Peak Applied Force and Peak Stress at Pubic Ramus
IRCOBI Conference - Hanover (Germany) - September 2010 179

• For all of the three representative vehicles, any changes in inertial mass of the pelvis, upper body, and contralateral lower limb did not significantly affect the applied load distributions between the thigh, lower pelvis, and upper pelvis.
• The decrease in the masses of the pelvis and the contralateral lower limb significantly decreased the peak applied load to the pelvis for all the vehicles.
• The lack of the mass of the upper body did not significantly affect the peak applied load in the SUV and minivan impacts, while the peak applied load was significantly increased with the sedan due to increased inclination of the thigh towards the bonnet.
• The effect of the mass of the struck side lower limb on the applied pelvis load was negligible in the SUV and minivan impacts.
• The major factors determining pelvis internal stress distribution were found to be the magnitude, direction and location of the applied load.
• The results of the comparisons of peak applied load to the pelvis and peak stress of the pubic ramus between baseline and mass-compensated human models suggest that inertial contributions from the upper body and the contralateral lower limb need to be accurately incorporated when evaluating pelvis injuries in pedestrians struck by various types of vehicles.
References Dakin, G. J., Arbelaez, R. A., Molz, F. J., Alonso, J. E., Mann, K. A., Eberhardt, A. W. : Elastic and Viscoelastic Properties of the Human Pubic Symphysis Joint: Effects of Lateral Impact Loading, Journal of biomechanical engineering, Vol. 123, pp. 218-226 (2001) Eastridge, B. J., Burgess, A. R. : Pedestrian Pelvic Fractures: 5-year Experience of a Major Urban Trauma Center, The Journal of Trauma, Volume 42(4), pp. 695-700 (1997) Gray, H. : Gray’s Anatomy: The Anatomical Basis of Medicine and Surgery, Thirty-eighth Edition, Churchill Livingstone (1995) Hamada, M., Hasegawa, J., Nishimura, R. : Finite Element Analysis of Pedestrian Pelvis Injuries, JSAE fall Congress Proceedings, No. 75-03 (2003) (in Japanese) International Road Traffic and Accident Database : Overview of Road Accidents and Traffic Data in 2008, Fatalities by road use, http://internationaltransportforum.org/irtad/pdf/roaduse.pdf (2009) Kemper, A. R., McNally, C., Duma, S. M. : Dynamic Tensile Material Properties of Human Pelvic Cortical Bone, Biomedical Sciences Instrumentation, Vol. 44, pp. 417-8 (2008) Kikuchi, Y., Takahashi, Y., Mori, F. : Development of a Finite Element Model for a Pedestrian Pelvis and Lower Limb, SAE World Congress, paper Number 2006-01-0683 (2006) Kikuchi, Y., Takahashi, Y., Mori, F. : Full-Scale Validation of a Human FE Model for the Pelvis and Lower Limb of a Pedestrian, SAE World Congress, Paper Number 2008-01-1243 (2008) Robbins, D. H. : Anthropometric Specifications for Mid-sized Male Dummy, Volume 2, the University of Michigan Transportation Research Institute, Report Number UMTRI-83-53-2 (1983) Salzar, R. S., Genovese, D., Bass, C. R., Bolton, J. R., Guillemot, H., Damon, A. M., Crandall, J. R. : Load Path Distribution within the Pelvic Structure under Lateral Loading, International Crashworthiness Conference (2008) Snedeker, J. G., Walz, F. H., Muser, M. H., Lanz, C., Schroeder, G. : Assessing Femur and Pelvis Injury Risk in Car-Pedestrian Collisions: Comparison of Full Body PMTO Impacts, and a Human Body Finite Element Model, 19th ESV Conference, Paper Number 05-103 (2005) Stewart, K. J., Edmonds-Wilson, R. H., Brand, R. A., Brown, T. D. : Spatial Distribution of Hip Capsule Structural and Material Properties, Journal of Biomechanics, 35(11), pp. 1491-8 (2002) Vix, V. A., Ryu, C. Y. : The Adult Symphysis Pubis: Normal and Abnormal, 71st Annual Meeting of the American Roentgen Ray Society (1970) Walker, J. M. : The Sacroiliac Joint: A Critical Review, Physical Therapy, Volume 72, Number 12, pp. 71-84 (1992)
180 IRCOBI Conference - Hanover (Germany) - September 2010