investing for a lifetime
DESCRIPTION
some of the most common problems unsuccessful investors make, how to avoid mistakes and how to increase wealth through out your lifetime.TRANSCRIPT
I.G. Investment Management, Ltd.2008
Investing For a Lifetime
TM
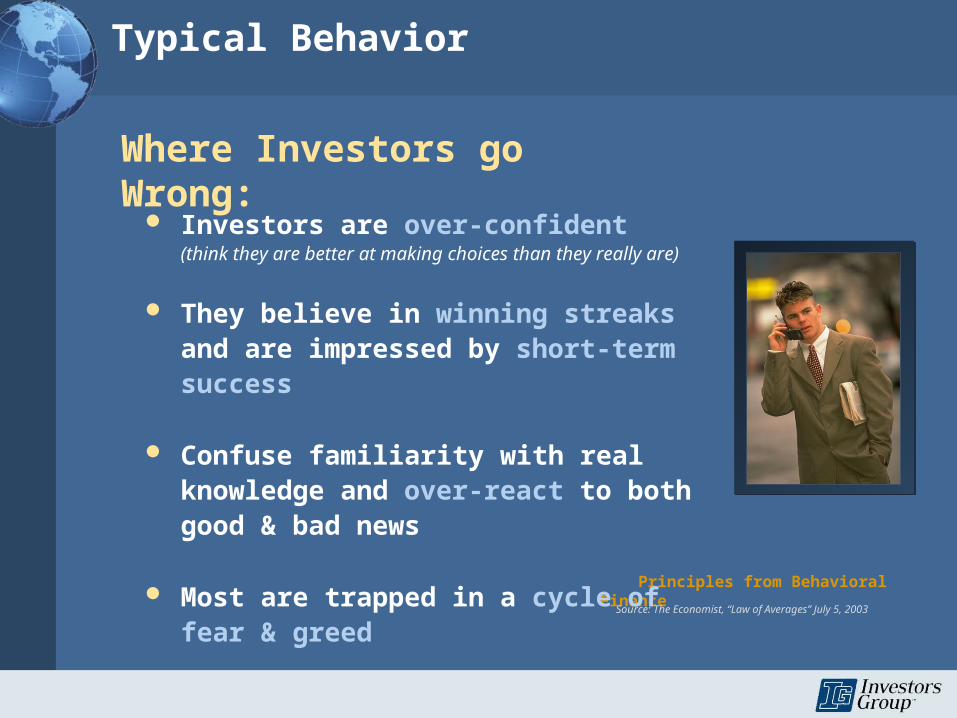
Principles from Behavioral Finance
Investors are over-confident(think they are better at making choices than they really are)
They believe in winning streaks and are impressed by short-term success
Confuse familiarity with real knowledge and over-react to both good & bad news
Most are trapped in a cycle of fear & greed
Where Investors go Wrong:
Source: The Economist, “Law of Averages” July 5, 2003
Typical Behavior

Requires a focus/discipline
Risk Management
Financial Plan
Asset Allocation
Long term focus
Scenario approach
Customized portfolio
Rational expectations
Managing Money
Arbitrary
Focus on reward
No plan
Performance Driven
Responsive to noise
Betting on a single outcome
Follow the crowd
Adaptive expectations
Make Money
There is a difference
Financial Planning Discipline

Personal Investment
Policy Statement
. . . your personal “roadmap” to successful
investing.
Step 1. The Foundation
Investing for a lifetime requires a...
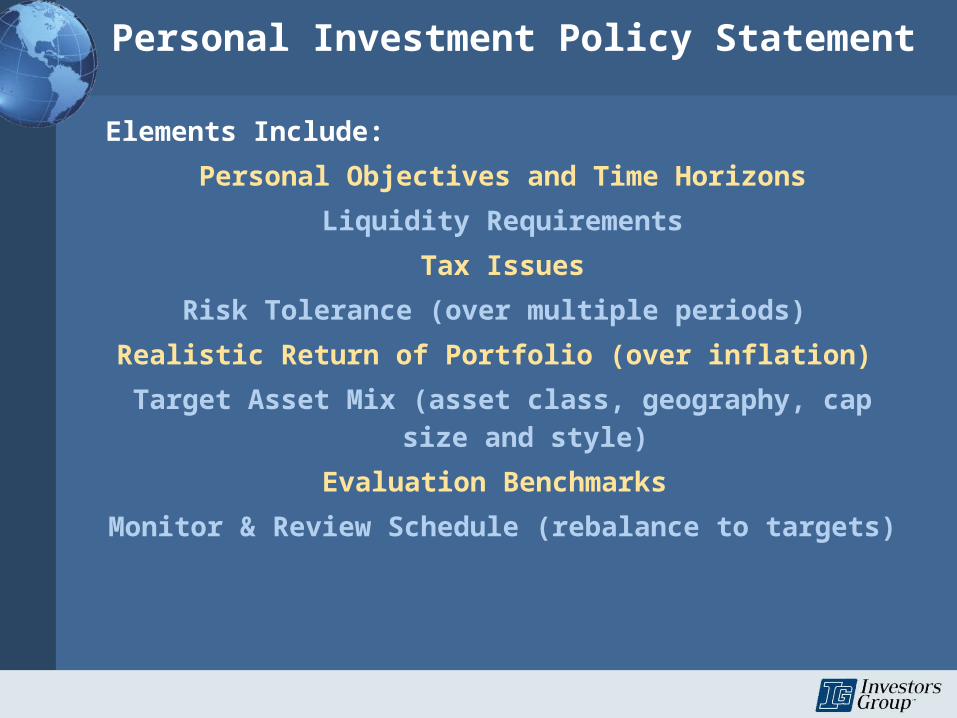
Elements Include:
Personal Objectives and Time Horizons
Liquidity Requirements
Tax Issues
Risk Tolerance (over multiple periods)
Realistic Return of Portfolio (over inflation)
Target Asset Mix (asset class, geography, cap size and style)
Evaluation Benchmarks
Monitor & Review Schedule (rebalance to targets)
Personal Investment Policy Statement
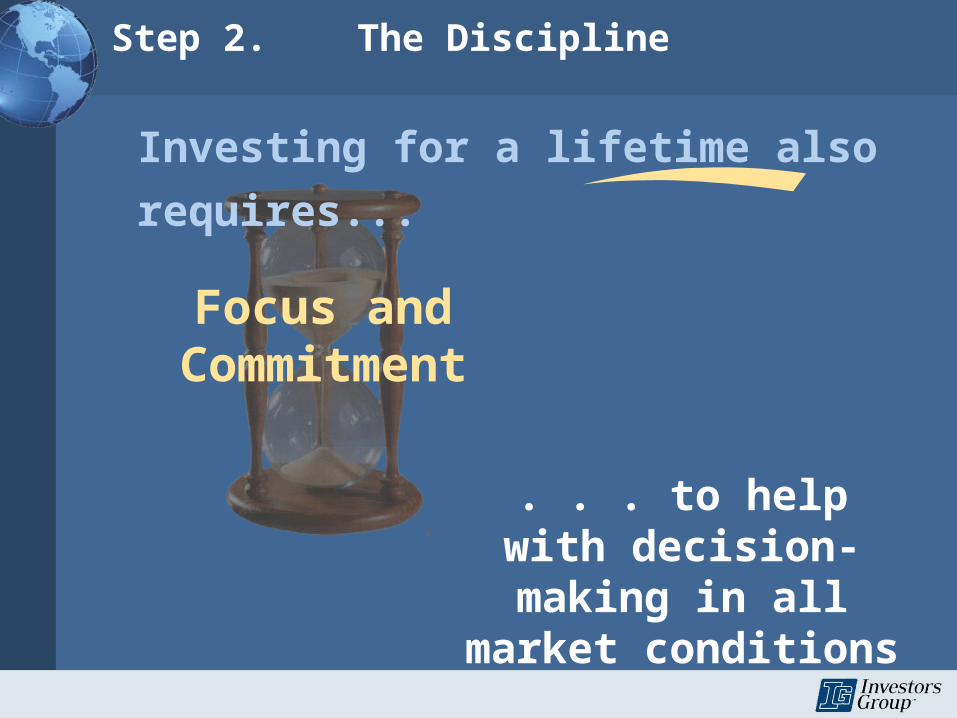
Focus and Commitment
. . . to help with decision-making in all
market conditions
Step 2. The Discipline
Investing for a lifetime also requires...
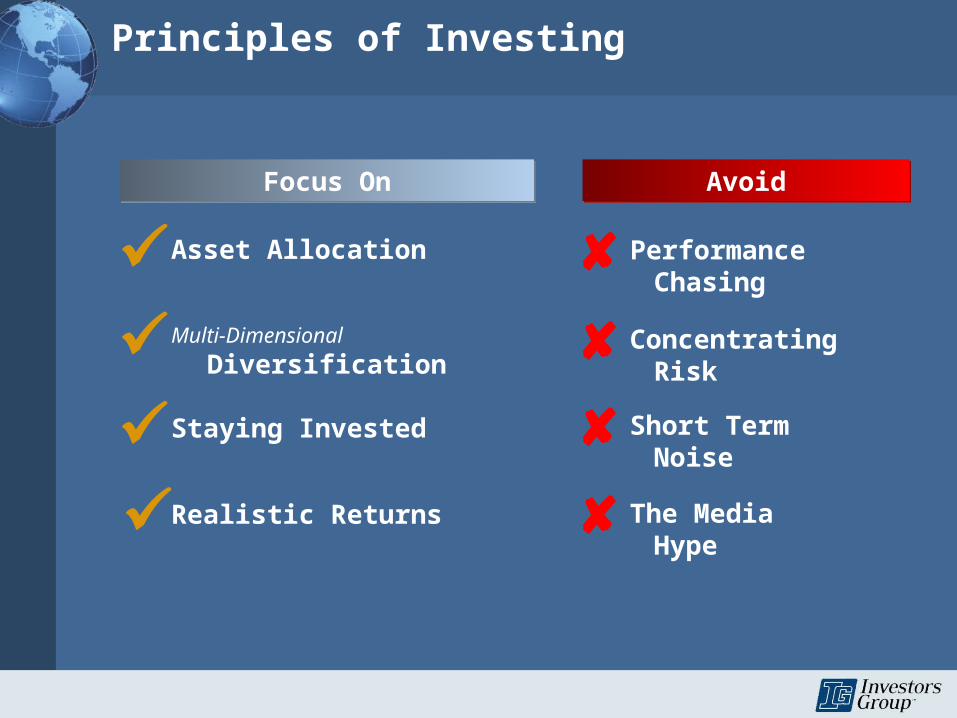
Focus OnFocus On
Asset Allocation
Staying Invested
Multi-Dimensional Diversification
Realistic Returns
AvoidAvoid
Performance ChasingConcentrating RiskShort Term NoiseThe Media Hype
Principles of Investing
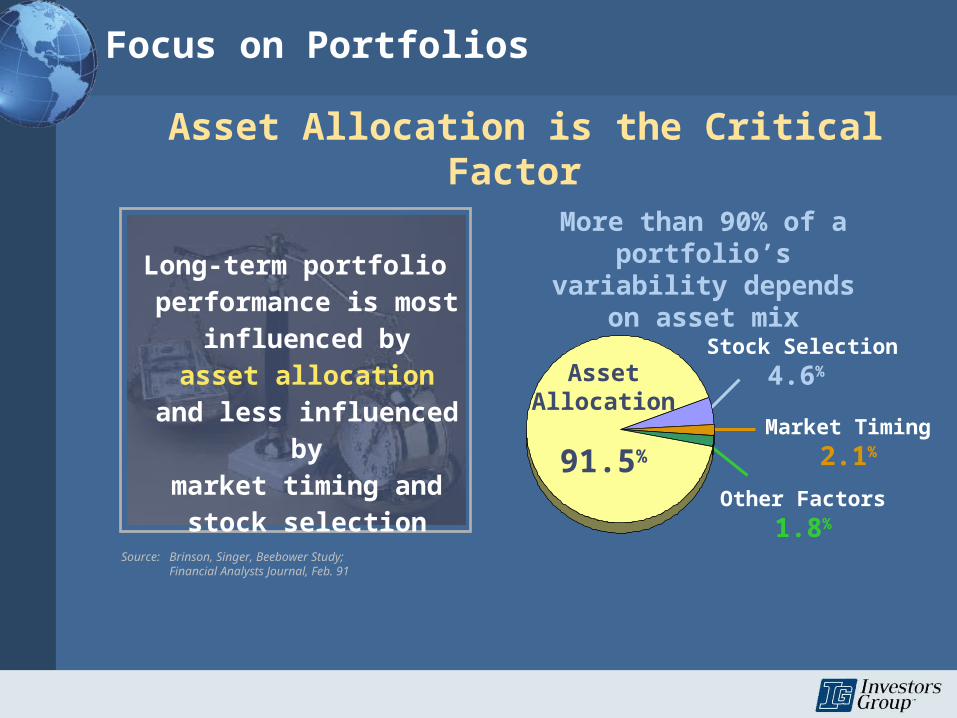
Asset Allocation is the Critical Factor
More than 90% of a portfolio’s variability
depends on asset mix
Market Timing
2.1%
Other Factors
1.8%
Stock Selection
4.6% Asset Allocation
91.5%
Long-term portfolio performance is most
influenced byasset allocation
and less influenced bymarket timing and
stock selection
Source: Brinson, Singer, Beebower Study;Financial Analysts Journal, Feb. 91
Focus on Portfolios
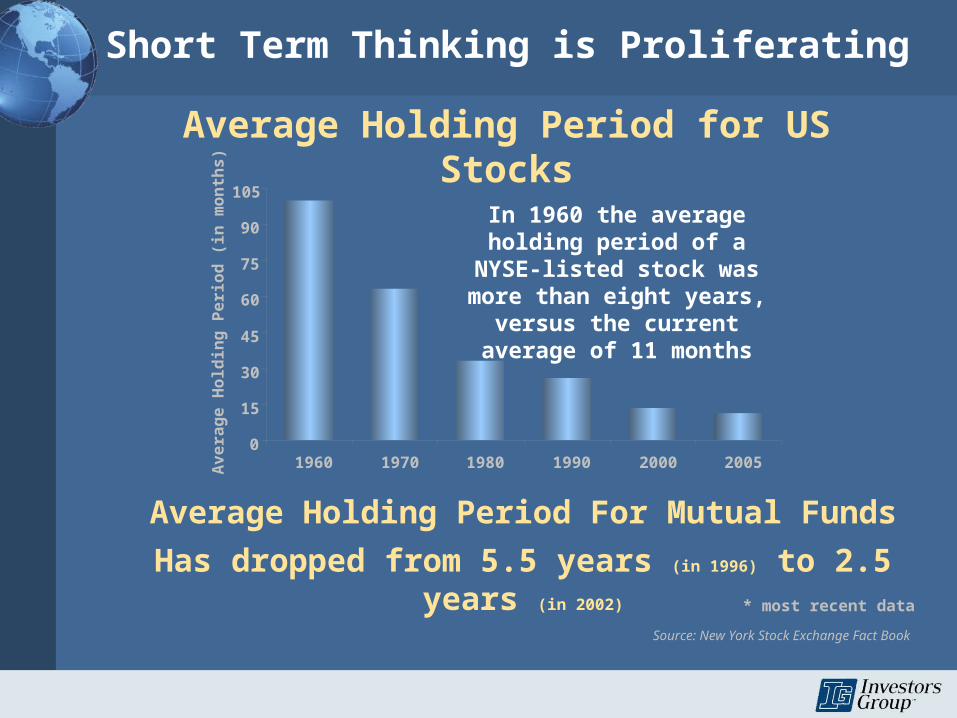
Average Holding Period For Mutual Funds
Has dropped from 5.5 years (in 1996) to 2.5 years (in 2002)
Average Holding Period for US Stocks
Source: New York Stock Exchange Fact Book
Short Term Thinking is Proliferating
In 1960 the average holding period of a NYSE-listed
stock was more than eight years, versus the current
average of 11 months
0
15
30
45
60
75
90
105
1960 1970 1980 1990 2000 2005
Av
era
ge
Ho
ldin
g P
eri
od
(in
mo
nth
s)
* most recent data
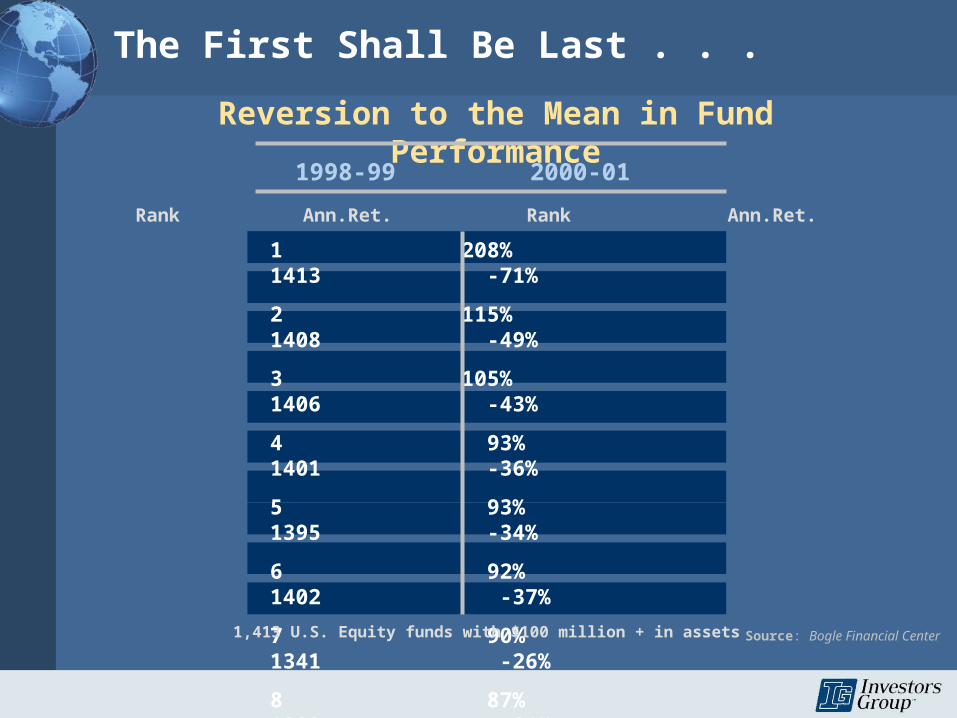
1 208% 1413 -71%
2 115% 1408 -49%
3 105% 1406 -43%
4 93% 1401 -36%
5 93% 1395 -34%
6 92% 1402 -37%
7 90% 1341 -26%
8 87% 1309 -24%
9 84% 1370 -29%
10 79% 1347 -27%
The First Shall Be Last . . .
Reversion to the Mean in Fund Performance
Rank Ann.Ret. Rank Ann.Ret.
1998-99 2000-01
Source: Bogle Financial Center1,413 U.S. Equity funds with $100 million + in assets
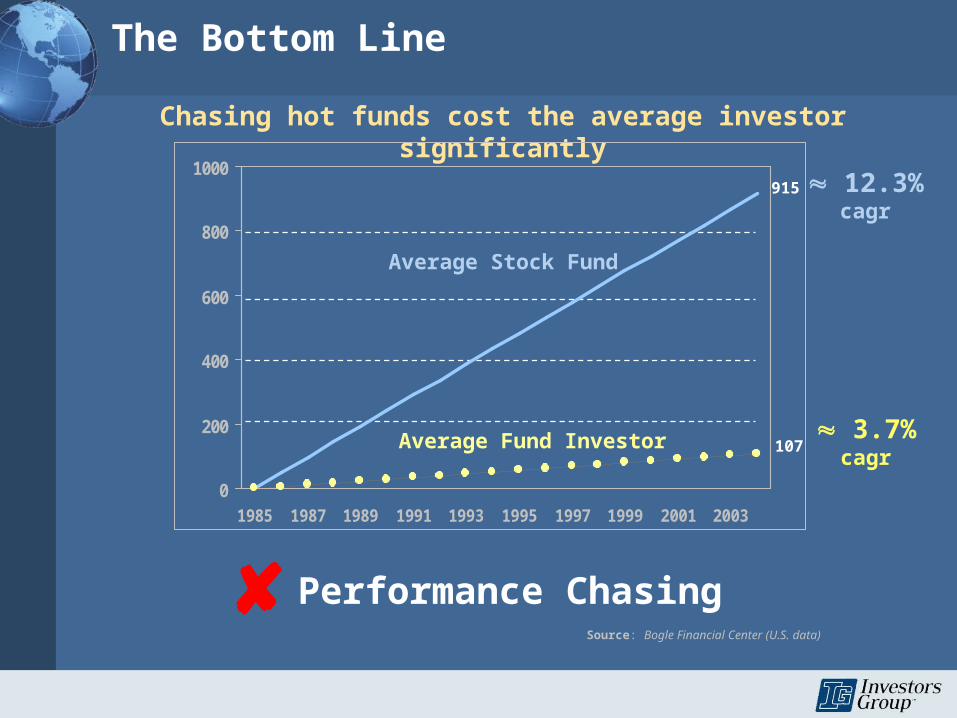
Average Stock Fund
Average Fund Investor
The Bottom Line
3.7% cagr
12.3% cagr
Chasing hot funds cost the average investor significantly
Performance ChasingSource: Bogle Financial Center (U.S. data)
0
200
400
600
800
1000
1985 1987 1989 1991 1993 1995 1997 1999 2001 2003
915
107
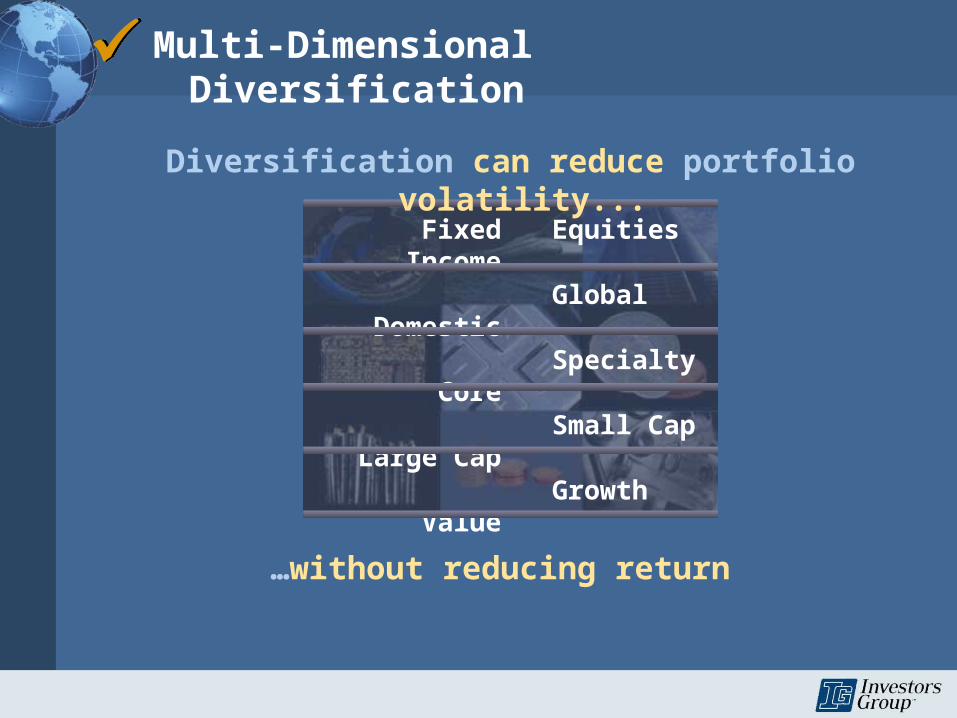
Multi-Dimensional Diversification
Equities
Global
Specialty
Small Cap
Growth
Fixed Income
Domestic
Core
Large Cap
Value
Diversification can reduce portfolio volatility...
…without reducing return
0
1000
2000
3000
4000
Dec-94
Dec-95
Dec-96
Dec-97
Dec-98
Dec-99
Dec-00
Dec-01
Dec-02
Dec-03
Dec-04
Dec-05
Dec-06
Dec-07
S&P/TSX Scotia Universe
Va
lue
of
Inv
es
tme
nt
($)
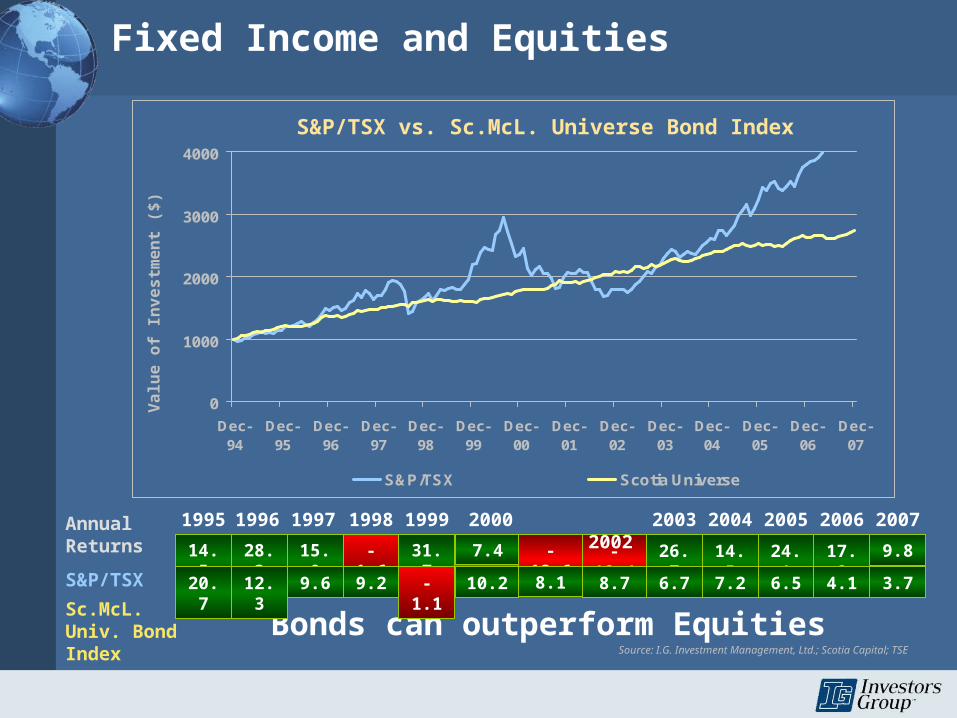
S&P/TSX vs. Sc.McL. Universe Bond Index
Fixed Income and Equities
Bonds can outperform EquitiesSource: I.G. Investment Management, Ltd.; Scotia Capital; TSE
17.3
4.1
2005
2006
Annual Returns
S&P/TSX
Sc.McL. Univ. Bond Index
20011995 1996 1997 1998 1999
14.5 28.3 15.0 -1.6 31.7
20.7 12.3 9.6 9.2 -1.1
2003
26.7
6.7
2000
7.4
10.2
-12.6 -12.4
8.7
2002 2004 14.5
7.2
24.1
6.58.1
2007 9.8
3.7
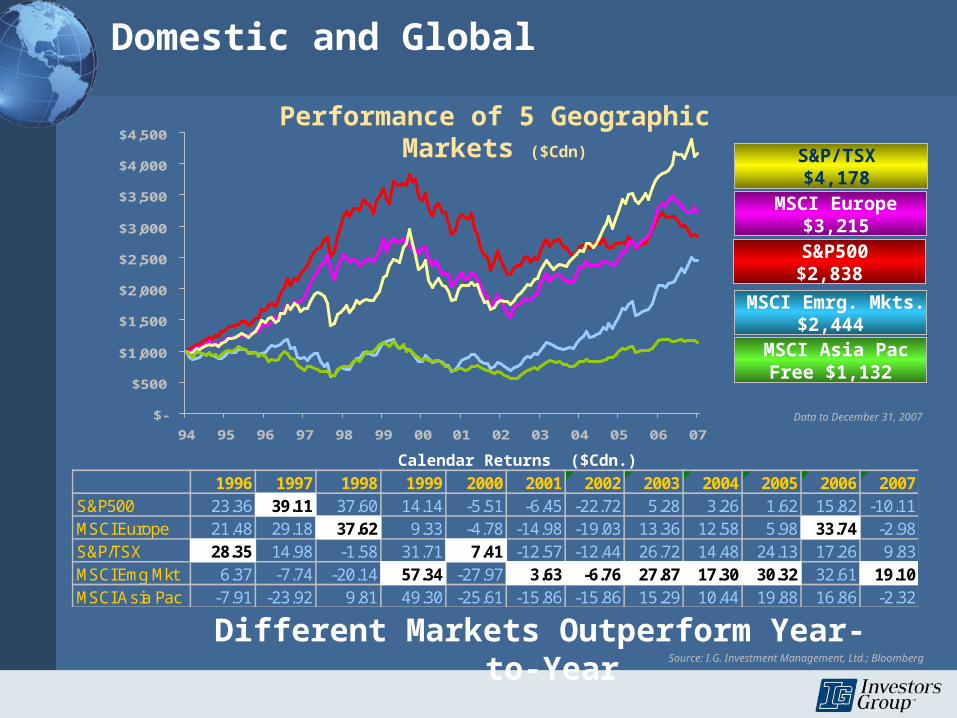
Domestic and Global
Data to December 31, 2007
Performance of 5 Geographic Markets ($Cdn)
Different Markets Outperform Year-to-Year
1996 1997 1998 1999 2000 2001 2002 2003 2004 2005 2006 2007S&P500 23.36 39.11 37.60 14.14 -5.51 -6.45 -22.72 5.28 3.26 1.62 15.82 -10.11MSCI Europe 21.48 29.18 37.62 9.33 -4.78 -14.98 -19.03 13.36 12.58 5.98 33.74 -2.98S&P/TSX 28.35 14.98 -1.58 31.71 7.41 -12.57 -12.44 26.72 14.48 24.13 17.26 9.83MSCI Emg Mkt 6.37 -7.74 -20.14 57.34 -27.97 3.63 -6.76 27.87 17.30 30.32 32.61 19.10MSCI Asia Pac -7.91 -23.92 9.81 49.30 -25.61 -15.86 -15.86 15.29 10.44 19.88 16.86 -2.32
Calendar Returns ($Cdn.)
Source: I.G. Investment Management, Ltd.; Bloomberg
S&P500$2,838
MSCI Emrg. Mkts. $2,444
MSCI Asia Pac Free $1,132
MSCI Europe $3,215
S&P/TSX $4,178
$-
$500
$1,000
$1,500
$2,000
$2,500
$3,000
$3,500
$4,000
$4,500
94 95 96 97 98 99 00 01 02 03 04 05 06 07
Highest Return
1997 1998 1999 2000
Lowest Return
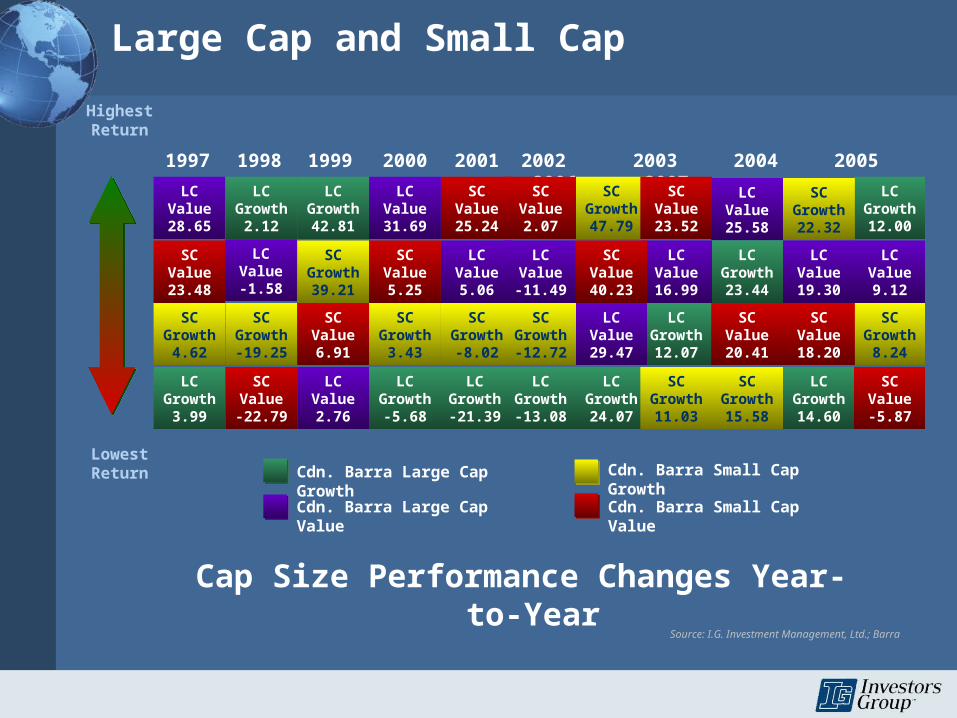
Large Cap and Small Cap
Cdn. Barra Large Cap Growth
Cdn. Barra Large Cap Value
Cdn. Barra Small Cap Growth
Cdn. Barra Small Cap Value
Cap Size Performance Changes Year-to-Year
Source: I.G. Investment Management, Ltd.; Barra
2001 2002 2003 2004 2005 2006 2007 LC
Growth2.12
LC Growth42.81
LC Growth
3.99
LC Growth
-5.68
LC Growth-21.39
LC Growth-13.08
LC Growth24.07
LC Growth12.07
LC Growth23.44
LC Growth14.60
LC Growth12.00
LC Value28.65
LC Value-1.58
LC Value2.76
LC Value31.69
LC Value5.06
LC Value-11.49
LC Value29.47
LC Value16.99
LC Value25.58
LC Value19.30
LC Value9.12
SC Growth39.21
SC Growth
4.62
SC Growth-19.25
SC Growth
3.43
SC Growth
-8.02
SC Growth-12.72
SC Growth47.79
SC Growth11.03
SC Growth15.58
SC Growth22.32
SC Growth
8.24
SC Value23.48
SC Value6.91
SC Value-22.79
SC Value5.25
SC Value25.24
SC Value2.07
SC Value40.23
SC Value23.52
SC Value20.41
SC Value18.20
SC Value-5.87
80.00
70.00
60.00
50.00
40.00
30.00
20.00
10.00
0.00
10.00
20.00
30.00
40.00
50.00
60.00
70.00
80.00
Dec-94 Dec-95 Dec-96 Dec-97 Dec-98 Dec-99 Dec-00 Dec-01 Dec-02 Dec-03 Dec-04 Dec-05 Dec-06 Dec-07
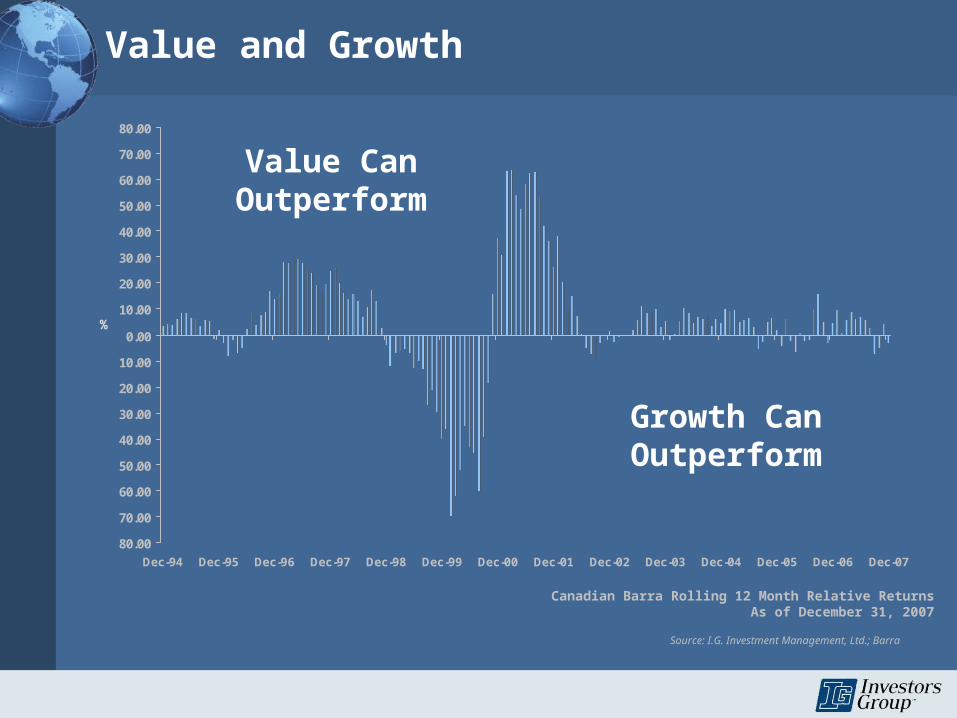
Value and Growth
Value Can Outperform
Growth Can Outperform
Canadian Barra Rolling 12 Month Relative ReturnsAs of December 31, 2007
%
Source: I.G. Investment Management, Ltd.; Barra
You Can’t Predict Next Year’s Winner
The Bottom Line
Concentrating Risk
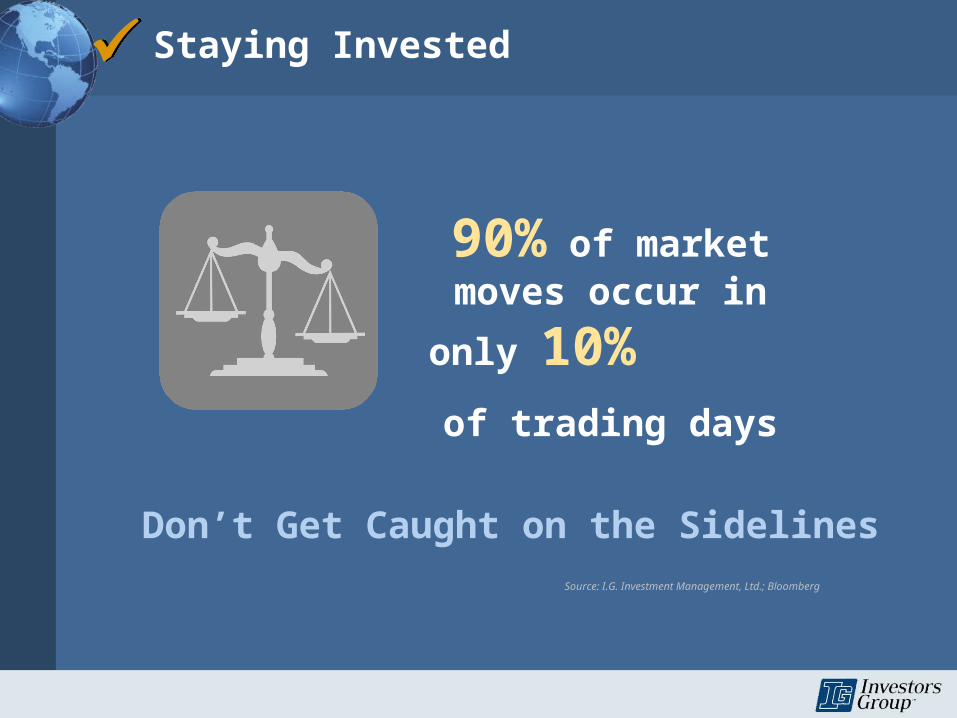
Staying Invested
Don’t Get Caught on the Sidelines
90% of market moves
occur in only 10%
of trading days
Source: I.G. Investment Management, Ltd.; Bloomberg
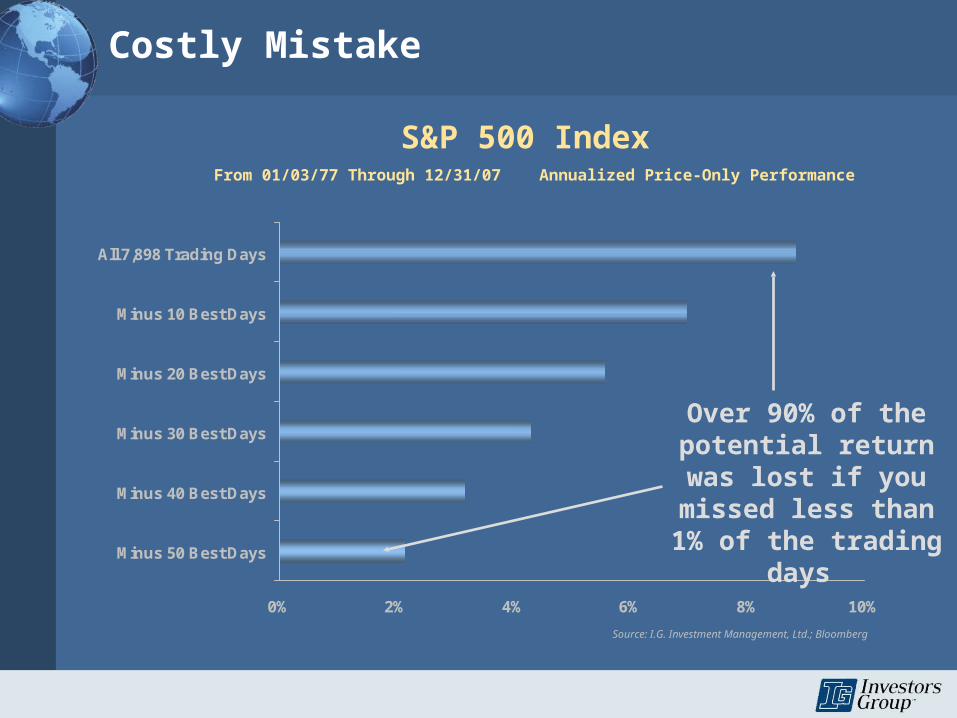
0% 2% 4% 6% 8% 10%
Minus 50 Best Days
Minus 40 Best Days
Minus 30 Best Days
Minus 20 Best Days
Minus 10 Best Days
All 7,898 Trading Days
Costly Mistake
S&P 500 Index From 01/03/77 Through 12/31/07 Annualized Price-Only Performance
Over 90% of the potential return was lost if you missed
less than 1% of the trading days
Source: I.G. Investment Management, Ltd.; Bloomberg
-50
-40
-30
-20
-10
0
10
20
30
40
50
60
70
80
90
100
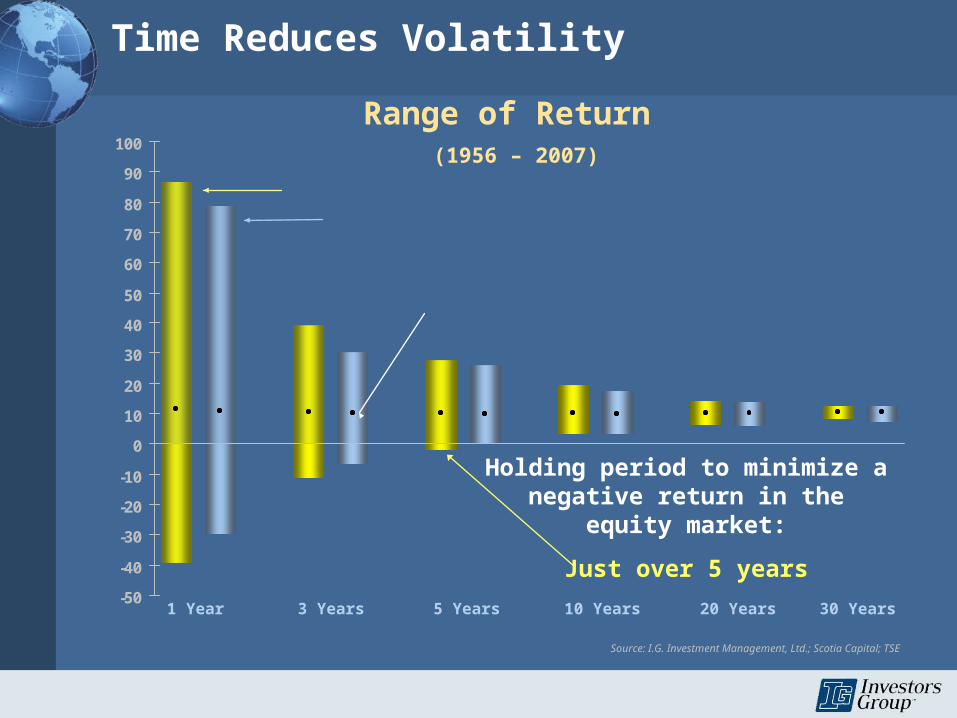
Average
TSE 300
75% Stocks / 25% L.T. Bonds
Time Reduces Volatility
1 Year 5 Years 10 Years 20 Years 30 Years3 Years
Holding period to minimize a negative return in the equity
market:
Just over 5 years
Source: I.G. Investment Management, Ltd.; Scotia Capital; TSE
Range of Return (1956 – 2007)
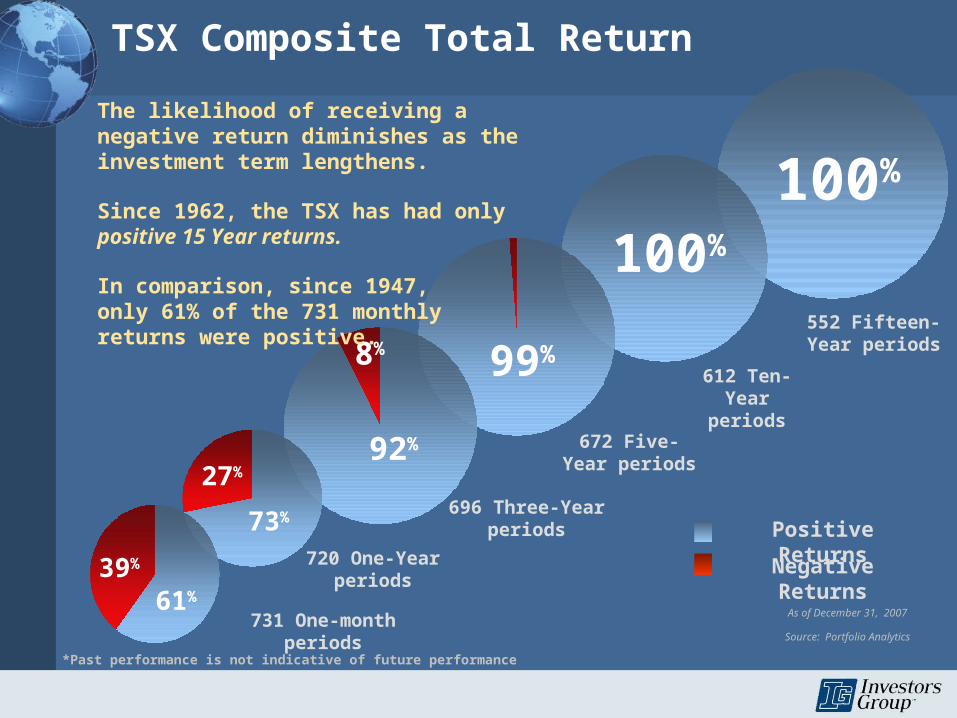
100%
100%
99%
92%
8%
73%
27%
Positive Returns
Negative Returns
731 One-month periods
720 One-Year periods
696 Three-Year periods
672 Five-Year periods
The likelihood of receiving a negative return diminishes as the investment term lengthens.
Since 1962, the TSX has had onlypositive 15 Year returns.
In comparison, since 1947,only 61% of the 731 monthlyreturns were positive.
39%
61%
552 Fifteen-Year periods
612 Ten-Year periods
*Past performance is not indicative of future performance
TSX Composite Total Return
Source: Portfolio Analytics
As of December 31, 2007
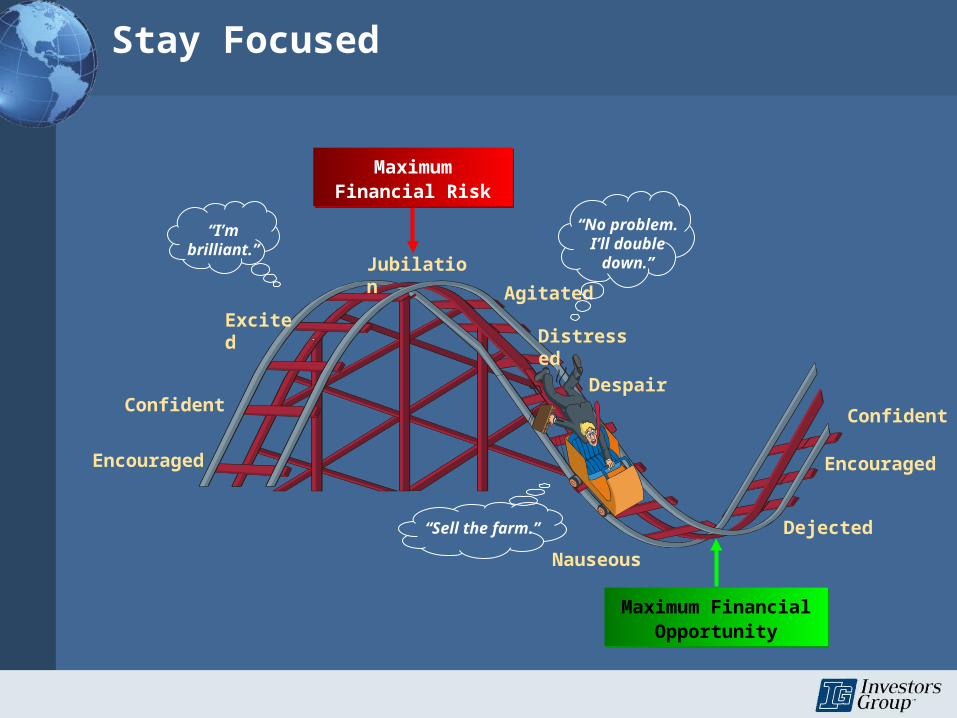
Encouraged
Confident
Excited
Jubilation
Agitated
Distressed
Despair
Nauseous
Dejected
Encouraged
Confident
Maximum Financial Opportunity
Maximum Financial Opportunity
Maximum Financial Risk
Maximum Financial Risk
“I’m brilliant.”
“Sell the farm.”
“No problem. I’ll double
down.”
Stay Focused
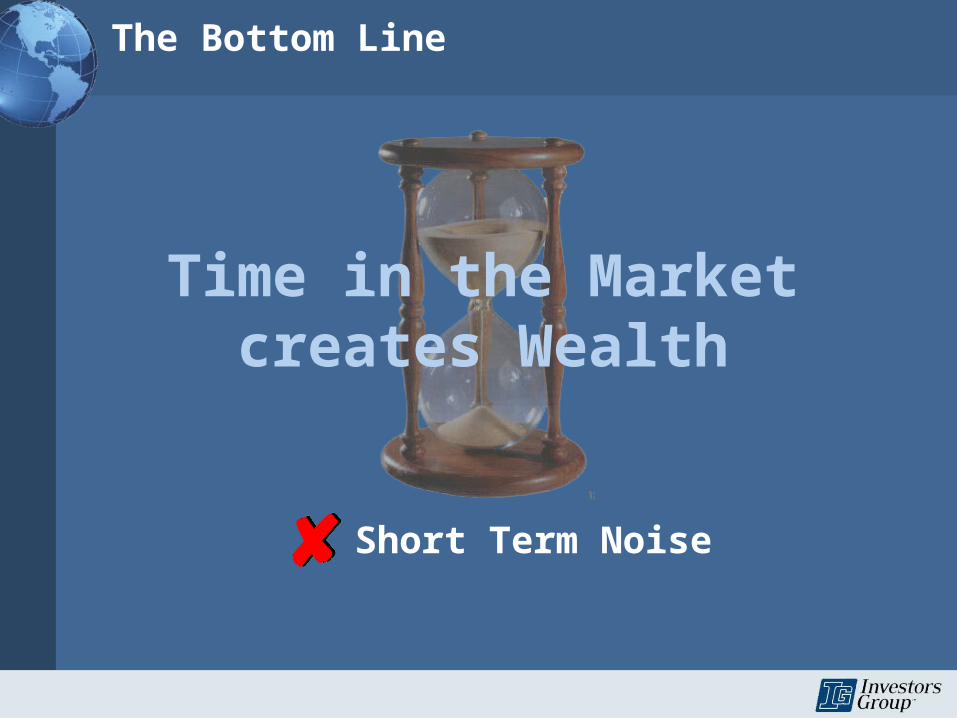
Time in the Market creates Wealth
The Bottom Line
Short Term Noise
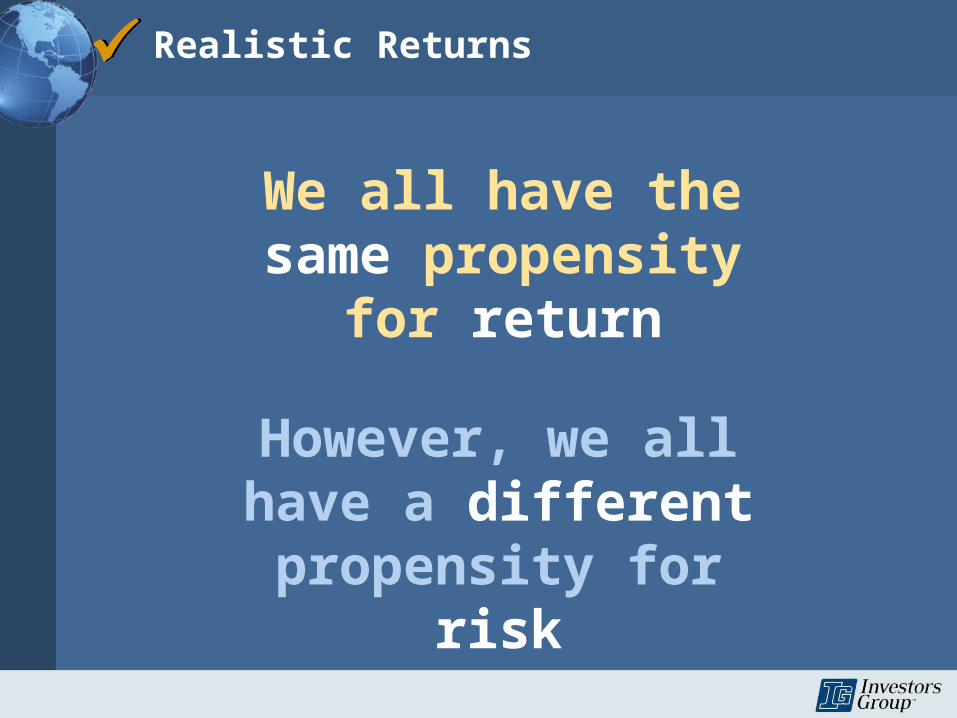
Realistic Returns
However, we all have a different
propensity for risk
We all have the same propensity for
return
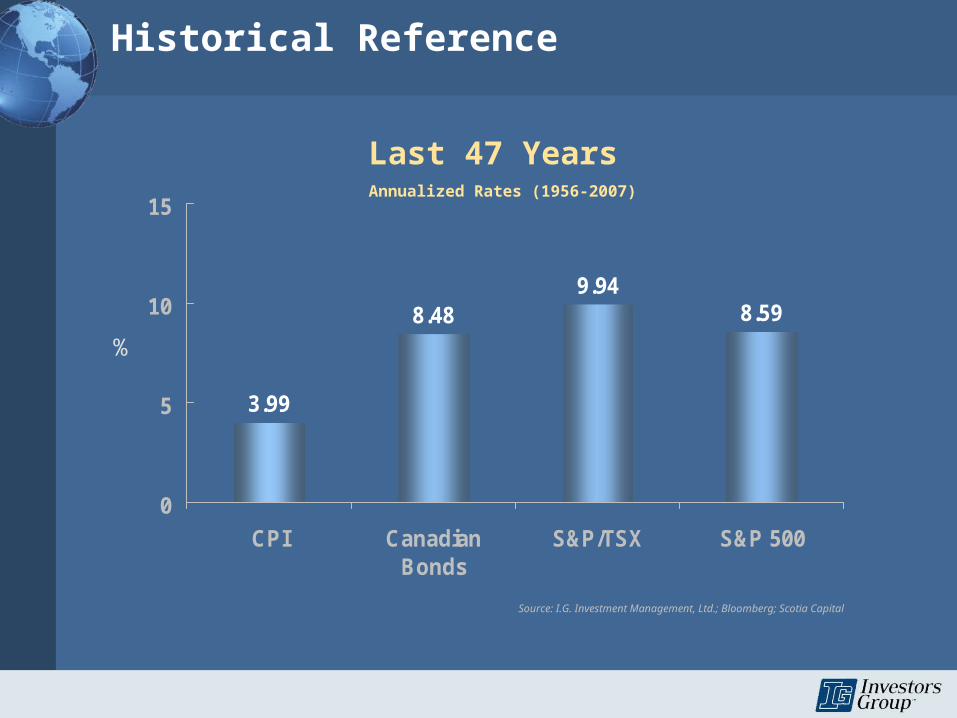
3.99
8.489.94
8.59
0
5
10
15
CPI CanadianBonds
S&P/TSX S&P 500
Historical Reference
Last 47 Years Annualized Rates (1956-2007)
Source: I.G. Investment Management, Ltd.; Bloomberg; Scotia Capital
%
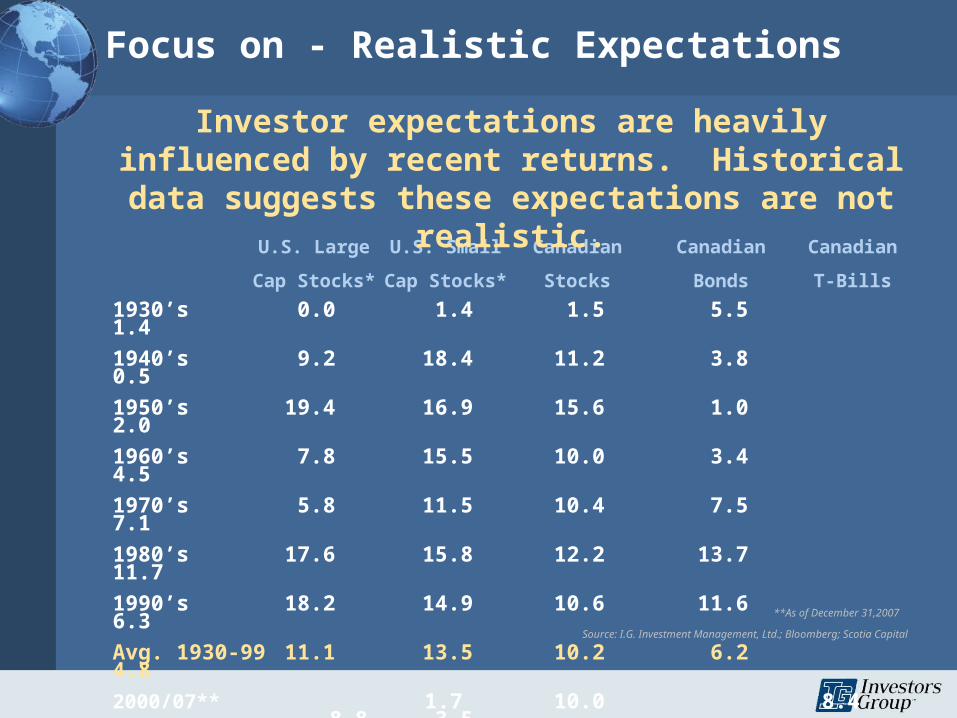
Focus on - Realistic Expectations
1930’s 0.0 1.4 1.5 5.5 1.4
1940’s 9.2 18.4 11.2 3.8 0.5
1950’s 19.4 16.9 15.6 1.0 2.0
1960’s 7.8 15.5 10.0 3.4 4.5
1970’s 5.8 11.5 10.4 7.5 7.1
1980’s 17.6 15.8 12.2 13.7 11.7
1990’s 18.2 14.9 10.6 11.6 6.3
Avg. 1930-99 11.1 13.5 10.2 6.2 4.8
2000/07** 1.7 10.0 8.4 8.8 3.5 *Returns based on U.S. $
U.S. Large U.S. Small Canadian Canadian Canadian
Cap Stocks* Cap Stocks* Stocks Bonds T-Bills
Investor expectations are heavily influenced by recent returns. Historical data suggests these expectations
are not realistic.
Source: I.G. Investment Management, Ltd.; Bloomberg; Scotia Capital
**As of December 31,2007
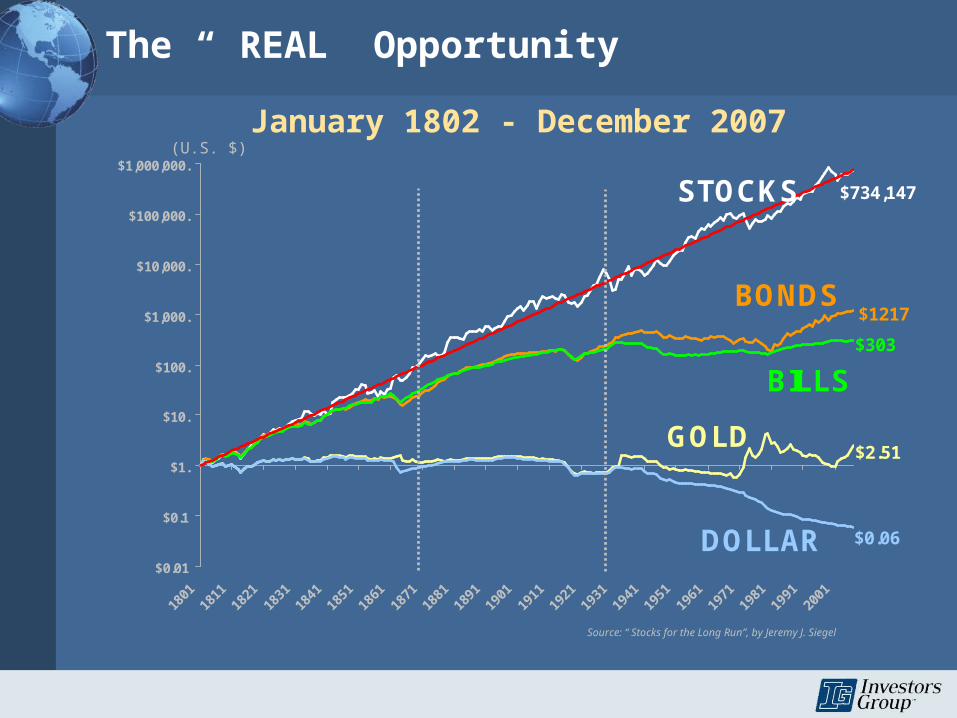
January 1802 - December 2007
Source: “ Stocks for the Long Run”, by Jeremy J. Siegel
(U.S. $)
STOCKS $734,147
BONDS$1217
BILLS$303
GOLD$2.51
DOLLAR $0.06
$0.01
$0.1
$1.
$10.
$100.
$1,000.
$10,000.
$100,000.
$1,000,000.
1801
1811
1821
1831
1841
1851
1861
1871
1881
1891
1901
1911
1921
1931
1941
1951
1961
1971
1981
1991
2001
The “ REAL” Opportunity

‘90% percent of the game is half mental.’
Yogi Berra
Recap of Important Points
Have a plan and stick to it
Single best determinant of success is the appropriate asset mix
Diversification is a guiding principle
Time in the market…not market timing creates wealth
The challenges are many but none so great as removing the behaviors that negatively impact
the decision-making process

Disclaimer
This presentation is published by Investors Group. It represents the views of the investment management team at I.G. Investment Management, Ltd. and is provided as a general source of information. It is not intended to provide investment advice or as an endorsement of any investment. Some of the securities mentioned may be owned by Investors Group or its mutual funds. Every effort has been made to ensure that the material contained in the commentary is accurate at the time of publication, however, Investors Group cannot guarantee the accuracy or the completeness of such material and accepts no responsibility for any loss arising from any use of or reliance on the information contained herein.
Please read the mutual fund's prospectus before investing. Commissions, trailing commissions, management fees and other expenses may be associated with mutual fund investments. There is no guarantee that the fund will maintain its net asset value or that the full amount of your investment will be returned to you. Past performance may not be repeated.
© Copyright 2008 IGM Financial Inc.
™ Trademarks owned by IGM Financial Inc. and licensed to its subsidiary Corporations
Do not reproduce any part of this presentation without permission