investing for generations - alliance trust · investing for generations. ... each containing about...
TRANSCRIPT

Alliance Trust PLCInterim Report for the six months ended 30 June 2017
Investing for Generations

Alliance Trust PLC | Interim Report 2017
2
Chairman’s Statement
Our new investment approach supports our aim of achieving consistent outperformance at a competitive cost, while maintaining our progressive dividend policy. With the approval of our shareholders at the General Meeting in February, the management of the investment portfolio transitioned to Willis Towers Watson (WTW). It is responsible for selecting eight underlying managers that it rates as ‘best-in-class’, each of whom manages concentrated portfolios of their top stock selections. We are targeting an Ongoing Charges Ratio of below 0.65%.
Alliance Trust Investments (ATI) was responsible for the Trust’s performance to 17th March, at which point the transition commenced. The new strategy became effective on 1st April, with the official appointment of WTW and the transition completed on 12th April. ATI was sold, at what we believe was a fair price, to Liontrust Asset Management, and that this is a good home for the team. We are grateful to all the team at ATI for their work on our behalf.
This first half of 2017 has been characterised by the transition the business has gone through, and we strongly believe we now have the foundations in place to deliver strong and sustainable performance for our shareholders in the future.
Financial performance Over the period, the Trust performed well. Total Shareholder Return was 10.8%, Net Asset Value (NAV) Total Return was 12.4% and the share price rose 9.7% to 700.0p. We are encouraged that, despite undertaking the transition to the new portfolio, the Trust outperformed its benchmark on a NAV total return basis by 6.0%, primarily driven by the outperformance of the equity portfolio. Additionally, the costs of the transition were much lower than originally anticipated, which is a meaningful saving for the business and our administration expenses for the period are showing only a modest increase at £8.4m (2016: £7.7m).
Alliance Trust Savings (ATS) has seen growth in both assets under administration and customer accounts. Whilst we had hoped that ATS would report a profit for the period, additional costs were incurred in the second quarter contributing to a loss for the half year of £1.5m (2016: £0.4m profit). In the second half of the year ATS plans to continue to invest to improve its levels of customer service. We expect it to report a loss for the year.
DividendWe are very proud of our dividend track record and the Board is delighted that the Trust has achieved 50 years of consecutive dividend growth, and has been recognised by the AIC through its Dividend Hero Award. The Board continues its progressive dividend policy and has declared a dividend of 3.29p per ordinary share payable on 2nd October 2017 to shareholders on the register on 1st September 2017.
BuybacksTowards the end of last year, we introduced a more active approach to share buybacks, supporting our determination to narrow materially the Trust’s discount to NAV which averaged 5.1% over the period. Consistent with this programme, the Trust also repurchased Elliott’s shareholding following shareholder approval in February.
In summaryThe first half of 2017 has been transformational for the Trust. We have a new investment approach which, although still in its early days, is demonstrating that it can deliver outperformance at competitive cost. We believe we now have a compelling offering and look forward to continuing to invest for generations.
Lord Smith of Kelvin
Chairman
26 July 2017
The Trust has successfully implemented its new investment approach. We are confident that our alliance of best ideas will deliver attractive returns for shareholders over the long term.

Alliance Trust PLC | Interim Report 2017
3
Results for 6 months to 30 June 2017
As at 30 June 2017 6 months 1 year 3 years 5 years
Total Shareholder Return (TSR) 10.8% 36.4% 68.8% 124.2%
NAV Total Return 12.4% 27.3% 55.0% 95.7%
MSCI ACWI 6.4% 22.9% 54.1% 104.7%
Source: WTW and FactSet.
Shareholder Return
6 months to 30 June
2017
Year to 31 December
2016
6 months to 30 June
2016
Total Administrative Expenses £8.4m £16.8m £7.7m
Less Non-recurring Expenses* £(1.1)m £(3.4)m £(1.4)m
Ongoing Administrative Expenses £7.3m £13.4m £6.3m
Source: WTW.*Includes reorganisation, strategic review and extraordinary general meeting costs.
Administration Expenses
30 June 2017 31 December 2016 30 June 2016
Share price 700.0p 638.0p 524.0p
Net Asset Value (NAV) per share* 742.2p 667.5p 591.4p
Discount to NAV 5.7% 4.4% 11.4%
Average Discount to NAV** 5.1% 10.1% 10.3%
Source: WTW and Morningstar. *Balance sheet value calculated with debt at fair value. **Six months to 30 June and 12 months to 31 December.
Contribution Analysis (%)Average Weight
Total Return
Contribution to Total Return
Equity Portfolio 99.8 10.6 9.8
Foreign Exchange Contracts and Index Futures N/A N/A 0.0
Non-core Investments 8.0 7.3 0.6
Effect of Gearing* -7.8 N/A 0.6
Investment Portfolio Total 100.0 11.0
Operating subsidiary 0.0
Cash and Accruals 0.4
Share Buybacks 1.3
Total Administration Costs -0.3
NAV including Income Total Return 12.4
Effect of Discount -1.6
Share Price Total Return 10.8
MSCI ACWI Total Return 6.4
Source: WTW, BNY Mellon Fund Services (Ireland) Ltd, Morningstar, MSCI Inc and FactSet. *Gearing effect is attributed assuming that all borrowing is invested in the equity portfolio and is net of the cost of borrowing to achieve the gearing.
Company Performance
Portfolio Performance
Alliance Trust PLC | Interim Report 2017
4
Investment Approach
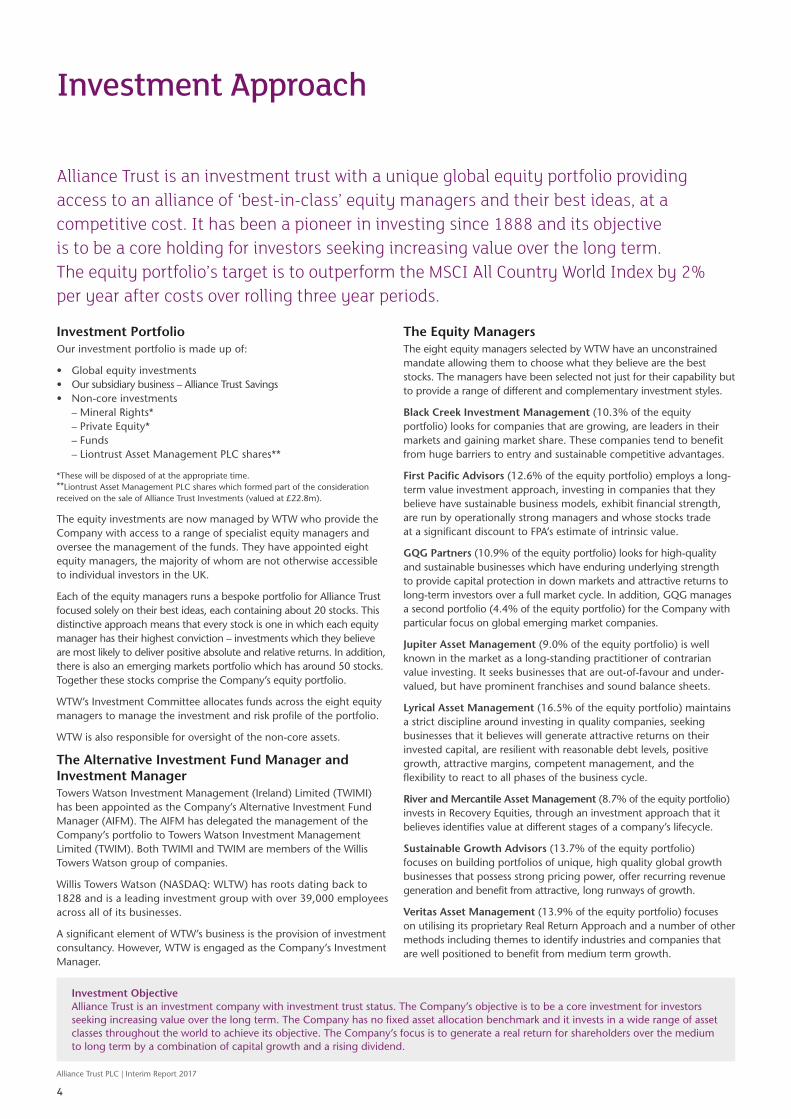
Alliance Trust is an investment trust with a unique global equity portfolio providing access to an alliance of ‘best-in-class’ equity managers and their best ideas, at a competitive cost. It has been a pioneer in investing since 1888 and its objective is to be a core holding for investors seeking increasing value over the long term. The equity portfolio’s target is to outperform the MSCI All Country World Index by 2% per year after costs over rolling three year periods.
Investment PortfolioOur investment portfolio is made up of:
• Global equity investments• Our subsidiary business – Alliance Trust Savings• Non-core investments – Mineral Rights* – Private Equity* – Funds – Liontrust Asset Management PLC shares**
*These will be disposed of at the appropriate time. **Liontrust Asset Management PLC shares which formed part of the consideration received on the sale of Alliance Trust Investments (valued at £22.8m).
The equity investments are now managed by WTW who provide the Company with access to a range of specialist equity managers and oversee the management of the funds. They have appointed eight equity managers, the majority of whom are not otherwise accessible to individual investors in the UK.
Each of the equity managers runs a bespoke portfolio for Alliance Trust focused solely on their best ideas, each containing about 20 stocks. This distinctive approach means that every stock is one in which each equity manager has their highest conviction – investments which they believe are most likely to deliver positive absolute and relative returns. In addition, there is also an emerging markets portfolio which has around 50 stocks. Together these stocks comprise the Company’s equity portfolio.
WTW’s Investment Committee allocates funds across the eight equity managers to manage the investment and risk profile of the portfolio.
WTW is also responsible for oversight of the non-core assets.
The Alternative Investment Fund Manager and Investment ManagerTowers Watson Investment Management (Ireland) Limited (TWIMI) has been appointed as the Company’s Alternative Investment Fund Manager (AIFM). The AIFM has delegated the management of the Company’s portfolio to Towers Watson Investment Management Limited (TWIM). Both TWIMI and TWIM are members of the Willis Towers Watson group of companies.
Willis Towers Watson (NASDAQ: WLTW) has roots dating back to 1828 and is a leading investment group with over 39,000 employees across all of its businesses.
A significant element of WTW’s business is the provision of investment consultancy. However, WTW is engaged as the Company’s Investment Manager.
The Equity ManagersThe eight equity managers selected by WTW have an unconstrained mandate allowing them to choose what they believe are the best stocks. The managers have been selected not just for their capability but to provide a range of different and complementary investment styles.
Black Creek Investment Management (10.3% of the equity portfolio) looks for companies that are growing, are leaders in their markets and gaining market share. These companies tend to benefit from huge barriers to entry and sustainable competitive advantages.
First Pacific Advisors (12.6% of the equity portfolio) employs a long-term value investment approach, investing in companies that they believe have sustainable business models, exhibit financial strength, are run by operationally strong managers and whose stocks trade at a significant discount to FPA’s estimate of intrinsic value.
GQG Partners (10.9% of the equity portfolio) looks for high-quality and sustainable businesses which have enduring underlying strength to provide capital protection in down markets and attractive returns to long-term investors over a full market cycle. In addition, GQG manages a second portfolio (4.4% of the equity portfolio) for the Company with particular focus on global emerging market companies.
Jupiter Asset Management (9.0% of the equity portfolio) is well known in the market as a long‐standing practitioner of contrarian value investing. It seeks businesses that are out‐of‐favour and under‐valued, but have prominent franchises and sound balance sheets.
Lyrical Asset Management (16.5% of the equity portfolio) maintains a strict discipline around investing in quality companies, seeking businesses that it believes will generate attractive returns on their invested capital, are resilient with reasonable debt levels, positive growth, attractive margins, competent management, and the flexibility to react to all phases of the business cycle.
River and Mercantile Asset Management (8.7% of the equity portfolio) invests in Recovery Equities, through an investment approach that it believes identifies value at different stages of a company’s lifecycle.
Sustainable Growth Advisors (13.7% of the equity portfolio) focuses on building portfolios of unique, high quality global growth businesses that possess strong pricing power, offer recurring revenue generation and benefit from attractive, long runways of growth.
Veritas Asset Management (13.9% of the equity portfolio) focuses on utilising its proprietary Real Return Approach and a number of other methods including themes to identify industries and companies that are well positioned to benefit from medium term growth.
Investment Objective Alliance Trust is an investment company with investment trust status. The Company’s objective is to be a core investment for investors seeking increasing value over the long term. The Company has no fixed asset allocation benchmark and it invests in a wide range of asset classes throughout the world to achieve its objective. The Company’s focus is to generate a real return for shareholders over the medium to long term by a combination of capital growth and a rising dividend.
Alliance Trust PLC | Interim Report 2017
5
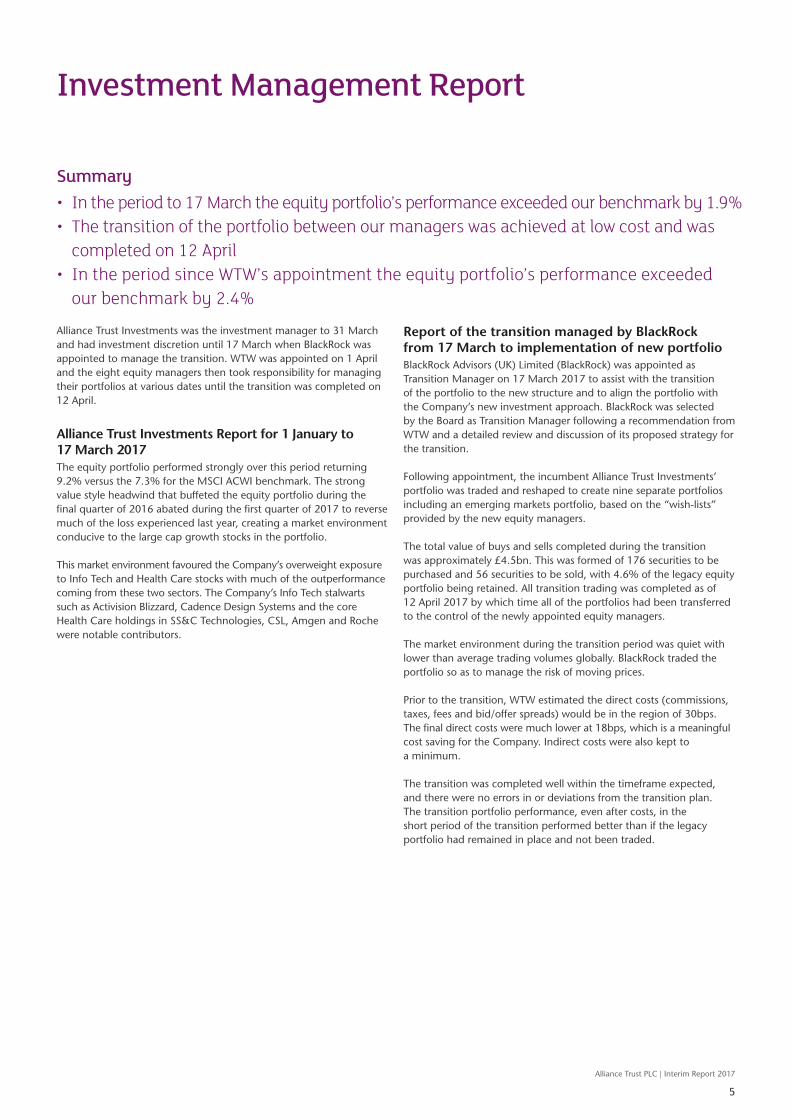
Investment Management Report
Summary• In the period to 17 March the equity portfolio’s performance exceeded our benchmark by 1.9%• The transition of the portfolio between our managers was achieved at low cost and was
completed on 12 April• In the period since WTW’s appointment the equity portfolio’s performance exceeded
our benchmark by 2.4%
Alliance Trust Investments was the investment manager to 31 March and had investment discretion until 17 March when BlackRock was appointed to manage the transition. WTW was appointed on 1 April and the eight equity managers then took responsibility for managing their portfolios at various dates until the transition was completed on 12 April.
Alliance Trust Investments Report for 1 January to 17 March 2017The equity portfolio performed strongly over this period returning 9.2% versus the 7.3% for the MSCI ACWI benchmark. The strong value style headwind that buffeted the equity portfolio during the final quarter of 2016 abated during the first quarter of 2017 to reverse much of the loss experienced last year, creating a market environment conducive to the large cap growth stocks in the portfolio. This market environment favoured the Company’s overweight exposure to Info Tech and Health Care stocks with much of the outperformance coming from these two sectors. The Company’s Info Tech stalwarts such as Activision Blizzard, Cadence Design Systems and the core Health Care holdings in SS&C Technologies, CSL, Amgen and Roche were notable contributors.
Report of the transition managed by BlackRock from 17 March to implementation of new portfolioBlackRock Advisors (UK) Limited (BlackRock) was appointed as Transition Manager on 17 March 2017 to assist with the transition of the portfolio to the new structure and to align the portfolio with the Company’s new investment approach. BlackRock was selected by the Board as Transition Manager following a recommendation from WTW and a detailed review and discussion of its proposed strategy for the transition. Following appointment, the incumbent Alliance Trust Investments’ portfolio was traded and reshaped to create nine separate portfolios including an emerging markets portfolio, based on the “wish-lists” provided by the new equity managers.
The total value of buys and sells completed during the transition was approximately £4.5bn. This was formed of 176 securities to be purchased and 56 securities to be sold, with 4.6% of the legacy equity portfolio being retained. All transition trading was completed as of 12 April 2017 by which time all of the portfolios had been transferred to the control of the newly appointed equity managers.
The market environment during the transition period was quiet with lower than average trading volumes globally. BlackRock traded the portfolio so as to manage the risk of moving prices. Prior to the transition, WTW estimated the direct costs (commissions, taxes, fees and bid/offer spreads) would be in the region of 30bps. The final direct costs were much lower at 18bps, which is a meaningful cost saving for the Company. Indirect costs were also kept to a minimum. The transition was completed well within the timeframe expected, and there were no errors in or deviations from the transition plan. The transition portfolio performance, even after costs, in the short period of the transition performed better than if the legacy portfolio had remained in place and not been traded.

Alliance Trust PLC | Interim Report 2017
6
Investment Management Report continuedWillis Towers Watson’s Report for 1 April to 30 June 2017
Market ReviewThe first half of the year was dominated by political headlines such as a snap general election in the UK, triggering of Article 50, elections across various Euro countries and a stream of tweets coming from the US. Despite the political uncertainty, economic indicators and business surveys posted strong figures close to pre-crisis highs with equities gaining in both emerging and developed markets. European elections have also rejected anti-EU politicians in Austria, the Netherlands and France, potentially implying that the widely feared break-up of the Eurozone may not be as imminent as some would like to think.
The US economy continues to look healthy, prompting the Federal Reserve (Fed) to raise rates again in June. The Fed also signalled that it may start to reduce the size of its balance sheet “relatively soon”. These actions may potentially have an impact on equity prices.
The economic and political outlook in the UK continues to be highly uncertain. The result of Theresa May’s decision to call a snap general election leaves the UK in a weakened position at a crucial time for the country as it begins its Brexit negotiations. Whilst political uncertainty across Europe has fallen, the risk remains significant within the UK.
Equity Portfolio PerformanceThe new investment approach adopted by Alliance Trust has been in place since the start of April 2017. Over this quarter the equity portfolio returned 3.0%, significantly outperforming the MSCI All Country World Index (ACWI) which returned 0.6%. Even though the results are short term, we are very pleased with the initial performance achieved under the new approach.
Investment OutlookWe continue to expect higher levels of market volatility. Periods of strong equity market returns coupled with low expectations of volatility in the market, as observed in recent months, are typically followed by periods of higher volatility. We believe that future equity returns over the longer term are unlikely to keep up with the exceptionally strong returns of recent years. This may be exacerbated by the possible gradual reduction in monetary stimulus or raising of interest rates by the main central banks.
We also believe that the high-level market view masks significant dispersion between companies, providing an excellent environment for active stock selection. We continue to position the portfolio relatively neutrally against the market with respect to countries, sector and styles to allow returns for the portfolio to be driven by the stock selection of our managers.
Non-core InvestmentsThe ongoing divestment of non-core investments continues. In the first half of 2017 the Company sold its holding in Euroclear and the final distribution from Albany Venture Partners III LP, a legacy direct private equity holding, was received in June. The reduction in value of private equity and indirect property holdings to £97m from £113m as at 31 December 2016 reflects continuing divestments. This resulted in the release of cash for investment in the equity portfolio. We expect further reductions in non-core holdings as remaining assets are realised in an orderly manner.
Alliance Trust Savings Alliance Trust Savings has made a number of important changes designed to enhance its longer-term performance through improvements to the operating platform and customer service. In the second quarter additional costs associated with these changes have been incurred and, with a delay in the full launch of the new technology platform, a loss of £1.5m was made in the first half of the year (2016: £0.4m profit).
During the period, Alliance Trust Savings has delivered: • Continued growth across all business channels with total assets
under administration now over £15bn, an increase of 11% since 31 December 2016; and
• An increase in the number of customer accounts of 3% to almost
114,000 since the year end. We have concluded that the valuation of the Company’s investment in Alliance Trust Savings should remain at £61.5m. In coming to this conclusion the Directors considered the underlying profitability of Alliance Trust Savings against the background of its financial performance, its continued focus on improving customer service and the potential to further develop the business. This valuation will be assessed in the second half of 2017 as the planned enhancements to customer service are introduced.
Disposal of Alliance Trust InvestmentsAs reported in our Annual Report for 2016, we sold Alliance Trust Investments to Liontrust Asset Management. This completed in early April and the value of the shares received as part of the consideration has increased by £3m from that reported at the year end.

Alliance Trust PLC | Interim Report 2017
7
Company Portfolio Review
Equity holdings as at 30 June 2017
Stock Sector Country of listing% of
quoted equitiesValue
£m
UnitedHealth Group Health Care United States 1.8 45.5
Charter Communications Consumer Discretionary United States 1.8 43.5
Microsoft Information Technology United States 1.6 38.9
Oracle Information Technology United States 1.6 38.9
Nielsen Industrials United Kingdom 1.4 35.8
CVS Health Consumer Staples United States 1.4 34.7
Nestle Consumer Staples Switzerland 1.3 32.3
Western Union Information Technology United States 1.3 31.5
Johnson Controls International Industrials Ireland 1.3 31.2
Ryanair Industrials Ireland 1.2 30.9
Anglo American Materials United Kingdom 1.2 30.7
Comcast Consumer Discretionary United States 1.2 30.0
Safran Industrials France 1.1 27.5
Airbus Industrials Netherlands 1.0 25.8
Alphabet Information Technology United States 1.0 25.4
AIA Group Financials Hong Kong 1.0 24.9
HDFC Bank Financials India 1.0 24.9
TP ICAP Financials United Kingdom 1.0 24.6
Allergan Health Care Ireland 1.0 24.4
PageGroup Industrials United Kingdom 1.0 23.6
Samsung Electronics Information Technology South Korea 0.9 23.6
Koninklijke Philips Industrials Netherlands 0.9 23.3
Britvic Consumer Staples United Kingdom 0.9 23.2
Baidu Information Technology Cayman Islands 0.9 22.9
Regeneron Pharmaceuticals Health Care United States 0.9 22.9
Aetna Health Care United States 0.9 22.8
Western Digital Information Technology United States 0.9 22.7
Liberty Interactive Consumer Discretionary United States 0.9 22.5
Novo Nordisk Health Care Denmark 0.9 22.1
Anthem Health Care United States 0.9 22.0
Tencent Information Technology Cayman Islands 0.9 21.9
Whirlpool Consumer Discretionary United States 0.9 21.8
Corning Information Technology United States 0.9 21.6
Amazon Consumer Discretionary United States 0.9 21.5
Kansas City Southern Industrials United States 0.8 21.1
Aflac Financials United States 0.8 21.1
Infosys Information Technology India 0.8 21.1
Eaton Industrials United States 0.8 20.8
Danone Consumer Staples France 0.8 20.8
Hugo Boss Consumer Discretionary Germany 0.8 20.7
Broadcom Information Technology Singapore 0.8 20.7
TE Connectivity Information Technology Switzerland 0.8 20.4
SAP Se Information Technology Germany 0.8 20.3
Celanese Materials United States 0.8 20.3
AerCap Industrials Netherlands 0.8 20.1
Visa Information Technology United States 0.8 20.0
Lincoln National Financials United States 0.8 19.8
Prosegur Industrials Spain 0.8 19.8
Priceline Consumer Discretionary United States 0.8 19.7
Ameriprise Financial Financials United States 0.8 19.1
Flex Information Technology Singapore 0.8 19.0
American Express Financials United States 0.8 18.8

Alliance Trust PLC | Interim Report 2017
8
Stock Sector Country of listing% of
quoted equitiesValue
£m
Goodyear Tire & Rubber Consumer Discretionary United States 0.8 18.8
Suncor Energy Energy Canada 0.7 18.6
Mondelez International Consumer Staples United States 0.7 18.5
EOG Resources Energy United States 0.7 18.4
Facebook Information Technology United States 0.7 18.2
Core Laboratories Energy Netherlands 0.7 18.0
Lowe's Companies Consumer Discretionary United States 0.7 17.9
H&R Block Consumer Discretionary United States 0.7 17.3
Pearson Consumer Discretionary United Kingdom 0.7 17.1
Dollar General Consumer Discretionary United States 0.7 16.8
Exxon Mobil Energy United States 0.7 16.4
HeidelbergCement Materials Germany 0.6 16.0
ICICI Bank Financials India 0.6 16.0
Daikin Industries Industrials Japan 0.6 15.9
OC Oerlikon Industrials Switzerland 0.6 15.5
BP Energy United Kingdom 0.6 15.5
Sumitomo Mitsui Financial Financials Japan 0.6 15.4
Capgemini Information Technology France 0.6 15.3
Moeller-Maersk Industrials Denmark 0.6 15.1
Centrica Utilities United Kingdom 0.6 15.0
Deutsche Börse Financials Germany 0.6 14.9
Eni Energy Italy 0.6 14.8
Sberbank Of Russia Financials Russia 0.6 14.7
Royal Bank Of Scotland Financials United Kingdom 0.6 14.6
Ericsson Information Technology Sweden 0.6 14.6
Check Point Software Technology Information Technology Israel 0.6 14.5
Standard Chartered Financials United Kingdom 0.6 14.1
Cisco Systems Information Technology United States 0.6 14.0
BNP Paribas Financials France 0.5 13.6
Rolls Royce Industrials United Kingdom 0.5 13.5
Solocal Consumer Discretionary France 0.5 13.5
Express Scripts Holding Health Care United States 0.5 13.4
Johnson & Johnson Health Care United States 0.5 13.4
Grupo Financiero Santander Financials Mexico 0.5 13.1
Schneider Electric Industrials France 0.5 13.0
Capita Industrials United Kingdom 0.5 13.0
Lam Research Information Technology United States 0.5 12.9
SoftBank Telecommunication Services Japan 0.5 12.9
Teradata Information Technology United States 0.5 12.9
Macquarie Financials Australia 0.5 12.6
London Stock Exchange Financials United Kingdom 0.5 12.6
Inovalon Health Care United States 0.5 12.5
Ambev Consumer Staples Brazil 0.5 12.1
Santen Pharmaceutical Health Care Japan 0.5 12.1
Lloyds Banking Group Financials United Kingdom 0.5 12.0
Anta Sports Products Consumer Discretionary Hong Kong 0.5 11.6
Citigroup Financials United States 0.5 11.6
InterContinental Financials United States 0.5 11.5
Sonic Healthcare Health Care Australia 0.5 11.5
BorgWarner Consumer Discretionary United States 0.5 11.5
Accor Consumer Discretionary France 0.5 11.5
Nintendo Information Technology Japan 0.5 11.5
Company Portfolio Review continuedEquity holdings as at 30 June 2017 continued

Alliance Trust PLC | Interim Report 2017
9
Stock Sector Country of listing% of
quoted equitiesValue
£m
Aristocrat Leisure Consumer Discretionary Australia 0.5 11.3
DSM Materials Netherlands 0.5 11.3
Galaxy Entertainment Consumer Discretionary Hong Kong 0.4 11.2
Galp Energia Energy Portugal 0.4 11.1
Bank of America Financials United States 0.4 11.0
Roche Health Care Switzerland 0.4 11.0
Charles Schwab Financials United States 0.4 10.9
Taiwan Semiconductor Manufacturing Information Technology Taiwan 0.4 10.9
Wells Fargo Financials United States 0.4 10.9
Mastercard Information Technology United States 0.4 10.8
CME Group Financials United States 0.4 10.7
International Business Machines Information Technology United States 0.4 10.6
DIA Consumer Staples Spain 0.4 10.6
FTI Consulting Industrials United States 0.4 9.8
Carsales.com Information Technology Australia 0.4 9.8
Applus Services Industrials Spain 0.4 9.8
Prada Consumer Discretionary Italy 0.4 9.7
Sanofi Health Care France 0.4 9.4
Marks & Spencer Consumer Discretionary United Kingdom 0.4 9.3
South32 Materials Australia 0.4 9.3
MYOB Information Technology Australia 0.4 9.0
Philip Morris International Consumer Staples United States 0.4 8.9
DONG Energy Utilities Denmark 0.4 8.7
Naspers Consumer Discretionary South Africa 0.3 8.4
Ansell Health Care Australia 0.3 8.3
Malaysia Airports Industrials Malaysia 0.3 8.3
Tesco Consumer Staples United Kingdom 0.3 8.2
Celgene Health Care United States 0.3 8.2
Kimberly - Clark de Mexico Consumer Staples Mexico 0.3 8.2
Sands China Consumer Discretionary Hong Kong 0.3 7.9
TS Tech Consumer Discretionary Japan 0.3 7.4
QUALCOMM Information Technology United States 0.3 7.3
Hengan International Group Consumer Staples Cayman Islands 0.3 6.5
Daiichi Sankyo Consumer Discretionary Japan 0.3 6.3
Alibaba Information Technology Cayman Islands 0.2 5.3
ARYZTA Consumer Staples Switzerland 0.2 5.1
Gafisa Consumer Discretionary Brazil 0.2 4.8
Bank Central Asia Financials Indonesia 0.2 4.4
British American Tobacco Consumer Staples United Kingdom 0.2 4.2
B3 Financials Brazil 0.2 4.0
JD.com Consumer Discretionary Cayman Islands 0.1 3.1
CP ALL Consumer Staples Thailand 0.1 3.1
Housing Development Finance Financials India 0.1 2.9
Itau Unibanco Financials Brazil 0.1 2.8
Telekomunikasi Indonesia Telecommunication Services Indonesia 0.1 2.5
Heineken Consumer Staples Netherlands 0.1 2.4
MercadoLibre Information Technology United States 0.1 2.3
CK Hutchison Industrials Cayman Islands 0.1 2.1
Moscow Exchange Financials Russia 0.1 2.1
Grupo Aeroportuario del Sureste Industrials Mexico 0.1 2.0
ALROSA Materials Russia 0.1 1.9
NVIDIA Information Technology United States 0.1 1.8

Alliance Trust PLC | Interim Report 2017
10
Stock Sector Country of listing% of
quoted equitiesValue
£m
Bank Rakyat Financials Indonesia 0.1 1.7
Raia Drogasil Consumer Staples Brazil 0.1 1.7
InterGlobe Aviation Industrials India 0.1 1.6
OTP Bank Financials Hungary 0.1 1.6
Grupo Aeroportuario del Pacifico Industrials Mexico 0.1 1.5
Credicorp Financials Bermuda 0.1 1.4
Yandex Information Technology Netherlands 0.1 1.4
Bancolombia Financials Colombia 0.1 1.4
Reliance Industries Energy India 0.1 1.3
Infraestructura Energetica Nova Utilities Mexico 0.1 1.3
Sarana Menara Telecommunication Services Indonesia 0.1 1.2
Guangdong Investment Utilities Hong Kong 0.1 1.2
Hyundai Mobis Consumer Discretionary South Korea 0.0 1.2
Grupo Financiero Galicia Financials Argentina 0.0 1.1
Gedeon Richter Health Care Hungary 0.0 1.1
Enel Americas Utilities Chile 0.0 1.1
Gudang Garam Consumer Staples Indonesia 0.0 1.1
Pampa Energia Utilities Argentina 0.0 1.0
Energisa Utilities Brazil 0.0 1.0
TAESA Utilities Brazil 0.0 1.0
Severstal Financials Russia 0.0 0.8
Shinhan Financial Financials South Korea 0.0 0.8
China Resources Land Utilities Bermuda 0.0 0.8
Qualicorp Health Care Brazil 0.0 0.8
LUKOIL Energy Russia 0.0 0.6
Rosneft Oil Energy Russia 0.0 0.6
Hong Kong and China Gas Co Utilities Hong Kong 0.0 0.5
TAV Havalimanlari Industrials Turkey 0.0 0.2
100% Total value 2,463.9
Company Portfolio Review continuedEquity holdings as at 30 June 2017 continued
Alliance Trust PLC | Interim Report 2017
11
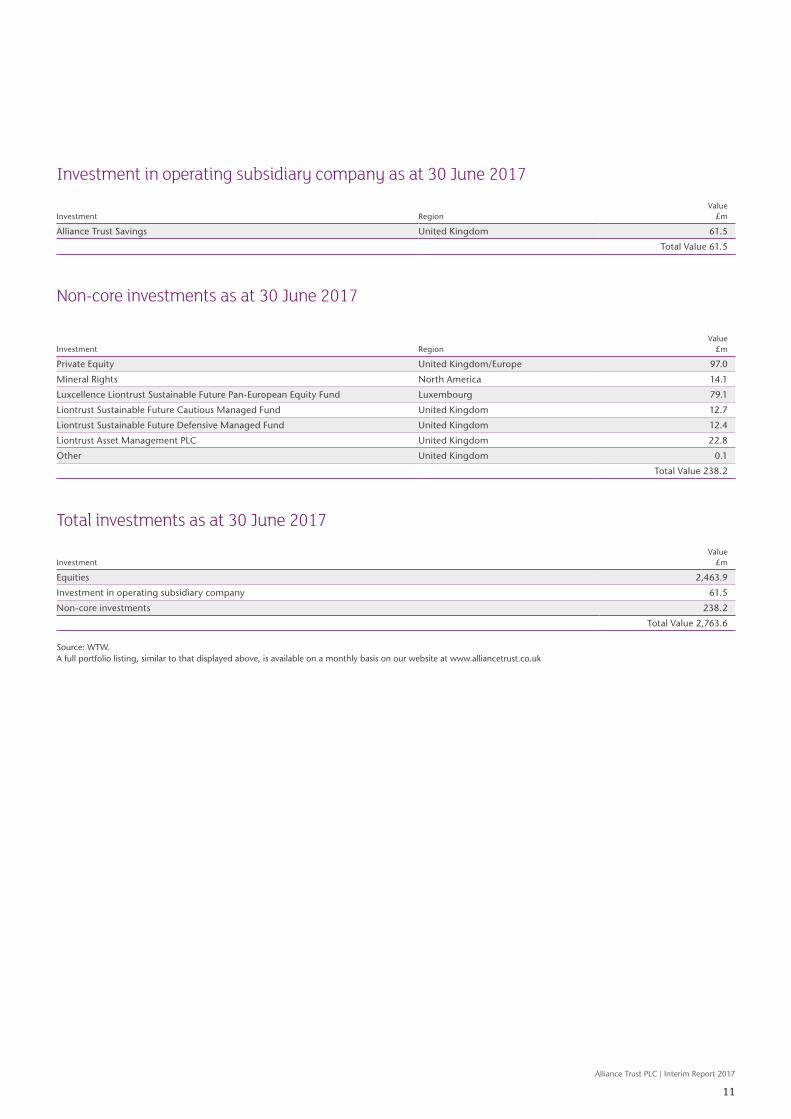
Non-core investments as at 30 June 2017
Investment RegionValue
£m
Private Equity United Kingdom/Europe 97.0
Mineral Rights North America 14.1
Luxcellence Liontrust Sustainable Future Pan-European Equity Fund Luxembourg 79.1
Liontrust Sustainable Future Cautious Managed Fund United Kingdom 12.7
Liontrust Sustainable Future Defensive Managed Fund United Kingdom 12.4
Liontrust Asset Management PLC United Kingdom 22.8
Other United Kingdom 0.1
Total Value 238.2
Total investments as at 30 June 2017
InvestmentValue
£m
Equities 2,463.9
Investment in operating subsidiary company 61.5
Non-core investments 238.2
Total Value 2,763.6
Source: WTW.A full portfolio listing, similar to that displayed above, is available on a monthly basis on our website at www.alliancetrust.co.uk
Investment in operating subsidiary company as at 30 June 2017
Investment RegionValue
£m
Alliance Trust Savings United Kingdom 61.5
Total Value 61.5

Alliance Trust PLC | Interim Report 2017
12
Other Information
Risks and UncertaintiesIn order to achieve its investment objectives the Company invests in quoted securities and in its subsidiary business. It also has non-core investments in other asset classes and financial instruments. Its principal risks and uncertainties are therefore: • Market and Prudential – investment underperformance and liquidity• Operational – change of investment manager and cyber attack• Strategic – external factors and subsidiary underperformance• Regulatory & Conduct – regulatory non-compliance These risks, and the way in which they are managed, are described in more detail within the Risk section on pages 22 to 24 of the Annual Report for the year ended 31 December 2016, which is available on the Company’s website at www.alliancetrust.co.uk.
The sale of Alliance Trust Investments completed during the period and, since 1 April 2017, the management of the Company’s Operational and Regulatory & Conduct risks is now supported by WTW. Having transitioned to our new investment structure the risks associated with the change of investment manager have diminished. The Board has considered the impact of Brexit and of the recent general election and believes that while these may lead to an element of market volatility, the global nature of the investments of the Company are such that neither of these factors are specifically believed to increase the risk of investment underperformance over the long term.
Related Party TransactionsIn the period the Company repurchased 95,478,576 shares from Elliott International L.P., The Liverpool Limited Partnership and Elliott Associates L.P., at a discount of 4.75% to NAV at a total cost of £633m. There were no other transactions with related parties during the six months ended 30 June 2017 which have a material effect on the results or the financial position of the Company.
BuybacksThe share buyback programme was continued throughout the period, and accommodated the purchase of Elliott’s 20% stake during March. As supply and demand has moved towards a state of equilibrium, share buybacks have reduced in number and scale during the second quarter of 2017.
ConsolidationThe Annual Report for the year ended 31 December 2016 presented both Company only financial statements of the Company as well as consolidated Group financial statements consisting of the Company and its wholly owned subsidiary Alliance Trust Services Limited (ATSL). This was because the activities of ATSL were previously material to the Company, which is no longer the case given a cessation of the services provided due to the new investment approach. The Board has therefore decided that, on the basis of materiality, it is now appropriate to no longer prepare consolidated financial statements, and to now present the results of the Company on a Company only basis. This interim report presents prior period Company only results to ensure consistency. The Company continues to recognise its subsidiaries as investments at fair value through the income statement.
Going Concern StatementThe factors impacting on Going Concern are set out in detail on page 37 of the Annual Report for the year ended 31 December 2016.
As at 30 June 2017 there have been no significant changes to these factors. The Directors, who have reviewed budgets, forecasts and sensitivities, consider that the Company has adequate financial resources to enable it to continue in operational existence for the foreseeable future. Accordingly, the Directors believe it is appropriate to continue to adopt the going concern basis for preparing the financial statements.
Responsibility StatementWe confirm that to the best of our knowledge:
• The condensed set of financial statements have been prepared in accordance with IAS 34 “Interim Financial Reporting” as adopted by the EU;
• The interim management report includes a fair review of the information required by:
(a) DTR 4.2.7R of the Disclosure and Transparency Rules, being an indication of important events that have occurred during the first six months of the financial year and their impact on the condensed set of financial statements, and a description of the principal risks and uncertainties for the remaining six months of the year; and
(b) DTR 4.2.8R of the Disclosure and Transparency Rules, being related party transactions that have taken place in the first six months of the current financial year and that have materially affected the financial position or performance of the entity during that period, and any changes in the related party transactions described in the last annual report that could do so.
Signed on behalf of the Board
Lord Smith of Kelvin Chairman 26 July 2017
Alliance Trust PLC | Interim Report 2017
13
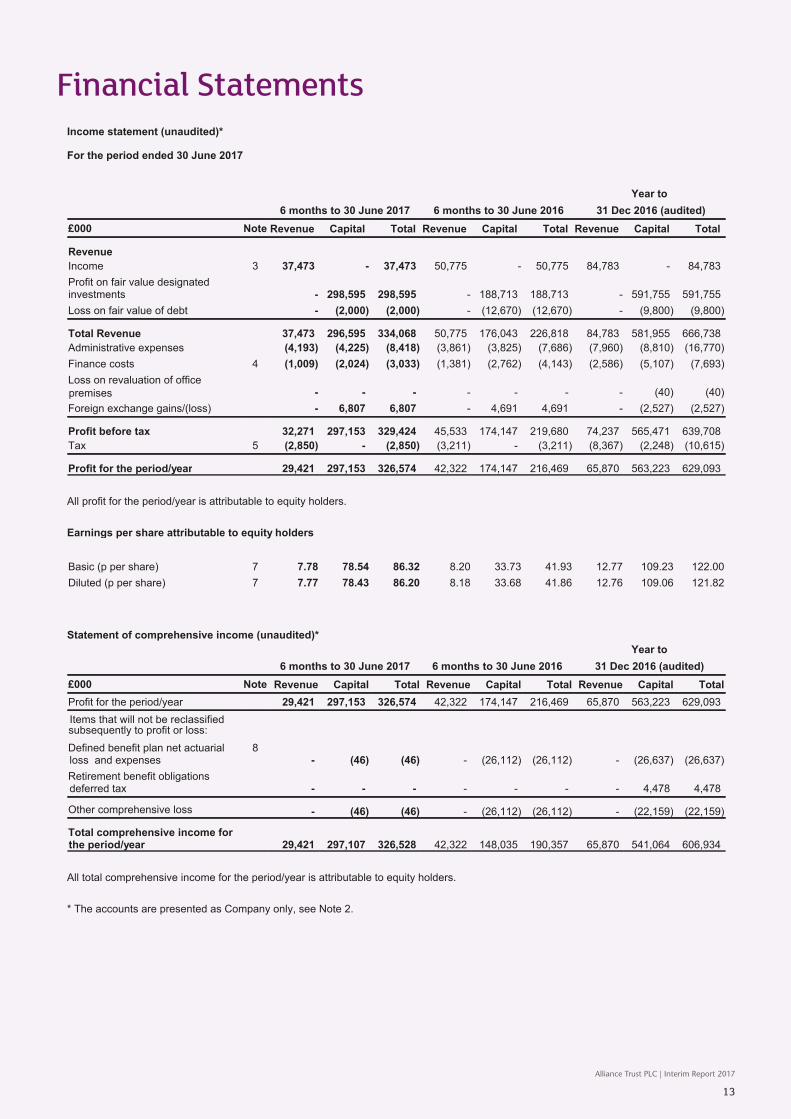
Financial StatementsFinancial StatementsIncome statement (unaudited)*
For the period ended 30 June 2017
6 months to 30 June 2017 6 months to 30 June 2016
Year to
31 Dec 2016 (audited)
£000 Note Revenue Capital Total Revenue Capital Total Revenue Capital Total
Revenue
Income 3 37,473 - 37,473 50,775 - 50,775 84,783 - 84,783
Profit on fair value designatedinvestments - 298,595 298,595 - 188,713 188,713 - 591,755 591,755
Loss on fair value of debt - (2,000) (2,000) - (12,670) (12,670) - (9,800) (9,800)
Total Revenue 37,473 296,595 334,068 50,775 176,043 226,818 84,783 581,955 666,738
Administrative expenses (4,193) (4,225) (8,418) (3,861) (3,825) (7,686) (7,960) (8,810) (16,770)
Finance costs 4 (1,009) (2,024) (3,033) (1,381) (2,762) (4,143) (2,586) (5,107) (7,693)
Loss on revaluation of officepremises - - - - - - - (40) (40)
Foreign exchange gains/(loss) - 6,807 6,807 - 4,691 4,691 - (2,527) (2,527)
Profit before tax 32,271 297,153 329,424 45,533 174,147 219,680 74,237 565,471 639,708
Tax 5 (2,850) - (2,850) (3,211) - (3,211) (8,367) (2,248) (10,615)
Profit for the period/year 29,421 297,153 326,574 42,322 174,147 216,469 65,870 563,223 629,093
All profit for the period/year is attributable to equity holders.
Earnings per share attributable to equity holders
Basic (p per share) 7 7.78 78.54 86.32 8.20 33.73 41.93 12.77 109.23 122.00
Diluted (p per share) 7 7.77 78.43 86.20 8.18 33.68 41.86 12.76 109.06 121.82
Statement of comprehensive income (unaudited)*
6 months to 30 June 2017 6 months to 30 June 2016
Year to
31 Dec 2016 (audited)
£000 Note Revenue Capital Total Revenue Capital Total Revenue Capital Total
Profit for the period/year 29,421 297,153 326,574 42,322 174,147 216,469 65,870 563,223 629,093
Items that will not be reclassified
Defined benefit plan net actuarialloss and expenses
8- (46) (46) - (26,112) (26,112) - (26,637) (26,637)
Retirement benefit obligationsdeferred tax - - - - - - - 4,478 4,478
Other comprehensive loss - (46) (46) - (26,112) (26,112) - (22,159) (22,159)
Total comprehensive income forthe period/year 29,421 297,107 326,528 42,322 148,035 190,357 65,870 541,064 606,934
All total comprehensive income for the period/year is attributable to equity holders.
* The accounts are presented as Company only, see Note 2.
subsequently to profit or loss:

Alliance Trust PLC | Interim Report 2017
14
Statement of changes in equity (unaudited)*
For the period ended 30 June 2017
£000
6 months to
30 June 2017
6 months to
30 June 2016
Year to
31 Dec 2016
(audited)
Called up share capital
At 1 January 12,319 13,160 13,160
Own shares purchased and cancelled in the period/year (3,493) (285) (841)
At 30 June / 31 December 8,826 12,875 12,319
Capital reserves
At 1 January 2,508,359 2,163,026 2,163,026
Profit for the period/year 297,153 174,147 563,223
Defined benefit plan actuarial loss (46) (26,112) (22,159)
Own shares purchased and cancelled in the period/year (969,102) (56,171) (195,841)
Share based payments - 223 110
At 30 June / 31 December 1,836,364 2,255,113 2,508,359
Merger reserve
At 1 January, 30 June and 31 December 645,335 645,335 645,335
Capital redemption reserve
At 1 January 6,679 5,838 5,838
Own shares purchased and cancelled in the period/year 3,493 285 841
At 30 June / 31 December 10,172 6,123 6,679
Revenue reserve
At 1 January 111,450 111,921 111,921
Profit for the period/year 29,421 42,322 65,870
Dividends (25,176) (32,001) (66,329)
Unclaimed dividends (redistributed)/returned 66 (2) (12)
At 30 June / 31 December 115,761 122,240 111,450
Total equity
At 1 January 3,284,142 2,939,280 2,939,280
At 30 June / 31 December 2,616,458 3,041,686 3,284,142
* The accounts are presented as Company only, see Note 2.

Alliance Trust PLC | Interim Report 2017
15
Balance sheet (unaudited)*
As at 30 June 2017
£000 Note 30 June 2017 30 June 201631 Dec 2016
(audited)
Non-current assets
Investments held at fair value 10 2,763,573 3,343,951 3,474,197
Property, plant and equipment:
Office premises 4,500 4,540 4,500
Other fixed assets - 29 24
Pension scheme surplus 8 38 235 83
Deferred tax asset 72 1,238 72
2,768,183 3,349,993 3,478,876
Current assets
Outstanding settlements and other receivables 14,111 42,535 9,821
Recoverable overseas tax 3,080 2,754 2,997
Cash and cash equivalents 103,134 41,458 49,430
120,325 86,747 62,248
Total assets 2,888,508 3,436,740 3,541,124
Current liabilities
Outstanding settlements and other payables (16,118) (68,057) (14,051)
Tax payable (3,991) (3,991) (3,991)
Bank loans 13 (131,000) (200,000) (120,000)
(151,109) (272,048) (138,042)
Total assets less current liabilities 2,737,399 3,164,692 3,403,082
Non-current liabilities
Unsecured fixed rate loan notes 13 (120,800) (121,670) (118,800)
Deferred tax liability (72) (1,238) (72)
Amounts payable under long term Investment Incentive Plan (69) (98) (68)
(120,941) (123,006) (118,940)
Net assets 2,616,458 3,041,686 3,284,142
Equity
Share capital 14 8,826 12,875 12,319
Capital reserve 1,836,364 2,255,113 2,508,359
Merger reserve 645,335 645,335 645,335
Capital redemption reserve 10,172 6,123 6,679
Revenue reserve 115,761 122,240 111,450
Total Equity 2,616,458 3,041,686 3,284,142
All net assets are attributable to the equity holders.
* The accounts are presented as Company only, see Note 2.
Net asset value per ordinary share attributable to equity holders
Basic (£) 9 £7.42 £5.91 £6.67
Diluted (£) 9 £7.41 £5.91 £6.67
Alliance Trust PLC | Interim Report 2017
16
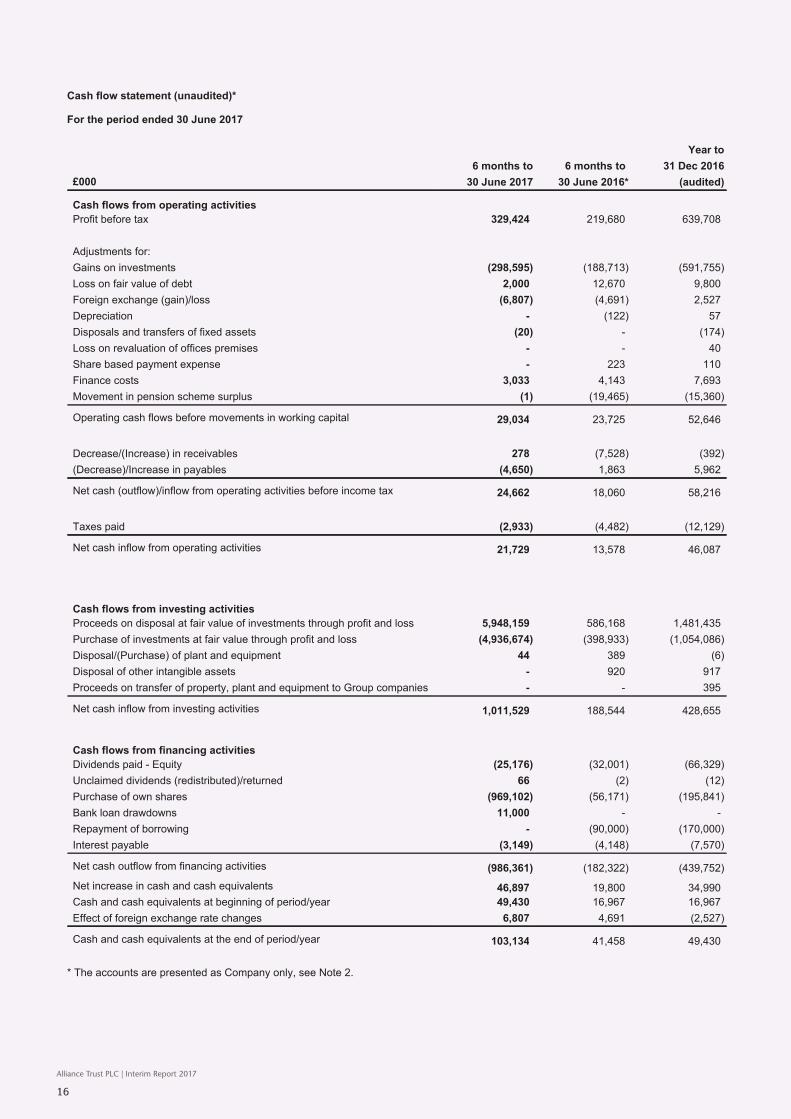
Cash flow statement (unaudited)*
For the period ended 30 June 2017
£000
6 months to
30 June 2017
6 months to
30 June 2016*
Year to
31 Dec 2016
(audited)
Cash flows from operating activities
Profit before tax 329,424 219,680 639,708
Adjustments for:
Gains on investments (298,595) (188,713) (591,755)
Loss on fair value of debt 2,000 12,670 9,800
Foreign exchange (gain)/loss (6,807) (4,691) 2,527
Depreciation - (122) 57
Disposals and transfers of fixed assets (20) - (174)
Loss on revaluation of offices premises - - 40
Share based payment expense - 223 110
Finance costs 3,033 4,143 7,693
Movement in pension scheme surplus (1) (19,465) (15,360)
Operating cash flows before movements in working capital 29,034 23,725 52,646
Decrease/(Increase) in receivables 278 (7,528) (392)
(Decrease)/Increase in payables (4,650) 1,863 5,962
Net cash (outflow)/inflow from operating activities before income tax 24,662 18,060 58,216
Taxes paid (2,933) (4,482) (12,129)
Net cash inflow from operating activities 21,729 13,578 46,087
Cash flows from investing activities
Proceeds on disposal at fair value of investments through profit and loss 5,948,159 586,168 1,481,435
Purchase of investments at fair value through profit and loss (4,936,674) (398,933) (1,054,086)
Disposal/(Purchase) of plant and equipment 44 389 (6)
Disposal of other intangible assets - 920 917
Proceeds on transfer of property, plant and equipment to Group companies - - 395
Net cash inflow from investing activities 1,011,529 188,544 428,655
Cash flows from financing activities
Dividends paid - Equity (25,176) (32,001) (66,329)
Unclaimed dividends (redistributed)/returned 66 (2) (12)
Purchase of own shares (969,102) (56,171) (195,841)
Bank loan drawdowns 11,000 - -
Repayment of borrowing - (90,000) (170,000)
Interest payable (3,149) (4,148) (7,570)
Net cash outflow from financing activities (986,361) (182,322) (439,752)
Net increase in cash and cash equivalents 46,897 19,800 34,990
Cash and cash equivalents at beginning of period/year 49,430 16,967 16,967
Effect of foreign exchange rate changes 6,807 4,691 (2,527)
Cash and cash equivalents at the end of period/year 103,134 41,458 49,430
* The accounts are presented as Company only, see Note 2.

Alliance Trust PLC | Interim Report 2017
17
Notes to the financial statements
1 General Information
The information contained in this report for the period ended 30 June 2017 does not constitute statutory accounts as defined in section 434of the Companies Act 2006. A copy of the statutory accounts for the year ended 31 December 2016 has been delivered to the Registrar ofCompanies. The auditor’s report on those financial statements was prepared under s495 and s496 of the Companies Act 2006. The reportwas not qualified, did not contain an emphasis of matter paragraph and did not contain statements under section 498(2) or (3) of theCompanies Act.
The interim results are unaudited. They should not be taken as a guide to the full year.
2 Accounting Policies
Basis of preparation
The annual financial statements were prepared using accounting policies consistent with International Financial Reporting Standards(IFRS) as adopted by the EU. The condensed set of financial statements included in this half yearly financial report have been prepared inaccordance with IAS 34 ‘Interim Financial Reporting’, as adopted by the EU.
The Annual Report for the year ended 31 December 2016 presented both Company only financial statements of the Company as well asconsolidated Group financial statements consisting of the Company and its wholly owned subsidiary Alliance Trust Services Limited(ATSL). This was because the activities of ATSL were previously material to the Company, which is no longer the case given a cessation ofthe services provided due to the new investment approach. The Board has therefore decided that, on the basis of materiality, it is nowappropriate to no longer prepare consolidated financial statements, and to now present the results of the Company on a Company onlybasis. This interim report presents prior period Company only results to ensure consistency. The Company continues to recognise itssubsidiaries as investments at fair value through the income statement.
Going concern
The Directors have a reasonable expectation that the Company has sufficient resources to continue in operational existence for theforeseeable future. Accordingly the financial statements have been prepared on a going concern basis.
Segmental reporting
The Company has identified a single operating segment, the investment trust, which aims to maximise shareholders returns. As such nosegmental information has been included in these financial statements.
Application of accounting policies
The same accounting policies, presentations and methods of computation are followed in these financial statements as were applied in theGroup’s last annual audited financial statements with the exception of the changes that have been made to the basis of preparation.
Group Consolidation
The Company qualifies as an investment entity under IFRS 10 meeting all the key characteristics and as a result recognises itssubsidiaries as investments at fair value through the income statement.
All subsidiaries within the Group are valued at fair value through the income statement as they do not provide services that relate directly tothe investment activities of the Company or they are themselves regarded as an investment entity.

Alliance Trust PLC | Interim Report 2017
18
Notes to the financial statements
3 Income
£000
6 months to
30 June 2017
6 months to
30 June 2016
Year to
31 Dec 2016
Deposit interest 23 (1) 4
Dividend income 35,661 49,950 82,903
Mineral rights income 1,453 826 1,685
Property rental income 335 - -
Recharged costs 1 - 191
Total income 37,473 50,775 84,783
4 Finance Costs
6 months to 30 June 2017 6 months to 30 June 2016 Year to 31 Dec 2016
£000 Revenue Capital Total Revenue Capital Total Revenue Capital Total
Bank loans and unsecuredfixed rate loan notes 1,009 2,024 3,033 1,381 2,762 4,143 2,586 5,107 7,693
Total finance costs 1,009 2,024 3,033 1,381 2,762 4,143 2,586 5,107 7,693
Finance costs include interest of £2.2m (£2.2m at 30 June 2016 and £4.3m at 31 December 2016) on the £100m 4.28% unsecured fixedrate loan notes which were drawn down in July 2014 for 15 years.
5 Taxation
UK corporation tax for the period to 30 June 2017 is calculated at the average rate of 19.3% (20.0% for the period to 30 June 2016) of theestimated assessable profit for the period. A reduction in the main rate of UK corporation tax to 19.3% was substantively enacted in April2017. Taxation for overseas jurisdictions is calculated at the rates prevailing in the respective jurisdictions, such taxation mainly compriseswithholding taxes levied on the investment returns generated on foreign investments such as overseas dividend income.
6 Dividends paid
£000
6 months to
30 June 2017
6 months to
30 June 2016
Year to
31 Dec 2016
Fourth interim dividend for the year ended 31 December 2015 of 3.3725p per share - 17,473 17,473
First interim dividend for the year ended 31 December 2016 of 2.8250p per share - 14,528 14,528
Second interim dividend for the year ended 31 December 2016 of 2.8250p per share - - 14,528
Third interim dividend for the year ended 31 December 2016 of 3.8500p per share - - 19,800
Fourth interim dividend for the year ended 31 December 2016 of 3.2740p per share 13,507 - -
First interim dividend for the year ended 31 December 2017 of 3.290p per share 11,669 - -
25,176 32,001 66,329
Alliance Trust PLC | Interim Report 2017
19
Notes to the financial statements
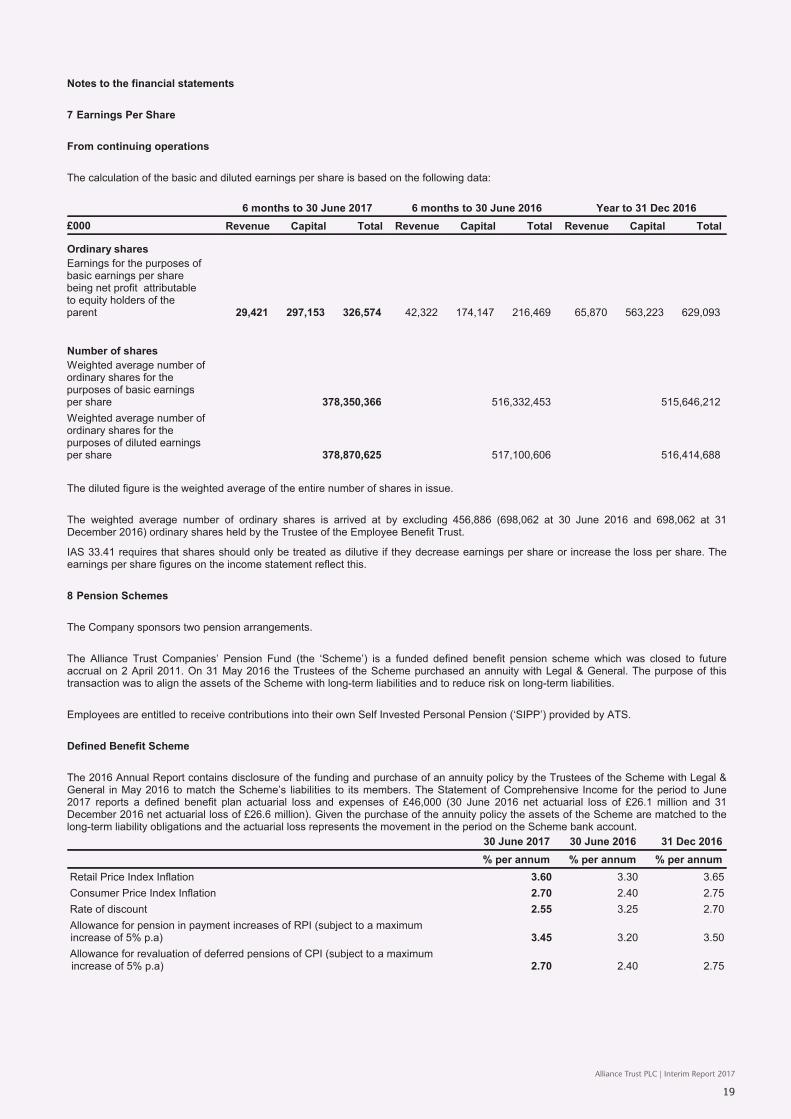
7 Earnings Per Share
From continuing operations
The calculation of the basic and diluted earnings per share is based on the following data:
6 months to 30 June 2017 6 months to 30 June 2016 Year to 31 Dec 2016
£000 Revenue Capital Total Revenue Capital Total Revenue Capital Total
Ordinary shares
Earnings for the purposes ofbasic earnings per sharebeing net profit attributableto equity holders of theparent 29,421 297,153 326,574 42,322 174,147 216,469 65,870 563,223 629,093
Number of shares
Weighted average number ofordinary shares for thepurposes of basic earningsper share 378,350,366 516,332,453 515,646,212
Weighted average number ofordinary shares for thepurposes of diluted earningsper share 378,870,625 517,100,606 516,414,688
The diluted figure is the weighted average of the entire number of shares in issue.
The weighted average number of ordinary shares is arrived at by excluding 456,886 (698,062 at 30 June 2016 and 698,062 at 31December 2016) ordinary shares held by the Trustee of the Employee Benefit Trust.
IAS 33.41 requires that shares should only be treated as dilutive if they decrease earnings per share or increase the loss per share. Theearnings per share figures on the income statement reflect this.
8 Pension Schemes
The Company sponsors two pension arrangements.
The Alliance Trust Companies’ Pension Fund (the ‘Scheme’) is a funded defined benefit pension scheme which was closed to futureaccrual on 2 April 2011. On 31 May 2016 the Trustees of the Scheme purchased an annuity with Legal & General. The purpose of thistransaction was to align the assets of the Scheme with long-term liabilities and to reduce risk on long-term liabilities.
Employees are entitled to receive contributions into their own Self Invested Personal Pension (‘SIPP’) provided by ATS.
Defined Benefit Scheme
The 2016 Annual Report contains disclosure of the funding and purchase of an annuity policy by the Trustees of the Scheme with Legal &General in May 2016 to match the Scheme’s liabilities to its members. The Statement of Comprehensive Income for the period to June2017 reports a defined benefit plan actuarial loss and expenses of £46,000 (30 June 2016 net actuarial loss of £26.1 million and 31December 2016 net actuarial loss of £26.6 million). Given the purchase of the annuity policy the assets of the Scheme are matched to thelong-term liability obligations and the actuarial loss represents the movement in the period on the Scheme bank account.
30 June 2017 30 June 2016 31 Dec 2016
% per annum % per annum % per annum
Retail Price Index Inflation 3.60 3.30 3.65
Consumer Price Index Inflation 2.70 2.40 2.75
Rate of discount 2.55 3.25 2.70
Allowance for pension in payment increases of RPI (subject to a maximumincrease of 5% p.a) 3.45 3.20 3.50
Allowance for revaluation of deferred pensions of CPI (subject to a maximumincrease of 5% p.a) 2.70 2.40 2.75
Alliance Trust PLC | Interim Report 2017
20
Notes to the financial statements
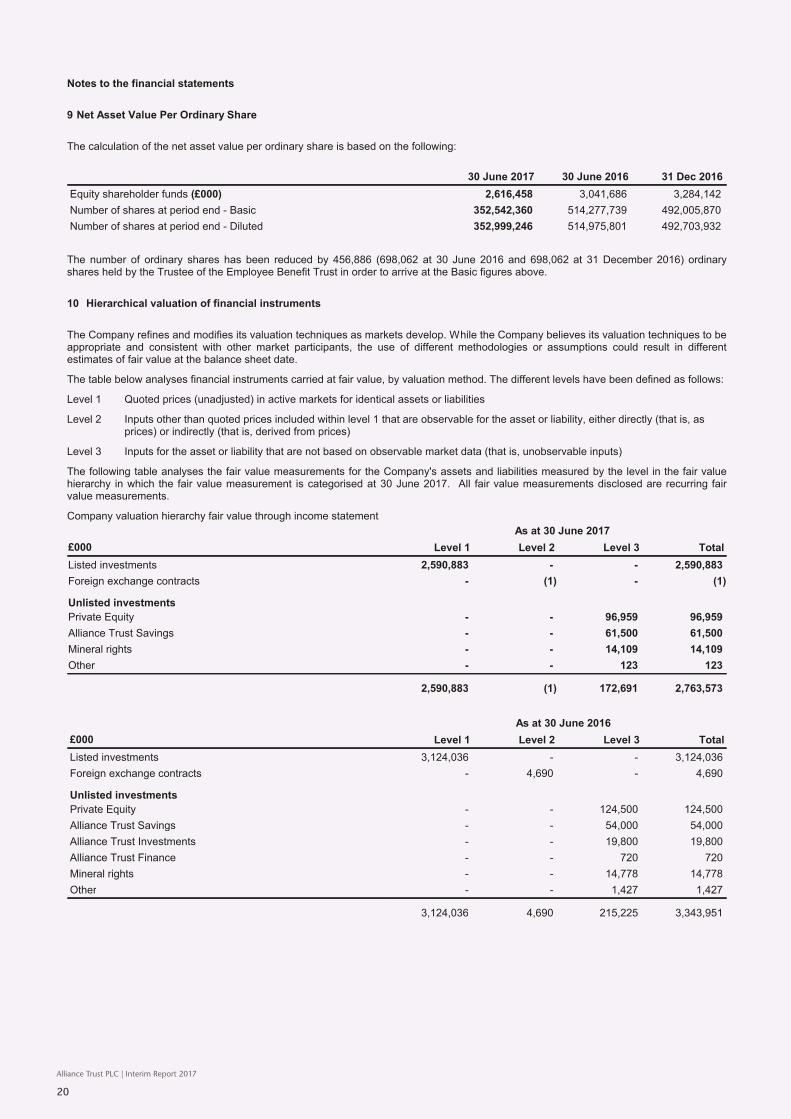
9 Net Asset Value Per Ordinary Share
The calculation of the net asset value per ordinary share is based on the following:
30 June 2017 30 June 2016 31 Dec 2016
Equity shareholder funds (£000) 2,616,458 3,041,686 3,284,142
Number of shares at period end - Basic 352,542,360 514,277,739 492,005,870
Number of shares at period end - Diluted 352,999,246 514,975,801 492,703,932
The number of ordinary shares has been reduced by 456,886 (698,062 at 30 June 2016 and 698,062 at 31 December 2016) ordinaryshares held by the Trustee of the Employee Benefit Trust in order to arrive at the Basic figures above.
10 Hierarchical valuation of financial instruments
The Company refines and modifies its valuation techniques as markets develop. While the Company believes its valuation techniques to beappropriate and consistent with other market participants, the use of different methodologies or assumptions could result in differentestimates of fair value at the balance sheet date.
The table below analyses financial instruments carried at fair value, by valuation method. The different levels have been defined as follows:
Level 1 Quoted prices (unadjusted) in active markets for identical assets or liabilities
Level 2 Inputs other than quoted prices included within level 1 that are observable for the asset or liability, either directly (that is, as prices) or indirectly (that is, derived from prices)
Level 3 Inputs for the asset or liability that are not based on observable market data (that is, unobservable inputs)
The following table analyses the fair value measurements for the Company's assets and liabilities measured by the level in the fair valuehierarchy in which the fair value measurement is categorised at 30 June 2017. All fair value measurements disclosed are recurring fairvalue measurements.
Company valuation hierarchy fair value through income statement
As at 30 June 2017
£000 Level 1 Level 2 Level 3 Total
Listed investments 2,590,883 - - 2,590,883
Foreign exchange contracts - (1) - (1)
Unlisted investments
Private Equity - - 96,959 96,959
Alliance Trust Savings - - 61,500 61,500
Mineral rights - - 14,109 14,109
Other - - 123 123
2,590,883 (1) 172,691 2,763,573
As at 30 June 2016
£000 Level 1 Level 2 Level 3 Total
Listed investments 3,124,036 - - 3,124,036
Foreign exchange contracts - 4,690 - 4,690
Unlisted investments
Private Equity - - 124,500 124,500
Alliance Trust Savings - - 54,000 54,000
Alliance Trust Investments - - 19,800 19,800
Alliance Trust Finance - - 720 720
Mineral rights - - 14,778 14,778
Other - - 1,427 1,427
3,124,036 4,690 215,225 3,343,951

Alliance Trust PLC | Interim Report 2017
21
Notes to the financial statements
10 Hierarchical valuation of financial instruments
As at 31 Dec 2016
£000 Level 1 Level 2 Level 3 Total
Listed investments 3,250,069 - - 3,250,069
Foreign exchange contracts - 6,853 - 6,853
Unlisted investments
Private Equity - - 113,007 113,007
Alliance Trust Savings - - 61,500 61,500
Alliance Trust Investments - - 28,276 28,276
Mineral rights - - 13,187 13,187
Other - - 1,305 1,305
3,250,069 6,853 217,275 3,474,197
There have been no transfers during the year between Levels 1, 2 and 3.
Fair Value Assets in Level 1
The quoted market price used for financial investments held by the Company is the current bid price. These investments are includedwithin Level 1 and comprise of equities and derivatives.
Fair Value Assets in Level 2
The fair value of financial instruments that are not traded in an active market (for example, over-the-counter derivatives) is determinedusing valuation techniques. These valuation techniques maximise the use of observable market data where it is available and with minimalreliance on entity specific estimates.
Fair Value Assets in Level 3
From 1 April 2017 Level 3 assets, excluding the valuation of Alliance Trust Savings (ATS), are reviewed at least annually by the ValuationCommittee of Willis Towers Watson (WTW) who are assigned responsibility for valuation by the Board of the Company. Prior to this date,valuation responsibility was assigned to the Valuation Committee of Alliance Trust Investments. The valuation of Alliance Trust Savings isreviewed at least annually by the Audit and Risk Committee with valuations recommended to the Board of the Company. The WTWValuation Committee considers the appropriateness of the valuation models and inputs, using the various valuation methods in accordancewith the Company's valuation policy. The WTW Valuation Committee will determine and advise the Board of the Company on theappropriateness of any valuation of the underlying assets.
The following table shows the reconciliation from the beginning balances to the ending balances for fair value measurement in Level 3 ofthe fair value hierarchy.
£000 June 17 June 16 Dec 16
Balance at 1 January 217,275 220,790 220,790
Net gain/(loss) from financial instruments at fair value through profit or loss 9,390 (17,304) 1,551
Purchases at cost 1,823 17,817 18,629
Sales proceeds (49,948) (9,187) (37,308)
Realised (gain)/loss on sale (5,849) 3,109 13,613
Balance at 30 June / 31 December 172,691 215,225 217,275
Investments in subsidiary companies (Level 3) are valued in the Company’s accounts at £124.9m (£168.0m at 30 June 2016 and £169.8mat 31 December 2016) being the Directors' estimate of their fair value, using the guidelines and methodologies on valuation published bythe International Private Equity and Venture Capital Association issued in December 2015 and where applicable external valuations. Thisincludes a valuation of ATS at £61.5m (£54.0m at 30 June 2016 and £61.5m at 31 December 2016). This represents the Directors' view ofthe amount for which the subsidiary could be exchanged between knowledgeable willing parties in an arm's length transaction. This doesnot assume that the Company currently has any intention to sell the subsidiary in the future. The Directors have used several valuationmethodologies as described in the guidelines to arrive at their best estimate of fair value, including discounted cash flow calculations,revenue and earnings multiples and recent market transactions where available. Alliance Trust Investments Limited (ATI), reported with afair value of £28.3m as at 31 December 2016, was sold to Liontrust Asset Management PLC in April 2017 for consideration consisting ofLiontrust ordinary shares, cash and contingent deferred consideration.
The Directors assessed the fair value of ATS. No change has been made to the fair valuation of ATS as at 30 June 2017. As part of theongoing review of fair value, the Directors will assess the fair value of ATS prior to the year end.
The fair value of ATI as at 31 December 2016 was based on the value of the sale transaction to Liontrust Asset Management PLC. Thisvaluation was based on the fair value of Liontrust shares used as consideration and the net asset value of ATI excluding any deferredcontingent amounts. This transaction was concluded on 1 April 2017.

Alliance Trust PLC | Interim Report 2017
22
Notes to the financial statements
10 Hierarchical valuation of financial instruments
Mineral rights are carried at fair value and are valued in the Company’s accounts at £14.1m (£14.8m at 30 June 2016, £13.2m at 31December 2016) being the Directors' estimate of their fair value, using the guidelines and methodologies on valuation published by theOklahoma Tax Commission and for non-producing properties, the Lierle US Price Report.
The table below details how an increase or decrease in the input variables would impact the valuation disclosed for the relevant Level 3assets.
£000
Investment
Fair Value
at June 17 Valuation Method Unobservable inputs Input
Input
sensitivity+/-
Change in
valuation +/-
Alliance Trust Savings 61,500 Average of discounted cash flow DCF Discount rate 12.5% 0.5 3,800/(3,500)
Mineral rights 14,109 Oklahoma Tax Commission Revenue multiple - gas 7 1 1,300/(1,300)
multiples and Lierle US Price Revenue multiple - oil 4 1 700/(700)
report (for non producing Revenue multiple 4 1 600/(600)
properties) - products/condensate
Average bonus 1 0.5 1,600/(1,600)
multiple non producing
The change in valuation disclosed in the above table shows the direction an increase or decrease in the respective input variables wouldhave on the valuation result. For ATS the Board has taken advice from an external valuer to apply a degree of independence and externalchallenge into the valuation. For mineral rights, an increase in the revenue multiple and average bonus multiple would lead to an increasein the estimated value.
Private equity investments, both fund-of-fund and direct, included under Level 3, are valued in accordance with the International PrivateEquity and Venture Capital Valuation Guidelines issued in December 2015. Unlisted investments in private equity are stated at thevaluation as determined by the WTW Valuation Committee based on information provided by the General Partner. The General Partner’spolicy in valuing unlisted investments is to carry them at fair value. The General Partner will generally rely on the fund's investmentmanager’s fair value at the last reported period, rolled forward for any cashflows. However, if the General Partner does not feel themanager is reflecting a fair value they will select a valuation methodology that is most appropriate for the particular investments in that fundand generate a fair value. In those circumstances the General Partner believes the most appropriate methodologies to use to value theunderlying investments in the portfolio are: price of a recent investment, multiples, net assets, and industry valuation benchmarks. An entityis not required to create quantitative information to comply with this disclosure requirement if quantitative unobservable inputs are notdeveloped by the entity when measuring fair value (for example, when an entity uses prices from prior transactions or third-party pricinginformation without adjustment). WTW receives information from the General Partner on the underlying investments which is subsequentlyreviewed by the WTW Valuation Committee. Where the WTW Valuation Committee does not feel that the valuation is appropriate, arecommendation of the appropriate fair value will be made to the Board of the Company.
No interrelationships between unobservable inputs used in the above valuations of Level 3 investments have been identified.
11 Financial Commitments
As at 30 June 2017 the Company had financial commitments, which have not been accrued, totaling £26.0m (£26.0m at 30 June 2016 and£28.5m at 31 December 2016). These amounts were in respect of uncalled subscriptions in investments in our private equity portfoliostructured as limited partnerships ('LP'). This is the maximum amount that the Company may be required to invest. These LPcommitments, which can include recallable distributions received, may be called at any time up to an agreed contractual date. TheCompany may choose not to fulfil individual commitments but may suffer a penalty should it do so, the terms of which vary betweeninvestments.
The Company has provided letters of comfort in connection with banking facilities made available to certain of its subsidiaries. TheCompany provided letters to AT2006 and ATREP GP confirming ongoing support for at least 12 months from the date the annual financialstatements were signed, to make sufficient funds available if needed to enable them to continue trading, meet commitments and not toseek repayment of any amounts outstanding.
The Company provides ongoing regulatory support for ATS in the context of its role as a consolidated bank holding company whenrequired.
12 Share Based Payments
The Company operates three share based payment schemes. Full details of these schemes (Long Term Incentive Plan (LTIP), DeferredBonus and All Employee Share Ownership Plan (AESOP)) are disclosed in the December 2016 Annual Report and financial statementsand the basis of measuring fair value is consistent with that disclosed therein.

Alliance Trust PLC | Interim Report 2017
23
Notes to the financial statements
12 Share Based PaymentsLong Term Incentive Plan ('LTIP')
Details of the LTIP awards are disclosed in the 2016 Annual Report.
The Company continues to operate the 2015 LTIP.
In the period ended 30 June 2017 no new awards were made and no Company shares were purchased (nil at 30 June 2016 and 31December 2016). There was no charge to the Company income statement during the period in respect of LTIP awards (£213,000 at 30June 2016 and £1,000 at 31 December 2016).
13 Bank loans and unsecured fixed rate loan notes
£000
As at
30 June 2017
As at
30 June 2016
As at
31 Dec 2016
Bank loans repayable within one year 131,000 200,000 120,000
Analysis of borrowings by currency:
Bank loans - Sterling 131,000 200,000 120,000
The weighted average % interest rates payable:
Bank loans 0.97% 1.24% 0.96%
The Directors' estimate of the fair value of the borrowings:
Bank loans 131,000 200,000 120,000
Unsecured fixed rate loan notes 120,800 121,670 118,800
The effective interest rates payable:
Unsecured fixed rate loan notes 2.29% 2.33% 2.52%
£100m of unsecured fixed rate loan notes were drawn down in July 2014, over 15 years at 4.28%.The basis of the fair value estimate isdisclosed in the Annual Report.
The total weighted average % interest rates payable: 2.40% 2.25% 2.47%
14 Share Capital
£000
As at
30 June 2017
As at
30 June 2016
As at
31 Dec 2016
Allotted, called up and fully paid:
352,999,246 (514,975,801 at 30 June 2016 and 492,703,932 at 31 December2016) ordinary shares of 2.5p each 8,826 12,875 12,319
Share Buybacks
£000
As at
30 June 2017
As at
30 June 2016
As at
31 Dec 2016
Ordinary shares of 2.5p each
Opening share capital 12,319 13,160 13,160
Share buybacks (3,493) (285) (841)
Closing share capital 8,826 12,875 12,319

Useful Information
Share investmentAlliance Trust PLC invests primarily in equities and aims to generate capital growth and a progressively rising dividend from its portfolio of investments.
Alliance Trust currently conducts its affairs so that its shares can be recommended by IFAs to ordinary retail investors in accordance with the FCA’s rules in relation to non-mainstream investment products and intends to continue to do so for the foreseeable future. The shares are excluded from the FCA’s restrictions which apply to non-mainstream investment products because they are shares in an investment trust.
The shares in Alliance Trust may also be suitable for institutional investors who seek a combination of capital and income return. Private investors should consider consulting an independent financial adviser who specialises in advising on the acquisition of shares and other securities before acquiring shares.
Potential investors are reminded that the value of investments and the income from them may go down as well as up and you may not receive back the full amount originally invested.
Investors should be capable of evaluating the risks and merits of such an investment and should have sufficient resources to bear any loss that may result.
How to investOne of the most convenient ways to invest in Alliance Trust is through one of the savings plans run by Alliance Trust Savings Limited who can be contacted online at: www.alliancetrustsavings.co.uk/apply/ or by calling Alliance Trust Savings on 01382 573737. Annual account charges and certain transaction costs will apply according to the type of plan.
Our shares can also be purchased through most online share dealing platforms that offer investment trusts or through your bank or stockbroker.
Shareholder forumsWe plan to hold more shareholder forums in the future, providing our shareholders with the opportunity to meet Alliance Trust’s equity managers. You can hear from them directly about their investment approach and how they create their portfolios of best ideas. We will publish details of future forums on our website as soon as dates are confirmed. Previous investor presentations can also be found on our website (www.alliancetrust.co.uk).
RegistrarsOur Registrars are:
Computershare Investor Services PLC, PO Box 82, The Pavilions, Bridgwater Road, Bristol BS99 7NH.
Telephone: 0370 889 3187
Change of address notifications and registration enquiries for shareholdings registered in your own name should be sent to the Company’s registrars at the above address. You should also contact the registrars if you would like the dividends on shares registered in your own name to be sent to your bank or building society account. You may check your holdings and view other information about Alliance Trust shares registered in your own name at www.computershare.com.
Contact UsIf you have any questions about the Company, please contact us: By phone: 01382 321010
By email: [email protected] By post: 8 West Marketgait, Dundee DD1 1QN
ContactAlliance Trust PLC8 West MarketgaitDundeeDD1 1QNTel +44 (0)1382 321010Email [email protected]