investing for generations - alliance trust · investing for generations. ... portfolios having only...
TRANSCRIPT

Alliance Trust PLCAnnual Report for the year ended 31 December 2016
Investing for Generations

*as rated by Willis Towers Watson (WTW)
Section I
Strategic Report 1The Year in Review 12016 Strategic Review 2Our New Business Model 5Investment Objective and Policy 5Chairman’s Statement 6Board Strategy Q&A 8Key Performance Indicators 10Investment Manager’s Report 11Non-core Investments 15Contribution Analysis 15Alliance Trust Investments 16Alliance Trust Savings 17Portfolio Listing 18Costs and Financial Measures 20Risk Management 22Corporate Responsibility 25
Section II
Directors’ Report 26Board of Directors 26Corporate Governance 28Board Evaluation 30Management Engagement Committee 31Nomination Committee 32Audit and Risk Committee 33Going Concern Statement 37Viability Statement 37Remuneration Committee 38Other Governance 45
Section III
Financial Statements 48Independent Auditors’ Report 48Consolidated income statement 54Consolidated statement of comprehensive income 54Company income statement 55Company statement of comprehensive income 55Statement of changes in equity 56Balance sheet 57Cash flow statement 58Notes 59
Information for shareholders 91 10 year record 93
www.alliancetrust.co.uk
Alliance Trust has been investing for generations since 1888. It provided access to scarce and compelling investment opportunities then and continues to build on this heritage today.
Following a Strategic Review, the Directors concluded that the optimum way to deliver an unchanged objective – generating a real return through capital and dividend growth – is to invest with a selection of the world’s best-in-class* global equity managers. Each of these managers will build a portfolio of only their best stock selections – the ‘best of the best’. The Board believes this approach is in the best interests of shareholders, whether investing for this generation or the next.
Investing for Generations

Alliance Trust PLC | Annual Report and Financial Accounts 2016
1
I Strategic Report IIIII
638.
0
517.
0
478.
9
450.
1
375.
3
2012 2013 2014 2015 2016
667.
5
559.
0
544.
8
516.
5
444.
9
2012* 2013* 2014* 2015* 2016*
0.43
0.59
0.60
0.75
0.67
2012 2013 2014 2015 2016
*with debt at fair valueSource: Factset Source: Factset Source: Alliance Trust
Strategic developments
The Year in Review
Financial highlights
667.5p638.0p 0.43%Net asset value (pence)*Share price (pence) Ongoing charges ratio (%)
Shareholders voted in favour of the new investment approach at our recent General Meeting. Key elements of this approach, in the process of being implemented, include:
• Alliance Trust to remain a global equity investment trust offering returns through capital and income growth over the medium to long term
• Target for our equity portfolio to outperform MSCI All Country World Index doubled from 1% to 2% p.a., net of costs, over rolling three-year periods
• Seeking outperformance at a competitive cost, below 0.65%• A new approach adopted for our investment management to increase the likelihood of
delivering consistently the enhanced performance target• Aim to build on Alliance Trust’s 50-year track record of year-on-year ordinary dividend growth• Move from a single manager to multiple equity managers, each rated ‘best-in-class’ by WTW• All of the managers to focus on high conviction stock selection with almost all of their
portfolios having only 20 stocks• An active programme of share buybacks introduced with the aim of achieving a significantly
narrower discount
Read about the Strategic Review in full on page 2
+23% +19%

Alliance Trust PLC | Annual Report and Financial Accounts 2016
2
Strategic Report
2016 Strategic Review
Since May 2016, the Board has engaged with shareholders and evaluated carefully a broad range of options, with an open mind on how best we could improve the Trust’s performance. We are confident that the approach resulting from this Review will improve Alliance Trust’s performance on a consistent basis.
Existing objectives
Investing for this generation and the next
Policy of progressive dividends
Commitment to narrow the discount
Providing good value
Simplifying our structure
Clear investment mandate to improve performance

Alliance Trust PLC | Annual Report and Financial Accounts 2016
3
I Strategic Report IIIII
Developments resulting from the Review
A new approach to investment management to be adopted to increase the likelihood of delivering consistently the performance target:
• Move from a single manager to multiple equity managers, each rated ‘best-in-class’ by WTW
• Each equity manager to create a focused portfolio of their top investment selections (more detail of this approach can be found on the next page)
• Equity portfolio outperformance target doubled to 2% p.a. net of costs over rolling three-year periods
• The Board reaffirms its commitment to its progressive dividend policy
• Aiming to build on Alliance Trust’s 50-year track record of year-on-year ordinary dividend growth
• An active programme of share buybacks has been introduced with the aim of achieving a significantly narrower discount reflecting the Board’s determination to narrow materially the discount
• Since announcing this programme the discount has reduced to below 5% and has been around this level since the end of 2016
• Increased value: the previous equity portfolio’s outperformance target above the MSCI All Country World Index (‘ACWI’) was 1% net of 0.45% ongoing costs increased to 2% outperformance with ongoing costs below 0.65% over rolling three-year periods
• The Board is setting a target of total annual costs of under 0.65% which is below the median for the investment trusts in the AIC global sector
• Alliance Trust Investments to be sold to Liontrust Asset Management PLC representing an expected gain of over £5m from its valuation at 30 June 2016
• Alliance Trust Savings continues to make good progress and remains part of the Group; it has reported a profit in 2016 and is well placed to develop further

Alliance Trust PLC | Annual Report and Financial Accounts 2016
4
Strategic Report
The Investment Manager
The Equity Managers
2016 Strategic Review continued
Blackcreek Investment ManagementBill Kanko is founder and President. Between 1999 and 2004 Bill was the lead manager for the AIM Trimark Fund and Trimark Select Growth Fund which had outstanding performance during that time.
Bill is a long-term investor, looking for companies that are growing, are leaders in their markets and gaining market share. These companies tend to benefit from huge barriers to entry and sustainable competitive advantages.
First Pacific AdvisersPierre Py and Greg Herr are co-portfolio managers with an average of 20 years investing experience.
Pierre and Greg typically employ a long-term value investment approach, investing in companies that they believe have sustainable business models, exhibit financial strength, are run by operationally strong managers and whose stocks trade at a significant discount to the FPA team’s estimate of intrinsic value.
GQG PartnersRajiv Jain founded GQG Partners in June 2016, having previously worked at Vontobel Asset Management for 22 years as lead portfolio manager, Head of Equities, CIO and Co-CEO, responsible for over £30bn of assets.
Rajiv looks for high-quality and sustainable businesses through a fundamental investment process utilising both traditional and non-traditional sources of information. Ideally, these quality businesses have enduring underlying strengths, which manifest in a variety of economic environments. The result has been portfolios designed to provide capital protection in down markets and attractive returns to long-term investors over a full market cycle. In addition, GQG will manage a global portfolio for the Company with particular focus on emerging market companies.
Jupiter Asset ManagementBen Whitmore has over 20 years of experience and joined Jupiter in 2006. Ben worked at Schroders, managing both retail and institutional portfolios and around £2 billion of assets. Ben will be supported by Dermot Murphy, Assistant Fund Manager.
Ben is well known as a long-standing practitioner of contrarian value investing, investing in companies he considers to be out-of-favour and under-valued. This approach has proved successful, with the Jupiter UK Special Situations Fund being top quartile in its sector over one, three, five and ten years.
Lyrical Asset ManagementLyrical Asset Management’s investment management team is led by Co-Founder and Chief Investment Officer, Andrew Wellington.
Value matters most to Lyrical and the team also maintains a strict discipline of investing in quality companies that they believe are relatively easy to analyse. They believe the combination of value, quality and straightforward business model creates resiliency in the portfolio and the greatest likelihood of long-term absolute performance and outperformance.
River and Mercantile Asset ManagementHugh Sergeant is the CIO of Equities having previously been in a similar role at Societe Generale Asset Management (‘SGAM’) and prior to that at UBS/Phillips & Drew and Gartmore.
The team invests in Recovery Equities, through an investment philosophy called PVT (Potential, Valuation & Timing) and a process that helps them identify value at different stages of a company’s lifecycle and to give signals from a timing perspective as to when that value might be unlocked.
Sustainable Growth AdvisersSGA was founded in 2003 by George Fraise, Gordon Marchand and Rob Rohn. They average over 30 years of investment experience.
SGA focuses on building concentrated portfolios of unique, high quality global growth businesses that possess strong pricing power, offer recurring revenue generation and benefit from attractive, long runways of growth.
Veritas Asset ManagementAndy Headley is Head of Global strategies at Veritas Asset Management. Andy has over 20 years investment experience and is supported by Charles Richardson, co-portfolio manager who has 30 years’ experience.
Veritas focuses on active equity management, utilising its proprietary Real Return Approach since inception of the firm. Veritas employs an absolute mind-set when valuing companies and dispenses with any reference to indices when constructing the portfolio. Veritas describes the firm’s overall approach as investing in a concentrated portfolio of good quality companies at the right price.
Willis Towers WatsonWillis Towers Watson is a leading investment group that is focused on creating financial value for investors through its expertise in risk assessment, strategic asset allocation, manager evaluation and investment management. It has over 900 investment associates worldwide, assets under advisory of around US$2.3 trillion and over US$87 billion of assets under management. It is part of Willis Towers Watson (NASDAQ: WLTW) which has over 39,000 employees in more than 120 territories and has roots dating to 1828.
They have worked, for many years, with equity managers to create tailored high-conviction portfolios for large institutional clients, with notable success over more than ten years for a large charitable foundation. More recently it launched an open-ended, high-conviction multi-manager vehicle for institutional investors, the Global Equity Focus Fund, which has outperformed its benchmark by 2.2% per annum net of underlying managers’ fees since the fund’s inception on 17 August 2015 to 28 February 2017.

Alliance Trust PLC | Annual Report and Financial Accounts 2016
5
I Strategic Report IIIII
Invest in:
• Global equities
We have investments in:• Our subsidiary business – Alliance Trust Savings• Non-core investments*
– Mineral Rights – Private Equity – Funds
*These will be disposed of at the appropriate time
How we will do it• A multiple manager approach, each rated best-in-class by WTW with oversight by them• Each equity manager creates its own focused portfolio of its top investment selections• Equity portfolio outperformance target of the MSCI All Country World Index by 2% p.a. net of costs over rolling three-year periods• One of only four FTSE All-Share Index companies with a record of increasing their ordinary dividend for the last 50 years.
How we create an attractive return for our shareholders• Capital growth in our investment portfolio
• Progressive income growth funded by dividends and income received from our investments
• Competitive costs
Global equities Subsidiary entities Non-core investments
Focused on equities
What we will do
Our New Business Model
Investment Objective and Policy
Alliance Trust is an investment company with investment trust status. The Company’s objective is to be a core investment for investors seeking increasing value over the long term. The Company has no fixed asset allocation benchmark and it invests in a wide range of asset classes throughout the world to achieve its objective. The Company’s focus is to generate a real return for shareholders over the medium to long term by a combination of capital growth and a rising dividend.
The Company pursues its objective by investing in both quoted and unquoted equities across the globe in different sectors and industries; investing internationally in fixed income securities; investing in other asset classes and financial instruments, either directly or through investment vehicles and investing in subsidiaries and associated businesses which allow us to expand into other related activities.
The Company is prepared to invest any proportion of the total corporate capital in any of the above asset classes, subject only to the restrictions imposed on the Company by the regulatory or fiscal regime within which we operate. However, the Company would expect equities to comprise at least 50% of its portfolio. Changes to the asset allocation will be dependent upon attractive investment opportunities being available.
Where market conditions permit, the Company will use gearing of not more than 30% of its net assets at any given time. The Company can use derivative instruments to hedge, enhance and protect positions, including currency exposures.
The existing Investment Objective and Policy allows the Board to pursue the new investment approach.

Alliance Trust PLC | Annual Report and Financial Accounts 2016
6
Strategic Report
During 2016 the Board spent a great deal of time consulting with shareholders on the future of Alliance Trust and what investors really wanted from their investment in the Trust. We evaluated a broad range of options to decide on the best way to improve the Trust’s performance and to position the Trust as a core holding for investors.
As I have commented before, it was clear that the appetite for a global equity investment trust remained strong, but that change was required to better differentiate Alliance Trust’s investment proposition and to improve performance.
Looking ahead, the Board and the new investment manager will now focus on delivering real returns for shareholders through a combination of capital growth and a rising dividend.
Strategic ReviewWith the aim of building on the progress achieved following last year’s AGM, the Board announced in May 2016 that it would conduct a Strategic Review of the Trust. As part of this, we assessed the potential courses of further action open to the Trust and the best way forward. On 15 December 2016, the Board announced the outcome of its review and set out a proposed new approach to managing the Trust’s equity portfolio.
This will see the adoption of a high conviction, multi-manager approach overseen by Willis Towers Watson (WTW), a leading investment group, targeting outperformance of the MSCI All Country World Index by 2% per annum, net of costs, over rolling three-year periods. WTW will be the overall investment manager of the Trust’s equity portfolio, providing access to and selecting and managing the sub-managers who in turn will create concentrated portfolios for the Trust. By leveraging the scale of Alliance Trust and WTW, total annual costs will also be targeted to be below 0.65%. This is highly competitive for an investment trust targeting such outperformance.
The aim of the new approach is to:
• deliver consistently the outperformance target, which has been doubled;
• maintain our long track record of growing dividends; and
• maintain the Trust’s competitive cost ratio.
Whilst it was not required, the Board wanted to provide shareholders with the opportunity to vote on the new approach to investment. We were delighted with the strong support at the General Meeting in February 2017 when over 96% of the votes cast by shareholders favoured the change. The transition to the new portfolio is well underway and I look forward to telling you more about this at our AGM in April, when WTW will also make a presentation.
Chairman’s Statement
We care about the long-term interests of all of our shareholders

Alliance Trust PLC | Annual Report and Financial Accounts 2016
7
I Strategic Report IIIII
During 2016 Alliance Trust Investments (ATI) made good progress. An independent Board was established, third-party funds under management increased, costs were reduced and the business recorded a profit for the year. As part of the Strategic Review, the Board reached agreement to sell ATI to Liontrust Asset Management PLC, a specialist independent fund management group. This transaction is expected to complete in April. As a result, Alliance Trust’s structure will be simplified and ATI will be provided with an exciting opportunity to continue to develop its third party fund management business.
Alliance Trust Savings also made significant progress during the last year and remains part of the Group, headquartered in Dundee. Assets under administration have grown by 60%, reflecting the benefit of the Stocktrade acquisition. In the year ended December 2016 ATS achieved a profit before tax of £1.2m, compared to a loss of £5.2m in the prior year.
When we announced the outcome of the Strategic Review, we introduced a more active approach to share buybacks, reflecting our determination to narrow the Trust’s discount to Net Asset Value (NAV). This has helped to narrow the discount to 4.4% as at the end of December 2016. We also announced in January 2017 that the Board had reached agreement with Elliott, the Company’s largest shareholder, to repurchase the shares in which it had a disclosable interest (approximately 20% of the issued share capital as at December 2016). Given the size of its shareholding Elliott was unable to participate in the share buyback programme without obtaining the approval of other, independent shareholders. This approval was granted at the General Meeting in February and the repurchase of Elliott’s shares has now been completed. The impact of this repurchase has been an uplift in the NAV for other shareholders of around 1%, as well as the removal of a share overhang, allowing the Trust to move forward with a more stable shareholder register.
Performance in 2016Over 2016 the Trust delivered a Total Shareholder Return of 26.4% and a NAV Total Return of 21.5%. The Trust’s share price rose 23% to 638p, while the NAV increased 19% to 667.5p, resulting in a discount at the year-end of 4.4%. The Equity portfolio underperformed the benchmark, which returned 29.4%, primarily through stock selection. The Board is delighted that the Trust has achieved 50 years of consecutive dividend growth, with a total declared dividend for the year of 12.774p per ordinary share.
As regards our objective to reduce costs, we fulfilled our commitment to reduce the OCR, which stood at 0.43% at the end of the year, below our target of 0.45%. This reflects the level of cost we expected under the old investment management approach. Going forward we will see this increasing to just under 0.65% which we believe provides excellent value for the targeted level of outperformance.
Significant Event During the year the Board received an unsolicited approach from RIT Capital Partners plc (RIT) with an informal proposal for a merger of the two companies. No detailed terms were provided by RIT with regard to the proposal. The Board of Alliance Trust announced that it would incorporate any formal merger proposal received from RIT into its Strategic Review, alongside the other options being considered. RIT subsequently withdrew their interest.
Board ChangesSince my appointment as Chairman last year there have been three changes to the Board. Following the conclusion of the AGM held in 2016, John Hylands retired as a Director of the Company. I would like to thank John for his contribution and consistent support to the Company over nine years.
In May, we welcomed Clare Dobie to the Board. Clare, who has had a successful career in marketing and client service in asset management companies, has made an excellent contribution to our Strategic Review.
Finally, and very sadly, Rory Macnamara passed away on 17 December 2016 after a period of illness. Rory, who joined the Board in June 2015, played a significant role during the Strategic Review.
The last two years have seen considerable change for Alliance Trust and we are very appreciative of the high level of support shareholders have shown. I am also extremely grateful for the commitment and diligence with which all of my fellow Directors have set about the task to establish a compelling and refreshed strategy for the Trust. With a clear course of direction and a settled shareholder register, we believe that Alliance Trust is well placed for the future.
Lord Smith of KelvinChairman

Alliance Trust PLC | Annual Report and Financial Accounts 2016
8
Strategic Report
Board Strategy Q&A
We met with hundreds of our shareholders to explain, and answer questions on, the changes we are making. Here are some of the questions that were asked and answered during these meetings.
Q Who are Willis Towers Watson?
A WTW is a leading investment group. The investment business at Willis Towers Watson has global assets under advice of more
than US$2.3 trillion and assets under management of more than US$87bn. Willis Towers Watson’s clients include some of the largest and most sophisticated investors in the world including pension funds, sovereign wealth funds, endowments and foundations.
Q How did you choose WTW as your investment manager?
A The Board ran a competitive process and WTW was selected to become the investment manager, as announced on 15th
December 2016.
Q What experience do Willis Towers Watson have of managing multi‐manager equity portfolios?
A For more than 20 years WTW has provided advice on the management of equity portfolios to large sophisticated
investors and has had a key role to play in managing multi‐manager portfolios for more than a decade.
Q How will the Trust’s portfolio be designed?
A It is anticipated that the Trust’s portfolio will have approximately 200 stocks held across the eight underlying equity managers.
The Company’s equity portfolio will be shared broadly equally between the eight equity managers. WTW believes that the combination of these managers’ best stock ideas will create a highly compelling equity portfolio for the Trust, where the long-term return relative to benchmark will be primarily driven by stock selection rather than macroeconomic factors.
Q What is the benefit of this approach?
A The underlying investment managers are chosen for their skill as stock pickers. Through asking each manager to focus on their
highest conviction ideas, we gain exposure to only the best ideas from each manager. This is achieved without increasing overall risk through the diversification of using multiple managers with different approaches to investing that are expected to perform differently in various market environments.
Q By moving to a multi‐ manager approach are you not moving the portfolio closer to the index and hence reducing the expected outperformance?
A Although the number of stocks in the overall portfolio increases from around 60 to around 200 (and hence the stock specific risk
reduces), every single stock is now one of the managers’ very best ideas, which is not possible in a single manager approach, where a number of stocks are inevitably held for risk control purposes.
Q What would cause you to review a manager?
A The most likely reason to replace a manager is if the research or portfolio management team feels that the skill of the manager
has eroded over time. This could be in an absolute sense or relative to other managers that would be suitable for inclusion in the portfolio. It is unlikely that poor performance, on its own, would be a reason for removing a manager except if that poor performance was caused by reduced skill from the manager. Poor performance (relative to a benchmark) that is attributable to style, size or sector weightings that were known features of the investment approach would not necessarily change our view of the manager’s skill.
The other reason a manager could be replaced is an inability to meet the terms of the mandate such as maintaining a very high level of active share and the restricted number of stocks. It is possible that we will be able to identify managers who combine better with the other managers in the portfolio than one initially chosen and therefore the portfolio management team may make changes for this reason.

Alliance Trust PLC | Annual Report and Financial Accounts 2016
9
I Strategic Report IIIII
Q Can you describe how the multi‐manager portfolio will be built:
A The portfolio can be thought of as being the result of two complementary components. The assets are all managed
by a group of focused active equity managers with varying styles. In addition there is risk control, oversight, manager selection, operational due diligence and monitoring performed by WTW.
The first component is a group of highly active (active share typically 90%+) concentrated, ‘best‐in‐class’, active equity managers. Each underlying portfolio usually has a named lead portfolio manager overseeing a portfolio of around 20 of their best equity ideas.
The second component is used to balance the risks within the active managers’ portfolios. It is the role of WTW to source appropriate managers from around the world, look at their risk and return characteristics and how they can be combined to minimise risks that can be diversified away whilst maximising the impact of the stock selection skills of the managers.
Q Why use concentrated mandates?
A There is significant evidence supporting better returns from concentrated mandates over more diversified portfolios.
Research supports the view that over 90% of risk associated with individual stocks is diversified away within the first 20‐30 holdings and there is little incremental benefit beyond this.
Q Will the managers have track records and does the strategy?
A All the portfolio managers selected for the Trust have long, successful track records at either their existing or previous asset
management firms. The managers’ track records and the quality of their investment approach is examined as part of the rating process conducted by WTW. The vast majority of the managers have also managed concentrated mandates similar to those intended for Alliance Trust, in many cases only for WTW clients.
Q How many stocks will be in the portfolio?
A Up to 200 stocks will be contained in the portfolio. The developed market managers typically have around 20 holdings each and
one manager also manages a dedicated emerging markets mandate which can hold up to 50 stocks.
Q What will be the target level of performance and risk of the Trust?
A The Trust is targeting 2% p.a. outperformance for the equity portfolio over the MSCI World ACWI, net of fees, over three year
rolling periods. The forecast tracking error of the Trust is expected to be 2‐4% (a guide, not a limit).
Q What will be the target yield on the portfolio and the dividend policy?
A The underlying yield on the stocks in the current proposed multi‐manager portfolio is roughly the same as the existing
portfolio. This leaves the strategy well placed to support the existing level of dividend payments and to continue the record of 50 years of consecutive dividend growth into the future.
Q What will be the target total annual costs of the Trust and how does this break down?
A The Trust’s OCR will be targeted to be below 0.65%. The fees payable to WTW are detailed on page 46.
Q Is the Trust intended to invest in developed or emerging markets?
A The Trust is benchmarked against the MSCI ACWI (an index that covers both developed and emerging markets). Each manager is
allowed to invest across both developed and emerging markets within their 20 stock portfolio, but one manager also has a specialist emerging market mandate which may have around 50 stocks.
Q What level of manager turnover is expected?
A A 10‐15% per annum manager turnover could be expected as a long‐term guide.
Q What level of portfolio turnover is expected in the sub‐manager’s underlying portfolios?
A Overall we would expect average turnover to be in the range 20% to 40% per annum.
Q What will be the approach to gearing?
A The approach is unchanged. The Board is ultimately responsible for setting the strategic level of gearing and WTW will then have
an element of discretion around this target.
We would not anticipate the level of gearing changing at all at the time of transition to the new arrangements.

Alliance Trust PLC | Annual Report and Financial Accounts 2016
10
Strategic Report
0.60
0.59
0.43
2014 2015 2016
2.55
1.46
12.8
2014 2015 2016
12.3
8
12.4
3
12.7
7412
.774
10.9
7
9.832014* 2015* 2016*
12.1
7.5
4.45.
6
4.6
4.6
1 Year 3 Year 5 Year
26.4
53.1
111.
1
29.4
49.5
102.
2
1 Year* 3 Year* 5 Year*
21.5
38.3
83.4
29.4
49.5
102.
2
1 Year 3 Year 5 Year
22.9
36.9
88.5
29.4
49.5
102.
2
Key Performance Indicators – 2016
Our Key Performance Indicators measure how well we are achieving our objectives of capital and income growth, investment performance and a narrowing discount.
This demonstrates the real return our shareholders receive through dividends paid and capital growth.
Why this is important
Total Shareholder Return (%)
Why this is important
This demonstrates the growth of our total portfolio including non-core investments. *NAV calculated with debt at fair value.
NAV* Total Return (%)
Read more in the Investment Manager’s Report on page 11
This measures how our equity portfolio investment managers perform. The equity portfolio accounted for 93% of our net asset value at the year end.
The figures shown are the total dividends paid, ordinary and special dividends.
This is the cost of running the Company as a percentage of the average net assets of the Trust. It is an indicator of how efficiently the Company is managed.
Why this is important
Why this is importantWhy this is important
Equity Portfolio Total Return (%)
Total Dividend (pence) year to 31 Dec
Ongoing Charges Ratio (%) as at 31 Dec
Why this is important
This is the difference between the share price of the Company and its net asset value and is an indicator of demand for our shares.
*Discount calculated using debt at fair value.
Discount* (%) as at 31 Dec
Read more in Costs and Financial Measures on page 20
Read more in Costs and Financial Measures on page 20
Read more in the Investment Manager’s Report on page 11
Read more in Costs and Financial Measures on page 20
Read more in the Investment Manager’s Report on page 11
Global sector Weighted Average Alliance Trust
MSCI ACWI Alliance Trust MSCI ACWI Alliance Trust MSCI ACWI Alliance Trust
Ordinary Dividend Special Dividend

Alliance Trust PLC | Annual Report and Financial Accounts 2016
11
I Strategic Report IIIII
Investment Manager’s Report – 2016
SummaryDuring 2016, the Trust’s equity portfolio delivered a Total Return of 22.9%. Taking into account the performance of non-core investments, the impact of buybacks and a one-off contribution to the pension scheme the Trust’s overall NAV Total Return was 21.5%. The Total Shareholder Return, which takes account of discount narrowing, was 26.4%.
The equity portfolio finished the year 6.5% behind the MSCI ACWI. This was driven largely by stock selection although sectoral allocation also contributed to the lag in performance. In the latter half of the year mid- and small-cap value stocks outperformed the larger, quality growth companies that constitute the Trust’s portfolio.
The investment team maintained the number of holdings within the portfolio to around 60, reflecting our continued conviction in the benefits of holding a portfolio of best-in-class global companies.
Review of PerformanceAfter a turbulent start to the year share prices rebounded in February as fears of a Chinese hard landing and a US industrial slow down faded. Despite some significant shocks to financial markets, such as Brexit, markets continued to make progress, driven by increasing signs of self-sustaining global growth and continued monetary laxity.
Over the year our decisions to increase our weightings in Industrials and remain overweight in Technology benefited performance. However, our decisions to improve the quality of holdings in Financials and Energy in 2015 did not continue to provide the uplift in performance achieved that year as lower quality companies rebounded strongly in 2016, outperforming our stock selections. The most important sectoral decision we got wrong in 2016 was to remain overweight in Health Care ahead of the US elections, during which investor concerns over the sustainability of drug pricing increased.
Industrials were the strongest contributor to performance in 2016. We increased our exposure to these stocks, ending the year overweight against the index. The star performers were Daikin and Melrose.
Information Technology was also a positive contributor to performance. The portfolio benefited from the significant Merger and Acquisition activity in the semi-conductor market, notably the sale of ARM which returned 61% and contributed just over 1% to the portfolio’s return. Holdings in Linear Tech and NXP are also subject to takeovers by ADI and Qualcomm respectively. The growth in electric and hybrid electric vehicles has translated to strong growth for the semi-conductor industry in the auto segment, as the car of the future requires significantly more electronic content to deliver improvements in safety and fuel efficiency. We also focus on thematic drivers within the technology sector such as the increase in Cloud computing and the need to invest in digital infrastructure. We believe that these are important drivers of performance and why we hold Accenture, Microsoft and SAP.
The Health Care sector reversed the strong gains of 2015 and was the second-worst performing sector in 2016. The investment process targets companies which deliver differentiated, life-saving therapies and products that makes healthcare more accessible or affordable. We believed that this sector and these sorts of companies would be able to deliver defensive growth in a tough economic environment and therefore maintained an overweight position during the year. In the US, the source of the majority of global healthcare profits, the Election raised questions on the sustainability of drug pricing, and this hurt performance over 2016. Our holding in GlaxoSmithKline did relatively well in the year thanks to its more diversified business, with its Consumer and Vaccine divisions providing opportunities for growth. Roche was out of favour over 2016, due to pricing pressure in the US, combined with investor concern over the results in early 2016 of the important “Aphinity” trial. The trial results are considered key to Roche’s global leadership in breast cancer and the nature of the news led to weakness in the stock. We believe that their approach of meeting unmet medical need across its whole portfolio and its innovative record of discovering new molecules with breakthrough potential, will be rewarded and command improved pricing.
The Financial sector contributed negatively to portfolio performance over the year. A substantial portion of the underperformance came from our position in the Italian bank Intesa Sanpaolo as investor concerns around its non-performing loans in Italy, and political uncertainty, led to large declines in the share prices of Italian financials. We decided to sell the position and switch the proceeds into DNB. Our underperformance came from the absence of investment banks which underwent a strong re-rating from a very low base. Visa, however, performed well and, as one of the portfolio’s largest positions, was a strong contributor to performance. We increased the portfolio’s exposure to Financials during the year.
Energy was again a focus for the market in 2016. After the turbulent markets in 2015 oil rallied from below US$30 a barrel in the first quarter of 2016 to above US$50 when producers reached an agreement to reduce their output. The Energy sector rallied impressively and delivered 54%. The portfolio’s underweight position through 2016 contributed negatively to asset allocation as did stock selection: lower quality companies rallied the most in response to higher oil prices. Our investment process’ focus on quality companies attracts us to companies with higher quality hydrocarbon assets that can deliver better investment returns from lower oil prices. We believe that over the medium term this will be a winning investment strategy for businesses that sell this volatile commodity.
Going into 2017 the portfolio remains overweight in Health Care, Information Technology and underweight in Consumer Discretionary, Consumer Staples and Energy.

Alliance Trust PLC | Annual Report and Financial Accounts 2016
12
Strategic Report
Investment case: Health CarePortfolio ActivityIn 2016 we added the Norwegian bank DNB and Microsoft to our portfolio. We believed that DNB’s valuation was attractive following market concerns related to oil-related economies as it remained one of the best capitalised banks in Europe. Microsoft is embracing the Cloud through Azure, which provides developers and IT professionals with a collection of integrated cloud services through a global network of data centres, and the shift in the sale of its Office software suite to a subscription model.
Significant sales in 2016 included Novo Nordisk and ARM. The former continues to benefit from innovations in insulin design but the weaker outlook for insulin sales, due to concerns about the sustainability of its US pricing model, resulted in lower profit expectations. ARM was sold following a bid by Softbank, a Japanese telecom and technology company. The proceeds from these sales were invested in the US company Cadence which develops electronic design automation software. We continued to use market weakness to add to positions where the team have strong long-term convictions such as Acuity Brands and Roche.
Our Top 10 holdings at the end of the year included for the first time Acuity Brands, Ecolab, Blackstone Group, Macquarie Infrastructure and the Toronto & Dominion group. Acuity is the US lighting market leader with a diversified product mix. It has steadily gained market share in an already relatively consolidated industry. It offers a full array of technologies, including LED, which suit the needs of its customers. Ecolab is a global leader in water, hygiene and energy technologies which are used across different industries to maintain clean and safe environments. Blackstone is possibly the best positioned ‘alternative’ asset manager globally and should benefit from the shift to that style of management.
Immuno-oncology is an innovation that is set to revolutionise cancer treatment. The ability to utilise the body’s immune system to fight a cancer tumour, rather than directly targeting the tumour itself, has produced some promising results. Long term survival in metastatic cancer is now a reality. The Trust’s portfolio has exposure to this innovation through Roche and Pfizer, both of whom are key players in the immune oncology revolution. We see Roche as remaining a global leader in the broader oncology setting however it was out of favour in 2016 and made a small relative contribution in the year. Pfizer is developing an exciting suite of treatments, including both immuno-oncology treatments and the recently launched Ibrance, in breast cancer. Pfizer also acquired Medivation, which has promising complementary products in the oncology setting which should allow it to build a profitable and growing oncology suite of products. Health Care stocks provided around one-tenth of the equity portfolio’s total return and this part of the portfolio outperformed the MSCI ACWI in the year.
The treatment of cancer remains one of the key areas in healthcare where innovation is increasingly important.
Investment Manager’s Report – 2016 continued
(%) Relative Contribution2014 2015 2016
Pfizer 0.24 0.31 0.60
Roche 0.02 0.07 0.03
Source: Alliance Trust

Alliance Trust PLC | Annual Report and Financial Accounts 2016
13
I Strategic Report IIIII
Portfolio RiskWe maintained the number of stocks in the portfolio at around 60, reflecting the conviction we had in those stocks which we considered to be best-in-class. The portfolio’s active share, which is the weighting of the stocks in the portfolio that is different from the stock weightings in the MSCI ACWI, was above 90%, a level that demonstrates that the portfolio was very structurally different to the index with just a 10% weighting overlap. The portfolio was sufficiently concentrated to deliver meaningful levels of outperformance yet diversified enough through only the highest quality global companies that there was the expectation of lower volatility than that of the index.
The portfolio started 2016 with a tracking error of 2.61% against the MSCI ACWI, finishing the year largely unchanged at 2.91%.
Investment case: Technology
The ‘Internet of Things’, Advanced Driver Assistance Systems (ADAS) and Electric Vehicles are all examples of areas where technology is penetrating new areas. The Internet of Things enables a refrigerator to manage its power usage to optimise the use of lower cost energy. ADAS will help reduce the number of casualties on the road through the use of predictive algorithms using data generated from radars, lidars and cameras. Electric vehicles will reduce CO2 emissions, make our cities cleaner and improve energy efficiency. All these are admirable goals but they do require significant processing power as well as software capability. Our exposure to digitalisation, beyond ARM and Linear Technology, has been through Cadence and, to a lesser extent, Accenture. Technology stocks provided around one-third of the equity portfolio’s total return in 2016.
The acquisition of both ARM and Linear Technology in 2016 was confirmation that within the technology sector, digitalisation is spreading to new areas.
(%) Relative Contribution2014 2015 2016
Accenture 0.36 0.59 0.98
ARM 0.01 0.08 0.99
Cadence 0.34 0.16 0.63
Linear Technologies 0.12 0.00 0.84
Benchmark relative risk (%)
Dec2015
Mar2016
Jun2016
Sep2016
Dec2016
2.6
2.7
2.8
2.9
3.0
Predicted tracking error
Source: MSCI Barra
Source: Alliance Trust

Alliance Trust PLC | Annual Report and Financial Accounts 2016
14
Strategic Report
Investment Manager’s Report – 2016 continued
Asset Allocation and Gearing in 2016Asset allocation is undertaken to enhance or protect the returns of the core investment portfolio. When strong returns are anticipated from equity markets the exposure to equities is increased by increasing borrowing. In contrast when equity valuations appear full and the outlook uncertain then exposure to equities is reduced.
Overall gearing levels were limited by the Board in the year to a maximum of 18%.
In 2016 four significant moves were implemented at an asset allocation level.
The year started with gearing on the core portfolio of 13%. In March, having ascertained that the UK Referendum on Leaving the EU could lead to a fall in the Pound, we hedged Sterling against the US Dollar equivalent to 5% of the portfolio. This mitigated the overweight of the equity portfolio towards Sterling.
Then in May gearing was reduced following a six month rally in global equities and mounting political and economic uncertainties. This brought gearing down to 10.2% of the equity portfolio.
Following the referendum result on 24 June the concern was to protect the portfolio from a disorderly fall in equity markets. To this end we sold FTSE 100 index futures to hedge the UK exposure of the portfolio – representing 4% of the overall portfolio. The position was closed on 1 July as it became apparent that currency markets were taking the impact while the FTSE 100 appreciated.
In October gearing was reduced further to 6%, given the risks surrounding the US election, anticipated US interest rate hikes and very strong equity market performance. In November the FX hedge was closed following Sterling’s 15% depreciation versus the US Dollar.
Overall the net impact of being geared into a rising market enhanced the return from the core investments, and while the index future short post the referendum had a negative impact this was more than covered by the positive contribution from the FX hedge.
StewardshipIn 2016 we voted at 161 meetings. For 123 of these meetings we voted against, withheld or abstained on one or more resolutions. These votes related to concerns about matters including: excessiveor opaque remuneration arrangements; auditors tenure and non audit fee; tenure and board and committee independence; and effectiveness or lack of transparency around lobbying activities and fair business policies. We added the issue of gender diversity on boards to our voting policy during the year and we voted against the company’s report & accounts where there were less than 15% women on the board and abstained from voting on report & accounts where there were less than 30% women on the board. This applied to just under one third of eligible meetings. The Financial Reporting Council awarded Alliance Trust Investments with a Tier 1 status on the quality of reporting against the Stewardship Code. Alliance Trust Investments is a signatory to the UN Principles for Responsible Investment (PRI), where representatives from the investment team sit on the PRI Sustainable Palm Oil Investor working group, PRI Engagement on Water Risks group, PRI Global Investor Taskforce on Corporate Tax Responsibility group. Alliance Trust Investments is also a signatory to the Paris Pledge for Action: Climate Change, PRI Montreal pledge.
Attribution analysis (%)Alliance Trust MSCI AC World Index Attribution
Equity Portfolio Only (look through basis)
AverageWeight
TotalReturn
Contribution to Total Return
AverageWeight
TotalReturn
Contribution to Total Return
Allocation Effect
SelectionEffect
TotalEffect
Consumer Discretionary 8.4 10.8 0.7 12.3 23.0 2.8 0.2 -0.8 -0.6
Consumer Staples 8.3 11.7 1.5 10.4 21.9 2.7 0.1 -0.7 -0.6
Energy 4.9 44.8 2.2 6.7 53.4 3.4 -0.4 -0.3 -0.7
Financials 17.8 19.6 3.1 17.3 32.9 4.9 0.0 -2.1 -2.1
Health Care 16.7 9.3 1.8 12.0 11.6 1.6 -0.7 -0.3 -1.0
Industrials 8.5 39.7 3.1 10.6 34.1 3.6 -0.1 0.4 0.3
Information Technology 20.0 33.3 7.1 15.5 34.7 5.3 0.2 -0.2 0.0
Materials 4.7 32.3 1.5 4.9 48.5 2.2 -0.1 -0.6 -0.7
Real Estate 4.6 25.5 1.5 3.2 22.9 0.8 -0.1 0.1 0.0
Telecommunication Services 3.2 6.1 0.2 3.8 26.2 1.1 0.0 -0.5 -0.5
Utilities 2.9 0.6 0.2 3.3 27.3 1.0 0.1 -0.7 -0.6
100.0 22.9 100.0 29.4 -0.8 -5.7 -6.5
Source: Alliance Trust and Factset

Alliance Trust PLC | Annual Report and Financial Accounts 2016
15
I Strategic Report IIIII
The divestment of non-core investments continued to gather momentum in 2016. Fixed interest investments were sold in their entirety by mid–year. The Trust has £9.5m in indirect property held through investments in Limited Partnerships. There are no direct property investments left in the portfolio although the Trust still owns its registered office, 8 West Marketgait, Dundee, DD1 1QN which was valued at £4.5m as at the end of 2016 (unchanged from 2015). This office accommodates Alliance Trust Savings’ operations and the Trust’s small executive function in Dundee. The Trust acts as landlord for Alliance Trust Savings on a commercial basis.
A sale process of the mineral rights holdings was held in the early part of the year but bids received were considered unacceptable in a distressed market environment of very weak oil prices. The sale of the holdings remains part of the divestment strategy for non-core assets but this is unlikely until there is a sustained period of energy price stability. At the year end, the mineral rights holdings were valued at £13.2m compared with a valuation of £17.5m in 2015.
The majority of investments in the private equity portfolio are held in seven externally managed private equity funds. These seven funds are largely mid-market European buyout funds and are held in our own fund of fund limited partnerships. These investments are now delivering strong returns. In 2016 the Trust saw a marked improvement in portfolio valuations and we experienced an increase in realisations resulting in healthy distributions back to the Trust. The value of our private equity investments is £103.5m. The unfunded commitment to private equity investments, which includes recallable distributions, is £28.5m. We have made no new private equity investments since 2014 and anticipate a continuation of the trend of further realisations within the private equity portfolio in 2017 generating more distributions back to the Trust.
For the non-core investments of private equity, property, fixed income and the mineral rights holdings, which together represents 3.7% of the total assets of the Trust, a positive contribution of 0.5% to investment returns was recorded in 2016.
Non-core Investments
Contribution Analysis – 2016
Whilst the Board is committed to reducing its exposure to these assets, they provided good returns and a strong income stream during the year.
The NAV total return for 2016 was 21.5% versus the benchmark MSCIACWI return of 29.4%. This is a result of the investment returns fromthe global equity portfolio, investments in fixed income, private equityand mineral rights and the change in value of the subsidiary companies. Over 2016 the shareholder total return was 26.4%, outstripping the NAV total return so capturing the benefit of a narrowing in the discount. Equities, at 93% of our total investment at the year end, are by far the most significant asset class and contributor to total return. The decision taken to fund the Company’s Final Salary Pension Schemeto allow it to buy in its liabilities through a bulk annuity policy had anegative effect on performance in the year. Average gearing was 10.7% over 2016, this had the effect of enhancingthe return from the equity portion of the portfolio over 2016.
Contribution Analysis (%) Contribution to Total Return
Equity Portfolio* 22.9
FX Contracts and Index Futures 0.2
Non-core Investments 0.5
Net Gearing Effect 0.2
Investment Portfolio Total 23.8
Subsidiaries -0.2
Pension Fund Adjustments -0.8
Effect of Change to Fair Value of Debt -0.5
Share buybacks, Cash and Accruals -0.3
Total Operating Costs -0.5
NAV Cum Income Total Return 21.5
Effect of Discount 4.9
Share Price Total Return 26.4
MSCI ACWI Total Return 29.4
*includes investments in Funds
Source: Alliance Trust and Factset

Alliance Trust PLC | Annual Report and Financial Accounts 2016
16
Strategic Report
2016
2015
£28.3m
£19.8m
2016
2015
67%
78%
2016
2015
£2.3bn
£2.1bn
2016
2015
£51m
£81m
Alliance Trust Investments
The focus of Alliance Trust Investments has been on managing the Trust’s investment portfolio and promoting its range of Sustainable Future (SF) equity and corporate bond funds alongside the Monthly Income Bond fund. These are open to both institutional and retail investors.
The business operates in a competitive marketplace and in the year was successful in continuing to attract net inflows of £51m into its funds.
During the year it carried out a significant reorganisation which reduced ongoing costs while maintaining its team of experienced investment professionals.
2016 saw strong performance from the SF Corporate Bond and Monthly Income Bond funds, with the former ending the year in the top quartile over 1, 2 and 5 years. Against the full Corporate Bond sector the Monthly Income Bond fund ended the year just below median.
Alliance Trust Investments saw net revenue grow to £22.0m, making an operating profit in the year of £3.1m, and a profit, after one-off and exceptional costs, of £0.4m, compared to its loss of £2.1m last year.
The total investment in the business by the Trust was £45.4m. At the end of 2016 the Directors had attributed a fair value to the business of £28.3m.
In December 2016 the Board announced that the Board had reached agreement to sell ATI to Liontrust Asset Management PLC (Liontrust), a specialist fund management group that has been listed on the London Stock Exchange since 1999. It is expected that net proceeds will be not less than £25m, before any future contingent consideration. The actual value which the Trust will finally receive will be dependent on the movement in the price of the Liontrust shares acquired as part of the consideration. This compares to its fair value of £19.8m as at the end of June 2016.
Alliance Trust Investments is a specialist fund management business offering open-ended funds and investment solutions. Agreement was reached in December 2016 to sell this business representing an expected gain of over £5m from its valuation at 30 June 2016. This is expected to be completed in April 2017.
Key Performance Indicatorsfor the year to 31 December
2016 (£m) 2015 (£m)
Net revenue 22.0 10.5
Ongoing expenses (18.9) (12.6)
Operating profit/(loss) 3.1 (2.1)
One-off expenses (2.7) -
Profit/(loss) before tax 0.4 (2.1)
£28.3mFair value
+43%
67% Funds above median over 3 years
-14%
£2.3bnThird party assets under management*
+11.5%
£51mThird party net inflows*
*Excludes effect of Alliance Trust mandate in February 2016.
-37%
Alliance Trust PLC | Annual Report and Financial Accounts 2016
17
I Strategic Report IIIII
2016
2015
£61.5m
£54.0m
2016
2015
£13.6bn
£8.5bn
2016
2015
110,962
84,746
2016
2015
673,486
539,222
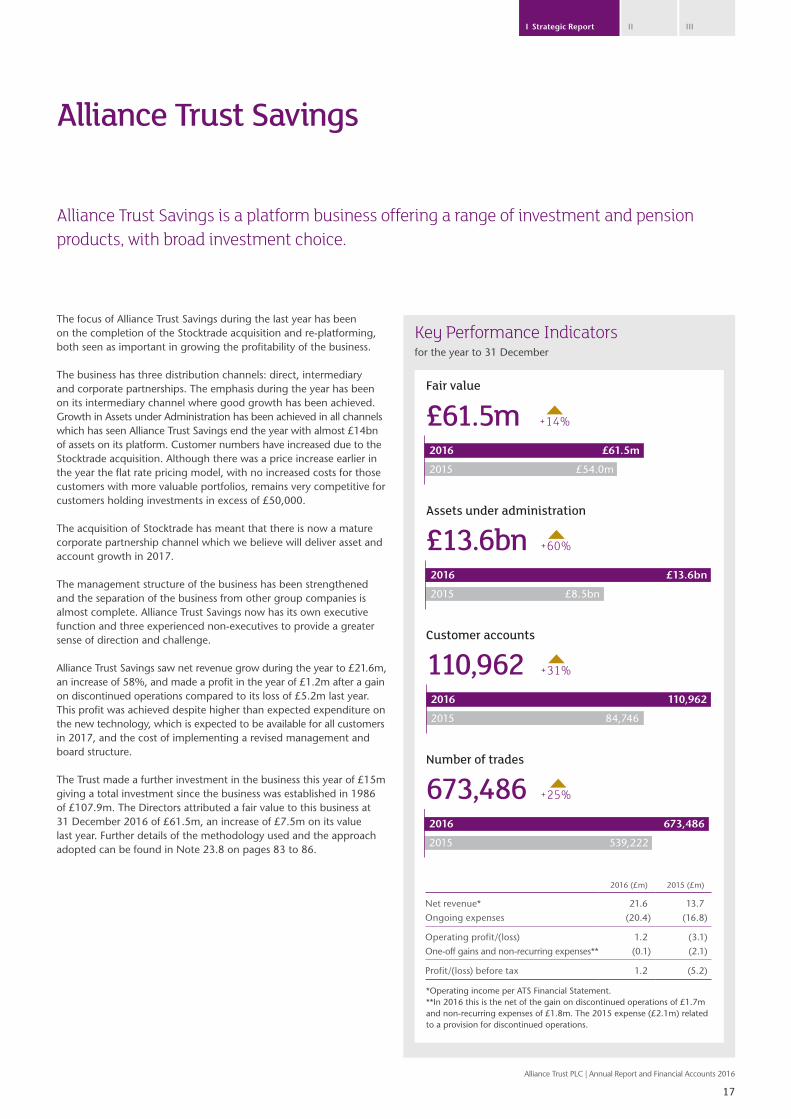
Alliance Trust Savings
The focus of Alliance Trust Savings during the last year has been on the completion of the Stocktrade acquisition and re-platforming, both seen as important in growing the profitability of the business.
The business has three distribution channels: direct, intermediary and corporate partnerships. The emphasis during the year has been on its intermediary channel where good growth has been achieved. Growth in Assets under Administration has been achieved in all channels which has seen Alliance Trust Savings end the year with almost £14bn of assets on its platform. Customer numbers have increased due to the Stocktrade acquisition. Although there was a price increase earlier in the year the flat rate pricing model, with no increased costs for those customers with more valuable portfolios, remains very competitive for customers holding investments in excess of £50,000.
The acquisition of Stocktrade has meant that there is now a mature corporate partnership channel which we believe will deliver asset and account growth in 2017.
The management structure of the business has been strengthened and the separation of the business from other group companies is almost complete. Alliance Trust Savings now has its own executive function and three experienced non-executives to provide a greater sense of direction and challenge.
Alliance Trust Savings saw net revenue grow during the year to £21.6m, an increase of 58%, and made a profit in the year of £1.2m after a gain on discontinued operations compared to its loss of £5.2m last year. This profit was achieved despite higher than expected expenditure on the new technology, which is expected to be available for all customers in 2017, and the cost of implementing a revised management and board structure.
The Trust made a further investment in the business this year of £15m giving a total investment since the business was established in 1986 of £107.9m. The Directors attributed a fair value to this business at 31 December 2016 of £61.5m, an increase of £7.5m on its value last year. Further details of the methodology used and the approach adopted can be found in Note 23.8 on pages 83 to 86.
Alliance Trust Savings is a platform business offering a range of investment and pension products, with broad investment choice.
Key Performance Indicatorsfor the year to 31 December
2016 (£m) 2015 (£m)
Net revenue* 21.6 13.7
Ongoing expenses (20.4) (16.8)
Operating profit/(loss) 1.2 (3.1)
One-off gains and non-recurring expenses** (0.1) (2.1)
Profit/(loss) before tax 1.2 (5.2)
£61.5mFair value
+14%
£13.6bnAssets under administration
+60%
110,962Customer accounts
+31%
+25%673,486
*Operating income per ATS Financial Statement.**In 2016 this is the net of the gain on discontinued operations of £1.7m and non-recurring expenses of £1.8m. The 2015 expense (£2.1m) related to a provision for discontinued operations.
Number of trades

Alliance Trust PLC | Annual Report and Financial Accounts 2016
18
Strategic Report
Portfolio Listing
All quoted equity holdings as at 31 December 2016
Stock Sector Country of listing% of
quoted equitiesValue
£m
Pfizer Inc. Health Care United States 2.8 88.2Walt Disney Company Consumer Discretionary United States 2.6 83.4Visa Inc. Class A Information Technology United States 2.5 80.1Accenture Plc Information Technology United States 2.5 79.0Ecolab Inc. Materials United States 2.4 76.4Macquarie Infrastructure Corporation Industrials United States 2.4 75.3Amgen Inc. Health Care United States 2.3 74.1Toronto-Dominion Bank Financials Canada 2.3 74.0Acuity Brands, Inc. Industrials United States 2.3 73.2Microsoft Corporation Information Technology United States 2.3 71.5Blackstone Group L.P. Financials United States 2.2 69.8Roche Holding Ltd Genusssch. Health Care Switzerland 2.1 67.3Daikin Industries, Ltd. Industrials Japan 2.1 66.3DNB ASA Financials Norway 2.1 65.7Prudential plc Financials United Kingdom 2.1 65.6American Tower Corporation Real Estate United States 2.1 64.8Deutsche Telekom AG Telecommunication Services Germany 2.0 63.8First Republic Bank Financials United States 2.0 63.0Danaher Corporation Health Care United States 2.0 62.4Thermo Fisher Scientific Inc. Health Care United States 2.0 62.1Swedbank AB Class A Financials Sweden 1.9 61.0Norsk Hydro ASA Materials Norway 1.9 60.2Eli Lilly and Company Health Care United States 1.9 60.1Total SA Energy France 1.9 59.4National Grid plc Utilities United Kingdom 1.9 59.2Statoil ASA Energy Norway 1.9 58.6Tencent Holdings Ltd. Information Technology China 1.9 58.6WPP Plc Consumer Discretionary United Kingdom 1.8 57.5Nasdaq, Inc. Financials United States 1.8 57.1NXP Semiconductors NV Information Technology Netherlands 1.7 55.2Cadence Design Systems, Inc. Information Technology United States 1.7 53.9Enterprise Products Partners L.P. Energy United States 1.7 53.1ASML Holding NV Information Technology Netherlands 1.7 52.5Activision Blizzard, Inc. Information Technology United States 1.7 52.4CVS Health Corporation Consumer Staples United States 1.6 50.3TJX Companies Inc Consumer Discretionary United States 1.6 49.6SS&C Technologies Holdings, Inc. Information Technology United States 1.6 49.2Equinix, Inc. Real Estate United States 1.5 47.9Wells Fargo & Company Financials United States 1.5 46.4ORIX Corporation Financials Japan 1.5 45.9SAP SE Information Technology Germany 1.4 42.8Alphabet Inc. Class A Information Technology United States 1.3 41.8GlaxoSmithKline plc Health Care United Kingdom 1.3 41.6Vodafone Group Plc Telecommunication Services United Kingdom 1.3 40.8Reckitt Benckiser Group plc Consumer Staples United Kingdom 1.3 40.7CSL Limited Health Care Australia 1.3 39.9Henkel AG & Co. KGaA Pref Consumer Staples Germany 1.2 38.4Legal & General Group Plc Financials United Kingdom 1.2 37.3Melrose Industries PLC Industrials United Kingdom 1.1 35.7Schneider Electric SE Industrials France 1.1 35.2Unilever PLC Consumer Staples United Kingdom 1.0 33.0Valeo SA Consumer Discretionary France 1.0 33.0AmerisourceBergen Corporation Health Care United States 1.0 31.5Dentsu Inc. Consumer Discretionary Japan 1.0 31.0Roper Technologies, Inc. Industrials United States 1.0 30.8Ambev SA Sponsored ADR Consumer Staples Brazil 1.0 30.4Keyence Corporation Industrials Japan 0.9 29.9Bangkok Bank Public Company Limited (Alien Mkt) Financials Thailand 0.9 29.0
100.0% Total Value 3,156.9

Alliance Trust PLC | Annual Report and Financial Accounts 2016
19
I Strategic Report IIIII
Funds as at 31 December 2016
Alliance Trust Investment Funds Country of registrationValue
£m
Sustainable Future Pan-European Equity Fund Luxembourg 69.5Sustainable Future Cautious Managed Fund United Kingdom 11.9Sustainable Future Defensive Managed Fund United Kingdom 11.7
Total Value 93.1
Non-core investments as at 31 December 2016
Investment Region Value £m
Private Equity United Kingdom/Europe 103.6Mineral Rights North America 13.2Indirect Property United Kingdom 9.5Other United Kingdom 1.2Foreign Currency Exchange Contract 6.9
Total Value 134.4
Total investments as at 31 December 2016
InvestmentValue
£m
Quoted Equities 3,156.9Funds 93.1Investments in operating subsidiary companies 89.8Non-core investments 134.4
Total Value 3,474.2
Source: Alliance TrustA full portfolio listing, similar to that displayed above, is available on a monthly basis on our website at www.alliancetrust.co.uk
Investments in operating subsidiary companies as at 31 December 2016
Investment RegionValue
£m
Alliance Trust Savings United Kingdom 61.5Alliance Trust Investments United Kingdom 28.3
Total Value 89.8

Alliance Trust PLC | Annual Report and Financial Accounts 2016
20
Strategic Report
0.43
0.59
0.60
0.75
0.67
2012 2013 2014 2015 2016
Cost savings across the Investment BusinessIn October 2015 we announced targeted cost savings of £6m, equivalent to more than 20% of the combined recurring costs borne by the Trust and ATI in 2015. By Investment Business we mean the combined costs of the investment manager, ATI, and the direct costs of the Trust after the Group reorganisation implemented in the last quarter of 2015.
The targeted £6m of costs savings were achieved and in total we reduced annual costs by over £9m; achieved through a combination of the initial cost target savings and an additional £3m cost saving in ATI as the business moved to profitability. The cost base of ATI was restructured in 2016 through staff reductions, a change in premises and management of discretionary spend; this enabled ATI to generate monthly profits from July 2016.
The ongoing costs of the Trust are now driven by a variable management fee. Other costs of running the Trust are directly under the control of the Board. In 2016 the Board sought to reduce ongoing costs to a level consistent with running the Trust efficiently and restoring shareholder value.
DividendsAlliance Trust has increased the ordinary dividend in each of the last 50 years and is one of only four companies in the FTSE All-Share index with such a track record. The Board’s current policy is to pay a progressive dividend and under normal market conditions to pay all net income received as ordinary dividends.
The ordinary dividend for 2016 will rise by 16% to 12.774p. A fourth interim dividend of 3.274p will be paid on 31 March 2017 to shareholders who were on the Company’s share register on 10 March 2017.
DiscountOur policy is to buyback shares where we judge it to be beneficial to shareholders. Through the use of our share buyback programme we narrowed the discount significantly at the year end closing the year at 4.4% slightly less than the AIC Global Sector’s average of 4.6%. Since the year end the discount has remained on or around 5%. All the shares bought back have been cancelled.
Costs and Financial Measures – 2016
Ongoing Charges Ratio (OCR)In October 2015 we announced a targeted Ongoing Charges Ratio (‘OCR’) of 0.45% or less by the end of 2016 (compared to 0.59% in 2015 and 0.60% in 2014). The actual 2016 OCR which is calculated on ongoing expenses was 0.43%. This reduction in OCR has been achieved through the appointment of Alliance Trust Investments (ATI) to manage the portfolio at an investment management charge of 0.35% of an adjusted NAV (excluding holdings in ATI managed funds and the fair value of ATS and ATI), effective management of ongoing direct expenses for the Trust and the Group reorganisation whereby direct expenses of ATI and Alliance Trust Savings are now borne directly by these entities. Ongoing expenses exclude non-recurring expenses relating to the Strategic Review and restructuring costs. Non-recurring costs in 2016 relating to the Strategic Review, indirect ATI sale costs and reorganisation costs are £3.4m.
The Trust implemented a new cost allocation policy in 2016. Where consistent with AIC SORP guidelines we now allocate management fees and other indirect expenditure one third to revenue profits and two thirds to capital profits. In prior years, with the exception of capital incentives, all expenses were recorded against revenue profits. The 2016 OCR of 0.43% is based on total ongoing costs, the corresponding OCR on total ongoing costs would have been 0.63% rather than the reported 0.59% based on revenue costs.
As in prior years the OCR excludes one-off or non-recurring costs. Non-recurring costs in 2016 were £3.4m (2015: £5.2m). Further disclosure of non-recurring costs is on the next page.
We provide here a breakdown of how our Ongoing Charges Ratio is calculated and cost savings achieved across the investment business.
Ongoing charges ratio (%)
Source: Alliance Trust

Alliance Trust PLC | Annual Report and Financial Accounts 2016
21
I Strategic Report IIIII
Alliance Trust PLCOngoing Charges Ratio (OCR) Summary 2016
£'0002016
Revenue Capital Total2015
Revenue Capital Total
Average net assets 3,111,711 2,983,253
Total administrative expenses 7,960 8,810 16,770 22,835 1,133 23,968
Non-recurring expenses (1,782) (1,590) (3,372) (5,233) - (5,233)
Ongoing expenses 6,178 7,220 13,398 17,602 1,133 18,735
Non-recurring expenses
Reorganisaton 556 179 735 2,880 - 2,880
Strategic Review 457 1,221 1,678 - - -
Indirect disposal costs of ATI 769 189 959 - - -
AGM requisition - - - 2,353 - 2,353
1,782 1,590 3,372 5,233 - 5,233
OCR ongoing expenses* 0.43% 0.59% 0.63%
Total Expenses Ratio (TER)* 0.54% 0.77% 0.80%
*We have not shown an OCR or TER for 2016 revenue expenses because from 1 January 2016 these measures are calculated on total expenses.
The expenses relating to Alliance Trust Investments and Alliance Trust Savings can be found on pages 16 and 17.

Alliance Trust PLC | Annual Report and Financial Accounts 2016
22
Strategic Report
Risk Management
This section of the report deals with the structure of the Group’s Risk Management Framework and risk reporting.
Risk Management FrameworkThe Group has a Risk Management Framework that provides a robust and comprehensive approach for the identification and management of key risks facing the business. The Framework helps in the assessment and management of current and future risks. Principal Risk categories include Market and Prudential, Operational, Strategic and Regulatory and Conduct Risk. The Risk Management Framework supports two key processes:
• the ICAAP (Internal Capital Adequacy Assessment Process), which helps to determine the capital requirements (including potential stress points) of the Group; and
• the ILAAP (Internal Liquidity Adequacy Assessment Process), which helps to determine the liquidity requirements (including potential stress points) of the Group.
Market and Prudential RisksRisk Description Mitigating activities Change in year
Investment under-performance
Investment performance fails to deliver sufficient capital growth due to poor stock selection, sector allocation or wider market movements.
• Asset allocation strategy and governance• Robust investment process• Compliance with investment parameters regularly tested• Stress and scenario testing of portfolios• Risk and performance management information
regularly reviewed by the Board
Liquidity The Company does not have sufficient liquid resources to ensure that it can meet its liabilities as they fall due during normal and stressed times.
• Majority of investments are in listed equities• Daily monitoring of cash positions• Gearing availability
Operational RisksRisk Description Mitigating activities Change in year
Cyber attack Failure to ensure that the business is adequately protected against the threat of cyber attack, which may lead to significant business disruption or external fraud.
Despite action taken by management to improve systems the increasing trend is due to the general growth in cyber related incidents across the industry.
• Systems and controls to protect the business regularly tested
• Ongoing monitoring of environment to understand threat landscape
• Programme of enhancements to keep pace with latest defence strategies
• Business continuity plans in place should an incident occur
Change of Investment Manager
The Company changed its investment manager to Alliance Trust Investments in 2016 and will change it to Willis Towers Watson in 2017.
• Experienced investment managers• Use of transition manager for the investment switch
to Willis Towers Watson
Alliance Trust PLC | Annual Report and Financial Accounts 2016
23
I Strategic Report IIIII
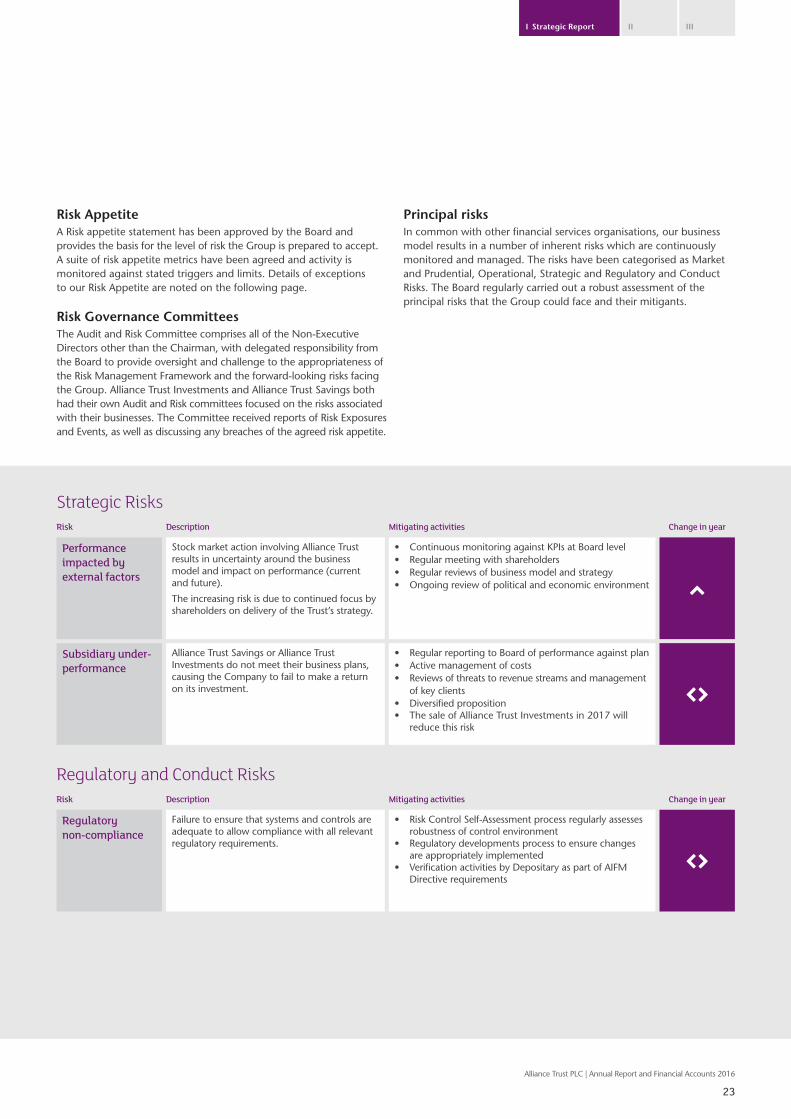
Strategic RisksRisk Description Mitigating activities Change in year
Performance impacted by external factors
Stock market action involving Alliance Trust results in uncertainty around the business model and impact on performance (current and future).
The increasing risk is due to continued focus by shareholders on delivery of the Trust’s strategy.
• Continuous monitoring against KPIs at Board level• Regular meeting with shareholders• Regular reviews of business model and strategy• Ongoing review of political and economic environment
Subsidiary under-performance
Alliance Trust Savings or Alliance Trust Investments do not meet their business plans, causing the Company to fail to make a return on its investment.
• Regular reporting to Board of performance against plan• Active management of costs • Reviews of threats to revenue streams and management
of key clients• Diversified proposition• The sale of Alliance Trust Investments in 2017 will
reduce this risk
Regulatory and Conduct RisksRisk Description Mitigating activities Change in year
Regulatory non-compliance
Failure to ensure that systems and controls are adequate to allow compliance with all relevant regulatory requirements.
• Risk Control Self-Assessment process regularly assesses robustness of control environment
• Regulatory developments process to ensure changes are appropriately implemented
• Verification activities by Depositary as part of AIFM Directive requirements
Risk AppetiteA Risk appetite statement has been approved by the Board andprovides the basis for the level of risk the Group is prepared to accept.A suite of risk appetite metrics have been agreed and activity ismonitored against stated triggers and limits. Details of exceptions to our Risk Appetite are noted on the following page.
Risk Governance CommitteesThe Audit and Risk Committee comprises all of the Non-Executive Directors other than the Chairman, with delegated responsibility from the Board to provide oversight and challenge to the appropriateness of the Risk Management Framework and the forward-looking risks facing the Group. Alliance Trust Investments and Alliance Trust Savings both had their own Audit and Risk committees focused on the risks associated with their businesses. The Committee received reports of Risk Exposures and Events, as well as discussing any breaches of the agreed risk appetite.
Principal risksIn common with other financial services organisations, our businessmodel results in a number of inherent risks which are continuouslymonitored and managed. The risks have been categorised as Market and Prudential, Operational, Strategic and Regulatory and Conduct Risks. The Board regularly carried out a robust assessment of the principal risks that the Group could face and their mitigants.

Risk AppetiteRisk Appetite measures which at the year end and in each quarter of 2016 were outside the limits approved by the Board were:
• Net Asset Value relative to MSCI ACWI
• Management of Alliance Trust PLC Direct Costs
The Board believes that the output from the Strategic Review and the actions being taken to implement a new investment approach will see these measures return to within our risk appetite limits.
The other measures which breached the agreed risk appetite during the year were:
• Discount – Breached from Q1 to Q3, with an improvement to within target following the Strategic Review announcement in December and the commencement of an active programme of share buybacks.
• Performance of subsidiaries against business plan – Breached in Q1 and Q2, with improvements made in the second half of the year with Alliance Trust Investments moving to operational profitability; however, Alliance Trust Savings profit finished the year below budget.
Alliance Trust PLC | Annual Report and Financial Accounts 2016
24
Strategic Report
Policies
Risk appetite
Risk universe
CultureEmbed risk practices Conduct
Risk management organisation Risk measurement
Governance Management information
Risk Management continued
Risk frameworkWe undertake an annual assessment of the effectiveness of the Risk Framework (see the diagram opposite). The most recent assessment was presented to the Audit and Risk Committee following the year end and noted that there were no significant concerns to highlight.
An annual report on the effectiveness of the internal control systems is provided to the Board. This includes a review of all material financial, prudential, operational and compliance controls. The report builds on the reporting of each line of defence that is provided across the course of the year through the governance committees up to the Board. The latest report was presented to the Audit and Risk Committee following the year end and no material issues were identified.

Alliance Trust PLC | Annual Report and Financial Accounts 2016
25
I Strategic Report IIIII
Corporate Responsibility
We report in our Investment Manager’s report how we exercise our stewardship responsibilities demonstrating our commitment to good corporate governance.
As an investment trust we have no customers however we do believe that we should maintain an open dialogue with our shareholders and during the year we met with our significant shareholders as well as individual shareholders and their representatives to hear their views and to update them on the progress of the Trust. This helps the Board to act fairly between the members of the Company by ensuring that it captures a range of shareholder views.
We have supported the Alliance Trust Foundation charity, which raises money through the Alliance Trust Cateran Yomp and fundraising activities by staff, for 3 years. Over that period the Company has donated £93,167. The Alliance Trust Foundation distributed £156,034 to charities including £87,423 to 28 charities in 2016. The charities supported are, in the main, those which are based in the communities where we have offices or where employees of the Group companies live i.e. Dundee, Edinburgh and London. We ceased our sponsorship of the Cateran Yomp after the 2016 event.
The Board believes that a diverse workforce will create the environment to allow our businesses to thrive and grow. We look for our subsidiaries to have an inclusive environment where people can develop and contribute fully. The Group’s employment and recruitment policies are at all times compliant with relevant EU and UK legislation.
Recruitment, development and promotion is based solely on the candidate’s suitability for the job to be done and there should be no discrimination either before or during employment on the basis of gender, sexual orientation, age, race, nationality, disability, political or religious belief. Should any employee become disabled they should not suffer any discrimination and reasonable adjustments will be made to allow them to continue to have the same opportunities as any other member of the workforce.
The Board also recognises its responsibilities to its former employees and has for a number of years looked to de-risk the Trust’s final salary pension scheme, which has around 200 members, by making additional contributions. In 2016 the Trust agreed to provide additional funding of £19.2m to partially fund the purchase of a bulk annuity policy which, along with existing annuities, now secures the benefits of all of the Scheme members.
The table below provides the gender split of the Board of the Company as at 31 December 2016. The Company has no employees. On 1 January 2016 all staff in the Group were transferred from Alliance Trust Services, which is the only consolidated subsidiary, to either Alliance Trust Savings or Alliance Trust Investments and accordingly we no longer disclose the gender split of the managers and staff of those companies. Alliance Trust Services has only one director who is a male.
Male Female
Board 5 (83%) 1 (17%)
Total greenhouse gas emissions data We report here on all of the emission sources required under the Companies Act 2006 (Strategic Report and Directors’ Report) Regulations 2013. These sources relate to offices occupied by our subsidiaries and to travel undertaken by their employees. Although these subsidiaries do not fall within our consolidated financial statements they are wholly owned by the Company and are therefore regarded as under its control for the purposes of reporting emissions.
Our carbon footprint has been calculated based on the WRI/WBCSD Greenhouse Gas Corporate Accounting and Reporting Standard (GHG Protocol) and Defra guidelines. We have adopted an operational control approach. The emissions reported below have been verified by Carbon Footprint Limited. Details of our verification statements are available on our website.
The Strategic Report (comprising the inside cover to page 25 of this document and the viability statement on page 37) has been approved by the Board and signed on its behalf by
Lord Smith of Kelvin Chairman 23 March 2017
Tonnes CO2eYear to
31 Dec 2013Year to
31 Dec 2014Year to
31 Dec 2015Year to
31 Dec 2016% Change
year-on-year
Scope 1Natural gasRefrigerant lossCompany cars
211 190 181 139 -23%
Scope 2 Location based Scope 2 Market based
Purchased electricity489
–535
– 472 112
404 66
-14%-41%
Scope 3 Downstream leased assetsBusiness travel
649 592 645 364 -44%
Total all Scopes 1,349 1,316 1,298 907 -30%
Total Scope 1 + 2 700 725 653 543 -17%
Scope 1 + 2 per full employee equivalent (FTE) 2.76 2.63 2.07 1.72 -17%

Lord Smith of KelvinChairman
Appointment to the Board 2016
Committee membership• Nomination (Chair)• Management Engagement
Gregor StewartDeputy Chairman
Appointment to the Board 2014
Committee membership• Nomination• Audit & Risk (Chair)• Remuneration• Management Engagement
Karl SternbergNon-Executive DirectorSenior Independent Director
Appointment to the Board 2015
Committee membership• Nomination• Audit & Risk• Remuneration• Management Engagement (Chair)
Subsidiary Board responsibilities
Non-Executive Director of Alliance Trust Savings
Skills and experience
• Investment• Asset Management• Financial Services• Business Leadership
• Financial and Risk oversight• Investment Trusts• Financial Services• Risk• Strategic Change• Corporate Finance• Distribution
• Investment• Asset Management• Investment Trusts• Financial Services• Business Leadership
External appointments
• Chairman of UK Green Investment Bank, IMI PLC and Forth Ports Ltd
• Non-Executive Director of Intrinsic FS Group, FNZ UK Ltd and its holding company
• Honorary Treasurer for the charity International Alert
• Non-Executive Director of Jupiter Fund Management PLC, JPM Elect plc, Monks Investment Trust PLC, Lowland Investment Company PLC, Herald Investment Trust PLC, Railpen Investments and Clipstone Logistics REIT PLC
• Member of Governing Body of Christ Church, Oxford
• Fellow of St Catherine’s College, Oxford
Previous experience
• Chief Executive Morgan Grenfell Asset Management
• Chairman of The Weir Group PLC and SSE PLC
• Non-Executive Director of Standard Bank Group Limited
• Chairman of the Scottish Devolution Commission
• Chairman of the Glasgow 2014 Commonwealth Games organising company
• Member of the Financial Reporting Council
• Finance Director at Scottish Widows• Finance Director for the Insurance
Division of Lloyds Banking Group• Chartered Accountant with and Partner
of Ernst & Young
• Partner of Oxford Investment Partners• Global Head of Equities and Chief
Investment Officer Europe and Asia Pacific at Deutsche Asset Management
Alliance Trust PLC | Annual Report and Financial Accounts 2016
26
Directors’ Report
Board of Directors

Anthony BrookeNon-Executive Director
Appointment to the Board 2015
Committee membership• Nomination• Audit & Risk• Remuneration (Chair)• Management Engagement
Clare DobieNon-Executive Director
Appointment to the Board 2016
Committee membership• Nomination• Audit & Risk • Remuneration• Management Engagement
Chris SamuelNon-Executive Director
Appointment to the Board 2015
Committee membership• Nomination• Audit & Risk• Remuneration• Management Engagement
Non-Executive Directorof Alliance Trust Investments
• Investment• Asset Management• Financial Services• Corporate Finance• Marketing
• Asset Management• Investment Trusts• Financial Services• Marketing and Distribution
• Asset Management• Investment Trusts• Financial Services• Business Leadership• Financial Oversight• Corporate Finance
• Non-Executive Director of Quintessentially (UK) and Bourne Park Capital Ltd
• Member of the Investments Committee of Christ’s College, Cambridge
• Member of the Investment Committee of the National Portrait Gallery, London
• Investment advisor to a number of charitable endowments
• Non-Executive Director of Aberdeen New Thai Investment Trust PLC, F&C Capital and Income Investment Trust PLC and Schroder UK Mid Cap Fund PLC
• Trustee of Essex and Herts Air Ambulance Trust
• Chairman of Defaqto• Non-Executive Director of JP Morgan
Japanese Investment Trust PLC, UIL Limited, UIL Finance Limited, BlackRock Throgmorton Trust Plc
• Non-Executive Director and member of Executive Committee and Chair of the Finance and Investment Committee of London Community Foundation
• Vice-Chairman of S G Warburg & Co. Ltd• Partner of Fauchier Partners• Non-Executive Director of
Huntsworth plc
• Group Head of Marketing at GAM• Head of Marketing and Clients at
Barclays Global Investors• City Editor at the Independent• Director, Braxted Marketing Measures • Deputy Chair, Southend University
NHS Foundation Trust
• Chief Executive of Ignis Asset Management
• Chief Operating Officer at Gartmore• Chief Operating Officer at Hill Samuel
Asset Management• Partner at Cambridge Place
Investment Management• Chartered Accountant with KPMG
Alliance Trust PLC | Annual Report and Financial Accounts 2016
27
II Directors’ Report IIII

Alliance Trust PLC | Annual Report and Financial Accounts 2016
28
Directors’ Report
Corporate Governance
Alliance Trust takes good governance seriously. Since the changes that were announced in 2015 and implemented in 2016 to introduce independent boards for both Alliance Trust Savings and Alliance Trust Investments and to move to a Non-Executive only Board for Alliance Trust PLC we have seen quite a radical change in the way in which the Company is run.
We have seen greater accountability from the executives who were charged with running our subsidiary business as they were challenged by independent non-executives as well as a non-executive appointed from the board of the Company. This is the first time that both of these subsidiaries have reported profits in the same year, and the first time that Alliance Trust Investments has reported a profit.
With less distraction from the affairs of the subsidiaries the Board has been focused on delivering the outcome of its Strategic Review, reported in more detail on pages 2 and 3, as well as ensuring that the Company itself is observing good standards of governance. Over the next few pages we outline the work that the Board and the Committees have done over the year. I would highlight that, apart from myself, every Director is a member of each Committee and has contributed across all areas of our governance. We took the decision last year that as a small Board it was more effective for all of the Directors to be involved in the work of all of the Committees so that everyone was aware of developments and could contribute from their own areas of specialist knowledge; we believe that this has led to more informed decisions and efficient use of the Directors’ time. This does mean that, on occasions, the Board itself may consider items of business that would normally come to it as a recommendation from one of the Board Committees, for example the appointment of a new director, however that has not detracted from the work of those Committees which are structured to allow adequate time for discussing matters in more depth than could be achieved within a Board meeting. We will be reviewing our Committee structure again in 2017 in light of experience gained in 2016.
Compliance with AIC Code of Corporate GovernanceThe Company has complied with the recommendations of the AIC Code of Corporate Governance issued in July 2016. This report describes how the Board applies the principles of that Code in practice.
Financial Reporting CouncilAs part of their regulatory responsibilities the Conduct Committee of the Financial Reporting Council review and investigate the annual reports and directors’ and strategic reports of public companies. Our Report and Accounts for 2015 were reviewed and the Conduct Committee confirmed that they had no questions or queries which they wished to raise with us. Their review was not based on the detailed knowledge and understanding of the business that our Board has however it was conducted by staff of the Financial Reporting Council who have an understanding of the relevant legal and accounting framework.
Lord Smith of Kelvin, Chairman

Alliance Trust PLC | Annual Report and Financial Accounts 2016
29
II Directors’ Report IIII
Subsidiary Boards
Board Committees
Board of Directors
Alliance Trust SavingsAlliance Trust Investments
Nomination RemunerationManagement EngagementAudit and Risk
Corporate structureWe have a number of Board Committees to ensure good governance and to enhance accountability and independence. The terms of reference of the four standing committees reporting to the Board can be found at www.alliancetrust.co.uk. The diagram below shows the main committees and reporting lines within the Group that were in
Since the end of 2015 the Board of the Company does not require the subsidiary boards to seek endorsement for their business plans, budgets, the launch of new funds or products or approval of major business expenditure. These changes, along with the appointment of new independent directors, have made the subsidiary boards more autonomous.
The Board still maintains an element of oversight and it has to be consulted before either of the subsidiaries takes any action which could impact adversely on the reputation or long-term financial interests of the Company. Each of the subsidiary companies also have a non-executive director from the Company sitting as a non-executive director on their board.
place at the year end. The Board will on occasions constitute ad hoc committees or working groups for specific purposes and has constituted a Disclosure Committee which will meet as required to consider the disclosure of inside information held by the Company.
Board ExperienceThe Board recognises that they require a mix of skills and experience to ensure that the Company is managed and governed effectively. We set out below the key skills which the Board has identified that it must have. In addition to these key skills the Board also has experience in Investment, Financial Oversight, Risk, Strategy and Change and Corporate Finance.
Board experienceFinancial Services
Business Leadership
Asset Management
Investment Trusts
Marketing and Distribution
Lord Smith of Kelvin ✓ ✓ ✓
Gregor Stewart ✓ ✓ ✓
Anthony Brooke ✓ ✓ ✓
Clare Dobie ✓ ✓ ✓ ✓
Chris Samuel ✓ ✓ ✓ ✓
Karl Sternberg ✓ ✓ ✓ ✓
Structure

Alliance Trust PLC | Annual Report and Financial Accounts 2016
30
Directors’ Report
Board Evaluation
We believe that boards should regularly review their own performance as part of a programme of continuous improvement. In addition to regular discussions in the course of board meetings, each year the Board undertakes a formal review of its own performance and that of each of its Committees. The Board as a whole meets to assess its own performance and that of its Committees.
Alliance Trust has a longstanding practice of periodic externally facilitated board reviews and has now done so four times beginning in 2007. The most recent external evaluation was carried out in December 2015 and the next external evaluation is planned for December 2017.
2015 evaluationThe 2015 evaluation identified that one area of focus should be an assessment of the skills and competencies of both current and future board members. An assessment was carried out by the executive search and board advisory firm Russell Reynolds, who also provide
non-executive director search services to the Company and its subsidiaries. The conclusion of the report they produced was that, overall, the Board had robust governance practices and a good, diverse mix of directors with strong values alignment and orientation; the Board and committees functioned well with strong processes and diligent focus.
2016 evaluationThe Board opted to conduct the 2016 performance evaluation through formal questionnaires and discussion between the Directors, Chairman and the Audit and Risk Committee Chairman. In summary, the conclusion was that 2016 was an exceptional year in terms of the time commitment of the Directors and that all of individual Directors contributed to the effective operation of the Board and of its Committees. The evaluation did identify that there was a significant level of overlap between the work of some of the Committees and that of the Board and it was agreed that the Committee structure would be reviewed.
External Evaluation• Agree focus and timing
• Agree external evaluator Outside firm interviews Directors and senior managers
• Outside firm attends Board meeting
• Presentation of findings to Board Agree Actions
• Implement Actions
Internal Evaluation• Agree themes
• Questionnaires completed by Board and senior managers Interviews by Chairman Report to the Board
• Agree Actions
• Implement Actions
Our three year
evaluation cycle
Year 1External
Year 2Internal
Year 3Internal

Alliance Trust PLC | Annual Report and Financial Accounts 2016
31
II Directors’ Report IIII
Management Engagement Committee
" The Management Engagement Committee was constituted in 2016 to oversee and review the performance of the investment manager. During the course of the year the whole Board decided to consider a number of matters that would normally have been the responsibility of this Committee. Since all members of the Board are also members of the Committee, we believed it would be more effective if these matters were considered directly by the Board rather than by convening a separate meeting of the Committee to make recommendations to the Board. We report here on our deliberations."
Karl Sternberg Chairman, Management Engagement Committee
Areas of focus in 2016
Evaluation of the Investment Manager’s Performance
The Board considered the performance of Alliance Trust Investments (ATI) during the year, and its contractual arrangements. We concluded that although ATI had underperformed its objective, we believed that on a longer-term basis, the manager continued to provide the levels of return that could be expected in current market conditions from a single manager with ATI’s investment style. Nevertheless, we decided to undertake a Strategic Review to consider whether a different approach would better suit the objectives of the Trust.
We received a number of submissions from third-party managers offering both global equity and multi-asset approaches. We considered these submissions, and the continued appointment of Alliance Trust Investments, on their own merits and then compared them with an unconstrained choice of single managers, whether they had submitted proposals or not.
After broad consultation, the Board decided that a multi-asset model was not an appropriate choice, so our focus was on the best way to deliver consistently good performance against the existing global equity benchmark.
We considered single managers and a traditional multi-manager approach with broad mandates spread across a number of investment houses. We decided, however, that either of these would lead to a portfolio with too many stocks and lower active money and would not be exclusive to the Trust: we wanted to deliver a conviction portfolio with fees paid only for active stock selection. As a result, the Board decided that we would appoint multiple managers with high conviction 20-stock portfolios.
In order to implement this new approach, we took two decisions:
1. To sell Alliance Trust Investments to a firm better able to exploit its natural advantages in sustainable investment; and
2. After a competitive tender, to appoint Willis Towers Watson (WTW) as our new investment manager.
The Board believes that its new focused multi-manager approach to be implemented by WTW is an opportunity to provide investors with a genuinely innovative and distinctive equity portfolio. It will both be high conviction and have a lower risk of disappointment. We also believe that the new approach will provide access to managers that are not otherwise accessible to retail investors.
The Board decided not to include performance fees as part of the remuneration structure for the underlying managers or for WTW. This is not just to avoid complexity, but is also designed to reduce the likelihood of managers replicating the benchmark index and rewarding managers for achieving performance levels they are already obligated to deliver.
The Board also agreed that the appointment of WTW would be on six months’ notice. This is the same notice period as was included in the agreement with Alliance Trust Investments.

Alliance Trust PLC | Annual Report and Financial Accounts 2016
32
Directors’ Report
Nomination Committee
“ The Nomination Committee exists to assess the skills and experience of the individual directors of the Company in order to ensure that they are sufficient to provide effective direction and oversight of the Company’s strategy and operation. We set out below the main areas of focus of the Committee during 2016.”
Lord Smith of Kelvin Chairman, Nomination Committee
Areas of focus in 2016
Re-election of Directors Since 2011 each Director has been subject to annual re-election by shareholders. The Committee considered each continuing Director for their independence, contribution, commitment and time availability and concluded that each Director satisfied these criteria and recommended their re-election. The Committee also assessed each director appointed since the last AGM and also assessed them under the same criteria and recommended their election or re-election.
Diversity Policy The Committee approved the following Diversity Policy:
Alliance Trust recognises the benefits of having a diverse Board, and sees diversity at Board level as important in maintaining good corporate governance and Board effectiveness. The Board members should include different skills, regional and industry experience, background, race and gender. These differences will be considered in determining the composition of the Board and when possible should be balanced appropriately.
All Board appointments must be made on merit, in the context of the skills, experience, independence and knowledge which the Board as a whole requires to be effective.
The Nomination Committee (‘the Committee’) will review and assess Board composition on behalf of the Board and recommend the appointment of new Directors. In reviewing Board composition, the Committee will consider the benefits of all aspects of diversity including, but not limited to, those described above, in order to enable it to discharge its duties and responsibilities.
In identifying suitable candidates for appointment to the Board, the Committee will consider candidates on merit against objective criteria and with due regard for the benefits of diversity on the Board. As part of the selection process, where search agents are used, they will be required in preparing their long list to include female candidates of at least 25% of the number submitted for consideration. Over time the Board intends to achieve at least 25% female representation on the Board.
As part of the annual performance evaluation of the effectiveness of the Board, Board Committees and individual Directors, the experience, independence and knowledge of the Directors and the diversity representation of the Board, how the Board works together, and other factors relevant to its effectiveness will be considered.
Non-Executive Directors The Board after approving its Diversity Policy agreed that action should be taken to address the lack of women on the Board and initiated a search for an additional director with the intention of improving gender diversity while also strengthening the existing Board’s skills and experience. The search that was undertaken led to the appointment of Clare Dobie to the Board in May.

Alliance Trust PLC | Annual Report and Financial Accounts 2016
33
II Directors’ Report IIII
Audit and Risk Committee
“ In this section we provide information on the main areas focussed on by the Audit and Risk Committee over the year. The Committee plays a significant role in ensuring that the Company’s financial statements are properly prepared and that the systems of internal controls in place are effective and appropriate. The Committee monitors how effective management is in managing risk in the business. In addition, the Committee reviews and challenges the appropriateness of the Company’s Risk Appetite, its application within the business and the investment manager’s assessment of the risk outlook for the portfolio. We provide more detail on these matters on the next pages. The key areas of focus and the decisions taken during the year are summarised in the table below.”
Gregor StewartChairman, Audit and Risk Committee
Areas of focus in 2016
Risk Appetite The Committee considered and updated its risk appetite and this is reported on in more detail on pages 22 to 24.
Cyber Risk The Committee received reports on how cyber risk impacted on the Company and assessed the steps being taken by the boards of the subsidiary companies to protect their businesses through increased IT security measures implemented during the year.
Final Salary Pension Scheme
The Committee received updates on the progress of the Trustees of the Company’s final salary pension to derisk the scheme through the purchase of a bulk annuity policy. The Trustees completed the buy in of the scheme’s liabilities on 31 May 2016.
Valuation of Fixed rate Loan Notes
The Committee, to provide the market with greater transparency and to move towards market convention, approved a change in the accounting policy for the valuation of its £100m of unsecured long term fixed rate notes, to include both par and fair value. Further detail can be found in Note 2 on page 63.
Long Term Incentive Plan The Committee received a report of the external independent review that had been commissioned into the process, controls and ownership of the process to determine the causes of errors arising in previous years. New procedures were approved and introduced to provide greater assurance that errors would be prevented in the future. The Committee requested the external auditors to ensure that their procedures are sufficiently robust in this regard.
Regulatory Compliance The Committee approved a number of submissions to the regulators. These included the consolidated Group Internal Capital Adequacy Process (ICAAP) and the consolidated Group Individual Liquidity Assessment Process (ILAAP) which involved analysing the risks to the business and the level of capital required to reflect those risks and the way in which any liquidity concerns would be addressed.
Internal and External Auditors
The Committee considered both its internal and external audit requirements. In the third quarter of 2016, the investment manager (ATI) adopted a revised combined risk assurance and internal audit approach with the agreement of the Committee. During the year the Group outsourced certain internal audit services in relation to its subsidiaries. The Committee evaluated the performance of the external auditor and determined that it would be inappropriate to carry out a tender in a year of significant business change, a change in governance structures and a rotational change in audit partner.
Valuation of Unlisted Investments
The valuation methodology used to value the investments in the subsidiaries and private equity investments can be found in Note 23.8 on pages 83 to 86. The Committee took advice from an external valuer and an internally prepared paper in arriving at the fair value for Alliance Trust Savings. The Committee challenged the range of values provided and after fully reviewing the methodology and assumptions adopted. In respect of Alliance Trust Investments, the Committee assessed the year end valuation on the expected disposal proceeds excluding the contingent consideration.
Review of Annual and Interim Accounts
The Committee considered the content of the Interim Accounts and the Annual Report and Accounts of the Company before recommending approval to the Board. The Committee concluded that the Company’s accounts were fair, balanced and understandable.

Alliance Trust PLC | Annual Report and Financial Accounts 2016
34
Directors’ Report
Audit and Risk Committee continued
Internal controlsThe Group has a clear governance structure for the control and monitoring of its business, including defined lines of responsibility and delegation of authority. The Group has a comprehensive system for reviewing, monitoring and reporting to the Board, including a detailed financial review against forecast.
The Board is responsible for determining its appetite for the level of risk it is willing to take in achieving its strategic objectives and for the Group’s risk management framework and internal control systems.
The Audit and Risk Committee assists the Board in fulfilling this responsibility through regular review of their effectiveness, including all material financial, operational and compliance controls. The Board has an established ongoing process for the identification, evaluation and management of the significant risks faced by the Company recognising that the now independent Boards of the subsidiary companies had their own Audit and Risk Committees to consider the risks specific to their businesses. The process helps the Board to carry out a robust assessment of the principal risks to the business.
The Company relies on the systems of internal control employed by its manager, Alliance Trust Investments (ATI), to facilitate effective and efficient operations and to ensure the assets of the Company are safeguarded, proper accounting records are maintained, and the financial information used within the business and for reporting to stakeholders is reliable.
Any system of risk management and internal control is designed to manage, rather than eliminate, the risk of failure to achieve business objectives and can only provide reasonable assurance and not absolute assurance against regulatory breach, material misstatement or loss. In 2016, the Board is not aware of any such material matters having occurred.
The Company has appointed a Depositary, National Westminster Bank plc. The Depositary is responsible for the safekeeping of all custodial assets of the Company, ensuring its cash flows are properly monitored, for verifying and maintaining a record of all other assets of the Company and for the collection of income that arises from the Company’s assets. It is the duty of the Depositary to take reasonable care to ensure that the Company is managed in accordance with the FCA FUND Sourcebook, the Company’s Articles of Association and the AIFM Directive.
Having carried out such procedures as the Depositary considers necessary to discharge their responsibilities as Depositary, it is their opinion, based on the information available to them and the explanations provided, that in all material respects the Company has been managed in accordance with the rules in the FUND sourcebook, the Articles of Association of the Company and as required by the AIFM Directive.
During 2016 the Committee provided challenge on the risk reporting provided in respect of the Company and in relation to subsidiaries ATI and ATS. The reviews undertaken included consideration of the Risk Appetite of the Company and of its subsidiaries as well as whether any of the trigger points set by the Board against each measure had been breached.
The Committee received reports from the Risk and Compliance functions of its investment manager (ATI) and ATS during the year. The External Auditor reports on the details of any significant internal control issues relating to the Company. The Committee, in conjunction with the equivalent committees of its subsidiaries, provided independent oversight and challenge of the Risk and Compliance functions to ensure that they were providing the level of scrutiny expected by the relevant Committees and the Board.
In the third quarter of 2016, ATI adopted a revised combined risk assurance and internal audit approach overseen by its Director of Risk & Compliance. This approach to providing assurance combines the use of resource from the ATI’s Risk and Compliance team supplemented with co-sourced assurance testing from an external third party. The ATI Director of Risk and Compliance presents the output of the review assignments to the Audit and Risk Committee of ATI, with any Trust specific reports provided to the Company’s Audit and Risk Committee. The Director of Risk and Compliance has a direct reporting line to the Chairman of both the ATI and Company’s Audit and Risk Committees.
Alliance Trust Savings continues to operate a three lines of defence model, where the third line of defence is comprised of the Internal Audit function and the Board Audit and Risk Committee. The Internal Audit function, which is outsourced, provides independent assurance of the suitability and effectiveness of the firm’s risk management arrangements, including execution of responsibilities to ensure an effective risk and control environment. This is executed through the Internal Audit programme which adopts a risk based audit approach to provide a regular review of key processes and activities.
The Audit and Risk Committee performed an assessment for the purpose of this Annual Report, which considered all significant aspects of risk management and internal control arising during the period of the report, including the work of the assurance functions. The Committee then reported its findings to the Board.
As a result of the annual review and the ongoing processes for review, monitoring and reporting of the Group’s risk management and internal controls, the Board did not identify any significant weaknesses or failings and remains satisfied with the effectiveness of the Group’s risk management and internal control systems. The Board recognises that the environment in which the Company and its subsidiaries operate is complex and constantly evolving. The Board supports and guides the business in the ongoing development of the risk management tools which are in place to enhance the control environment of the business and to ensure the business continues to be well positioned to comply with operational and regulatory changes.

Alliance Trust PLC | Annual Report and Financial Accounts 2016
35
II Directors’ Report IIII
Internal controls over financial reportingOne of the risks to the Group is Financial and Prudential Reporting – the risk of misstatement of the accounting policies and ineffective controls over financial and regulatory reporting.
The Group has Financial Accounting Policies and an Accounting Manual to enable the Group to comply with all relevant accounting standards to ensure that the financial statements provide a true and fair view.
This risk and the mitigating controls are assessed regularly by management. Controls over the preparation of the consolidated accounts include but are not limited to:
• A formal review and sign-off of the annual accounts by Alliance Trust Investments’ management including verification of any statements made;
• Adoption and review of appropriate accounting policies by the Board;
• Review and approval of accounting estimates by the Board.
The Committee also considered whether the Annual Report, taken as a whole, was fair, balanced and understandable, and provides the information necessary for shareholders to assess the Company’s performance, business model and strategy. In arriving at their conclusion that the Annual Report satisfied this standard the Committee took into account the process adopted in the preparation of the document which included:
• The involvement of senior members of the management of Alliance Trust Investments in drafting meetings;
• The establishment of a working group of the Board and members of the management of Alliance Trust Investments to review drafts prior to consideration by the Committee;
• Verification of all factual statements contained within the narrative section of the Annual Report, with evidence required from the author;
• Statements which cannot be verified – typically opinions or forward-looking statements – specifically brought to the Committee’s attention;
• Independent internal review by a senior manager not involved in the preparation of the Annual Report.
The Committee considered the steps outlined above and the content of the document. After review the Committee were satisfied, taking care to ensure that the narrative parts of the Annual Report were consistent with the numerical disclosures in the audited accounts, that the Annual Report satisfied the required standard and recommended approval to the Board.
Independence of AuditorThe Committee’s policy is to allow the audit firm to be instructed to undertake non-audit work only where there is no threat to independence. Any assignment must be approved on behalf of the Committee by its Chair. Such assignments are normally put out to tender. Last year £10,500 was paid to the Auditor, in respect of work on a review of the interim audit and audit of the annual accounts of the Pension Scheme.
Each year the Committee considers the independence of the Auditor. It has done so this year and confirms the Auditor’s independence.
Effectiveness of Audit processDuring the course of the year the audit engagement partner and other members of the engagement team met with the Committee Chair and management, both together and separately. These meetings provide an opportunity for matters relating to the conduct of the audit, including the performance of the External Auditor, to be raised and addressed at the time.
Following completion of the external audit of the financial statements for the period ended 31 December 2015 an evaluation of the External Auditor’s effectiveness was undertaken. The Committee concluded that it was generally satisfied with the performance of the External Auditor. At last year’s Annual General Meeting it was identified that there had been a management error in calculating the level of Long Term Incentive Plan awards that would vest, which was not identified by the Auditor. The Committee commissioned an independent external review of both the role of management and the Auditor with a focus on ensuring that procedures were strengthened to ensure no such errors recur. Given the changes in Deloitte’s audit approach and the rotational change in audit partner, the Committee concluded that it was satisfied with the performance and independence of the External Auditor.
Appointment of AuditorFollowing a tender, Deloitte LLP were appointed after approval of the members at the 2011 Annual General Meeting. Deloitte LLP have been reappointed at subsequent AGMs and are proposed for reappointment in 2016. The recommendation to reappoint Deloitte LLP is not automatic.
In the course of the year the Chair of the Committee has met with the Auditor outwith the formal structure of Committee meetings. The Committee has considered the performance of the Auditor and is satisfied with the rigour that they apply to the audit process and have recommended the reappointment of Deloitte LLP for a further year.
In accordance with professional guidance, Deloitte LLP change the audit partner every five years. The former partner, Calum Thomson, carried out his final audit for the Trust last year and his replacement, Andrew Partridge, has been appointed. The Board considered whether, during this period of change, this was an appropriate point to carry out a tender exercise and decided to remain with Deloitte.
The Committee will continue to review the appropriate timing of a future tender.
The Company confirms its compliance with the provisions of The Statutory Audit Services for Large Companies Market Investigation (Mandatory Use of Competitive Tender Processes and Audit Committee Responsibilities) Order 2014 for the year to 31 December 2016.
Disclosure of information to AuditorThe Directors who held office at the date of approval of this Directors’ Report confirm that, so far as they are each aware, there is no relevant audit information of which the Auditor is unaware; and each Director has taken all steps they ought to have taken as a Director to make themselves aware of any relevant audit information and to establish that the Auditor is aware of that information.
Alliance Trust PLC | Annual Report and Financial Accounts 2016
36
Directors’ Report
Directors’ responsibilities statementThe Directors are responsible for preparing the financial statements in accordance with applicable law and regulations. Company law requires the Directors to prepare financial statements for each financial period. By law, the Directors are required to prepare the group financial statements in accordance with International Financial Reporting Standards (IFRSs) as adopted by the European Union (EU) and Article 4 of the IAS Regulation and have elected to prepare the parent company financial statements under IFRSs as adopted by the EU.
The financial statements are required by law and IFRSs as adopted by the EU to present fairly the financial position of the Company and the performance for that period; the Companies Act 2006 provides, in relation to such financial statements, that references in the relevant part of that Act to financial statements giving a true and fair view are references to their achieving a fair presentation.
In preparing the financial statements, the Directors are required to:
• select suitable accounting policies and then apply them consistently;
• present information, including accounting policies, in a manner that provides relevant, reliable, comparable and understandable information;
• provide additional disclosures when compliance with the specific requirements in IFRSs are insufficient to enable users to understand the impact of particular transactions, other events and conditions on the entity’s financial position and financial performance; and
• make an assessment of the Company’s ability to continue as a going concern.
The Directors are responsible for keeping proper accounting records that disclose with reasonable accuracy at any time the financial position of the Company and to enable them to ensure that its financial statements comply with the Companies Act 2006. They have general responsibility for taking such steps as are reasonably open to them to safeguard the assets of the Company and to prevent and detect fraud and other irregularities.
Under applicable law and regulations, the Directors are also responsible for preparing a Directors’ Report and a Strategic Report that complies with that law and those regulations.
Audit and Risk Committee continued

Alliance Trust PLC | Annual Report and Financial Accounts 2016
37
II Directors’ Report IIII
The Group’s business activities are set out on page 5 with the principal risks which could impact on performance set out on pages 22 and 23. The Group’s financial position and cash flows are set out on pages 54 to 58 along with an analysis of its borrowings in Note 15 on page 75. As regards Going Concern the Directors have considered both liquidity and solvency risks.
Liquidity is concerned with our ability to liquidate assets or access new sources of short-term funds in the time needed to meet our liabilities as they fall due. The majority of the Group’s assets are in listed securities on recognised stock exchanges which are readily realisable even in volatile markets. At 31 December 2016 we also had £330m of unused committed funding lines.
Solvency is concerned with our ability to meet our liabilities in full. This involves managing our capital by maintaining a business model which is capable of delivering over time a continuing economic return to our shareholders whilst absorbing the impact of any risks which crystallise. As at 31 December 2016 the Group’s total net assets were £3.3bn. Our investment policy restricts gearing to 30% of net assets at any given time (6% at 31 December 2016).
Given that most of the likely liquidity requirements such as loan payments and dividends are timetabled and as such readily foreseeable, while others such as share buybacks are subject to the Company’s discretion, the Directors are satisfied that unexpected liquidity and solvency needs are not significant relative to the size of the Company’s portfolio and that they could be readily met without compromising normal portfolio management practice.
Sensitivities to market, credit, liquidity and gearing risk are set out in Note 23 on pages 79 to 83.
The Directors, who have reviewed projections and sensitivities for the coming year, consider that the Group has adequate financial resources to enable it to continue in operational existence for at least 12 months from the date of these Accounts. Accordingly the Directors believe that it is appropriate to continue to adopt the Going Concern basis for preparing the financial statements.
Going Concern Statement
The Directors have assessed the viability of the Company and Group over a longer period than the 12 months required by the Going Concern statement. The Board concluded an appropriate period to be five years, a period which aligns with our long-term planning horizon. This assessment has been made taking account of the current position of the Group, corporate planning process and the Group’s principal risks, both current and medium and long-term, as detailed in the Strategic Report on pages 22 and 23.
The corporate planning process includes our budget, strategy cycle and consolidated Group Internal Capital Adequacy Assessment Process (“ICAAP”).
The strategy provides long-term direction and is reviewed on, at least, an annual basis, including five year forecasts showing expected financial impact. The resilience of the strategy is further tested in a series of severe but plausible downside financial scenarios as part of the annual review of the ICAAP. The ICAAP, covering a five year period, is prepared to identify and quantify the Group’s risks and level of capital which should be held to cover those risks. As part of the assessment the Board has also considered the sustainability of the Company’s dividend and it believes that our progressive dividend policy is also sustainable over the same time frame.
The ICAAP includes a risk assessment carried out to identify the principal risks that may adversely impact the Group. These include Market and Prudential, Operational, Strategic and Regulatory and Conduct Risks. An internal Risk Control Self-Assessment (RCSA) and modelling approaches are used to quantify these risks, which ensure that the Group holds sufficient regulatory capital to mitigate the impact of these risks. Alongside the corporate planning and scenario tests, the supporting risk management framework and controls have various regular early warning indicator and risk outlook signposts (trends) and triggers (events) alert the Board to the potential advent of a scenario.
This approach ensures a link to our business model and strategy and allows a robust identification and assessment of the principal risks, and mitigating actions, for the Group.
The Directors have therefore concluded, based on the extent of the corporate planning process, its strong financial position and long term investment horizon and financing, that there is a reasonable expectation that the Company and the Group have adequate resources and will continue to operate and meet its liabilities as they fall due over the period of their assessment and for the foreseeable future, taken to mean until at least 2022.
Viability Statement

Alliance Trust PLC | Annual Report and Financial Accounts 2016
38
Directors’ Report
“ Set out here is the Directors’ Remuneration Report for the year ended 31 December 2016. The Report includes our current Remuneration Policy, which was approved at the Annual General Meeting in 2016, and gives details of how this Policy has been implemented during the year. It also includes details of contractual payments made to former Executive Directors.”
Anthony BrookeChairman, Remuneration Committee
Remuneration Committee
Remuneration Policy approved on 6 May 2016The Board’s Remuneration Policy is designed to ensure that the remuneration of Directors is set at a reasonable level commensurate with the duties and responsibilities of each Director and the time commitment required to carry out their roles effectively. Remuneration will be such that the Company is able to attract and retain Directors of appropriate experience and quality. The fees paid to Directors will reflect the experience of the Board as a whole, will be fair, and will take account of the responsibilities attaching to each role given the nature of the Company’s interests, as well as the level of fees paid by comparable investment trusts. Secretarial assistance will be provided to the Chairman to assist in the execution of his duties. Additional payments may be made to Directors for time expended over and above that envisaged on appointment and for serving on or chairing Committees or for service as directors of subsidiary boards, or other additional responsibilities. The level of such fees and payments will be subject to periodic review. Directors will be reimbursed for travel and subsistence expenses incurred in attending meetings or in carrying out any other duties incumbent upon them as Directors of the Company. In the event that any such payments are regarded as taxable, Directors may receive additional payments to ensure that they suffer no net cost in carrying out their duties. The level of Directors’ fees paid will not exceed the limit set out in the Company’s Articles of Association.
The Committee also reserves the right to make payments outside the Policy in exceptional circumstances. The Committee would only use this right where it believes that this is in the best interests of the Company, and when it would be disproportionate to seek specific approval from a General Meeting. Any such payments would be fully disclosed on a timely basis.
The full text of the previous policy can be found on our website.
Consideration of Shareholder ViewsWe regularly engage with our shareholders on all aspects of performanceand governance. Due to the level of Director activity this year we havenot sought the views of our principal shareholders on remunerationissues. However, any comments received will be considered. This Reportwill be subject to approval at the Annual General Meeting and wewelcome the opportunity to discuss matters of remuneration with our shareholders at that meeting.
Non-Executive Directors’ ContractsEach Non-Executive Director’s appointment is governed by written terms which are available for inspection at the Company’s registered office and are also available at the AGM. Non-Executive Directors are appointed subject to annual re-election at the Company’s AGM and their appointment may be terminated at any time by notice given by three-quarters of the other Directors.

Alliance Trust PLC | Annual Report and Financial Accounts 2016
39
II Directors’ Report IIII
The Remuneration Committee comprises all of the members of the Board other than the Chairman.
The Committee reviewed the fees paid to Directors this year and agreed that they should remain unchanged. The Committee did, however, agree to make a one off payment of £30,000 to Karl Sternberg to reflect the time spent over and above what could reasonably have been expected on the proposed investment manager changes and other aspects of the Strategic Review. In addition to the fees received from Alliance Trust PLC where a Non-Executive Director also sits on the Board of a subsidiary company the Director is also paid a fee for that role, the level of fee is set by the subsidiary company. The Chairman’s statement on Corporate Governance refers to a review of the Committee structure which will take place in 2017. The Remuneration Committee will also review in 2017 the fee structure for Directors.
In 2016 annual fees were:
Chairman £120,000
Deputy Chairman* £80,000
Basic Non-Executive Director Fee £35,000
Chairman of Audit and Risk Committee* £11,000
Chairman of Remuneration Committee £7,500
Chairman of Audit Committee** £11,000
Chairman of Board Risk Committee*** £7,500
Chairman of Management Engagement Committee Nil
Chairman of any other Committee Nil
Senior Independent Director £5,000
Membership of Audit and Risk Committee* £3,000
Membership of Remuneration Committee £3,000
Membership of Audit Committee** £3,000
Membership of Board Risk Committee*** £3,000
Membership of Management Engagement Committee Nil
Membership of any other Committee Nil
Subsidiary Board Director’s Fee £35,000
* From 4 February 2016
** Audit Committee until 4 February 2016
*** To 4 February 2016
In 2017 annual fees will be:
Chairman* £120,000
Deputy Chairman £80,000
Basic Non-Executive Director Fee and payable to each Director (other than the Chairman) £35,000
Committee Membership** £6,000
Chairman of Audit and Risk Committee*** £8,000
Chairman of Remuneration Committee*** £4,500
Senior Independent Director £5,000
Subsidiary Board Director’s Fee^ £35,000
* Inclusive of membership of all Board Committees
** All Directors are members of all Board Committees and this is a composite fee for all Board Committees
*** This fee is additional to the Committee membership fee
^ Payable to Chris Samuel in respect of his appointment to Alliance Trust Investments and to Gregor Stewart in respect of his appointment to Alliance Trust Savings
Non-Executive Directors’ Fees

Alliance Trust PLC | Annual Report and Financial Accounts 2016
40
Directors’ Report
Implementation Report – Current Remuneration
Relative importance of spend on payThe chart below shows, in respect of this and the preceding financial year, the actual expenditure of the Company on remuneration and distributions to shareholders by way of dividend and share buybacks. Last year we provided details of remuneration paid to Group (Alliance Trust PLC and Alliance Trust Services Limited) employees including directors. In 2016 there were no Group employees and accordingly the remuneration figure for 2016 only includes payments made to Directors and former Directors.
Single total figure of remuneration (audited)
£000 2016 2015
Non-Executive Director*
Company Fees
Fees for Subsidiary Company
appointment TotalCompany
Fees
Fees for Subsidiary Company
appointment Total
Lord Smith 109 – 109 – – –
Anthony Brooke 46 – 46 23 – 23
Clare Dobie 25 – 25 – – –
John Hylands 18 29 47 51 – 51
Rory Macnamara 41 – 41 23 – 23
Susan Noble** 5 7 12 48 – 48
Chris Samuel 41 35 76 10 – 10
Karl Sternberg 76 – 76 10 – 10
Gregor Stewart 106*** 29 135 59*** – 59
*Karin Forseke and Alistair Kerr both resigned as Directors on 1 January 2016. They received no payments in 2016. **The fees shown represent only those paid for the period that Susan Noble was a Non-Executive Director of Alliance Trust PLC. ***Includes payment for part of year as Interim Chairman to cover the period of transition between the Board Meeting held in November 2015 and Lord Smith’s appointment in February 2016.
Directors Shareholdings (audited)All Directors are required to hold 3,000 shares in the Company.Details of the shareholdings of all Directors and their connected persons, together with details of shares acquired, are shown below. None of these shares are subject to performance conditions. The Company has issued no options to subscribe for shares.
For most of 2016, as a result of their involvement in the Strategic Review, the Directors were unable to add to their holdings.
Directors’shareholdings
As at 1 Jan 2016 or date of
appointment if later
As at 31 Dec 2016
or date of leaving
if earlier
Acquired between
31 Dec 2016 – 28 Feb 2017
Lord Smith nil 18,000 nil
Anthony Brooke 3,000 3,000 nil
Clare Dobie nil 3,030 nil
Karin Forseke 108,576 108,576 –
Katherine Garrett-Cox** 446,975 450,158 –
John Hylands*** 86,567 87,771 –
Alistair Kerr* 8,875 8,875 –
Rory Macnamara 3,000 3,030 –
Susan Noble** 15,392 15,512 –
Chris Samuel 5,000 5,096 48
Karl Sternberg 3,000 3,041 37
Gregor Stewart 24,758 24,843 84
*Resigned 1 January 2016 **Resigned 3 February 2016 ***Resigned 6 May 2016†Rory Macnamara passed away on 17 December 2016
(£m)
*This includes payments made to the former Chief Executive Officer, former Chief Financial Officer and the Directors. The single figure of remuneration for Alan Trotter for 2016 was £198,000. Remuneration prior to 2016 also included payments made to other employees in the Group.
**This includes dividends paid in the year and does not include the value of the third interim dividend for 2016 which was paid on 3 January 2017.
2015 2016
50
100
150
200
1.9 66
.3**
195.
8
25.0 76
.8
136.
5
Remuneration* Dividend Buybacks

Alliance Trust PLC | Annual Report and Financial Accounts 2016
41
II Directors’ Report IIII
0
100
200
300
31 Jan 2009 31 Jan 2010 31 Jan 2011 31 Dec 2011 31 Dec 2012 31 Dec 2013 31 Dec 2014 31 Dec 2015 31 Dec 2016†
Performance graphThe graph below shows the Total Shareholder Return (TSR) for holders of Alliance Trust PLC Ordinary Shares, measured against the MSCI All Country World Index rebased to 100 at 31 January 2009. The Company believes that this is the most appropriate index as it represents the performance of listed equities across a range of global markets. The Company’s equity portfolio is global in nature and at the year end comprised 93% of the Net Asset Value.
Chief Executive Officer’s remunerationThe table below shows the remuneration for the Director undertaking the role of Chief Executive Officer during each of the last eight financial periods. The Company ceased to have Executive Directors on 3 February 2016 when Katherine Garrett-Cox left the Board. Katherine-Garrett-Cox was still entitled to receive payments due under her contract during 2016.
31 Jan 2010 31 Jan 2011† 31 Dec 2011 31 Dec 2012 31 Dec 2013 31 Dec 2014 31 Dec 2015 31 Dec 2016
Single figure of remuneration £692,484 £700,232 £1,037,175 £1,800,326 £1,378,444 £1,342,859 £1,376,076 £1,213,577
Annual bonus (as percentage of maximum opportunity) 58.4% 50.0% 90.3% 81.5% 57.5% 85% 60.7% nil
LTIP vesting (as percentage of maximum opportunity) 0% 0% 0% 51.7% 33.9% 12.5% 27.1% 38.9%
†11 months 31 January to 31 December 2011.
The Company no longer has a Chief Executive Officer and all payments made in 2016 reflected those required to be made under her contract. The total remuneration paid to the Chief Executive Officer was 11% less in 2016 than it was in the previous year. As there were no employees within the Group (Alliance Trust PLC and Alliance Trust Services Limited) during 2016 there is no comparator for any increase in remuneration for employees.
Voting at Annual General MeetingAt the Annual General Meeting held on 6 May 2016, votes cast by proxy and at the meeting in respect of Directors’ remuneration policy and report were as follows
Resolution Votes for %Votes
Against %Total
votes castVotes withheld
(abstentions)
Directors’ remuneration report (excluding remuneration policy) 180,793,307 97.44 4,752,612 2.56 185,545,919 1,800,624
Approval of Remuneration Policy 182,111,330 98.29 3,164,092 1.71 185,275,422 2,039,521
Alliance Trust TSR MSCI ACWI
AdvisorsThe Remuneration Committee received no independent advice in respect of remuneration during the year.
†11 months 31 January to 31 December 2011.

Alliance Trust PLC | Annual Report and Financial Accounts 2016
42
Directors’ Report
Implementation Report – Historic Remuneration
The information in this part of the Implementation Report details the payments made in 2016 to Katherine-Garrett-Cox, the former Chief Executive Officer who left the Board on 3 February 2016, and also to Alan Trotter the former Chief Financial Officer who left on 30 September 2015.
Executive Directors’ Service ContractsThe Executive Directors had service contracts which could be terminated on twelve months’ notice from the Company or six months’ notice from the Director. Service contracts did not contain a default normal retirement age.
Share-based entitlements granted to an Executive Director under the Group’s share plans are based on the relevant plan rules. The default position was that any outstanding awards lapsed on cessation of employment. However, in certain prescribed circumstances, such as death, injury or disability, redundancy, retirement or other circumstances at the discretion of the Committee (taking into account the individual’s performance and the reasons for their departure), ‘good leaver’ status could be applied. There have been no accelerated payments. Awards are normally pro-rated for length of service.
The rules of the Company’s Long-Term Incentive Plan contain a change of control clause, which crystallises the share awards, subject to pro-rating of awards within a three year cycle based on days worked and on the participant giving up their entitlement for replacement shares in any new company.
Contracts contained specific mitigation provisions should they be terminated. These mitigation provisions are structured to provide monthly payments during the notice period against which any income received during the period is offset. The monthly payment is based on the then current salary, pension allowance and benefits. A Director’s service contract could be terminated without notice and without any further payment or compensation, except for sums accrued up to the date of termination, on the occurrence of certain events such as gross misconduct.
Payments to Former DirectorsIn last year’s Implementation Report we detailed the payments to which both Katherine-Garrett-Cox and Alan Trotter were entitled and here we report on the payments actually made to them during 2016. All of these payments were within the terms of the Company’s Remuneration Policy which had been approved by shareholders on 1 May 2014. Details of this can be found on our website. No discretionary payments were made to either of the former Directors in 2016 and all payments made were in accordance with those detailed in the 2015 Remuneration Implementation Report.
Katherine Garrett-Cox
Payment
Redundancy £5,225
Compensation payment for any claim £78,335
Bonus in respect of year ending 31 December 2015 £410,000
Bonus in respect of year ending 31 December 2016 Nil
Salary and payments in respect of pension during notice period £532,158
Payment in lieu of contractual benefits £9,007
LTIP awards made in 2016 None
Value of LTIP awards vested in 2016 £379,079
Value of LTIP awards vesting in 2017* £587,352
AESOP award £1,500
Alan Trotter
Payment
Redundancy £3,563
Compensation payment for any claim £66,437
Bonus in respect of year ending 31 December 2015 £110,000
Bonus in respect of year ending 31 December 2016 Nil
Salary and payments in respect of pension during notice period £125,840
Contractual Benefits £872
LTIP awards made in 2016 None
Value of LTIP awards vested in 2016 £198,380
Value of LTIP awards vesting in 2017* £234,262
AESOP award £1,500
*based on a share price of £5.943 being the average share price in the last quarter of 2016.
Single total figure of remuneration (audited)
£000 2016 2015
Non-Executive Director Salary
TaxableBenefits**
AnnualBonus†
Long Term
Awards^ Pension*** Total SalaryTaxableBenefits**
AnnualBonus†
Long Term
Awards Pension*** Total
Katherine Garrett-Cox 425# 93 2 587 106 1,213 450 23 412 379* 112 1,376
*incorrectly reported in 2015 Accounts as £438,000.**includes redundancy, compensation payments, payment in lieu of contractual benefits as well as accommodation allowance, medical and life assurance***this is a cash payment instead of a pension contribution†includes AESOP award (£1,500)^based on a share price of £5.943 being the average share price in the last quarter of 2016#under the terms of the agreement reached with Katherine Garrett-Cox a full payment of salary was not made for the month of March 2016

Alliance Trust PLC | Annual Report and Financial Accounts 2016
43
II Directors’ Report IIII
Long-Term Incentive PlansNo awards were made under the LTIPs in respect of the financial years ended 31 December 2015 and 31 December 2016 and no further awards will be made. Awards made in prior years will still be paid subject to the rules of the Plan and to the achievement of performance targets.
The table below shows the payout for the awards which were made in 2014 and will vest in 2017, based on the three year performance period ending 31 December 2016. An additional holding period of two years has been applied to these awards. This applies to both shares purchased from the deferred bonus and those vesting after the end of the three year performance period.
Peer Group^ Ranking out of 22 %
TSR Rank* 8 TSR payout 77.82
NAV Rank* 12 NAV payout 0.00
Combined payout 38.91
^ The Peer Group can be found on our website www.alliancetrust.co.uk*Calculated using the average of the Company’s NAV in respect of weekdays (excluding Saturdays and Sundays) falling during the 30 day period ending on the day before the start and end of the Performance Period. This has been calculated using data as at 26 January 2017, provided by Factset.
Details of the awards made to the Executive Directors can be found on the next page. As both Katherine Garrett-Cox and Alan Trotter were made redundant, their existing awards under the LTIP did not lapse on cessation of employment but will vest subject to reduction/pro rating as set out under the Plan’s rules. The rules of the LTIP provide that the number of shares that will vest will be proportionate to the number of days within the three year performance period that the individual was an eligible employee; in the case of Katherine Garrett-Cox this was until 11 March 2016 and in the case of Alan Trotter until 3 June 2016.
An error was made in the calculation of LTIP vesting as reportedin the 2015 Annual Report. This was identified and corrected beforeany payments were made so no one received more than they weredue. The error was the inclusion of one Investment Trust (Hansa) which was not in the peer group for the whole of the three year period (moving into the peer group in April 2014). This meant that calculations of the payments were based on a group of 35 rather than 34 Trusts. This led to a higher proportion of the award vesting (65.02% rather than the 54.14% that was actually due). Our ranking was 15th under both calculations. This meant a reduction in the value of the LTIP award as reported in the 2015 Accounts from £438,000 to £379,000 for Katherine Garrett-Cox and from £229,000 to £198,000 for Alan Trotter. This error had not been not identified by our managers when they prepared the calculation and was not identified by our Auditors in the course of their audit. We commissioned an external review of the process to prevent a recurrence. The LTIP awards reported this year have been subject to significant additional scrutiny.
All Employee Share Ownership PlanExecutive Directors also participated in the Company’s All Employee Share Ownership Plan (AESOP). The award made in 2016 for the previous financial year was for shares to the values of £1,500. This award was made to all full time participants in the AESOP.
Summary of 2014 Policy: Long-Term Incentive PlansThere were two categories of awards that Executive Directors could receive. These were:
Matching Awards: these entitled the participant to receive shares at nil cost with the number of shares being calculated with reference to the amount of the individual’s deferred annual bonus which was used to purchase shares in the Company and which were deposited in the plan. The maximum that could be received was twice the number of shares that could be purchased with the gross value of the annual bonus.
Performance Awards: these were based on a multiple of salary.The maximum number of shares which could be awarded was calculated on twice the annual salary of the participant at the date of the award.
Both awards are based on a combination of two separate performance measures – one relating to growth in NAV and another to TSR – over three consecutive financial years and then compared to a comparator group comprising global investment trusts (these can be found on the Company website).
TSR/NAV Performance against Peer Group % of share awards that vest
Below Median 0
Median 25
Between Median and Top Quartile 25-100
Top Quartile 100
The Committee can make minor changes to the performance conditions. Any significant changes would require shareholder approval.
Vesting between median and top quartile is based on a vesting curve. A vesting curve was chosen to align the interests of LTIP participants to those of shareholders reflecting the belief that consistent median to top quartile performance would, over time, lead to top quartile performance without incentivising excessive risk taking.
Peer Group Ranking
0
25
50
Vest
ing
(%)
75
100
Q4 Q3 Q2 Q1
LTIP awards (from 2011 onwards)
Peer Group Ranking

Alliance Trust PLC | Annual Report and Financial Accounts 2016
44
Directors’ Report
Long-Term Incentive Plan Awards (audited)This table provides detail of awards made to the former Executive Directors under the Long-Term Incentive Plan in the year ended 31 December 2016 and earlier years. All awards are subject to performance conditions as described on the preceding page. If the minimum performance condition is met 12.5% of the awards detailed in the table below will vest. No awards were made in 2016.
Katherine Garrett-Cox
Scheme and year of awardAt 1 Jan
2016
Awards granted in year
Awards vested in year
Awards lapsed in year
At 31 Dec 2016
Market price of share on
date of award Vesting date
LTIP 6 May 2015 (Matching Award)
223,471 – – – 223,471 £5.07 6 May 2020
LTIP 6 May 2015 (Performance Award)
177,514 – – – 177,514 £5.07 6 May 2020
LTIP 11 April 2014 (Matching Award)
160,086 – 45,524* (will vest)
– 160,086 £4.537 11 April 2017
LTIP 11 April 2014 (Performance Award)
187,458 – 53,307* (will vest)
– 187,458 £4.537 11 April 2017
LTIP 16 April 2013 (Matching Award)
75,273 – 20,376 54,897 – £4.336 16 April 2016
LTIP 16 April 2013 (Performance Award)
196,148 – 53,097 143,051 – £4.336 16 April 2016
*The number of shares that will vest has been reduced to reflect the fact that the former Director was not an eligible employee for the whole of the three year performance period.
Alan Trotter
Scheme and year of awardAt 1 Jan
2016
Awards granted in year
Awards vested in year
Awards lapsed in year
At 31 Dec 2016
Market price of share on
date of award Vesting date
LTIP 6 May 2015 (Matching Award)
42,475 – – – 42,475 £5.07 6 May 2020
LTIP 6 May 2015 (Performance Award)
96,646 – – – 96,646 £5.07 6 May 2020
LTIP 11 April 2014 (Matching Award)
26,275 – 8,255* (will vest)
– 26,275 £4.537 11 April 2017
LTIP 11 April 2014 (Performance Award)
99,184 – 31,163* (will vest)
– 99,184 £4.537 11 April 2017
LTIP 16 April 2013 (Matching Award)
38,256 – 10,356 27,900 – £4.336 16 April 2016
LTIP 16 April 2013 (Performance Award)
103,782 – 28,094 75,688 – £4.336 16 April 2016
*The number of shares that will vest has been reduced to reflect the fact that the former Director was not an eligible employee for the whole of the three year performance period.
ApprovalThe Remuneration Report comprising pages 38 to 44 and the Implementation Report, comprising pages 40 to 44, have been approved by the Board and signed on its behalf by
Anthony BrookeChairman, Remuneration Committee23 March 2017
Implementation Report – Historic Remunerationcontinued

Alliance Trust PLC | Annual Report and Financial Accounts 2016
45
II Directors’ Report IIII
Other Governance
Re-election of DirectorsDetails of the current Directors can be found on pages 26 and 27. Clare Dobie was appointed during the year and her appointment falls to be confirmed by shareholders at the Annual General Meeting.
The Board has decided that all of the Directors will be subject to re-election every year.
The individual performance of each Director and their ongoing suitability for election or re-election was considered and endorsed by the Nomination Committee. All are recommended for election or re-election at the forthcoming Annual General Meeting. Each of our Directors has confirmed that they remain committed to their role and has sufficient time available to meet what is expected of them.
Directors in 2016Name Designation Appointed
Lord Smith Chairman 3/2/16
Anthony Brooke Non-Executive Director 24/6/15
Clare Dobie Non-Executive Director 26/5/16
Karin Forseke* Chairman 1/3/12
Katherine Garrett-Cox** Chief Executive Officer 1/5/07
John Hylands*** Non-Executive Director 22/2/08
Alastair Kerr* Non-Executive Director 1/10/12
Rory Macnamara† Non-Executive Director 24/6/15
Susan Noble** Non-Executive Director 11/7/12
Chris Samuel Non-Executive Director 23/9/15
Karl Sternberg Non-Executive Director 23/9/15
Gregor Stewart Non-Executive Director 1/12/14
*Resigned 1 January 2016 **Resigned 3 February 2016 ***Resigned 6 May 2016†Rory Macnamara passed away on 17 December 2016
Major shareholdersAs at 21 March 2017 the Company had received the following notification from shareholders holding an interest in more than 3% of the voting rights of the ordinary shares in issue of the Company:
Shareholder Nature of interest Number of shares
DC Thomson & Company Limited Shares 16,000,000 (4%)
The largest shareholder in the Company is the nominee company for Alliance Trust Savings which holds its shares on behalf of over 21,000 customers.
Alliance Trust Savings Nominees Limited 121,164,239 (33%)
Alliance Trust PLC | Annual Report and Financial Accounts 2016
46
Directors’ Report
Other Governance continued
Directors’ and Officers’ indemnificationThe Company provides insurance for legal action brought against its Directors as a consequence of their position. In addition separate deeds of indemnity have been agreed with each Director indemnifying them as permitted by company law. The indemnity and insurance does not extend to cover claims brought by the Company itself which are upheld by the Courts, nor to criminal fines or penalties.
Access to adviceAll Directors have access to independent professional advice if necessary.
Relationship with shareholdersAll Directors normally attend the AGM where they have the opportunity to meet shareholders. Meetings also take place throughout the year with major and institutional shareholders.
Investment Trust StatusHM Revenue and Customs have confirmed that Alliance Trust PLC has investment trust status for all financial periods from 1 January 2012.
Alternative Investment Fund Managers DirectiveUntil 3 February 2016 the Company was approved by the Financial Conduct Authority as a manager under the Directive. Since that date the manager has been Alliance Trust Investments Limited. It is intended that upon completion of the sale of Alliance Trust Investments that Towers Watson Investment Management (Ireland) Limited will be appointed manager.
The Company has appointed National Westminster Bank PLC as its Depositary under the Directive for the purpose of strengthening the arrangements for the safe custody of assets. Regulatory disclosures, including the Company’s Investor Disclosure Document, are provided
on the Company’s website at www.alliancetrust.co.uk. Disclosures on Remuneration as required under the AIFMD can also be found on our website.
Investment Management AgreementUnder the terms of the proposed Management Agreement with Towers Watson Investment Management (Ireland) Limited (‘the AIFM’), the AIFM will be entitled to a management fee together with reimbursement of reasonable expenses incurred. The fee equates to the sum of (i) £1.5m per annum (increasing in line with UK Consumer Prices Index (‘CPI’) each year) plus 0.055% per annum of the market capitalisation of the Company after deduction of (a) the value of non-core assets, (b) the value of the Company’s subsidiaries; (ii) such fees as are agreed from time to time by the Company in respect of third party managers; and (iii) fees paid to the managers/administrators of non-core assets.
The AIFM will also receive a fixed administration fee in respect of the provision of certain underlying administration services which is capped at £0.92m per annum (increasing in line with the CPI).The Management Agreement may be terminated by either party on not less than six months’ notice or, if terminated by the Company earlier, upon the payment of compensation. The Management Agreement may also be terminated earlier by either party with immediate effect and without compensation on the occurrence of certain events. On termination the AIFM is entitled to receive its fees pro rata to the date of termination.
Under the investment management agreement with Alliance Trust Investments (ATI) they were entitled to receive a fee for its services equal to 0.35% of the Company’s adjusted net asset value (excluding holdings in ATI managed funds and the fair value of ATS and ATI). The agreement could also be terminated by either ATI or the Company giving to the other not less than six months’ written notice.
Board and Committee attendancesIn addition to the scheduled Board and Committee meetings below, all or some of the Directors met on over 20 occasions to consider matters arising between the scheduled meetings and to progress the Strategic Review. As reported on page 31, the Board undertook the work of the Management Engagement Committee during the year so no separate Management Engagement Committee meetings took place.
Meeting attendances Board Audit and Risk Remuneration Nomination
Director Actual Possible Actual Possible Actual Possible Actual Possible
Lord Smith 6 6 - - - - 2 2
Anthony Brooke 6 6 5 5 2 2 2 2
Clare Dobie 3 3 2 2 1 1 0 0
Katherine Garrett-Cox* 0 0 - - - - - -
John Hylands* 3 3 3 3 1 1 1 1
Rory Macnamara 4 6 3 5 1 2 1 2
Susan Noble** 0 0 0 0 0 0 0 0
Chris Samuel 6 6 4 4 2 2 2 2
Karl Sternberg 6 6 4 4 2 2 2 2
Gregor Stewart 6 6 5 5 2 2 2 2
*Resigned 6 May 2016 **Resigned 3 February 2016

Alliance Trust PLC | Annual Report and Financial Accounts 2016
47
II Directors’ Report IIII
Director developmentEvery new director receives an individually tailored induction. The Board as a whole received updates on Market Abuse Regulations and other relevant topics.
Share capital and waiver of dividendsThe Company’s issued share capital as at 31 December 2016 comprised 492,703,932 Ordinary 2.5p shares of which 698,062 have been acquired by the Trustee of an Employee Benefit Trust (‘the Trustee’) with funds provided by the Company in connection with its employee share plans. The Trustee has elected to waive all dividends payable in respect of those shares. The Trustee holds a further 226,161 shares deposited by recipients of awards under the LTIP. Each Ordinary share of the Company is entitled to one vote but the Trustee does not vote in respect of the shares held by it on behalf of the Company.
In the course of the year the Company acquired and cancelled 37,056,046 shares for £195m.
There are no preference shares or shares held in treasury.
Agreement in respect of voting rightsThere are no agreements in respect of voting rights.
Share buyback authorityAt the last Annual General Meeting the shareholders renewed the authority for them repurchase of up to 14.99% of the issued shares and also authorised that shares repurchased may be held in treasury. These authorities fall to be renewed at the next Annual General Meeting. The Company made use of this provision during the course of the year as detailed above. The Company will seek the renewal of these authorities at the Annual General Meeting. The Company also received authority from the shareholders at the General Meeting on 28 February 2017 to repurchase up to a further 5% of the shares in issue on that date. This authority will lapse at the AGM in April 2017.
Conflicts of interestThe Directors have previously provided details of all interests which potentially could cause a conflict of interest to arise. The unconflicted Directors in each case noted the declarations by the Directors of their other interests and confirmed that at that time none of the interests disclosed were reasonably likely to give rise to a conflict. An annual review of all interests was undertaken as part of the year end process and this was considered by the Board in February 2017. Procedures are in place to allow Directors to request authority should it be required outwith the normal Board meeting schedule.
Annual General MeetingIn addition to formal business, there will be the opportunity for questions to be put to the Directors. This year, in addition to the normal business there will be proposals to:
• renew the share buyback authority and requesting the power to hold shares purchased under that authority to be held in Treasury or cancelled with power to reintroduce any shares held in Treasury to the market but not at a discount to net asset value; and
• confirm the notice period for convening general meetings other than Annual General Meeting.
At the meeting we hope that shareholders will have the opportunity to meet with some of our new equity managers.
Greenhouse gas (GHG) emissionsOur mandatory disclosure of total GHG emissions data for the year ended 31 December 2016 can be found on page 25. We report there on all of the emission sources required under the Companies Act 2006 (Strategic Report and Directors’ Reports) Regulations 2013. These sources fall within our consolidated financial statements. We do not have responsibility for any emission sources that are not included in our consolidated financial statements.
Our carbon footprint has been calculated based on the Defra Environmental Reporting Guidelines (including mandatory greenhouse gas emissions reporting guidance). We have adopted an operational control approach. The emissions reported on page 25 have been verified by Carbon Footprint Limited.
Report of Directors and Responsibility StatementThe Report of the Directors, including the Directors’ responsibility statement, on pages 28 to 36, the going concern statement onpage 37 and pages 45 to 47 of the Annual Report and Accounts has been approved by the Board.
We confirm that to the best of our knowledge:
• the financial statements, prepared in accordance with International Financial Reporting Standards as adopted by the European Union, give a true and fair view of the assets, liabilities, financial position and profit or loss of the Company and the undertakings included in the consolidation taken as a whole;
• the Strategic Report includes a fair review of the development and performance of the business and the position of the Company and the undertakings included in the consolidation taken as a whole, together with a description of the principal risks and uncertainties that they face; and
• the Annual Report and financial statements, taken as a whole, are fair, balanced and understandable and provide the information necessary for shareholders to assess the Company’s position, performance, business model and strategy.
Lord Smith of KelvinChairman23 March 2017

Alliance Trust PLC | Annual Report and Financial Accounts 2016
48
Financial Statements
Opinion on financial statements of Alliance Trust PLCIn our opinion the financial statements:
• give a true and fair view of the state of the Group’s and of the Company’s affairs as at 31 December 2016 and of the Group’s and the Company’s profit for the year then ended;
• have been properly prepared in accordance with International Financial Reporting Standards (IFRSs) as adopted by the European Union; and
• have been prepared in accordance with the requirements of the Companies Act 2006 and, as regards the group financial statements, Article 4 of the IAS Regulation.
The financial statements that we have audited comprise the Group and Company:
• income statements;• statements of comprehensive income;• statements of changes in equity;• balance sheets;• cash flow statement; and • related notes 1 to 27.
The financial reporting framework that has been applied in their preparation is applicable law and IFRSs as adopted by the European Union.
Summary of our audit approach
Key risks The key risks that we identified in the current year were:
• valuation and ownership of listed investments; and• valuation of unlisted investments.
All risks within this report are in line with prior year.
Materiality The materiality that we used in the current year was £32.8m which was determined on the basis of 1% of net asset value.
Significant changes in our approach
There have been no significant changes to our audit approach since the prior year.
Going concern and the directors’ assessment of the principal risks that would threaten the solvency or liquidity of the group
As required by the Listing Rules we have reviewed the directors’ statement regarding the appropriateness of the going concern basis of accounting contained within note 2 to the financial statements and the directors’ statement on the longer-term viability of the Group contained within the Directors Report on page 37.
We are required to state whether we have anything material to add or draw attention to in relation to:
• the directors’ confirmation on page 37 that they have carried out a robust assessment of the principal risks facing the Group, including those that would threaten its business model, future performance, solvency or liquidity;
• the disclosures on pages 22 to 23 that describe those risks and explain how they are being managed or mitigated;
• the directors’ statement in note 2 to the financial statements about whether they considered it appropriate to adopt the going concern basis of accounting in preparing them and their identification of any material uncertainties to the Group’s ability to continue to do so over a period of at least twelve months from the date of approval of the financial statements; and
• the directors’ explanation on page 37 as to how they have assessed the prospects of the Group, over what period they have done so and why they consider that period to be appropriate, and their statement as to whether they have a reasonable expectation that the Group will be able to continue in operation and meet its liabilities as they fall due over the period of their assessment, including any related disclosures drawing attention to any necessary qualifications or assumptions.
We confirm that we have nothing material to add or draw attention to in respect of these matters.
We agreed with the directors’ adoption of the going concern basis of accounting and we did not identify any such material uncertainties.
However, because not all future events or conditions can be predicted, this statement is not a guarantee as to the Group’s ability to continue as a going concern.
Independent Auditor’s Report to the members of Alliance Trust PLC

Alliance Trust PLC | Annual Report and Financial Accounts 2016
49
Alliance Trust PLC | Annual Report and Financial Accounts 2016
49
III Financial Statements III
Independence
We are required to comply with the Financial Reporting Council’s Ethical Standards for Auditors and confirm that we are independent of the Group and we have fulfilled our other ethical responsibilities in accordance with those standards.
We confirm that we are independent of the Group and we have fulfilled our other ethical responsibilities in accordance with those standards. We also confirm we have not provided any of the prohibited non-audit services referred to in those standards.
Our assessment of risks of material misstatementThe assessed risks of material misstatement described below are those that had the greatest effect on our audit strategy, the allocation of resources in the audit and directing the efforts of the engagement team. These matters were addressed in the context of our audit of the financial statements as a whole, and in forming our opinion thereon, and we do not provide a separate opinion on these matters.
Risk Title Risk Description How the scope of our audit responded to the risk
Key observations
Valuation and ownership of listed investments
Listed investments represent the most significant number on the balance sheet and are the main driver of the Group’s performance. Listed investments £3,257m (2015: £3,089m) represented 92% of total assets of the Group at 31 December 2016 (2015: 87%) (see notes 9 and 23).
There is a risk that the prices quoted in respect of the listed investments held by the Group may not be reflective of fair value.
There is a risk over the recording and custody of listed investments and whether listed investments recorded are the property of the Group.
We assessed the design and implementation controls over valuation and existence of listed investments.
We reviewed Controls Reports relating to Custody and Investment Accounting provided by Bank of New York Mellon.
We confirmed 100% of the portfolio of listed investments to confirmations received directly from the custodian and depositary.
We confirmed 100% of the valuation of the listed investments to independent pricing sources.
No misstatements were identified which required reporting to those charged with governance in regards to the valuation of the listed investments.
We did not identify any differences when agreeing the Group’s investment portfolio to the confirmation received directly from the custodian and depositary.

Alliance Trust PLC | Annual Report and Financial Accounts 2016
50
Financial Statements
Risk Title Risk Description How the scope of our audit responded to the risk
Key observations
Valuation of unlisted investments
Unlisted investments of £217m (2015: £221m) are valued at the Directors’ best estimate of fair value using the guidelines and methodologies on valuation published by the International Private Equity and Venture Capital Association and, where relevant the use of external valuers and may take account of recent arm’s length transactions. (see Audit and Risk Committee report on page 33 and notes 9 and 23)
There are key inputs to the valuation calculations which reflect the Directors, external valuers and Investment Manager’s judgement (see note 23.8).
There is a risk that the application of an inappropriate valuation methodology and/or the use of inappropriate assumptions could result in the valuation of unlisted investments being materially misstated.
We assessed the design and implementation of controls around the valuation of unlisted investments. In addition we tailored our substantive testing to reflect the different categories of unlisted investments held in the portfolio (see note 23).
Subsidiaries
We reviewed and challenged management’s and external valuations for a sample of unlisted investments, focusing on the appropriateness of the valuation methodology and assumptions used within the calculations (e.g. cash flow projections; growth projections; discount rate used). We also considered how recent developments and actual performance are reflected in the future projections. As part of our testing we liaised with our internal valuation experts.
Unlisted Equities
We obtained valuation papers for the unlisted investments and reviewed the minutes of the Valuation Committee. We considered and challenged whether the assumptions made by the Manager were reasonable and confirmed that the unlisted investments had been valued on a consistent basis.
No misstatements were identified which required reporting to those charged with governance in regards to the valuation of the unlisted investments.
Our application of materialityWe define materiality as the magnitude of misstatement in the financial statements that makes it probable that the economic decisions of a reasonably knowledgeable person would be changed or influenced. We use materiality both in planning the scope of our audit work and in evaluating the results of our work.
We determined materiality for the Group to be £32.8m (2015: £29.5m), which is 1% (2015: 1%) of net assets. Net assets has been chosen as a benchmark as it is considered the most relevant benchmark for investors and is a key driver of shareholder value.
We agreed with the Audit and Risk Committee that we would report to the Committee all audit differences in excess of £657,000 (2015: £589,000), as well as differences below that threshold that, in our view, warranted reporting on qualitative grounds. We also report to the Audit and Risk Committee on disclosure matters that we identified when assessing the overall presentation of the Financial Statements.
An overview of the scope of our auditThere were no changes to the scope of our audit since the prior year. Our audit was scoped by obtaining an understanding of the entity and its environment, including internal control, and assessing the risks of material misstatement. Our Group audit scope included the audit of all subsidiaries and these were subject to a full scope audit for the year ended 31 December 2016 and was performed directly by the audit engagement team Audits were performed for local statutory purposes at a local materiality level calculated by reference to the scale of the business concerned.
As part of our audit we assessed the controls in place at Alliance Trust Investments Limited (“the Manager”) who prepares the financial statements of the Group.
Independent Auditor’s Report to the members of Alliance Trust PLC continued

Alliance Trust PLC | Annual Report and Financial Accounts 2016
51
Alliance Trust PLC | Annual Report and Financial Accounts 2016
51
III Financial Statements III
Opinion on other matters prescribed by the Companies Act 2006In our opinion, based on the work undertaken in the course of the audit:
• the part of the Directors’ Remuneration Report to be audited has been properly prepared in accordance with the Companies Act 2006;
• the information given in the Strategic Report and the Directors’ Report for the financial year for which the financial statements are prepared is consistent with the financial statements; and
• the Strategic Report and the Directors’ Report have been prepared in accordance with applicable legal requirements.
In the light of the knowledge and understanding of the Group and its environment obtained in the course of the audit, we have not identified any material misstatements in the Strategic Report and the Directors’ Report.
Matters on which we are required to report by exception
Adequacy of explanations received and accounting records
Under the Companies Act 2006 we are required to report to you if, in our opinion:
• we have not received all the information and explanations we require for our audit; or
• adequate accounting records have not been kept by the Company, or returns adequate for our audit have not been received from branches not visited by us; or
• the Company financial statements are not in agreement with the accounting records and returns.
We have nothing to report in respect of these matters.
Directors’ remuneration
Under the Companies Act 2006 we are also required to report if in our opinion certain disclosures of directors’ remuneration have not been made or the part of the Directors’ Remuneration Report to be audited is not in agreement with the accounting records and returns.
We have nothing to report arising from these matters.
Corporate Governance Statement
Under the Listing Rules we are also required to review part of the Corporate Governance Statement relating to the Company’s compliance with certain provisions of the UK Corporate Governance Code.
We have nothing to report arising from these matters.
Our duty to read other information in the Annual Report
Under International Standards on Auditing (UK and Ireland), we are required to report to you if, in our opinion, information in the annual report is:
• materially inconsistent with the information in the audited financial statements; or
• apparently materially incorrect based on, or materially inconsistent with, our knowledge of the Group acquired in the course of performing our audit; or
• otherwise misleading.
In particular, we are required to consider whether we have identified any inconsistencies between our knowledge acquired during the audit and the directors’ statement that they consider the annual report is fair, balanced and understandable and whether the annual report appropriately discloses those matters that we communicated to the Audit and Risk Committee which we consider should have been disclosed.
We confirm that we have not identified any such inconsistencies or misleading statements.
Respective responsibilities of directors and auditorAs explained more fully in the Directors’ Responsibilities Statement, the directors are responsible for the preparation of the financial statements and for being satisfied that they give a true and fair view. Our responsibility is to audit and express an opinion on the financial statements in accordance with applicable law and International Standards on Auditing (UK and Ireland). We also comply with International Standard on Quality Control 1 (UK and Ireland). Our audit methodology and tools aim to ensure that our quality control procedures are effective, understood and applied. Our quality controls and systems include our dedicated professional standards review team and independent partner reviews.
This report is made solely to the Group’s members, as a body, in accordance with Chapter 3 of Part 16 of the Companies Act 2006. Our audit work has been undertaken so that we might state to the company’s members those matters we are required to state to them in an auditor’s report and for no other purpose. To the fullest extent permitted by law, we do not accept or assume responsibility to anyone other than the company and the company’s members as a body, for our audit work, for this report, or for the opinions we have formed.

Alliance Trust PLC | Annual Report and Financial Accounts 2016
52
Scope of the audit of the financial statementsAn audit involves obtaining evidence about the amounts and disclosures in the financial statements sufficient to give reasonable assurance that the financial statements are free from material misstatement, whether caused by fraud or error. This includes an assessment of: whether the accounting policies are appropriate to the Group’s and the Company’s circumstances and have been consistently applied and adequately disclosed; the reasonableness of significant accounting estimates made by the directors; and the overall presentation of the financial statements. In addition, we read all the financial and non-financial information in the annual report to identify material inconsistencies with the audited financial statements and to identify any information that is apparently materially incorrect based on, or materially inconsistent with, the knowledge acquired by us in the course of performing the audit. If we become aware of any apparent material misstatements or inconsistencies we consider the implications for our report.
Andrew Partridge (Senior Statutory Auditor) for and on behalf of Deloitte LLPChartered Accountants and Statutory Auditor,Edinburgh, United Kingdom23 March 2017
Independent Auditor’s Report to the members of Alliance Trust PLC continued

Alliance Trust PLC | Annual Report and Financial Accounts 2016
53
III Financial Statements III
Financial Statements
Consolidated income statement for year ended 31 December 2016
Consolidated statement of comprehensive income
Company income statement for year ended 31 December 2016
Company statement of comprehensive income
Statement of changes in equity for year ended 31 December 2016
Balance sheet as at 31 December 2016
Cash flow statement for year ended 31 December 2016
Notes

Alliance Trust PLC | Annual Report and Financial Accounts 2016
54
Financial Statements
Consolidated income statement for the year ended 31 December 2016
Year to December 2016 Year to December 2015
£000 Note Revenue Capital Total Revenue Capital* Total
Income 3 84,788 - 84,788 114,386 - 114,386
Profit on fair value designated investments 9 - 593,997 593,997 - 85,137 85,137
Profit on investment property 9 - - - - 720 720
(Loss)/Profit on fair value of debt * - (9,800) (9,800) - 1,200 1,200
Total* 84,788 584,197 668,985 114,386 87,057 201,443
Administrative expenses 4 (7,972) (8,810) (16,782) (44,460) (1,585) (46,045)
Finance costs 5 (2,586) (5,107) (7,693) (3,972) (5,281) (9,253)
(Loss)/Gain on revaluation of office premises - (40) (40) - 175 175
Foreign exchange losses - (2,527) (2,527) - (84) (84)
Profit before tax* 74,230 567,713 641,943 65,954 80,282 146,236
Tax 6 (8,367) (2,248) (10,615) (5,362) - (5,362)
Profit for the year* 65,863 565,465 631,328 60,592 80,282 140,874
All profit for the year is attributable to equity holders of the parent.
Earnings per share attributable to equity holdersof the parent
Basic (p per share)* 8 12.77 109.66 122.43 11.05 14.64 25.69
Diluted (p per share)* 12.75 109.50 122.25 11.03 14.61 25.64
Consolidated statement of comprehensive income
Year to December 2016 Year to December 2015
£000 Revenue Capital Total Revenue Capital* Total
Profit for the year* 65,863 565,465 631,328 60,592 80,282 140,874
Items that will not be reclassified subsequently to profitor loss:
Defined benefit plan net actuarial Loss (note 25) - (26,637) (26,637) - (22) (22)
Retirement benefit obligations deferred tax - 4,478 4,478 - (96) (96)
Other comprehensive loss - (22,159) (22,159) - (118) (118)
Total comprehensive income for the year* 65,863 543,306 609,169 60,592 80,164 140,756
All total comprehensive income for the year is attributable to equity holders of the parent.
* 2015 restated to reflect reporting of fixed rate loan notes at fair value - refer to note 2 (Basis of accounting) for further information.

Alliance Trust PLC | Annual Report and Financial Accounts 2016
55
III Financial Statements III
Company income statement for the year ended 31 December 2016
Year to December 2016 Year to December 2015
£000 Note Revenue Capital Total Revenue Capital* Total
Income 3 84,783 - 84,783 92,348 - 92,348
Profit on fair value designated investments 9 - 591,755 591,755 - 87,334 87,334
Profit on investment property 9 - - - - 720 720
(Loss)/Profit on fair value of debt* - (9,800) (9,800) - 1,200 1,200
Total* 84,783 581,955 666,738 92,348 89,254 181,602
Administrative expenses 4 (7,960) (8,810) (16,770) (22,835) (1,133) (23,968)
Finance costs 5 (2,586) (5,107) (7,693) (3,968) (5,281) (9,249)
(Loss)/Gain on revaluation of office premises - (40) (40) - 175 175
Foreign exchange losses - (2,527) (2,527) - (84) (84)
Profit before tax* 74,237 565,471 639,708 65,545 82,931 148,476
Tax 6 (8,367) (2,248) (10,615) (5,360) - (5,360)
Profit for the year* 65,870 563,223 629,093 60,185 82,931 143,116
All profit for the year is attributable to equity holders of the parent.
Earnings per share attributable to equity holdersof the parent
Basic (p per share)* 8 12.77 109.23 122.00 10.97 15.12 26.09
Diluted (p per share)* 12.76 109.06 121.82 10.95 15.09 26.04
Company statement of comprehensive income
Year to December 2016 Year to December 2015
£000 Revenue Capital Total Revenue Capital* Total
Profit for the year* 65,870 563,223 629,093 60,185 82,931 143,116
Items that will not be reclassified subsequently to profitor loss:
Defined benefit plan net actuarial loss (note 25) - (26,637) (26,637) - (22) (22)
Retirement benefit obligations deferred tax - 4,478 4,478 - (96) (96)
Other comprehensive loss - (22,159) (22,159) - (118) (118)
Total comprehensive income for the year* 65,870 541,064 606,934 60,185 82,813 142,998
All total comprehensive income for the year is attributable to equity holders of the parent.
* 2015 restated to reflect reporting of fixed rate loan notes at fair value - refer to note 2 (Basis of accounting) for further information.

Alliance Trust PLC | Annual Report and Financial Accounts 2016
56
Financial Statements
Statement of changes in equity for the year ended 31 December 2016
Group Company
£000 Dec 16 Dec 15* Dec 16 Dec 15*
Called up share capital
At 1 January 13,160 13,835 13,160 13,835
Own shares purchased and cancelled in the year (841) (675) (841) (675)
At 31 December 12,319 13,160 12,319 13,160
Capital reserve
At 1 January* 2,160,142 2,223,715 2,163,026 2,223,950
Profit for the year 565,465 80,282 563,223 82,931
Defined benefit plan actuarial net loss (22,159) (118) (22,159) (118)
Own shares purchased and cancelled in the year (195,841) (136,479) (195,841) (136,479)
Share based payments 110 521 110 521
Dividends paid - (7,779) - (7,779)
At 31 December* 2,507,717 2,160,142 2,508,359 2,163,026
Merger reserve
At 1 January and at 31 December 645,335 645,335 645,335 645,335
Capital redemption reserve
At 1 January 5,838 5,163 5,838 5,163
Own shares purchased and cancelled in the year 841 675 841 675
At 31 December 6,679 5,838 6,679 5,838
Revenue reserve
At 1 January 112,565 120,916 111,921 120,679
Profit for the year 65,863 60,592 65,870 60,185
Dividends paid (66,329) (68,982) (66,329) (68,982)
Unclaimed dividends (redistributed)/returned (12) 39 (12) 39
At 31 December 112,087 112,565 111,450 111,921
Total Equity at 1 January* 2,937,040 3,008,964 2,939,280 3,008,962
Total Equity at 31 December* 3,284,137 2,937,040 3,284,142 2,939,280
* 2015 restated to reflect reporting of fixed rate loan notes at fair value - refer to note 2 (Basis of accounting) for further information.

Alliance Trust PLC | Annual Report and Financial Accounts 2016
57
III Financial Statements III
Balance sheet as at 31 December 2016
Group Company
£000 Note Dec 16 Dec 15* Dec 16 Dec 15*
Non-current assets
Investments held at fair value 9 3,474,165 3,307,397 3,474,197 3,309,671
Property, plant and equipment:
Office premises 9 4,500 4,540 4,500 4,540
Other fixed assets 9 24 299 24 299
Intangible assets 11 - 917 - 917
Pension scheme surplus 25 83 6,882 83 6,882
Deferred tax asset 12 72 1,238 72 1,238
3,478,844 3,321,273 3,478,876 3,323,547
Current assets
Outstanding settlements and other receivables 13 9,760 12,125 9,821 9,428
Recoverable overseas tax 2,997 1,483 2,997 1,483
Cash and cash equivalents 21 51,094 25,153 49,430 16,967
63,851 38,761 62,248 27,878
Total assets 3,542,695 3,360,034 3,541,124 3,351,425
Current liabilities
Outstanding settlements and other payables 14 (15,627) (17,570) (14,051) (7,818)
Tax payable 12 (3,991) (3,991) (3,991) (3,991)
Bank loans 15 (120,000) (290,000) (120,000) (290,000)
(139,618) (311,561) (138,042) (301,809)
Total assets less current liabilities 3,403,077 3,048,473 3,403,082 3,049,616
Non-current liabilities
Unsecured fixed rate loan notes* 15 (118,800) (109,000) (118,800) (109,000)
Deferred tax liability 12 (72) (1,238) (72) (1,238)
Amounts payable under long term Investment IncentivePlan (68) (1,195) (68) (98)
(118,940) (111,433) (118,940) (110,336)
Net assets* 3,284,137 2,937,040 3,284,142 2,939,280
Equity
Share capital 16 12,319 13,160 12,319 13,160
Capital reserve* 17 2,507,717 2,160,142 2,508,359 2,163,026
Merger reserve 17 645,335 645,335 645,335 645,335
Capital redemption reserve 17 6,679 5,838 6,679 5,838
Revenue reserve 17 112,087 112,565 111,450 111,921
3,284,137 2,937,040 3,284,142 2,939,280Total Equity*
All net assets are attributable to equity holders of the parent
* 2015 restated to reflect reporting of fixed rate loan notes at fair value - refer to note 2 (Basis of accounting) for further information.
Net Asset Value per ordinary share attributable toequity holders of the parent
Basic (£)* £6.67 £5.59 £6.67 £5.59
Diluted (£)* £6.67 £5.58 £6.67 £5.58
The financial statements were approved by the Board of Directors and authorised for issue on 23 March 2017.
They were signed on its behalf by:
Lord Smith of Kelvin
Chairman

Alliance Trust PLC | Annual Report and Financial Accounts 2016
58
Financial Statements
Cash flow statement for the year ended 31 December 2016
Group Company
£000 Dec 16 Dec 15 Dec 16 Dec 15
Cash flows from operating activities
Profit before tax 641,943 146,236 639,708 148,476
Adjustments for:
Gains on investments (593,997) (85,857) (591,755) (88,054)
Losses/(Gains) on fair value of debt 9,800 (1,200) 9,800 (1,200)
Foreign exchange losses 2,527 84 2,527 84
Depreciation 57 193 57 193
Disposals and transfers of fixed assets (174) - (174) -
Amortisation of intangibles - 329 - 329
Loss/(Gain) on revaluation of office premises 40 (175) 40 (175)
Share based payment expense 110 521 110 521
Finance costs 7,693 9,253 7,693 9,249
Movement in pension scheme surplus (15,360) (1,707) (15,360) (1,707)
Operating cash flows before movements in working capital 52,639 67,677 52,646 67,716
Decrease/(increase) in receivables 2,366 3,367 (392) 7,585
(Decrease)/Increase in payables (3,311) 10,067 5,962 1,037
Net cash flow from operating activities before income taxes 51,694 81,111 58,216 76,338
Taxes paid (12,129) (5,948) (12,129) (5,948)
Net cash inflow from operating activities 39,565 75,163 46,087 70,390
Cash flows from investing activities
Proceeds on disposal at fair value of investments through profit andloss 1,481,435 1,325,859 1,481,435 1,325,859
Purchases of fair value through profit and loss investments (1,054,086) (1,206,841) (1,054,086) (1,206,841)
Purchase of plant and equipment (6) (25) (6) (25)
Proceeds on transfer/(purchases) of other intangible assets toGroup companies 917 (214) 917 (214)
Proceeds on transfer of property, plant and equipment to Groupcompanies 395 - 395 -
Net cash inflow from investing activities 428,655 118,779 428,655 118,779
Cash flows from financing activities
Dividends paid - Equity (66,329) (76,761) (66,329) (76,761)
Unclaimed dividends (redistributed)/returned (12) 39 (12) 39
Purchase of own shares (195,841) (136,479) (195,841) (136,479)
Bank loans and unsecured fixed rate loan notes raised - 10,000 - 10,000
Repayment of borrowing (170,000) - (170,000) -
Finance costs paid (7,570) (9,606) (7,570) (9,602)
Net cash outflow from financing activities (439,752) (212,807) (439,752) (212,803)
Net cash increase/(decrease) in cash and cash equivalents 28,468 (18,865) 34,990 (23,634)
Cash and cash equivalents at beginning of year 25,153 44,102 16,967 40,685
Effect of foreign exchange rate changes (2,527) (84) (2,527) (84)
Cash and cash equivalents at end of year 51,094 25,153 49,430 16,967

Alliance Trust PLC | Annual Report and Financial Accounts 2016
59
III Financial Statements III
Notes
1 General Information
Alliance Trust PLC was incorporated in the United Kingdom under the Companies Acts 1862-1886. The address of the registered office isgiven on page 91. The nature of the Group’s operations and its principal activity is as a global investment trust company investing in aportfolio of global equities and other assets. The following notes refer to the year ended 31 December 2016 and the comparatives, whichare in brackets, for the year ended 31 December 2015.
The financial statements are presented in pounds sterling which is the currency of the primary economic environment in which the Groupoperates.
Critical accounting estimates and judgements
The preparation of the financial statements necessarily requires the exercise of judgement, both in application of accounting policies, whichare set out below, and in the selection of assumptions used in the calculation of estimates. These estimates and judgements are reviewedon an ongoing basis and are continually evaluated based on historical experience and other factors. However, actual results may differ fromthese estimates. The most significantly affected components of the financial statements and associated critical judgements are as follows:
Valuation of unlisted investments
Investments which are not listed or which are not frequently traded are stated at the Directors’ best estimate of fair value. In arriving at theirestimate, the Directors make use of recognised valuation techniques and may take account of recent arm’s length transactions in the sameor similar instruments. Investments in subsidiary investments are valued in the Company and Group accounts at the Directors' estimate oftheir fair value, using the guidelines and methodologies on valuation published by the International Private Equity and Venture CapitalAssociation issued in December 2015 and, where relevant the use of external advice. With respect specifically to investments in privateequity, whether through funds or partnerships, the Directors rely on unaudited valuations of the underlying investments as supplied by themanagers of those funds or partnerships. The Directors regularly review the principles applied by the managers to those valuations toensure they are in compliance with the above policies.
Defined benefit pension scheme
The Alliance Trust Companies’ Pension Fund (‘the Scheme’) is a funded defined benefit pension scheme which closed to future accrual on2 April 2011. In May 2016 the Board decided to pay £19.2m into the Scheme to fund the purchase of an annuity policy with Legal &General to match the Scheme’s liabilities to its members. The annuity was purchased by the Trustees of the Scheme on 31 May 2016. It isintended that the Scheme will be wound up in 2017. The actuarial assumptions of the Scheme are set out in note 25 of the financialstatements.
2 Summary of Significant Accounting Policies
Basis of accounting
The directors have, at the time of approving the financial statements, a reasonable expectation that the Company and Group haveadequate resources to continue in operational existence for the foreseeable future. They therefore continue to adopt the going concernbasis of accounting in preparing the financial statements in accordance with International Financial Reporting Standards (IFRS's), asadopted by the European Union (“Adopted IFRS's”). Further detail can be found on page 37.
The financial statements have been prepared on the historical cost basis, except that investments and investment properties and financialinstruments are stated at fair value and office premises are revalued on a periodic basis. The principal accounting policies adopted are setout below. Where presentational guidance set out in the Statement of Recommended Practice (‘SORP’) “Financial Statements ofInvestment Trust Companies” issued by the Association of Investment Companies (‘AIC’) in November 2014, is consistent with therequirements of IFRS, then the Directors have sought to prepare the financial statements on a basis consistent with the recommendationsof the SORP.
The same accounting policies, presentations and methods of computation are followed in these financial statements as were applied in theGroup’s last annual audited financial statements, other than those stated below.
Change of accounting policy
During 2016, the Group changed its accounting policy for the measurement of unsecured fixed rate loan notes: in particular changing frommeasuring at amortised cost to fair value. The Directors believe this change results in a more appropriate treatment in line with marketpractice. As a result of this change, in accordance with IFRS, the amended policy has been applied retrospectively and prior periodsrestated. As at 31 December 2014 the impact of this change in accounting policy would have led in to an an increase in liabilities of £10.2million and a £10.2 million loss on fair value of debt, decreasing net assets and closing capital reserves by £10.2 million for both the Groupand Company. For the year ended 31 December 2014 this would have resulted in a decrease in Basic EPS attributable to Capital and on atotal basis of 1.84p.
As at 31 December 2015 this would have led to a decrease in liabilities of £1.2 million and a £1.2 million gain on fair value of debt,increasing net assets and closing capital reserves by £1.2 million for both the Group and Company. For the year ended 31 December 2015this would have resulted in an increase in Basic EPS attributable to Capital and on a total basis of 0.22p.
Change in basis of expenses allocation
From 1 January 2016 the Company, where consistent with the AIC SORP, has attributed indirect expenditure including management feesand finance costs one third to revenue and two thirds to capital profits. This excludes costs which under the AIC SORP are chargeable torevenue profits. In prior periods the Company allocated all indirect expenditure against revenue profits save two thirds of finance costswhich were allocated against capital profits.
Group consolidation
The Company qualifies as an investment entity under IFRS 10 meeting all the key characteristics in the definition of an investmentcompany and as such does not consolidate the majority of its subsidiaries.
Alliance Trust PLC | Annual Report and Financial Accounts 2016
60
Financial Statements
2 Summary of Significant Accounting Policies
The consolidated financial statements therefore incorporate the financial statements of the Company and Alliance Trust Services Limited('ATSL') as a result of the application of the "Investment Entities" exemption noted above. All other entities controlled by the Company arerecorded at fair value through the income statement. They are included within the "Investments at fair value" on the Consolidated BalanceSheet as they are no longer consolidated on a line by line basis. ATSL was the employer of all staff within the Group until 31 December2015 and also acted as paymaster company. In 2016 all costs were incurred directly by the applicable legal entity, however ATSL hascontinued to provide services that relate directly to the investment activities of the Company and as such continues to be consolidated.
The following subsidiaries and related companies have not been consolidated into the Group results and have been valued at fair valuethrough the income statement:
NameShares
heldCountry of
incorporation Principal Activity
Alliance Trust Savings Limited ('ATS') Ordinary Scotland Provision and administration ofinvestment and pension products
Alliance Trust Savings (England) Limited ('ATS (England)') Ordinary England Inactive
AT2006 Limited ('AT2006') Ordinary Scotland Intermediate holding company
Second Alliance Trust Limited ('SATL') Ordinary Scotland Inactive
Alliance Trust Real Estate Partners (GP) Limited ('ATREP GP') Ordinary Scotland Real estate general partner
Alliance Trust Real Estate Partners LP ('ATREP LP') - Scotland Limited partnership
Alliance Trust Investments Limited ('ATI') Ordinary Scotland Investment management
Alliance Trust Investments (England) Limited ('ATI (England)') Ordinary England Inactive
Alliance Trust Equity Partners Limited ('ATEPL') Ordinary Scotland Investment management
Albany Venture Managers GP Limited ('AVMGP') Ordinary Scotland Private equity general partner
ATEP 2008 GP Limited ('ATEP 2008GP') Ordinary Scotland Private equity general partner
ATEP 2009 GP Limited ('ATEP 2009GP') Ordinary Scotland Private equity general partner
Allsec Nominees Limited Ordinary Scotland Nominee
Alliance Trust Savings Nominees Limited Ordinary Scotland Nominee
Alliance Trust Investment Funds ICVC ('ATIF') Ordinary Scotland UK domiciled Open Ended InvestmentCompany
Alliance Trust Sustainable Future ICVC ('ATSF') Ordinary Scotland UK domiciled Open Ended InvestmentCompany
Alliance Trust (Finance) Limited, Second Alliance Leasing Limited, Alliance Trust Equity Partners (Holdings) Limited and Alliance Trust (PEManco) Limited were liquidated during 2016 and any remaining assets were returned to the Company.
Adopted IFRS's
Amendments to the following IFRS's were applicable for the year ended 31 December 2016;
IFRS 10 Amendments regarding the application of the consolidation exception
IAS 1 Disclosure initiative
IAS 27 Separate Financial Statements (amendments)
FRS's not yet applied
The Group and the Company have not applied the following new and revised IFRS that have been issued but are not yet effective and insome cases had not been adopted for the year ended 31 December 2016:
IAS 7 Cashflow disclosure initiative (amendments)
IAS 12 Income taxes
IFRS 2 Share based payments (amendments)
IFRS 9 Financial Instruments
IFRS 15 Revenue from contracts with customers
IFRS 16 Leases
Any required changes will be applicable to the financial statements of the Company and Group for the year ended 31 December 2017 andfuture years and are expected to impact the Company and Group’s accounting for financial assets and liabilities and the disclosuresthereof. The Directors do not believe that the adoption of the other standards listed above will have a material impact on the financialstatements of the Company or the Group in future years.
Basis of consolidation
The consolidated financial statements incorporate the financial statements of the Company and entities controlled by the Company (itssubsidiaries) made up to 31 December each year. Control is achieved where the Company has the power to govern the financial andoperating policies of an invested entity so as to obtain benefits from its activities. Net gains or losses attributable to these investments aretreated as profit on fair value of investments in the income statement and are disclosed in note 9 of the financial statements. All intra-Grouptransactions, balances, income and expenses are eliminated on consolidation.

Alliance Trust PLC | Annual Report and Financial Accounts 2016
61
III Financial Statements III
2 Summary of Significant Accounting Policies
Presentation of income statement
In order to reflect the activities of an investment trust more accurately, and in accordance with guidance issued by the AIC, supplementaryinformation which analyses the income statement between items of a revenue and capital nature have been presented alongside theincome statement. Net capital returns are not generally distributed by way of a dividend but a dividend was paid out of capital reserves inthe prior year (note 17).
Revenue recognition
Dividend income from investments is recognised when the shareholders’ rights to receive payment have been established, normally the ex-dividend date.
Where the Group has elected to receive its dividends in the form of additional shares rather than cash, the amount of cash dividendforegone is recognised as income. Any excess in the value of shares received over the amount of cash dividend foregone is recognised asa capital gain in the income statement.
Rental income from investment property and income from mineral rights is recognised on a time-apportioned basis.
Interest income is accrued on a time-apportioned basis, by reference to the principal outstanding and at the effective interest rateapplicable, which is the rate that exactly discounts estimated future cash receipts through the expected life of the financial asset to thatasset’s net carrying amount.
Special dividends receivable are treated as repayment of capital or as income depending on the facts of each particular case.
Underwriting commission is recognised as earned.
Expenses connected with rental income and mineral rights are included as administrative expenses.
Foreign currencies
Transactions in currencies other than Sterling are recorded at the rates of exchange applicable to the dates of the transactions. At eachbalance sheet date, monetary items and non-monetary assets and liabilities that are fair valued and are denominated in foreign currenciesare restated at the rates prevailing on the balance sheet date. Gains and losses arising on restatement are included as capital net profit orloss for the period where investments are classified as fair value through profit or loss.
Expenses
All expenses are accounted for on an accruals basis. In respect of the analysis between revenue and capital items presented within theincome statement, from 1 January 2016 the Company, where consistent with the AIC SORP is attributing indirect expenditure includingmanagement fees and finance costs one third to revenue and two thirds to capital profits, specifically:
Expenses which are incidental to the acquisition of an investment are included within the cost of that investment.
Expenses which are incidental to the disposal of an investment are deducted from the disposal proceeds of that investment.
Annual bonus and Long Term Incentive Plan costs which relate to the achievement of investment manager performance objectives,
total shareholder return and net asset value performance objectives are allocated against capital profits and those that relate to the
achievement of other corporate targets or job performance objectives against revenue profits.
Expenses which under the AIC SORP are chargeable to revenue profits are recorded directly to revenue.
Operating leases
Charges for operating leases are debited to the income statement on an accruals basis. Note 26 “Operating lease commitments” disclosesthe commitments to pay charges for leases expiring within 1 year, between 2-5 years and over 5 years.
Share based payments
The Group operates three share based payment schemes, the All Employee Share Ownership Plan (AESOP), the Long Term IncentivePlans (LTIP) and the Deferred Bonus Award. The cost of the AESOP is recognised as a revenue cost in the year. The fair value of optionsgranted to employees under the LTIP is recognised as staff costs, with a corresponding increase in equity, over the year in which theemployees become unconditionally entitled to the options. The amount recognised as an expense may be adjusted to reflect the actualnumber of share options that vest. For share based compensation schemes settled by the Company a recharge equal to the cost duringthe year is made to subsidiary companies.
Investment incentive plan
The Equity Annual Incentive Plan ("the Plan") was a discretionary plan for members of the investment team applicable for 2015. Itconsisted of matching awards which were based upon the proportion of annual bonus set aside in the the Plan by the participants either inthe form of cash or shares in the funds which they manage. The awards are settled in cash at the end of a three year performance periodsubject to meeting predefined performance targets.
Pension costs
From 1 January 2016 employer contributions to pension arrangements for staff have been charged one third to revenue and two thirds tocapital. For periods prior to 31 December 2016 these contributions have been charged to revenue costs.
Contributions in respect of the defined benefit pension scheme are calculated by reference to actuarial valuations carried out for theTrustees at intervals of not more than three years, and represent a charge to cover the accrued liabilities on a continuing basis.
Actuarial gains and losses are recognised in full in the statement of comprehensive income in the year in which they occur.
Taxation
The Company carries on its business as an investment trust and conducts its affairs so as to qualify as such under the provisions ofSection 1158 and 1159 of the Corporation Tax Act 2010.

Alliance Trust PLC | Annual Report and Financial Accounts 2016
62
Financial Statements
2 Summary of Significant Accounting Policies
The tax expense represents the sum of the withholding tax suffered on foreign dividends.
The tax currently payable is based on taxable profit for the year. Taxable profit differs from net profit as reported in the income statementbecause it excludes items of income or expense that are taxable or deductible in other years and it further excludes items that are nevertaxable or deductible. The Group’s liability for current tax is calculated using tax rates that have been enacted or substantively enacted bythe balance sheet date.
In line with the recommendations of the SORP, the allocation method used to calculate tax relief on expenses presented against capitalreturns in the supplementary information in the income statement is the ‘marginal basis’. Under this basis, if taxable income is capable ofbeing offset entirely by expenses presented in the revenue return column of the income statement, then no tax relief is transferred to thecapital return column.
Deferred tax liabilities are generally recognised for all taxable temporary differences and deferred tax assets are recognised to the extentthat it is probable that taxable profits will be available against that deductible temporary differences which can be utilised. Such assets andliabilities are not recognised if the temporary differences arise from the initial recognition of goodwill or from the initial recognition (otherthan in a business combination) of other assets and liabilities in a transaction that affects neither the tax profit nor the accounting profit.
Deferred tax liabilities are recognised for taxable temporary differences arising on investments in subsidiaries and associates and interestsin joint ventures, except where the Group is able to control the reversal of the temporary difference and it is probable that the temporarydifference will not reversed in the foreseeable future.
The carrying amount of deferred tax assets is reviewed at each balance sheet date and reduced to the extent that it is no longer probablethat sufficient taxable profits will be available to allow all or part of the asset to be recovered.
Deferred tax is calculated at the tax rates that are expected to apply in the period when the liability is settled or the asset is realised.Deferred tax is charged or credited in the income statement, except when it relates to items charged or credited directly to equity, in whichcase the deferred tax is also recorded within equity.
Deferred tax assets and liabilities are offset when there is a legally enforceable right to set off current tax assets against current taxliabilities and where they relate to income taxes levied by the same taxation authority and the Group intends to settle its current tax assetsand liabilities on a net basis.
Neither the Company or the Group recognise deferred tax assets or liabilities on capital profits or losses on the basis that the investmenttrust status of the Company means no tax is due on the capital profits, or losses, of the Company.
Financial instruments
Financial assets and financial liabilities are recognised on the Group’s balance sheet when the Group becomes a party to the contractualprovisions of the financial instrument. The Group will only offset financial assets and financial liabilities if it has a legally enforceable right ofset off and intends to settle on a net basis.
Derivative financial instruments
The Group’s activities expose it primarily to the financial risks of changes in market prices, foreign currency exchange rates and interestrates. Derivative transactions which the Group may enter include futures, forwards and swaps.
Derivative financial instruments are initially recorded at fair value on the date on which the derivative contract is entered into and aresubsequently remeasured at fair value. The fair value of forward currency contracts are calculated by reference to current forwardexchange rates for contracts of similar maturity dates. Changes in fair value of derivatives financial instruments are recognised in theIncome Statement.
Investments
Investments are recognised and derecognised on the trade date where a purchase or sale is made under a contract whose terms requiredelivery within the timeframe established by the market concerned, and are initially measured at cost, including transaction costs.
Investments, which include collective investment schemes, are principally designated as fair value through profit and loss upon initialrecognition (not including transaction costs). Listed investments are measured at subsequent reporting dates at fair value, which is eitherthe bid price or the last traded price, depending on the convention of the exchange on which the investment is quoted.
Investments in property are initially recognised at cost and then valued at fair value based on an independent professional valuation at thereporting date, with changes in fair value recognised through the income statement. Disposals of investment property are recognised whencontracts for sale have been exchanged and the sale has been completed.
Investments which are not listed or which are not frequently traded are valued at the Directors' best estimate of fair value. In arriving at theirestimate, the Directors make use of recognised valuation techniques and may take account of recent arm's length transactions in the sameor similar instruments.
Investments in subsidiary companies are valued in the Company’s accounts at the Directors’ estimate of their fair value, using theguidelines and methodologies on valuation published by the International Private Equity and Venture Capital Association issued inDecember 2015 and where relevant the use of external valuers. For investments in private equity, the Directors make use of unauditedvaluations of the underlying investments as supplied by the managers of those private equity funds. The Directors regularly review theprinciples applied by those managers to ensure they are in compliance with the Company’s policies.
Valuation of mineral rights, included in unlisted investments is based upon the net income received from the asset in the previous twelvemonths multiplied by appropriate factors for gas and oil. Mineral rights are included in unlisted investments.
Foreign exchange gains and losses for fair value designated investments are included within the changes in its fair value.
Cash and cash equivalents
Cash and cash equivalents are defined as short term, highly liquid investments that are readily convertible to known amounts of cash.

Alliance Trust PLC | Annual Report and Financial Accounts 2016
63
III Financial Statements III
2 Summary of Significant Accounting Policies
Other receivables
Other receivables do not carry any interest and are stated at their nominal value as reduced by appropriate allowances for estimatedirrecoverable amounts.
Office premises
Office premises are valued annually by chartered surveyors on the basis of market value in accordance with the RICS Appraisal andValuation Standards. No depreciation has been charged on these assets as, in the opinion of the Board, any provision for depreciationwould be immaterial.
Intangible assets
The external costs associated with the development and procurement of significant technology systems are capitalised where it is probablethat the expected future economic benefit of that system will flow to the entity. They are stated at cost less accumulated amortisation. Onthe completion of each project amortisation is charged so as to write off the value of these assets over periods up to five years.
Other fixed assets
Other fixed assets are held at cost less accumulated depreciation, which is charged to write off the value of the asset over three to fiveyears.
Impairment
At each balance sheet date, the Group reviews the carrying amounts of its intangible assets to determine whether there is any indicationthat those assets have suffered an impairment loss. If any such indication exists, the recoverable amount of the asset is estimated todetermine the extent of any impairment loss (if any).
If the recoverable amount of an asset is estimated to be less than its carrying amount, the carrying amount of the asset is reduced to therecoverable amount. An impairment loss is recognised immediately in the income statement, unless the relevant asset is carried at a re-valued amount, in which case the reversal of the impairment is treated as a revaluation decrease.
Financial liabilities and equity
Financial liabilities and equity instruments are classified according to the substance of the contractual arrangements entered into. An equityinstrument is any contract that evidences a residual interest in the assets of the Group after deducting all of its liabilities.
Unsecured fixed rate loan notes and bank borrowings
Interest-bearing bank loans and overdrafts are initially recorded at the proceeds received, net of direct issue costs. Finance charges,including premiums payable on settlement or redemption and direct issue costs, are accounted for through the income statement on anaccruals basis using the effective interest rate method and are added to the carrying amount of the instrument to the extent that they arenot settled in the period in which they arise.
Unsecured fixed rate loan notes are initially recorded at the proceeds received. After initial recognition during 2016 and as appliedretrospectively (see change in accounting policy) they are now measured at fair value. Finance charges are accounted for through theincome statement on an accruals basis using the effective interest rate.
Other payables
Other payables are not interest bearing and are stated at their nominal value.
Buy backs and cancellation of shares
The costs of acquiring own shares for cancellation, together with any associated trading costs, are written back to distributable reserves.Share capital is reduced by the nominal value of the shares bought back with an equivalent entry made to the capital redemption reserve.
Realised and unrealised capital reserves
A description of each of the reserves follows:
Capital reserve
The following are recorded through this reserve:
Gains and losses on realisation of investments
Changes in fair value of investments
Realised exchange differences of a capital nature
Purchases of shares by the Trustee of the Employee Benefit Trust
Payment of capital dividends
Amounts recognised in relation to share based payments which are capital in nature
Amounts by which other assets and liabilities valued at fair value differ from their book value
Buy back and cancellation of own shares
Amounts recognised in relation to the defined benefit pensions scheme
Where consistent with the AIC SORP, attributing two thirds of indirect expenditure including management fees, finance costs and
relevant administrative expenses are charged to capital profits

Alliance Trust PLC | Annual Report and Financial Accounts 2016
64
Financial Statements
2 Summary of Significant Accounting Policies
Revaluation reserve
This reserve is used to record changes in the valuation of the office premises. A downward revaluation in office premises is charged to theincome statement to the extent that there is no earlier upward revaluation in this reserve for those premises.
Merger reserve
This reserve was created as part of the arrangements for the acquisition of the assets of SATL.
Capital redemption reserve
This reserve was created on the cancellation and repayment of the Company’s preference share capital. Further movements in this reservereflects the nominal value of the buy back and cancellation of a portion of the share capital of the Company.
Revenue reserve
Net revenue profits and losses of the Company and its subsidiaries and the fair value costs of share based payments which are revenue innature are recorded within this reserve, together with the dividend payments made by the Company.

Alliance Trust PLC | Annual Report and Financial Accounts 2016
65
III Financial Statements III
3 Revenue
An analysis of the Group's and Company's revenue is as follows:
Group Company
£000 Dec 16 Dec 15 Dec 16 Dec 15
Income from investments
Listed dividends - UK 18,866 19,464 18,866 19,464
Distributions from Collective Investment Schemes 1,913 8,161 1,913 8,161
Unlisted dividends - Subsidiaries - 248 - 248
Listed dividends - Overseas 62,124 60,374 62,124 60,374
82,903 88,247 82,903 88,247
Other income
Property rental income - 565 - 565
Mineral rights income 1,685 3,311 1,685 3,311
Deposit interest 9 17 4 6
Other interest - 219 - 219
Recharged costs* 191 22,027 191 -
1,885 26,139 1,880 4,101
Total income 84,788 114,386 84,783 92,348
Investment income comprises
Listed UK 20,779 27,625 20,779 27,625
Listed Overseas 62,124 60,374 62,124 60,374
Unlisted - 248 - 248
82,903 88,247 82,903 88,247
* In 2016 all costs including staff and administrative costs, were incurred directly by the applicable legal entity resulting in a lower level ofrecharged costs compared to the previous year. ATSL was the employer of all staff within the Group until 31 December 2015 and alsoacted as paymaster company and as such staff costs and all indirect costs for the two trading businesses ATS and ATI until 31 December2015 were included within income and expenses in the Consolidated Income Statement as these were recharged by ATSL.
4 Profit before tax is stated after charging the following administrative expenses:
Group Group
£000
Dec 16
Revenue
Dec 16
Capital
Dec 16
Total
Dec 15
Revenue
Dec 15
Capital
Dec 15
Total
Staff costs 509 990 1,499 18,006 1,585 19,591
Social security costs 104 209 313 2,337 - 2,337
Pension credit - defined benefit scheme (note 25) (146) (292) (438) (207) - (207)
Pension costs - defined contribution scheme 1 2 3 1,643 - 1,643
468 909 1,377 21,779 1,585 23,364
Group Group
£000
Dec 16
Revenue
Dec 16
Capital
Dec 16
Total
Dec 15
Revenue
Dec 15
Capital
Dec 15
Total
Auditor's remuneration
Fee payable to the auditor for the audit of the Group'sannual accounts 64 - 64 62 - 62
Fee payable to the auditor for subsidiary company audits 13 - 13 17 - 17
Total audit fees 77 - 77 79 - 79
Audit related assurance services - - - 3 - 3
All other services 5 - 5 4 - 4
Total non-audit fees 5 - 5 7 - 7
Fees payable to the Company's auditor in respect ofassociated pension schemes audit 5 - 5 4 - 4
5 - 5 4 - 4
Total remuneration 87 - 87 90 - 90

Alliance Trust PLC | Annual Report and Financial Accounts 2016
66
Financial Statements
4 Profit before tax is stated after charging the following administrative expenses:
Group Group
£000
Dec 16
Revenue
Dec 16
Capital
Dec 16
Total
Dec 15
Revenue
Dec 15
Capital
Dec 15
Total
Operating lease charges
Land and buildings - - - 111 - 111
Other - - - 19 - 19
Total operating lease charges - - - 130 - 130
Investment management fee 3,114 6,227 9,341 - - -
Other administrative costs 4,303 1,674 5,977 22,461 - 22,461
Total administrative costs 7,972 8,810 16,782 44,460 1,585 46,045
Company Company
£000
Dec 16
Revenue
Dec 16
Capital
Dec 16
Total
Dec 15
Revenue
Dec 15
Capital
Dec 15
Total
Staff costs 509 990 1,499 7,710 1,133 8,843
Social security costs 104 209 313 1,126 - 1,126
Pension credit - defined benefit scheme (note 25) (146) (292) (438) (207) - (207)
Pension costs - defined contribution scheme 1 2 3 594 - 594
468 909 1,377 9,223 1,133 10,356
Auditor's remuneration
Fee payable to the auditor for the audit of the Company'sannual accounts 64 - 64 62 - 62
Total audit fees 64 - 64 62 - 62
All other services 5 - 5 4 - 4
Total non-audit fees 5 - 5 4 - 4
Fees payable to the Company's auditors in respect ofassociated pension schemes audit 5 - 5 4 - 4
Total pension audit fees 5 - 5 4 - 4
Total remuneration 74 - 74 70 - 70
Operating lease charges
Land and buildings - - - 111 - 111
Other - - - 19 - 19
Total operating lease charges - - - 130 - 130
Investment management fee 3,114 6,227 9,341 - - -
Other administrative costs 4,304 1,674 5,978 13,412 - 13,412
Total administrative costs 7,960 8,810 16,770 22,835 1,133 23,968
In addition to the audit fees paid by the Company and consolidated group disclosed above, fees payable to the company's auditors for theaudit of the non-consolidated subsidiaries amounted to £190,000 (£176,000), with audit related services for these entities amounting to£100,000 (£70,000). Total audit fees of £267,000 (£255,000), non-audit fees of £105,000 (£75,000) and fees payable in respect ofassociated pension schemes of £5,000 (£4,000) were paid to Deloitte LLP. Total remuneration paid to Deloitte LLP amounted to £377,000(£334,000).
Total Directors’ remuneration recorded for the year was £1.2m (£2.4m). This includes the current year allocation in respect of contractualawards made to former Executive Directors in prior years. No new awards were granted during 2016. Further details are given in theRemuneration Report on pages 38 to 44. In the year the Group employed no staff as all staff were employed by trading subsidiaries; staffand social security costs represent costs of Non-Executive Directors and the previous CEO. In the prior year staff were employed byAlliance Trust Services Limited and staff costs were included within the Group results. The Group employed an average of Nil (261) full-time and Nil (16) part-time staff, excluding Directors. The average full time equivalents in the year was Nil.
Total Company administrative expenses of £16.8m (£23.9m) include non-recurring expenses of £3.4m (£5.2m) as disclosed on page 21.The ongoing charges (OCR) of the Company amounted to 0.43% (0.59%) of the average net assets. The 2016 OCR of 0.43% is based ontotal ongoing expenses. Had the new OCR calculation basis been applied in 2015 the comparable OCR would have been 0.63%. This isfurther outlined in the Costs section on page 20.
The basis of the investment management fee is 0.35% of NAV after deducting the value of Trust holdings in ATI managed funds and thefair value of subsidiary companies.
The cost of insured benefits for staff including Executive Directors is included in staff costs.

Alliance Trust PLC | Annual Report and Financial Accounts 2016
67
III Financial Statements III
5 Finance costs
Group Group
£000
Dec 16
Revenue
Dec 16
Capital
Dec 16
Total
Dec 15
Revenue
Dec 15
Capital
Dec 15
Total
Bank loans and unsecured fixed rate loan notes 2,586 5,107 7,693 3,972 5,281 9,253
Total finance costs 2,586 5,107 7,693 3,972 5,281 9,253
Company Company
£000
Dec 16
Revenue
Dec 16
Capital
Dec 16
Total
Dec 15
Revenue
Dec 15
Capital
Dec 15
Total
Bank loans and unsecured fixed rate loan notes 2,586 5,107 7,693 3,968 5,281 9,249
Total finance costs 2,586 5,107 7,693 3,968 5,281 9,249
Finance costs include interest of £4.3m (£4.3m) on the £100m 4.28% unsecured fixed rate loan notes which were drawn down in July 2014for 15 years. The basis of apportionment of finance costs between revenue and capital profits is disclosed in note 2 (change of accountingestimates).
6 Taxation
Group Group
£000
Dec 16
Revenue
Dec 16
Capital
Dec 16
Total
Dec 15
Revenue
Dec 15
Capital
Dec 15
Total
UK corporation tax at 20.00% (20.25%) - - - - - -
Prior year adjustment (1) - (1) (2) - (2)
Overseas taxation 6,219 - 6,219 5,460 - 5,460
Recoverable income tax (81) - (81) - - -
6,137 - 6,137 5,458 - 5,458
Deferred taxation 2,280 2,248 4,528 (96) - (96)
Rate change impact on deferred tax balances (50) - (50) - - -
Tax expense for the year 8,367 2,248 10,615 5,362 - 5,362
Corporation tax is calculated at the average rate of 20.00% (20.25%) of the estimated assessable profit for the year. Taxation for overseasjurisdictions is calculated at the rates prevailing in the respective jurisdictions. The charge for the year can be reconciled to the profit perthe income statement as follows:
Group Group
£000
Dec 16
Revenue
Dec 16
Capital
Dec 16
Total
Dec 15
Revenue
Dec 15
Capital
Dec 15
Total
Profit before tax 74,230 567,713 641,943 65,954 80,282 146,236
Tax at the average UK corporation tax rate of 20.00% (20.25%) 14,846 113,543 128,389 13,356 16,257 29,613
Non taxable income (14,423) - (14,423) (14,574) (219) (14,793)
Losses on investments not taxable - (118,799) (118,799) - (17,386) (17,386)
Prior year adjustment (1) - (1) (2) - (2)
Foreign exchange adjustments - 505 505 - 17 17
Effect of changes in tax rates (452) (397) (849) (100) - (100)
Effect of overseas tax 6,219 - 6,219 5,460 - 5,460
Deferred tax assets not recognised (192) 5,551 5,359 1,383 1,045 2,428
Fair value movement in office premises - 8 8 - (35) (35)
Adjustments arising on the difference betweentaxation and accounting treatment of income andexpenses 2,149 1,595 3,744 (127) 164 37
Utilisation of brought forward tax losses - - - (272) 146 (126)
Expenses not deductible for tax purposes 390 242 632 326 11 337
Expense relief for overseas tax (88) - (88) (91) - (91)
Group relief not paid for - - - 3 - 3
Recoverable income tax (81) - (81) - - -
Tax expense for the year 8,367 2,248 10,615 5,362 - 5,362

Alliance Trust PLC | Annual Report and Financial Accounts 2016
68
Financial Statements
6 Taxation
Company Company
£000
Dec 16
Revenue
Dec 16
Capital
Dec 16
Total
Dec 15
Revenue
Dec 15
Capital
Dec 15
Total
UK corporation tax at 20.00% (20.25%) - - - - - -
Prior year adjustment (1) - (1) (4) - (4)
Overseas taxation 6,219 - 6,219 5,460 - 5,460
Recoverable income tax (81) - (81) - - -
6,137 - 6,137 5,456 - 5,456
Deferred taxation 2,280 2,248 4,528 (96) - (96)
Rate change impact on deferred tax balances (50) - (50) - - -
Tax expense for the year 8,367 2,248 10,615 5,360 - 5,360
Corporation tax is calculated at the average rate of 20.00% (20.25%) of the estimated assessable profit for the year. Taxation for overseasjurisdictions is calculated at the rates prevailing in the respective jurisdictions. The charge for the year can be reconciled to the profit perthe income statement as follows:
Company Company
£000
Dec 16
Revenue
Dec 16
Capital
Dec 16
Total
Dec 15
Revenue
Dec 15
Capital
Dec 15
Total
Profit before tax 74,237 565,471 639,708 65,545 82,931 148,476
Tax at the average UK corporation tax rate of 20.00% (20.25%) 14,847 113,094 127,941 13,273 16,794 30,067
Non taxable income (14,423) - (14,423) (14,574) - (14,574)
Losses on investments not taxable - (118,351) (118,351) - (17,831) (17,831)
Prior year adjustment (1) - (1) (2) - (2)
Foreign exchange adjustments - 505 505 - 17 17
Effect of changes in tax rates (452) (397) (849) (100) - (100)
Effects of overseas tax 6,219 - 6,219 5,460 - 5,460
Deferred tax assets not recognised (193) 5,552 5,359 1,383 1,045 2,428
Fair value movement in office premises - 8 8 - (35) (35)
Adjustments arising on the difference betweentaxation and accounting treatment of income andexpenses 2,149 1,595 3,744 (20) - (20)
Expenses not deductible for tax purposes 390 242 632 28 10 38
Expense relief for overseas tax (88) - (88) (91) - (91)
Group relief not paid for - - - 3 - 3
Recoverable income tax (81) - (81) - - -
Tax expense for the year 8,367 2,248 10,615 5,360 - 5,360
7 Dividends
Dividends Paid £000 Dec 16 Dec 15
Fourth interim dividend for the year ended 31 December 2014 of 2.4585p per share
First interim dividend for the year ended 31 December 2015 of 2.5325p per share
Second interim dividend for the year ended 31 December 2015 of 2.5325p per share
Third interim dividend for the year ended 31 December 2015 of 2.5325p per share
- 13,555*
- 13,962
- 13,965
- 13,464
Fourth interim dividend for the year ended 31 December 2015 of 3.3725p per share 17,473* -
First interim dividend for the year ended 31 December 2016 of 2.825p per share 14,528 -
Second interim dividend for the year ended 31 December 2016 of 2.825p per share 14,528 -
Third interim dividend for the year ended 31 December 2016 of 3.85p per share 19,800 -
- 66,329 54,946
Special dividend for the year ended 31 December 2014 of 2.546p per share
Special dividend for the year ended 31 December 2015 of 1.463p per share
- 14,036
- 7,779
66,329 76,761
We also set out below the total dividend payable in respect of the financial year, which is the basis on which the requirements of Section1158/1159 of the Corporation Tax Act 2010 are considered.
Alliance Trust PLC | Annual Report and Financial Accounts 2016
69
III Financial Statements III
7 Dividends
Dividends Earned £000 Dec 16 Dec 15
First interim dividend for the year ended 31 December 2015 of 2.5325p per share
Second interim dividend for the year ended 31 December 2015 of 2.5325p per share
Third interim dividend for the year ended 31 December 2015 of 2.5325p per share
Fourth interim dividend for the year ended 31 December 2015 of 3.3725p per share
- 13,962
- 13,965
- 13,464
- 17,570*
First interim dividend for the year ended 31 December 2016 of 2.825p per share 14,528 -
Second interim dividend for the year ended 31 December 2016 of 2.825p per share 14,528 -
Third interim dividend for the year ended 31 December 2016 of 3.85p per share 19,800 -
Fourth interim dividend for the year ended 31 December 2016 of 3.274p per share 16,108 -
64,964 58,961
Special dividend for the year ended 31 December 2015 of 1.463p per share - 7,779 64,964 66,740
* 31 December 2014 and 31 December 2015 figures have been adjusted to reflect share buy backs.
8 Earnings per share
The calculation of the basic and diluted earnings per share is based on the following data:
Group Group
Basic £000
Dec 16
Revenue
Dec 16
Capital
Dec 16
Total
Dec 15
Revenue
Dec 15
Capital
Dec 15
Total
Ordinary shares
Earnings for the purposes of basic earnings pershare being net profit attributable to equity holdersof the parent 65,863 565,465 631,328 60,592 80,282 140,874
Number of shares
Weighted average number of ordinary shares for thepurpose of basic earnings per share 515,646,212 548,480,531
Weighted average number of ordinary shares for thepurpose of diluted earnings per share 516,414,688 549,465,141
Company Company
Diluted £000
Dec 16
Revenue
Dec 16
Capital
Dec 16
Total
Dec 15
Revenue
Dec 15
Capital
Dec 15
Total
Ordinary shares
Earnings for the purposes of basic earnings pershare being net profit attributable to equity holdersof the parent 65,870 563,223 629,093 60,185 82,931 143,116
Number of shares
Weighted average number of ordinary shares for thepurpose of basic earnings per share 515,646,212 548,480,531
Weighted average number of ordinary shares for thepurpose of diluted earnings per share 516,414,688 549,465,141
The diluted figure is the weighted average of the entire number of shares in issue.
To arrive at the basic figure, the number of shares has been reduced by 698,062 (886,173) ordinary shares held by the Trustee of theEmployee Benefit Trust. During the year the Trustee increased its holding by Nil (Nil) shares. 188,111 (245,664) shares were transferredfrom the Employee Benefit Trust to participants in the Long Term Incentive Plans in satisfaction of awards.
IAS 33.41 requires that shares should only be treated as dilutive if they decrease earnings per share or increase the loss per share.

Alliance Trust PLC | Annual Report and Financial Accounts 2016
70
Financial Statements
9 Non-current assets
Group Company
£000 Dec 16 Dec 15 Dec 16 Dec 15
Investments designated at fair value through profit and loss:
Investments listed on a recognised investment exchange 3,157,042 2,930,872 3,157,042 2,930,872
Forward currency exchange contracts held at fair value through profit andloss 6,853 - 6,853 -
Unlisted investments 47,444 47,778 47,444 47,778
Investment in collective investment schemes (note 10) 93,027 158,009 93,027 158,009
Investments in related and subsidiary companies (note 10) 169,799 170,738 169,831 173,012
3,474,165 3,307,397 3,474,197 3,309,671
Total Investments 3,474,165 3,307,397 3,474,197 3,309,671
December 2015 Group
£000Listed
InvestmentsInvestment
Property
Related andSubsidiary
CompaniesUnlisted
Investments Total
Opening book cost at 1 January 2015 2,515,187 10,413 197,393 50,281 2,773,274
Opening unrealised appreciation/(depreciation) 591,114 (5,583) (24,735) 9,592 570,388
Opening valuation as at 1 January 2015 3,106,301 4,830 172,658 59,873 3,343,662
Movements in the year
Purchases at cost** 1,160,828 - 39,100 3,808 1,203,736
Sales - proceeds** (1,280,897) (5,550) (38,147) (1,265) (1,325,859)
- realised gains/(losses)on sales 156,042 (4,863) 5,904 (6,859) 150,224
(Decrease)/Increase in appreciation on assets held (53,393) 5,583 (8,777) (7,779) (64,366)
Closing valuation as at 31 December 2015 3,088,881 - 170,738 47,778 3,307,397
Closing book cost 2,551,160 - 204,250 45,965 2,801,375
Closing appreciation/(depreciation)on assets held 537,721 - (33,512) 1,813 506,022
Closing valuation as at 31 December 2015 3,088,881 - 170,738 47,778 3,307,397
December 2016 Group
£000Listed
InvestmentsInvestment
Property
Related andSubsidiary
CompaniesUnlisted
Investments Total
Opening book cost at 1 January 2016 2,551,160 - 204,250 45,965 2,801,375
Opening unrealised appreciation/(depreciation) 537,721 - (33,512) 1,813 506,022
Opening valuation at 1 January 2016 3,088,881 - 170,738 47,778 3,307,397
Movements in the year
Purchases at cost** 1,035,577 - 17,000 1,629 1,054,206
Sales - proceeds** (1,444,127) - (37,121) (187) (1,481,435)
- realised gains/(losses)on sales 261,018 - 14,046 (433) 274,631
Increase/(decrease) in appreciation on assets held 315,573 - 5,136 (1,343) 319,366
Closing valuation at 31 December 2016 3,256,922 - 169,799 47,444 3,474,165
Closing book cost 2,403,628 - 198,175 46,974 2,648,777
Closing appreciation/(depreciation)on assets held 853,294 - (28,376) 470 825,388
Closing valuation as at 31 December 2016 3,256,922 - 169,799 47,444 3,474,165

Alliance Trust PLC | Annual Report and Financial Accounts 2016
71
III Financial Statements III
9 Non-current assets
December 2015 Company
£000Listed
InvestmentsInvestment
Property
Related andSubsidiarycompanies
UnlistedInvestments Total
Opening book cost as at 1 January 2015 2,515,187 10,413 197,393 50,281 2,773,274
Opening unrealised appreciation/(depreciation) 591,114 (5,583) (24,657) 9,592 570,466
Opening valuation as at 1 January 2015 3,106,301 4,830 172,736 59,873 3,343,740
Movements in the year
Purchases at cost** 1,160,828 - 39,100 3,808 1,203,736
Sales - proceeds** (1,280,897) (5,550) (38,147) (1,265) (1,325,859)
- realised gains/(losses) on sales 156,042 (4,863) 5,904 (6,859) 150,224
(Decrease)/increase in appreciation on assets held (53,393) 5,583 (6,581) (7,779) (62,170)
Closing valuation as at 31 December 2015 3,088,881 - 173,012 47,778 3,309,671
Closing book cost 2,551,160 - 204,250 45,965 2,801,375
Closing appreciation/(depreciation) on assets held 537,721 - (31,238) 1,813 508,296
Closing valuation as at 31 December 2015 3,088,881 - 173,012 47,778 3,309,671
December 2016 Company
£000Listed
InvestmentsInvestment
Property
Related andSubsidiarycompanies
UnlistedInvestments Total
Opening book cost as at 1 January 2016 2,551,160 - 204,250 45,965 2,801,375
Opening unrealised appreciation/(depreciation) 537,721 - (31,238) 1,813 508,296
Opening valuation as at 1 January 2016 3,088,881 - 173,012 47,778 3,309,671
Movements in the year
Purchases at cost** 1,035,577 - 17,000 1,629 1,054,206
Sales - proceeds** (1,444,127) - (37,121) (187) (1,481,435)
- realised gains/(losses) on sales 261,018 - 14,046 (433) 274,631
Increase/(decrease) in appreciation on assets held 315,573 - 2,894 (1,343) 317,124
Closing valuation as at 31 December 2016 3,256,922 - 169,831 47,444 3,474,197
Closing book cost 2,403,628 - 198,175 46,974 2,648,777
Closing appreciation/(depreciation)on assets held 853,294 - (28,344) 470 825,420
Closing valuation as at 31 December 2016 3,256,922 - 169,831 47,444 3,474,197
** Expenses incidental to the purchase or sale of investments are included within the purchase cost or deducted from the sale proceeds.These expenses amount to £1.6m (£2.0m) for purchases and £1.5m (£1.5m) for sales.

Alliance Trust PLC | Annual Report and Financial Accounts 2016
72
Financial Statements
9 Non-current assets
£000 Group and Company
Office premises freehold / Heritable property
Valuation at 31 December 2014 4,365
Revaluation 175
Valuation at 31 December 2015 4,540
Revaluation (40)
Valuation at 31 December 2016 4,500
At 31 December 2016 Cushman & Wakefield, an independent Chartered Surveyor, valued the office premises at 8 West Marketgait,Dundee at £4.50m (£4.54m) on the basis of market value. The valuation was in accordance with RICS Appraisal and Valuation Standards.The historic cost of the building as at 31 December 2016 was £12.7m (£12.7m).
£000 Group and Company
Other Fixed Assets
Opening book cost at 1 January 2015 856
Additions 25
Disposals -
Book cost at 31 December 2015 881
Additions 6
Disposals (721)
Transfers from Group companies 323
Book cost at 31 December 2016 489
Opening depreciation at 1 January 2015 (389)
Depreciation charge (193)
Disposals -
Depreciation at 31 December 2015 (582)
Depreciation charge (57)
Disposals 300
Transfers from Group companies (126)
Depreciation at 31 December 2016 (465)
Net book value at 31 December 2015 299
Net book value at 31 December 2016 24
10 Subsidiaries and Related Companies
The Group results incorporate the Company and ATSL in full only on the basis ATSL continues to provide services that relate directly to theinvestment activities of the Company, however it is not an investment entity itself. In 2016 all costs including staff and administrative costs,were charged directly to the applicable legal entity resulting in a lower level of recharged costs compared to the previous year. All intra-group transactions, balances, income and expenses within these entities are eliminated on consolidation.
At 31 December 2016 the Company owned 100% of ATS, AT2006, ATREP, ATSL, ATI, and ATEPL, AVMGP, ATEP2008GP andATEP2009GP. AT2006 owned 100% of SATL. A full list of investments in subsidiary entities is included in the basis of accounting note.
Investments in subsidiary companies are valued in the Group accounts at £169.8m (£170.7m) and Company’s accounts at £169.8m(£173.0m) being the Directors’ estimate of their fair value, using the guidelines and methodologies on valuation published by theInternational Private Equity and Venture Capital Association issued in December 2015 and external valuation inputs. This includes, the twomain trading investments, ATS at £61.5m (£54.0m) and ATI at £28.3m (£19.8m). The key financial results are noted below for both.
Alliance Trust Investments Limited
£000
Year ended
31 December 2016
Year ended
31 December 2015
Total income 22,007 10,545
Expenses (18,883) (12,598)
Profit/(loss) before exceptional items 3,124 (2,053)
Exceptional expenses (2,772) -
Profit/(loss) 352 (2,053)
Fair valuation 28,276 19,800

Alliance Trust PLC | Annual Report and Financial Accounts 2016
73
III Financial Statements III
10 Subsidiaries and Related Companies
Alliance Trust Savings Limited
£000
Year ended
31 December 2016
Year ended
31 December 2015
Total income 21,627 13,695
Expenses (20,385) (16,848)
Profit/(loss) before non-recurring and discontinued 1,242 (3,153)
Non-recurring and discontinued (68) (2,074)
Profit/(loss) 1,174 (5,227)
Fair valuation 61,500 54,000
The Directors have used several valuation methodologies as described in the International Private Equity and Venture Capital Associationguidelines issued in December 2015 to arrive at their best estimate of fair value, including discounted cash flow calculations, revenue andearnings multiples, recent market transactions where available and external valuations. Note 23.8 provides further information on thevaluation methodologies applied, including that the Directors involved an external valuation in their assessment of the fair value of ATS for2015 and 2016.
On 15 December 2016 Alliance Trust PLC announced the outcome of the Strategic Review and an agreement to sell Alliance TrustInvestments (ATI) to Liontrust Asset Management PLC. While completion of the deal is subject to conditions and approvals, completion isexpected to take place in early April 2017. The reported fair value of ATI reflects the 30 December 2016 value of Liontrust AssetManagement PLC shares to be used as consideration for the purchase of ATI, the expected net asset value of ATI and excludes anycontingent amounts.
The Company has invested in two sub-funds of Alliance Trust Investment Funds ICVC (‘ATIF’) and in two sub-funds in Alliance TrustSustainable Future ICVC ('ATSF'), both ATIF and ATSF are UK domiciled Open Ended Investment Companies (OEIC). In addition theCompany has invested in a sub-fund of Luxcellence, a Luxembourg domiciled Société d’Investissement à Capital Variable (SICAV). TheCompany redeemed its interest in the Monthly Income Bond Fund and Dynamic Bond Fund, sub-funds of ATIF, during 2016. As at 31December 2016 the Company held the following value of shares and proportions of each sub-fund. The value of the shares held by theCompany is also given below:
Dec 16
Proportion %
Dec 16
Value £000
Dec 15
Proportion %
Dec 15
Value £000
ATIF - Monthly Income Bond fund - - 20 63,184
ATIF - Dynamic Bond Fund - - 75 10,143
ATSF - Sustainable Future Cautious Managed Fund 66 11,850 80 10,950
ATSF - Sustainable Future Defensive Managed Fund 58 11,680 80 10,830
Luxcellence - Alliance Trust Sustainable Future Pan-European Equity Fund 44 69,497 49 62,902
- 93,027 - 158,009
11 Intangible assets
Group and Company
£000 Technology systems
Opening book cost at 1 January 2015 2,082
Additions 214
Book cost at 31 December 2015 2,296
Additions -
Transfers from Group companies (1,749)
Book cost at 31 December 2016 547
Opening amortisation at 1 January 2015 - (1,050)
Amortisation (329)
Amortisation at 31 December 2015 (1,379)
Amortisation -
Transfers from Group companies 832
Amortisation as at 31 December 2016 (547)
Carrying amount as at 31 December 2015 917
Carrying amount as at 31 December 2016 -
Amortisation is included within administrative expenses in the income statement.
Transfers were made to or from non-consolidated subsidiary companies at an arms length basis.

Alliance Trust PLC | Annual Report and Financial Accounts 2016
74
Financial Statements
12 Deferred tax
The following are the major deferred tax liabilities and assets recognised by the Group and Company and movements thereon during thecurrent and prior reporting period:
Group
£000
Retirementbenefit
obligations
AcceleratedTax
Depreciation Losses Foreign Tax Other Total
At 1 January 2015 - (liability)/asset (1,039) - 1,039 - - -
Income statement - deferred tax credit 204 - 303 - - 507
Income statement - deferred tax charge (307) - (104) - - (411)
Equity - deferred tax credit 4 - - - - 4
Equity - deferred tax charge (100) - - - - (100)
At 31 December 2015 - (liability)/asset (1,238) - 1,238 - - -
Income statement - deferred tax credit (3,373) - (1,097) - (58) (4,528)
Income statement - deferred tax charge 119 - (69) - - 50
Equity - deferred tax credit 4,528 - - - - 4,528
Equity - deferred tax charge (50) - - - - (50)
At 31 December 2016 - (liability)/asset (14) - 72 - (58) -
At the balance sheet date, the Group had unused tax losses of £82.7m (£53.8m) available for offset against future profits.
There are unrecognised deferred tax assets of £14.1m (£9.7m) in relation to unused tax losses and £3.7m (£0.2m) in relation to fixedassets and other timing differences. The Directors have not recognised this deferred tax asset due to uncertainty over the timing of futureprofits.
Tax payable of £3.9m (£3.9m) relates to the taxation of overseas dividends received before July 2009. The amount of the final liability to bepaid is dependent on the outcome of an ongoing class action in which the Company is participating.
Company
£000
Retirementbenefit
obligations
AcceleratedTax
Depreciation Losses Foreign Tax Other Total
At 1 January 2015 - (liability)/asset (1,039) - 1,039 - - -
Income statement - deferred tax credit 204 - 303 - - 507
Income statement - deferred tax charge (307) - (104) - - (411)
Equity - deferred tax credit 4 - - - - 4
Equity - deferred tax charge (100) - - - - (100)
At 31 December 2015 - (liability)/asset (1,238) - 1,238 - - -
Income statement - deferred tax credit (3,373) - (1,097) - (58) (4,528)
Income statement - deferred tax charge 119 - (69) - - 50
Equity - deferred tax credit 4,528 - - - - 4,528
Equity - deferred tax charge (50) - - - - (50)
At 31 December 2016 - (liability)/asset (14) - 72 - (58) -
At the balance sheet date, the Company had unused tax losses of £79.8m (£47.2m) available for offset against future profits.
There are unrecognised deferred tax assets of £13.6m (£9.3m) in relation to unused tax losses and £3.7m (£0.2m) in relation to fixedassets and other timing differences. The Directors have not recognised the deferred tax asset due to uncertainty over the timing of futureprofits.
Tax payable of £3.9m (£3.9m) relates to the taxation of overseas dividends received before July 2009. The amount of the final liability to bepaid is dependent on the outcome of an ongoing class action in which the Company is participating.
13 Outstanding settlements and other receivables
Group Company
£000 Dec 16 Dec 15 Dec 16 Dec 15
Dividends receivable 6,021 5,514 6,021 5,514
Other income receivable 43 544 43 544
Amounts due from subsidiary companies 366 797 438 1,529
Other debtors 3,330 5,270 3,319 1,841
9,760 12,125 9,821 9,428

Alliance Trust PLC | Annual Report and Financial Accounts 2016
75
III Financial Statements III
13 Outstanding settlements and other receivables
The Directors consider that the carrying amount of other receivables approximates to their fair value.
14 Outstanding settlements and other payables
Group Company
£000 Dec 16 Dec 15 Dec 16 Dec 15
Purchases of investments awaiting settlement 907 787 907 787
Amounts due to subsidiary companies 3,124 2,226 3,035 1,971
Other creditors 9,610 12,694 8,123 3,197
Interest payable 1,986 1,863 1,986 1,863
15,627 17,570 14,051 7,818
The Directors consider that the carrying amount of other payables approximates to their fair value.
15 Bank loans and unsecured fixed rate loan notes
Bank loans Group Company
£000 Dec 16 Dec 15 Dec 16 Dec 15
Bank loans repayable within one year 120,000 290,000 120,000 290,000
Analysis of borrowings by currency:
Bank loans - sterling 120,000 290,000 120,000 290,000
The weighted average % interest rates payable:
Bank loans 0.96% 1.33% 0.96% 1.33%
The Directors estimate the fair value of the borrowings to be:
Bank loans 120,000 290,000 120,000 290,000
Unsecured fixed rate loan notes Group Company
£000 Dec 16 Dec 15 Dec 16 Dec 15
Unsecured fixed rate loan notes 118,800 109,000 118,800 109,000
The effective interest rate payable:
Unsecured fixed rate loan notes 2.52% 3.44% 2.52% 3.44%
£100m of unsecured fixed loan notes were drawn down in July 2014, with 15 years duration at 4.28%. The fair value is estimated bydiscounting future cash flows using quoted benchmark interest yield curves as at the end of the reporting period and by obtaining lenderquotes for borrowings of similar maturity to estimate credit risk margin.
Long term fixed rate notes Group Company
£000 Dec 16 Dec 15 Dec 16 Dec 15
The total weighted average % interest rate 2.47% 2.09% 2.47% 2.09%
16 Share capital
Group Company
£000 Dec 16 Dec 15 Dec 16 Dec 15
Allotted, called up and fully paid:
- 492,703,932 ordinary shares of 2.5p each 12,319 13,160 12,319 13,160
The Company has one class of ordinary share which carries no right to fixed income.
The Employee Benefit Trust holds 698,062 (886,173) ordinary shares, acquired by its Trustee with funds provided by the Company. Duringthe year the Trustee increased its holding by Nil (Nil) shares. 188,111 (245,664) shares were transferred from the Employee Benefit Trustto participants in the Long Term Incentive Plans in satisfaction of awards.

Alliance Trust PLC | Annual Report and Financial Accounts 2016
76
Financial Statements
16 Share capital
Group Company
£000 Dec 16 Dec 15 Dec 16 Dec 15
Ordinary shares of 2.5p each
Opening share capital 13,160 13,835 13,160 13,835
Share buy backs (841) (675) (841) (675)
Closing share capital 12,319 13,160 12,319 13,160
Capital Management Policies and Procedures
The capital of the Company is managed in accordance with its investment policy in pursuit of its investment objective, both of which aredetailed on page 5. From February 2016 this function has been undertaken by ATI in its capacity as AIFM within parameters set by theBoard. The Group, Company and the remaining financial services subsidiary investments comply with the capital requirements of theirrelevant regulators, including the Capital Requirements Directive (CRD) and the Alternative Investment Fund Managers Directive (AIFMD).
17 Reserves
Group
£000Share
CapitalCapital
ReserveMerger
Reserve
CapitalRedemption
ReserveRevenueReserve Total
Net assets at 31 December 2014 13,835 2,223,715 645,335 5,163 120,916 3,008,964
Dividends - (7,779) - - (68,982) (76,761)
Unclaimed dividends returned - - - - 39 39
Profit for the year - 80,282 - - 60,592 140,874
Own shares purchased (675) (136,479) - 675 - (136,479)
Defined benefit plan net actuarial loss - (118) - - - (118)
Share based payments - 521 - - - 521
Net assets at 31 December 2015 13,160 2,160,142 645,335 5,838 112,565 2,937,040
Dividends - - - - (66,329) (66,329)
Unclaimed dividends redistributed - - - - (12) (12)
Profit for the year - 565,465 - - 65,863 631,328
Own shares purchased (841) (195,841) - 841 - (195,841)
Defined benefit plan net actuarial loss - (22,159) - - - (22,159)
Share based payments - 110 - - - 110
Net assets at 31 December 2016 12,319 2,507,717 645,335 6,679 112,087 3,284,137
Company
£000Share
CapitalCapital
ReserveMerger
Reserve
CapitalRedemption
ReserveRevenueReserve Total
Net assets at 31 December 2014 13,835 2,223,950 645,335 5,163 120,679 3,008,962
Dividends - (7,779) - - (68,982) (76,761)
Unclaimed dividends returned - - - - 39 39
Profit for the year - 82,931 - - 60,185 143,116
Own shares purchased (675) (136,479) - 675 - (136,479)
Defined benefit plan net actuarial loss - (118) - - - (118)
Share based payments - 521 - - - 521
Net assets at 31 December 2015 13,160 2,163,026 645,335 5,838 111,921 2,939,280
Dividends - - - - (66,329) (66,329)
Unclaimed dividends redistributed - - - - (12) (12)
Profit for the year - 563,223 - - 65,870 629,093
Own shares purchased (841) (195,841) - 841 - (195,841)
Defined benefit plan net actuarial loss - (22,159) - - - (22,159)
Share based payments - 110 - - - 110
Net assets at 31 December 2016 12,319 2,508,359 645,335 6,679 111,450 3,284,142
The Company revenue reserves distributable by way of a dividend are £111.5m (£111.9m). Realised capital reserves of £1,702m(£1,664m) can be distributed by way of a dividend. Unrealised capital reserves of £508m (£508m) relate to unrealised appreciation oninvestments. Total distributable reserves are £2,507m (£2,172m). Share buy backs are funded through realised capital reserves.

Alliance Trust PLC | Annual Report and Financial Accounts 2016
77
III Financial Statements III
18 Net Asset Value per Ordinary Share
The calculation of the net asset value per ordinary share is based on the following:
Group Company
£000 Dec 16 Dec 15 Dec 16 Dec 15
Equity shareholder funds 3,284,137 2,937,040 3,284,142 2,939,280
Number of shares at year end - Basic 492,005,870 525,454,724 492,005,870 525,454,724
Number of shares at year end - Diluted 492,703,932 526,340,897 492,703,932 526,340,897
The diluted figure is the entire number of shares in issue.
To arrive at the basic figure, the number of shares has been reduced by 698,062 (886,173) shares held by the Trustee of the EmployeeBenefit Trust. During the year the Trustee increased its holding by Nil (Nil) shares. 188,111 (245,664) shares were transferred from theEmployee Benefit Trust to participants in the LTIP in satisfaction of awards.
19 Segmental Reporting
The Company has identified a single operating segment, the investment trust, whose objective is to be a core investment for investorsseeking increasing capital growth and income over the long term. The accounting policies of the operating segment, which operates in theUK, are the same as those described in the summary of significant accounting policies. The Company evaluates performance based on thetotal profit before tax which is shown in the Company Income Statement on page 55.
20 Related Party Transactions
Transactions between the Company and ATSL are eliminated on consolidation.
Other subsidiaries held by the Group may purchase goods or services for other entities within the Group and recharge these costs directlyto the appropriate entity to which the costs relate.
There are no further related parties other than those stated below.
From 1 January 2016 all employee contracts were transferred to either ATI or ATS resulting in lower comparable costs. During 2015amounts were reimbursed/(repaid) between ATSL and the other entities as it acted as paymaster and employer of staff for all corporateentities.
Alliance Trust Services
£000
Year ended
31 December 2016
Year ended
31 December 2015
Paid by Alliance Trust PLC (the Company) 7,198 27,629
Paid to Alliance Trust PLC (the Company) (7,217) (15,787)
Due from/(to)ATSL (95) 417
Paid by Alliance Trust Savings Limited 30,906 25,087
Paid to Alliance Trust Savings Limited (2,750) (1,983)
Due from/(to)ATSL (58) 252
Paid by Alliance Trust Investments Limited 19,533 18,985
Paid to Alliance Trust Investments Limited (8,721) (2,890)
Due from/(to)ATSL (8) 392
Paid by Alliance Trust Equity Partners (Holdings) Limited - 20
Due from/(to)ATSL - -
Paid by Alliance Trust Equity Partners Limited 45 20
Paid to Alliance Trust Equity Partners Limited (3) (1)
Due from/(to)ATSL - -
Paid by Alliance Trust Real Estate Partners LP 108 130
Paid to Alliance Trust Real Estate Partners LP (10) (3)
Due from/(to)ATSL - (74)
Transactions with key management personnel
Details of the Non Executive Directors are disclosed on pages 26 to 27. The remuneration and other compensation including pension costpaid to the Directors during the year is summarised overleaf.
For the purpose of IAS 24 ‘Related Party Disclosures, key management personnel comprised the Chief Executive and senior management,plus the Non Executive Directors of the Company. In 2015 this also included the Members of the Executive Committee.
The 2016 remuneration paid to the previous Chief Executive has been borne by the Company. Details of the remuneration are disclosed inthe remuneration report on pages 38 to 44.

Alliance Trust PLC | Annual Report and Financial Accounts 2016
78
Financial Statements
20 Related Party Transactions
Group Company
£000 Dec 16 Dec 15 Dec 16 Dec 15
Total emoluments 467 2,847 467 2,089
Payments to former key management personnel 625 474 625 474
Post retirement benefits - 61 - 27
Equity compensation benefits 71 538 71 423
1,163 3,920 1,163 3,013
21 Analysis of change in net cash/(debt)
Group
£000 Dec 14 Cash flow
Othergains /
(losses) Dec 15 Cash flow
Othergains /
(losses) Dec 16
Cash and cash equivalents 44,102 (18,865) (84) 25,153 28,468 (2,527) 51,094
Bank loans and unsecured fixed rateloan notes (390,200) (10,000) 1,200 (399,000) 170,000 (9,800) (238,800)
Net (debt)/cash (346,098) (28,865) 1,116 (373,847) 198,468 (12,327) (187,706)
Company
£000 Dec 14 Cash flow
Othergains /
(losses) Dec 15 Cash flow
Othergains /
(losses) Dec 16
Cash and cash equivalents 40,685 (23,634) (84) 16,967 34,990 (2,527) 49,430
Bank loans and unsecured fixed rateloan notes (390,200) (10,000) 1,200 (399,000) 170,000 (9,800) (238,800)
Net (debt)/cash (349,515) (33,634) 1,116 (382,033) 204,990 (12,327) (189,370)
Other gains/(losses) includes movement on foreign exchange and movements in the fair value of the fixed rate loan notes.
22 Financial commitments
Financial commitments as at 31 December 2016, which have not been accrued, for the Group and the Company totalled £28.5m(£43.9m).These were in respect of uncalled subscriptions in investments in our private equity portfolio structured as limited partnerships(LP). These LP commitments, which can include recallable distributions received, may be called at any time up to an agreed contractualdate. The Company may choose not to fulfil individual commitments but may suffer a penalty should it do so, the terms of which varybetween investments.
A maturity analysis of the expiry dates of these LP commitments is presented below:
Group and Company
£000 Dec 16 Dec 15
< 1 year 1,722 1,446
1-5 years 18,208 33,511
5-10 years 8,555 8,930
28,485 43,887
The Company has provided letters of comfort in connection with banking facilities made available to certain of its subsidiaries. TheCompany provided letters to AT2006 and ATREP GP confirming ongoing support for at least 12 months from the date the annual financialstatements were signed, to make sufficient funds available if needed to enable them to continue trading, meet commitments and not toseek repayment of any amounts outstanding.
The Company provides ongoing regulatory support for ATS in the context of its role as a consolidated bank holding company whenrequired.
On 25 March 2011 the Company granted a floating charge of up to £30.0m over its listed investments to the Trustees of the Alliance TrustCompanies Pension Fund. The Trustees released the floating charge in December 2016.

Alliance Trust PLC | Annual Report and Financial Accounts 2016
79
III Financial Statements III
23 Financial instruments and Risk
The Strategic Report details the Company’s approach to investment risk management on pages 18 and 19 and the accounting policies onpages 59 to 64 explain the basis on which currencies and investments are valued for accounting purposes.
The Directors are of the opinion that the fair values of financial assets and liabilities of the Group are not materially different to their carryingvalues.
Capital Risk Management
The Group manages its capital to ensure that entities in the Group and the Company will be able to continue as a going concern whilemaximising the return to stakeholders through the optimisation of the use of debt and equity balances. The Group's and Company’s overallstrategy remains unchanged from the year ended 31 December 2015.
The capital structure of the Group and the Company consists of debt, which includes the borrowings disclosed in Note 15, cash and cashequivalents and equity attributable to equity holders of the Company comprising issued capital, reserves and retained earnings asdisclosed in Note 17 to the financial statements.
The Board reviews the capital structure of the Company and the Group on an at least a semi-annual basis. The Group and the Companyhave decided that net gearing should at no time exceed 30% of the net assets of either the Group or the Company.
Group Company
£000 Dec 16 Dec 15 Dec 16 Dec 15
Debt* (238,800) (399,000) (238,800) (399,000)
Cash and cash equivalents 51,094 25,153 49,430 16,967
Net (debt) (187,706) (364,847) (189,370) (373,033)
Net (debt) as % of net assets (5.7)% (12.7)% (5.8)% 13.0%
* If debt had been valued at par, on a Group and Company basis net debt as a % of net assets would be 5.1% (12.4%) and 5.2% (12.7%)respectively.
Risk management policies and procedures
As an investment trust the Company invests in equities, private equity, financial instruments and its subsidiary businesses for the long termin order to achieve the investment objectives set out on page 5. In pursuing these objectives the Company is exposed to a variety of risksthat could result in a reduction in the Company’s net assets or a reduction in the profits available for payment as dividends.
The principal financial instruments at risk comprise those in the Company’s investment portfolio and this note addresses these risks below.The Group has certain additional risks, and these are detailed in the appropriate sections below.
These risks and the Directors’ approach to managing them are set out below under the following headings: market risk (comprisingcurrency risk, interest rate risk, and other price risk), credit risk, liquidity risk, and gearing risk.
The Group has a risk management framework in place which is described in detail on pages 22 to 24. The objectives, policies andprocesses for managing the risks, and the methods used to measure the risks have not changed from the previous accounting year.
23.1 Market Risk
Market risk embodies the potential for both losses and gains and includes currency risk (see note 23.2), interest rate risk (see note 23.3)and other price risk (see note 23.4). Market risk is managed on a regular basis by ATI in its role as AIFM. ATI manages the capital of theCompany within parameters set by the Directors on investment and asset allocation strategies and risk. These activities performed by ATIare overseen by the Board Management Engagement Committee.
The Company’s strategy on investment risk is outlined in our statement of investment objectives and policy on page 5.
Details of the investment portfolio at the balance sheet date are disclosed on pages 18 to 19.
23.2 Currency Risk
Some of the Group’s assets, liabilities and transactions are denominated in currencies other than its functional currency of Sterling.Consequently the Group is exposed to the risk that movements in exchange rates may affect the Sterling value of those items.
The Group’s currency holdings and gains/losses thereon are reviewed regularly by the Directors, and the currency risk is managed on aregular basis by ATI within parameters set by the Directors on investment and asset allocation strategies and risk. The Group enters intoforward exchange contracts to cover specific foreign currency exposure.
The currency exposure for overseas investments is based on the quotation currency of each holding, while the currency exposure for netmonetary assets is based on the currency in which each asset or liability is denominated. At the reporting date the Group and Companyhad the following exposures:
Alliance Trust PLC | Annual Report and Financial Accounts 2016
80
Financial Statements
23 Financial instruments and Risk
23.2 Currency Risk
Group and Company
Currency Exposure
£000
Overseasinvestments
Dec 16
Net monetaryassets
Dec 16
Totalcurrencyexposure
Dec 16
Overseasinvestments
Dec 15
Net monetaryassets
Dec 15
Totalcurrencyexposure
Dec 15
US dollar 1,760,969 240 1,761,209 1,481,269 740 1,482,009
Euro 399,530 - 399,530 396,450 - 396,450
Yen 173,188 - 173,188 178,833 - 178,833
Other non-sterling 514,158 - 514,158 437,114 - 437,114
2,847,845 240 2,848,085 2,493,666 740 2,494,406
Sensitivity analysis
If Sterling had strengthened by 10% (5%) relative to all currencies, with all other variables held constant, the income statement and the netassets attributable to equity holders of the parent would have decreased by the amounts shown below. The analysis is performed on thesame basis as for the year ended 31 December 2015. The revenue return impact is an estimated figure for 12 months based on the cashbalances at the reporting date.
Group Company
£000 Dec 16 Dec 15 Dec 16 Dec 15
Income Statement
Revenue return (5,976) (2,936) (5,976) (2,936)
Capital return (284,784) (124,683) (284,784) (124,683)
Net Assets (290,760) (127,619) (290,760) (127,619)
A 10% (5%) weakening of Sterling against the above currencies would have resulted in an equal and opposite effect on the aboveamounts, on the basis that all other variables remain constant.
23.3 Interest Rate Risk
The Group is exposed to interest rate risk in a number of ways. A movement in interest rates may affect the fair value of investments infixed interest rate securities, income receivable on cash deposits and interest payable on variable rate borrowings.
The Company finances part of its activities through borrowings at levels which are approved and monitored by the Board. The possibleeffects on fair value and cash flows as a result of an interest rate change are taken into account when making investment or borrowingdecisions.
The following table details the Group’s and Company’s exposure to interest rate risks for bank and loan balances:
Group Company
£000 Dec 16 Dec 15 Dec 16 Dec 15
Exposure to floating interest rates
Cash at bank 51,094 25,153 49,430 16,967
Bank loans repayable within one year (120,000) (290,000) (120,000) (290,000)
(68,906) (264,847) (70,570) (273,033)
Sensitivity analysis
If interest rates had decreased by 0.25% (0.25%), with all other variables held constant, the income statement result and the net assetsattributable to equity holders of the parent would have increased by the amounts shown below. The revenue return impact is an estimatedfigure for the year based on the cash balances at the reporting date.

Alliance Trust PLC | Annual Report and Financial Accounts 2016
81
III Financial Statements III
23 Financial instruments and Risk
23.3 Interest Rate Risk
Group Company
£000 Dec 16 Dec 15 Dec 16 Dec 15
Income statement
Revenue return 64 431 68 451
Capital return 109 233 109 233
Net Assets 173 664 177 684
If interest rates had increased by 0.25% (0.25%) with all other variables held constant, the income statement result and net assetsattributable to equity holders of the parent would have decreased by the amounts shown below.
Group Company
£000 Dec 16 Dec 15 Dec 16 Dec 15
Income statement
Revenue return (63) (429) (67) (449)
Capital return (109) (233) (109) (233)
Net Assets (172) (662) (176) (682)
23.4 Other Price Risk
Other price risk is the risk that the value of a financial instrument will fluctuate as a result of changes in market prices (other than thosearising from currency risk or interest rate risk), whether caused by factors specific to an individual investment or its issuer, or by factorsaffecting all instruments traded in that market.
As the majority of the Group’s financial assets are carried at fair value with fair value changes recognised in the income statement, allchanges in market conditions will directly affect gains and losses on investments and net assets.
The Directors manage price risk by having a suitable investment objective for the Company. The Board reviews this objective andinvestment performance regularly. The risk is managed on a regular basis by ATI within parameters set by the Directors on investment andasset allocation strategies and risk.
Concentration of exposure to other price risks
A listing of the Company’s equity investment portfolio is shown on pages 18 to 19. The largest amount of equity investments by value is inNorth America, with significant amounts also in Europe, Asia and the UK. It also shows the concentration of investments in various sectors.
The following table details the Group’s exposure to market price risk on its quoted and unquoted equity investments:
Group Company
£000 Dec 16 Dec 15 Dec 16 Dec 15
Investments at fair value through Profit & Loss
Listed 3,157,042 2,930,872 3,157,042 2,930,872
Foreign exchange contracts 6,853 - 6,853 -
Unlisted 47,444 47,778 47,444 47,778
Investments in Collective Investment Schemes 93,027 158,009 93,027 158,009
Investments in Related and Subsidiary Companies 169,799 170,738 169,831 173,012
3,474,165 3,307,397 3,474,197 3,309,671
Sensitivity analysis
93.7% (93.3%) of the Company’s investment portfolio is listed on stock exchanges. If share prices had decreased by 10% with all othervariables remaining constant, the income statement result and the net assets attributable to equity holders of the parent would havedecreased by the amounts shown below. The analysis for last year assumed a share price decrease of 10%.
Alliance Trust PLC | Annual Report and Financial Accounts 2016
82
Financial Statements
23 Financial instruments and Risk
23.4 Other Price Risk
Group Company
£000 Dec 16 Dec 15 Dec 16 Dec 15
Income statement
Revenue return - - - -
Capital return (325,692) (308,888) (325,692) (308,888)
Net Assets (325,692) (308,888) (325,692) (308,888)
A 10% increase (10% increase) in share prices would have resulted in a proportionate equal and opposite effect on the above amounts, onthe basis that all other variables remain constant.
23.5 Credit Risk
Credit risk is the risk that a counterparty to a financial instrument will fail to discharge an obligation or commitment that it has entered intowith the Group.
This risk is managed as follows:
• Investment transactions are carried out with a number of well established, approved brokers.
• Investment transactions are carried out on a cash against receipt or cash against delivery basis
The Group minimises credit risk through banking polices which restrict banking deposits to highly rated financial institutions. The policiesalso set maximum exposure to individual banks.
The Group has adopted a policy of only dealing with credit worthy counterparties and obtaining sufficient collateral where appropriate (cashand gilts) as a means of mitigating the risk of financial loss from defaults.
At the reporting date, the Group’s and Company's cash and cash equivalents exposed to credit risk were as follows:
Group Company
£000 Dec 16 Dec 15 Dec 16 Dec 15
Credit Rating
Aa1 47,879 15,248 47,879 15,248
A3 3,215 9,905 1,551 1,719
51,094 25,153 49,430 16,967
Average maturity 1 day 1 day 1 day 1 day
The Company’s UK listed equities and its overseas listed equities are held by Bank of New York Mellon as custodian. Bankruptcy orinsolvency of the custodian may cause the Group’s rights with respect to securities held by the custodian to be delayed or limited.
23.6 Liquidity Risk
Liquidity risk is the risk that an entity will encounter difficulty in meeting its obligations associated with financial liabilities.
This is not a significant risk for the Company as the majority of its assets are investments in quoted equities that are readily realisable. Italso has the ability to borrow, which gives it access to additional funding when required. At the balance sheet date it had the followingfacilities:
£000 Dec 16 Expires Dec 15 Expires
Committed multi currency facility - RBS 100,000 100,000 31/12/2018
Amount drawn - - - -
Committed multi currency facility - RBS - -
Amount drawn - - - -
Committed multi currency facility - RBS 50,000 31/12/2016 50,000 31/12/2016
Amount drawn - - - -
Committed multi currency facility - RBS 100,000 31/03/2017 100,000 31/03/2017
Amount drawn 100,000 - 90,000 -
Committed multi currency facility - Scotiabank 100,000 27/03/2018 100,000 27/03/2018
Amount drawn 20,000 - 100,000 -

Alliance Trust PLC | Annual Report and Financial Accounts 2016
83
III Financial Statements III
23 Financial instruments and Risk
23.6 Liquidity Risk
£000 Dec 16 Expires Dec 15 Expires
Committed multi currency facility - Scotiabank - -
Amount drawn - - - -
Committed multi currency facility - Scotiabank 100,000 22/12/2017 100,000 22/12/2017
Amount drawn - - 100,000 -
Unsecured fixed rate loan notes* 100,000 31/07/2029 100,000 31/07/2029
Amount drawn 100,000 - 100,000 -
Total facilities 550,000 550,000
Total drawn 220,000 - 390,000 -
All the facilities are unsecured and have covenants on the maximum level of gearing and minimum net asset value of the Company.
* The fair value of fixed rate loan notes is shown in note 15.
23.7 Gearing Risk
This is the risk that the movement in the fair value of the assets of the Company is amplified by any gearing that the Company may have.The exposure to this risk and the sensitivity analysis is detailed below.
Group Company
£000 Dec 16 Dec 15 Dec 16 Dec 15
Investments after gearing 3,474,165 3,307,397 3,474,197 3,309,671
Gearing* (238,800) (399,000) (238,800) (399,000)
Investments before gearing 3,235,365 2,908,397 3,235,397 2,910,671
* Gearing is expressed as debt at fair value
Sensitivity analysis
If net assets before gearing had decreased by 10%, with all other variables held constant, the income statement result and the net assetsattributable to equity holders of the parent would have further decreased by the amounts shown below. The analysis for last year assumeda net assets before gearing decrease of 10%.
Group Company
£000 Dec 16 Dec 15 Dec 16 Dec 15
Income Statement
Revenue return - - - -
Capital return (23,800) (39,000) (23,800) (39,000)
Net Assets (23,800) (39,000) (23,800) (39,000)
A 10% increase (10% increase) in net assets before gearing would have resulted in an equal and opposite effect on the above amounts, onthe basis that all other variables remain constant.
23.8 Hierarchical Valuation of Financial Instruments
The Group refines and modifies its valuation techniques as markets develop. While the Group believes its valuation techniques to beappropriate and consistent with other market participants, the use of different methodologies or assumptions could result in differentestimates of fair value at the balance sheet date.
The table below analyses financial instruments carried at fair value, by valuation method. The different levels have been defined as follows:
Level 1 Quoted prices (unadjusted) in active markets for identical assets or liabilities
Level 2 Inputs other than quoted prices included within level 1 that are observable for the asset or liability, either directly (that is, as prices) or indirectly (that is, derived from prices)
Level 3 Inputs for the asset or liability that are not based on observable market data (that is, unobservable inputs)
The following table analyses the fair value measurements for the Group's and Company's assets and liabilities measured by the level in thefair value hierarchy in which the fair value measurement is categorised at 31 December 2016. All fair value measurements disclosed arerecurring fair value measurements.

Alliance Trust PLC | Annual Report and Financial Accounts 2016
84
Financial Statements
23 Financial instruments and Risk
23.8 Hierarchical Valuation of Financial Instruments
Group valuation hierarchy fair value through profit and loss
As at 31 December 2016 As at 31 December 2015
£000 Level 1 Level 2 Level 3 Total Level 1 Level 2 Level 3 Total
Listed investments 3,250,069 - - 3,250,069 3,088,881 - - 3,088,881
Foreign exchangecontracts - 6,853 - 6,853 - - - -
Unlisted investments
Private equity - - 113,007 113,007 - - 125,254 125,254
Alliance Trust Savings - - 61,500 61,500 - - 54,000 54,000
Alliance Trust Finance(in liquidation) - - - - - - 720 720
Alliance TrustInvestments - - 28,276 28,276 - - 19,800 19,800
Mineral rights - - 13,187 13,187 - - 17,535 17,535
Other - - 1,273 1,273 - - 1,207 1,207
3,250,069 6,853 217,243 3,474,165 3,088,881 - 218,516 3,307,397
Company valuation hierarchy fair value through profit and loss
As at 31 December 2016 As at 31 December 2015
£000 Level 1 Level 2 Level 3 Total Level 1 Level 2 Level 3 Total
Listed investments 3,250,069 - - 3,250,069 3,088,881 - - 3,088,881
Foreign exchangecontracts - 6,853 - 6,853 - - - -
Unlisted investments
Private equity - - 113,007 113,007 - - 125,254 125,254
Alliance Trust Savings - - 61,500 61,500 - - 54,000 54,000
Alliance Trust Finance(in liquidation) - - - - - - 720 720
Alliance TrustInvestments - - 28,276 28,276 - - 19,800 19,800
Mineral rights - - 13,187 13,187 - - 17,535 17,535
Other - - 1,305 1,305 - - 3,481 3,481
3,250,069 6,853 217,275 3,474,197 3,088,881 - 220,790 3,309,671
There have been no transfers of recurring measurements during the year between Levels 1, 2 and 3.
Fair Value Assets in Level 1
The quoted market price used for financial investments held by the Group is the current bid price. These investments are included withinLevel 1 and comprise equities, bonds and exchange traded derivatives.
Fair Value Assets in Level 2
The fair value of financial instruments that are not traded in an active market (for example, over-the-counter derivatives) is determined byusing valuation techniques. These valuation techniques maximise the use of observable market data where it is available and with minimalreliance on entity specific estimates.
Fair Value Assets in Level 3
Level 3, excluding the valuations of the subsidiaries, are reviewed at least annually by the Valuation Committee of ATI. The valuations ofthe two trading subsidiaries, ATI and ATS are reviewed at least annually by the Audit and Risk Committee with valuations recommended tothe Board of the Company. The ATI Valuation Committee considers the appropriateness of the valuation models, inputs, using the variousvaluation methods in accordance with the Group's valuation policy. The Committee will determine the appropriateness of any valuation ofthe underlying assets.
The following table shows the reconciliation from the beginning balances to the ending balances for fair value measurement in Level 3 ofthe fair value hierarchy.

Alliance Trust PLC | Annual Report and Financial Accounts 2016
85
III Financial Statements III
23 Financial instruments and Risk
23.8 Hierarchical Valuation of Financial Instruments
£000 Group Company
Dec 16 Dec 15 Dec 16 Dec 15
Balance at 1 January 218,516 232,531 220,790 232,609
Net (loss)/gain from financial instruments at fair value through profit orloss 3,793 (16,556) 1,551 (14,360)
Purchases at cost 18,629 42,908 18,629 42,908
Sales proceeds (37,308) (38,175) (37,308) (38,175)
Realised (loss)/gain on sale 13,613 (2,192) 13,613 (2,192)
Balance at 31 December 217,243 218,516 217,275 220,790
Investments in subsidiary companies (Level 3) are valued in the Group accounts at £169.8m (£170.7m) and in the Company’s accounts at£169.8m (£173.0m) being the Directors' estimate of their fair value, using the guidelines and methodologies on valuation published by theInternational Private Equity and Venture Capital Association issued in December 2015 and where applicable external valuations. Thisincludes a valuation of ATS at £61.5m (£54.0m). This represents the Directors' view of the amount for which the subsidiary could beexchanged between knowledgeable willing parties in an arm's length transaction. This does not assume that the Company currently hasany intention to sell the subsidiary business in the future. The Directors have used several valuation methodologies as prescribed in theguidelines to arrive at their best estimate of fair value including discounted cash flow calculations, revenue and earnings multiples andrecent market transactions where available.
For 31 December 2016 the fair valuation of ATI is based on the recently announced transaction to sell ATI to Liontrust Asset ManagementPLC. The valuation is based on the fair value of Liontrust shares to be used to fund the transaction and the expected net asset value ofATI excluding any contingent amounts. (note 10)
The following key assumptions are relevant to the fair valuation of our investment in our subsidiary companies, and are consistent with prioryears:
• Alliance Trust Savings - This is valued as a trading business. For the fair valuation of ATS at 31 December 2016 the Audit and RiskCommittee took advice from an external valuer in arriving at the fair value of ATS. The Audit and Risk Committee challenged the range of values provided and after fully reviewing the methodology and
assumptions the Committee approved the reported valuation. An internal model prepared by management using a discounted cash flow has been used for comparative purposes.
The multiples applied in valuing our subsidiary are derived from comparable companies sourced from market data.
Mineral rights are carried at fair value and are valued in the Company’s accounts at £13.2m (£17.5m) being the Directors' estimate of theirfair value, using the guidelines and methodologies on valuation published by the Oklahoma Tax Commission and for non-producingproperties, the Lierle US Price Report.
The table below details how an increase or decrease in the respective input variables would impact the valuation disclosed for the relevantLevel 3 assets.
£000
Investment
Fair Value
at Dec 16 Valuation Method Unobservable inputs Input
Input
sensitivity +/-
Change in
valuation +/-
Alliance Trust Savings 61,500 Discounted cash flow DCF discount rate 12.5% 0.5 3,800/(3,500)
Mineral Rights 13,187 Oklahoma Tax Commission Revenue multiple - gas 7 1 933/(933)
multiples and Lierle US Price Revenue multiple - oil 4 1 363/(363)
report (for non-producing Revenue multiple - 4 1 760/(760)
properties). products/condensate
Average bonus 1 0.5 1,158/(1,158)
multiple non-producing
The change in valuation disclosed in the above table shows the direction an increase or decrease in the respective input variables wouldhave on the valuation result. For Mineral rights, an increase in the revenue multiple and average bonus multiple would lead to an increasein the estimated value.
For the 31 December 2016 and 2015 fair valuations of ATS the Board has taken advice from an external valuer. This approach was takensubsequent to the purchase of Stocktrade and the decision to use an external valuer is to apply a degree of independence and externalchallenge into the valuation. The external valuation was compared against internal valuations models prepared by management.
Private equity investments, both fund-to-fund and direct included under Level 3, are valued in accordance with the International PrivateEquity and Venture Capital Valuation Guidelines issued in December 2015. Unlisted investments in private equity are stated at thevaluation as determined by the Valuation Committee based on information provided by the General Partner. The General Partner’s policy invaluing unlisted investments is to carry them at fair value. The General Partner will generally rely on the fund's investment manager’s fairvalue at the last reported period, rolled forward for any cashflows. However if the General Partner does not feel the manager is reflecting afair value they will select a valuation methodology that is most appropriate for the particular investments in that fund and generate a fair

Alliance Trust PLC | Annual Report and Financial Accounts 2016
86
Financial Statements
23 Financial instruments and Risk
23.8 Hierarchical Valuation of Financial Instruments value. In those circumstances the General Partner believes the most appropriate methodologies to use to value the underlying investmentsin the portfolio are:
• Price of a recent investment
• Multiples
• Net assets
• Industry valuation benchmarks
An entity is not required to create quantitative information to comply with this disclosure requirement if quantitative unobservable inputs arenot developed by the entity when measuring fair value (for example, when an entity uses prices from prior transactions or third-party pricinginformation without adjustment). ATI receives information from the General Partner on the underlying investments which is subsequentlyreviewed by the Valuation Committee. Where the Valuation Committee does not feel that the valuation is appropriate, an adjustment will bemade.
From 1 January 2016 unsecured fixed rate loan notes are recognised at fair value. In 2015 the fixed rate loan notes were initiallyrecognised at a carrying value equivalent to the proceeds received net of issue costs associated with the borrowings. As disclosed in theaccounting policies note the 2015 opening and closing valuations have been restated at fair value.
After initial recognition, unsecured fixed rate loan notes are subsequently measured at amortised cost using the effective interest ratemethod. The effective rate of interest is 2.47%.
No interrelationships between unobservable inputs used in the above valuations of Level 3 investments have been identified.
24 Share Based Payments
The Group operated the share based payment schemes:
All Employee Share Ownership Plan ('AESOP')
Employees could receive up to £3,600 of shares annually under the terms of the AESOP. This amount is pro rated for part time employees.Individuals receive these shares free of all restrictions after a period of 5 years. No such awards were made in 2016. In 2015 the charge tothe income statement for these awards was £312,000. The total costs for the AESOP for all staff are borne by the Company as the awardis based on key performance metrics and criteria relating to the Company. On this basis the AESOP cost has not been recharged tosubsidiary companies.
Long Term Incentive Plan ('LTIP')
The LTIP is a discretionary plan for Executive Directors and senior managers. It comprised two elements: first it provided for the grant ofmatching awards based on the proportion of annual bonus applied by participants in the purchase of shares in the Company and held bythe Employee Benefit Trust; and second it provided for the grant of performance awards. Both awards, granted over shares in theCompany, vest either in full or in part at the end of the three year performance period subject to meeting pre-defined targets.
In the year ended 31 December 2016, no new awards were made.
In the year to 31 December 2015 participating employees applied a proportion of their annual cash bonuses for the year ended 31December 2014 to purchase 98,002 shares of Alliance Trust PLC at a price of £5.10 per share. Matching awards of up to 317,880 sharesand performance awards of up to 552,263 were granted. Matching awards and performance awards made were valued at £588,000 and£1,022,000 respectively. The fair value of the awards granted during 2015 was calculated using a binomial methodology. The assumptionsused were a share price of £5.07, share price volatility of 11% based on a long term dividend yield of 2.08%, comparator group share pricecorrelation of 40%, risk free interest rate of 0.94% and forfeiture of Nil.
The cumulative credit to the income statement during the year for the cost of the LTIP awards referred to above was £1,000 (£52,000charge). In the year to 31 December 2016 a £70,000 credit (£473,000 charge) was recognised in reserves in relation to equalisation ofamounts carried forward from the prior year. These charges related to the Company only.
As a result of the transfer of staff employment contracts to ATI and ATS the cumulative incentive plan reserves as at 31 December 2015were transferred to the respective new employing company. The 2016 LTIP expense recorded by the Company relates to the previousChief Executive who left in 2016 and staff made redundant in 2015 who were classed as good leavers.
In accordance with IFRS 2 the costs of matching and performance awards for each plan are expensed over the three year performanceperiod.
These costs are only adjusted if certain vesting conditions are not met, for example if a participant leaves before the end of the three yearvesting period.
Deferred Bonus Award
The Deferred Bonus Award is a discretionary plan for FCA code staff in subsidiaries, where they are required to defer 50% of an annualbonus award for 3 years. Shares in the Company are awarded up to the value of the deferred award and are held by the Employee BenefitTrust. The award, granted over shares in the Company vests in full or in part at the end of the three year holding period subject to therebeing no material misstatement or fraud in the results of the year that the grant relates to. The cost of all awards are reflected in thesubsidiaries.

Alliance Trust PLC | Annual Report and Financial Accounts 2016
87
III Financial Statements III
24 Share Based Payments
Movements in optionsMovements in options granted under the LTIP are as follows:
Group
December 2016
Group
December 2015
£000Number of
optionsWeighted average
exercise priceNumber of
optionsWeighted average
exercise price
Outstanding at 1 January 2,394,619 £0.00 2,912,170 £0.00
Granted during year 85,102 £0.00 870,143 £0.00
Exercised during year (188,111) £0.00 (245,668) £0.00
Forfeited during year (9,686) £0.00 (343,545) £0.00
Expired during year (556,091) £0.00 (798,481) £0.00
Outstanding at 31 December 1,725,833 £0.00 2,394,619 £0.00
Exercisable at 31 December - £0.00 - £0.00
The weighted average remaining contractual life of the options outstanding at 31 December 2016 was 745 days (577 days).
The weighted average exercise price of the options is Nil (Nil) as any options which vest at the end of the performance period are satisfiedby shares held on behalf of the Company by the Trustee of the Employee Benefit Trust.
25 Pension Scheme
The Group sponsors two pension arrangements. The following disclosures apply to both the Group and the Company.
The Alliance Trust Companies’ Pension Fund (the ‘Scheme’) is a funded defined benefit pension scheme which was closed to futureaccrual on 2 April 2011. On 31 May 2016 the Trustees of the Scheme purchased an annuity with Legal & General. The purpose of thistransaction was to align the assets of the Scheme with long term liabilities and to reduce risk on long term liabilities.
The disclosures which follow relate to the Scheme.
Participating Employer
ATSL is the sole Participating Employer and its pension obligations are guaranteed by the Company.
Valuation and Contributions
The last full actuarial valuation of the Scheme was carried out by a qualified independent actuary as at 1 April 2015 although for thepurpose of these calculations the results of the 1 April 2015 valuation have been updated on an approximate basis to 31 December 2016.Valuations are on the projected unit credit method.
In May 2016 the Board decided to inject £19.2m into the Scheme to fund the purchase of an annuity policy with Legal & General to matchthe Scheme’s liabilities to its members. The annuity was purchased by the Trustees of the Scheme on 31 May 2016. The SOCI reports adefined benefit plan net actuarial loss of £26.6m. This is attributable to the £19.2m annuity purchase, a £0.2m employer contribution, a£0.4m IAS 19 credit recognised in the Income Statement and a £6.8m reduction of the Pension Scheme surplus.
Risks
Following the purchase of the group annuity policy the principal risks the Scheme typically exposes the Group to are as follows:
- Covenant risk: There is a risk that the insurance companies providing the annuities will fail, following which the responsibility for makingthe benefit payments under the Scheme would remain with the Scheme (and ultimately the Company). This risk is mitigated as in the eventof insurer insolvency, the Financial Services Compensation Scheme would apply, providing some protection to the Scheme.
- Investment risk: The risk of the Scheme failing to hold investments to match the liabilities of the Scheme is extinguished by holdingannuities. Any failure of an insurance company involved could however return this risks to the Scheme.
- Actuarial risk: The Trustees are aware that there are actuarial risks associated with the longevity of the members, interest rates andinflation. Although these are now matched by annuities this does not however totally remove actuarial risk, as any failure of an insurancecompany involved could return these risks to the Scheme.
Reconciliation of opening and closing balances of the present value of the defined benefit obligation
£000 31 December 2016 31 December 2015
Defined benefit obligation at start of year 37,119 38,783
Past service cost 139 -
Interest 1,398 1,330
Actuarial losses/(gains) 16,303 (1,389)
Benefits paid (690) (1,605)
Defined benefit obligation at end of year 54,269 37,119
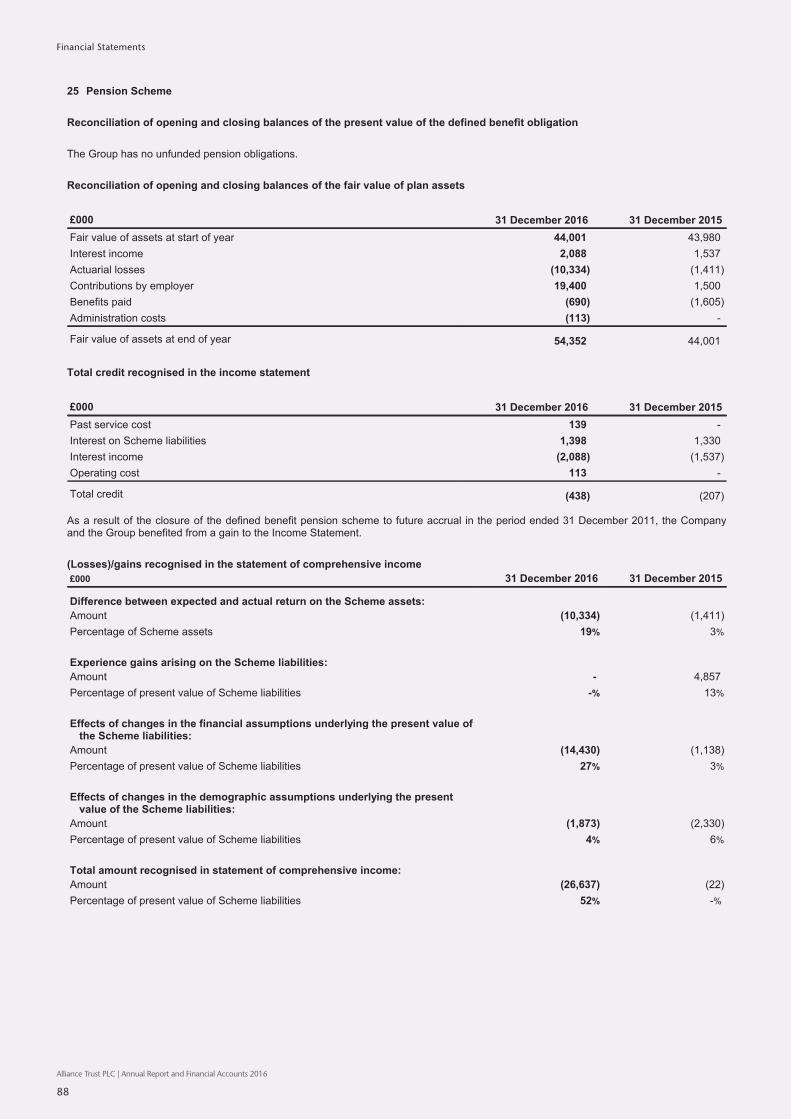
Alliance Trust PLC | Annual Report and Financial Accounts 2016
88
Financial Statements
25 Pension Scheme
Reconciliation of opening and closing balances of the present value of the defined benefit obligation
The Group has no unfunded pension obligations.
Reconciliation of opening and closing balances of the fair value of plan assets
£000 31 December 2016 31 December 2015
Fair value of assets at start of year 44,001 43,980
Interest income 2,088 1,537
Actuarial losses (10,334) (1,411)
Contributions by employer 19,400 1,500
Benefits paid (690) (1,605)
Administration costs (113) -
Fair value of assets at end of year 54,352 44,001
Total credit recognised in the income statement
£000 31 December 2016 31 December 2015
Past service cost 139 -
Interest on Scheme liabilities 1,398 1,330
Interest income (2,088) (1,537)
Operating cost 113 -
Total credit (438) (207)
As a result of the closure of the defined benefit pension scheme to future accrual in the period ended 31 December 2011, the Companyand the Group benefited from a gain to the Income Statement.
(Losses)/gains recognised in the statement of comprehensive income
£000 31 December 2016 31 December 2015
Difference between expected and actual return on the Scheme assets:
Amount (10,334) (1,411)
Percentage of Scheme assets 19% 3%
Experience gains arising on the Scheme liabilities:
Amount - 4,857
Percentage of present value of Scheme liabilities -% 13%
Effects of changes in the financial assumptions underlying the present value ofthe Scheme liabilities:
Amount (14,430) (1,138)
Percentage of present value of Scheme liabilities 27% 3%
Effects of changes in the demographic assumptions underlying the presentvalue of the Scheme liabilities:
Amount (1,873) (2,330)
Percentage of present value of Scheme liabilities 4% 6%
Total amount recognised in statement of comprehensive income:
Amount (26,637) (22)
Percentage of present value of Scheme liabilities 52% -%

Alliance Trust PLC | Annual Report and Financial Accounts 2016
89
III Financial Statements III
25 Pension SchemeAssets
£000 31 December 2016 31 December 2015 31 December 2014
Equities - 17,601 22,395
Bonds - 21,120 21,251
Other 54,352 5,280 334
54,352 44,001 43,980
Other assets includes cash of £0.1m (2015 £5.3m) and an insurance policy of £54.2 million (2015 £nil).
The assets are held independently of the assets of the Group in funds managed by Legal & General. None of the fair values of the assetsshown above include any of the Group’s own financial instruments or any property occupied by, or other assets used by, the Group.
Actual return on the Scheme assets
The actual return on the Scheme assets over the year ended 31 December 2016 was a loss of 15% (gain of 0.3%).
Assumptions
% 31 December 2016 31 December 2015 31 December 2014
Retail Price Index Inflation 3.65 3.50 3.00
Consumer Price Index Inflation 2.75 2.60 2.10
Rate of discount 2.70 3.80 3.50
Allowance for pension in payment increases of RPI(subject to a maximum increase of 5% p.a.) 3.50 3.35 2.90
Allowance for revaluation of deferred pension of RPI(subject to a maximum increase of 5% p.a.) 2.75 2.20 2.10
Statutory revaluation has used the Consumer Price Index (CPI) for the last four years rather than the Retail Price Index (RPI) which waspreviously used.
We have assumed that the long term CPI assumption is 0.9% lower than the corresponding RPI assumption. The mortality assumptions,adopted at 31 December 2016, follow the S2PA table, using 80% of the base table with CMI_2014 mortality projections with improvementsubject to a 1.5% minimum to the annual improvement. The assumptions imply the following life expectancy from age 65.
The weighted average duration of the defined benefit obligation is around 26 years.
Mortality assumptions
31 December 2016
Years
31 December 2015
Years
Male currently age 45 at 65 26.9 26.8
Female currently age 45 at 65 29.1 29.0
Male currently age 65 24.7 24.6
Female currently age 65 26.8 26.7
Sensitivities
An estimate of the sensitivities regarding the principal assumptions used to measure the Scheme’s liabilities are set out below.
Assumption Change in assumption
Increase
Estimated impact onscheme liabilities
(Decrease)/Increase
Change in assumption
Decrease
Estimated impact onscheme liabilities
Increase/(Decrease)
Discount rate 0.5% (£6,509,000) 0.5% £7,749,000
RPI 0.5% £5,882,000 0.5% (£6,059,000)
Age of member 1 year (£1,792,000) 1 year £1,795,000
£000 31 December 2016 31 December 2015 31 December 2014
Present value defined benefit obligation 54,269 37,119 38,783
Fair value of Scheme assets 54,352 44,001 43,980
Surplus in Scheme 83 6,882 5,197
The cumulative amount of actuarial gains and losses recognised in the statement of comprehensive income of the Company sinceadoption of IAS19 is a loss of £30.4m (£3.8m).
All actuarial gains and losses are recognised immediately.

Alliance Trust PLC | Annual Report and Financial Accounts 2016
90
Alliance Trust PLC | Annual Report and Financial Accounts 2016
90
Financial Statements
25 Pension Scheme
Best estimate of contributions to be paid to scheme for the year ending 31 December 2016
The Scheme closed to accrual on 2 April 2011. The Company paid contributions in the year of £19.4m represented by a £19.2m to fund thebulk annuity purchase with Legal & General Group PLC and a £0.2m contribution in line with the previous recovery plan.
Amounts for the current and previous years
£000 Dec 16 Dec 15 Dec 14 Dec 13 Dec 12
Fair value of assets 54,352 44,001 43,980 38,986 34,616
Defined benefit obligation 54,269 37,119 38,783 33,907 30,311
Surplus in Scheme 83 6,882 5,197 5,079 4,305
Experience adjustment on Scheme liabilities - 4,857 10 (41) 546
Experience adjustment on Scheme assets (10,334) (1,411) 2,617 1,973 383
Effects of changes in the demographic and financialassumptions underlying present value of the Schemeliabilities (16,303) (3,468) (4,133) (2,807) (1,334)
26 Operating lease commitments
As at 31 December 2016 the Group and Company had total future minimum lease payments under non cancellable operating leases asfollows:
31 December 2016 31 December 2015
Group
£000Land andbuildings Other
Land andbuildings Other
Lease commitments due
< 1 year - - - 3
Between 2-5 years 468 48 787 1
After 5 years 1,863 - 2,084 -
31 December 2016 31 December 2015
Company
£000Land andbuildings Other
Land andbuildings Other
Lease commitments due
Within 1 year - - - 3
Between 2-5 years 468 48 787 1
After 5 years 1,863 - 2,084 -
27 Post Balance Sheet Events
Repurchase of Shares
As disclosed on page 7 the Company announced that it had entered into an agreement, subject to shareholder approval, with ElliottInternational, LP, the Liverpool Limited Partnership and Elliott Associates LP (collectively “Elliott”) the Company’s largest beneficialshareholders) to purchase the 95,478,576 Ordinary Shares over which Elliott had direct control or to which it had an economic exposure(through contracts for difference, in five tranches each at a 4.75 per cent. discount to Net Asset Value). The repurchase, which wasapproved at the General Meeting of the Company on 28 February 2017, has been completed on these terms.
Approval of New Approach to Investment Management
As disclosed on page 3, following approval by shareholders on 28 February 2017, the Board confirmed the new multi investment managerapproach to managing the Trust’s equity portfolio, effective from 1 April 2017.

Alliance Trust PLC | Annual Report and Financial Accounts 2016
91
Alliance Trust PLC | Annual Report and Financial Accounts 2016
91
Information for shareholders
IncorporationAlliance Trust PLC is incorporated in Scotland with the registered number 1731.
The Company’s Register of Members is held at
Computershare Investor Services PLC, Leven House, 10 Lochside Place, Edinburgh Park, Edinburgh EH12 9DF
General EnquiriesIf you have an enquiry about the Company, or wish to receive a paper copy of our Annual Report, please contact the Company Secretary at our registered office:
8 West Marketgait, Dundee DD1 1QNTel: 01382 321000 Fax: 01382 321185Email: [email protected]
For security and compliance monitoring purposes telephone calls may be recorded.
Investor RelationsOur Director of Investor Relations can be contacted at our registered office (detailed above).
Our website www.alliancetrust.co.uk contains information about the Company, including daily share price and net asset value.
RegistrarsOur registrars are:
Computershare Investor Services PLCPO Box 82, The Pavilions,Bridgwater Road, Bristol BS99 7NH
Change of address notifications and registration enquiries for shareholdings registered in your own name should be sent to the Company’s registrars at the above address. You should also contact the registrars if you would like the dividends on shares registered in your own name to be sent to your bank or building society account. You may check your holdings and view other information about Alliance Trust shares registered in your own name at www.computershare.com.
Data ProtectionThe Company is a data controller as defined under the Data Protection Act 1998. Information received from or about shareholders or investors (for example from a stockbroker), whether by telephone or in writing, by fax or by any other electronic or digital means of communication may be processed.
Information held on the Company’s Register of Members is, by law, information to which the public may, for a proper purpose, have access and the Company cannot prevent any person inspecting it or having copies of it for such purpose, on payment of the statutory fee.
Annual Report and Electronic CommunicationsWe only send paper Annual Reports to shareholders who have asked us to do so. All shareholders receive notices of our meetings and information on how to access our Annual Report. Shareholders can opt to receive all notifications electronically by going to www.alliancetrust.co.uk/ec.htm which will provide a link to our registrars’ website.
TaxationIf you are in any doubt about your liability to tax arising from a shareholding in the Company you should seek professional advice.
Income TaxDividends paid by the Company carry a tax credit at 10% of the gross dividend. Dividends are paid net of the tax credit.
If you hold your shares in your own name, the tax voucher which you need for your tax records will be sent to the address we have for you on the register maintained by Computershare. The Registrar will send a consolidated tax voucher to members after the final dividend during the tax year is paid.
If your dividends are received by a nominee, such as your stockbroker’s nominee, you must contact that person for the tax voucher. If you invest in the Company through Alliance Trust Savings, it will automatically supply you with a consolidated income tax voucher for income received for you in the Investment Dealing Account.
Capital Gains TaxFor investors who purchased shares prior to 31 March 1982, the cost of those shares for capital gains tax purposes is deemed to be the price of the share on that date. The market value of each Alliance Trust PLC ordinary 25p share on that date was £2.85 which, when adjusted for the split on a 10 for 1 basis on 21 June 2006, gives an equivalent value of £0.285 per share. The market value of each Second Alliance Trust PLC ordinary 25p share on 31 March 1982 was £2.35. Holders of Second Alliance Trust PLC shares received 8.7453 ordinary 2.5p shares for each 25p ordinary share they held on 20 June 2006 and are treated as though they acquired these shares at the same time and at the same cost as the Second Alliance Trust shares they previously held. This gives an equivalent value of £0.269 per share.

Alliance Trust PLC | Annual Report and Financial Accounts 2016
92
Share investmentAlliance Trust PLC invests primarily in equities and aims to generate capital growth and a progressively rising dividend from its portfolio of investments.
Alliance Trust currently conducts its affairs so that its shares can be recommended by IFAs to ordinary retail investors in accordance with the FCA’s rules in relation to non-mainstream investment products and intends to continue to do so for the foreseeable future. The shares are excluded from the FCA’s restrictions which apply to non-mainstream investment products because they are shares in an investment trust.
The shares in Alliance Trust may also be suitable for institutional investors who seek a combination of capital and income return. Private investors should consider consulting an independent financial advisor who specialises in advising on the acquisition of shares and other securities before acquiring shares.
Investors should be capable of evaluating the risks and merits of such an investment and should have sufficient resources to bear any loss that may result.
RisksIf you wish to acquire shares in the Company, you should take professional advice as to whether an investment in our shares is suitable for you. You should be aware that:
• Investment should be made for the long term.
• The price of a share will be affected by the supply and demand for it and may not fully represent the underlying value of the assets of the Company. The price generally stands below the net asset value of the Company (‘at a discount’) but it may also stand above it (‘at a premium’). Your capital return will depend upon the movement of the discount/premium over the period you own the share, as well as the capital performance of the Company’s own assets.
• The assets owned by the Company may have exposure to currencies other than Sterling. Changes in market movements and in rates of exchange may cause the value of your investment to go up or down.
• Past performance is not a guide to the future. What you get back will depend on investment performance. You may not get back the amount you invest.
Bogus telephone callsWe have become aware of a numbers of telephone calls being made to shareholders wherein the caller offers to buy the recipient’s shares at a price significantly above the current market price. We are prohibited from advising shareholders on whether to buy or to sell shares in Alliance Trust PLC, but recommend that if you wish to sell your shares you only deal with a financial services firm that is authorised by the FCA.
Annual General MeetingThe 129th Annual General Meeting of the Company will beheld at 11.00am on Friday 27 April 2016 at the Gardyne Theatre,Dundee and Angus College, Gardyne Road, Dundee DD5 1NY.The Notice of Meeting, detailing the business of the meeting, issent to all shareholders.
Financial calendarProposed dividend payment dates for the financial year to31 December 2017 are on or around:
• 30 June 2017• 2 October 2017• 2 January 2018• 31 March 2018
Dividend Tax AllowanceFrom April 2016 dividend tax credits have replaced by an annual £5,000 tax-free allowance across an individual’s entire share portfolio. Above this amount, individuals will pay tax on their dividend income at a rate dependent on their income tax bracket and personal circumstances. Our Registrars provide registered shareholders with a confirmation of the dividends paid by Alliance Trust PLC and this should be included with any other dividend income received when calculating and reporting total dividend income received. It is the Shareholder’s responsibility to include all Dividend Income when calculating tax requirements.
If you have any Tax queries, please contact your Financial Advisor.
Common Reporting StandardsSince January 2016 you may have received requests from our Registrarfor personal information to comply with legal obligations introduced to reduce tax evasion. While it is not compulsory that you complete and return these requests we are required by law to make these requests and to report on the responses received to the HMRC.
Please note that only a small number of our shareholders fall into the category where we have to make these requests. If you have any queries on the validity of any document received from our registrars you can contact them directly on 0870 889 3187.

Alliance Trust PLC | Annual Report and Financial Accounts 2016
93
10 year record
A ten year record of the Company’s Financial Performance is provided below. Prior to the financial year ended 31 January 2007 there were two trusts, The Alliance Trust and The Second Alliance Trust, and the figures are therefore not directly comparable.
Assets £m as at31 Jan 2008
31 Jan 2009
31 Jan 2010
31 Jan 2011
31 Dec 2011
31 Dec 2012
31 Dec 2013
31 Dec 2014
31 Dec 2015
31 Dec 2016
Total assets 2,894 2,211 2,704 3,268 2,676 2,702 3,478 3,415 3,351 3,541
Loans (159) (50) (160) (339) (249) (200) (380) (380) (390) (220)
Net assets 2,699 2,123 2,513 2,895 2,400 2,491 2,886 3,019 2,948 3,284
Net asset value (p)
NAV per share 402.3 316.8 377.7 439.0 405.8 444.9 516.5 544.8• 559.0• 667.5•
NAV total return on 100p – 10 years* 210.7 178.6 198.3
Share price (p)
Closing price per share 338.0 268.0 313.0 364.0 342.8 375.3 450.1 478.9 517.0 638.0
Share price High 386.2 353.7 337.0 377.9 392.7 383.5 464.2 481.1 528.5 641.5
Share price Low 321.2 218.0 233.0 293.5 310.2 337.0 375.3 426.0 440.1 447.3
Total shareholder return on 100p – 10 years* 226.0 197.0 225.5
Gearing/net cash (%)
Gearing 5 – 5 11 7 7 12 11 13 6
Net cash – 11 – – – – – – – –
Year ended 31 January 11 mths Year ended 31 December
Revenue 2008 2009 2010 2011to 31 Dec
2011 2012 2013 2014 2015 2016
Profit after tax £61.5m £69.5m £61.1m £63.8m £61.9m £55.6m £60.6m £68.8m £60.2m £65.9m
Earnings per share 9.17p 10.37p 9.14p 9.67p 9.87p 9.74p 10.83p 12.38p 12.43p† 12.77p
Dividends per share 7.90p 8.00p 8.15p 8.395p 9.00p 9.27p 9.55p 9.83p 10.97p 12.77p
Special dividend – 0.50p – – – 0.36p 1.28p 2.546p 1.46p∆
Performance (rebased at 31 Jan 2007) as at
31 Jan 2008
31 Jan 2009
31 Jan 2010
31 Jan 2011
31 Dec 2011
31 Dec 2012
31 Dec 2013
31 Dec 2014
31 Dec 2015
31 Dec 2016
NAV per share 95 75 90 104 96 106 123 130 133 158
Closing price per share 92 73 86 100 94 103 123 131 141 174
Earnings per share 106 120 106 112 117 112 125 143 143 147
Dividends per share (excluding special) 104 106 108 111 119 122 126 130 145 169
Year ended 31 January 11 mths Year ended 31 December Cost of running the Company 2008 2009 2010 2011
31 Dec 2011 2012 2013 2014 2015 2016
Administrative expenses £15.0m £16.8m £16.0m £17.0m £16.0m £18.7m £21.5m £20.8m £23.9m £18.8m
Ongoing charges ratio (excluding capital incentives***) 0.42% 0.60% 0.64% 0.53% 0.56%** 0.67% 0.75% 0.60% 0.59% 0.43%
Capital incentives 0.03% 0.07% 0.05% 0.07% 0.04% 0.04% 0.05% 0.04% 0.04% –
Ongoing charges ratio (including capital incentives***) 0.45% 0.67% 0.69% 0.60% 0.60%** 0.71% 0.80% 0.64% 0.63% 0.43%•With debt at fair value *Source: Morningstar UK Ltd†Includes capital dividend paid December 2015∆Capital dividend paid December 2015**Administrative expenses have been annualised given the financial reporting period was for 11 months, except for incentives which were on an actual basis***The AIC’s recommended methodology for the calculation of an Ongoing Charges figure states that for self-managed companies costs relating to compensation schemes which are linked directly to investment performance should be excluded from the calculation of the principal Ongoing Charges figure.

ContactAlliance Trust PLC8 West MarketgaitDundeeDD1 1QNTel +44 (0)1382 321000Email [email protected]