investment banking industrial … technology quarterly ©2016 raymond james & associates, inc.,...
TRANSCRIPT
INDUSTRIAL TECHNOLOGY QUARTERLY
©2016 Raymond James & Associates, Inc., member New York Stock Exchange/SIPC
1033 Demonbreun Street, Suite 505 // Nashville, Tennessee 37203 // T (615) 645-6820 // raymondjames.com
INVESTMENT BANKING
1
INDUSTRIAL TECHNOLOGY QUARTERLY
INDUSTRIAL TECHNOLOGY COVERAGE TEAM
Information obtained from third-party sources is considered reliable, but we do not guarantee that the information herein is accurate or complete. This report was prepared within Raymond James & Associates' Investment Banking Department and is for information
purposes only. This report is not a product of Raymond James & Associates' Research Department; recipients of this report should not interpret the information herein as sufficient grounds for an investment decision or any other decision. The report shall not constitute
an offer to sell or the solicitation of an offer to buy any of the securities mentioned herein; past performance does not guarantee future results. This report includes logos or other words or devices that may be registered trademarks of their respective owners. Such use is
solely for purposes of convenience in referring to the trademark owners and their products/services. This report and its contents are not endorsed, sponsored or affiliated with any trademark owner. Raymond James and its affiliates are not affiliated with any trademark
owner but may provide certain financial services to one or more trademark owners or their affiliates.
SUMMER 2016
Gary Downing
(727) 567-1157
Frank McGrew
(615) 645-6797
Jason Lowry
(615) 645-6802

INDUSTRIAL TECHNOLOGY QUARTERLY
©2016 Raymond James & Associates, Inc., member New York Stock Exchange/SIPC
1033 Demonbreun Street, Suite 505 // Nashville, Tennessee 37203 // T (615) 645-6820 // raymondjames.com
INVESTMENT BANKING
2
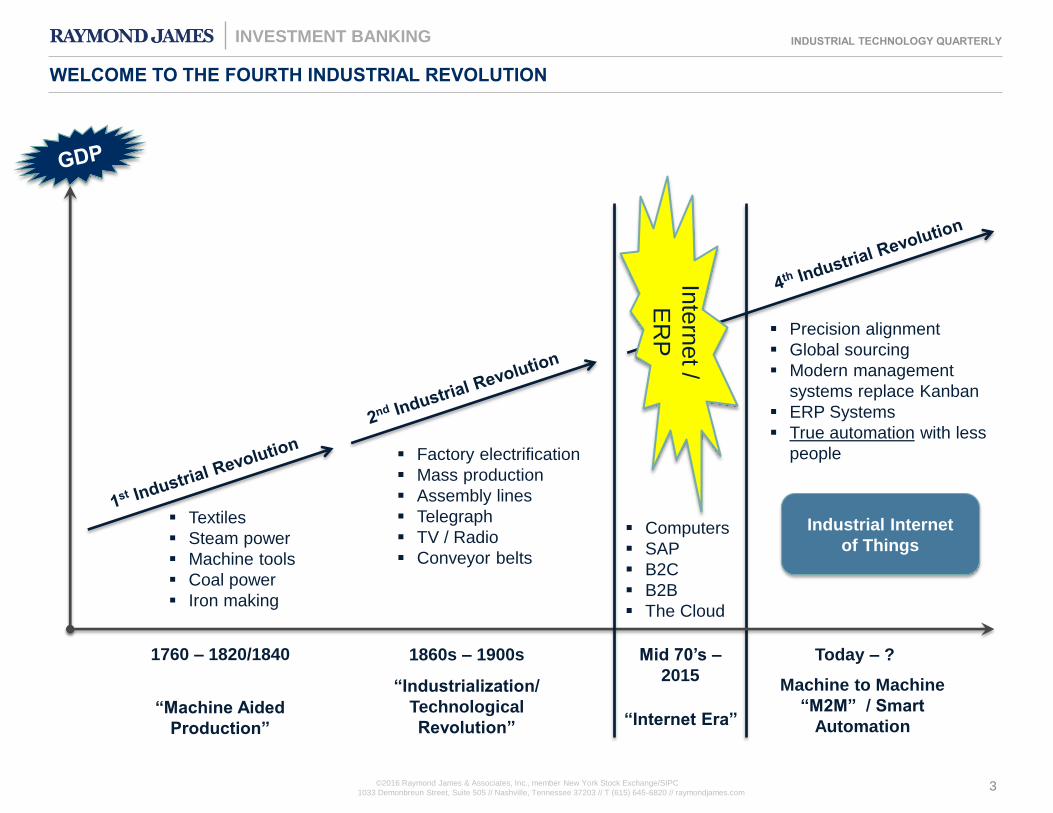
When talking about industrial revolutions, it’s common to immediately think about the past. However, new technologies that allow
machines, and entire factories, to communicate digitally to streamline production and maximize efficiencies have brought us into a
new age. We’ve entered the fourth industrial revolution, and today’s smart machine technology is at its core. To remain competitive in
today’s markets, manufacturers must find ways to raise the capital needed to invest in new technology and grow through the
acquisition of competencies outside their own organizations. Companies that successfully leverage technology and understand four
key factors will have a competitive edge going forward.
In three distinct historical periods, technological advancements have brought manufacturing into a new phase. The invention of steam
and coal power transformed factories in the late 1700s. In the mid-19th century, the introduction of electricity in the factory setting
begat assembly lines and mass production. Then, in the late 20th century, the Internet Era brought efficiencies and abilities that
transformed the business of manufacturing.
This new, fourth industrial revolution is likely to have an even more significant impact. Whereas early innovations simply replaced earlier, less-efficient means
of doing or producing something, there is something more powerful at work with today’s technology and its ubiquitous adoption across the overall industry
supply chain. The same technology that helps satisfy customers’ demands for greater visibility throughout the manufacturing process also allows producers to
streamline and scale up productivity. Tools once considered the stuff of science fiction, such as artificial intelligence, robotics and the Industrial Internet of
Things (“IIoT”), are now implementable as part of a viable long-term growth plan. As with the industrial revolutions that preceded this one, the early adopters
will gain the advantage.
Moreover, the timing of the new industrial revolution couldn’t be better, as global population growth and resource sustainability issues have been posing ever-
greater challenges to the industrials sector. Regardless of what product is being made, the motivations for the makers are the same – to invest in and leverage
available technologies to maximize resource efficiency, build scale into infrastructure for long-term growth and adopt the right technologies to get the best
return on investment – based on these four key factors:
1. Population growth – Cities are growing more compact and the population is aging, thus the need for smarter and more efficient transportation
networks;
2. Land usage – Increased demand for food requires improved agricultural productivity through technology such as precision farming and efficient water
usage to drive yields;
3. Water usage – New sources of water from desalination and water reuse technology are needed to solve drought conditions and aid poor or water-
stressed regions; and
4. Energy usage – Transitioning from coal to alternative and renewable forms of energy such as solar, biomass and natural gas presents real prospects
for U.S. exports.
Change is on the horizon and companies should begin to prepare for tomorrow. The threat of technological disruption is always upon us and companies must
be mindful to avoid being left in the dark – not many cab companies saw Uber coming! While every sector is unique with its own characteristics, there are
common trends that influence the broad industrials category and will impact the capital needs of all companies in the industry. After all, hope is not a strategy!
The industrials sector has always been among the most creative and innovative in our nation’s history. With the technologies available and challenges
presented, part of the sector’s creativity and innovation must go into determining how private and public capital can be used to stimulate the new, indeed the
fourth, industrial revolution.
WELCOME TO THE FOURTH INDUSTRIAL REVOLUTION
Frank A. McGrew IV
Managing Director
INDUSTRIAL TECHNOLOGY QUARTERLY
©2016 Raymond James & Associates, Inc., member New York Stock Exchange/SIPC
1033 Demonbreun Street, Suite 505 // Nashville, Tennessee 37203 // T (615) 645-6820 // raymondjames.com
INVESTMENT BANKING
3
Textiles
Steam power
Machine tools
Coal power
Iron making
Factory electrification
Mass production
Assembly lines
Telegraph
TV / Radio
Conveyor belts
Inte
rnet /
ER
P
Computers
SAP
B2C
B2B
The Cloud
Precision alignment
Global sourcing
Modern management
systems replace Kanban
ERP Systems
True automation with less
people
1760 – 1820/1840 1860s – 1900s Mid 70’s –
2015
Today – ?
“Internet Era”
“Industrialization/
Technological
Revolution” “Machine Aided
Production”
Machine to Machine
“M2M” / Smart
Automation
Industrial Internet
of Things
WELCOME TO THE FOURTH INDUSTRIAL REVOLUTION

INDUSTRIAL TECHNOLOGY QUARTERLY
©2016 Raymond James & Associates, Inc., member New York Stock Exchange/SIPC
1033 Demonbreun Street, Suite 505 // Nashville, Tennessee 37203 // T (615) 645-6820 // raymondjames.com
INVESTMENT BANKING
4
TRANSACTION PROFILE: NIBE TO ACQUIRE CLIMATE CONTROL GROUP FROM LSB INDUSTRIES
NIBE’s $364 million pending acquisition of LSB’s Climate Control Group will
further solidify NIBE as a global leader in sustainable energy and indoor climate solutions.
• Provides specialty HVAC products to commercial, institutional and
residential new construction, renovation and replacement markets
‒ Manufactures and distributes its products from seven facilities located in
Oklahoma City, OK
• Market and technology leader for water source and geothermal heat
pumps, and hydronic fan coils
‒ Benefitting from the economic recovery, long-term trend toward green
construction, and growth of emerging products
CLIMATE CONTROL GROUP OVERVIEW
SALES MIX BY PRODUCT TYPE
TRANSACTION DETAILS
The transaction further reinforces Raymond James’ coverage
thesis for Industrial Technology…
• Continued improvement in commercial and institutional new
construction over the next two to four years
• Trend towards higher energy efficiency products in the
commercial / institutional sector
• Residential market increasingly aware of the impact their HVAC
systems have on the environment and to the overall cost to run
their homes
• Announced date: May 12, 2016
• Purchase price: $364 million
• ~1.3x revenue (estimated CY 2015 revenue of $274 million)
• ~14.6x EBITDA
Hydronic
Fan Coils
Water Source
Heat Pumps
Sources: LSB Industries Investor Presentation and SEC filings.
Modular
Chillers
Custom
Air Handlers
Geothermal Heat
Pumps Hydronic
fan coils
23% Heat pumps
62%
Other HVAC
products
15%
Climate Control Group
Significant Installed Base of
Climate Control Products

INDUSTRIAL TECHNOLOGY QUARTERLY
©2016 Raymond James & Associates, Inc., member New York Stock Exchange/SIPC
1033 Demonbreun Street, Suite 505 // Nashville, Tennessee 37203 // T (615) 645-6820 // raymondjames.com
INVESTMENT BANKING
5
0%
20%
40%
60%
80%
100%
120%
140%
160%
3D Printing Automation, Power, Motion & Control Communications Connectivity Environmental Equipment / Controls
Flow Control HVAC Industrial Conglomerates Intelligent Transportation
Power Connectivity Wire & Cable S&P 500
Note: Indexed stocks are weighted based on market capitalization. See pages 6 through 10 for index constituents. Past performance is not indicative of future results. Indices are
unmanaged. You cannot invest directly into an index.
Source: S&P Capital IQ.
INDUSTRIAL TECHNOLOGY STOCK PERFORMANCE
INDUSTRIAL TECHNOLOGY SECTOR PUBLIC COMPANY TRADING STATISTICS
Source: S&P Capital IQ as of 5/31/2016.
17.8%
70.0%
82.3% 82.0%
88.9% 86.6%
103.2%
75.7%
113.5% 117.0%
138.8%
Median
# of ∆ in Stock Price % of 52 - TEV / LTM TEV / 2016E
Sector Companies 3-Month 12-Month Week High TEV ($MMs) Revenue EBITDA Revenue EBITDA
3D Printing 4 11.5% (24.3%) 65.5% $711.7 2.0x NM 2.4x 13.0x
Automation, Power, Motion & Control 17 6.4% (8.1%) 90.1% 4,111.5 1.8x 12.1x 1.8x 11.3x
Communications Connectivity 9 6.4% (2.9%) 91.3% 4,268.0 1.3x 9.8x 1.8x 9.3x
Environmental Equipment / Controls 8 14.3% (5.6%) 85.7% 1,024.1 1.5x 12.3x 1.7x 10.5x
Flow Control 11 10.3% 7.9% 94.9% 3,565.9 1.9x 13.8x 1.9x 12.3x
HVAC Pure Plays 3 8.6% 15.1% 95.9% 2,173.1 2.0x 16.0x 1.9x 13.5x
Industrial Conglomerates 19 8.7% (2.2%) 94.3% 21,120.8 1.9x 11.3x 1.9x 10.5x
Intelligent Transportation 11 2.0% 16.4% 81.6% 396.5 0.8x 8.8x 1.2x 9.8x
Power Connectivity 5 (4.3%) (4.7%) 89.7% 440.5 1.1x 10.7x 1.0x 9.8x
Wire & Cable 8 16.1% (16.0%) 80.6% 1,638.2 0.4x 8.2x 0.5x 6.5x

INDUSTRIAL TECHNOLOGY QUARTERLY
©2016 Raymond James & Associates, Inc., member New York Stock Exchange/SIPC
1033 Demonbreun Street, Suite 505 // Nashville, Tennessee 37203 // T (615) 645-6820 // raymondjames.com
INVESTMENT BANKING
6
PUBLICLY TRADED INDUSTRIAL TECHNOLOGY COMPANY UNIVERSE(1)
Source: S&P Capital IQ.
1. Financial information, market values, and market multiples as of 5/31/2016; revenue multiples in excess of 6x and EBITDA multiples in excess of 50x excluded.
2. Stock price performance (3-month and 12-month) is based on price as of 5/31/2016.
($ in U.S. millions, except per share data)
Market % of
Price Change in Stock Price 52-Week Enterprise Market LTM EBITDA EV / Revenue EV / EBITDA
3D Printing Ticker 5/31/16 3-Month(2) 12-Month(2) High Value Cap Revenue EBITDA Margin LTM 2016E LTM 2016E
3D Systems Corporation DDD $13.39 13.8% (38.0%) 59.6% $1,346.8 $1,500.3 $658.0 ($15.4) NM 2.0x 2.0x NM 13.0x
Arcam AB ARCM 27.14 27.2% 55.1% 99.6% 511.9 560.1 77.1 9.1 11.9% NM 5.8x NM 44.7x
The ExOne Company XONE 10.52 3.2% (13.1%) 71.3% 139.8 169.0 42.0 (13.8) NM 3.3x 2.8x NM NM
Stratasys Ltd. SSYS 22.82 9.2% (35.4%) 57.8% 911.4 1,189.1 691.2 3.3 0.5% 1.3x 1.3x NM 7.5x
Median 65.5% $711.7 $874.6 $367.5 ($5.2) 6.2% 2.0x 2.4x NM 13.0x
Mean 72.1% 727.5 854.6 367.1 (4.2) 6.2% 2.2x 3.0x NM 21.7x
($ in U.S. millions, except per share data)
Market % of
Price Change in Stock Price 52-Week Enterprise Market LTM EBITDA EV / Revenue EV / EBITDA
Automation, Power, Motion & Control Ticker 5/31/16 3-Month(2) 12-Month(2) High Value Cap Revenue EBITDA Margin LTM 2016E LTM 2016E
ABB Ltd. ABBN $20.80 13.9% 0.6% 93.3% $47,091.4 $45,013.0 $34,829.0 $4,462.0 12.8% 1.4x 1.3x 10.6x 10.1x
Altra Industrial Motion Corp. AIMC 27.04 8.6% (1.2%) 90.1% 892.2 702.2 733.7 100.4 13.7% 1.2x 1.3x 8.9x 9.2x
Ametek Inc. AME 47.82 (0.1%) (10.9%) 82.9% 12,993.1 11,161.7 3,934.6 1,070.3 27.2% 3.3x 3.3x 12.1x 12.4x
Brady Corp. BRC 31.79 19.7% 27.0% 98.9% 1,698.7 1,597.7 1,127.2 137.3 12.2% 1.5x 1.5x 12.4x 11.4x
Cognex Corporation CGNX 43.07 10.2% (13.9%) 82.9% 3,263.5 3,663.2 445.4 130.2 29.2% NM NM 25.1x 22.8x
Eaton Corporation plc ETN 61.63 6.4% (13.9%) 84.1% 36,350.5 28,226.5 20,445.0 3,298.0 16.1% 1.8x 1.8x 11.0x 10.9x
Echelon Corporation ELON 5.08 (17.6%) (44.3%) 52.9% 0.4 22.4 37.6 (2.9) NM NM - NM -
FARO Technologies Inc. FARO 35.39 7.1% (18.4%) 73.2% 426.1 589.3 323.4 27.6 8.5% 1.3x 1.3x 15.4x 10.7x
Generac Holdings Inc. GNRC 37.91 9.5% (8.1%) 90.3% 3,585.0 2,522.6 1,292.0 249.1 19.3% 2.8x 2.5x 14.4x 12.5x
Hubbell Inc. HUBB 106.27 4.1% (2.1%) 95.0% 6,545.1 5,879.5 3,415.5 594.3 17.4% 1.9x 1.9x 11.0x 11.3x
Littelfuse Inc. LFUS 114.53 (2.5%) 17.5% 91.9% 2,668.2 2,568.1 876.9 196.4 22.4% 3.0x 2.6x 13.6x 11.9x
Rockw ell Automation Inc. ROK 116.05 8.1% (6.3%) 91.3% 14,597.6 15,116.7 6,049.6 1,213.7 20.1% 2.4x 2.5x 12.0x 11.5x
Regal Beloit Corporation RBC 57.13 1.7% (26.3%) 72.7% 4,056.0 2,555.4 3,416.2 531.0 15.5% 1.2x 1.2x 7.6x 8.4x
Schneider Electric SE SU 64.67 5.8% (15.5%) 84.3% 43,163.9 37,564.9 28,932.9 4,139.0 14.3% 1.5x 1.5x 10.4x 9.7x
Trimble Navigation Limited TRMB 25.58 2.4% 9.1% 98.1% 6,923.5 6,422.5 2,290.8 369.3 16.1% 3.0x 2.9x 18.7x 14.5x
Woodw ard, Inc. WWD 56.94 15.2% 10.0% 98.2% 4,111.5 3,479.3 1,981.9 316.7 16.0% 2.1x 2.0x 13.0x 11.8x
Zebra Technologies Corporation ZBRA 53.11 (18.9%) (51.9%) 44.5% 5,542.5 2,774.5 3,606.0 505.0 14.0% 1.5x 1.5x 11.0x 9.1x
Median 90.1% $4,111.5 $3,479.3 $2,290.8 $369.3 16.0% 1.8x 1.8x 12.1x 11.3x
Mean 83.8% 11,406.4 9,991.7 6,690.5 1,019.8 17.2% 2.0x 1.9x 13.0x 11.7x

INDUSTRIAL TECHNOLOGY QUARTERLY
©2016 Raymond James & Associates, Inc., member New York Stock Exchange/SIPC
1033 Demonbreun Street, Suite 505 // Nashville, Tennessee 37203 // T (615) 645-6820 // raymondjames.com
INVESTMENT BANKING
7
PUBLICLY TRADED INDUSTRIAL TECHNOLOGY COMPANY UNIVERSE(1)
($ in U.S. millions, except per share data)
Market % of
Price Change in Stock Price 52-Week Enterprise Market LTM EBITDA EV / Revenue EV / EBITDA
Communications Connectivity Ticker 5/31/16 3-Month(2) 12-Month(2) High Value Cap Revenue EBITDA Margin LTM 2016E LTM 2016E
Amphenol Corporation APH $58.72 6.4% 2.7% 99.2% $20,272.4 $18,081.5 $5,692.8 $1,313.3 23.1% 3.6x 3.3x 15.4x 14.2x
ARRIS International plc ARRS 24.10 0.2% (26.2%) 70.4% 6,278.6 4,550.1 5,197.9 577.5 11.1% 1.2x 0.9x 10.9x 7.3x
AVX Corp. AVX 13.81 17.8% (2.9%) 96.3% 1,363.9 2,312.7 1,195.5 162.9 13.6% 1.1x 1.1x 8.4x 6.6x
Belden Inc. BDC 64.67 12.7% (23.7%) 74.6% 4,268.0 2,720.8 2,303.8 365.7 15.9% 1.9x 1.8x 11.7x 10.0x
CommScope Holding Company, Inc. COMM 31.15 14.5% (0.4%) 91.3% 10,532.2 5,976.5 4,126.4 842.9 20.4% 2.6x 2.1x 12.5x 9.6x
Huber+Suhner AG HUBN 50.29 6.4% 17.8% 98.8% 817.3 978.2 705.5 83.6 11.9% 1.2x 1.1x 9.8x 8.5x
Radiall SA RLL 274.89 25.3% 2.1% 100.0% 421.0 486.8 314.9 69.8 22.2% 1.3x - 6.0x -
RF Industries, Ltd. RFIL 2.33 (42.3%) (40.7%) 50.5% 14.6 20.3 32.9 1.5 4.6% 0.4x - 9.6x -
TE Connectivity Ltd. TEL 60.00 1.2% (13.0%) 85.9% 24,191.0 21,457.0 11,887.0 2,468.0 20.8% 2.0x 1.9x 9.8x 9.3x
Median 91.3% $4,268.0 $2,720.8 $2,303.8 $365.7 15.9% 1.3x 1.8x 9.8x 9.3x
Mean 85.2% 7,573.2 6,287.1 3,495.2 653.9 15.9% 1.7x 1.8x 10.5x 9.4x
($ in U.S. millions, except per share data)
Market % of
Price Change in Stock Price 52-Week Enterprise Market LTM EBITDA EV / Revenue EV / EBITDA
Environmental Equipment / Controls Ticker 5/31/16 3-Month(2) 12-Month(2) High Value Cap Revenue EBITDA Margin LTM 2016E LTM 2016E
CECO Environmental Corp. CECE $8.15 25.4% (27.1%) 69.3% $420.9 $277.9 $389.6 $50.4 12.9% 1.1x 1.0x 8.4x 7.4x
CIRCOR International, Inc. CIR 56.04 35.4% 5.7% 90.9% 951.5 920.2 641.2 73.5 11.5% 1.5x 1.6x 13.0x 13.1x
CLARCOR Inc. CLC 59.30 17.6% (4.1%) 91.7% 3,178.4 2,876.1 1,446.2 254.0 17.6% 2.2x 2.3x 12.5x 12.4x
Colfax Corporation CFX 27.09 2.2% (46.3%) 52.5% 4,765.9 3,322.3 3,932.8 470.3 12.0% 1.2x 1.3x 10.1x 10.2x
Donaldson Company, Inc. DCI 33.51 10.4% (7.0%) 91.5% 4,878.6 4,454.9 2,241.4 347.5 15.5% 2.2x 2.2x 14.0x 13.4x
Energy Recovery, Inc. ERII 10.75 34.4% 310.3% 80.5% 465.9 562.6 50.2 (2.5) NM NM 4.7x NM 10.3x
ESCO Technologies Inc. ESE 40.27 11.1% 8.0% 99.6% 1,096.7 1,036.5 559.6 90.3 16.1% 2.0x 1.8x 12.1x 10.5x
Fuel-Tech, Inc. FTEK 1.58 0.6% (33.3%) 61.4% 27.5 36.9 76.4 (3.0) NM 0.4x 0.4x NM NM
Median 85.7% $1,024.1 $978.4 $600.4 $81.9 14.2% 1.5x 1.7x 12.3x 10.5x
Mean 79.7% 1,973.2 1,685.9 1,167.2 160.1 14.3% 1.5x 1.9x 11.7x 11.0x
Source: S&P Capital IQ.
1. Financial information, market values, and market multiples as of 5/31/2016; revenue multiples in excess of 6x and EBITDA multiples in excess of 50x excluded.
2. Stock price performance (3-month and 12-month) is based on price as of 5/31/2016.
INDUSTRIAL TECHNOLOGY QUARTERLY
©2016 Raymond James & Associates, Inc., member New York Stock Exchange/SIPC
1033 Demonbreun Street, Suite 505 // Nashville, Tennessee 37203 // T (615) 645-6820 // raymondjames.com
INVESTMENT BANKING
8
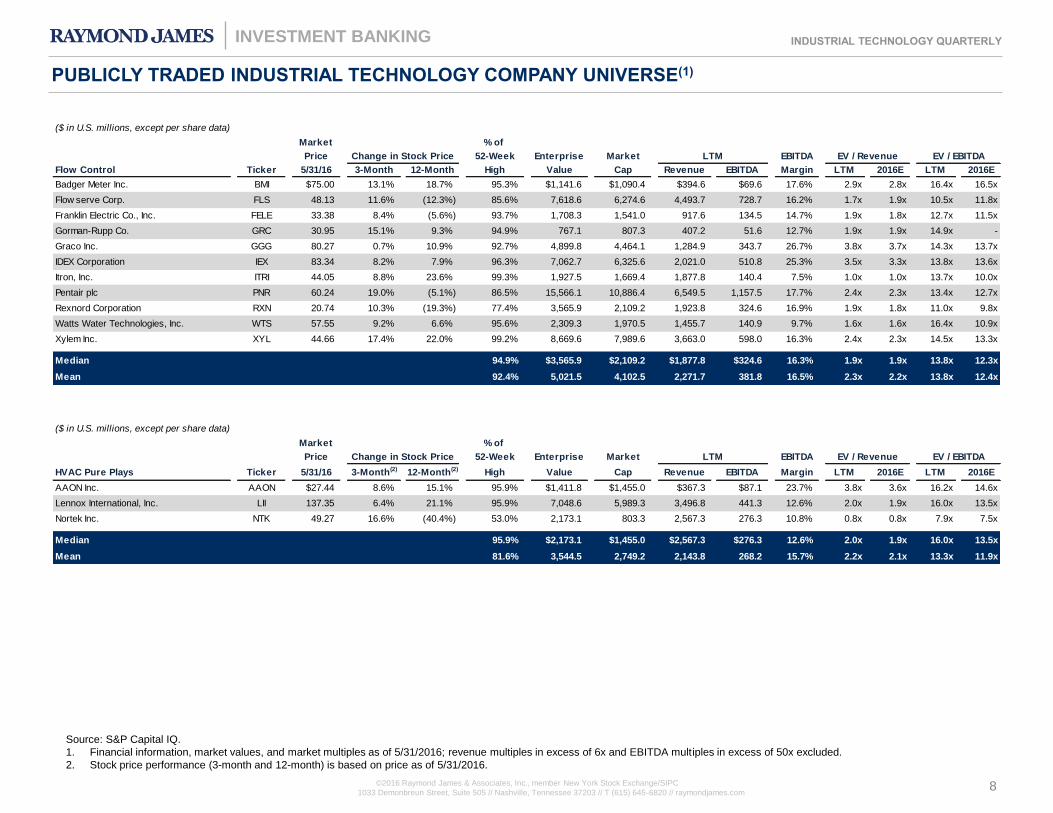
PUBLICLY TRADED INDUSTRIAL TECHNOLOGY COMPANY UNIVERSE(1)
($ in U.S. millions, except per share data)
Market % of
Price Change in Stock Price 52-Week Enterprise Market LTM EBITDA EV / Revenue EV / EBITDA
Flow Control Ticker 5/31/16 3-Month 12-Month High Value Cap Revenue EBITDA Margin LTM 2016E LTM 2016E
Badger Meter Inc. BMI $75.00 13.1% 18.7% 95.3% $1,141.6 $1,090.4 $394.6 $69.6 17.6% 2.9x 2.8x 16.4x 16.5x
Flow serve Corp. FLS 48.13 11.6% (12.3%) 85.6% 7,618.6 6,274.6 4,493.7 728.7 16.2% 1.7x 1.9x 10.5x 11.8x
Franklin Electric Co., Inc. FELE 33.38 8.4% (5.6%) 93.7% 1,708.3 1,541.0 917.6 134.5 14.7% 1.9x 1.8x 12.7x 11.5x
Gorman-Rupp Co. GRC 30.95 15.1% 9.3% 94.9% 767.1 807.3 407.2 51.6 12.7% 1.9x 1.9x 14.9x -
Graco Inc. GGG 80.27 0.7% 10.9% 92.7% 4,899.8 4,464.1 1,284.9 343.7 26.7% 3.8x 3.7x 14.3x 13.7x
IDEX Corporation IEX 83.34 8.2% 7.9% 96.3% 7,062.7 6,325.6 2,021.0 510.8 25.3% 3.5x 3.3x 13.8x 13.6x
Itron, Inc. ITRI 44.05 8.8% 23.6% 99.3% 1,927.5 1,669.4 1,877.8 140.4 7.5% 1.0x 1.0x 13.7x 10.0x
Pentair plc PNR 60.24 19.0% (5.1%) 86.5% 15,566.1 10,886.4 6,549.5 1,157.5 17.7% 2.4x 2.3x 13.4x 12.7x
Rexnord Corporation RXN 20.74 10.3% (19.3%) 77.4% 3,565.9 2,109.2 1,923.8 324.6 16.9% 1.9x 1.8x 11.0x 9.8x
Watts Water Technologies, Inc. WTS 57.55 9.2% 6.6% 95.6% 2,309.3 1,970.5 1,455.7 140.9 9.7% 1.6x 1.6x 16.4x 10.9x
Xylem Inc. XYL 44.66 17.4% 22.0% 99.2% 8,669.6 7,989.6 3,663.0 598.0 16.3% 2.4x 2.3x 14.5x 13.3x
Median 94.9% $3,565.9 $2,109.2 $1,877.8 $324.6 16.3% 1.9x 1.9x 13.8x 12.3x
Mean 92.4% 5,021.5 4,102.5 2,271.7 381.8 16.5% 2.3x 2.2x 13.8x 12.4x
($ in U.S. millions, except per share data)
Market % of
Price Change in Stock Price 52-Week Enterprise Market LTM EBITDA EV / Revenue EV / EBITDA
HVAC Pure Plays Ticker 5/31/16 3-Month(2) 12-Month(2) High Value Cap Revenue EBITDA Margin LTM 2016E LTM 2016E
AAON Inc. AAON $27.44 8.6% 15.1% 95.9% $1,411.8 $1,455.0 $367.3 $87.1 23.7% 3.8x 3.6x 16.2x 14.6x
Lennox International, Inc. LII 137.35 6.4% 21.1% 95.9% 7,048.6 5,989.3 3,496.8 441.3 12.6% 2.0x 1.9x 16.0x 13.5x
Nortek Inc. NTK 49.27 16.6% (40.4%) 53.0% 2,173.1 803.3 2,567.3 276.3 10.8% 0.8x 0.8x 7.9x 7.5x
Median 95.9% $2,173.1 $1,455.0 $2,567.3 $276.3 12.6% 2.0x 1.9x 16.0x 13.5x
Mean 81.6% 3,544.5 2,749.2 2,143.8 268.2 15.7% 2.2x 2.1x 13.3x 11.9x
Source: S&P Capital IQ.
1. Financial information, market values, and market multiples as of 5/31/2016; revenue multiples in excess of 6x and EBITDA multiples in excess of 50x excluded.
2. Stock price performance (3-month and 12-month) is based on price as of 5/31/2016.

INDUSTRIAL TECHNOLOGY QUARTERLY
©2016 Raymond James & Associates, Inc., member New York Stock Exchange/SIPC
1033 Demonbreun Street, Suite 505 // Nashville, Tennessee 37203 // T (615) 645-6820 // raymondjames.com
INVESTMENT BANKING
9
PUBLICLY TRADED INDUSTRIAL TECHNOLOGY COMPANY UNIVERSE(1)
($ in U.S. millions, except per share data)
Market % of
Price Change in Stock Price 52-Week Enterprise Market LTM EBITDA EV / Revenue EV / EBITDA
Intelligent Transportation Ticker 5/31/16 3-Month(2)
12-Month(2) High Value Cap Revenue EBITDA Margin LTM 2016E LTM 2016E
Hill & Smith Holdings PLC HILS $13.71 23.1% 33.6% 94.2% $1,208.9 $1,075.8 $689.4 $79.3 11.5% 1.8x 1.7x 15.2x 10.0x
Image Sensing Systems, Inc. ISNS 2.30 (17.0%) (24.1%) 46.8% 10.2 11.6 15.2 0.8 5.0% 0.7x - 13.3x -
Indra Sistemas, S.A. IDR 11.41 2.0% 15.4% 89.8% 2,617.3 1,868.3 3,201.1 (560.0) NM 0.8x 0.9x NM 10.1x
Init Innovation in Traffic Systems AG IXX 14.30 (12.9%) (45.5%) 45.9% 153.5 143.3 115.2 15.1 13.1% 1.3x 1.4x 10.2x 11.7x
International Road Dynamics Inc. IRD 1.01 (2.9%) 22.2% 87.4% 17.5 14.8 46.0 3.1 6.8% 0.4x 0.3x 5.6x 4.7x
Iteris, Inc. ITI 2.42 (7.1%) 35.8% 81.6% 59.0 77.4 76.0 (1.6) NM 0.8x - NM -
Jenoptik AG JEN 15.94 15.9% 24.8% 93.6% 948.7 912.5 775.6 102.6 13.2% 1.2x 1.2x 9.2x 9.1x
Kapsch TrafficCom AG KTCG 31.87 (15.1%) 20.0% 75.4% 396.5 414.3 528.6 70.3 13.3% 0.8x 0.6x 5.6x 4.4x
Mobileye N.V. MBLY 37.97 10.4% (18.2%) 58.9% 8,067.3 8,324.1 270.5 92.2 34.1% NM NM NM 44.9x
Redflex Holdings Limited RDF 0.22 11.1% (48.3%) 57.7% 20.7 24.1 94.4 8.9 9.4% 0.2x - 2.3x -
Vaisala Oyj VAIAS 31.58 20.1% 16.4% 99.6% 504.8 568.3 374.1 60.0 16.0% 1.3x 1.4x 8.4x 9.6x
Median 81.6% $396.5 $414.3 $270.5 $15.1 13.1% 0.8x 1.2x 8.8x 9.8x
Mean 75.5% 1,273.1 1,221.3 562.4 (11.8) 13.6% 0.9x 1.1x 8.7x 13.1x
($ in U.S. millions, except per share data)
Market % of
Price Change in Stock Price 52-Week Enterprise Market LTM EBITDA EV / Revenue EV / EBITDA
Industrial Conglomerates Ticker 5/31/16 3-Month(2)
12-Month(2) High Value Cap Revenue EBITDA Margin LTM 2016E LTM 2016E
3M Company MMM $168.32 5.6% 5.9% 98.3% $111,756.5 $102,088.5 $30,105.0 $8,570.0 28.5% 3.7x 3.7x 13.0x 12.7x
Carlisle Companies Incorporated CSL 103.82 11.7% 3.9% 98.1% 6,959.5 6,664.3 3,627.9 691.1 19.0% 1.9x 1.9x 10.1x 9.7x
Crane Co. CR 57.40 12.2% (5.1%) 92.4% 3,827.2 3,346.6 2,721.7 451.8 16.6% 1.4x 1.4x 8.5x 8.5x
Danaher Corp. DHR 98.36 8.7% 13.2% 97.9% 79,539.9 67,740.1 21,255.6 4,910.8 23.1% 3.7x 3.5x 16.2x 14.7x
Dover Corporation DOV 66.75 6.7% (11.2%) 86.8% 13,129.0 10,356.2 6,863.1 1,255.1 18.3% 1.9x 1.9x 10.5x 10.8x
Emerson Electric Co. EMR 52.02 3.2% (13.6%) 85.7% 37,490.1 33,467.1 20,958.0 3,999.0 19.1% 1.8x 1.8x 9.4x 9.5x
General Electric Company GE 30.23 0.2% 10.8% 94.3% 459,445.8 277,984.8 117,654.0 15,391.0 13.1% 3.9x 3.7x 29.9x 21.9x
Honeywell International Inc. HON 113.83 6.9% 9.4% 97.7% 94,517.6 86,751.6 38,890.0 7,822.0 20.1% 2.4x 2.3x 12.1x 11.3x
Ingersoll-Rand Plc IR 66.81 16.7% (3.2%) 94.8% 21,120.8 17,201.2 13,307.0 1,860.6 14.0% 1.6x 1.6x 11.4x 10.5x
ITT Inc. ITT 35.51 (2.7%) (17.1%) 80.8% 2,976.8 3,199.5 2,506.0 395.8 15.8% 1.2x 1.2x 7.5x 7.5x
Illinois Tool Works Inc. ITW 106.03 9.3% 13.1% 99.8% 42,663.0 38,104.0 13,337.0 3,368.0 25.3% 3.2x 3.2x 12.7x 12.1x
Johnson Controls Inc. JCI 44.15 17.7% (16.2%) 81.0% 36,435.5 28,625.5 36,317.0 3,265.0 9.0% 1.0x 1.0x 11.2x 9.0x
Roper Technologies, Inc. ROP 171.08 (0.2%) (2.2%) 87.3% 19,902.1 17,313.4 3,619.5 1,247.1 34.5% 5.5x 5.1x 16.0x 14.6x
Parker-Hannifin Corporation PH 114.84 8.6% (4.7%) 94.0% 16,617.2 15,466.8 11,548.1 1,560.7 13.5% 1.4x 1.5x 10.6x 10.3x
Siemens Aktiengesellschaft SIE 109.24 12.8% 2.4% 97.4% 106,312.3 88,332.2 88,900.4 9,871.9 11.1% 1.2x 1.2x 10.8x 9.4x
SPX Corporation SPXC 16.57 28.9% (77.7%) 21.9% 943.5 689.4 1,732.3 (54.0) NM 0.5x 0.6x NM 6.6x
Stanley Black & Decker, Inc. SWK 113.18 16.9% 10.1% 98.3% 21,053.6 16,990.2 11,213.9 1,777.4 15.8% 1.9x 1.9x 11.8x 11.3x
Tyco International plc TYC 42.62 18.8% 5.8% 99.0% 20,328.7 18,134.7 9,701.0 1,574.0 16.2% 2.1x 2.1x 12.9x 13.6x
United Technologies Corporation UTX 100.58 5.3% (14.0%) 84.4% 101,685.0 84,172.0 56,135.0 10,105.0 18.0% 1.8x 1.8x 10.1x 9.4x
Median 94.3% $21,120.8 $18,134.7 $13,307.0 $1,860.6 17.3% 1.9x 1.9x 11.3x 10.5x
Mean 88.9% 62,984.4 48,243.6 25,810.1 4,108.5 18.4% 2.2x 2.2x 12.5x 11.2x
Source: S&P Capital IQ.
1. Financial information, market values, and market multiples as of 5/31/2016; revenue multiples in excess of 6x and EBITDA multiples in excess of 50x excluded.
2. Stock price performance (3-month and 12-month) is based on price as of 5/31/2016.
INDUSTRIAL TECHNOLOGY QUARTERLY
©2016 Raymond James & Associates, Inc., member New York Stock Exchange/SIPC
1033 Demonbreun Street, Suite 505 // Nashville, Tennessee 37203 // T (615) 645-6820 // raymondjames.com
INVESTMENT BANKING
10
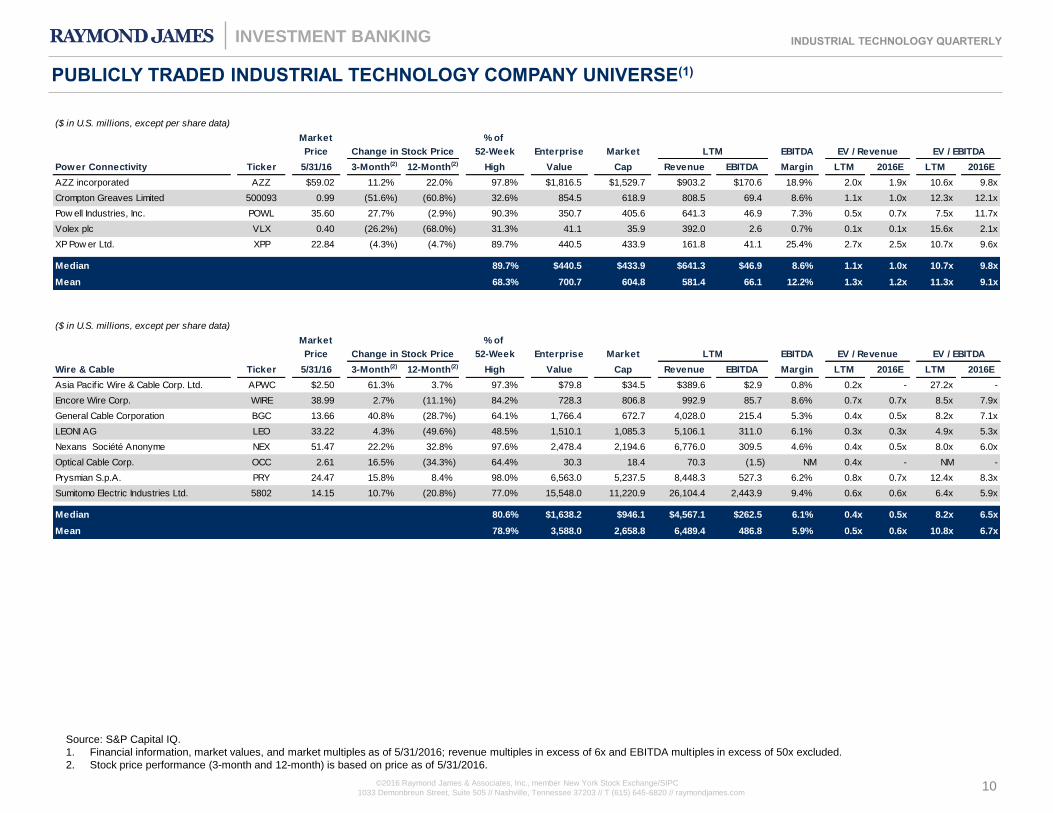
PUBLICLY TRADED INDUSTRIAL TECHNOLOGY COMPANY UNIVERSE(1)
($ in U.S. millions, except per share data)
Market % of
Price Change in Stock Price 52-Week Enterprise Market LTM EBITDA EV / Revenue EV / EBITDA
Power Connectivity Ticker 5/31/16 3-Month(2) 12-Month(2) High Value Cap Revenue EBITDA Margin LTM 2016E LTM 2016E
AZZ incorporated AZZ $59.02 11.2% 22.0% 97.8% $1,816.5 $1,529.7 $903.2 $170.6 18.9% 2.0x 1.9x 10.6x 9.8x
Crompton Greaves Limited 500093 0.99 (51.6%) (60.8%) 32.6% 854.5 618.9 808.5 69.4 8.6% 1.1x 1.0x 12.3x 12.1x
Pow ell Industries, Inc. POWL 35.60 27.7% (2.9%) 90.3% 350.7 405.6 641.3 46.9 7.3% 0.5x 0.7x 7.5x 11.7x
Volex plc VLX 0.40 (26.2%) (68.0%) 31.3% 41.1 35.9 392.0 2.6 0.7% 0.1x 0.1x 15.6x 2.1x
XP Pow er Ltd. XPP 22.84 (4.3%) (4.7%) 89.7% 440.5 433.9 161.8 41.1 25.4% 2.7x 2.5x 10.7x 9.6x
Median 89.7% $440.5 $433.9 $641.3 $46.9 8.6% 1.1x 1.0x 10.7x 9.8x
Mean 68.3% 700.7 604.8 581.4 66.1 12.2% 1.3x 1.2x 11.3x 9.1x
($ in U.S. millions, except per share data)
Market % of
Price Change in Stock Price 52-Week Enterprise Market LTM EBITDA EV / Revenue EV / EBITDA
Wire & Cable Ticker 5/31/16 3-Month(2) 12-Month(2) High Value Cap Revenue EBITDA Margin LTM 2016E LTM 2016E
Asia Pacif ic Wire & Cable Corp. Ltd. APWC $2.50 61.3% 3.7% 97.3% $79.8 $34.5 $389.6 $2.9 0.8% 0.2x - 27.2x -
Encore Wire Corp. WIRE 38.99 2.7% (11.1%) 84.2% 728.3 806.8 992.9 85.7 8.6% 0.7x 0.7x 8.5x 7.9x
General Cable Corporation BGC 13.66 40.8% (28.7%) 64.1% 1,766.4 672.7 4,028.0 215.4 5.3% 0.4x 0.5x 8.2x 7.1x
LEONI AG LEO 33.22 4.3% (49.6%) 48.5% 1,510.1 1,085.3 5,106.1 311.0 6.1% 0.3x 0.3x 4.9x 5.3x
Nexans Société Anonyme NEX 51.47 22.2% 32.8% 97.6% 2,478.4 2,194.6 6,776.0 309.5 4.6% 0.4x 0.5x 8.0x 6.0x
Optical Cable Corp. OCC 2.61 16.5% (34.3%) 64.4% 30.3 18.4 70.3 (1.5) NM 0.4x - NM -
Prysmian S.p.A. PRY 24.47 15.8% 8.4% 98.0% 6,563.0 5,237.5 8,448.3 527.3 6.2% 0.8x 0.7x 12.4x 8.3x
Sumitomo Electric Industries Ltd. 5802 14.15 10.7% (20.8%) 77.0% 15,548.0 11,220.9 26,104.4 2,443.9 9.4% 0.6x 0.6x 6.4x 5.9x
Median 80.6% $1,638.2 $946.1 $4,567.1 $262.5 6.1% 0.4x 0.5x 8.2x 6.5x
Mean 78.9% 3,588.0 2,658.8 6,489.4 486.8 5.9% 0.5x 0.6x 10.8x 6.7x
Source: S&P Capital IQ.
1. Financial information, market values, and market multiples as of 5/31/2016; revenue multiples in excess of 6x and EBITDA multiples in excess of 50x excluded.
2. Stock price performance (3-month and 12-month) is based on price as of 5/31/2016.
INDUSTRIAL TECHNOLOGY QUARTERLY
©2016 Raymond James & Associates, Inc., member New York Stock Exchange/SIPC
1033 Demonbreun Street, Suite 505 // Nashville, Tennessee 37203 // T (615) 645-6820 // raymondjames.com
INVESTMENT BANKING
11
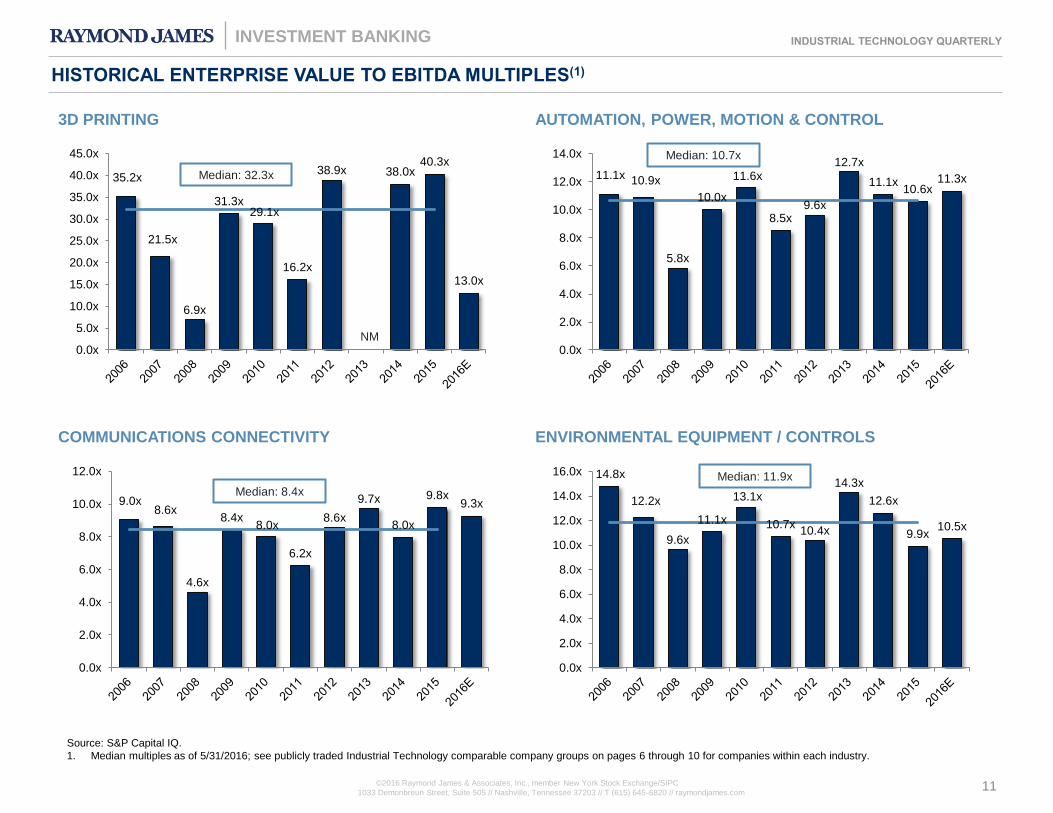
HISTORICAL ENTERPRISE VALUE TO EBITDA MULTIPLES(1)
NM
Median: 32.3x
Median: 10.7x
Median: 8.4x
Median: 11.9x
Source: S&P Capital IQ.
1. Median multiples as of 5/31/2016; see publicly traded Industrial Technology comparable company groups on pages 6 through 10 for companies within each industry.
11.1x 10.9x
5.8x
10.0x
11.6x
8.5x9.6x
12.7x
11.1x10.6x
11.3x
0.0x
2.0x
4.0x
6.0x
8.0x
10.0x
12.0x
14.0x
9.0x8.6x
4.6x
8.4x8.0x
6.2x
8.6x
9.7x
8.0x
9.8x9.3x
0.0x
2.0x
4.0x
6.0x
8.0x
10.0x
12.0x 14.8x
12.2x
9.6x
11.1x
13.1x
10.7x10.4x
14.3x
12.6x
9.9x10.5x
0.0x
2.0x
4.0x
6.0x
8.0x
10.0x
12.0x
14.0x
16.0x
35.2x
21.5x
6.9x
31.3x29.1x
16.2x
38.9x 38.0x40.3x
13.0x
0.0x
5.0x
10.0x
15.0x
20.0x
25.0x
30.0x
35.0x
40.0x
45.0x
3D PRINTING AUTOMATION, POWER, MOTION & CONTROL
COMMUNICATIONS CONNECTIVITY ENVIRONMENTAL EQUIPMENT / CONTROLS

INDUSTRIAL TECHNOLOGY QUARTERLY
©2016 Raymond James & Associates, Inc., member New York Stock Exchange/SIPC
1033 Demonbreun Street, Suite 505 // Nashville, Tennessee 37203 // T (615) 645-6820 // raymondjames.com
INVESTMENT BANKING
12
9.3x9.8x
6.1x
9.9x 10.0x
7.9x
9.2x
11.2x 11.3x
9.9x10.5x
0.0x
2.0x
4.0x
6.0x
8.0x
10.0x
12.0x
HISTORICAL ENTERPRISE VALUE TO EBITDA MULTIPLES(1)
Median: 11.3x Median: 10.3x
Median: 9.7x
Median: 9.4x
11.6x 11.9x
7.1x
11.5x
10.4x9.2x
10.5x
13.9x
11.5x12.5x 12.3x
0.0x
2.0x
4.0x
6.0x
8.0x
10.0x
12.0x
14.0x
16.0x
10.2x
8.0x
6.6x
8.4x
10.3x9.0x
10.3x
13.6x 13.2x
15.0x
13.5x
0.0x
2.0x
4.0x
6.0x
8.0x
10.0x
12.0x
14.0x
16.0x
11.7x11.3x
7.9x8.2x
8.7x
7.4x 7.4x
10.5x9.4x 9.3x
9.8x
0.0x
2.0x
4.0x
6.0x
8.0x
10.0x
12.0x
14.0x
FLOW CONTROL HVAC PURE PLAYS
INDUSTRIAL CONGLOMERATES INTELLIGENT TRANSPORTATION
Source: S&P Capital IQ.
1. Median multiples as of 5/31/2016; see publicly traded Industrial Technology comparable company groups on pages 6 through 10 for companies within each industry.
INDUSTRIAL TECHNOLOGY QUARTERLY
©2016 Raymond James & Associates, Inc., member New York Stock Exchange/SIPC
1033 Demonbreun Street, Suite 505 // Nashville, Tennessee 37203 // T (615) 645-6820 // raymondjames.com
INVESTMENT BANKING
13
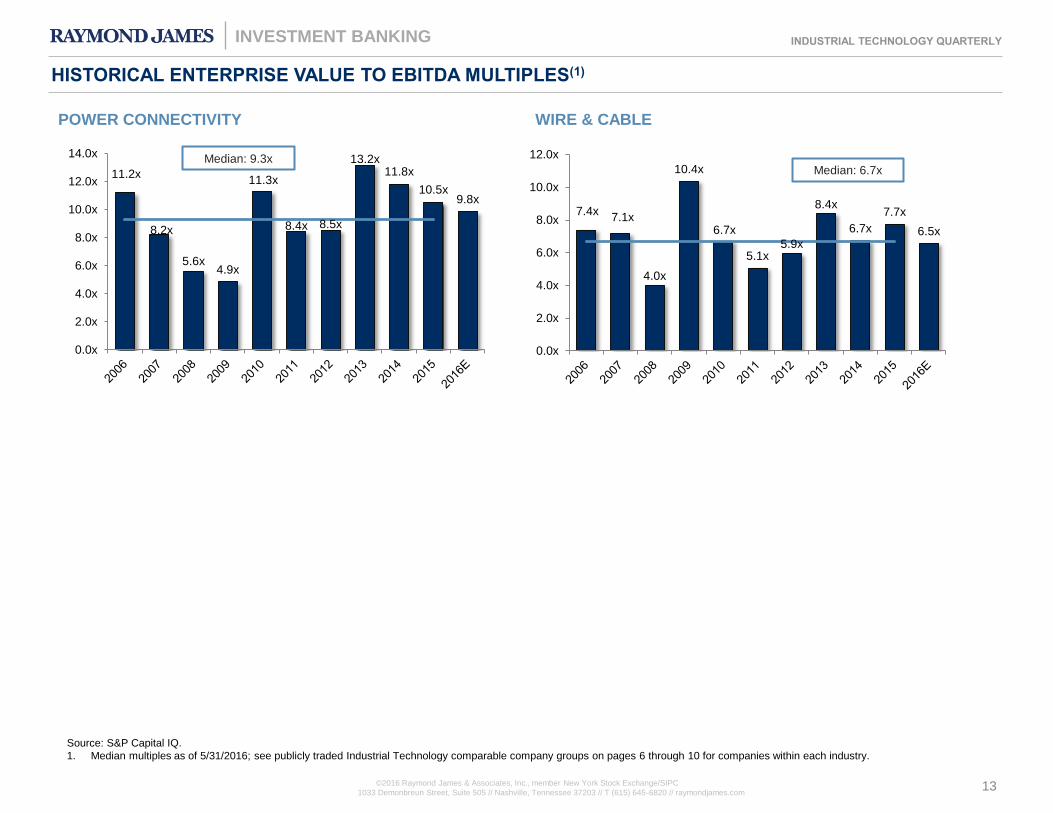
HISTORICAL ENTERPRISE VALUE TO EBITDA MULTIPLES(1)
Median: 6.7x Median: 9.3x
11.2x
8.2x
5.6x4.9x
11.3x
8.4x 8.5x
13.2x11.8x
10.5x9.8x
0.0x
2.0x
4.0x
6.0x
8.0x
10.0x
12.0x
14.0x
7.4x7.1x
4.0x
10.4x
6.7x
5.1x5.9x
8.4x
6.7x
7.7x
6.5x
0.0x
2.0x
4.0x
6.0x
8.0x
10.0x
12.0x
POWER CONNECTIVITY WIRE & CABLE
Source: S&P Capital IQ.
1. Median multiples as of 5/31/2016; see publicly traded Industrial Technology comparable company groups on pages 6 through 10 for companies within each industry.

INDUSTRIAL TECHNOLOGY QUARTERLY
©2016 Raymond James & Associates, Inc., member New York Stock Exchange/SIPC
1033 Demonbreun Street, Suite 505 // Nashville, Tennessee 37203 // T (615) 645-6820 // raymondjames.com
INVESTMENT BANKING
14
Source: S&P Capital IQ.
Note: Only includes transactions greater than $10 million.
SELECT RECENT INDUSTRIAL TECHNOLOGY M&A TRANSACTIONS
Date Enterprise EV / LTM
Announced Closed Target Buyers/Investors Sector Value ($M) Revenue EBITDA
5/18/2016 Pending Cambridge International, Inc. Rexnord Corporation Flow Control 210.0$ - -
5/16/2016 Pending AWG Fittings GmbH LUKAS Hydraulik GmbH Automation, Pow er, Motion & Control 52.1 - -
5/12/2016 Pending LSB Industries, Climate Control Group NIBE Industrier AB HVAC Pure Plays 364.0 1.3x 14.6x
4/21/2016 4/21/2016 Daintree Netw orks, Inc. Current Communications Connectivity 100.0 - -
04/20/2016 5/20/2016 Jaquet AG TE Connectivity Ltd. Pow er Connectivity - - -
4/18/2016 Pending Prysmian Baosheng Cable Co., Ltd. Baosheng Group Co., Ltd. Wire & Cable 69.2 - -
03/09/2016 Pending Crompton Greaves Limited, T&D Business First Reserve International Ltd Pow er Connectivity - - -
3/1/2016 3/1/2016 RSI Video Technologies S.A. Honeyw ell Automation and Control Solutions Flow Control 123.0 - -
02/04/2016 3/17/2016 Akron Brass Company IDEX Corporation Flow Control 224.2 1.9x 8.8x
2/5/2016 2/5/2016 Electronic Systems Protection, Inc. Ametek Inc. Automation, Pow er, Motion & Control 130.0 3.3x -
2/4/2016 4/1/2016 Xtralis Pty Ltd. Honeyw ell Automation and Control Solutions Automation, Pow er, Motion & Control 480.0 - -
01/24/2016 Pending Tyco International plc Johnson Controls Inc. Automation, Pow er, Motion & Control 16,395.0 1.7x 10.5x
01/15/2016 Pending GE Appliances Inc. Qingdao Haier Co., Ltd. Industrial Conglomerates 5,400.0 - 10.0x
12/15/2015 12/21/2015 Oman Cables Industry SAOG Draka Holding B.V. Wire & Cable 826.0 1.1x 11.7x
12/14/2015 3/30/2016 SPX Cooling Technologies, Inc., Dry Cooling Business Paharpur Cooling Tow ers Limited Automation, Pow er, Motion & Control 48.0 - -
11/07/2015 3/25/2016 TE Connectivity Ltd., Circuit Protection Business Littelfuse Inc. Automation, Pow er, Motion & Control 350.0 - -
11/05/2015 2/4/2016 COM DEV International Ltd. Honeyw ell International Inc. Industrial Conglomerates 341.2 2.0x 18.9x
11/2/2015 11/2/2015 Kele, Inc. Snow Phipps Group, LLC; Snow Phipps Fund 2, L.P. Automation, Pow er, Motion & Control - - -
10/29/2015 12/10/2015 Juno Lighting, LLC Acuity Brands Lighting, Inc. Automation, Pow er, Motion & Control 385.0 1.7x 12.0x
10/26/2015 Pending CliniSys Solutions Limited Roper Technologies, Inc. Industrial Conglomerates 261.1 - -
10/26/2015 10/26/2015 Atlas Medical Softw are Roper Technologies, Inc. Industrial Conglomerates 48.0 - -
10/08/2015 10/21/2015 Aderant Holdings, Inc. Roper Technologies, Inc. Industrial Conglomerates 675.0 - -
10/1/2015 10/1/2015 Priamus SYSTEM Technologies AG Barnes Group Inc. Automation, Pow er, Motion & Control - - -
10/1/2015 10/1/2015 Automated Quality Technologies, Inc. Motion Tech Automation, LLC Automation, Pow er, Motion & Control - - -
9/24/2015 10/1/2015 Gulf Coast Dow nhole Technologies, LLC Prysmian S.p.A. Wire & Cable 66.0 1.9x -
9/24/2015 10/28/2015 Clearlogx, Inc. H2O Innovation Inc. Flow Control 1.5 - -
9/16/2015 10/23/2015 Adept Technology Inc. Omron Management Center of America, Inc. Automation, Pow er, Motion & Control 190.8 3.5x NM
8/31/2015 8/31/2015 KB Electronics, Inc. Nidec America Corporation Automation, Pow er, Motion & Control 30.2 1.4x -
9/1/2015 10/2/2015 ABEL GmbH & Co. KG Rotex Global, Coperion Corp., Terrasource Global Flow Control 106.7 3.2x 11.9x
8/31/2015 10/5/2015 Wolverine Advanced Materials, LLC ITT Corporation (nka:ITT Inc.) Industrial Conglomerates 300.0 - -
8/31/2015 8/31/2015 Engineered Products Company Donaldson Company, Inc. Environmental Equipment / Controls - - -
8/25/2015 8/25/2015 Thermocouple Technology, Inc. Viking Capital Holdings Automation, Pow er, Motion & Control - - -
8/15/2015 9/18/2015 ERICO Global Company Pentair plc Flow Control 1,800.0 - -
8/3/2015 8/3/2015 Rimrock Corporation Lincoln Electric Holdings Inc. Automation, Pow er, Motion & Control - - -
8/3/2015 8/3/2015 B+ Equipment SAS Sealed Air Corporation Automation, Pow er, Motion & Control - - -
7/31/2015 8/3/2015 IDEX Corporation, Ismatec Product Line Cole-Parmer Instrument Company, LLC Flow Control 28.0 2.2x -
7/30/2015 7/30/2015 IEF-Werner GmbH INDUS Holding AG Automation, Pow er, Motion & Control - - -
7/30/2015 9/1/2015 Delta Tau Data Systems, Inc. OMRON Corporation Automation, Pow er, Motion & Control - - -
7/30/2015 12/1/2015 Custom Sensors & Technologies (Huizhou) Ltd. Sensata Technologies Holding NV Automation, Pow er, Motion & Control - - -
7/30/2015 12/1/2015 Custom Sensors & Technologies US Corporation Sensata Technologies Holding NV Automation, Pow er, Motion & Control - - -
7/28/2015 12/29/2015 Elster Group SE Honeyw ell International Inc. Industrial Conglomerates 6,523.6 4.0x -
Median: 1.9x 11.8x
Average: 2.2x 12.3x

INDUSTRIAL TECHNOLOGY QUARTERLY
©2016 Raymond James & Associates, Inc., member New York Stock Exchange/SIPC
1033 Demonbreun Street, Suite 505 // Nashville, Tennessee 37203 // T (615) 645-6820 // raymondjames.com
INVESTMENT BANKING
15
• Ten dedicated investment bankers with over 150 combined years of banking and capital markets expertise
• Services: Mergers & Acquisitions (Buy & Sell-side advisory); Public Equity and Debt Offerings; Private Placements of Equity and Debt;
Divestitures; Restructurings & Recapitalizations; Valuations & Fairness Opinions
• Longstanding relationships with extensive network of industrial-focused strategic buyers and private equity sponsors
INDUSTRIAL SECTOR EXPERTISE
INDUSTRIALS INVESTMENT BANKING GROUP
Building Products & Infrastructure Water Infrastructure
Distribution
Building Products Metals & Infrastructure Equipment Services
Automation & Process Control
Environmental Equipment
& Controls Intelligent Transportation
Basic Specialty
• Stone, Concrete,
Aggregates
• Lumber
• Walls, Ceilings,
Floors, Decking
• Framing, Roofing,
Insulation
• Sheet Goods
• Windows & Doors
• Fixtures &
Cabinets
• Lighting
• Residential
Plumbing
• Service Centers &
Processors
• Metal Stamping
• Steel Fabricators
• Integrated
Producers
• Mini Mill
Producers
• Storm Water
Products
• Pipe & Tube
Producers
• Aluminum
• Scrap & Raw
Materials
• Recycling
Services
• Metal, Concrete
and Plastic Pipe
• Filtration /
Separation
• Distribution &
Collection
• Specialty
Chemicals
• Water &
Wastewater
Treatment
Equipment
• Treating Boiler
Water
• Manufactured /
On-site Tanks
• Irrigation
• Pump Stations
• Pool Supplies
• Disinfection
• Facility
Management
• Site Development
• Billing & Meter
Reading
• Energy
Management
• Maintenance
• Pipeline Repair
• Logistics
• Procurement
• Support Services
• Well Water
Drilling
• Installation &
Tunneling
• Marine
Construction
• Water and
Wastewater Plant
Construction
• Automation
• Robotics
• Motion Control
• Photonics
• Building Controls
• 3D Printing
• Pumps
• Control Valves
• Control Systems
• Wire & Cable
• Interconnect
Systems
• Connectors
• Instrumentation &
Control Products
• Transmission &
Distribution
(Services &
Products)
• Switchgear &
Signal
Conditioning
Products
• Air Handling
• Filtration
• HVAC
Components
• Bike Rentals
• Smart Traffic
• On-Demand
• Roofing
• HVAC
• Insulation
• Engineered Wood
• Pipe, Valve &
Fitting
• Process Flow
Control
• Motion Control &
Fluid Power
• MRO
• Automotive
• Tires
• Linens
• Fiberglass
• Diversified
• Technology
• Heavy Equipment
Global Connectivity
Industrial Technology