investment opportunities in thailand - thai embassy€¦ · investment opportunities in thailand 2...
TRANSCRIPT

1
Duangjai Asawachintachit
Director
Investment Marketing Bureau
Thailand Board of Investment
August 2008
Investment Opportunities in Thailand
2
Strong Economic FundamentalsStrong Economic Fundamentals
3
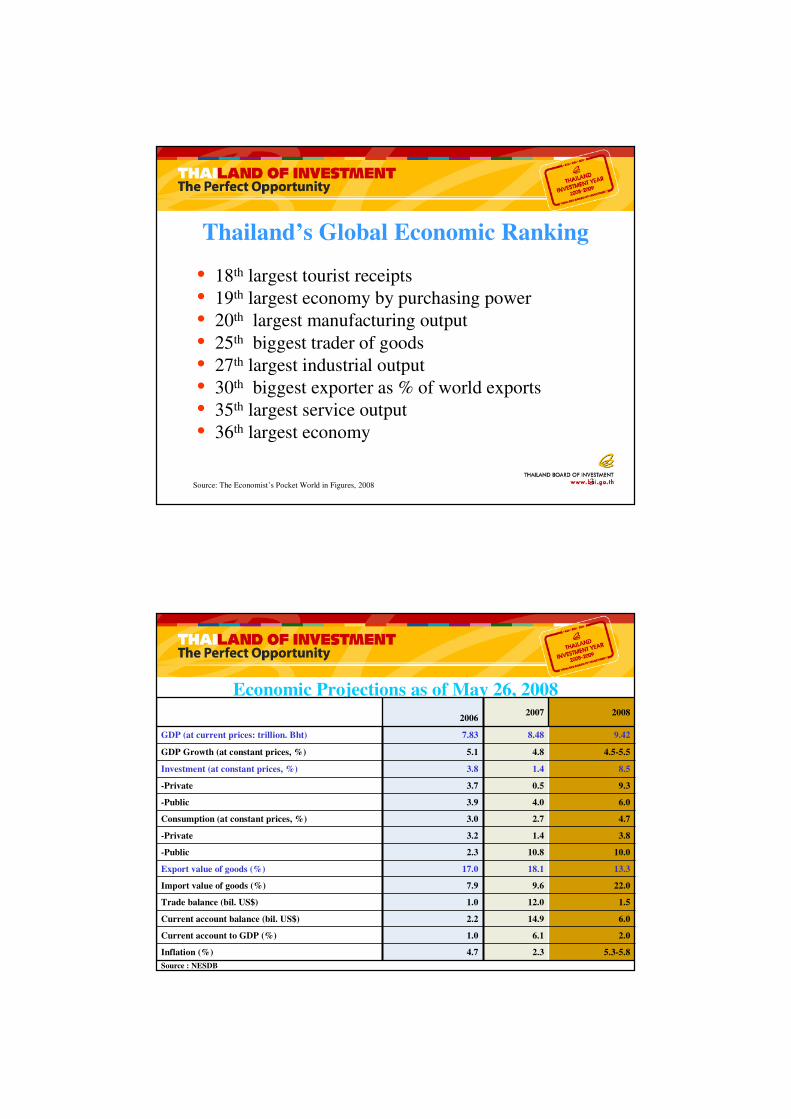
Thailand’s Global Economic Ranking
• 18th largest tourist receipts
• 19th largest economy by purchasing power
• 20th largest manufacturing output
• 25th biggest trader of goods
• 27th largest industrial output
• 30th biggest exporter as % of world exports
• 35th largest service output
• 36th largest economy
Source: The Economist’s Pocket World in Figures, 2008
4
Economic Projections as of May 26, 2008
2006 2007 2008
GDP (at current prices: trillion. Bht) 7.83 8.48 9.42
GDP Growth (at constant prices, %) 5.1 4.8 4.5-5.5
Investment (at constant prices, %) 3.8 1.4 8.5
-Private 3.7 0.5 9.3
-Public 3.9 4.0 6.0
Consumption (at constant prices, %) 3.0 2.7 4.7
-Private 3.2 1.4 3.8
-Public 2.3 10.8 10.0
Export value of goods (%) 17.0 18.1 13.3
Import value of goods (%) 7.9 9.6 22.0
Trade balance (bil. US$) 1.0 12.0 1.5
Current account balance (bil. US$) 2.2 14.9 6.0
Current account to GDP (%) 1.0 6.1 2.0
Inflation (%) 4.7 2.3 5.3-5.8
Source : NESDB

5
Thailand’s Top 10 Exports (2007)Top 10 Exports in 2007Top 10 Exports in 2007 Value Value (USD (USD
Mil.)Mil.)
11 Computers & components 17,29917,299
22 Motor cars, parts and accessories 12,03512,035
33 Integrated circuits 8,0538,053
44 Rubber 5,6395,639
55 Gems and jewelry 5,3815,381
66 Plastic pellets 5,2125,212
77 Iron and Steel 4,5704,570
88 Machinery & Parts 4,3394,339
99 Refine fuels 4,0974,097
1010 Chemical 3,9203,920
Source: Thai Customs
2 of Top 10 exports are electronics products
6
Economic Growth Rates
2000-2007
1.8
4.6 4.85.1
4.5
6.3
6.9
5.2
5.3
4.9
2.63.1
4.1
4.95.1 4.9
0
1
2
3
4
5
6
7
8
2000 2001 2002 2003 2004 2005 2006 2007
%
Thailand
World
Source: BOT and NESDB, Thailand

Latest Economic Stimulus Package
1. Reduction of excise tax on oil which will lower consumer oil prices.
2. Postponing an increase of LPG price to reduce household expenses over the next six months.
3. Reducing utility water bills by offering free use of tap water by households using less than 50 cubic metres per month.
4. Reducing electricity expenses for households using less than 150 units per month.
5. Reduce the cost of travel with free travel on 800 ordinary buses operated by the state run Bangkok Mass Transit Authority.
6. Reduce the cost of third class railway carriage - free travel on all routes nationwide
Source: www.thaigov.go.th, as of July 16, 2007
Trend of Malaysian Investment
BOI Approved Projects
11.94
5.37
11.57
16.40
20.41
4.37
1.68
0
5
10
15
20
25
2002 2003 2004 2005 2006 2007 2008 (Jan-
Jun)
Billion B
aht
Source: BOI, as of July 21, 2008

11.3522Services and Infrastructure
70.06
1.87
42.04
5.63
0.83
2.77
5.56
THB Billion
193TOTAL
25Petrochemicals, Chemicals
33Electrical and Electronics
53Auto and Metal Processing
10Light Industry
10Minerals and Ceramics
40Agriculture
ProjectsSector
Malaysia Approved Applications Totals by Sector: 2003-2008 (Jan-Jun)
Source: BOI, as of July 21, 2008
Sample of Malaysian Approved Projects
1.62Air transportationThai Air Asia Co,.,Ltd
2.59SemiconductorToshiba Semiconductor (Thailand)
Co.,Ltd
1.32Glass bottleThai Malaysia Glass Co,Ltd
1.35Medium density fiber boardSiam Fibreboard Co.,Ltd
2.37Gypsum boardThai Gypsum Products Public
Co.,Ltd
32.88Gas Pipeline systemTrans Thai-Malaysia (Thailand) Ltd
37.40Hard disk drive, head stack assembly, head
gimbal assembly, slider, undercoated wafer
substrate
Western Digital (Thailand) Co., Ltd
Invest (Billion
Baht)
ProductCompany
Source: BOI, as of July 23, 2008

Trade Summary between Thailand/Malaysia
5.315.82
6.61
7.79
5.185.53
8.10 8.48 8.62
5.10
10.84
13.92
15.09
16.41
10.28
0
2
4
6
8
10
12
14
16
18
2004 2005 2006 2007 2008 (Jan-Jun)
Billion
US
$
0
2
4
6
8
10
12
14
16
18
Billion
US
$
Export
Import
Total
Source: MOC, as of July 21, 2008
Principal Imports from Malaysia
29.465.108.628.488.10Total
5.362.264.464.103.24Others
36.880.290.540.510.45Electrical circuit panels
86.120.450.570.410.48Electrical machinery and parts
35.300.470.700.660.55Chemicals
20.450.701.321.271.36Computer, accessories and parts
127.580.921.011.531.99Crude oil
% Growth
(Jan- Jun 07/08)
2008
(Jan-Jun)
200720062005Description
Source: MOC, as of July 21, 2008
Unit: Billion US$

Principal Exports to Malaysia
16.345.187.796.615.82Total
16.062.894.694.083.63Others
105.380.240.630.330.34Electronic integrated circuits
-14.170.410.800.830.77Automatic data processing machines
and units thereof
31.570.480.650.450.42Motor cars, parts and accessories
6.370.520.910.800.56Rubber
-2.840.630.120.120.11Beauty or make up preparations, soap
and preparations for the care of skin
% Growth
(Jan- Jun 07/08)
2008
(Jan-Jun)
200720062005Description
Source: MOC, as of July 21, 2008
Unit: Billion US$
14
Why Thailand and Global RankingsWhy Thailand and Global Rankings

15
UNCTAD’s Survey on Most Attractive FDI
Locations1 China 11 THAILAND
2 India 12 France
3 United States 13 Malaysia
4 Russian Federation 14 Indonesia
5 Brazil 15 Singapore
6 Vietnam 16 Italy
7 United Kingdom 17 Ukraine
8 Australia 18 Japan
9 Mexico 19 Canada
10 Poland and Germany 20 Republic of Korea
Source: UNCTAD World investment Prospects Survey, 2007-2009
“FDI inflows to Thailand
continued to rise, by 9%
in 2006, reaching a
record $10 billion and
consolidating the
country’s position as the
second largest FDI
recipient in South-East
Asia.”
16
1 Singapore 12 Japan
2 New Zealand 1515 THAILANDTHAILAND
3 United States 24 Malaysia
4 Hong Kong 30 Korea
5 Denmark 50 Taiwan
6 UK 83 China
7 Canada 91 Vietnam
8 Ireland 123 Indonesia
9 Australia 133 Philippines
10 Iceland 164 Laos PDR
Ease of Doing Business
Source: World Bank Study: Doing Business 2008

17
Liberal Investment Policy
• No restrictions on foreign currency remittances
• No export requirement
• No foreign equity restrictions in manufacturing
sectors
• No local content requirement
18
Bangkok 2007 One of the world’s least expensive cities
1) Moscow 48) Taipei
2) London 52) Mumbai
3) Seoul 55) Jakarta
4) Tokyo 56) Hanoi
5) Hong Kong 60) Ho Chi Minh City
8) Osaka 64) Melbourne
14) Singapore 68) New Delhi
15) New York City 68) Guangzhou
20) Beijing 95) BANGKOK
Source: Mercer Human Resources Consulting Worldwide Cost of Living Survey 2007

19
Cost of Living
Source: World Bank Study: Doing Business 2008
94
.9
86
.8
85
.4
84
.2
82
.4
79
.0
69
.3
64
.9
50
55
60
65
70
75
80
85
90
95
100
Beijing,
China
Taipei,
Taiwan
Hanoi,
Vietnam
Ho Chi
Minh City,
Vietnam
New Delhi,
India
Kuala
Lumpur,
Malysia
Bangkok,
Thailand
Manila,
Philippines
20
Wage Costs
400
230 220
120 120
0
50
100
150
200
250
300
350
400
450
US
$
Peking and
Shanghai
Thailand Philippines Indonesia Vietnam
Source: Strategic Alliance Network (Sanet GmbH)

Top 10 Cities Overall
Rank 2008 Rank 2007 Name Score
1 3 Bangkok 87.61
2 2 Buenos Aires 87.24
3 10 Cape Town 86.59
4 5 Sydney 86.49
5 1 Florence 86.24
6 - Cuzco, Peru 86.15
7 4 Rome 85.12
8 6 New York 85.03
9 8 Istanbul 84.61
10 9 San Francisco 84.42
Note: “-” means that the property was not among the top-ranked in this category last year
Source: www.travelandleisure.com
22
Mass Transit :
Skytrain, Subway, Bus Systems all to be expanded
Highway System: Over 70,000 km to all provinces.
Deep Sea Ports: : 6 deep sea ports and 2 international river ports
Capacity over 10 million TEU - Laem Chabong ranked 21st among top 120 container ports
Rail: 4,346 km rail, links to Malaysia, Singapore. Bangkok Light Rail expansion plan for
137 km (2006-2012)
Industrial Estates::
38 under IEAT and an additional 18 industrial zones and parks
Internet: Wi-Fi Capability and Inexpensive Broadband Widely Available – speeds to 5
Mbps
Communications:46% cell phone use (some studies as high as 82%)
CBD Office Rent (Bangkok):
Grade A: US$12/sq. ft./year Grade B: US$18.90/sq.meter as of first quarter ‘08
Six international airports run by AOT: 2007 operations: 56 million passengers and 1.26 million tons cargoSuvarnabhumi Intl. Airport: Initial capacity: 45 million passengers and 3 million ton cargo /year
Infrastructure- Strong and Growing

23
24
Priority Transport Corridors of Thailand in
GMS
Source: NESDB

25
Ping Thong Industrial Estate
Hemaraj Land and Development PLC
Amata Industrial Estate
Gateway CityIndustrial Estate
Asia Industrial Estate
PadaengIndustrial Estate
Map Ta PhutIndustrial Estate
Laem Chabang Industrial Estate
WellgrowIndustrial Estate
Golf Course
International School& University
Hospital
304 Industrial Park
RojanaIndustrial Park
0
2,000,000
4,000,000
6,000,000
8,000,000
10,000,000
12,000,000
14,000,000
2547
2548
2549
2550
2551
2552
2553
2554
2555
2556
2557
2558
2559
2560
TEU
Capacity
Forecast
Capacity and Throughput of Laem Chabang Port
7.4 million
TEU/yr
10.8 million TEU/yr
Actual Throughput
����������

27
ASEAN: 550 million AFTA ASEAN: 550 million AFTA
Australia: 20 million TAFTAAustralia: 20 million TAFTA
China: 1.3 billion China: 1.3 billion
Early Harvest :ChinaEarly Harvest :China--Thailand Thailand
ChinaChina--ASEAN FTA ASEAN FTA
India: 1.1 billion India: 1.1 billion
Early Harvest Agreement Early Harvest Agreement
Japan: 128 million Japan: 128 million
JapanJapan--Thailand Economic Thailand Economic
Partnership AgreementPartnership Agreement
Taiwan: 23 million Taiwan: 23 million
Thailand: 65 millionThailand: 65 million
GDP per capita: GDP per capita: BhtBht 128,563.6128,563.6
New Zealand: 4 million New Zealand: 4 million
Closer Economic PartnershipCloser Economic Partnership
Hub of Access to Regional Markets (Countries and populations)
28
TAX RATESTAX RATES

Taxation
• Corporate income tax
• 10% for regional operating headquarters
• 20-30% for net profits (for firms with capital of < 5
million baht)
• 30% of net profits (for other firms)
• VAT – 7%
• Remittances: 10% of gross remittances
• Withholding: 10-15%
• Personal income: 0-37% (sliding scale)
Several changes recently announced (1)
• Starting from July 2008, a minimum of three shareholders is required for
company establishment (in the past seven) in order to accelerate the
establishment process.
• Decrease of corporate income tax from 30% to 20-25% with retrospective
effect from January 1, 2008.
• Register of Memorandum of Association and register of a company at the same
day possible
• Reduction of tax on land and real estate from 3.3% to 0.1% and reduction of
transfer charge from 2% to 0.01%
• Increase of tax-free amount on income tax of an individual enterprise to
1,200,000 THB
• 40% deduction on acquisition costs for computer software for more than 3 years
• 100% deduction on acquisition costs if not exceeding 500,000 THB
(Exception: e.g. real estate) Source: www.sanet.eu

For Juristic Persons (e.g. Ltd., PLC.) only:
• Up to 125% deduction on costs of energy-saving
instrumentation, energy-saving technical equipment or
energy-saving materials
• 40% deduction on acquisition costs for technical equipment
and technical instrumentation
• Increase of deduction on acquisition costs for computer
software from 10% to 33.33% for a period of 3 years
• Decrease of corporate income tax from 30% to 20-25% for
MAI/SET listed companies
Several changes recently announced (2)
Source: www.sanet.eu
32
Basic BOI Privileges and IncentivesNON-TAX INCENTIVES
• Land ownership rights for foreign investors
• Permission to bring in foreign experts and technicians
• Work permit/visa facilitation
• Fast Track immigration lane
TAX INCENTIVES
• Corporate income tax holidays up to 8 years
• Import duty reductions
or exemptions on machinery and raw
materials
33
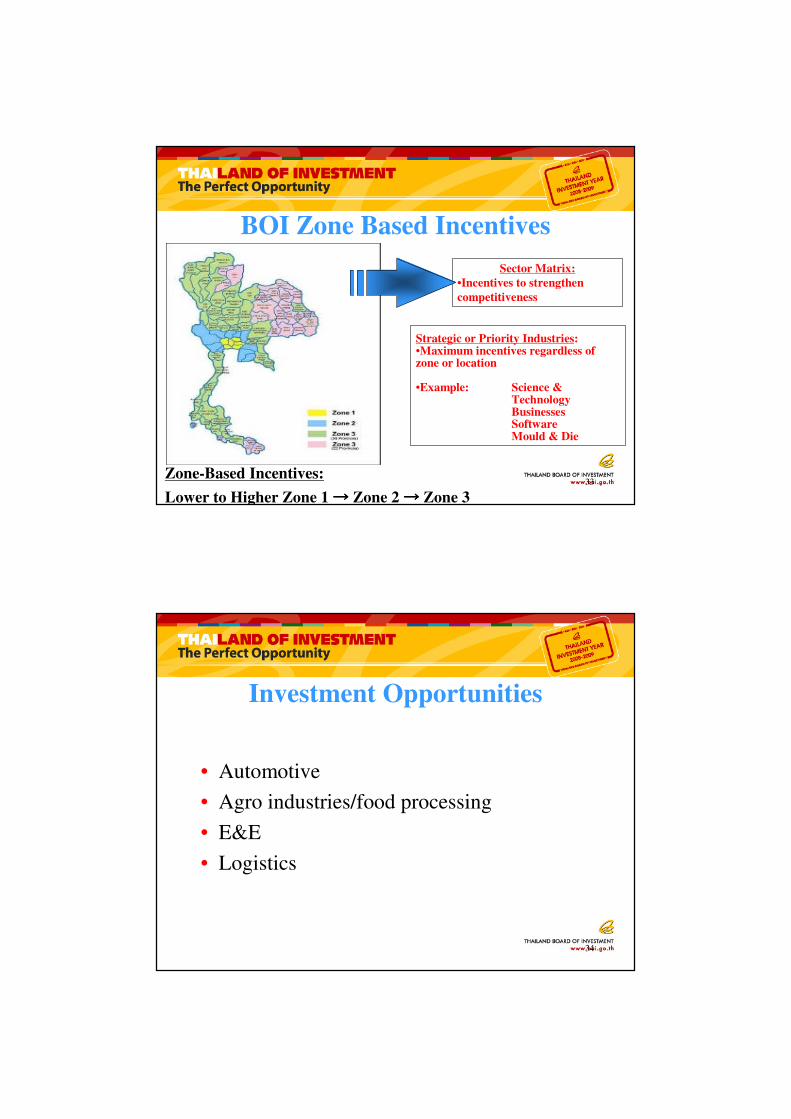
Sector Matrix:
•Incentives to strengthen
competitiveness
Strategic or Priority Industries:•Maximum incentives regardless of zone or location
•Example: Science & Technology BusinessesSoftwareMould & Die
BOI Zone Based Incentives
Zone-Based Incentives:
Lower to Higher Zone 1 →→→→ Zone 2 →→→→ Zone 3
34
Investment Opportunities
• Automotive
• Agro industries/food processing
• E&E
• Logistics

35
Auto & Auto Parts Industries
Thailand: Automotive Hub of Asia
36
• Auto sector 12% of GDP
• Largest auto producer in Southeast Asia
• World’s 2nd largest producer and market of pickup trucks.
• 16 assemblers with production of 1.3 mil. units in 2007: 53% exports
• Strong Supporting Industry
– ~ 1,800 suppliers of Tier 1, 2 ,3
• High Local content : 80-90% for pick up and 30-70% for passenger car
• New policy to promote production base for Eco car
Automotives
Target: Top 10 auto producer by 2010, producing 1,800,000 units

37
2007 Automotive Industry in Thailand
1,287
1,177
158
559
525434
389
584
459
411327
928
750
631
683
262218
296
363
589
485 571
144
409
626533
690
539
21 8 14
66 130 152 175
42
180233
332
0
200,000
400,000
600,000
800,000
1,000,000
1,200,000
1,400,000
1995 1996 1997 1998 1999 2000 2001 2002 2003 2004 2005 2006 2007
Production Domestic Export
Thousand Units
38
Economic Growth and Car Consumption
Country GDP Growth
(%)
GDP per Capita (US$)
Population (M.
persons)
Persons per Car
Domestic Demand
(Units/yr)
1 USA 5 36,200 278 2.1 17,440,000
2 Japan 1.3 24,900 126 2.5 5,940,000
3 Germany 3 23,400 83 1.9 3,620,000
4 United Kingdom 3 22,800 59 2.2 2.810,000
5 France 3.1 24,400 59 2.2 2,550,000
6 Italy 2.7 22,100 57 1.8 2,480,000
7 Canada 4.3 24,800 31 2.2 1,630,000
8 Korea 9 16,100 47 4.0 1,130,000
9 Thailand 4.5 2,800 62 10.0 700,000
10 Belgium 4.1 25,300 10 2.2 550,000

39
Thailand : The Automotive Hub of Asia
China•Population 1,285 million
•Production 2005: 5.7 million•Dom. Sales 2005: 5.7 million
•Biggest Share: Passenger Car
Japan•Population 127.1 million
•Production 2005: 10.7 million•Dom. Sales 2005: 5.9 million
•Biggest Share: Small & Compact Passenger Car
Thailand•Population 64 million
•Production 2005: 1.1 million•Dom. Sales 2005: 0.7 million•Biggest Share: Commercial
Vehicle (1-ton Pick up)
India •Population 914 million
•Production 2005: 1.6 million•Dom. Sales 2005: 1.4 million
•Biggest Share: Passenger Car
Korea•Population 47.6 million
•Production 2005: 2.5 million•Dom. Sales 2005: 1. 1 million
•Biggest Share: Passenger Car
40
General Auto Assembly Incentives
• No corporate income tax holiday in any zone
• Projects in Zone 1 receive 50% reduction of import duty on
machinery
• Projects in Zone 2 receive
– 50% reduction of import duty on machinery if setting up outside industrial
estate
– Exemption on import duty on machinery if setting up inside industrial
estate
• Projects in Zone 3 receive import duty exemption on machinery
• Investment of greater than 10 billion Baht required

41
Promotion of Passenger Car Manufacturing
• Waivers on import duty for machinery• 5-year corporate income tax exemption
• Projects must have a minimum production of 100,000 units/year within 5 years
• The size if investment, exclusive of land cost and working capital, must not be lower than THB 15 billion (around AUD$ 512 million) within the first five years of corporate tax holidays.
• Presenting a plan of parts usage and parts manufacturing to the Board for approval.
42
Investment Incentives
for Automotive Component & Part Manufacturing
Zone 3Zone 2Zone 1
Examples: Electronic Fuel Injection Systems, ABS Brake Systems,
Substrates for Catalytic Converters, NGV Parts, Molds/Dies
Exempt from corporate income tax for 8 years
Exempt from machinery import duties
Machinery Duty: 50% reduction
Corporate Income tax exemption:
In IE - 3 years
High-Tech
Machinery Duty: Exempt
Corporate Incometax exemption:
exempt 8 years
Machinery Duty: 50% reductionCorporate Incometax exemption: In IE - 7 years Outside IE - 3 years
General

43
• Passenger Car Engines• Fuel Injection Pumps• Transmissions• Differential Gears• Injection Nozzles• Electronic Systems• Electronic Control Units• Turbo Chargers• Substrates for Catalytic converters• Anti-Lock Brake Systems• NGV Equipment � target: 99,000 NGVs by 2008
Opportunities: Components not
Sufficiently Produced in Thailand
44
AgroAgro--based Industriesbased Industries
Fertile Grounds for InvestmentFertile Grounds for Investment
As of June 12, 2008As of June 12, 2008
45
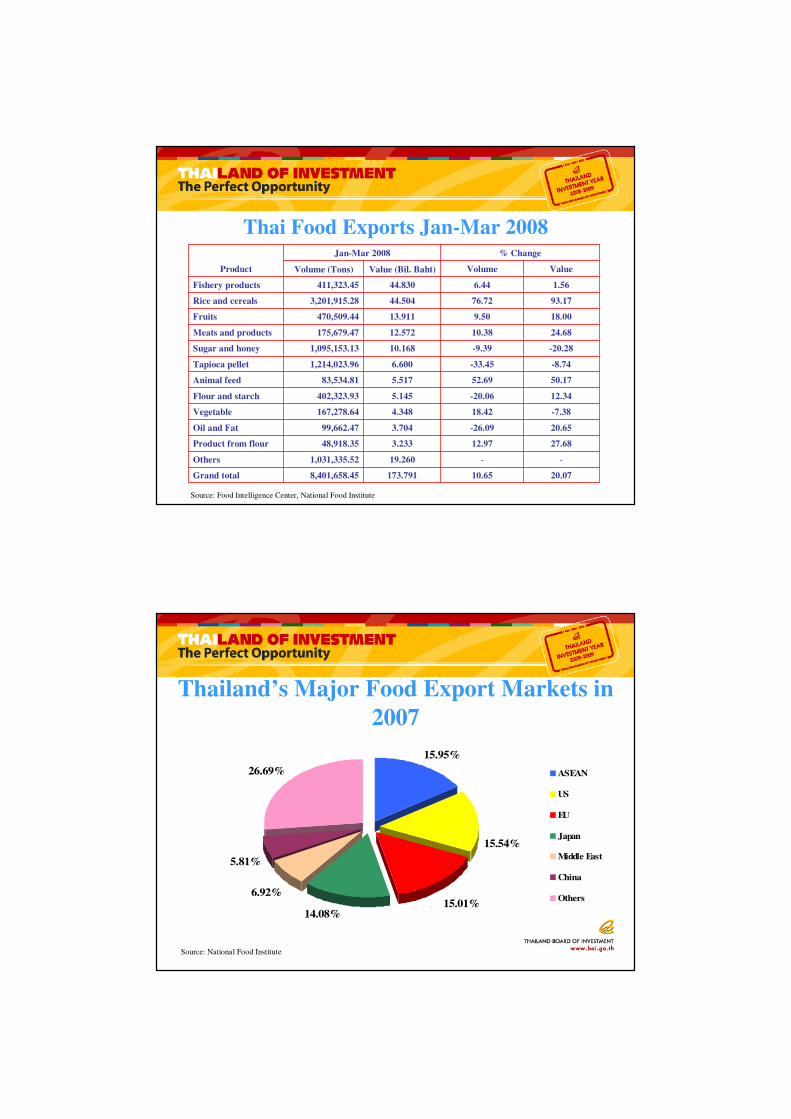
Thailand: World’s Leader in Agro-Based Products
• World’s No.1 producer of natural rubber
• World’s top exporter of rice
• Seafood, canned tuna, canned pineapples, cassava
• World’s No.2 exporter of sugar
43.888
48.559
119.304
194.356
2007
57.743205.470Rubber
9.86828.109Sugar
15.28743.370Tapioca products
43.41498.179Rice
Q1/20082006Products
Exports in 2006 – 2008
Source: Bank of Thailand
(Billion Baht)

Thailand's Exported Food
products 2005 - 2008f
(Quantity: Ton, Value: million US$)
20,40130,872,29121,36228,725,73420,49524,258,56016,60523,259,220Total
2,6422,885,5742,4452,279,7992,6712,725,1722,3292,961,678Other foods not specified
3201,054,985338856,304127516,17567484,402Animal feed
541257,486544230,794530217,883431199,310Pet food
217232,724208243,078175201,550144155,662Non-alcoholic beverage
280193,230278165,422264153,082209154,898Seasonings
13776,79316168,95514270,95811865,031Rice products
131242,798127194,943131273,407100196,972Flour and starch
4871,805,9324821,529,2175091,697,5793101,430,777Cassava flour and starch
8266,596,8067535,331,9946254,224,7634083,031,308Cassava products
306470,909328411,814183298,314121175,221Palm oil
1,2053,544,0231,5884,429,1171,0092,238,8099053,041,397Sugar
3,5798,860,0643,9478,730,0863,5487,438,5712,9887,537,342Rice
Other food products
309339,122295289,864323315,910240225,606Vegetable / fruit juice
469738,635462685,272448594,313385634,600Fresh / dried fruit
619574,042647537,166695541,356544483,225Vegetable products
1,0991,076,4181,074908,9281,100959,250903832,731Canned / processed fruit
2,4972,728,2172,4782,421,2302,5642,410,8292,0732,176,162Vegetable and fruit
513199,235528182,749494169,009437171,761Other canned/processed fish
544102,30957996,64558695,573520101,017Squid
569388,249643400,573641364,709584353,360Chilled / frozen fish
1,546506,9561,577455,3961,785501,6521,453454,909Canned / processed tuna
2,737361,6502,971359,5003,153346,9112,287282,994Shrimp
5,9081,558,3996,2971,494,8636,6561,477,8545,2831,364,041Fishery
1,321364,3531,387338,1171,357313,6151,119285,022Chicken and poultry
Livestock
ValueQuantityValueQuantityValueQuantityValueQuantity
2008f200720062005
Export Items
Source: Department of Trade Negotiations and Food Institute (Quantity: Ton, Value: million AUD$)
Thai Food Exports Jan-Mar 2008
20.0710.65173.791 8,401,658.45Grand total
--19.2601,031,335.52Others
27.6812.973.233 48,918.35 Product from flour
20.65-26.093.704 99,662.47 Oil and Fat
-7.3818.424.348 167,278.64Vegetable
12.34-20.065.145 402,323.93Flour and starch
50.1752.695.51783,534.81Animal feed
-8.74-33.456.600 1,214,023.96Tapioca pellet
-20.28-9.3910.168 1,095,153.13 Sugar and honey
24.6810.3812.572175,679.47Meats and products
18.009.5013.911 470,509.44Fruits
93.1776.7244.504 3,201,915.28Rice and cereals
1.566.4444.830 411,323.45Fishery products
ValueVolumeValue (Bil. Baht)Volume (Tons)
% ChangeJan-Mar 2008
Product
Source: Food Intelligence Center, National Food Institute
Thailand’s Major Food Export Markets in
2007
26.69%
5.81%
6.92%
14.08%15.01%
15.54%
15.95%
ASEAN
US
EU
Japan
Middle East
China
Others
Source: National Food Institute

51
• food packaging materials
• cold storage transport:
− 8-year corporate income tax exemption,
regardless of zone
Thailand’s booming agriculture exports has
created opportunities for investment in:
52
Food Processing Equipment
• About 5.523 billion Baht in machinery for
bottling, filling, sealing, labeling and
washing was imported in 2007 reflecting
tremendous new investment opportunities.

53
Food Safety Equipment
• Thailand has enforced the Good Manufacturing Process
(GMP) standard since 2003, leading to significant
growth in the food safety equipment market, which is
about 11.342 billion Baht in 2005 and growing by about
20-25% per year.
54
• Thailand was the first country to implement a
scientific standard for Halal Food, carried out by the
Halal Science Center, with companies accredited by
the Central Islamic Committee of Thailand
• More than 1,700 companies with over 50,000
products received Halal Certificates in 2006
(Source: The Institution for Halal Food Standards of Thailand)
Halal Food

Opportunities in Agro-based Industries
• Rubber: 2.97 million tons or 194.36 billion Baht exported in 2007 and 1.18 million ton or 89.87 billion Baht exported between January and May 2008• Opportunities in tires, rubber gloves, etc
• Tapioca:7.24 million tons or 48.56 billion Baht exported in 2007 and 2.81 million ton or 23.47 billion Baht exported between January and May 2008
• Opportunities in Biofuels, food additives
• Sugar: 4.41 million tons or 43.89 billion Baht exported in 2007 and 1.91 million ton or 17.28 billion Baht exported between January and May 2008
• Opportunities in lactic acid, alcohol
Source: Bank of Thailand, as of 16 July, 2008
56
Electronics & Electrical Products
Integrating Innovation & Technology
57
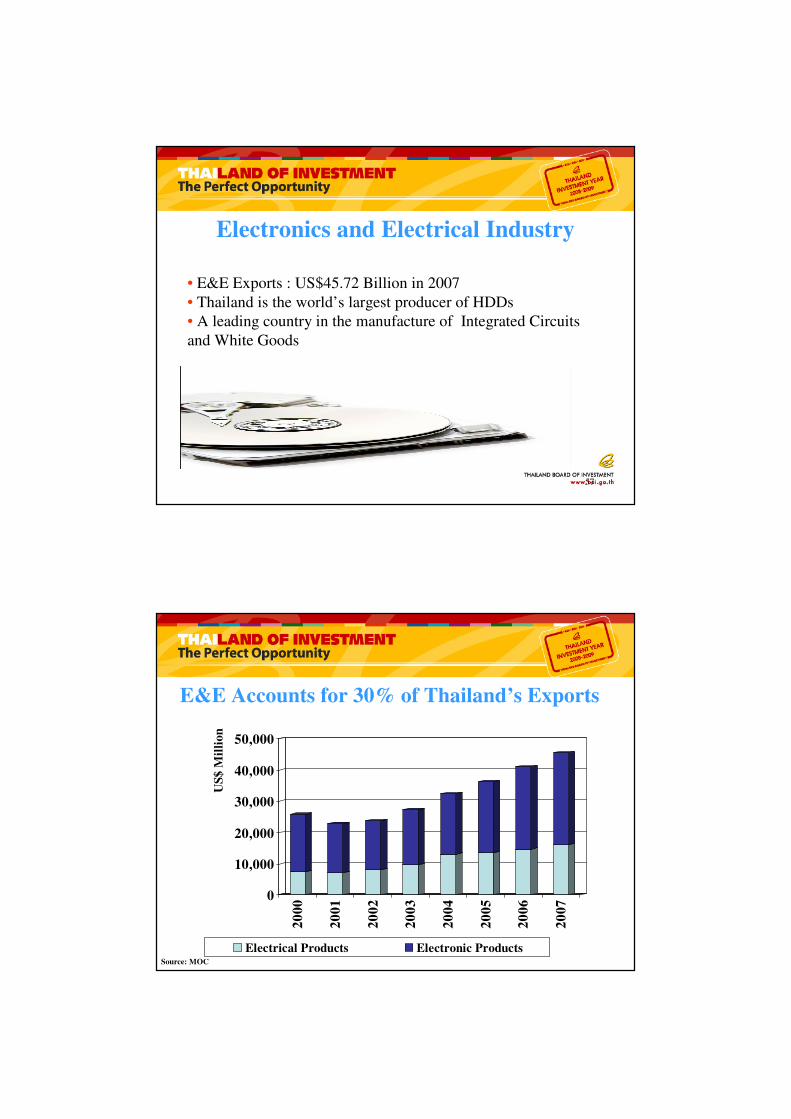
Electronics and Electrical Industry
• E&E Exports : US$45.72 Billion in 2007
• Thailand is the world’s largest producer of HDDs
• A leading country in the manufacture of Integrated Circuits
and White Goods
58
Source: MOC
0
10,000
20,000
30,000
40,000
50,000
US
$ M
illi
on
20
00
20
01
20
02
20
03
20
04
20
05
20
06
20
07
Electrical Products Electronic Products
E&E Accounts for 30% of Thailand’s Exports

59
E & E Industry Production
Items
Production Growth Rate (%) Average Growth
(%) Between 2004-2007
2005 2006 2007 2005 2006 2007
Integrated Circuit
(Million Pieces)11,378 13,954 14,334 15.5 22.6 2.72 13.61
Hard Disk Drive
(1,000 Units)120,707 153,980 205,277 59.5 27.3 33.31 40.04
Printers
(1,000 Units)19,241 16,577 17,439 -9.5 -13.8 5.2 -6.03
Source: Bank of Thailand
Thailand’s Electrical Appliance
Exports by Market in 2007
18%
17%
17%13%
6%
7%
22%EU
Japan
ASEAN
US
Middle East
China
Others

Air Conditioner40.0
30.0
20.0
10.0
0.0
-10.0
-20.0
-30.0
-1.0 5.0 10 15 20 25 30 3540
China
Star
Dog
Thailand
Italy
USA
Malaysia
2007
Source: The Office Of Industrial Economics
Growth
Market Share
M$
1. China 6,308
2. Thailand 3,155
3. Italy 1,427
4. United States 1,110
5. Malaysia 993
6. Japan 813
7. Germany 776
8. Belgium 623
9. South Korea 577
10 Spain 411
Refrigerator
561
608
726
929
946
1,020
1,444
1,598
2,246
9. Poland
8. Singapore
7. USA
6. Germany
5. Thailand
4. Italy
3. Mexico
2. South Korea
1. China
60.0
50.0
40.0
30.0
20.0
10.0
0.0
-10.0
-20.0
-30.0
-1.0 2.0 4.0 6.0 8.0 10.0 12.014.0
China
Dog
South Korea
MexicoItaly
Thailand
2007Star
Source: The Office Of Industrial Economics
Growth
Market Share
M$

Microwave
106
157
209
223
301
566
2147
7. Sweden
6. USA
5. Germany
4. South Korea
3. Malaysia
2. Thailand
1. China
60.0
50.0
40.0
30.0
20.0
10.0
0.0
-10.0
-20.0
-30.0
-1.0 10 20 30 40 50 6070 80
China
Dog
Thailand
S Korea
Germany
2007Star
Source: The Office Of Industrial Economics
Growth
Market Share
M$
Malaysia
Washing Machine
344
450
532
570
599
953
1,533
1,986
2,046
9. Spain
8. Slovakia
7.Poland
6. Thailand
5. USA
4. S Korea
3. China
2.Germany
1. Italy
60.0
50.0
40.0
30.0
20.0
10.0
0.0
-10.0
-20.0
-30.0
-1.0 5.0 10.0 15.0 20.0 25.030.0
Italy
Dog
Germany
China
Thailand
South Korea
2007 Star
Source: The Office Of Industrial Economics
Growth
Market Share
M$

65
Science & Knowledge Based
Value Chain
Missing Links
(Forward & Backward)
High V.A.
Ind
ust
ry /
Ser
vic
eStrengthening
Existing
Existing New & Cluster
Strategies for the Electronics Industry
•Plasma TV
• LCD TV• Air Conditioner
2
•Wafer
• IC Design• Plasma Display Panel
• LCD Panel
3
•Mobile Phone
• Other CE• Media / Platter
41
Logistics

Total Logistics Costs as Percentage of GDP
17
13
8
0
2
4
6
8
10
12
14
16
18
Log
isi=
tics
Cost
s(%
)
Thailand Malaysia Singapore
%
Source: Frost & Sullivan
Investment Opportunities (1 of 2)
• Malaysia has attached great importance to the development of an efficient and integrated transportation network, building infrastructure facilities (seaports, airports and rail links) and adopting a supply-driven policy to streamline transport. The shipping costs from Malaysia are very competitive, and much lower than Thailand.
• Building shipping containers in Thailand presents a good investment opportunity not only because it promises to erase or at least reduce the costs associated with sending empty containers to their filling points, but also because the demand for these containers continues to grow.

Investment Opportunities (2 of 2)
• Laem Chabang Port (LCP) is searching for private sector to operate its C0 berth to match the export demand of automobile industry.
• The inefficiency of Thailand’s trucking industry presents an opportunity for multinational logistics service providers (LSPs). If they acquire and consolidate some of the medium to large local trucking companies, they can transfer some of their trucking freight management technology to these firms and ultimately become a powerful market force.
• The number of hi-tech logistics and warehouse centers for domestic distribution is also insufficient.
70