investor & analyst day -...
TRANSCRIPT

Investor & Analyst Day
March 9, 2015
LendingTree, Inc.
(Nasdaq: TREE)

2
Forward-Looking Statements
Safe Harbor Statement Under the Private Securities Litigation Reform Act of 1995 The matters contained in this presentation may be considered to be "forward-looking statements" within the meaning of the Securities Act of 1933 andthe Securities Exchange Act of 1934, as amended by the Private Securities Litigation Reform Act of 1995. Those statements include statementsregarding the intent, belief or current expectations or anticipations of LendingTree and members of our management team. Factors currently known tomanagement that could cause actual results to differ materially from those in forward-looking statements include the following: adverse conditions inthe primary and secondary mortgage markets and in the economy, particularly interest rates; seasonality of results; potential liabilities to secondarymarket purchasers; changes in the Company's relationships with network lenders; breaches of network security or the misappropriation or misuse ofpersonal consumer information; failure to provide competitive service; failure to maintain brand recognition; ability to attract and retain customers in acost-effective manner; ability to develop new products and services and enhance existing ones; competition; allegations of failure to comply withexisting or changing laws, rules or regulations, or to obtain and maintain required licenses; failure of network lenders or other affiliated parties tocomply with regulatory requirements; failure to maintain the integrity of systems and infrastructure; liabilities as a result of privacy regulations; failureto adequately protect intellectual property rights or allegations of infringement of intellectual property rights; and changes in management. These andadditional factors to be considered are set forth under "Risk Factors" in our Annual Report on Form 10-K for the period ended December 31, 2013, ourQuarterly Report on Form 10-Q for the period ended September 30, 2014 and in our other filings with the Securities and Exchange Commission. Weundertake no obligation to update or revise forward-looking statements to reflect changed assumptions, the occurrence of unanticipated events orchanges to future operating results or expectations.
About LendingTree, Inc.LendingTree, Inc. (NASDAQ: TREE) operates the nation’s leading online loan marketplace and provides consumers with an array of online tools andinformation to help them find the best loans for their needs. LendingTree’s online marketplace connects consumers with multiple lenders that competefor their business, empowering consumers as they comparison-shop across a full suite of loans and credit-based offerings. Since inception, LendingTreehas facilitated more than 35 million loan requests. LendingTree provides access to lenders offering home loans, home equity loans/lines of credit,personal loans, auto loans, student loans and more.
LendingTree, Inc. is headquartered in Charlotte, N.C. and maintains operations solely in the United States.

3
Agenda
TIME TOPIC PRESENTER TITLE
10:30 AMCompany Overview & Market Opportunity
Doug Lebda Founder, Chairman & CEO
11:00 AM Business Overviews Gabe Dalporto CMO, President – Mortgage
11:30 AM Product & Technology Nikul Patel Chief Product & Technology Officer
12:00 PM LUNCH
12:15 PM Client Panel Sam Mischner (moderator) SVP – Sales & Client Management
1:00 PM Consumer Marketing Fred Saunders SVP – Marketing/Brand Management
1:30 PM Financials Alex Mandel CFO
2:00 PM Group Q&A
2:45 PM Closing Remarks Doug Lebda Founder, Chairman & CEO

Company Overview & Market Opportunity
Doug Lebda – Founder, Chairman & CEO
5
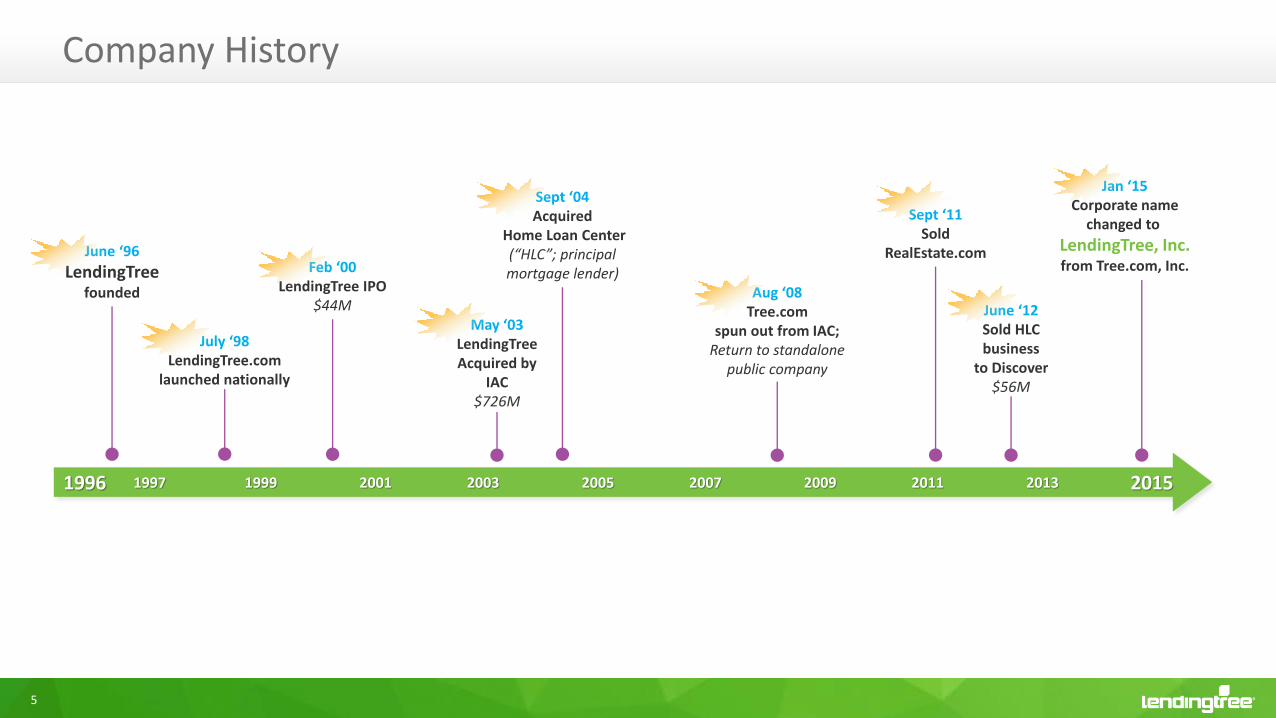
Company History
July ‘98LendingTree.com
launched nationally
June ‘96
LendingTreefounded
Feb ‘00LendingTree IPO
$44M
Sept ‘04Acquired
Home Loan Center(“HLC”; principalmortgage lender)
Aug ‘08Tree.com
spun out from IAC;Return to standalone
public company
Sept ‘11Sold
RealEstate.com
Jan ‘15Corporate name
changed to
LendingTree, Inc.from Tree.com, Inc.
1996
May ‘03LendingTreeAcquired by
IAC$726M
June ‘12Sold HLCbusiness
to Discover$56M
1997 1999 2001 2003 2005 2007 2009 2011 2013 2015

6
A True Online Marketplace
Matching Consumers with Lenders and Other Service Providers
Access to Multiple Offers
Cost-Efficient Customer
Acquisition
Retail Banks
SpecialtyFinance & P2P
Mortgage Cos.
Other
Free Credit Scores
Tools & Resources
Ratings & Reviews
Performance Marketing Machine
Exchanges Matching Platform
Real-Time Reporting & Analytics
Auto Dealers/ Lenders

7
Where Consumers Shop for Money
Analogous to other marketplaces for Travel, Retail, etc.THE Online Marketplace for Consumer Loan Shopping
8
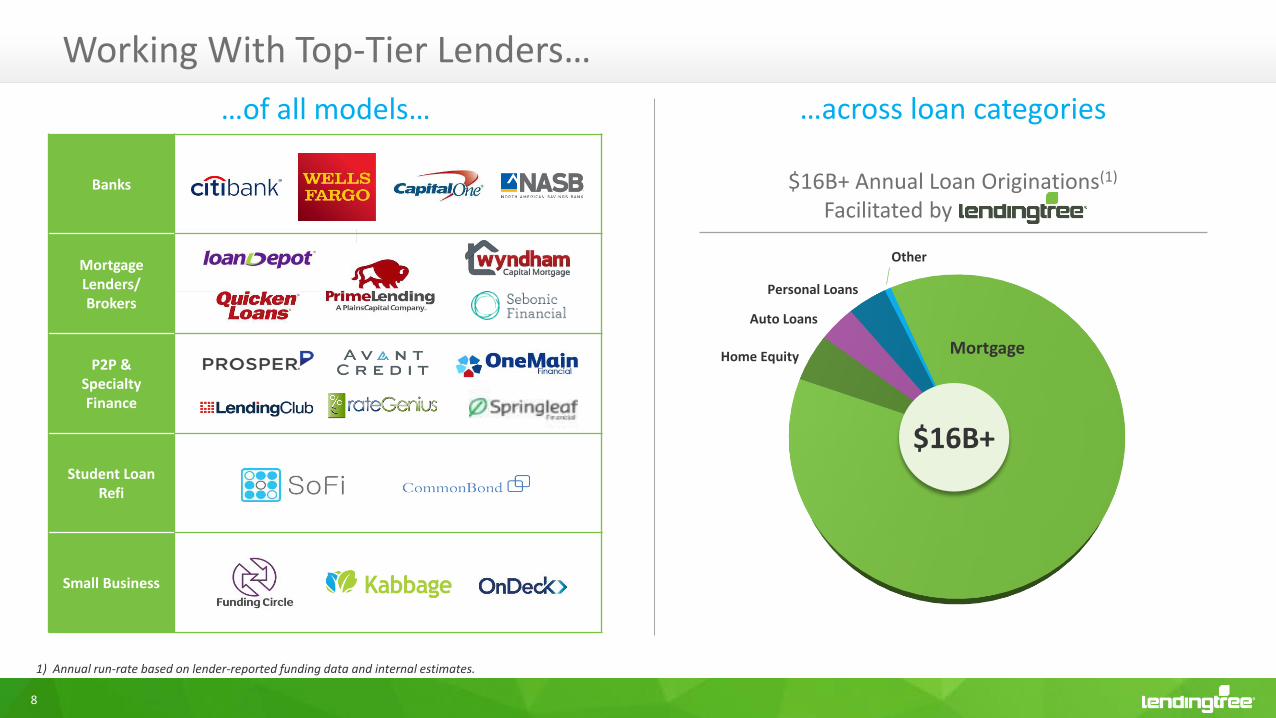
$16B+ Annual Loan Originations(1)
Facilitated by LendingTree
Working With Top-Tier Lenders…
…across loan categories…of all models…
1) Annual run-rate based on lender-reported funding data and internal estimates.
MortgageHome Equity
Auto Loans
Personal Loans
Other
$16B+
Banks
Mortgage Lenders/ Brokers
P2P & Specialty Finance
Student Loan Refi
Small Business
9
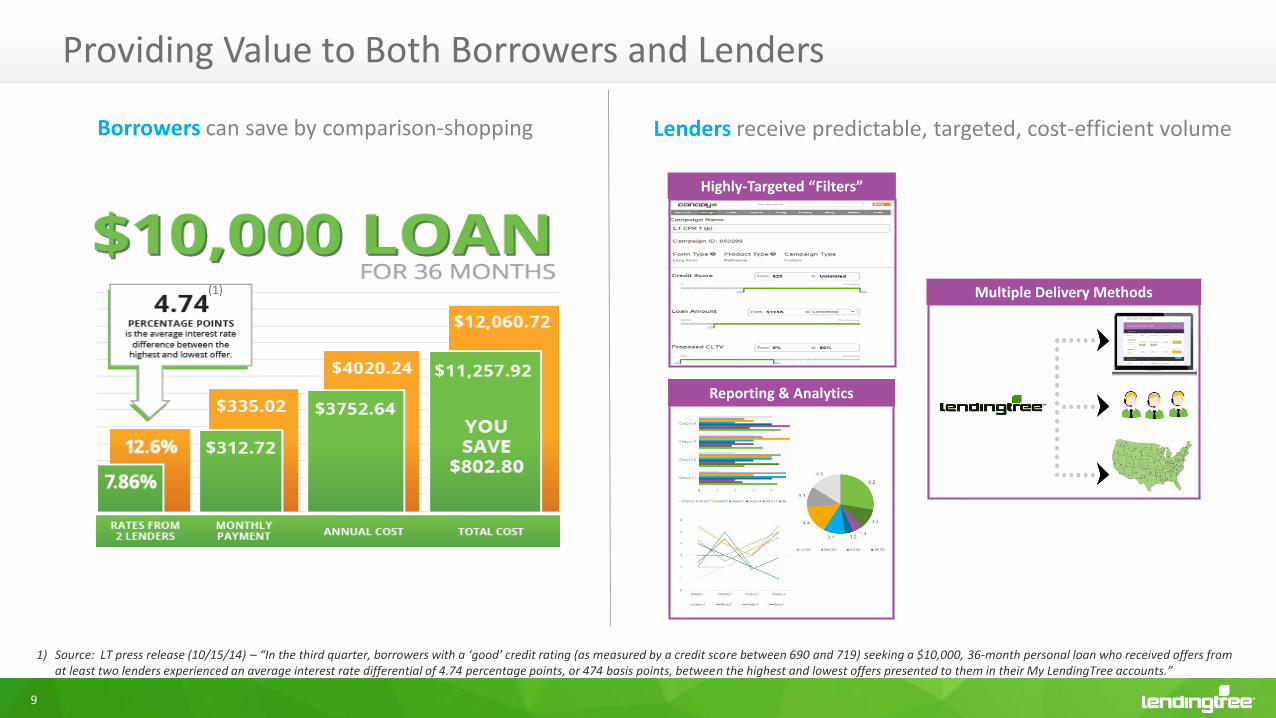
Providing Value to Both Borrowers and Lenders
Lenders receive predictable, targeted, cost-efficient volumeBorrowers can save by comparison-shopping
1) Source: LT press release (10/15/14) – “In the third quarter, borrowers with a ‘good’ credit rating (as measured by a credit score between 690 and 719) seeking a $10,000, 36-month personal loan who received offers from at least two lenders experienced an average interest rate differential of 4.74 percentage points, or 474 basis points, between the highest and lowest offers presented to them in their My LendingTree accounts.”
Multiple Delivery Methods
Highly-Targeted “Filters”
Reporting & Analytics
(1)

10
Mortgage$8.1
Home Equity$0.5
Auto Loans$0.9
Credit Card$0.7
Other$0.3
Student Loans$1.1
Small Biz$0.3
US Debt OutstandingConsumer(2) & Small Business(3)
Consumer Finance: $12 Trillion Debt/Credit Outstanding
Consumer finance: the opportunity is massive
$12 Trillion in US Consumer Debt outstanding
Early stages of fundamental shift from offline to online
Today, our share of the overall market is small
• LendingTree facilitating ~1.2% of all mortgage originations(1)
• In other categories, we facilitate < 1%
1) Estimated share of mortgage originations facilitated by LendingTree based on lender-reported funding data, internal estimates and market data from Mortgage Banker’s Association.2) FRB of NY – Quarterly Report on Household Debt & Credit, November 2014.3) FDIC Statistics on Depository Institutions Report (C&I loans of $1.0M or less to U.S. addressees) as of 9/30/14.
: ~1.2%(1)

11
US Debt OutstandingConsumer(1) & Small Business(2)
$8.1
$0.5
$1.1$0.9
$0.7$0.3 $0.3
$0
$1
$2
$3
$4
$5
$6
$7
$8
$9
$10
Mortgage HE Student Auto CC Other(incl.
PersonalLoans)
Small Biz
+7x#2 Category
Consumer Finance: Mortgage Leadership & New Category Growth
1) FRB of NY – Quarterly Report on Household Debt & Credit, November 2014.2) FDIC Statistics on Depository Institutions Report (C&I loans of $1.0M or less to U.S. addressees) as of 9/30/14.
($ T
rilli
on
s)
Lenders tell us:
Borrower acquisition is their key constraint to growth
Unique in driving customer acquisition across full spectrum of loan categories
Mortgage: +7x the #2 loan category
Alternative lending platforms driving growth/ innovation in previously underserved markets
• Personal Loans
• Small Business Loans
• Student Loan Refinancing
Well-positioned to grow share across all lending categories
12
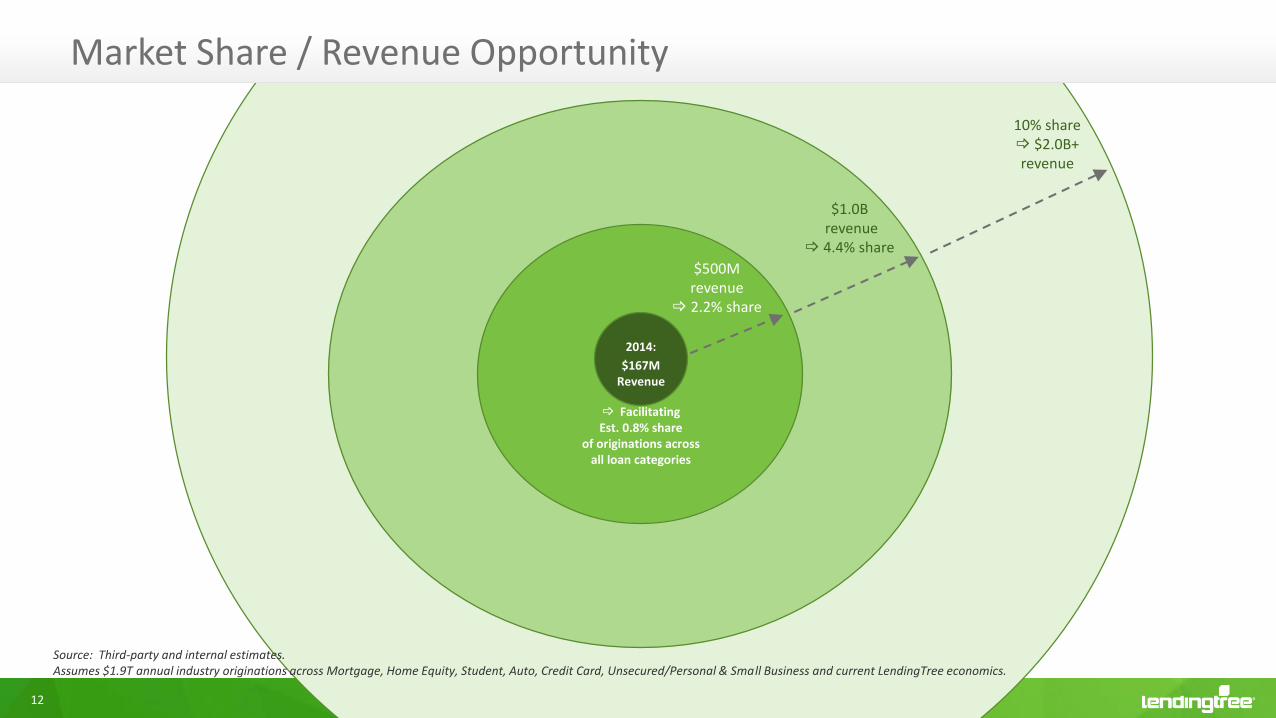
2014:
$167MRevenue
Facilitating Est. 0.8% share
of originations acrossall loan categories
$500M revenue
2.2% share
$1.0Brevenue
4.4% share
10% share $2.0B+revenue
Market Share / Revenue Opportunity
Source: Third-party and internal estimates.Assumes $1.9T annual industry originations across Mortgage, Home Equity, Student, Auto, Credit Card, Unsecured/Personal & Small Business and current LendingTree economics.

Business Overviews
Gabe Dalporto – CMO, President–Mortgage
14
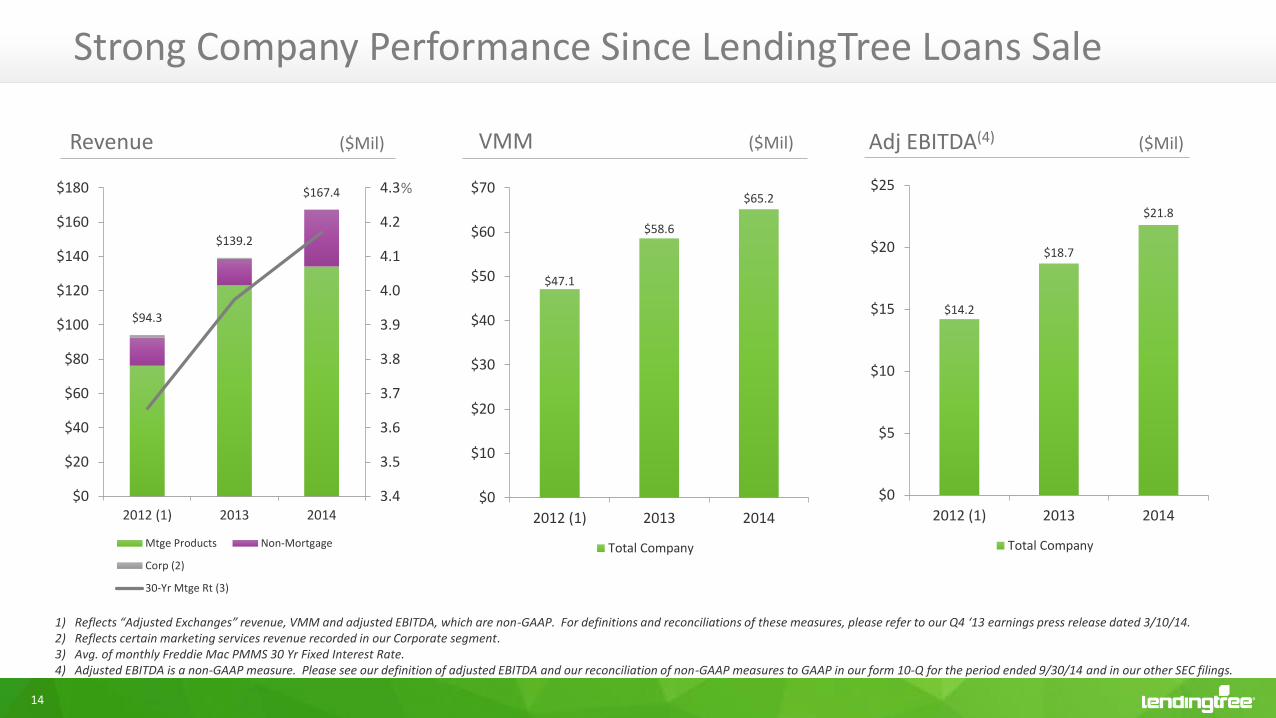
Strong Company Performance Since LendingTree Loans Sale
$94.3
$139.2
$167.4
3.4
3.5
3.6
3.7
3.8
3.9
4.0
4.1
4.2
4.3
$0
$20
$40
$60
$80
$100
$120
$140
$160
$180
2012 (1) 2013 2014
Mtge Products Non-Mortgage
Corp (2)
30-Yr Mtge Rt (3)
Revenue ($Mil)
$47.1
$58.6
$65.2
$0
$10
$20
$30
$40
$50
$60
$70
2012 (1) 2013 2014
Total Company
$14.2
$18.7
$21.8
$0
$5
$10
$15
$20
$25
2012 (1) 2013 2014
Total Company
1) Reflects “Adjusted Exchanges” revenue, VMM and adjusted EBITDA, which are non-GAAP. For definitions and reconciliations of these measures, please refer to our Q4 ‘13 earnings press release dated 3/10/14.2) Reflects certain marketing services revenue recorded in our Corporate segment.3) Avg. of monthly Freddie Mac PMMS 30 Yr Fixed Interest Rate.4) Adjusted EBITDA is a non-GAAP measure. Please see our definition of adjusted EBITDA and our reconciliation of non-GAAP measures to GAAP in our form 10-Q for the period ended 9/30/14 and in our other SEC filings.
VMM ($Mil) Adj EBITDA(4) ($Mil)
%

15
Continued Diversification
61%
20%
4%
15%
Refinance Purchase
Other Lending (1) Other Non-Lending (2)
62%
26%
7%
5%
Refinance Purchase
Other Lending (1) Other Non-Lending (2)
51%
29%
17%
3%
Refinance Purchase
Other Lending (1) Other Non-Lending (2)
2012 – Revenue Mix 2013 – Revenue Mix 2014 – Revenue Mix
Note, the classifications depicted above are for presentation purposes and do not correspond to the classifications utilized in our SEC filings and earnings press releases.1) Includes the home equity, reverse mortgage, personal loan, auto loan, small business loan, student loan and credit card products. 2) Includes school (post-secondary) enrollment, home services, insurance and other personal credit products.

16
Be #1 or #2 in All Lending Comparison-Shopping Categories
(1) Among lead providers. Based on competitive intelligence and client feedback. (2) Direct auto finance.
Our Established Categories Our Emerging Categories
CategoryEst.
Market Share(1)
Refinance Mortgage #1
Purchase Mortgage #1
Personal Loans #1
Auto Loans #1(2)
Reverse Mortgage Top-5
CategoryCompetitive Advantage
Industry Stage
Opportunity
Business Loans Brand Ripe for disruption
Large
Credit Cards Brand Mature Large
Student Loans/ Refinance
Brand Immature Medium
LendingTree: Where Consumers Shop for Money

17
Mortgage Out-Performed Industry 9 Consecutive Quarters
Relative Market – Y/Y
1494
1123
495
613
755
676
$0
$500
$1,000
$1,500
$2,000
$2,500
2012 2013 2014
Refinance Purchase
2,107
1,879
1,171
LT Mtge Products Revenue ($Mil)
$76.2
$123.1
$134.1
$0
$20
$40
$60
$80
$100
$120
$140
$160
2012 (2) 2013 2014
Refinance Purchase Loan Explorer
Industry Originations(1) ($Mil)
1) Survey of estimates from MBA, Fannie Mae and Freddie Mac.2) Reflects “Adjusted Exchanges” revenue, VMM and adjusted EBITDA, which are non-GAAP. For definitions and reconciliations of these measures, please refer to our Q4 ‘13 earnings press release dated 3/10/14.3) LendingTree mortgage products revenue, as presented in our earnings press releases.4) Avg. of monthly Freddie Mac PMMS 30 Yr Fixed Interest Rate.
26%17% 16%
(20%)
(42%)(52%)
(45%)
(28%)(17%)
51%
30%
95%
75%
51%
35%
5%
(3%)
5%
3.0%
3.2%
3.4%
3.6%
3.8%
4.0%
4.2%
4.4%
4.6%
(60%)
(40%)
(20%)
0%
20%
40%
60%
80%
100%
120%
Q4'12
Q1'13
Q2'13
Q3'13
Q4'13
Q1'14
Q2'14
Q3'14
Q4'14
Mtge Industry Originations (1)
TREE Mtge Prods. Revenue (3)
30-Yr Mtge Rt (4)

18
How We’re Doing It
Consumer

19
Mortgage – Key 2015 Initiatives
Customized Lender
solutions for Purchase
Brand dominance
Transform consumer experience
Banks andretail branch
networks
Expandproduct offerings
MyLendingTree

20
Q12013
Q22013
Q32013
Q42013
Q12014
Q22014
Q32014
Q42014
LT Personal Loans Revenue
Personal Loans – #1 Provider of Customer Acquisition(1)
Re-launched Q3 ‘13
Added Lenders,Tested Marketing
$-
$500
$1,000
$1,500
$2,000
$2,500
Q12013
Q22013
Q32013
Q42013
Q12014
Q22014
Q32014
Q42014
LendingClub (2) Prosper (2)
1) Source: Client feedback.2) Source: Company disclosures/filings.
Selected Lending Platforms – Originations Growth

21
Personal Loans – Borrower Uses of Funds
Debt consolidation + Card refinance ~50%
Source: internal data.
39%
11%

22
Personal Loans – Key 2015 Initiatives
Connect consumers with lenders however they want to be served• Form leads
• Call transfers
• Click marketplace (rate table)
Direct mail
Deeper coverage in 580-640 FICO
Improved lender conversions

23
$0
$100
$200
$300
$400
$500
$600
2012 2013 2014
Industry Auto Loan Originations(1)
Autos – Continued Growth in 2014
2012 2013 2014
LendingTree Autos Revenue
+ 78%
+ 84%
+ 10%
+ 15%
1) Q4 2014 Experian-Oliver Wyman Market Intelligence Report.
Industry Auto Loan Originations(1)
24
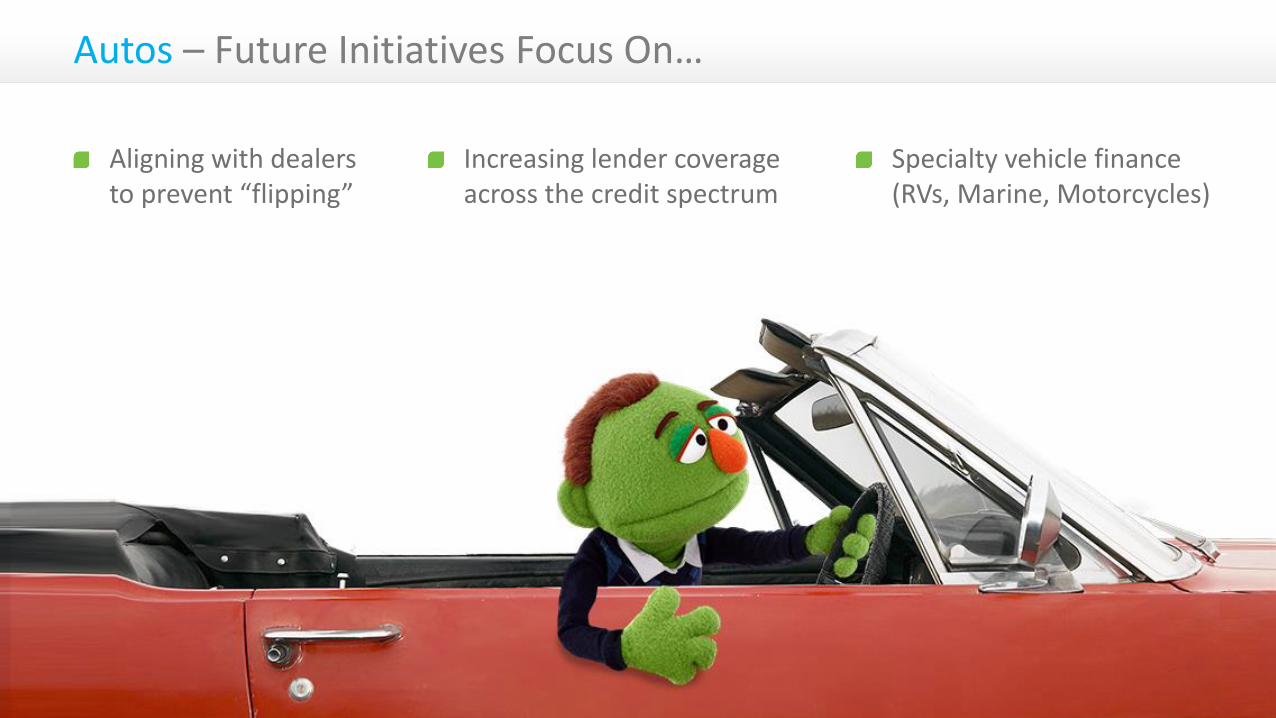
Autos – Future Initiatives Focus On…
Aligning with dealers to prevent “flipping”
Increasing lender coverage across the credit spectrum
Specialty vehicle finance (RVs, Marine, Motorcycles)

25
Why it’s attractive:
• Fragmented, opaque market
• New disruptive players
• No large scale, origination-agnostic comparison-shopping platform
Small Business Loans
Market size:
• ~$300B(1), 28M small businesses
Our competitive advantage:
• Brand
LendingTree stage:
• Product: Launched Nov. 2014
• Lender coverage: Good and expanding
• Marketing: Initial tests
1) FDIC Statistics on Depository Institutions Report (C&I loans of $1.0M or less to U.S. addressees) as of 9/30/14.
26
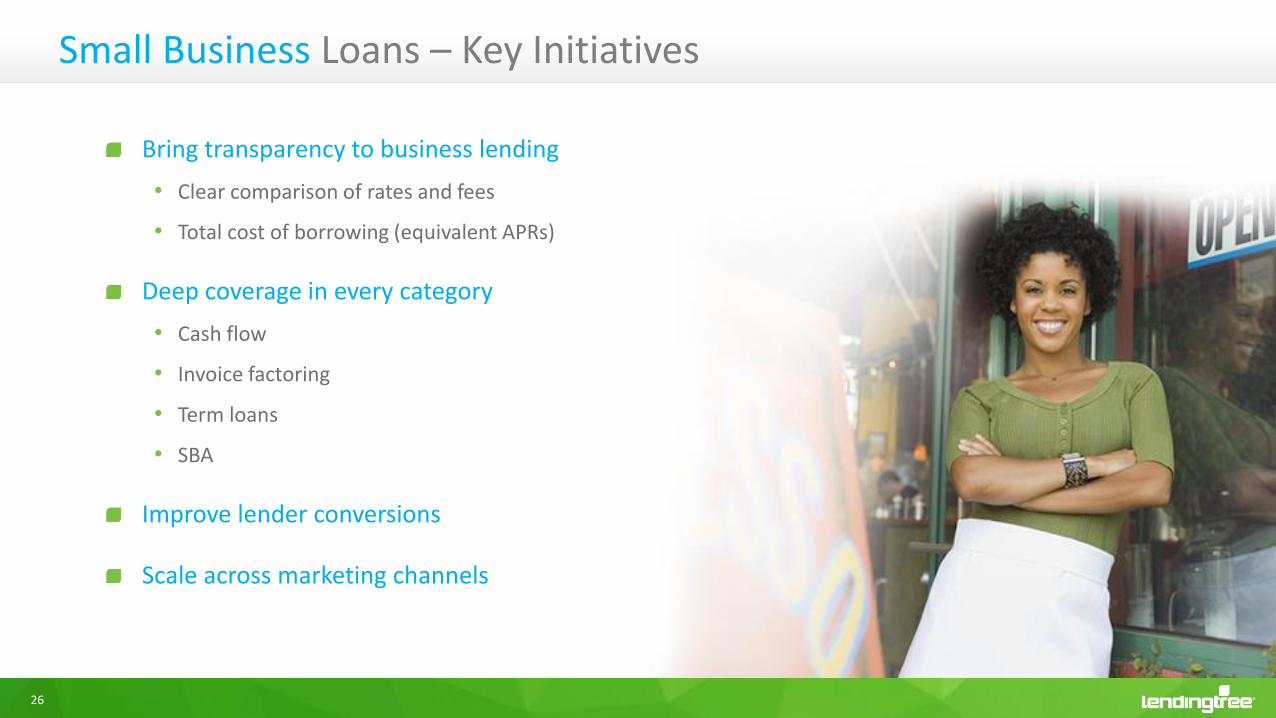
Small Business Loans – Key Initiatives
Bring transparency to business lending
• Clear comparison of rates and fees
• Total cost of borrowing (equivalent APRs)
Deep coverage in every category
• Cash flow
• Invoice factoring
• Term loans
• SBA
Improve lender conversions
Scale across marketing channels

27
Credit Cards
Why it’s attractive:
• No “branded” aggregator in the space
LendingTree stage:
• Product: “direct” relationships with issuers (March ‘15)
• Sales: all major issuers on our platform or contracted
• Marketing: initial testing
Market size: $680B(1) Our competitive advantage:
• Brand
1) FRB of NY – Quarterly Report on Household Debt & Credit, November 2014.

28
Credit Cards – Key Initiatives
#1 Goal: top-tier payouts based on volume and quality
Rich, unbiased content and reviews
Card sort algorithm for revenue optimization
Rapid expansion of marketing channels

29
Student Loans
Why it’s attractive:
• No “branded” aggregator in the space
LendingTree stage:
• Product: direct to lenders for Refinance (Feb ‘15), New loans via biz dev (direct pending)
• Sales: initial coverage in high FICO; expanding into lower tiers
• Marketing: initial testing
Market size: $1.1T(1) Our competitive advantage:
• Brand
1) FRB of NY – Quarterly Report on Household Debt & Credit, November 2014.

30
Student Loans – Key Initiatives
Expand lender coverage across credit spectrum
Test and scale marketing
Launch direct platform for “in school” loans
Automated My LendingTree savings alerts

Product & Technology
Nikul Patel – Chief Product & Technology Officer

32
If money is a commodity, why is shopping for it so hard?
33
Getting a mortgage has been compared to getting audited by the IRS
34
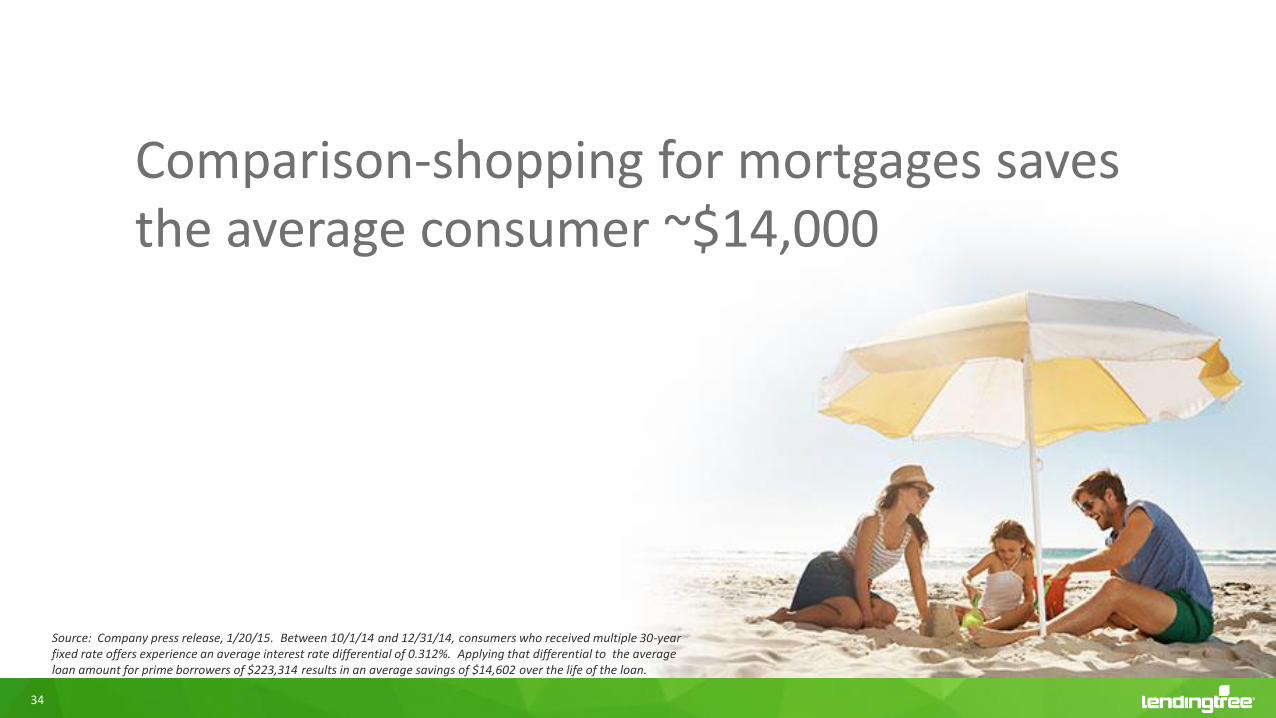
Comparison-shopping for mortgages saves the average consumer ~$14,000
Source: Company press release, 1/20/15. Between 10/1/14 and 12/31/14, consumers who received multiple 30-year fixed rate offers experience an average interest rate differential of 0.312%. Applying that differential to the average loan amount for prime borrowers of $223,314 results in an average savings of $14,602 over the life of the loan.

35
These problems span all “money” categories
Mortgage Personal Loans Student Loans Credit CardsAuto Loans Business Loans

36
The LendingTree Solution
Comparison-shopping

37
The LendingTree Solution
Comparison shopping
Trust and transparency

38
The LendingTree Solution
Comparison shopping
Trust and transparency
Ease of transaction

39
Trends & Transformations

40
Innovations in Mortgage
Trends & Transformations Are Driving Our Product Vision

41
Adding a local lender choiceexpands our market and
increases the conversion rate for our network
42
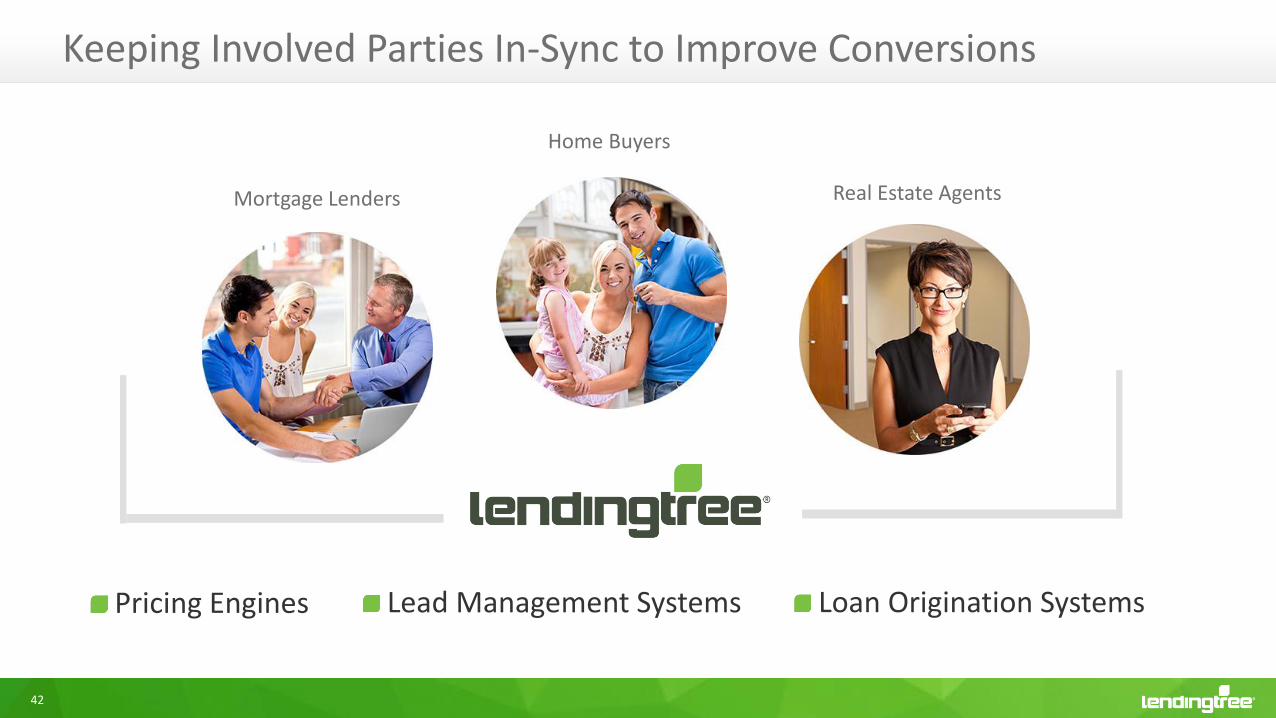
Keeping Involved Parties In-Sync to Improve Conversions
Home Buyers
Real Estate AgentsMortgage Lenders
Lead Management Systems Loan Origination SystemsPricing Engines
43
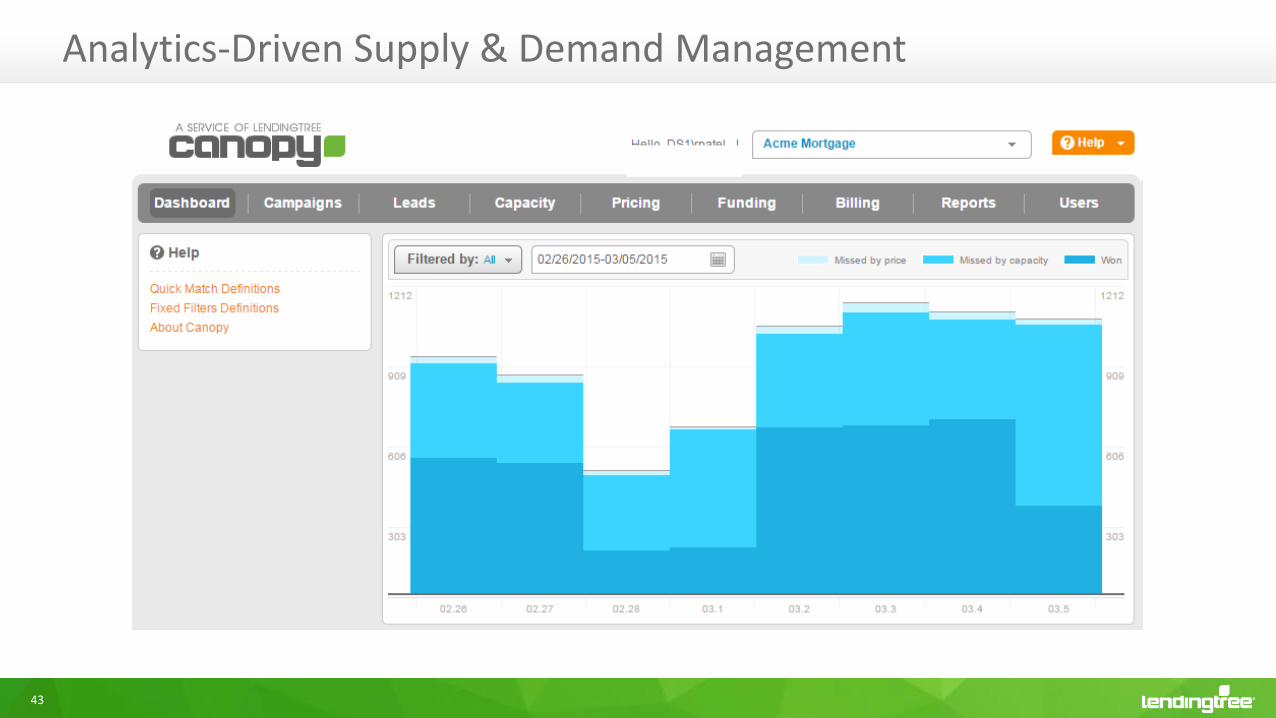
Analytics-Driven Supply & Demand Management
44
Innovations in Mortgage
Shift to mobile
Trends & Transformations Are Driving Our Product Vision

45
More than 50% of our traffic is mobile(as of April 2014)
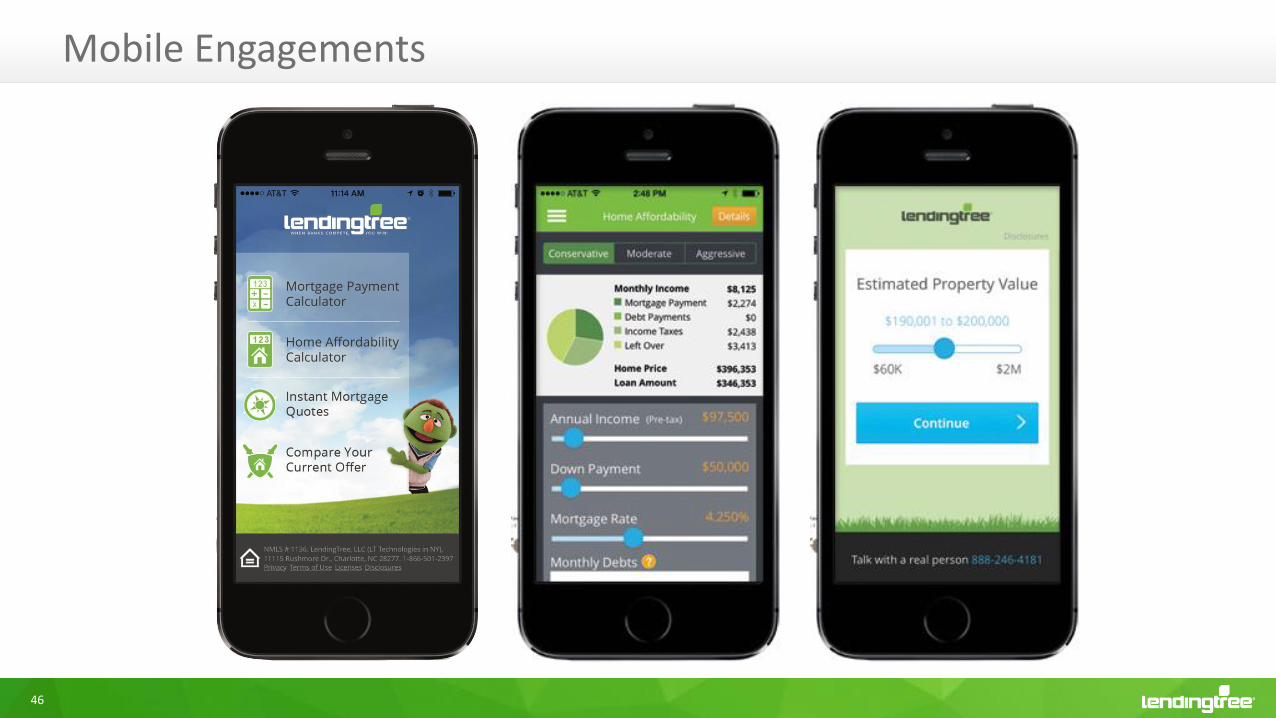
46
Mobile Engagements
47
Innovations in Mortgage
Shift to mobile
Growth in non-Mortgage loan/credit categories
Trends & Transformations Are Driving Our Product Vision
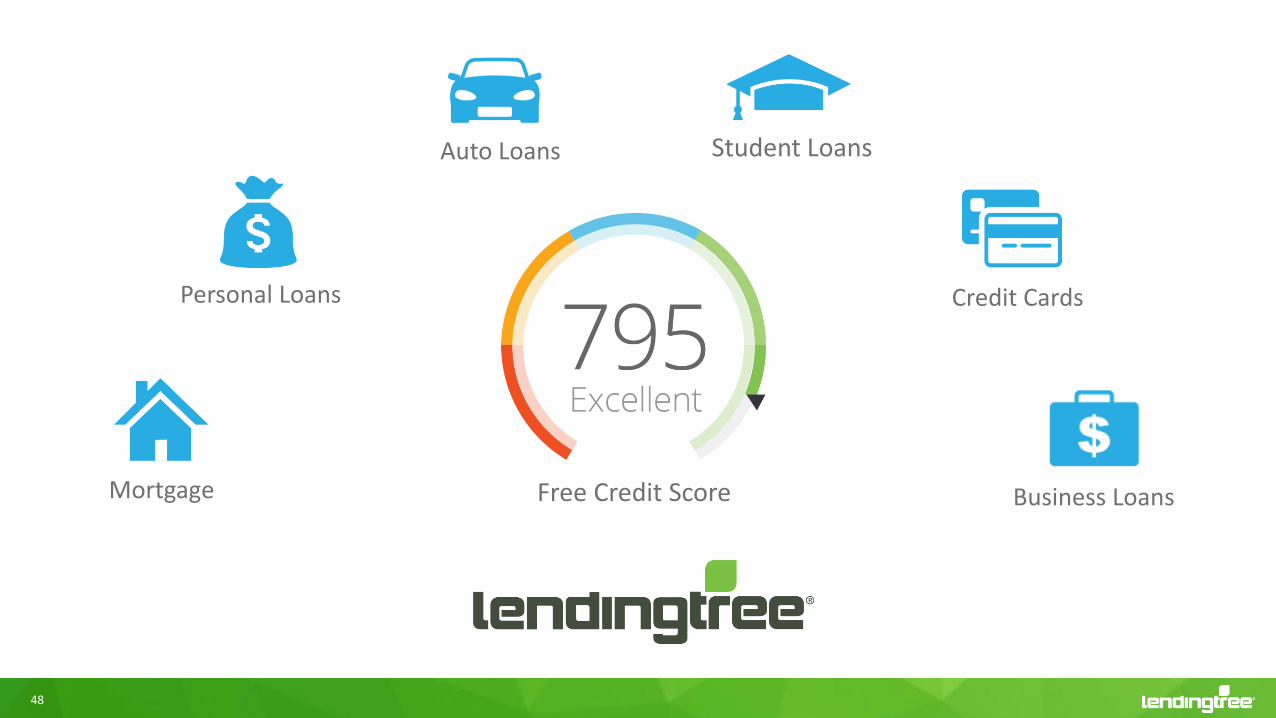
48
Mortgage
Personal Loans
Student Loans
Credit Cards
Auto Loans
Business LoansFree Credit Score

49
Innovations in Mortgage
Shift to mobile
Growth in non-Mortgage loan/credit categories
Moving from transaction to relationship
Trends & Transformations Are Driving Our Product Vision

50
Our Killer App: Free Credit Score With a “Brain”
Rich Data Analysis

51
Access to Rich Credit Data Allows Us to Calculate Savings by Product
Auto Loans Personal LoansCredit CardsMortgage Student Loans
App Push Notifications
Text

52
0
1,000
2,000
3,000
4,000
5,000
6,000
Jun-14 Jul-14 Aug-14 Sep-14 Oct-14 Nov-14 Dec-14 Jan-15 Feb-15
Daily New Users
My LendingTree User Growth
Jun-14 Jul-14 Aug-14 Sep-14 Oct-14 Nov-14 Dec-14 Jan-15 Feb-15
Cumulative New Users
1st 200k in 119 days
3rd 200k in 44 days
2nd 200kin 72 days
Mobile enabled
Scaling paid marketing

53
Let’s take a walkin the shoes ofa consumer…

54
Jane is a 30-year-old nurse with a
house and 2 kids
She has $15,000 in credit card debt
Jane Smith

55
Jane Smith
Jane shops for a personal loan
at LendingTree.com and
receives attractive offers from
4 different lenders

56
Jane Smith
Jane selects a lender and
completes the transaction
The $15,000 loan is in her
account within 24 hours and
now she saves $85/month in
payments

57
Jane Smith
She also gets her credit score
100% free – every month

58
Jane Smith
Jane gets an alert that her mortgage
from 2009, at a 5.75% rate, can now
be beat by one of the lenders on the
LendingTree network
Refinancing will save her $90/month

59
Jane Smith
Jane compares her loan options and
researches lenders using LendingTree
She connects with a loan officer directly to
work with her on a loan

60
New My LendingTree
Building on Data & Analytics
Delivering Engaging Customer Experiences
Driving Repeat Visitors
Providing Leverage to Paid Marketing

Lunch Break

Client Panel
Moderated by:
Sam Mischner – SVP, Sales & Client Management

63
Client Panel
Ron Suber, President
Chris Brown, President & CEOJessica Rowe, VP - eCommerceBrad Heritage, Director – Business Development
Gene Lugat, EVP – MortgageAdam Hughes, COO
Jeff Douglas, CEOJohn Lee, EVP-Chief Analytics Officer

Consumer Marketing & Advertising
Fred Saunders – SVP, Marketing/Brand Management

65
Our Brand is a True Marketing Advantage

66
Our Strategy is to Cast a Wide Net Across Channels
Messaging on the Home Page
My LendingTreeSearch
Marketing Search Engine Optimization
Social Media Marketing
Display CRM/ Email Marketing
Direct MailCall Center Marketing
Television Advertising

67
Two Elements of Successful Marketing
ART + SCIENCE

68
The Art

69
Understanding How Consumers Really Feel
Skeptical about banks, lender motivations and incentives
Don’t know or understand the ‘how’ and ‘why’ of getting a loan
Overwhelmed by the whole process

70
Identifying How LendingTree Is Uniquely Positioned to Help
Credit
• Safeguard consumers’ personal information
• Soft credit pull does NOT impact your credit score
Money
• Side-by-side comparison of rates, fees across multiple lenders
• Proactive savings alerts to help consumers “find” money
Time
• Shop multiple lenders all at the same time, online
• Fill out one form, one time; not multiple applications
LendingTree Can Save Consumers…
71
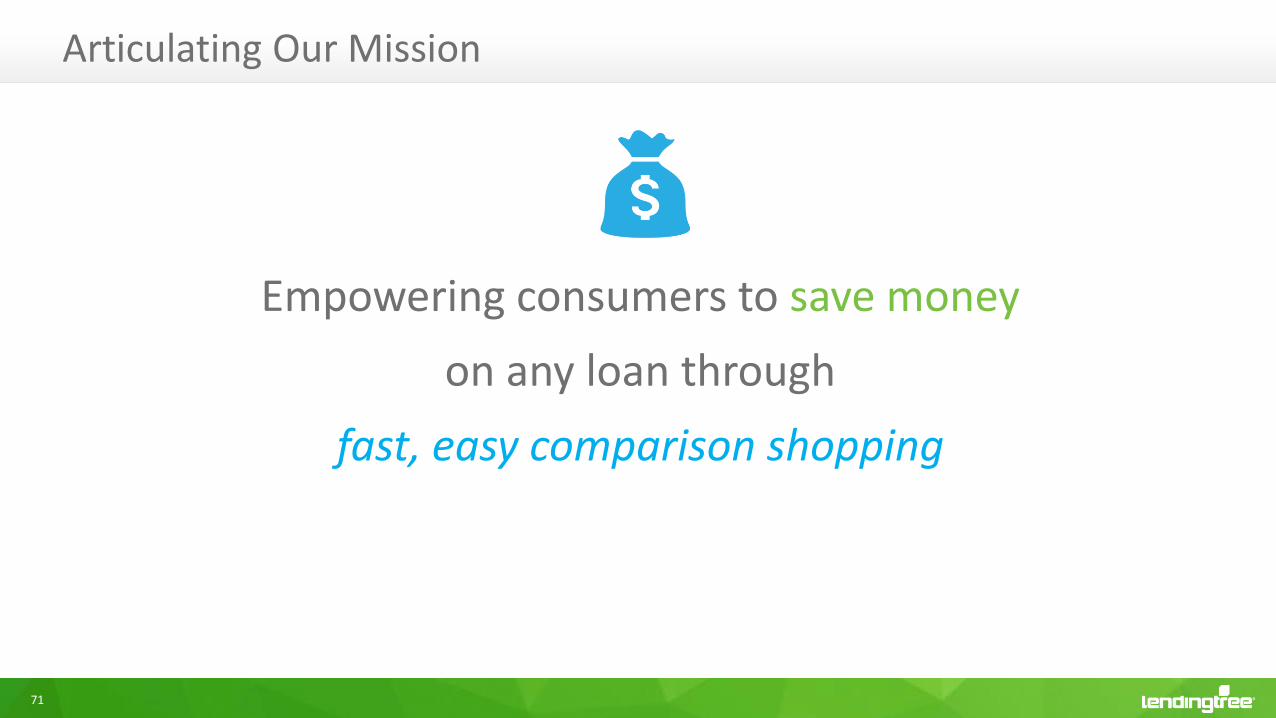
Articulating Our Mission
Empowering consumers to save money
on any loan through
fast, easy comparison shopping

72
Leveraging an Iconic, Consistent Platform

73
Our Latest Commercials
Our Latest Commercials…
74
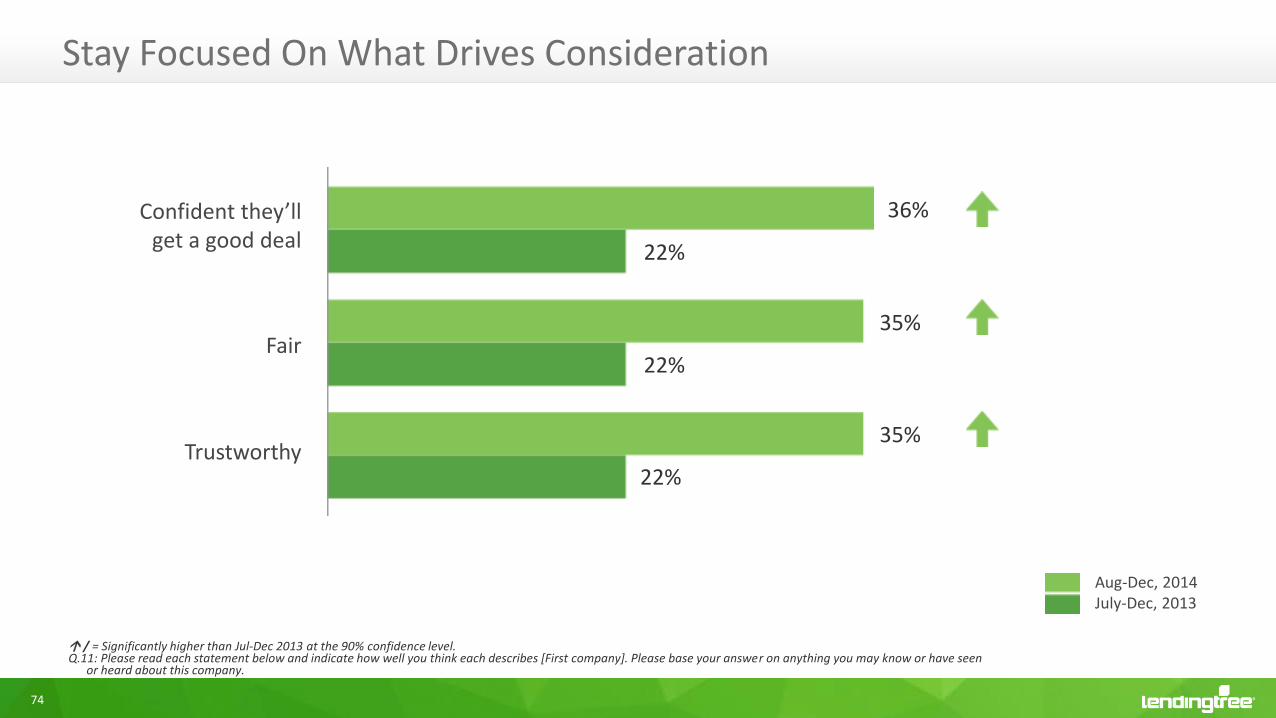
Stay Focused On What Drives Consideration
/ = Significantly higher than Jul-Dec 2013 at the 90% confidence level.Q.11: Please read each statement below and indicate how well you think each describes [First company]. Please base your answer on anything you may know or have seen
or heard about this company.
Confident they’ll get a good deal
Fair
Trustworthy
36%
22%
35%
22%
35%
22%
Aug-Dec, 2014July-Dec, 2013

75
The Iconic Brand
68% brand awareness $1+ billion lifetime investment
79%
68%64%
22%
13%8%
2%
0%
20%
40%
60%
80%
100%
Wells Fargo Quicken Loans Zillow Bankrate Lower-My-Bills Google Advisors
Aided Brand Awareness(1)
Source: LendingTree Consumer Research Study conducted by S. Radoff Associates, LLC, February 2015. 1,722 online surveys. Prospects defined as creditworthy current or prospective homeowners who are in the market for either a primary mortgage or refinancing.1) Awareness and familiarity of selected companies within category defined by companies that offer mortgages online.

76
The Iconic Brand
68% brand awareness $1+ billion lifetime investment
79%
68%64%
22%
13%8%
2%
0%
20%
40%
60%
80%
100%
Wells Fargo Quicken Loans Zillow Bankrate Lower-My-Bills Google Advisors
Aided Brand Awareness(1)
Source: LendingTree Consumer Research Study conducted by S. Radoff Associates, LLC, February 2015. 1,722 online surveys. Prospects defined as creditworthy current or prospective homeowners who are in the market for either a primary mortgage or refinancing.1) Awareness and familiarity of selected companies within category defined by companies that offer mortgages online.
Brand Strength allows digital marketing to perform significantly better in CTR, Conversion and
Revenue/Lead

77
The Science
78
Purpose-Built Marketing Team
Over the last 3 years, we have completely revamped marketing at LendingTree
Applied best-in-class practices and personnel to every marketing channel
Test, learn, scale, optimize…test again

79
Wide-scale testing
Reinforcing visual brand
Massive iteration and implementation of control creative
Take winner and optimize
Display: Test, Learn, Scale, Optimize

80
Achieve dominant position in our categories
Be ahead of platform changes (ad extensions, reviews, ratings, etc) – boost ad real estate
Partnership with Google to test new qualifiers, improve quality scores, new trends (shift to mobile)
Testing real-time bidding solutions to execute multiple bid changes per day
Custom implementation of bidding algorithms to maximize profit for all products and keywords
SEM: Dominate Keywords, Grow Impression Share, Positioning

81
Extensive targeting and testing:
• Lookalike modeling, oCPM (Facebook), retargeting, interest targeting, platform targeting
Paid Social Media Marketing

82
Partnerships
• Yahoo! Homes
• CNN
• AOL
• 15+ others
Business Development: Powering Third-Party Websites
Powered by:LendingTree

83
CRM: The Right Experience at the Right Touch Point
Call Center
Direct Mail
App PushNotifications
Text
Lead cultivation/nurturing
Cross-sell/up-sell
Incorporating new products
Expanding CRM beyond email

84
28 3040 42 45 47
75 77 79 79104
126 128 130149
166189
262
CPV IndexCost Per Visit
Television: Wide Testing, Weekly Optimizations

85
The Industry’s Best Marketing Machine
Industry-leading brand awareness
Best-in-class talent in across marketing channels
Leading-edge technology and marketing campaign optimization
Data-driven results, web analytics, form optimization, marketing channel performance

Financial Profile
Alex Mandel - CFO

87
How We Make MoneyLender Economics of Customer Acquisition
Price per Lead X
# of LeadsPurchased =
Total Lender Spend ÷
Funded LoanVolume =
Cost per Funded Loan
• $1 - $100+ (Lender Conversion) • 50 – 150 bps
Example: Mortgage
Other loan categories follow similar paradigms
• CPFL ranges vary across loan categories and lender operating models
88
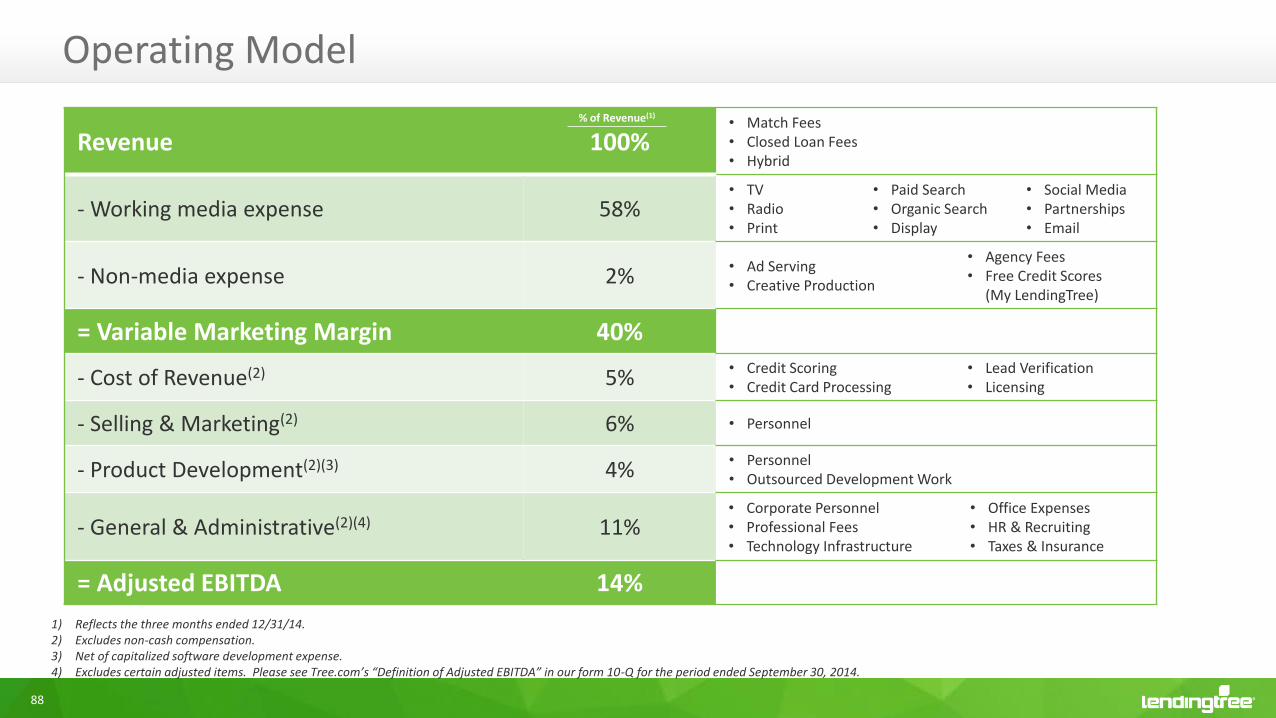
Operating Model
, ~1.2% (3)
Revenue 100%• Match Fees• Closed Loan Fees• Hybrid
- Working media expense 58%• TV• Radio• Print
• Paid Search• Organic Search• Display
• Social Media• Partnerships• Email
- Non-media expense 2%• Ad Serving• Creative Production
• Agency Fees• Free Credit Scores
(My LendingTree)
= Variable Marketing Margin 40%
- Cost of Revenue(2) 5%• Credit Scoring• Credit Card Processing
• Lead Verification• Licensing
- Selling & Marketing(2) 6% • Personnel
- Product Development(2)(3) 4%• Personnel• Outsourced Development Work
- General & Administrative(2)(4) 11%• Corporate Personnel• Professional Fees• Technology Infrastructure
• Office Expenses• HR & Recruiting• Taxes & Insurance
= Adjusted EBITDA 14%
1) Reflects the three months ended 12/31/14.2) Excludes non-cash compensation.3) Net of capitalized software development expense.4) Excludes certain adjusted items. Please see Tree.com’s “Definition of Adjusted EBITDA” in our form 10-Q for the period ended September 30, 2014.
% of Revenue(1)

89
Quarterly Financial Performance
, ~1.2% (3)
Adjusted EBITDA(1) ($ Mil)Revenue & VMM ($ Mil)
$11.7 $12.4$13.5 $13.7
$15.1$16.3
$15.2 $15.8$16.7
$17.5
$23.3 $23.9
$28.1
$37.4 $37.3$36.4
$40.0
$42.1$41.3
$43.9
50%52%
48%
37%40%
45%
38% 37%40% 40%
0%
20%
40%
60%
80%
100%
120%
$0
$5
$10
$15
$20
$25
$30
$35
$40
$45
$50
Q3'12 Q4'12 Q1'13 Q2'13 Q3'13 Q4'13 Q1'14 Q2'14 Q3'14 Q4'14 Q1'15
VMD Revenue VMM%
$46-$48
$3.9
$2.7
$4.1
$3.4
$5.4
$5.9
$4.5
$5.5$5.8
$6.0
17%
11%
15%
9%
14%
16%
11%
13%14% 14%
0%
5%
10%
15%
20%
25%
30%
35%
40%
$0
$1
$2
$3
$4
$5
$6
$7
Q3'12 Q4'12 Q1'13 Q2'13 Q3'13 Q4'13 Q1'14 Q2'14 Q3'14 Q4'14 Q1'15
AEBITDA AEBITDA%
$6 - $7
$19-$20
Launched National
Brand Campaign
1) Adjusted EBITDA is a non-GAAP measure. Please see our definition of adjusted EBITDA and our reconciliation of non-GAAP measures to GAAP in our form 10-Q for the period ended 9/30/14 and in our other SEC filings.

90
, ~1.2% (3)
$25.3
$33.1 $33.0
$31.7
$34.2 $34.7
$32.0$33.2
$2.8
$3.7$4.4
$4.7
$5.8
$7.5$9.3
$10.7
$28.1
$37.4 $37.3$36.4
$40.0
$42.1$41.3
$43.9
$15
$20
$25
$30
$35
$40
$45
$50
Q1'13 Q2'13 Q3'13 Q4'13 Q1'14 Q2'14 Q3'14 Q4'14Mortgage Non-Mortgage Corp/Other (1)
Revenue ($ Mil)
1) Reflects certain marketing services revenue recorded in our Corporate segment.
Unpacking Growth: Mortgage vs. Non-Mortgage
Total revenue +20% in 2014 vs 2013
• Mortgage Products +9%
• Non-Mortgage Products +114%
Product innovation and diversification
• New and re-launched loan & credit categories
• Product enhancements for consumers and lenders
Strategic brand investment to maximize lifetime value
Marketing machine + analytics optimization
2013 = $139.2M 2014 = $167.4M
91
, ~1.2% (3)
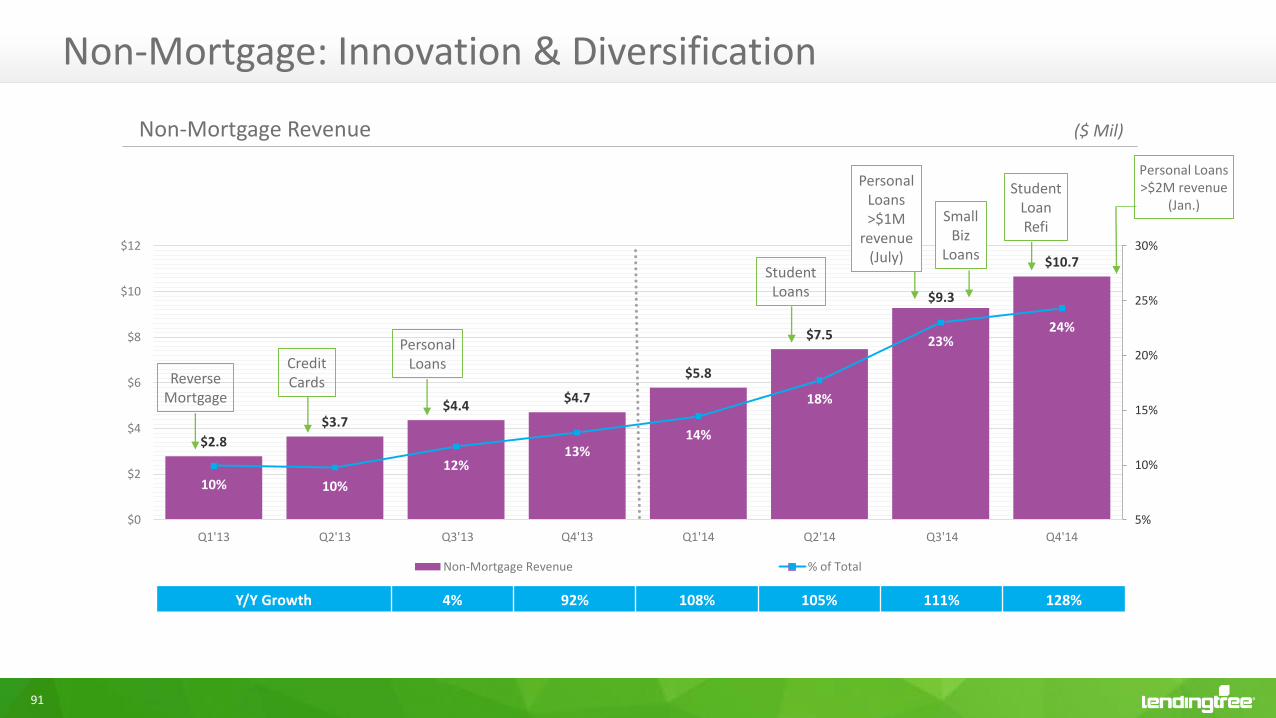
$2.8
$3.7$4.4
$4.7
$5.8
$7.5
$9.3
$10.7
10% 10%
12%13%
14%
18%
23%24%
5%
10%
15%
20%
25%
30%
$0
$2
$4
$6
$8
$10
$12
Q1'13 Q2'13 Q3'13 Q4'13 Q1'14 Q2'14 Q3'14 Q4'14
Non-Mortgage Revenue % of Total
Non-Mortgage Revenue ($ Mil)
Non-Mortgage: Innovation & Diversification
Y/Y Growth 4% 92% 108% 105% 111% 128%
Reverse Mortgage
CreditCards
PersonalLoans
StudentLoans
Personal Loans >$1M
revenue (July)
Small Biz
Loans
StudentLoan Refi
Personal Loans >$2M revenue
(Jan.)
92
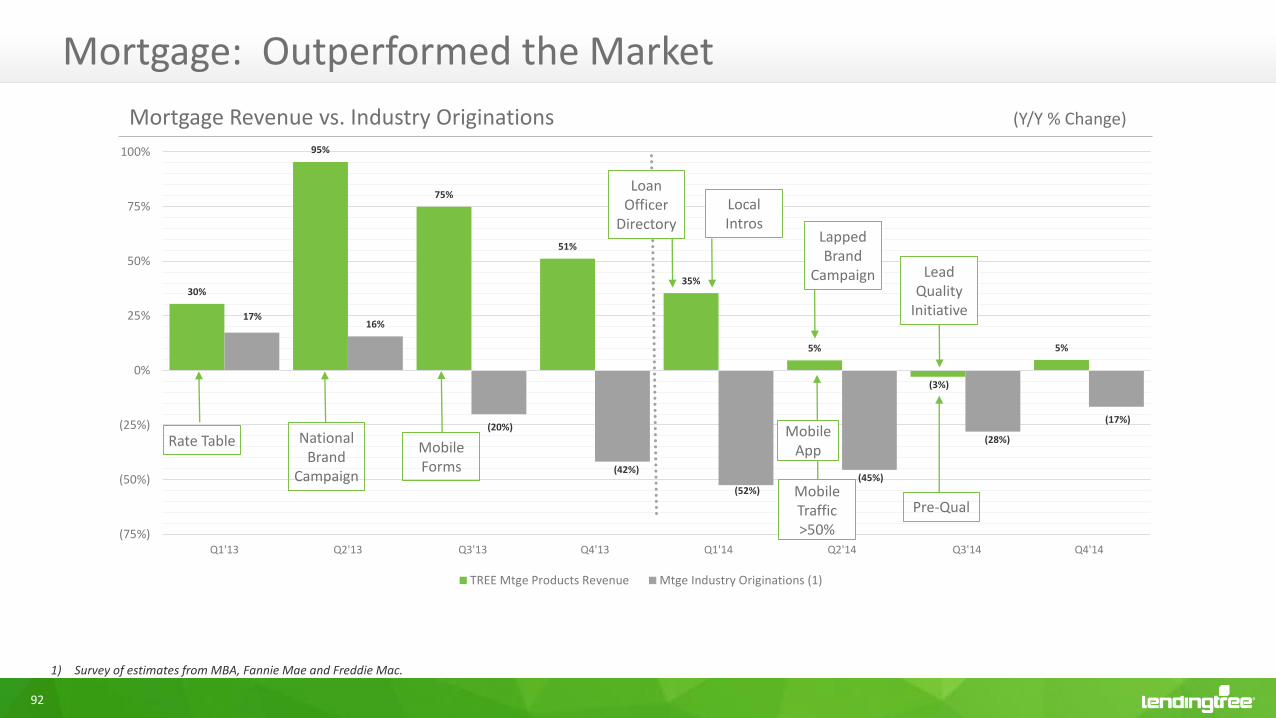
, ~1.2% (3)
30%
95%
75%
51%
35%
5%
(3%)
5%
17%16%
(20%)
(42%)
(52%)(45%)
(28%)
(17%)
(75%)
(50%)
(25%)
0%
25%
50%
75%
100%
Q1'13 Q2'13 Q3'13 Q4'13 Q1'14 Q2'14 Q3'14 Q4'14
TREE Mtge Products Revenue Mtge Industry Originations (1)
Mortgage Revenue vs. Industry Originations (Y/Y % Change)
1) Survey of estimates from MBA, Fannie Mae and Freddie Mac.
Mortgage: Outperformed the Market
Rate Table National Brand
Campaign
Loan Officer
DirectoryLocal Intros
Lapped Brand
Campaign LeadQuality
Initiative
Mobile App
Pre-Qual
Mobile Forms
Mobile Traffic >50%
93
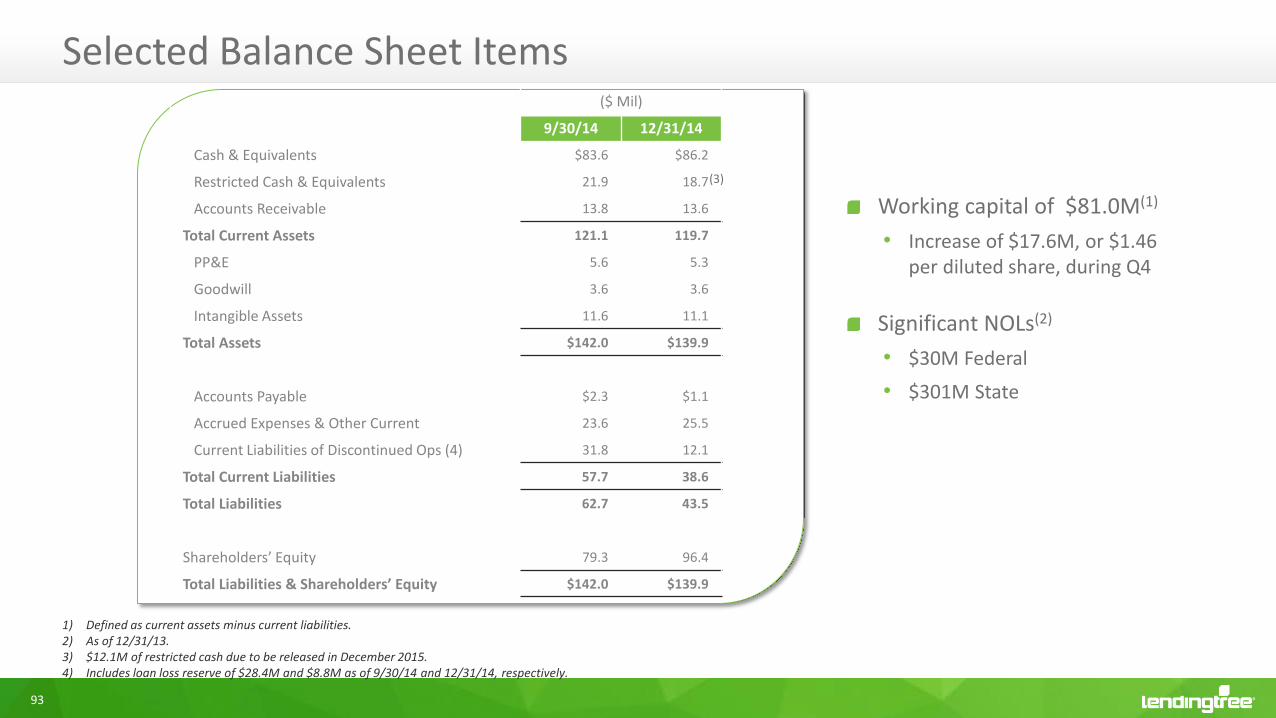
Selected Balance Sheet Items
Working capital of $81.0M(1)
• Increase of $17.6M, or $1.46 per diluted share, during Q4
Significant NOLs(2)
• $30M Federal
• $301M State
($ Mil)
9/30/14 12/31/14
Cash & Equivalents $83.6 $86.2
Restricted Cash & Equivalents 21.9 18.7
Accounts Receivable 13.8 13.6
Total Current Assets 121.1 119.7
PP&E 5.6 5.3
Goodwill 3.6 3.6
Intangible Assets 11.6 11.1
Total Assets $142.0 $139.9
Accounts Payable $2.3 $1.1
Accrued Expenses & Other Current 23.6 25.5
Current Liabilities of Discontinued Ops (4) 31.8 12.1
Total Current Liabilities 57.7 38.6
Total Liabilities 62.7 43.5
Shareholders’ Equity 79.3 96.4
Total Liabilities & Shareholders’ Equity $142.0 $139.9
1) Defined as current assets minus current liabilities.2) As of 12/31/13.3) $12.1M of restricted cash due to be released in December 2015. 4) Includes loan loss reserve of $28.4M and $8.8M as of 9/30/14 and 12/31/14, respectively.
(3)

94
Guidance Summary
Q1 2015
Revenue $46.0 - $48.0
Y/Y Growth 15% - 20%
VMM $ $19.0 - $20.0
Y/Y Growth 25% - 31%
Adj. EBITDA $6.0 - $7.0
Y/Y Growth 34% - 56%
FY 2015
Revenue(1) $192.5 - $200.8
Y/Y Growth 15% - 20%
VMM $ $76.0 - $80.0
Y/Y Growth(1) 17% - 23%
Adj. EBITDA $27.0 - $29.0
Y/Y Growth(1) 24% - 33%

95
2014:
$167MRevenue
Facilitating Est. 0.8% share
of originations acrossall loan categories
$500M revenue
2.2% share
$1.0Brevenue
4.4% share
10% share $2.0B+revenue
Market Share / Revenue Opportunity
Source: Third-party and internal estimates.Assumes $1.9T annual industry originations across Mortgage, Home Equity, Student, Auto, Credit Card, Unsecured/Personal & Small Business and current LendingTree economics.

96
Long-Term Model
, ~1.2% (3)
1) Reflects the twelve months ended 12/31/14.2) Reflects mid-point of current FY 2015 guidance.
% of Revenue(1)
% of Revenue
2014(1) 2015 Guidance(2) Long-Term Model
Mortgage Revenue 80% ~70% ~50%
Non-Mortgage Revenue 20% ~30% ~50%
Revenue 100% 100% 100%
Variable Marketing Expense 61% 60%
Variable Marketing Margin 39% 40% 40%
Operating Expense 26% 26%
Adjusted EBITDA 13% 14% 20% - 25%

97
Investment Highlights
THE marketplace for consumer loans
Providing value to consumers & lenders
Leader in largest loan category – Mortgage
At forefront of high-growth lending categories
Iconic LendingTree brand
Cutting-edge marketing & analytics
Continuous product innovation
New My LendingTree – personalization platform
Sound financial model

Group Q&A
99
For more information please contact:
Trent Ziegler
VP – Finance & Investor Relations
704-943-8294
Alex Mandel
Chief Financial Officer
Doug Lebda
CEO and Chairman
