investor briefing new york city, palace...
TRANSCRIPT

Investor Briefing
Copyright © OpenText Corporation. All rights reserved.
Investor Briefing New York City, Palace Hotel
September 6th, 2012

Welcome
Copyright © OpenText Corporation. All rights reserved.
Welcome
Greg SecordOpenText VP Investor Relations
September 6th, 2012

Safe Harbor Statement
Certain statements in this presentation constitute forward-looking statements or forward-looking information within the meaning of applicable securities laws (“forward-looking statements”). Such forward-looking statements involve known and unknown risks, uncertainties and other factors that may cause the actual results, performance or achievements of Open Text, or developments in Open Text’s business or in its industry, to differ materially from the anticipated results, performance, achievements or developments expressed or implied by such forward-looking statements. The historical increases in the Company's revenues and earnings do not assure the revenues and earnings will not decrease in the future. Forward-looking statements include all disclosure regarding possible events, conditions or results of operations that is based on assumptions about future economic conditions and courses of operations that is based on assumptions about future economic conditions and courses of action. Forward-looking statements may also include any statement relating to future events, conditions or circumstances. Open Text cautions you not to place undue reliance upon any such forward-looking statements, which speak only as of the date they are made. Forward-looking statements relate to, among other things, changes in the EIM market; the market focus of Open Text, Open Text’s revenue mix and margin targets; Open Text’s operations priorities; and Open Text’s strategy for its products and solutions. The risks and uncertainties that may affect forward-looking statements include, among others, the completion and integration of acquisitions, the possibility of technical, logistical or planning issues in connection with deployments, the continuous commitment of Open Text's customers, demand for Open Text's products and other risks detailed from time to time in Open Text's filings with the Securities and Exchange Commission and Canadian provincial securities regulators, including Open Text's Annual Report on Form 10-K for the year ended June 30, 2012. Forward-looking statements are based on management’s current plans, estimates, projections, beliefs and opinions, and the Company does not undertake any obligation to update forward-looking statements should assumptions related to these plans, estimates, projections, beliefs and opinions change.
3

Reminders/Upcoming Investor Events
� Reminder: This event is being recorded
� Presentation materials and replay information are available in the “Investors” section of www.opentext.com
Upcoming Investor EventsUpcoming Investor Events� Deutsche Bank Access 2012 Technology Conference,
September 11, 2012, Las Vegas, NV
� OpenText Enterprise World, Investor/Analyst program, November 14th, 2012, Orlando, Florida
� Credit Suisse's Annual Technology Conference, November 27, 2012, Scottsdale, Arizona
� Raymond James & Associates’ 34th Annual Institutional Investors Conference, March 5, 2013, Orlando, Florida
4

Investor Briefing New York City, Palace Hotel
Copyright © OpenText Corporation. All rights reserved.
Mark J. BarrenecheaOpenText President & CEO
September 6th, 2012

Agenda
Speaker Time
Mark J. BarrenecheaCEO
09:00 AM – 09:30 AM
Greg CorganEVP, Field Operations
09:30 AM – 10:00 AM
Muhi Majzoub 10:00 AM – 10:30 AM
6
Muhi Majzoub SVP, Engineering
10:00 AM – 10:30 AM
Paul McFeetersCFO & CAO
10:30 AM – 11:00 AM
Mark J. BarrenecheaCEO
11:00 AM – 11:10 AM
Q&A 11:10 AM – 11:50 AM
Break 11:50 AM – 12:00 PM
Lunch with Management 12:00 PM – 01:00 PM

What You Will Hear Today
� Expanded Market Opportunity - EIM
� Growth Plans: Revenue, License, Earnings
� Expanded Management Team
� Innovation Strategy� Innovation Strategy
� Fiscal 2013 target model
7

Consistency and Growth
238
270
294
800
1000
1200
1400Service
Customer Support
License
Non-GAAP EPS Revenue
$3.00
$3.50
$4.00
$4.50
$5.00
8
126 143 151 167 204 257
288364 405
508561
657183
219230
238
0
200
400
600
800
FY07
$596
FY08
$725
FY09
$786
FY10
$912
FY11
$1033
FY12
$1208
6 year CAGR 28.7%* 6 year CAGR 19.7%*
$-
$0.50
$1.00
$1.50
$2.00
$2.50
$3.00
FY07 $1.46
FY08$2.03
FY09$2.51
FY10$3.12
FY11$4.07
FY12$4.60
*FY06 Revenue $410 million*FY06 non GAAP EPS $1.01

$2 Billion in Acquisitions
9

OpenText My Day 1 Observations Go Forward Priorities
Expanded Opportunity &Addressable Market
ECM$5b TAM in 2012
EIM$19b TAM in 2016
Consistency and GrowthStrong Revenue,
Earnings, Cash Flow CAGRs
Remains a Priority
Update on Priorities
10
CAGRs
Organic License Growthbelow
Market Rates@ or above
Market Rates
Proven Acquirer$2 Billion.
Doubled the Company over six years.
Remains a Priority
Innovation Silo’d & Incremental Integrated & Strategic
Company Leadership & Structure
GM / BU Model Functional Model

Executive Team
Paul McFeeters Greg Corgan Muhi Majzoub James McGourlay
11
Paul McFeetersCFO & CAO
Gordon DaviesCLO
Greg CorganWW Field Operations
Muhi MajzoubEngineering
James LathamCMO
James McGourlayCustomer Service
Manny SousaHuman Resources
Steve HuntCIO

Delivered a Solid Fiscal 2012
OpenText delivered record performance in revenue, profit, earnings per share and Non-GAAP operating cash flow
$1.2 billionRevenueUp 17% percent
$293 millionLicenseUp 9% percent
$4.60
13%
12
$4.60Non-GAAP Earnings Per ShareUp 13% percent
Up 17% percent Up 9% percent
$270 millionNon-GAAP Net IncomeUp 13% percent
$287 millionNon-GAAP OperatingCash Flow*Up 15 percent
$4.07
2011 2012
* Before impact of special charges

Global BusinessFiscal 2012
WW HQWaterloo, ON
New York, NY
Washington, DC
Atlanta, GA
San Francisco,CA
Austin, TX
Tucson, AZ
Bellevue, WA
Reading, UK
Paris, FR
EMEA HQGrasbrunn, DE
Ottawa, ON
Stockholm, SE
Richmond Hills, ONTokyo, JN
Hyderabad
Mumbai IN
Hong Kong
13
Americas
F12 Revenue $635m
Y/Y Growth 16%
% of Business 52.6%
EMEA
FY12 Revenue $474m
Y/Y Growth 13%
% of Business 39.3%
APJ
FY12 Revenue $98m
Y/Y Growth 42%
% of Business 8.1%
Sao Paulo, SP
Johannesburg, SA
APJ HQSydney, AU
Singapore
Melbourne, AU
HyderabadIN
IN

Markets Evolve: The Platform
The Platform
BI
DeveloperTools
4 Leaders100’s
14
PlatformDatabase
ApplicationServer Security

Markets Evolve: Applications
BusinessFinancials
CRMHRMS
3 Leaders100’s
15
BusinessSuiteFinancials
Supply Chain MRP
PLM

EDI
Markets Evolve: EIM
Enterprise
Discovery
ECM
FAX
Capture
100’s
16
EnterpriseInformation
Management
ECM
IXBPM
CEM

Unstructured Information
Discover. Connect. Capture. Digitize
Unstructured Enterprise Information
17
Control Content Extract Value Provide Insight Build Apps
Process & Data Orchestration
Records ManagementClassification
MetadataSecurity
ERP, CRMSCM, PLM
EmailOther Repositories
PortalSocialSearchMobile
CasesContractsCustomersInvoicingApprovals

Enterprise Information ManagementUnleashing the Power of Information
OpenText Vision and Strategy
Mobile . Social . Cloud
18
The Next Generation Enterprise Platform

Two Enterprise Information Pillars
EIM ERP
CustomerECM, BPM, FIN, HRMS,
Emerging Mature
19
CustomerEmployeeSupplierAssets
Products…
Unstructured Information
Structured Information
ECM, BPM, CEM, iX, Discovery
FIN, HRMS, OM, CRM,
PLM
$19b TAM 201610% CAGR
$33b TAM 20167% CAGR

EIM Today
Lack of Standards
Islands of Data
ERP, Email, Paper, DBMS, File Systems, Desktops, SharePoint
Custom Applications
Contracts, Cases, Quality, Compliance,
Assets, …
� Data Fragmentation
� Process Fragmentation
� Bespoke Applications
20
Varying Formatspdf, doc, ppt, xml, html, jpg, cad …
Important Data
ObjectsCustomer, Employees,
Suppliers, Assets, Products
� Data Vulnerability
� Costly
� Too Many Point Solutions
� Lots of Missed Opportunity

EIM Tomorrow
Vertical Stacks
ApplicationsContracts, Cases, Quality…
Tools & BIStandards and Consistency…
� Information Integration
� Process Integration
� Standard Business Flows
21
MiddlewareData Integration
Standards and Consistency…
Information StoresEIM, ERP
� Packaged Applications
� Information Governance & Security
� Suite Providers

Enterprise Information Management (EIM)TAM: $13 billion 2012, $19 billion 2016.* 10% CAGR**
Customer win:
Emergency Medicine
Physicians Information
Exchange
DiscoveryCEMBPMECM
2012
$4.6B Market
2012
$2.6B Market
2012
$1.35B Market
2012
$3.2B Market
2012
$1.4B Market
22
$4.6B Market
7.2% Growth
$2.6B Market
7.9% Growth
$1.35B Market
14% Growth
$3.2B Market
11.4% Growth
$1.4B Market
14% Growth
Search
Semantic Navigation
eDiscovery
Auto-Classification
Content Analytics
Fax, EDI, SMS, Voice
Document Distribution
Capture
Recognition
Managed File Transfer
Data Integration
Business Process
Management
High Volume Imaging
Case Management
Process-centric
Applications
Strategic Business
Planning and
Modeling
Content Management
Archiving
eDOCS
Records Management
Learning Management
Email Management
Content-centric
Applications
Web Content
Management
Social Communities
Customer
Communications
Management
Portal
Media Management
Mobile Web
Digital Asset
Management
* *See appendix at end of presentation for sources of data
*Based on projected annualized growth rate as applied to current $13B market opportunity

Information Reference Records Management,
Product Priorities
ApplicationsData & Process
IntegrationFunctional Excellence
Contracts, Cases, Compliance, Assets, …
Information Reference Model, Middleware,
Connectors & Collectors, and Tools
Records Management, Archiving, Social
Communities, Process Modeling, Scanning, …
23
Mobile Social Cloud
Built on an Integrated Platform

How We Look at the Market
� Category leader
� EIM leader
� Expertise
ECM BPM CEM iX Discovery
OpenText ✔ ✔ ✔ ✔ ✔
IBM ✔ ✔ - - -
HP ✔ - - - ✔
MicroSoft ✔ - - - -
Competitive Grid How we win
24
� Expertise
� Customer references
� Proven ROI
� Singular Focus
MicroSoft ✔ - - - -
EMC ✔ - - - -
Oracle ✔ - ✔ - -
Adobe - - ✔ - -
Pega - ✔ - - -
Tibco - ✔ - - -
J2 Global - - - ✔ -
SDL - - ✔ - -
EPIQ - - - - ✔
More… - - - - -
Source: OpenText

Growth Drivers
EIM New MarketsDistribution Expansion
25
Product Cycle Cloud Services Acquisitions

Unleashing the Power of InformationUnleashing the Power of Information

Investor Briefing New York City, Palace Hotel
Copyright © OpenText Corporation. All rights reserved.
New York City, Palace Hotel
Greg CorganOpenText EVP WorldwideField Operations
September 6th, 2012

Greg Corgan
� 24 Years with IBM
� 2 Startups
� EVP Worldwide Sales at CA Technologies
� EVP Worldwide Field Operations at Infor
28

Customer World-Class
First Principles
Grow License
Customer Success
Selling Organization
29
LicenseRevenue

Delivering Success in Fiscal 2013
� Cross sell and up sell into customer base
� Greater discipline in deal structure & discounting
� Emerging market expansion
� SAP� SAP
� Partner program
� Sales force expansion
30

Update on Priorities
OpenText My Day 1 Observations Go Forward Priorities
Leadership Solid Management Team Build out their teams
Customers Strong Customer Base Expand and optimize coverage
Drive Harder
31
Partners Outstanding SAP RelationshipDrive HarderLeverage more productivelyBuild additional relationships
DistributionCoverage GapsGeographic Partner Strategies
Hire to GrowHire to FocusWorld Class Partner Organization
Processes Localized ProcessesWorldwide Alignment of ‘How we do things’
ServicesSolid ImplementersGood Margins
Higher Value ContentContinued Good Margins

Field Organization
Steve Best Ted Harrison Graham Pullen Gary Weiss
32
Steve BestAmerica Sales
Ted HarrisonEMEA Sales
Graham PullenAPJ Sales
Gary WeissiX & Portfolio Sales
Walter KohlerProfessional Services
Brad KellerWW Sales Operations
Patrick BarnertPartners

Update on Priorities
OpenText My Day 1 Observations Go Forward Priorities
Leadership Solid Management Team Build out their teams
Customers Strong Customer Base Expand and optimize coverage
Drive Harder
33
Partners Outstanding SAP RelationshipDrive HarderLeverage more productivelyBuild additional relationships
DistributionCoverage GapsGeographic Partner Strategies
Hire to GrowHire to FocusWorld Class Partner Organization
Processes Localized ProcessesWorldwide Alignment of ‘How we do things’
ServicesSolid ImplementersGood Margins
Higher Value ContentContinued Good Margins

Account Segmentation Model
• Top historical and potential future revenue producers• 1 to 10 per “Key Account” AE• Focus on building relationships and getting deeper and
wider• Highest level of support (Value Engr, SC’s, etc.)
Key Accounts
34
• Next band of accounts based on historical and potential future revenue
• 15 to 30 per “Named Account” AE• Focus on mining opportunities
Named Accounts
• Remaining accounts• Narrow product focus• Inside sales• Partner support• “Virtual” AE Deployment SWAT team
Territory Accounts

Selling Areas (Americas)
Americas
Canada
East USA
35
East USA
West USA
Public Sector
Latin America (� expanding)

Selling Areas (EMEA)
EMEA
UK
Northern Europe
36
Northern Europe
Southern Europe
DACH
Emerging (� expanding)

Selling Areas (APJ)
EMEA
ANZ
South East Asia
37
South East Asia
Japan
India
China
(� expanding)
(� expanding)

Strategic Alliances
System Integrators SI / FSI
VARs
Gro
wth
and O
pport
unity
Gro
wth
and O
pport
unity
Distribution Model
VARs
Distributors
OEM
Technology Alliances
Gro
wth
and O
pport
unity
Gro
wth
and O
pport
unity
38

Professional Services at OpenText
FACTS
Global PresenceFY12 Revenue 257.2M
FY12 Margin 20.3%
MISSION
Help our customers derive valuefrom their OpenText investment
in a fast, cost-effective and predictable way.
39
FY12 Margin 20.3% predictable way.
COMPLETE OFFERING
Strategy ConsultingDesign / Blueprinting
ImplementationChange Mgmt / Training
Managed Services / Operation
FUTURE / INITIATIVES
EIM Strategy FocusBest Practice Solutions
Industry Blueprints
Growth & Profitability

Leaders Buy From Leaders
40

Unleashing the Power of InformationUnleashing the Power of Information

Investor Briefing New York City, Palace Hotel
Copyright © OpenText Corporation. All rights reserved.
Muhi S. MajzoubSVP, Engineering
September 6th, 2012

Background
� Oracle building business and internet applications
Oracle.com, Oracle Store, Oracle Applications
� CA Technologies managing the Application
Management Division and the Catalyst Platform/Common Management Division and the Catalyst Platform/Common
Components
� NorthgateArinso as Chief of Products building Payroll
and Human Resources
43

Enterprise Information ManagementUnleashing the Power of Information
OpenText Vision and Strategy
Mobile . Social . Cloud
44
The Next Generation Enterprise Platform

EIM Evolution
Lack of Standards
Islands of Data
Custom Applications
Vertical Stacks
ApplicationsContracts, Cases, Quality…
Tools & BI
45
Varying Formats
Important Data
Objects
MiddlewareData Integration
Tools & BIStandards and Consistency…
Information StoresEIM, ERP

Information Reference Records Management,
Product Priorities
ApplicationsData & Process
IntegrationFunctional Excellence
Contracts, Cases, Compliance, Assets, …
Information Reference Model, Middleware,
Connectors & Collectors, and Tools
Records Management, Archiving, Social
Communities, Process Modeling, Scanning, …
46
Mobile Social Cloud
Built on an Integrated Platform

Applications
� SAP: Employee, Receipts and Vendor Management
� Oracle: Archiving, Records Management
� Contract Management
� Asset Management � Asset Management
� Case Management
� Digital Asset Management
Copyright © Open Text Corporation. All rights reserved. 47

Data and Process IntegrationP
rocess
Copyright © Open Text Corporation. All rights reserved. 48
Data
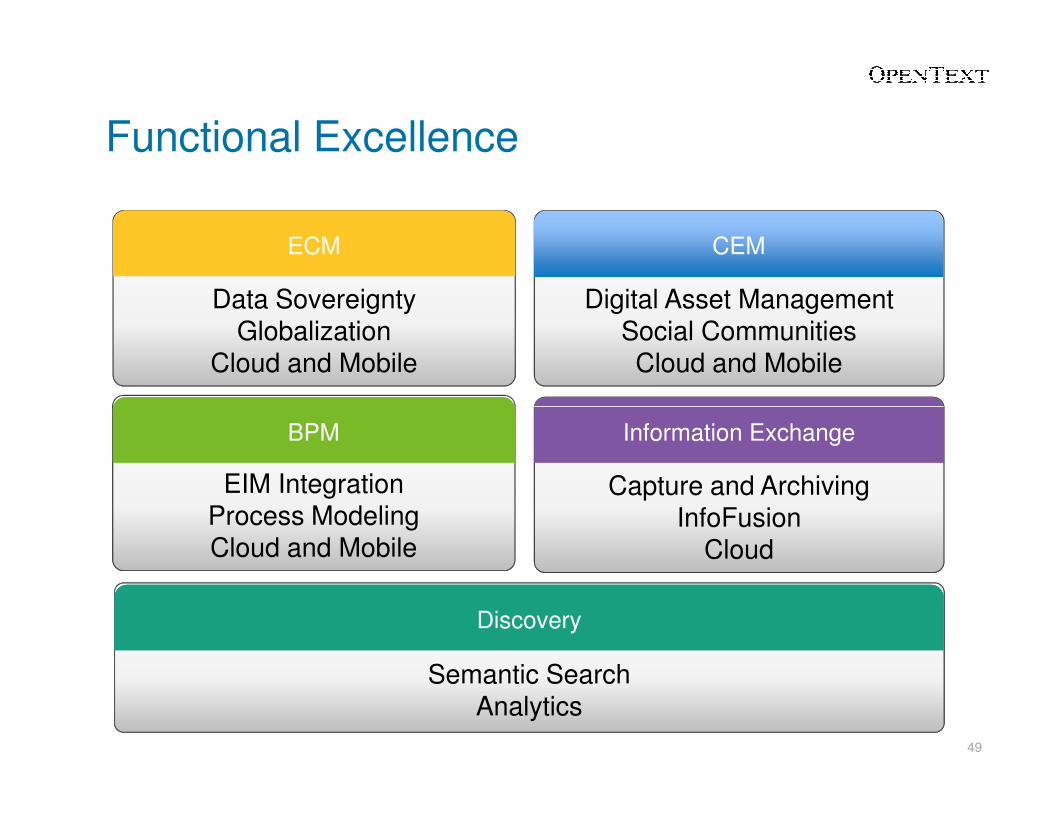
Functional Excellence
Data SovereigntyGlobalization
Cloud and Mobile
ECMECM
Digital Asset ManagementSocial CommunitiesCloud and Mobile
CEMCEM
EIM IntegrationProcess ModelingCloud and Mobile
BPMBPM
Capture and Archiving InfoFusion
Cloud
Information ExchangeInformation Exchange
Semantic SearchAnalytics
DiscoveryDiscovery
49

Information Flows
ECM BPM CEM IX Discover
Create Publish Measure Adjust Consume
Initiate Assess Collaborate Process Optimize
Capture Classify Manage Discover Archive
50

Information Exchange EasyLink, FDDG
EIM - In The Cloud
2 Billion Transaction per year25,000 Customers1.5 Million Users
2 Billion Transaction per year25,000 Customers1.5 Million Users
Data & Process Services
Social Services
Platform Services
ECM & BPM
CEM
Managed Hosting
COPYRIGHT © 2012 OPEN TEXT CORPORATION. ALL RIGHTS RESERVED.
51

Social Communities & Tempo In The Cloud
End of calendar year
52

InfoFusion
53

Innovation Cycles Increasing
BPM Focus FY 13 Q1
BPM Release 9.0
BPM Mobile 2.0
Provision 9.0
Enterprise Connect 10.2.2Enterprise Connect 10.2.2
Mobile. Social. Cloud. FY 13 Q2
Tempo in the Cloud
Achieve in the Cloud
WAVE Mobile Platform 3.8
Social Communities in the Cloud
54

Summary
InnovationPredictable
Product Cycle
Quality&
Performance
55
EIMData Store Services Analytics Applications
Social Mobile Cloud Integration

Unleashing the Power of InformationUnleashing the Power of Information

Investor Briefing New York City, Palace Hotel
Copyright © OpenText Corporation. All rights reserved.
New York City, Palace Hotel
Paul McFeetersOpenText CFO and CAO
September 6th, 2012

FY13 External Target Model*
Revenue Type Fiscal 2012 ActualFiscal 2012 Target
Model
Fiscal 2013 Target
Model
As a % of revenue
Product License 24.3% 25-30% 20 - 25%
Cloud Services 0.6% 0% 11 - 14%
Product Maintenance 53.8% 52-57% 44 - 48%
Professional Services 21.3% 18-23% 17 - 22%
Non-GAAP Gross Margin
Product License 93.9% na 92 - 94%
58*This target model is not guidance.
Product License 93.9% na 92 - 94%
Cloud Services na na 58 - 60%
Product Maintenance 83.2% na 83 - 85%
Professional Services 20.4% na 19 - 21%
Non-GAAP Gross Margin 72.5% 73-75% 71 - 74%
Non-GAAP Operating Expenses
Development 13.7% 14-16% 13 - 14%
Sales & Marketing 22.0% 21-23% 21 - 23%
General & Admin 7.7% 8-10% 8 - 9%
Depreciation 1.8% 2% 2%
Non-GAAP Ops Margin 27.3% 25-30% 26 - 30%

License Revenue Seasonality (guideline – not guidance)
� Q4 to Q1 – down 10-20%
� Q1 to Q2 – up 20-30%
� Q2 to Q3 – down 5-10%
� Q3 to Q4 – up 20-30%
59

Support Revenue – historical metrics
� Renewal rate 91 – 93% inclusive of Price increase
� First year maintenance mandatory 20%
� Deferred customer support revenue June 30, 2012 $287m, $274m recognizable in fiscal 2013
60

Sample Support Revenue Calculation– using FY ‘11 as a base for FY ‘12 - example
Calculation Revenue
Q4 F11 support revenue $ 151
Annualized revenue (4 x Q4) (a) 604
Current deferred revenue
6/30/11(b) $ 255
Support to be renewed (a) - (b) = (c) 349
Renewal rate (d) 92%
61
Renewal rate (d) 92%
Renewed support (c) x (d) = (e) 322
price increase (f) 1%
(e) x (f) = (g) 3
Total renewed (b) + (e) + (g) = (h) 580
F12 license revenue (i) 295
First year maintenance (j) 20%
Revenue recognized (i) x (j) x 50% = (k) 30
Total renewed (h) + (k) = (l) 610
Global360 40
Estimate of total revenue $ 650

Tax rate – Cash taxes
2011Effective Rate on Adjusted Earnings – 14%Cash Taxes on Operations – 5%-7%
2012
62
2012Effective Rate on Adjusted Earnings – 14%Cash Taxes on Operations – 5%-7%
2013Effective Rate on Adjusted Earnings – 14%Cash Taxes on Operations – 5%-7%

Taxes on Business Reorganization and Acquisition Transfers of IP
Open Text also expects to pay cash taxes based on continuing to align ownership and management of our Intellectual Property in Luxembourg.
The amount depends on the fair value and tax
63
The amount depends on the fair value and tax attributes (cost basis)of the acquired assets and tax attributes (losses) of the acquired entity from which any property is transferred or sold.
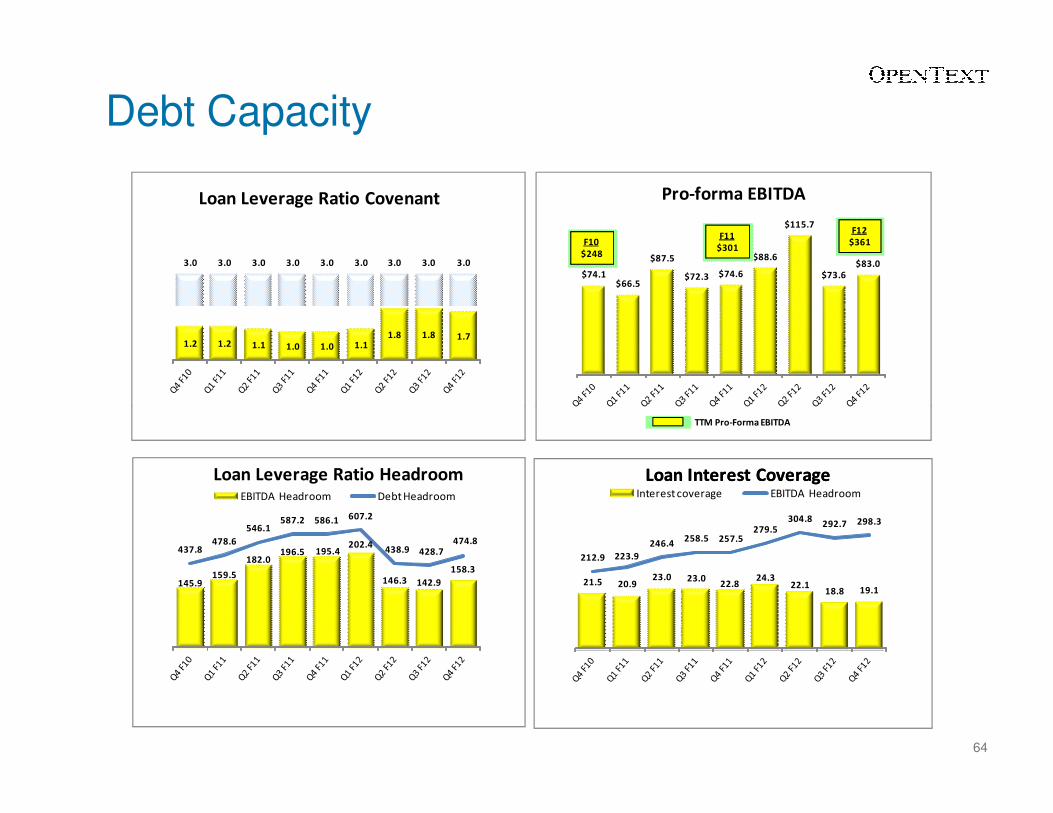
Debt Capacity
3.0 3.0 3.0 3.0 3.0 3.0 3.0 3.0 3.0
1.2 1.2 1.1 1.0 1.0 1.1 1.8 1.8 1.7
Loan Leverage Ratio Covenant
$74.1$66.5
$87.5
$72.3 $74.6
$88.6
$115.7
$73.6$83.0
Pro-forma EBITDA
F10
$248
F11
$301
F12
$361
64
145.9159.5
182.0196.5 195.4
202.4
146.3 142.9
158.3
437.8478.6
546.1587.2 586.1 607.2
438.9 428.7474.8
EBITDA Headroom Debt Headroom
Loan Leverage Ratio Headroom
TTM Pro-Forma EBITDA
21.5 20.923.0 23.0
22.824.3
22.118.8 19.1
212.9 223.9
246.4258.5 257.5
279.5304.8
292.7 298.3
Interest coverage EBITDA Headroom
Loan Interest Coverage Loan Interest Coverage

Debt Capacity
� F12 EBITDA $361m
� Loan Covenants - 3 X Debt/EBITDA & 3 X Interest
� June 2012 cash balance $560m, EasyLink cash cost $315m
� Debt capacity:
65
� Debt capacity:
TTM EBITDA $ 361
Loan covenant 3.0
1,083
Current debt 608
Additional capacity $ 475

History of Growing Non-GAAP EPS and Adjusted Operating Cash Flow**Non-GAAP EPS
6 Year CAGR 28.7%*
$-
$1.00
$2.00
$3.00
$4.00
$5.00
FY07 $69M$1.46
FY08$108M$2.03
FY09$134M$2.51
FY10$179M$3.12
FY11$238M$4.07
FY12$270M$4.60
66
* FY06 non-GAAP EPS $1.01, OCF $61M** Before the impact of special charges
Operating Cash Flow **
$-
$2.00
$4.00
$6.00
0
50
100
150
200
250
300
350
FY 07$111M
$2.18/shr
FY 08$166M
$3.16/shr
FY 09$186M
$3.50/shr
FY 10$214M
$3.73/shr
FY 11$244M
$4.19/shr
FY 12$287M
$4.89/shr
6 Year CAGR 29.5%*
$1.46 $2.03 $2.51 $3.12 $4.07 $4.60

OpenText – Key Financial Metrics
�Predictability of Results
�Strong Earnings & Cash Flow
67
�Acquisition capacity

Investor Briefing New York City, Palace Hotel
Copyright © OpenText Corporation. All rights reserved.
Mark J. BarrenecheaOpenText President & CEO
Wrap Up
September 6th, 2012

Two Key Observations
80% of Enterprise data is unstructured.The other 20% lives
More unstructured data will be generated this year, then in all previous
69
The other 20% lives in ERP systems. then in all previous
years combined.
“Technology Trends You Can’t Ignore” - Gartner“Investigating the 80% “ – Seth Grimes, BridgePoint

Summary
EIM$19b TAM 2016.
10% CAGR.
GrowthRevenue. License.
EPS. CF.
LeadershipCompany. Products.
Customers.
70
ConsistencyDoubled the company in six years. Year over Year execution.
Acquisitions

Unleashing the Power of InformationUnleashing the Power of Information

References
• ECM, BPM: Gartner Forecast Enterprise Software Markets, 2009-2016 1Q12
Update
• InfoExchange: Research and Markets, Computer-based Fax Markets, 2010-2015
• Gartner Enterprise Software Markets, 2009-2016
• 1Q12 Update, Davidson Consulting, Fax Server Industry Forecast, 2011-2016
• CEM: Gartner Magic Quadrant for Web Content Management, 10 Nov. 2011
• Discovery: Gartner Market Trends: Expect Disruption and Divergence in the
72
• Discovery: Gartner Market Trends: Expect Disruption and Divergence in the
E-Discovery Software Market, 16 Dec. 2011