investor conference - air products & chemicals/media/60e19e1ebbc74e... · investor conference...
TRANSCRIPT

Investor ConferenceInnovation, Integration and Improvement
Simon MooreDirector, Investor Relations
Forward-Looking Statements Note: This presentation contains "forward-looking statements" within the safe harbor provisions of the Private Securities Litigation Reform Act of 1995, including earnings guidance, projections and targets. These forward-looking statements are based on management's reasonable expectations and assumptions as of the date this release is issued regarding important risk factors. Actual performance and financial results may differ materially from projections and estimates expressed in the forward-looking statements because of many factors not anticipated by management, including, without limitation, slowing of global economic recovery; renewed deterioration in economic and business g, , g g y;conditions; weakening demand for the Company's products; future financial and operating performance of major customers and industries served by the Company; unanticipated contract terminations or customer cancellations or postponement of projects and sales; the success of commercial negotiations; asset impairments due to economic conditions or specific product or customer events; the impact of competitive products and pricing; interruption in ordinary sources of supply of raw materials; the ability to recover unanticipated increased energy and raw material costs from customers; costs and outcomes of litigation or regulatory activities; successful development and market acceptance of new products and applications, the ability to attract, hire and retain qualified personnel in all regions of the world where the Company operates; the effects of a natural disaster; the success of cost reduction and productivity programs and achieving anticipated acquisition synergies; the timing, impact, and other uncertainties of future acquisitions or divestitures; significant fluctuations in interest rates and foreign currencies from that currently anticipated; the continued availability of capital funding sources in all of the Company's foreign operations; the impact anticipated; the continued availability of capital funding sources in all of the Company s foreign operations; the impact of environmental, healthcare, tax or other legislation and regulations in jurisdictions in which the Company and its affiliates operate; the impact of new or changed financial accounting guidance; the timing and rate at which tax credits can be utilized and other risk factors described in the Company's Form 10K for its fiscal year ended September 30, 2010. The Company disclaims any obligation or undertaking to disseminate any updates or revisions to any forward-looking statements contained in this document to reflect any change in the Company's assumptions, beliefs or expectations or any change in events, conditions, or circumstances upon which any such forward-looking statements are based.

Time Presentation Presenter
8:30 Welcome Simon Moore
8:35 Strategy for Success John McGlade
Agenda
8:35 Strategy for SuccessCommitment to Success
John McGladePaul Huck
9:30 Q&A John McGladePaul Huck
9:50 Break
10:05 Business Presentations and Q&A Business Leaders
11:45 Closing John McGlade
12:00 LunchDisplay Interaction
Management Team
1:30 End
Today’s Speakers
Paul Huck
John McGladeChairman,President and CEO
Strategy for Success8:35 a.m.
Steve Jones
Paul HuckSenior Vice Presidentand Chief Financial Officer
Bob DixonSenior Vice Presidentand General Manager, Merchant Gases
Tonnage Gases,
Commitment to Success
Merchant Gases
9:00 a.m.
10:05 a.m.
Senior Vice President and General Manager,Tonnage Gases, Equipment and Energy
Corning PainterVice Presidentand General Manager, Global Electronics
Tonnage Gases,Equipment and Energy
Electronics
10:40 a.m.
11:15 a.m.

Investor ConferenceInnovation, Integration and Improvement
Strategy for Success
John McGladeh d dChairman, President and CEO
Delivering on Our Future
• Culture of Improvement• Accountability
People
• Energy• Environment• Emerging Markets
• Accountability• Talent Development
AcceleratingGrowth
SuperiorFinancial Returns• Accelerating Productivity• Meeting Commitments• Long-term Targets
• Long-Term Customer Relationships• Global Trends• Benchmarks / Best Practices
External Focus

A Strategy for Success
Winning in energy, environmentaland emerging Markets
Executing
Delivering
Markets
on revenue, margin
G l
on innovation, integrationand improvement Actions
e e g
Generating Shareholder Value
and return Goals
Winning in energy, environmentaland emerging Markets

AcceleratingGrowth
Winning in the Markets
Air Products Advantage
Global Trends
Customers Productivity Quality
Applications Environmental Needs EfficiencyIndustrial Gas Fundamentals
Global Trends Accelerate Growth
Market Air ProductsTrend Market Air ProductsOpportunity
Trend
• Refining
• Gasification
• Hydrogen
• Oxygen
Increasing Energy Demand

Global Trends Accelerate Growth
Market Air ProductsTrend Market Air ProductsOpportunity
Trend
• Refining
• Glass
• Coatings & Construction
• Hydrogen
• Oxygen
• Performance Materials
Environmental FocusEnvironmental Focus
Construction Materials
Global Trends Accelerate Growth
Market Air ProductsTrend Market Air ProductsOpportunity
• Gases
• Applications
TrendEmerging Markets • Metals
• Chemicals
• Food
• Electronics

Global Trends Accelerate Growth
Trend Market Air Products
• Semiconductor
• Display
• Onsite Nitrogen
• Liquid Products
• Electronic Materials
TrendDigital RevolutionDigital Revolution
Market Air ProductsOpportunity
• Equipment
Air Products Advantage:Hydrogen Leadership
10
12Onsite HOnsite H22 MarketMarketMajor Hydrogen Pipelines
0
2
4
6
8
10
BSCFD
• US Gulf Coast• Southern California• Edmonton, Alberta, Canada• Sarnia Ontario Canada 0
2001 2010 2020
#1 market share for over two decades
Sarnia, Ontario, Canada• Rotterdam, Netherlands

Air Products Advantage:Electronics Leadership
#1in Taiwan
in Koreain U.S.
ROW
#1
#1 #1
300mm Fab Capacity
Key customer and geographic positions
Air Products Advantage:Asia Merchant Leadership
India Taiwan
ChinaKorea
#1 positions in high growth markets

Air Products Advantage:Profitable Joint Ventures in High Growth Regions
Mexico Italy South Africa India Thailand
$2.3B revenue on 100% basis
E iExecuting on innovation, integrationand improvementActions

Innovation Built on Core Competencies
Refining
Gasification
MarketsKey Offerings
Oxy-Fuel Burner DesignGas ApplicationsCombustion
Core Competencies
Gasification
Chemicals
Steel
Glass
Food
Fabrication
Semiconductor
Oxy Fuel Burner Design
Thin film precursors
Electronics
ASU, SMR, LNG, ITM
Gas Production & Delivery
Separations
Process Technology
Semiconductor
CoatingsPerformance AdditivesPMDMaterials and
Chemistry
Creating customer value through these combinations
Integrated Industrial Gas ModelPackaged Gas
TransfillLiquifierOnsite Plant
• Full market access
• Capital leverage
• Lower supply chain costs
• Global best practices
CylinderCustomer
Liquid Customer
OnsiteCustomer
Delivers higher growth and profitability

A Culture of Improvement Delivers Results
• Investment in people, process and tools
• Leadership accountability and individual responsibilityresponsibility
• Data-driven
Growth
• New offerings• Capacity expansions
Productivity
• Product cost reduction• Distribution efficiency
Pricing
• Pricing tools and skills development
l
4%–5% annual cost reduction
• Acquisition synergy • Receivables reduction • Materials sourcing• Leveraging SAP
Delivering on revenue, marginand returnGoals

We Deliver on Our Commitments
15ORONA Operating Margin
18 17% Goal
7
9
11
13
Perc
ent
12.5% Goal
10
12
14
16
Perc
ent
5
2004 2007
8
2007 2011
See appendix for GAAP reconciliation
20152015by
$15+ Billion in Sales
20% Operating Margin
201520% Operating Margin
15% Return on Capital Employed

Thank you…tell me more

Investor ConferenceInnovation, Integration and Improvement
Commitment to Success
Paul Huckd dSenior Vice President and
Chief Financial Officer
RevenueGrowth
20%
Return onCapital
15%11%-13%per year
OperatingMargin
From 16.5% From 12.5%From $9B From 16.5%in 2010
to20% in 2015
From 12.5%in 2010
to15% in 2015
From $9Bin 2010
to$15B+ in 2015
See appendix for GAAP reconciliation

RevenueGrowth
20%
Return onCapital
15%
OperatingMargin
From 16.5% From 12.5%
RevenueGrowth
11%-13%per year
From $9B
Growth11%-13%per year
From $9Bin 2010 From 16.5%
in 2010to
20% in 2015
From 12.5%in 2010
to15% in 2015
From $9Bin 2010
to$15B+ in 2015
to$15B+ in 2015
See appendix for GAAP reconciliation
Global Industrial Gas Market
Electronics10%
Energy9%Population
$63 Billion
Food9%
Metals12%
Manufacturing
Chemicals13%
10%
Healthcare8%
IndustrialManufacturing39%
IndustrialProduction
2010

35
Global Industrial Gas Market GrowthAnnual Growth 9% $96 Billion
Electronics11%
Energy10%6%
7%
10
15
20
25
30 Food8%
Healthcare7%
Chemicals14%
11%10%
Metals
10%
12%
12%
9%
7%
Bill
ions
($)
0
5
Sales Growth
Manufacturing38%
2015
12%8%
Global Industrial Gas Geographies$63 Billion
EmergingChina
Developing Asia10%
D l d
US / Canada26%
S/C America7%
7%C/E Europe
3%
Africa/ME3%
2010
Developed
W Europe27%
Japan17%

35
Global Industrial Gas Geographic Growth
16%15%
$96 BillionAnnual Growth 9%
US / Canada25%China
Developing Asia12%
10
15
20
25
30 16%
5%
14%
19%
13%
4%
Bill
ions
($)
25%China11%
C/E Europe4%
Africa/ME3%
S/C America9%
0
5
Sales Growth
8%
2015
W Europe22%Japan
14%
Air Products Market Exposure 2010
APD $9 Billion
Food4%Healthcare
Food9%
Market $63 Billion
Energy
M f t i
4%Healthcare7%
Metals9%
9%Healthcare
8%
Metals12%
Chemicals13%
Electronics10%
9%
Electronics15%
Energy23%
~10-11% Growth
Manufacturing23%
Chemicals19%
~9% Growth
Manufacturing39%
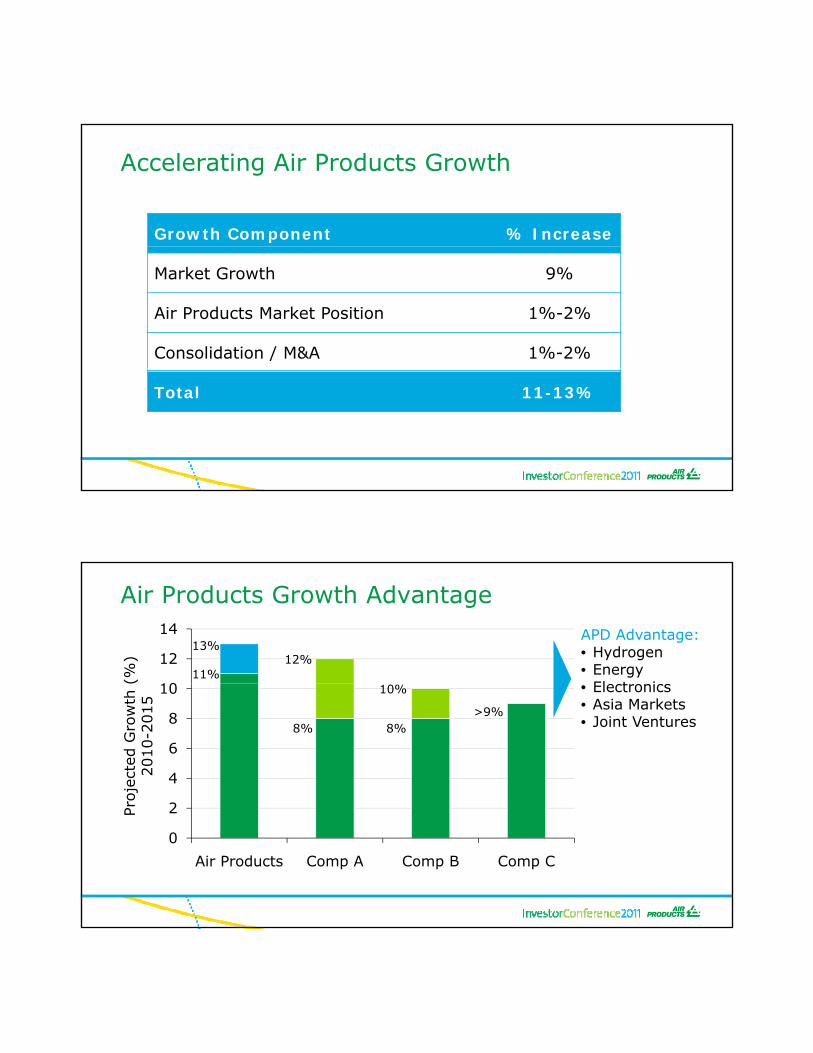
Accelerating Air Products Growth
Growth Component % Increase
Market Growth 9%
Air Products Market Position 1%-2%
Consolidation / M&A 1%-2%
Total 11-13%
Air Products Growth Advantage
10
12
14
(%)
11%
13%APD Advantage: • Hydrogen• Energy
El t i
12%
2
4
6
8
10
roje
cted
Gro
wth
2010-2
015
• Electronics• Asia Markets• Joint Ventures8% 8%
>9%
10%
0
2
Air Products Comp A Comp B Comp C
Pr

OperatingMargin
20%
OperatingMargin
From 16.5%
RevenueGrowth
Return onCapital
15%11%-13%per year
From 12.5%From $9B
Margin
20%
From 16.5%in 2010From 16.5%in 2010
to20% in 2015
From 12.5%in 2010
to15% in 2015
From $9Bin 2010
to$15B+ in 2015
to20% in 2015
See appendix for GAAP reconciliation
Roadmap to 20%
20
22
20%
%)
1% Productivity
12
14
16
18 2% Growth
per
atin
g M
argin
(
17%17%
10
12
2011 2015
Op
See appendix for GAAP reconciliation

Growth Leverage
Existing Asset Asset
Loading25%
New Asset Fixed Cost Leverage
75%
200 Basis Point Margin Improvement
Depre-ciation11%
Air Products Cost Profile = $7.5B
Variable Costs57%
Cash Fixed Costs32%
11%

Air Products Variable Cost Profile = $4.3B
PowerOther22%
Depre-i i 22%
Natural Gas26%
22%
Raw Materials
25% TotalE
Variable Costs57%
Cash Fixed Costs32%
ciation11%
Energy = 53%
Fuel5%
Variable Cost Leverage
Operating Service Center0.92
0.96
1.00 Hydrogen Efficiency
0.882005 20111993 1999 2015
$100MM/year improvement
Argon Recovery
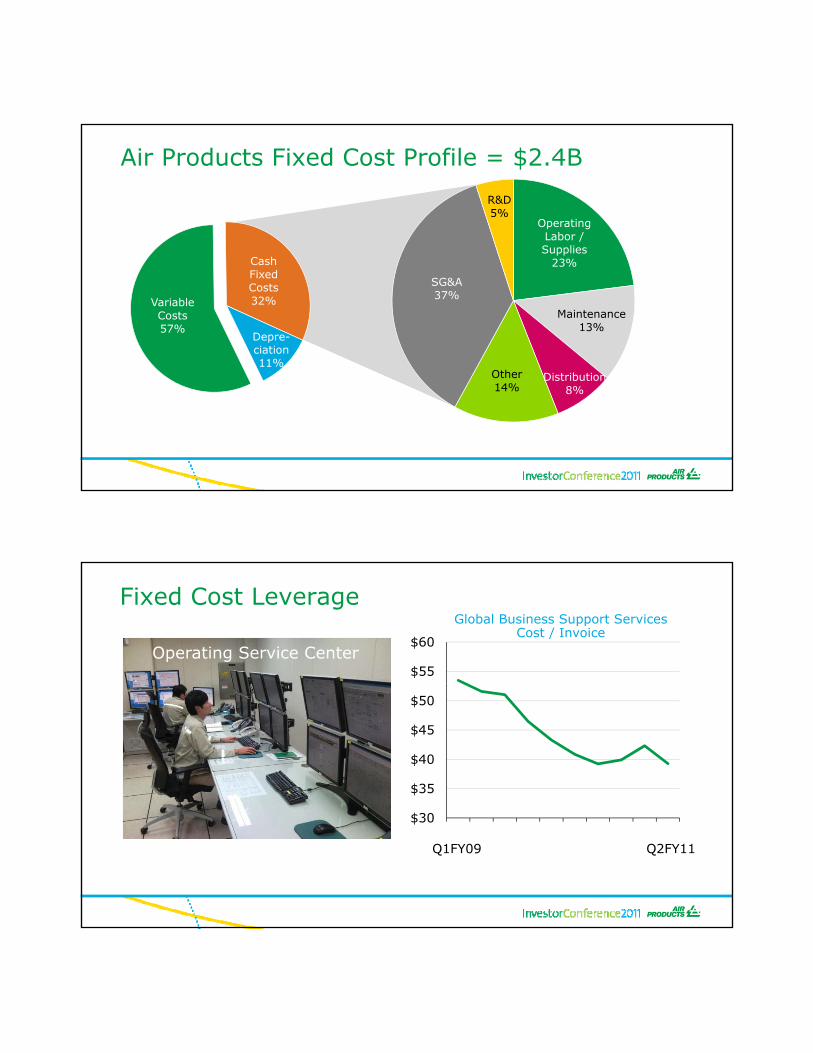
Operating Labor / S li
R&D5%
Air Products Fixed Cost Profile = $2.4B
Supplies23%
Maintenance13%
SG&A37%
Variable Costs57%
Cash Fixed Costs32%
Depre-ciation11%
Distribution8%
Other14%
Fixed Cost Leverage
Operating Service Center$55
$60
Global Business Support ServicesCost / Invoice
$35
$40
$45
$50
$30
Q1FY09 Q2FY11

Fixed Cost Leverage
Operating Service Center13%
14%SG&A as a % of Sales
10%
11%
12%
$50MM/year improvement
9%
2004 2011
Pricing vs. Raw Materials
$200
$400
$(200)
$-
$M
M
Price
Raw Materials
Net Margin
$(400)
$35MM/year improvement
2006-2010 2011-2015

Return onCapital
RevenueGrowth
20%11%-13%per year
OperatingMargin
From 16.5%From $9B
Return onCapital
15%
From 12.4%
Capital
15%
From 12.5%in 2010From 16.5%
in 2010to
20% in 2015
From $9Bin 2010
to$15B+ in 2015
From 12.4%in 2010
to15% in 2015
to15% in 2015
See appendix for GAAP reconciliation
Driving Returns Higher
15
16
15%.5% Capital Improvement
11
12
13
14 1% Margin Turnover
13.5%13.5%
RO
CE (
%)
10
11
2011 2015
See appendix for GAAP reconciliation

120
ex
Driving Capital Cost LowerElectronics NitrogenLarge ASU
120
x>50% >30%
40
60
80
100
apital
Cost
Inde
40
60
80
100
pital
Cost
Index>50%
Savings>30%Savings
20
40
2009 2010 2012 2015
Ca
20
40
2009 2010 2012 2015Ca
16%
18%
Comp A
Delivering Higher Returns
CE
6%
8%
10%
12%
14%Comp A
APD
Comp B
Comp C
4 Q
tr T
raili
ng R
OC
4%
6%
Dec07
Jun08
Dec08
Mar09
Dec09
Jun10
Dec10
Mar11
Mar08
Sep08
Sep09
Mar10
Jun09
Sep10
See appendix for ROCE definition
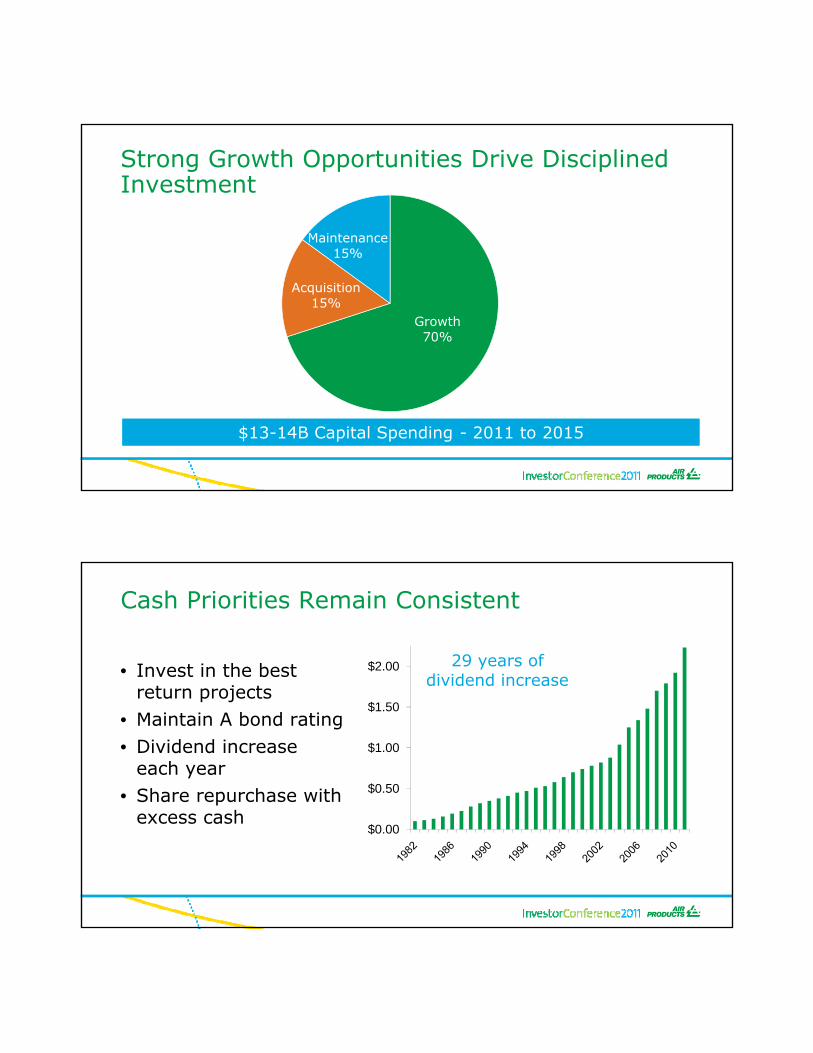
Strong Growth Opportunities Drive Disciplined Investment
Maintenance
Growth70%
Acquisition15%
15%
$13-14B Capital Spending - 2011 to 2015
Cash Priorities Remain Consistent
• Invest in the best $2.00 29 years of dividend increase
return projects• Maintain A bond rating• Dividend increase
each year• Share repurchase with $0.50
$1.00
$1.50
dividend increase
excess cash$0.00
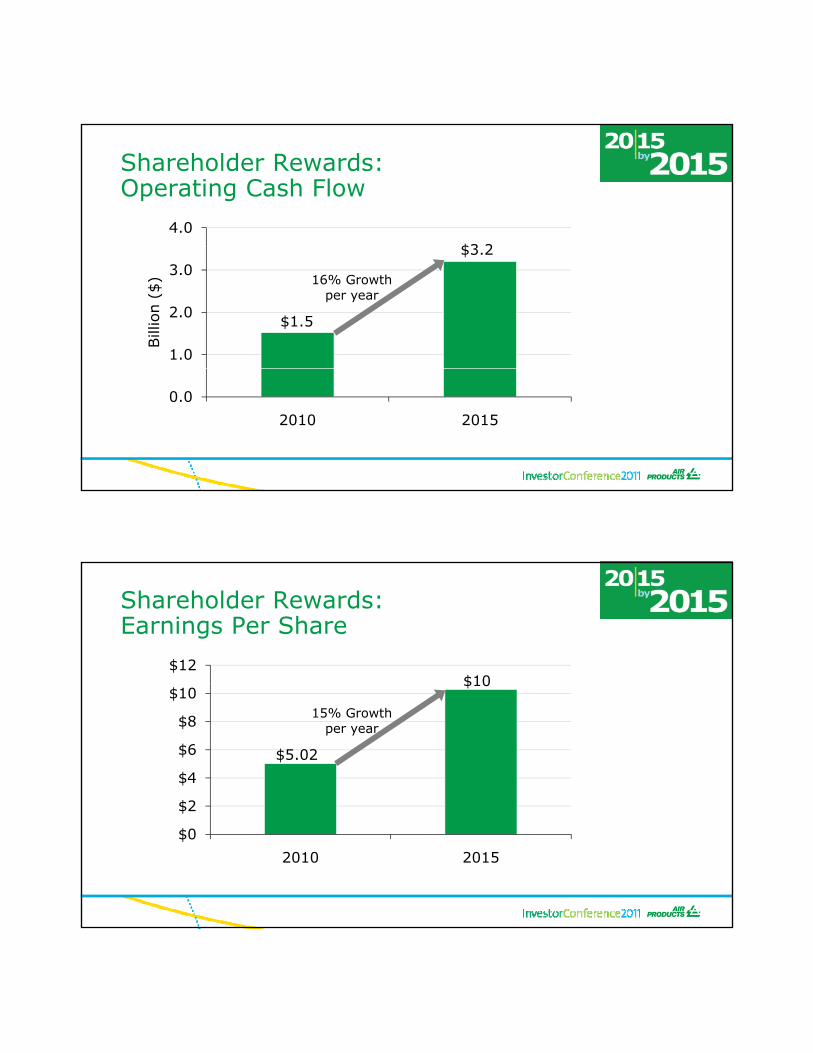
Shareholder Rewards:Operating Cash Flow
4.0
$3 2
1.0
2.0
3.0
Bill
ion (
$) 16% Growth
per year
$1.5
$3.2
0.0
2010 2015
Shareholder Rewards:Earnings Per Share
$12$10
$2
$4
$6
$8
$10
t
15% Growthper year
$5.02
$10
$0
$2
2010 2015

20152015by
$15+ Billion in Sales
20% Operating Margin
201520% Operating Margin
15% Return on Capital Employed
Thank you…tell me more

Appendix
Appendix – Non GAAP Results1) FY06-FY10 Non GAAP Operating Income/Operating Margin
($mm) FY06 FY07 FY08 FY09 FY10
Sales 7,885.0 9,148.2 10,414.5 8,256.2 9,026.0
GAAP Operating Income 1,042.0 1,375.6 1,495.8 846.3 1,389.0
Non GAAP AdjustmentsNon GAAP AdjustmentsGlobal Cost Reduction Plan 72.1 13.7 298.2Gain on Contract Settlement (36.8)Pension Settlement 10.3 26.3 8.0Donation/Sale of Cost Investment (5.0)Customer Bankruptcy and Asset Actions 32.1Acquisition - Related Costs 96.0
Total Non GAAP Adjustments 72.1 (17.8) 26.3 338.3 96.0
Non-GAAP Operating Income 1,114.1 1,357.8 1,522.1 1,184.6 1,485.0Non-GAAP Operating Margin 14.1% 14.8% 14.6% 14.3% 16.5%
2) FY10 Non GAAP Diluted EPS Continuing Ops. Attributable to Air Products
FY10 Reported EPS $4.74FY10 Acquisition - Related Costs $0.28FY10 Non GAAP EPS $5.02
3) FY11 Operating Margin and ROCE excludes Airgas acquisition related costs of $48.5mm pre-tax.

Appendix – Non GAAP Results$ Millions $ MillionsQuarter Ended Q409 Q110 Q210 Q310 Q410 Quarter Ended Q110 Q210 Q310 Q410
Numerator Reported
Operating Income Reported 345.0 340.6 336.4 367.0 Income Before Taxes 340.3 343.3 338.9 371.5
Equity Affiliate Income 26.9 32.2 32.5 35.3 Tax Expense 83.5 84.9 77.6 93.5
Earnings before tax as reported 371.9 372.8 368.9 402.3 Tax Rate Reported 24.5% 24.7% 22.9% 25.2%
Items Items
A i iti R l t d C t 0 0 23 4 37 9 34 7 O ti I
ROCE Calculation Tax Rate Calculation
Acquisition - Related Costs 0.0 23.4 37.9 34.7 Operating Income
Earnings before tax ex items 371.9 396.2 406.8 437.0 Acquisition - related costs 23.4 37.9 34.7
Effective tax rate as reported 24.5% 24.7% 22.9% 25.2% Tax Exp
Earnings after tax as reported 280.8 280.7 284.4 300.9 Acquisition - related costs 8.8 14.2 12.9
Effective tax rate ex items 24.5% 25.6% 24.4% 26.2% Ex Items
Earnings after tax ex items 280.8 294.8 307.5 322.5 Income Before Taxes 340.3 366.7 376.8 406.2Tax Expense 83.5 93.7 91.8 106.4
4 Qtr trailing AT earnings (numerator) - as reported 1,146.8 Tax Rate ex Items 24.5% 25.6% 24.4% 26.2%4 Qtr trailing AT Earnings (numerator) - ex items 1,205.6
Denominator Capital Expenditures FY10
Total Debt 4,501.5 4,418.7 4,343.4 4,188.0 4,128.3 GAAP Capital Expenditures 1,133.8 Air Products Shareholders' Equity 4,791.9 5,033.9 5,265.6 5,231.4 5,546.9 Capital lease expenditures 122.6 Noncontrolling Interest 138.1 150.2 152.7 140.5 150.7 Noncurrent liability related to purchase of
Total Capital 9,431.5 9,602.8 9,761.7 9,559.9 9,825.9 shares from noncontrolling interests 42.0
5 Qtr Average Capital (denominator) 9,636.4 Non-GAAP Capital Expenditures 1,298.4
ROCE as rptd (4 Qtr trail AT earnings / 5 pt avg capital) 11.9%
ROCE ex items (4 Qtr trail AT earnings/ 5 pt avg capital) 12.5%

Investor ConferenceInnovation, Integration and Improvement
Simon MooreDirector, Investor Relations
Forward-Looking Statements Note: This presentation contains "forward-looking statements" within the safe harbor provisions of the Private Securities Litigation Reform Act of 1995, including earnings guidance, projections and targets. These forward-looking statements are based on management's reasonable expectations and assumptions as of the date this release is issued regarding important risk factors. Actual performance and financial results may differ materially from projections and estimates expressed in the forward-looking statements because of many factors not anticipated by management, including, without limitation, slowing of global economic recovery; renewed deterioration in economic and business g, , g g y;conditions; weakening demand for the Company's products; future financial and operating performance of major customers and industries served by the Company; unanticipated contract terminations or customer cancellations or postponement of projects and sales; the success of commercial negotiations; asset impairments due to economic conditions or specific product or customer events; the impact of competitive products and pricing; interruption in ordinary sources of supply of raw materials; the ability to recover unanticipated increased energy and raw material costs from customers; costs and outcomes of litigation or regulatory activities; successful development and market acceptance of new products and applications, the ability to attract, hire and retain qualified personnel in all regions of the world where the Company operates; the effects of a natural disaster; the success of cost reduction and productivity programs and achieving anticipated acquisition synergies; the timing, impact, and other uncertainties of future acquisitions or divestitures; significant fluctuations in interest rates and foreign currencies from that currently anticipated; the continued availability of capital funding sources in all of the Company's foreign operations; the impact anticipated; the continued availability of capital funding sources in all of the Company s foreign operations; the impact of environmental, healthcare, tax or other legislation and regulations in jurisdictions in which the Company and its affiliates operate; the impact of new or changed financial accounting guidance; the timing and rate at which tax credits can be utilized and other risk factors described in the Company's Form 10K for its fiscal year ended September 30, 2010. The Company disclaims any obligation or undertaking to disseminate any updates or revisions to any forward-looking statements contained in this document to reflect any change in the Company's assumptions, beliefs or expectations or any change in events, conditions, or circumstances upon which any such forward-looking statements are based.

Time Presentation Presenter
8:30 Welcome Simon Moore
8:35 Strategy for Success John McGlade
Agenda
8:35 Strategy for SuccessCommitment to Success
John McGladePaul Huck
9:30 Q&A John McGladePaul Huck
9:50 Break
10:05 Business Presentations and Q&A Business Leaders
11:45 Presentation Wrap-up John McGlade
12:00 LunchDisplay Interaction
Management Team
1:30 End

Investor ConferenceInnovation, Integration and Improvement
Merchant Gases
Bob DixonS i Vi P id t dSenior Vice-President andGeneral Manager Merchant Gases
Winning in energy, environmentaland emerging Markets

Global Trends Accelerate Merchant Growth
Market Merchant GasesTrend Market
• Glass
• Cement
• Metals
• Oil Field Services
Merchant GasesOpportunity
Trend
• Oxygen for enrichment and oxy-fuel applications
• Proprietary burners• Nitrogen
Rising energy demand and cost
Global Trends Accelerate Merchant Growth
Market Merchant GasesTrend Market
• Water
• Recycling
• Construction
• Pollution control
Merchant GasesOpportunity• Oxygen for water
treatment• Nitrogen for grinding• Argon for insulation• Analytical gases for
emission control
TrendSustainabilitySustainability
emission control

Global Trends Accelerate Merchant Growth
TrendTrend Market Merchant GasesTrendTrend Market
• Construction
• Fabricated Products
• Food Freezing and Packaging
Merchant GasesOpportunity• Cylinder gases for
construction• Argon for welding• Nitrogen and gas
mixtures for food
Expanding Middle ClassExpanding Middle Class
Packaging
Air Products Advantage:Asia Leadership
2011-2020Forecasted Growth
ROW
Forecasted Growth in Manufacturing Output
Asia65%
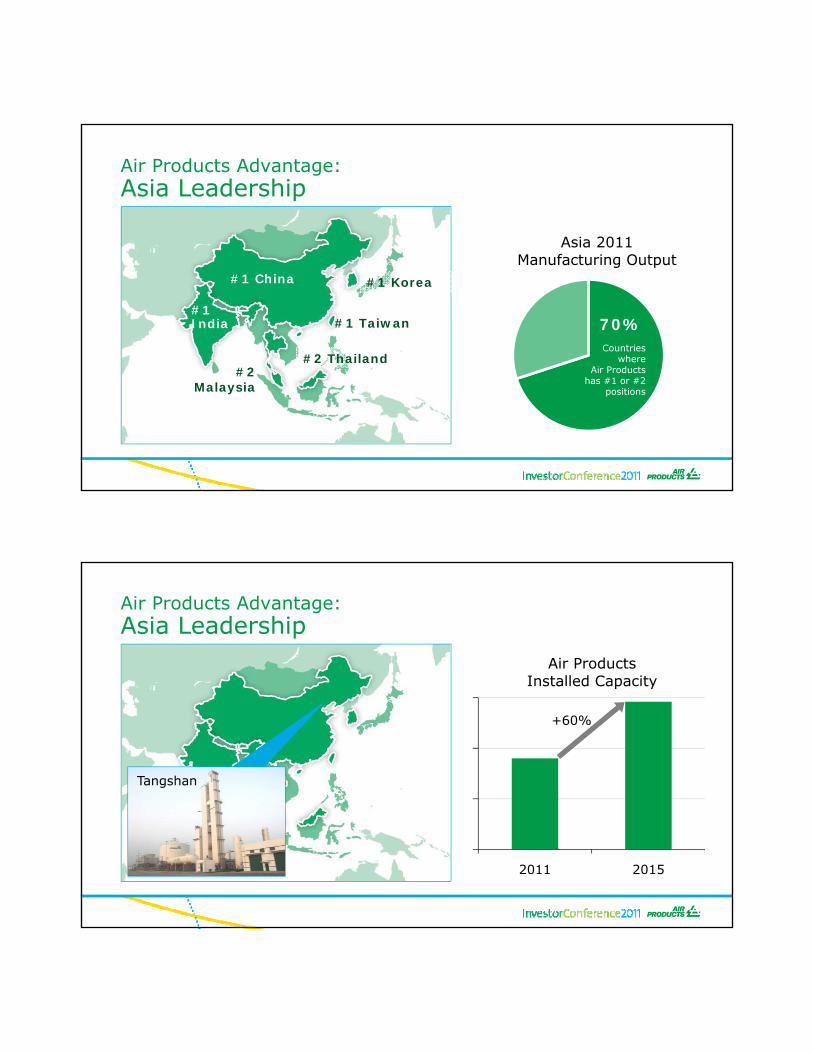
Air Products Advantage: Asia Leadership
Asia 2011 Asia 2011 Manufacturing Output
Countries where
Air Products
70%
#1 China
#1India
#1 Korea
#1 Taiwan
#2 Thailand#2 Air Products
has #1 or #2 positions
#2 Malaysia
Air Products Advantage: Asia Leadership
Air Products Installed Capacity
5000
10000
15000Installed Capacity
Tangshan
+60%
02011 2015

L200 Plant
Air Products Advantage: Asia Leadership
3 x L200in build
3x L200in
build
1st On-Stream Sept. 2011
E iExecuting on innovation, integrationand improvement Actions

Driving Profits through InnovationResponding to Market Needs
Low cost start-up food freezing solutions
Improved yield, lower emission aluminum production
Safer, more convenient welding & cutting
Freshline® QS FreezerAdvanced Low
Emission Aluminum MeltingIntegra® Cylinder
Driving Profits through InnovationBringing Supply Convenience to Customers
Vacuum Swing Adsorption (VSA)
Air ProductsPatent Pending Modular Design

Driving Profits through InnovationBringing Supply Convenience to Customers
CryoEase®
Microbulk Solutions80 cylinders Microbulk Solutions80 cylinders
80 cylinders
Integrated Industrial Gas ModelPackaged Gas
TransfillLiquifierOnsite Plant
• Full market access
• Capital leverage
• Lower supply chain costs
• Global best practices
CylinderCustomer
Liquid Customer
OnsiteCustomer
Delivers higher growth and profitability

Integrated Industrial Gas ModelProviding Real Benefits –Locally and Globally
• Full market eMerchant Gases
Fully Integrated Industrial Gases
access
• Capital leverage
• Lower supply chain costs
• Global best
Gen Gasbrings onsite to liquid customers CryoEase®
Solutions
Merchant Gases
Packaged Gases
• Global best practices
Delivers higher growth and profitability
Cylinder
LiquidOnsiteSolutions
brings liquidto cylinder customers
Success in the Past, Present and Future
La Porte new ASUOn-stream Oct 2011
Xingtai new ASUOn-stream Apr 2011
SAGA AcquisitionSAP Go Live Feb 2011

Driving Profits through Improvement
Operating Service Center Argon Recovery
Combining for a Customer Win
Industry Experts
Customer
World Class Facilities
Winning Customer Knowledge
Winning Solutions

Delivering on growth, marginand returnGoals
8 0
Merchant Gases Commitments
25
Revenue Growth Operating Margin
4.0
5.0
6.0
7.0
8.0
Bill
ion (
$) 10% to 13%
per year
$3.7 15
20
25
Perc
ent
21% to 24%by 2015
19.6%
2.0
3.0
2010 2015
10
2010 2015

A Strategy for Success
Winning in energy, environmentaland emerging Markets
Executing
Delivering
Markets
on revenue, margin
G l
on innovation, integrationand improvement Actions
e e g
Generating Shareholder Value
and return Goals
A Strategy for Success
Winning • Strong market fundamentals• Positioned in the right geographies
Executing
Delivering
• Customer solutions• Lower cost supply• Driving productivity
• 2015 goalse e g
Generating Shareholder Value

Thank you…tell me more

Investor ConferenceInnovation, Integration and Improvement
Tonnage Gases, Equipment and Energy
Steve JonesS i Vi P id t d G l MSenior Vice-President and General ManagerTonnage Gases, Equipment and Energy
Winning in energy, environmentaland emerging Markets

Global Trends Accelerate Growth
MarketTrend TGEEMarket
• Refining
• Coal Based Chemicals and Power
N t l G
• Hydrogen• Oxygen• LNG
Trend
Increasing Energy Demand• Higher Refinery Yields• Use of Heavier Crude Oil• Use of Alternative Feedstocks
TGEEOpportunity
• Natural Gas
Global Trends Accelerate Growth
MarketTrend TGEE
• Clean Coal
• Natural Gas
• Power
• H2 Economy
• Oxygen• LNG• Energy
Solutions
MarketTrend
Sustainability• Lower GHG footprint• Plant efficiencies
TGEEOpportunity
2 y

Global Trends Accelerate Growth
MarketTrend TGEE
Emerging Markets
• Economic Growth
• Infrastructure
• Use of Indigenous Energy
• Steel
• Refining
• Coal Based Chemicals and Power
• Oxygen• Hydrogen
MarketTrend TGEEOpportunity
Hydrogen Capacity
Geographies Are Expandingover the Next Decade…
12
BSCFD
4
6
8
10
0
2
NAFTA LASA Europe Middle East
Asia
20102020

1,400
Geographies Are Expandingover the Next Decade…
s)
Oxygen Capacity
400
600
800
1,000
1,200
per
Day
(Thousa
nds
0
200
Tons
p
NAFTA LASA Europe Middle East
Asia
2010
2020
Geographies Are Expandingover the Next Decade…
H2: MonsantoLuling, Louisiana
O2: Xingtai SteelHebei, China
H2: ExxonMobilRotterdam,
The Netherlands
H2: PetroChinaSichuan, China
ASULaPorte, Texas
O2: PCECShaanxi, China
H2: USGCPipeline Connection
O2: Arcelor MittalGent, Belgium
Additional Active Bidding: LASA, Middle East, India, C/E Europe

E iExecuting on innovation, integrationand improvement Actions
Innovation Drives Hydrogen Business and Global Leadership
• Pioneered new 2.5
FD)
business model fromSOE to SOG
• Technip alliance
• Maintaining 40+% market share 0.5
1.0
1.5
2.0
r Pro
duct
s H
2(B
SCF
market share
0.0
1990 1994 1998 2002 2006 2010
Air

Innovation in LNG: Reshape Markets andServe Emerging Needs• Full range of process
options: from peak shavers options: from peak-shavers to mega-trains
• Mid-size plant under construction in China
• Technology of choice for emerging floating LNG emerging floating LNG market
World’s leading provider of LNG technology
Innovation: Responding to Market Needs
Alternative Fuel
Carbon Capture and Storage
Ion TransportMembrane
Energy from Waste

Integrated Solutions to Winin Growing Markets Globally
PetroChina - Sichuan, China
• Focus on integrated solutions• Pipeline franchises in key locations globally• Growth with key customers
Integrated Gulf Coast Pipeline Drives Efficiencyand Reliability
• >1 billion SCFD of capacityp y
• >20 operating plants
• >600 miles of pipeline
• On-stream 2012
Enhances leadership position in world’s largest refining market

Improvement in Large ASU DeliveringLow Cost and New Business Globally
100
120
x >50%
40
60
80
100
pital
Cost
Index 50%
Savings
0
20
2009 2010 2012 2015
Cap
0.98
1.00
Dedicated to Hydrogen Plant Efficiency Improvement
ndex
0.90
0.92
0.94
0.96
0.98
Pla
nt
Eff
icie
ncy
In
0.88
1993 1995 1997 1999 2001 2003 2005 2007 2009 2011 2013 2015
P
Delivering results in the past and future
Delivering on revenue, marginand returnGoals
6 0
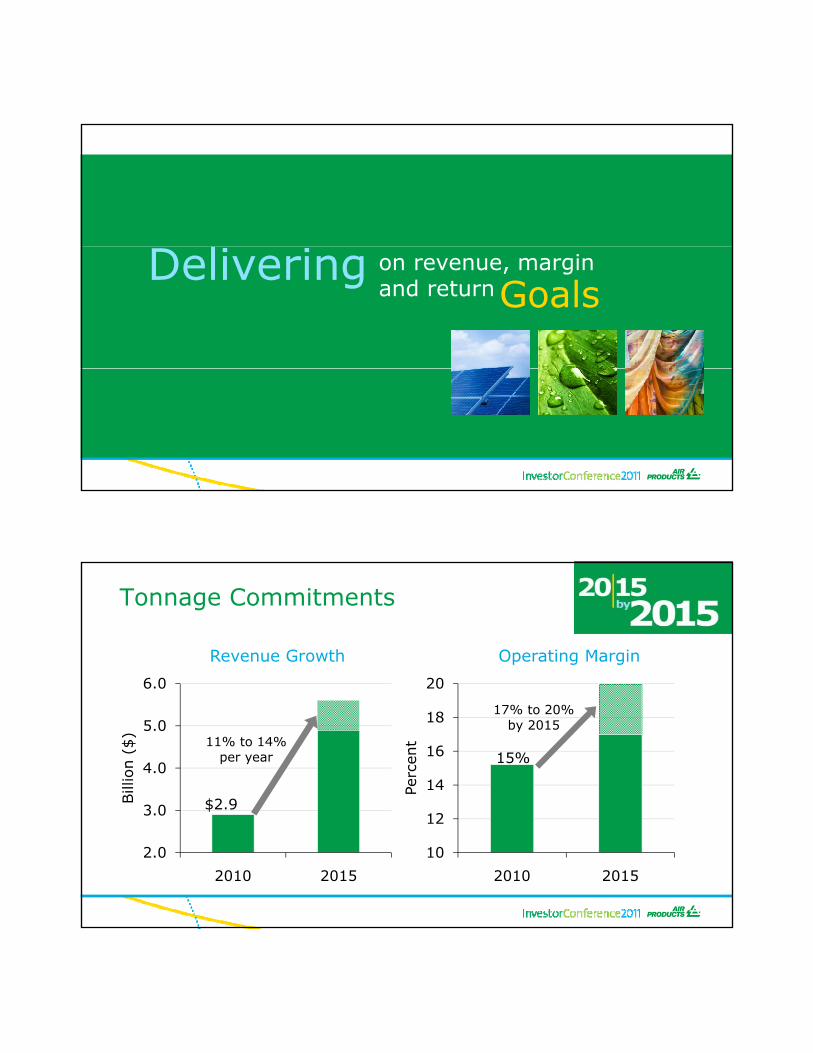
Tonnage Commitments
20
Revenue Growth Operating Margin
3 0
4.0
5.0
6.0
Bill
ion (
$) 11% to 14%
per year
$2 914
16
18
20
Perc
ent
17% to 20%by 2015
15%
2.0
3.0
2010 2015
$2.9
10
12
2010 2015
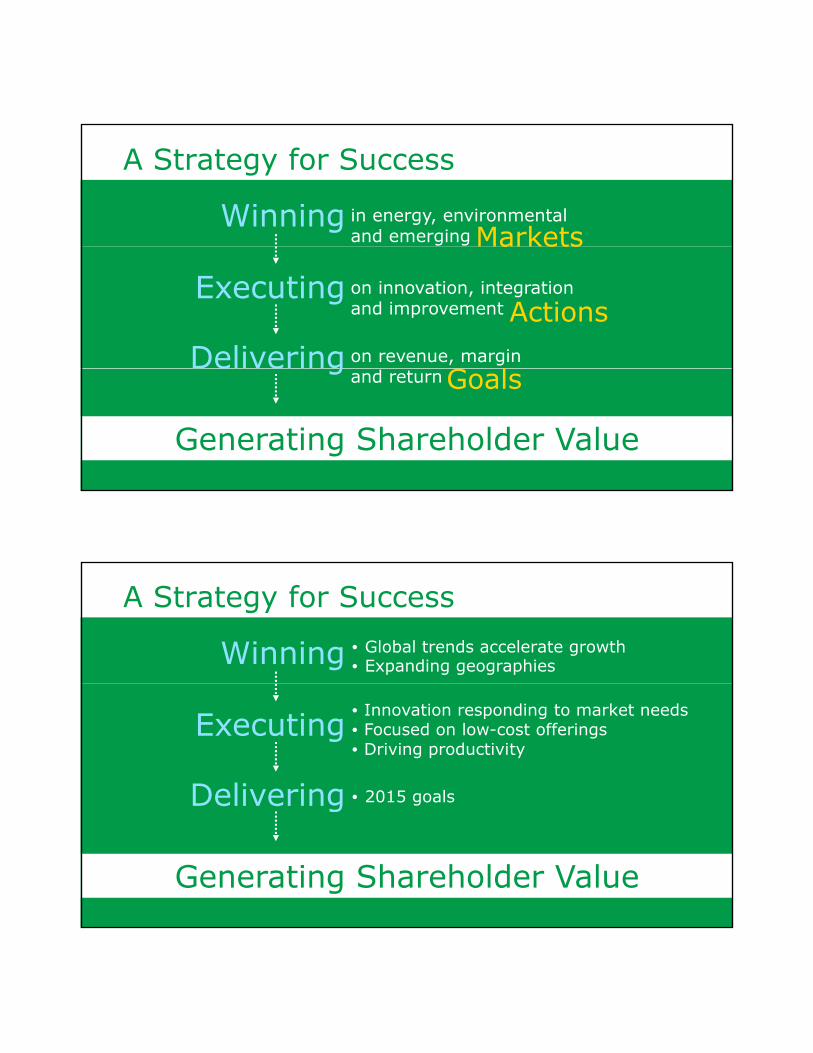
A Strategy for Success
Winning in energy, environmentaland emerging Markets
Executing
Delivering
Markets
on revenue, margin
G l
on innovation, integrationand improvement Actions
e e g
Generating Shareholder Value
and return Goals
A Strategy for Success
Winning • Global trends accelerate growth• Expanding geographies
Executing
Delivering
• Innovation responding to market needs• Focused on low-cost offerings• Driving productivity
• 2015 goalse e g
Generating Shareholder Value

Thank you…tell me more

Investor ConferenceInnovation, Integration and Improvement
Electronics
Corning PainterVi P id t d G l MVice-President and General Manager
Global Electronics
Winning in energy, environmentaland emerging Markets

Global Trends Accelerate Electronics Growth
MarketTrend Electronics
• Integrated Circuit
• Display
• Mobile Revolution • Cloud Computing• Expanding Middle Class • Gases and
Materials
• Equipment
• Services
Opportunity
MarketTrend Electronics
Global Trends Accelerate Electronics Growth
Opportunity• Photovoltaic
• LED
• Increasing Energy Demand• Sustainability
• Gases and Materials
• Equipment

Winning in the Marketplace
Air Products RevenueSemiconductor Capital Spending
Other Customers(> 1000) Customer A
Customer B
Customer C
Other
Intel
Samsung
Strategic Accounts(< 50)
Customer C
tsmc
2011 Top 10 Outlook 2010
The Partner of Choice What customers want
Scale and low cost
What we provide
• Basic manufacturing• Scale
Result
• Strong market andcost position
Technical leadershipCollaboration
Reliability
• Lean 6 Sigma
• Enabling materials• Joint development
• Supply chain excellence• Robust quality systems• Continuous Improvement
• New product pipeline• Value-added products• Rapid adoption
• Secure position with industry leaders
• Stronger growth
Partnership position with industry leaders
p
E iExecuting on innovation, integrationand improvement Actions
20000000
25000000
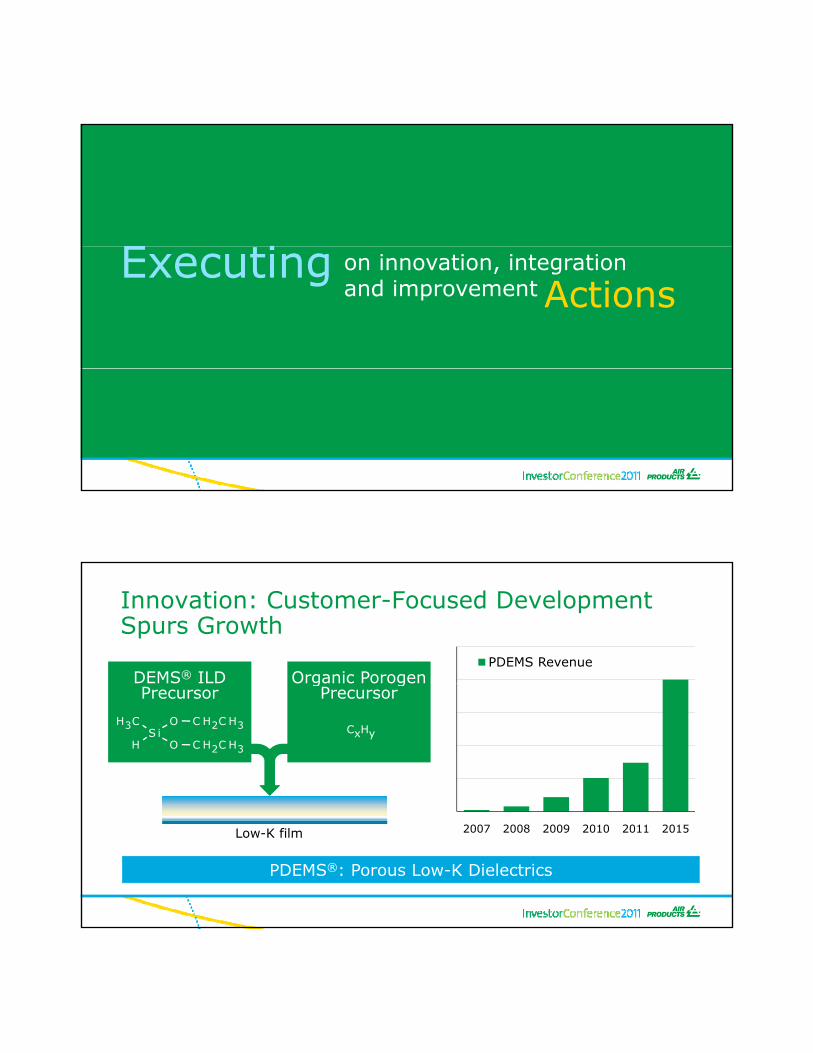
PDEMS Revenue
Innovation: Customer-Focused Development Spurs Growth
DEMS® ILD Organic Porogen
5000000
10000000
15000000
Precursor
S iH3C
H
O
O
C H2C H3
C H2C H3
g gPrecursor
CxHy
0
2007 2008 2009 2010 2011 2015
PDEMS®: Porous Low-K Dielectrics
Low-K film
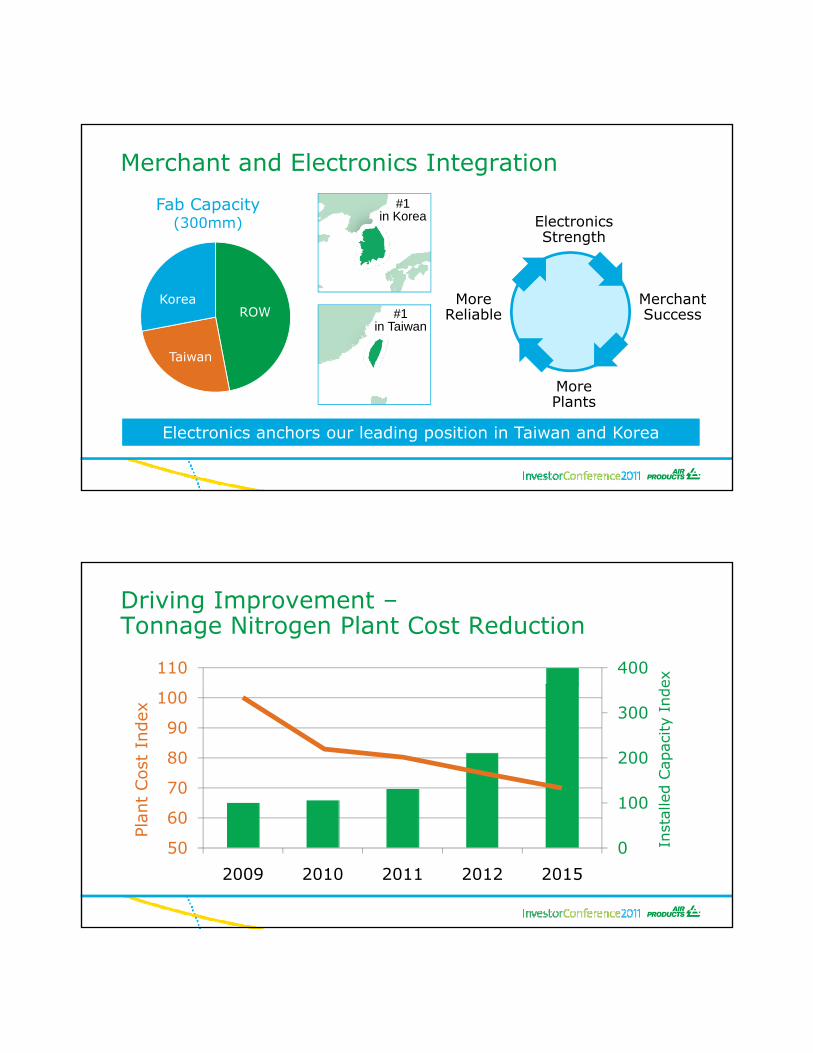
Merchant and Electronics Integration
#1in Korea
Fab Capacity(300mm) Electronics
Strength
#1in Taiwan
ROW
Taiwan
Korea MoreReliable
MerchantSuccess
Electronics anchors our leading position in Taiwan and Korea
MorePlants
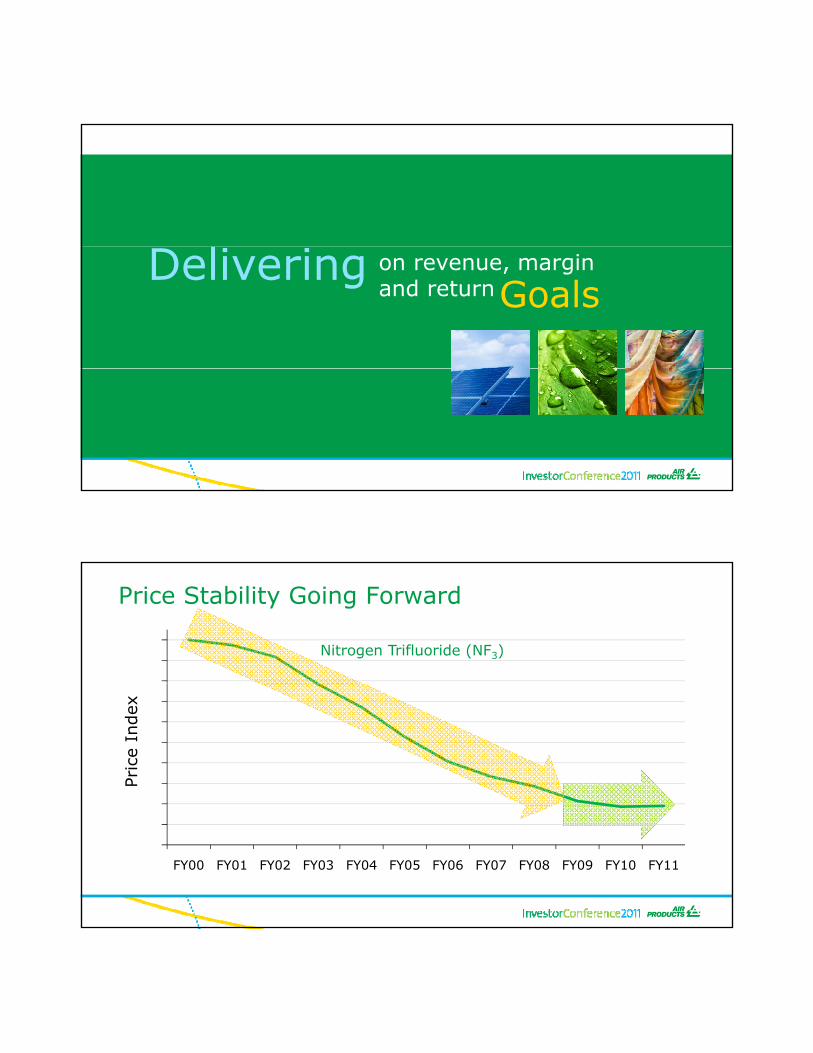
Driving Improvement –Tonnage Nitrogen Plant Cost Reduction
400110ex
100
200
300
70
80
90
100
led C
apac
ity
Inde
nt
Cost
Index
0
100
50
60
2009 2010 2011 2012 2015
Inst
al
Plan
Delivering on revenue, marginand returnGoals
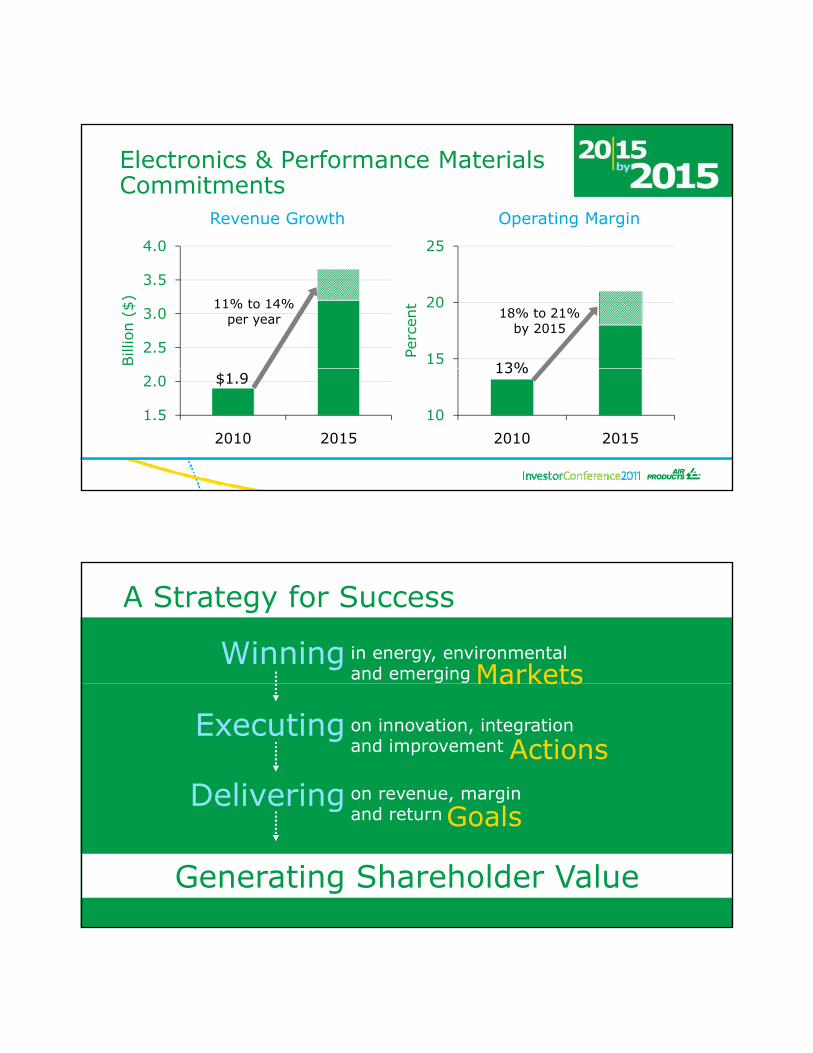
160 180 200
Price Stability Going Forward
Nitrogen Trifluoride (NF3)
40 60 80
100 120 140 160
Price
Index
-20 40
FY00 FY01 FY02 FY03 FY04 FY05 FY06 FY07 FY08 FY09 FY10 FY11
4 0
Electronics & Performance MaterialsCommitments
25
Revenue Growth Operating Margin
2.5
3.0
3.5
4.0
Bill
ion (
$) 11% to 14%
per year
15
20
25
Perc
ent
18% to 21%by 2015
13%
1.5
2.0
2010 2015
$1.9
10
2010 2015
13%
A Strategy for Success
Winning in energy, environmentaland emerging Markets
Executing
Delivering
Markets
on revenue, margin
G l
on innovation, integrationand improvement Actions
e e g
Generating Shareholder Value
and return Goals

A Strategy for Success
Winning • Partner to Industry Leaders
Executing
Delivering
• Innovative materials• Cost leadership• Emerging markets
• 2015 goalse e g
Generating Shareholder Value
Thank you…tell me more

Investor ConferenceInnovation, Integration and Improvement
Strategy for Success
John McGladeh d dChairman, President and CEO
20152015by
$15+ Billion in Sales
20% Operating Margin
201520% Operating Margin
15% Return on Capital Employed

A Strategy for Success
Winning in energy, environmentaland emerging Markets
Executing
Delivering
Markets
on revenue, margin
G l
on innovation, integrationand improvement Actions
e e g
Generating Shareholder Value
and return Goals
Thank you…tell me more

Investor ConferenceInnovation, Integration and Improvement
Simon MooreDirector, Investor Relations
Time Presentation Presenter
8:30 Welcome Simon Moore
8:35 Strategy for Success John McGlade
Agenda
8:35 Strategy for SuccessCommitment to Success
John McGladePaul Huck
9:30 Q&A John McGladePaul Huck
9:50 Break
10:05 Business Presentations and Q&A Business Leaders
11:45 Presentation Wrap-up John McGlade
12:00 LunchDisplay Interaction
Management Team
1:30 End

Today’s Display Sessions
Debbie McCulloughVice PresidentGl b l E i i
John MarslandSr. Vice PresidentS ppl Chain
How do we win in our target markets?Delivering low-cost facilities
Global Engineering Supply Chainfacilities
How do we win in our target markets?Integrated project development
Jeff ByrneVice President and Gen. Mgr.Tonnage Gases
C.S. SawVice PresidentLiquid Bulk Asia
Corning Painter Vice President and Gen. Mgr. Global Electronics
Monty Alger Vice President andChief Technology Officer
How do we develop new electronics materials?
Today’s Display Sessions How do we grow through innovation?CryoEase®
Microbulk
Nelson SquiresVice PresidentN.A. Merchant Gases
Ivo BolsVice President and Gen. Mgr.Merchant
Jeff Kramer Vice President and Gen. Mgr. Microbulk
SolutionsGases Asia Packaged Gases
How do we manage a pipeline network and keep improving returns?
Joe PietrantonioVice PresidentGlobal Operations
Wilbur MokVice PresidentN.A. Tonnage Gases
How do our Performance Materials provide a competitive advantage?
Pam MattimoreVice President and Gen. Mgr. Performance Materials
George BittoVice President and Treasurer