investor lunch, new york – 3 march 2006 ahuja managing director, india gustav bard managing...
TRANSCRIPT

1
Investor lunch, New York – 3 March 2006
2
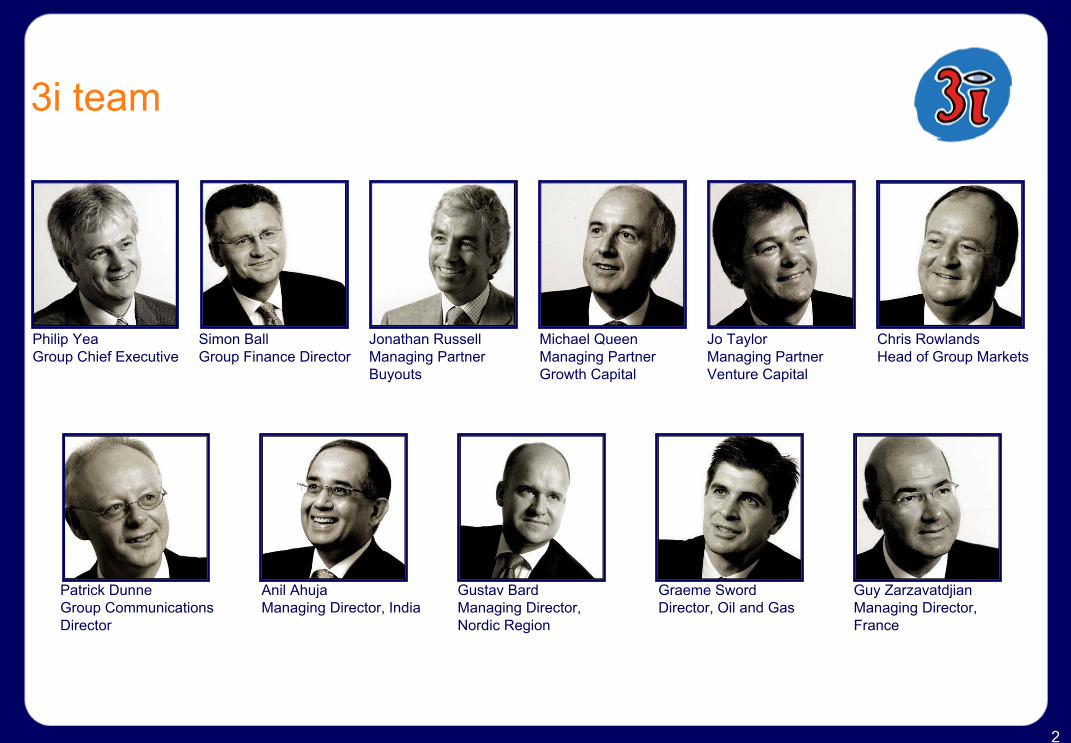
3i team
Philip YeaGroup Chief Executive
Simon BallGroup Finance Director
Jonathan RussellManaging Partner Buyouts
Michael QueenManaging Partner Growth Capital
Jo TaylorManaging Partner Venture Capital
Chris RowlandsHead of Group Markets
Graeme SwordDirector, Oil and Gas
Guy ZarzavatdjianManaging Director,France
Anil AhujaManaging Director, India
Gustav BardManaging Director,Nordic Region
Patrick DunneGroup Communications Director

3
Investor lunch, New York – 3 March 2006
Contents
• Introduction to 3i
• The private equity market
• Interim results to 30 September 2005
• Investor relations
• Closing remarks
4
Investor lunch, New York – 3 March 2006Introduction to 3i
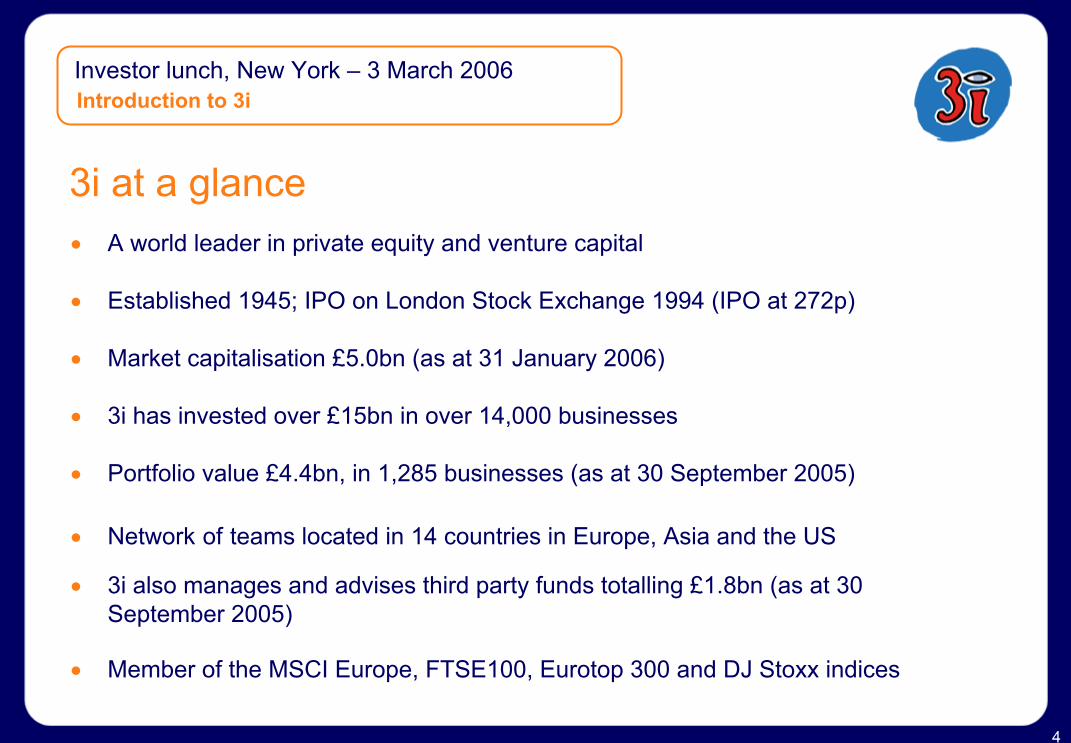
3i at a glance• A world leader in private equity and venture capital
• Established 1945; IPO on London Stock Exchange 1994 (IPO at 272p)
• Market capitalisation £5.0bn (as at 31 January 2006)
• 3i has invested over £15bn in over 14,000 businesses
• Portfolio value £4.4bn, in 1,285 businesses (as at 30 September 2005)
• Network of teams located in 14 countries in Europe, Asia and the US
• 3i also manages and advises third party funds totalling £1.8bn (as at 30 September 2005)
• Member of the MSCI Europe, FTSE100, Eurotop 300 and DJ Stoxx indices
5
Investor lunch, New York – 3 March 2006Introduction to 3i
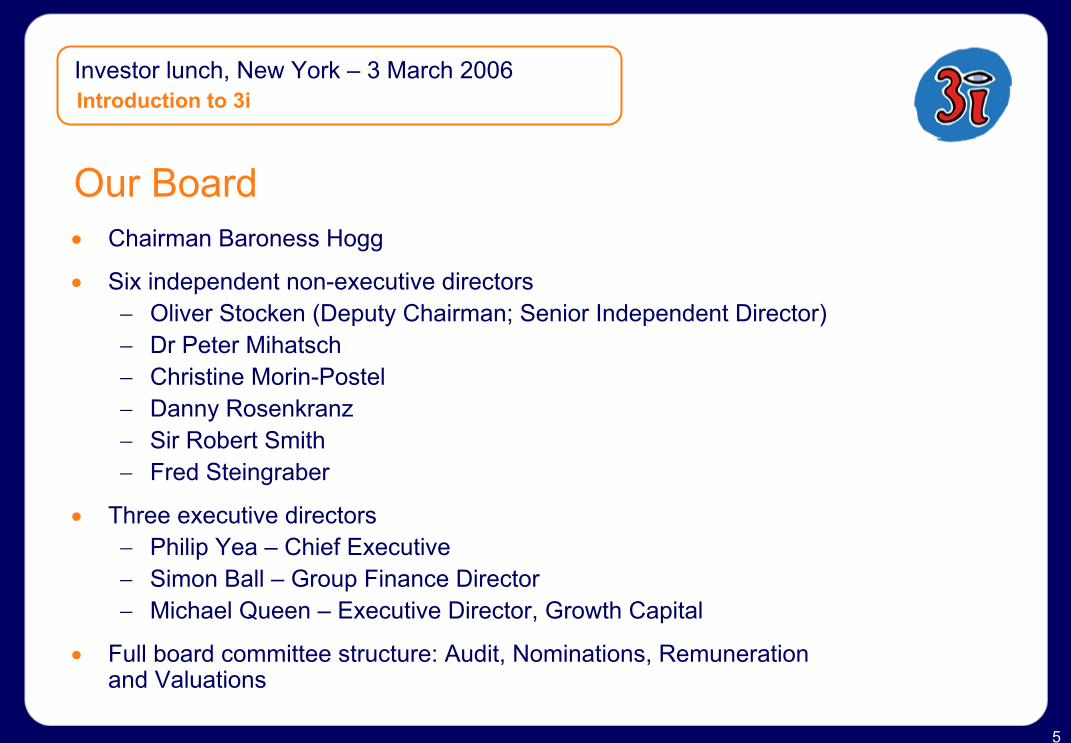
Our Board • Chairman Baroness Hogg
• Six independent non-executive directors − Oliver Stocken (Deputy Chairman; Senior Independent Director)− Dr Peter Mihatsch− Christine Morin-Postel− Danny Rosenkranz− Sir Robert Smith− Fred Steingraber
• Three executive directors− Philip Yea – Chief Executive− Simon Ball – Group Finance Director− Michael Queen – Executive Director, Growth Capital
• Full board committee structure: Audit, Nominations, Remunerationand Valuations
6
Investor lunch, New York – 3 March 2006Introduction to 3i
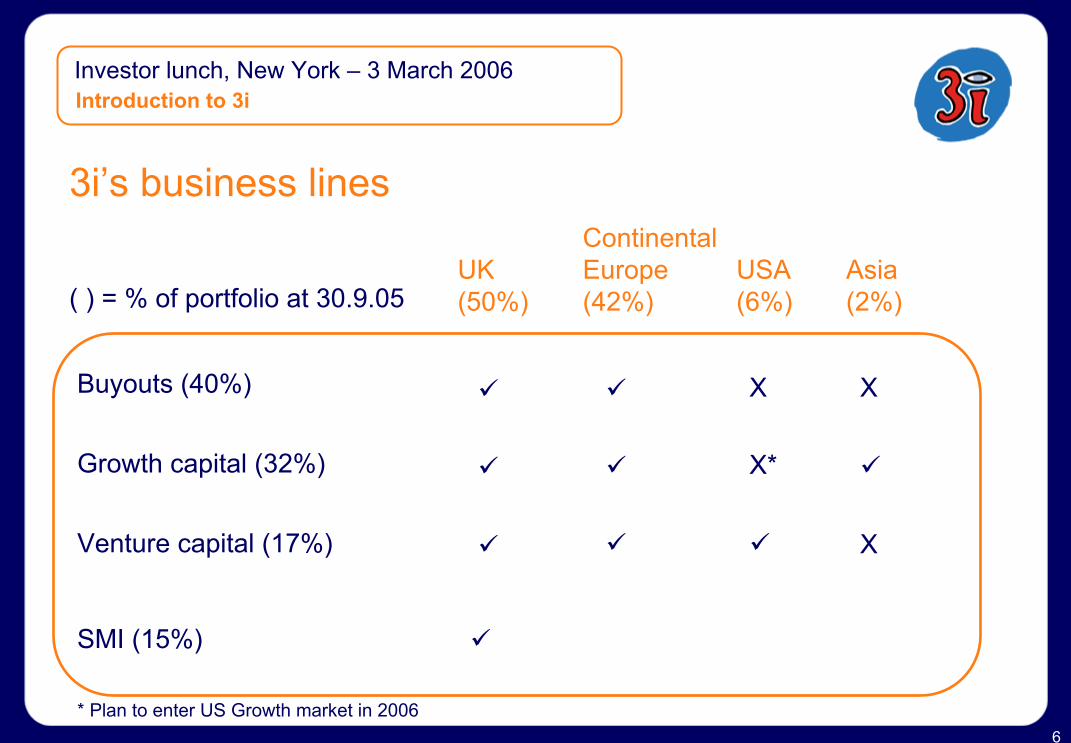
3i’s business linesContinental Europe (42%)
UK (50%)
USA (6%)
Asia(2%)( ) = % of portfolio at 30.9.05
Buyouts (40%)
Growth capital (32%)
Venture capital (17%)
SMI (15%)
* Plan to enter US Growth market in 2006
X
X*
X
X

7
Investor lunch, New York – 3 March 2006Introduction to 3i
Buyouts• Nature of investment
− Established businesses− Involves change of ownership, majority stake− Use of leverage
• Deal range− Up to €1bn− Investment size – up to €150m
• Target characteristics− Local relationship significant− Operational issues vital− Less competitive situations (non-price issues)− Exit via consolidation/strategic purchaser
• Buy local, sell global

8
Investor lunch, New York – 3 March 2006
Record profit:3i sells YBR Group for €1.8bn and generates 4.2x money multiple, 110% IRR and circa €600m proceeds3i has sold its stake in European telephone directories business Yellow Brick Road (YBR) to a consortium led by Australia’s Macquarie Capital Alliance.
Introduction to 3i
“A 110% IRR is great news and a terrific example of creating value for 3i Group, the investors in our Buyout fund and of course the management team who have done an excellent job.”
Jonathan Russell, 3i’s head of Buyouts
“3i was uniquely placed to achieve this. I can’t think of anyone else who could have had the market access to make the original investment in Fonecta, De Telefoongidsand Mediatel and the the ability to put them together so successfully.”
Gary List, Chairman, YBR
“Creating such a unique and valuable business over the last few years would not have been possible without a great management team, the shareholder’s media expertise and our international network. We wish the management and Macquarie well in taking the business forwards to its next stage of growth”
Crevan O’Grady, 3i’s head of Media
9
Investor lunch, New York – 3 March 2006Introduction to 3i
Benefiting from knowledge-based investing
• The origins of YBR date back to 1997, when 3i backed Gary List to buyout Thomson Directories, the UK’s second largest operator, in a €133m buyout that turned 3i’s original €38m into nearly €200m – more than five times the original investment. We identified the yellow pages sector as a promising sector, at a time when the telecoms bubble had just burst and operators were offloading their directories businesses
Buyouts – Yellow Brick Road
• In 2002 we bought Fonecta for €112m. 3i’s Finnish venture capital team’s relationship with telecoms group Sonera provided the inside track, whilst our Thomson Directories experience gave us the credibility. In 2003, 3i and VSS then led further buyouts, alongside new management teams, of De Telefoongids (€500m) from KPN in the Netherlands and Mediatel(€270m) in Austria and central Europe from Verizon Inc. Gary List joined the Board of De Telefoongids
Capitalising on local relationships
Strong performance through operational improvement
• Benefiting from the Thomson experience, 3i supported management in driving through cost savings (especially in printing), developing electronic media, improving sales efficiency and taking advantage of the fast growing eastern European markets. 3i were actively involved in implementing +15 smaller bolt-on acquisitions, especially in Finland. Earnings grew from a pro-forma €126m in 2002 to €160m in 2005. Cash flow was particularly strong with +€400m generated over the course of three years
A truly pan-European strategy:Merger and Recap
• In 2004, working with advisers and management from 17 different nationalities, we merged Fonecta, De Telefoongids and Mediatel to form YBR, a leading, fast growing, diversified European Directory player with an enhanced strategic value beyond the limits of the individual country operations. We brought back Gary List to act as chairman and help drive through a number of organisational changes. A refinancing of the combined group raised €1bn of new debt and delivered cash returns for 3i of €224m (a cash-to-cash multiple of 1.5x)

10
Investor lunch, New York – 3 March 2006Introduction to 3i
Buyouts – value creationBuying well
Performance improvement
Complex processes
Platform deals
Market opportunity
Valuecreation
11
Investor lunch, New York – 3 March 2006
Growth Capital• Nature of investment
− Established private (often family-owned) regional businesses− Minority stake (alignment of interests)− To fund growth or acquisition or allow private placing− Use of leverage (often)
• Deal range− Investment size €10m-€100m, average c€30m
• Characteristics− Attractive yields− Diversity – sector, size and situation− International angle− Wider spectrum of the risk and return profile
• Infrastructure
Introduction to 3i

12
Investor lunch, New York – 3 March 2006
Growth Capital – Petrofac• 3i invested £22m/$40m for a 16.2% stake in May 2002
• 3i reinforced the balance sheet during a period of rapid growth
• 3i introduced CFO and Independent Director
• 3i also identified RGIT Montrose - acquired in February 2004
• Company transformed
• £742m IPO of Petrofac in October 20053i realised £120m (money multiple of 5.3, IRR of 67%)
Introduction to 3i

13
Investor lunch, New York – 3 March 2006Introduction to 3i
Venture Capital• Nature of investment
− Start-up or early stage technology or life sciences− Minority stakes− Syndicate of venture investors− Funding of development/research expenditure through series of ‘rounds’
• Deal range− First time investments of €2m- €10m
• Characteristics− Critical mass teams in key locations (e.g. Cambridge, Silicon Valley)− Sector focus (software, communications, healthcare, ESAT)− Strong relationships with key corporates− Global/international knowledge and contact sharing
14
Investor lunch, New York – 3 March 2006Introduction to 3i
Venture Capital – creating value• 3i invested £11m for a c.30% stake in 2004
• Added value: board building, corporate relationships and exit insight
• Revenues grown to $24m in 2005
• Sale of test and measurement business to Aeroflex in May 2005 for $84m
• Sale of retained business to Cambridge Silicon Radio for $48m in July 2005 following 3i introduction
• 3i realised £30m including £4m deferred (90% IRR in 18 months)
15
Investor lunch, New York – 3 March 2006Introduction to 3i
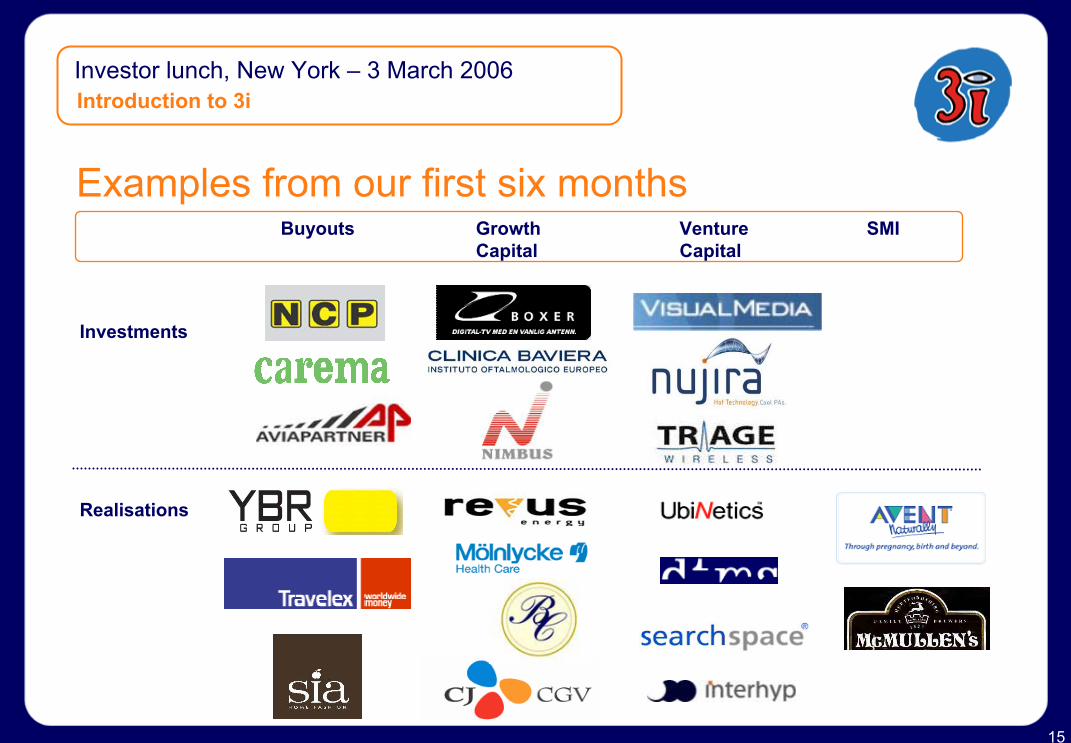
Examples from our first six monthsBuyouts Growth
CapitalVenture Capital
SMI
Investments
Realisations
16
Investor lunch, New York – 3 March 2006Introduction to 3i
Vision3i shall be the private equity firm of choice
• Operating on a world-wide scale
• Producing consistent market beating returns
• Acknowledged for our partnership style
• Winning through our unparalleled resources
17
Investor lunch, New York – 3 March 2006Introduction to 3i
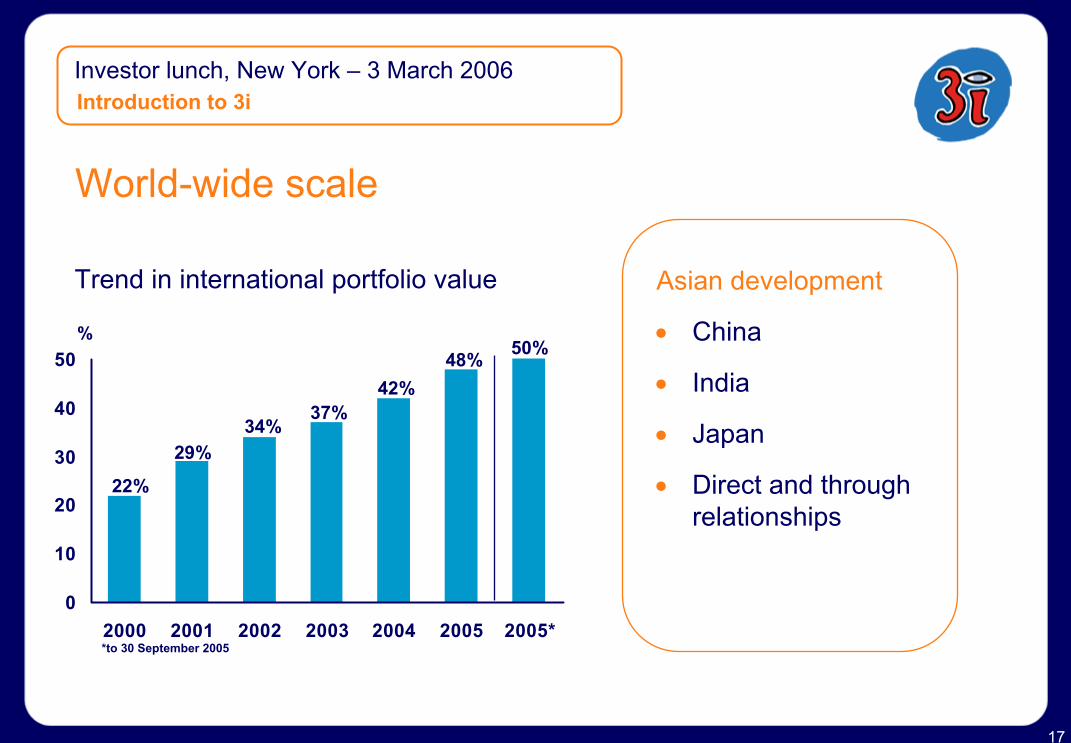
World-wide scale
Asian development
• China
• India
• Japan
• Direct and through relationships
0
10
20
30
40
50
2000 2001 2002 2003 2004 2005 2005*
%
*to 30 September 2005
22%
29%34%
37%42%
48%
Trend in international portfolio value
50%

18
Investor lunch, New York – 3 March 2006Introduction to 3i
Model changed since 2002
0
50
100
150200
250
300
350
2000 2001 2002 2003 2004 20050
500
1000
1500
2000
2500
3000
2000 2001 2002 2003 2004 2005 2005*
Number of portfolio companies
2874 2759
2162
2606
1878
1285
676
609
SMI
SMI
*to 30 September 2005
SMI
1502
Number of new investments

19
Investor lunch, New York – 3 March 2006Introduction to 3i
Producing consistent market returns
BuyoutsGrowth CapitalVenture Capital
20%20%35%
Cash to cash% returns pa
Vintage year volatility
Cycle volatility
+/- 10+/- 7+/- 20
+/- 5+/- 3+/- 10
Goals

20
Investor lunch, New York – 3 March 2006The private equity market
Drivers of increased activity
• Stock market conditions
• Market dynamics (eg single European market)
• M&A activity levels
• Restructuring
• Entrepreneurial culture
• Regulatory factors
• Technological developments and expenditure on IT
• Succession issues (especially in family-owned businesses)
21
Investor lunch, New York – 3 March 2006The private equity market
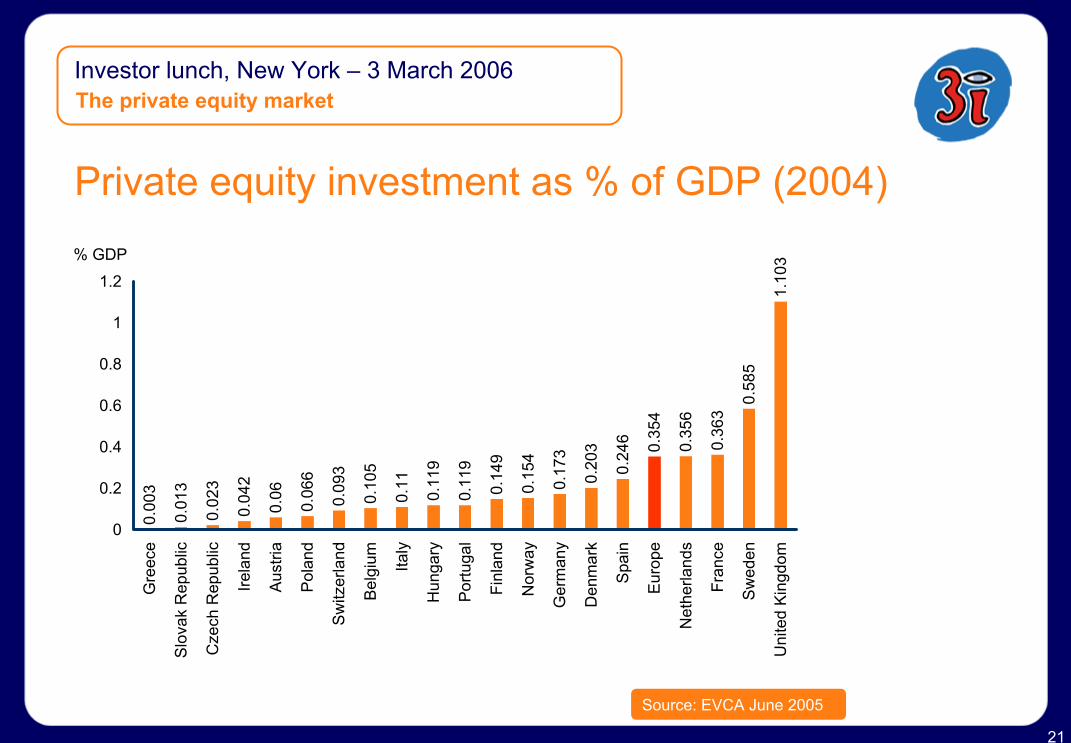
Private equity investment as % of GDP (2004)0.
003
0.01
3
0.02
3
0.04
2
0.06
0.06
6
0.09
3
0.10
5
0.11
0.11
9
0.11
9
0.14
9
0.15
4
0.17
3
0.20
3
0.24
6 0.35
4
0.35
6
0.36
3
0.58
5
1.10
3
0
0.2
0.4
0.6
0.8
1
1.2
Gre
ece
Slo
vak
Rep
ublic
Cze
ch R
epub
lic
Irela
nd
Aus
tria
Pol
and
Sw
itzer
land
Bel
gium Ita
ly
Hun
gary
Por
tuga
l
Finl
and
Nor
way
Ger
man
y
Den
mar
k
Spa
in
Eur
ope
Net
herla
nds
Fran
ce
Sw
eden
Uni
ted
Kin
gdom
% GDP
Source: EVCA June 2005
22
Investor lunch, New York – 3 March 2006The private equity market
Structural change
• Large corporates focusing on core activities
• Decline in European manufacturing
• Sector consolidation
• The Asia effect
• Capital squeeze

23
Investor lunch, New York – 3 March 2006The private equity market
Generating returns
Historically TodayAccess to management
PE arbitrage
Inflation
Margin enhancement
Leverage
Acquisition
Complexity
Organic growth
X
X
X
X

24
Investor lunch, New York – 3 March 2006Interim results to 30 September 2005
Financial performance highlights
• Total return £447m £224m
• Return on opening shareholders’ funds 12.1% 6.8%− Interim dividend 5.5p 5.3p
• Net asset value per share 677p 574p
• Realisation proceeds £1,041m £603m− including co-investment funds £1,363m £792m
• Realised profits on disposal £189m £89m
• New investment £706m £422m− including co-investment funds £835m £521m
2005/061st half
2004/05*1st half
*as restated
25
Investor lunch, New York – 3 March 2006Interim results to 30 September 2005
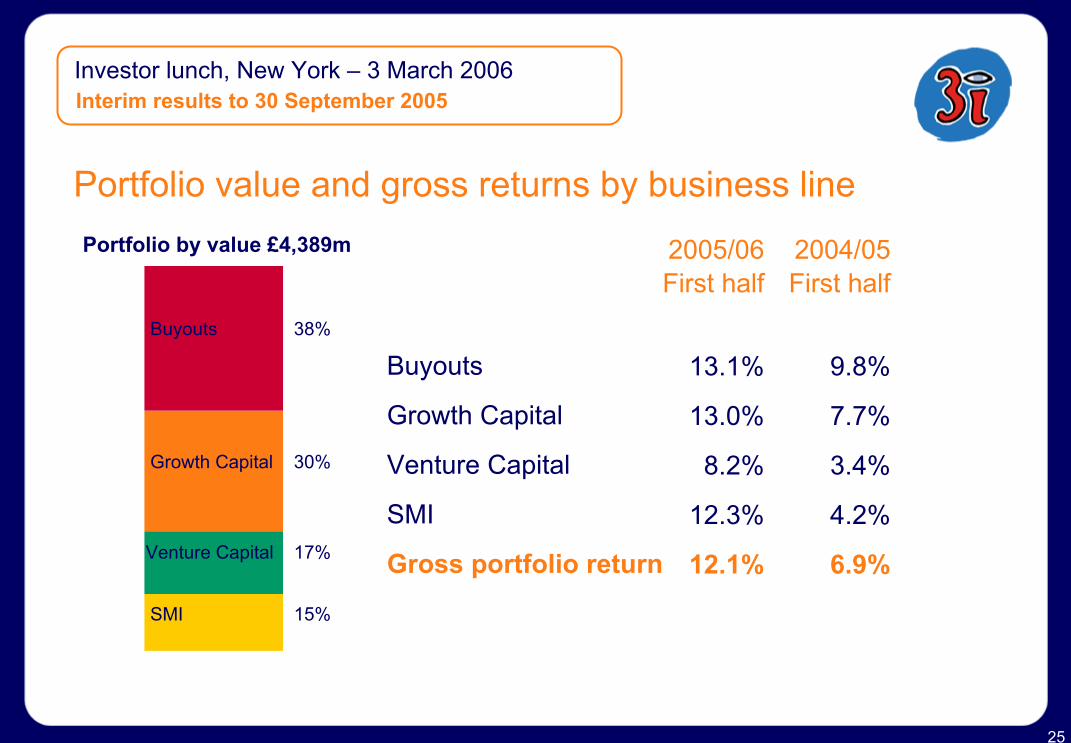
Portfolio value and gross returns by business linePortfolio by value £4,389m
Buyouts
Growth Capital
Venture Capital
SMI
38%
30%
17%
15%
Buyouts
Growth Capital
Venture Capital
SMI
Gross portfolio return
2004/05First half
9.8%
7.7%
3.4%
4.2%
6.9%
2005/06First half
13.1%
13.0%
8.2%
12.3%
12.1%

26
Investor lunch, New York – 3 March 2006Interim results to 30 September 2005
2004/05First half
(as restated)£m
Gross portfolio return 2005/06First half
£m
Realised profits on disposal of investmentsUnrealised profits on revaluation of investmentsPortfolio incomeGross portfolio return
BuyoutsGrowth CapitalVenture CapitalSMIGross portfolio return
189223109521
199168
6193
521
12%
13%13%
8%12%
8986
126301
145932340
301
10%8%3%4%
7%

27
Investor lunch, New York – 3 March 2006Interim results to 30 September 2005
Gross portfolio returnFund management fee incomeNet carried interest & investment performance plansOperating expenses & share-based paymentsNet portfolio returnNet interest payableExchange movementsMovement in the fair value of derivativesOtherProfit after taxRevaluation gain/lossesTotal recognised income and expenseDividend
2005/06First half
£m
30114
(24)(83)208(25)32
9(1)
2231
2245.3p
5211531
(96)471(12)35
(33)1
462(15)447
5.5p
12%
11%
Net portfolio and total return
12.1%
2004/05First half
(as restated)£m
7%
5%
6.8%
28
Investor lunch, New York – 3 March 2006Interim results to 30 September 2005
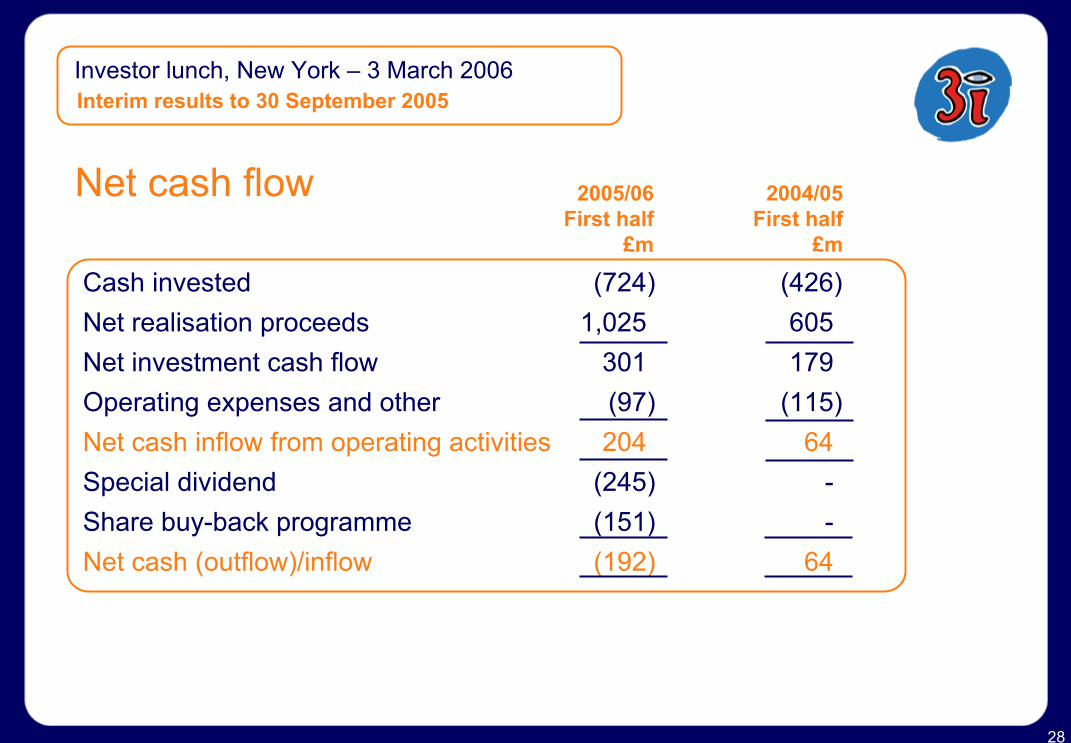
Net cash flow
Cash invested (724) (426)Net realisation proceeds 1,025 605Net investment cash flow 301 179Operating expenses and other (97) (115)Net cash inflow from operating activities 204 64Special dividend (245) -Share buy-back programme (151) -Net cash (outflow)/inflow (192) 64
2005/06First half
£m
2004/05First half
£m
29
Investor lunch, New York – 3 March 2006
Financial summary
• Exceptionally active half year
• Strong returns achieved at gross, net and total levels
• Demonstrated our commitment to capital efficiency through £500m return of capital programme
Interim results to 30 September 2005

30
Investor lunch, New York – 3 March 2006
3i’s IR website www.3igroup.com
Investor relations
31
Investor lunch, New York – 3 March 2006
Closing remarks
• Business recovered strongly from challenges of 01/02
• Delivered good financial performance in 03/04 and 04/05
• Strong first half performance in 05/06, good start to second half
• Market generally favourable
• Confident in our business model
• Focused on building for the future
Closing remarks
“Quoted access to private equity returns”