investor presentation - tk5kxbgzm8.smdtalabs.com · indonesia thailand malaysia vietnam philippines...
TRANSCRIPT
Investor Presentation
March 2018
Table of Contents
2
The Philippine Economy 3
About SM Investments 5
SM Retail 13
Banking 17
SM Prime 18
SM Equity Investments 29
CAPEX and Land Bank 36
Financials 37

Philippines: Strong Macroeconomic Fundamentals
3
Avg. Inflation rate: 4.0% (Jan 2018)
Avg. lending rate: 5.7% (Jan 2018)
Debt/GDP: 42.1%
CAR: 15.7%
NPLs: 1.2%
Net lender to the IMF
Job creation and inclusive growth
Provincial growth – Luzon, Visayas, Mindanao
Improved Infrastructure development
Agriculture, Tourism, Manufacturing
Foreign Direct Investments
S&P BBB Stable
Moody's Baa2 Positive
Fitch BBB Positive
Current Credit Ratings
4 3
14 138
96
212
316
11
8
21
19 20
24 25
60
Indonesia Thailand Malaysia Vietnam Philippines
US
D b
n
Net FDI Inflows Remittances ICT ExportSource: BSP Selected Economic and Financial Indicators
Release as of Mar 02, 2018
Source: The World Bank, Most Recent Data
Young Workforce with Rising Incomes
Net External Inflows and ICT ExportsBenign Inflation and Interest Rate Environment
Healthy Fiscal and Monetary System
Opportunities
Strong GDP Growth
6.7%
Per Capita GNI
USD3,590
Median Age
23
Per Capita GDP
USD2,987
Population
105M
+1.6% p.a.
Consumption Driven
68.7% of GDP

Government Priorities
4
Maintain current macroeconomic policies, including fiscal, monetary, and trade policies
Progressive tax management
Pursue investment friendly reforms
Accelerate infrastructure development
Increase agricultural and rural enterprise productivity and rural tourism
Effective land management
Invest in human capital development
Promote science, technology, and the creative arts to enhance innovation and creative capacity
Improve social protection programs for greater social inclusion
Strengthen implementation of the Responsible Parenthood and Reproductive Health Law
10-Point Socio-economic Agenda 2017 Legislative Agenda
1. Enact the 1st package of the Tax Reform Program
2. Pass the National Land Use Act to ban conversion of
prime agricultural land to industrial/commercial
3. Enact the Bangsamoro Basic Law
4. Create a Disaster Management Department
5. Review the Mining Act to impose additional penalties
on irresponsible mining and require local processing
activities
6. Enact a Government Right-sizing Act
7. Amend the Procurement Law to remove the
requirement of accepting the lowest bid
8. Set guidelines limiting Restraining Orders on projects
of national significance that underwent proper bidding

Strong Proxy for Philippine Growth
Strong brand franchise
Market leading consumer-centric businesses
Extensive group synergies
Business Enabler
Partner of choice
Access to capital and SM’s vast network of businesses, customers,
tenants and suppliers
Strong management commitment to partner success
Culture of Sustainability and ESG
Good governance, entrepreneurship and strong customer focus
Prudent financial management
Emphasis on sustainability and community development
About SM Investments
5
SMIC is a leading Philippine company that is invested in market leading businesses in
retail, banking and property. It also invests in ventures that can capture high growth
opportunities in the emerging Philippine economy. It looks for market leaders that offer
synergies and attractive returns and cash flows.

Retail
77%SM RETAIL INC.
SP
EC
IALT
Y
RE
TA
ILE
RS
JO
INT
VE
NT
UR
ES
FO
OD
Banking
45%BANCO DE
ORO
20%CHINA
BANKING
CORP.
Property
50%SM PRIME HOLDINGS, INC.
MA
LL
S
RE
SID
EN
TIA
L
LE
ISU
RE
&
TO
UR
ISM
CO
MM
ER
CIA
L
HO
TE
LS
&
CO
NV
EN
TIO
NS
SM Equity Investments
28%BELLE CORP
34%ATLAS CONSOLIDATED MINING
34%CITYMALL COMMERCIAL
CENTERS
90%NET GROUP
Core Investments
Our Investments
6
TH
E S
M S
TO
RE
Note: Figures are Effective Interest
30.5%2GO GROUP
61.2%MYTOWN
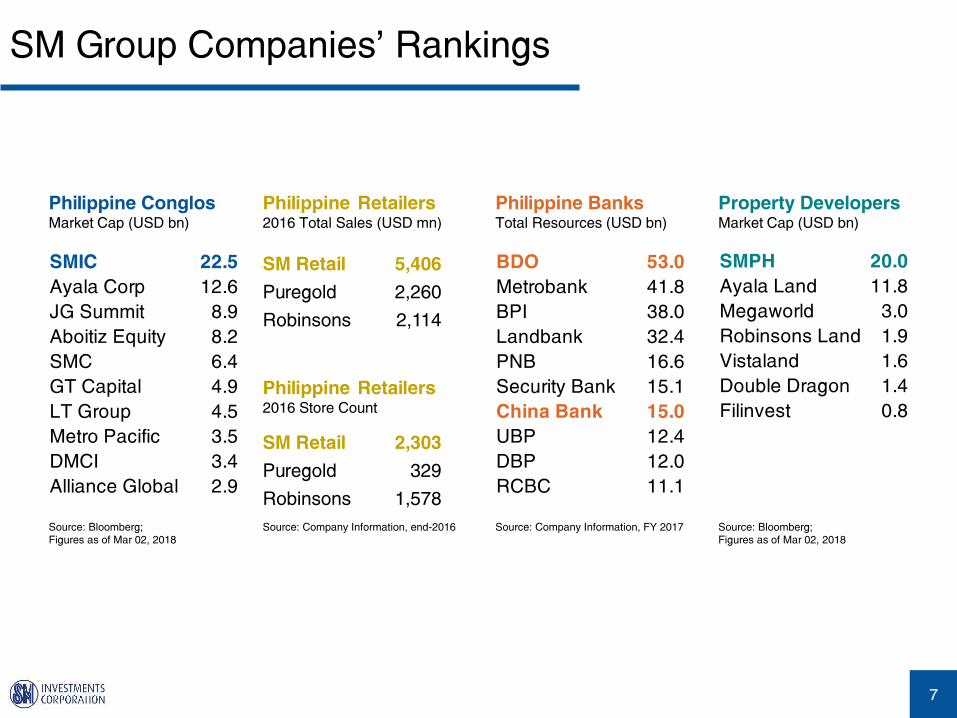
Philippine Retailers
2016 Total Sales (USD mn)
Source: Company Information, end-2016
SM Group Companies’ Rankings
7
Philippine Conglos
Market Cap (USD bn)
Source: Bloomberg;
Figures as of Mar 02, 2018
SMIC 22.5
Ayala Corp 12.6
JG Summit 8.9
Aboitiz Equity 8.2
SMC 6.4
GT Capital 4.9
LT Group 4.5
Metro Pacific 3.5
DMCI 3.4
Alliance Global 2.9
Philippine Banks
Total Resources (USD bn)
Source: Company Information, FY 2017
BDO 53.0
Metrobank 41.8
BPI 38.0
Landbank 32.4
PNB 16.6
Security Bank 15.1
China Bank 15.0
UBP 12.4
DBP 12.0
RCBC 11.1
Property Developers
Market Cap (USD bn)
Source: Bloomberg;
Figures as of Mar 02, 2018
SMPH 20.0
Ayala Land 11.8
Megaworld 3.0
Robinsons Land 1.9
Vistaland 1.6
Double Dragon 1.4
Filinvest 0.8
SM Retail 5,406
Puregold 2,260
Robinsons 2,114
SM Retail 2,303
Puregold 329
Robinsons 1,578
Philippine Retailers
2016 Store Count
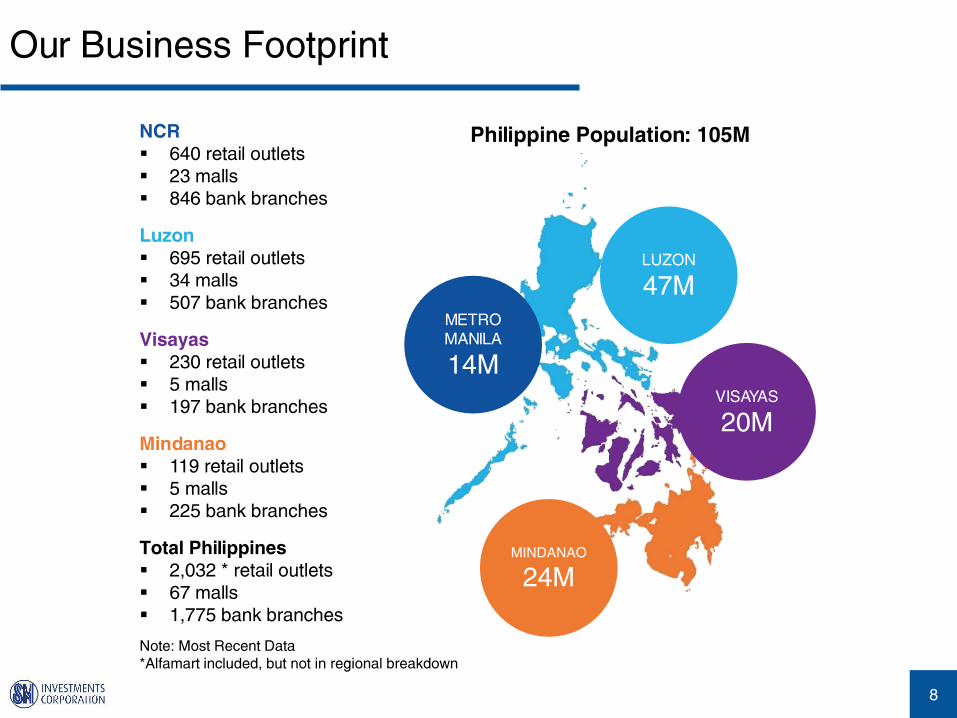
Our Business Footprint
8
NCR
640 retail outlets
23 malls
846 bank branches
Luzon
695 retail outlets
34 malls
507 bank branches
Visayas
230 retail outlets
5 malls
197 bank branches
Mindanao
119 retail outlets
5 malls
225 bank branches
LUZON
47M
VISAYAS
20M
MINDANAO
24M
METRO
MANILA
14M
Note: Most Recent Data
*Alfamart included, but not in regional breakdown
Philippine Population: 105M
Total Philippines
2,032 * retail outlets
67 malls
1,775 bank branches

Our ESG Culture
9
As a group, SM is committed to:
Being a catalyst for development in the communities we serve
UN Sustainable Development Goals
We focus on four areas of advocacy:
15,389 farmers
trained from 2,315
barangays in 616
municipalities
128 public health centers and
medical facilities renovated by
SM Foundation
27 rural health centers
renovated by BDO Foundation
1,238 medical missions
conducted nationwide3,637 college scholars
1,644 technical-
vocational scholars
80 school buildings
donated by SM Foundation
30 school buildings
donated by BDO Foundation
1,000 disaster resilient new
homes for victims of
typhoon Yolanda (Haiyan)
EDUCATION
ZERO HUNGER
HEALTH AND WELLNESS
ENVIRONMENTAL SUSTAINABILITY
takes the lead in the UN ARISE
for integrating disaster
resilience in its businesses
Highest Governance standards
Transparency - Global Reporting Standards
SMIC’s 2016 Environmental, Social
and Governance Report conservation/preservation
awareness programs
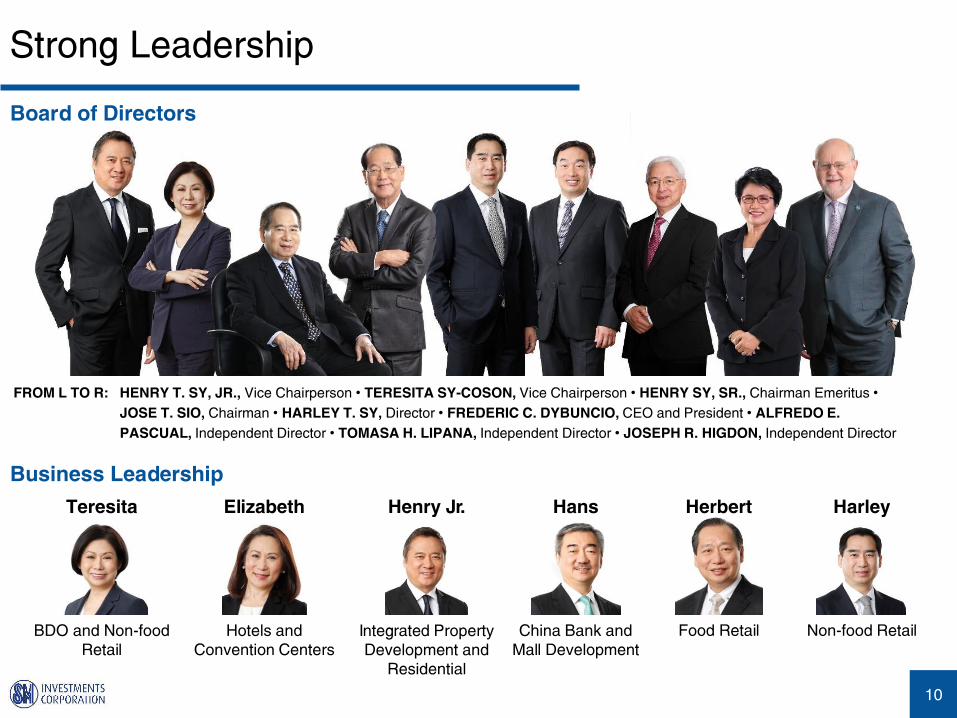
Strong Leadership
10
Board of Directors
HENRY T. SY, JR., Vice Chairperson • TERESITA SY-COSON, Vice Chairperson • HENRY SY, SR., Chairman Emeritus •
JOSE T. SIO, Chairman • HARLEY T. SY, Director • FREDERIC C. DYBUNCIO, CEO and President • ALFREDO E.
PASCUAL, Independent Director • TOMASA H. LIPANA, Independent Director • JOSEPH R. HIGDON, Independent Director
FROM L TO R:
Business Leadership
Teresita
BDO and Non-food
Retail
Elizabeth
Hotels and
Convention Centers
Henry Jr.
Integrated Property
Development and
Residential
Hans
China Bank and
Mall Development
Herbert
Food Retail
Harley
Non-food Retail

10-Year Performance
11
250
960
2007 2017
In P
HP
Bill
ion
Assets grew at 14.4% p.a.
124
396
2007 2017
In P
HP
Bill
ion
Revenue grew at 12.3% p.a.
Net Income grew at 10.5% p.a.207,748
1,192,537
In P
HP
Mill
ion
Market Cap grew 19.1% p.a.
12.1
32.9
2007 2017
In P
HP
Bill
ion
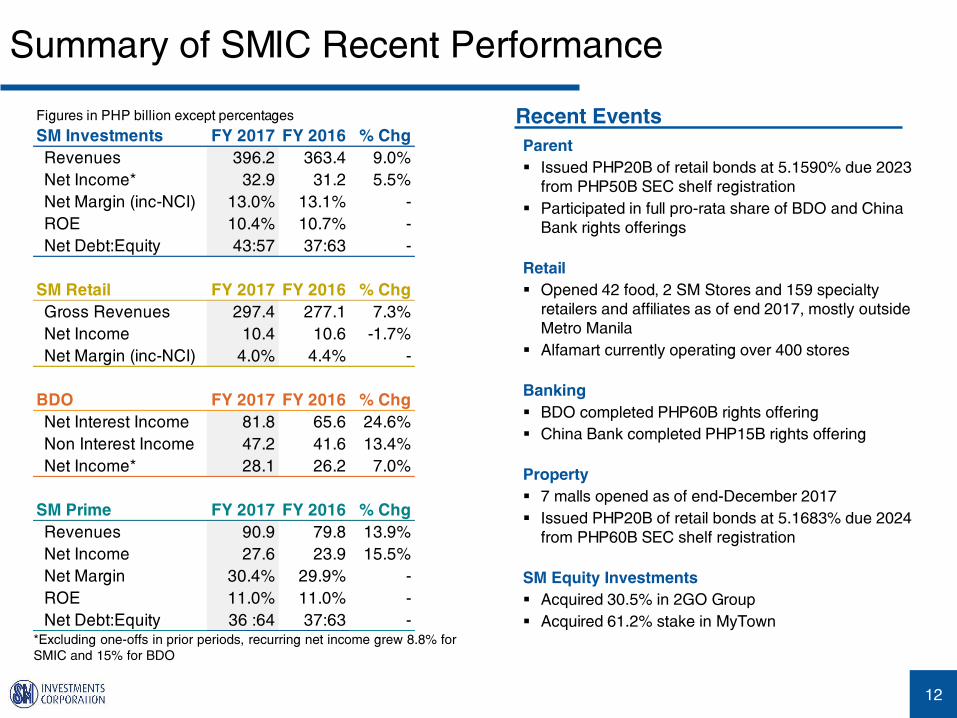
Summary of SMIC Recent Performance
12
Parent
Issued PHP20B of retail bonds at 5.1590% due 2023
from PHP50B SEC shelf registration
Participated in full pro-rata share of BDO and China
Bank rights offerings
Retail
Opened 42 food, 2 SM Stores and 159 specialty
retailers and affiliates as of end 2017, mostly outside
Metro Manila
Alfamart currently operating over 400 stores
Banking
BDO completed PHP60B rights offering
China Bank completed PHP15B rights offering
Property
7 malls opened as of end-December 2017
Issued PHP20B of retail bonds at 5.1683% due 2024
from PHP60B SEC shelf registration
SM Equity Investments
Acquired 30.5% in 2GO Group
Acquired 61.2% stake in MyTown
Recent EventsFigures in PHP billion except percentages
SM Investments FY 2017 FY 2016 % Chg
Revenues 396.2 363.4 9.0%
Net Income* 32.9 31.2 5.5%
Net Margin (inc-NCI) 13.0% 13.1% -
ROE 10.4% 10.7% -
Net Debt:Equity 43:57 37:63 -
SM Retail FY 2017 FY 2016 % Chg
Gross Revenues 297.4 277.1 7.3%
Net Income 10.4 10.6 -1.7%
Net Margin (inc-NCI) 4.0% 4.4% -
BDO FY 2017 FY 2016 % Chg
Net Interest Income 81.8 65.6 24.6%
Non Interest Income 47.2 41.6 13.4%
Net Income* 28.1 26.2 7.0%
SM Prime FY 2017 FY 2016 % Chg
Revenues 90.9 79.8 13.9%
Net Income 27.6 23.9 15.5%
Net Margin 30.4% 29.9% -
ROE 11.0% 11.0% -
Net Debt:Equity 36 :64 37:63 -*Excluding one-offs in prior periods, recurring net income grew 8.8% for
SMIC and 15% for BDO

SM Retail: Most Diversified Retail Portfolio
13
Leading player in creating Philippine
modern retailing
Food - multiple formats from 200 to
14,000 sqm GFA
Non-food - Department stores,
Specialty retailing
Service-led - SM is the most trusted brand
in the Philippines
Serving all customer segments
Diversified portfolio of leading domestic
and foreign brands
Nationwide expansion strategy - faster
market penetration and promote regional
growth
Low market penetration today
80% of new stores opened outside
Metro Manila
Partnerships accelerate expansion
Scalable, competitively advantaged
operations
Extensive synergies with SM Malls
Strong distribution network
‘Click & Brick’ Ecommerce opportunity

SM Retail: Footprint Expansion Opportunity
14
LUZON
47M
VISAYAS
20M
MINDANAO
24M
METRO
MANILA
14M
SM Retail Footprint by Region
GSA Share*
Metro Manila (NCR) 41%
Luzon (ex-NCR) 41%
Visayas 12%
Mindanao 7%
*Excludes Alfamart
Department Stores Stores GSA (sqm) Average
The SM Store 59 765,556 12,976
Food Stores GSA (sqm) Average
SM Supermarket 52 345,611 6,646
SM Hypermarket 47 335,009 7,128
SaveMore 181 506,834 2,800
Waltermart 46 125,550 2,729
Alfamart 348 - -
Specialty Stores* Outlets GSA (sqm) Average
Ace Hardware 169 154,718 915
Homeworld 84 130,835 1,558
Toy Kingdom 142 54,107 381
SM Appliances 80 85,804 1,073
Others 824 123,178 149
Stores/Outlets GSA (sqm)
Total 2,032 2,627,202
*Some outlets located in SM Stores/Food stores

SM Retail: Food Retailing
15
SupermarketsLarge format anchor tenant in
SM malls
HypermarketsStand-alone large format
destinations with 50/50
food/non-food mix
SavemoreStand-alone mid-sized format
expanding nationwide
WalterMartMid-sized format tenant located
in Waltermart Malls expanding
in Luzon
Alfamart
Minimart format, JV with
Indonesian partner providing
supermarket goods and prices
in neighborhood locations

SM Retail: Non-Food Retailing
16
The SM STORE
Anchor tenant in SM malls
80% consignment / 20% in-house brands
Wide range of merchandise and price
points
Targets all customer segments
Specialty Retailing
SM Appliance
Ace Hardware
Toy Kingdom
Baby Company
Our Home
Crate & Barrel
Forever 21
Leading local category specialists
Aspirational but affordable foreign brands
High margin, high growth
Key tenants in malls, selective expansion
outside malls
Homeworld
Watsons
Kultura
Sports Central
Pet Express
Body Shop
Uniqlo

Banking
17
Diversified and sustainable earning stream
Client acquisition through branch expansion
Drive provincial lending and deposit taking initiatives
Expand fee income
Operating leverage
Set up operating platform to support future growth
Implement digital strategy
Prudent balance sheet management
Conservative provisioning for risk assets
Complement current funding with long term
Ensure sufficient capital to support growth
Accelerate Expansion
Grow Revenue Lines
Solidify presence in corporate market
Defend market share for commercial/middle
market/SMEs
Expand menu of consumer products
Continue diversification of fee-based businesses
Intensify branding and differentiation
BDO China Bank

About SM Prime
18
Developer of large scale, integrated “Lifestyle cities”
anchored on world-class malls
The largest property developer in Southeast Asia by
market capitalization
Core businesses include Malls, Residential,
Commercial, Hotels and Conventions Centers
Focus on Philippine provincial footprint expansion -
Malls and Residential
Recurring revenues of ~70%
Extensive landbank and ongoing landbanking
activities - plus reclamation plans
Consistently cited for excellence in corporate
governance, property development, environmental
consciousness and service
Residential
Commercial
Hotels
Malls

SM Prime: An Integrated Property Developer
19
Commercial, entertainment and residential hub
60 hectares of reclaimed land fronting Manila
Bay
FiveE-com
(2015)
TwoE-com
(2012)
Mall of Asia
(2006)
Sea Residences
(2008)Shell Residences
(2011)SM Arena
(2012)
Conrad Manila
(2016)
OneE-com
(2008)
SMX Convention
Center, Manila
(2007)
Under construction: ThreeE-Com Center,
FourE-Com Center, Shore Residences, S
Residences, Galeon Museum
The Mall of Asia Complex

SM Malls: Overview
20

SM Malls: Philippines
21
Note: Most Recent Data
Mall Distribution Malls GFA (sqm) % of Total
Metro Manila (NCR) 23 3,430,408 43%
Luzon (ex-NCR) 34 2,841,468 35%
Visayas 5 1,095,303 14%
Mindanao 5 661,147 8%
Total 67 8,028,326 100%
New Malls Opened GFA (sqm)
SM Cagayan de Oro May 2017 169,894
SM Cherry Antipolo Jun 2017 27,225
S Maison Jun 2017 42,107
SM Puerto Princesa Sep 2017 53,203
SM Center Tuguegarao Oct 2017 33,229
SM Center Lemery Nov 2017 24,877
SM Center Pulilan Dec 2017 26,229
Upcoming Malls
SM Center Imus SM City Legazpi
SM City Urdaneta SM City Ormoc
SM City Telabastagan SM Center Dagupan
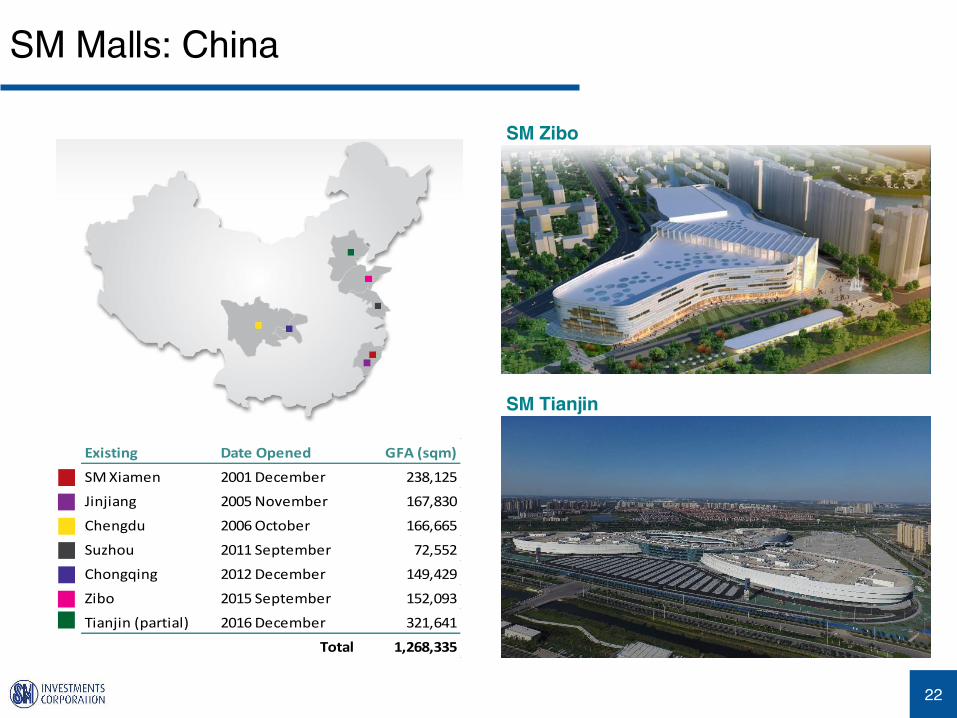
SM Malls: China
22
Existing Date Opened GFA (sqm)
SM Xiamen 2001 December 238,125
Jinjiang 2005 November 167,830
Chengdu 2006 October 166,665
Suzhou 2011 September 72,552
Chongqing 2012 December 149,429
Zibo 2015 September 152,093
Tianjin (partial) 2016 December 321,641
Total 1,268,335
SM Zibo
SM Tianjin

Projects Overview FY 2017 FY 2016
Reservation Sales (PHP B) 57.8 47.7
Reservation Sales (units) 17,259 16,670
Future Plans
2018 Planned launches (units) 12,000-15,000
2018 CAPEX PHP39.2bn
SMDC Land bank Hectares
Metro Manila 71.84
Outside Metro Manila 484.38
Land for Future Projects 556.22
SM Residences
23
S Residences
South Residences
Pioneer in affordable high rise residential
developments since 2003
Extensive amenities and SM Retail facilities
49 projects with over 110,000 units launched to date
Plans to develop 12-15,000 units in multiple formats
• High rise
• Mid rise
• House and lot
National housing backlog of over 5 million homes

SM Residences: Affordable Modern Condo Living
24
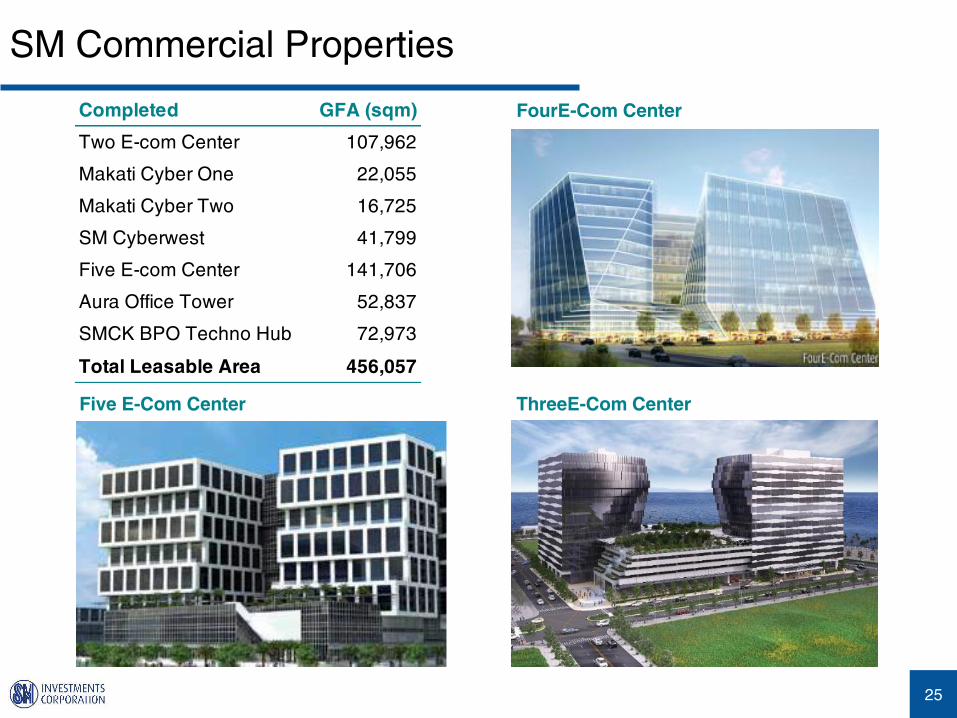
SM Commercial Properties
25
FourE-Com Center
ThreeE-Com CenterFive E-Com Center
Completed GFA (sqm)
Two E-com Center 107,962
Makati Cyber One 22,055
Makati Cyber Two 16,725
SM Cyberwest 41,799
Five E-com Center 141,706
Aura Office Tower 52,837
SMCK BPO Techno Hub 72,973
Total Leasable Area 456,057

SM Hotels and Convention Centers
26
Conrad Manila
Growing tourism opportunity
SM Hotels’ planned expansions will
complement existing Mall, Commercial
and Residential developments
Iloilo
SM North Edsa, Metro Manila
San Fernando, Pampanga
SM Seaside City, Cebu
SMX Convention Center
Mall of Asia Arena

SM Hotels and Convention Centers
27
Conrad Manila Lobby
Conrad Manila Diplomatic Suite Venue Location GLA (sqm)
SMX Manila MOA Complex 17,306
SMX Davao SM Lanang 5,200
SMX Aura Premier SM Aura 3,136
SMX Bacolod Bacolod 4,269
Megatrade Hall Megamall 4,214
Cebu Trade Hall Cebu 1,498
SM Seaside Skyhall Cebu 1,857
Mall of Asia Arena MOA Complex 20,000 seats
Total 37,480
Hotel Opened Rooms
Taal Vista, Tagaytay 2003 260
Radisson Blu, Cebu 2010 396
Pico Sands, Hamilo Coast 2011 151
Park Inn, Davao 2013 202
Park Inn, Clark 2015 154
Conrad Manila, Pasay 2016 347
Total 1,510

Pico de Loro Development, Batangas
28
Pristine environment
1½ - 2 hours from Manila 90 minutes from the Mall of Asia Complex
Sprawling seaside sanctuary flanked by the sea on the West,
mountain ranges in the East, with thirteen coves, three of which
are Marine Protected Areas
5,780 hectares
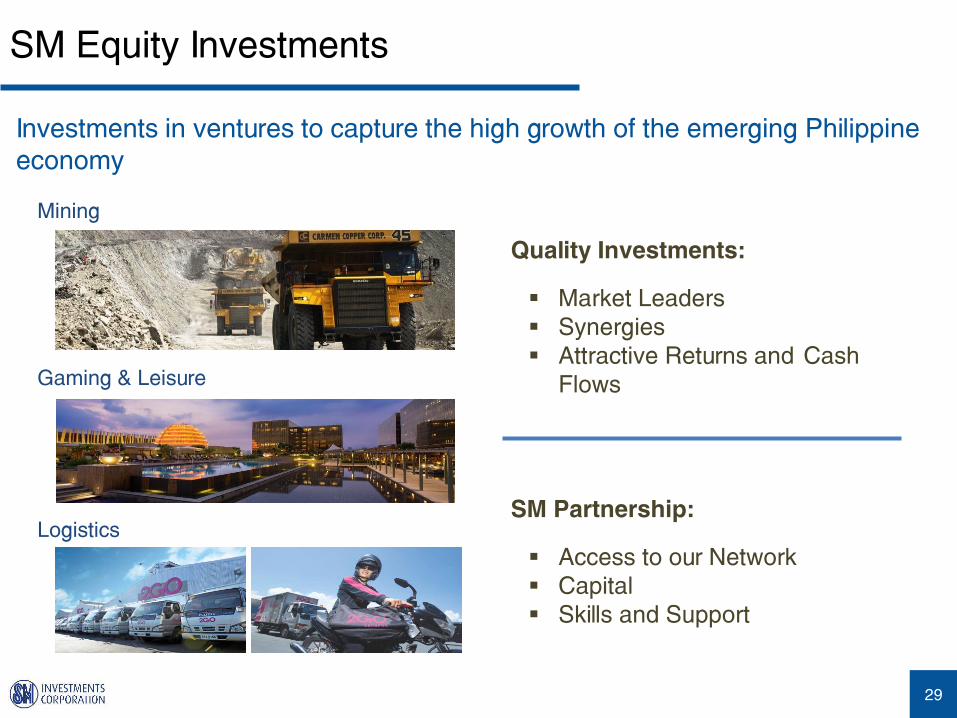
SM Equity Investments
29
Investments in ventures to capture the high growth of the emerging Philippine
economy
Mining
Gaming & Leisure
Logistics
Quality Investments:
Market Leaders
Synergies
Attractive Returns and Cash
Flows
SM Partnership:
Access to our Network
Capital
Skills and Support
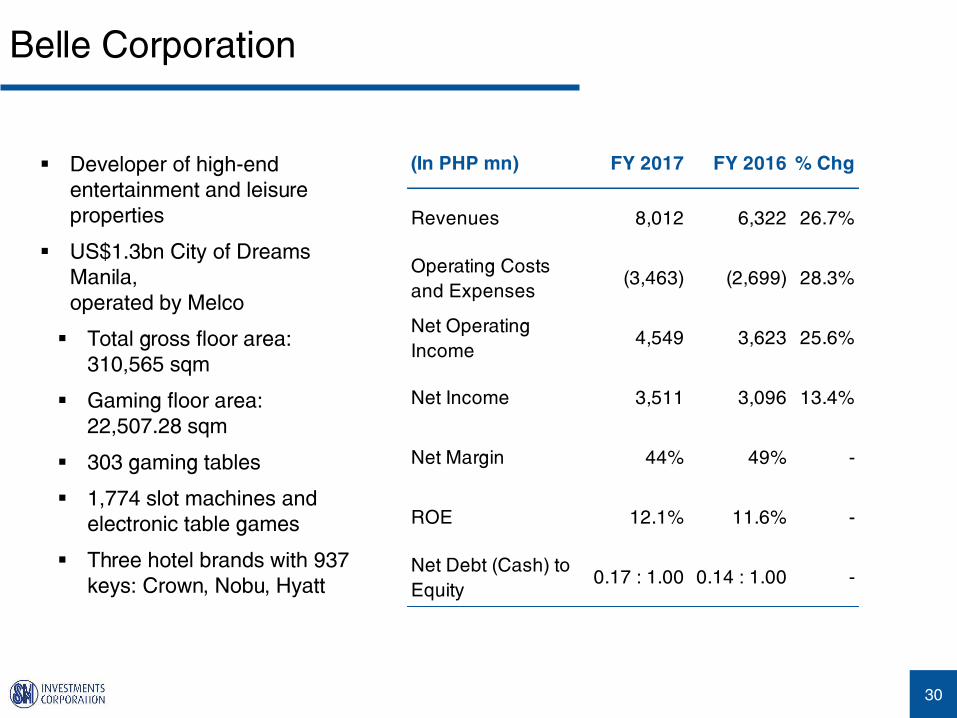
Belle Corporation
30
Developer of high-end
entertainment and leisure
properties
US$1.3bn City of Dreams
Manila,
operated by Melco
Total gross floor area:
310,565 sqm
Gaming floor area:
22,507.28 sqm
303 gaming tables
1,774 slot machines and
electronic table games
Three hotel brands with 937
keys: Crown, Nobu, Hyatt
(In PHP mn) FY 2017 FY 2016 % Chg
Revenues 8,012 6,322 26.7%
Operating Costs
and Expenses (3,463) (2,699) 28.3%
Net Operating
Income 4,549 3,623 25.6%
Net Income 3,511 3,096 13.4%
Net Margin 44% 49% -
ROE 12.1% 11.6% -
Net Debt (Cash) to
Equity0.17 : 1.00 0.14 : 1.00 -

Atlas Consolidated Mining
31
Copper mine with 17 years
mine life, over 370m tonnes
of proved and probable
reserves
Average Cu grade of 0.291%
Excellent environmental and
social record
Supportive shareholders and
other stakeholders
C1 cost is $1.77/lb Cu
(In PHP mn) FY 2017 FY 2016 % Chg
Revenues 11,964 12,080 -1%
Total Cash Cost 8,151 8,968 -9%
EBITDA 3,806 3,174 20%
Net Income (1,968) (879) -124%
Core Income (746) (1,195) 38%

CityMalls Commercial Corp.
32
CityMalls Open 2018 Total
Luzon 7 5 12
Visayas 14 6 20
Mindanao 4 7 11
Philippines 25 18 43
Typical Mall Layout
SM Retail and Banking Footprint: ~55%
Savemore, ACE Hardware, Watson’s, SM
Appliance, Simply Shoes, BDO, Chinabank
Savings
Average Occupancy Rate: 95%
18 other sites to commence construction
Land bank: 60 sites in city centers

2GO Group
33
2GO Group, Inc. (30.5%)
Negros Navigation Corp. (88.3%)
Public (11.7%)
Udenna Corp.
39.85%
SM Investments Corp.
34.50%
China ASEAN Marine BV
25.30%
Others
0.35%
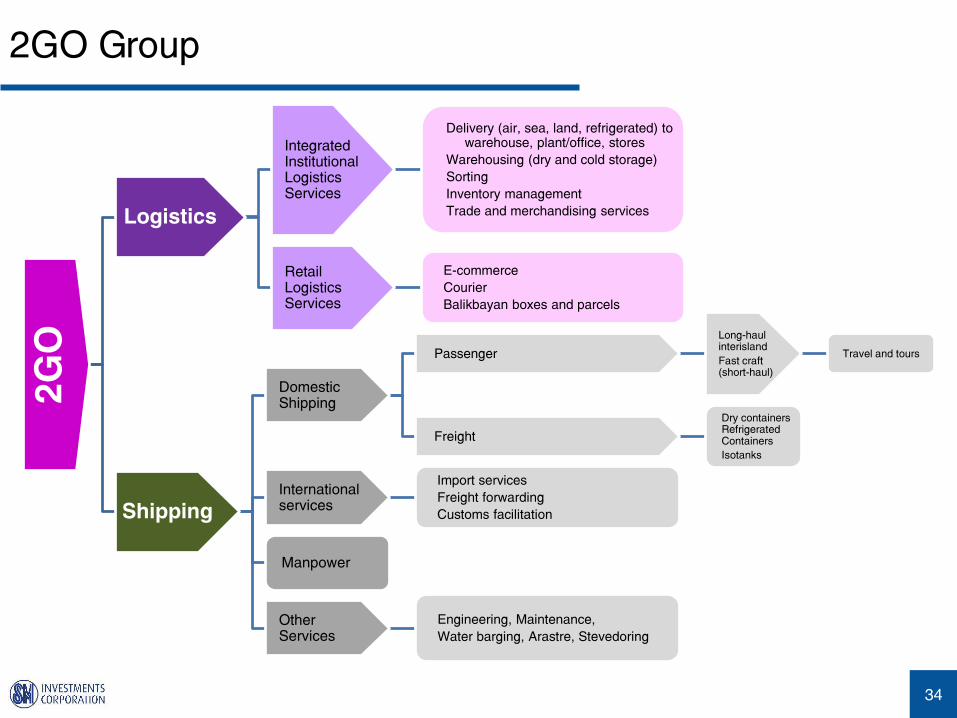
2GO Group
34
2G
O
Logistics
Integrated Institutional Logistics Services
Delivery (air, sea, land, refrigerated) to warehouse, plant/office, stores
Warehousing (dry and cold storage)
Sorting
Inventory management
Trade and merchandising services
Retail Logistics Services
E-commerce
Courier
Balikbayan boxes and parcels
Shipping
Domestic Shipping
Passenger
Long-haul interisland
Fast craft (short-haul)
Travel and tours
Freight
Dry containers Refrigerated Containers
Isotanks
International services
Import services
Freight forwarding
Customs facilitation
Manpower
Other Services
Engineering, Maintenance,
Water barging, Arastre, Stevedoring

2GO Group
35
Premier player in fast growing
Philippine logistics sector
Largest integrated supply chain
operator
Links to 150 countries, customs
clearance
Leading transportation provider
Over 90% of domestic
passenger freight
Over a third of cargo handling
Widest logistics infrastructure
400,000 TEU capacity
16 vessels, 15,000 containers,
35 cross-dock warehouses
185 outlets, 70,000 sqm of
distribution center
550 trucks, 1,200 trailers, 250
motorcycles
Potential synergies with SM
group
Nationwide expansion
ECommerce
(In PHP mn) FY 2017 FY 2016 % Chg
Revenues 21,551 19,054 13.1%
Operating Costs and
Expenses (21,190) (17,969) 17.9%
Net Operating
Income 361 1,085 -66.7%
Net Income
Attributable to Parent (315) 330 -195.5%
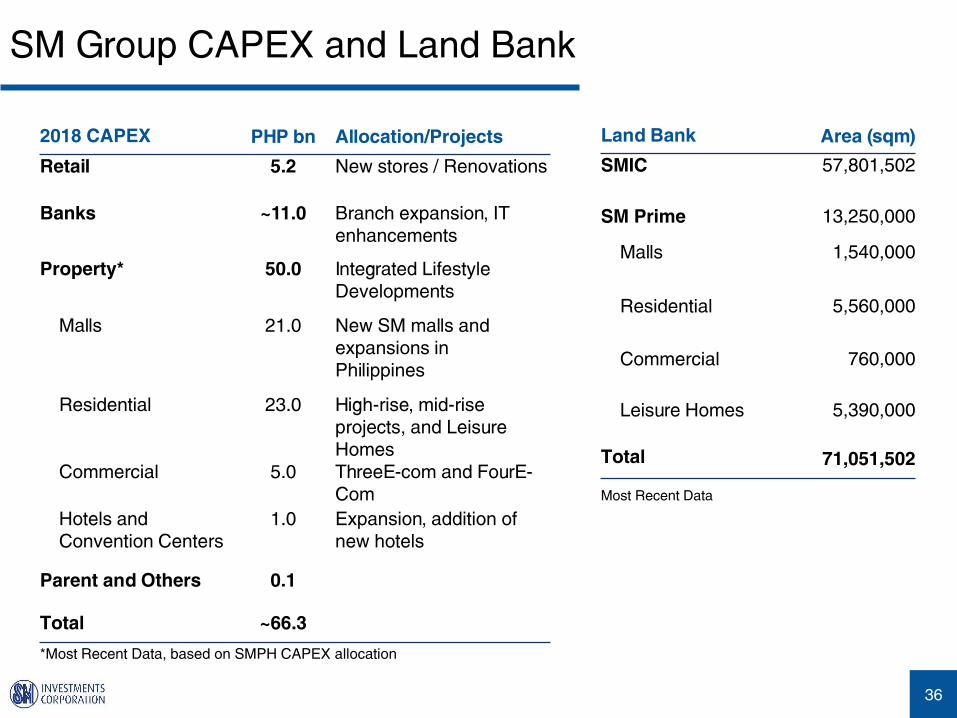
SM Group CAPEX and Land Bank
36
2018 CAPEX PHP bn Allocation/Projects
Retail 5.2 New stores / Renovations
Banks ~11.0 Branch expansion, IT
enhancements
Property* 50.0 Integrated Lifestyle
Developments
Malls 21.0 New SM malls and
expansions in
Philippines
Residential 23.0 High-rise, mid-rise
projects, and Leisure
Homes
Commercial 5.0 ThreeE-com and FourE-
Com
Hotels and
Convention Centers
1.0 Expansion, addition of
new hotels
Parent and Others 0.1
Total ~66.3
Land Bank Area (sqm)
SMIC 57,801,502
SM Prime 13,250,000
Malls 1,540,000
Residential 5,560,000
Commercial 760,000
Leisure Homes 5,390,000
Total 71,051,502
Most Recent Data
*Most Recent Data, based on SMPH CAPEX allocation

FINANCIALS
37

21.0%
75.3%
3.7%
40.5%
21.8%
37.7%
Property Retail Banking
Financials: SMIC
38
Revenue Contribution
Earnings Contribution
Banking business not consolidated
FY 2017 Consolidated Results
In PHP Billion
SMIC Parent Debt
Net Debt to Equity 45 : 55 Average Cost of Debt 5.13%
Peso-Foreign Currency Mix 56 : 44 Average Debt Tenure 3.71 years
Particulars FY 2017 FY 2016 % Chg FY2016 FY2015 FY2014 FY2013
Revenue 396.2 363.4 9.0% 363.4 332.2 308.8 286.7
Reported Net Income 32.9 31.2 5.5% 31.2 43.7 41.5 40.0
Net Margin (inc-NCI) 13.0% 13.1% - 13.1% 13.1% 13.5% 14.0%
Return on Equity 10.4% 10.7% - 10.7% 10.8% 12.1% n/a
Total Capital FY 2017 FY 2016 % Chg FY2016 FY2015 FY2014 FY2013
Counterpart investments 113.3 145.1 -21.9% 145.1 125.0 134.7 120.3
Net Debt 243.7 174.8 39.4% 174.8 156.7 127.5 117.8
Equity attrib to Parent 328.1 300.5 9.2% 300.5 280.0 252.2 219.4
Net Debt:Equity 43:57 37:63 - 37:63 36:64 34:66 36:64
Recent Bond Offerings
Issued Amount Currency Due Date Coupon Rate
December 9, 2016 20 bn Philippine Peso December 2023 5.159%
June 10, 2014 350 mn US Dollar June 2024 4.875%
May 19, 2014 15 bn Philippine Peso May 2021/May 2024 5.2958%/5.6125%
July 16, 2012 15 bn Philippine Peso Jul 2019/Jul 2022 6.0%/6.9442%
October 17, 2012 500 mn US Dollar October 2019 4.25%

Financials: BDO
39
Financial Highlights (In PHP Bn) FY 2017 FY 2016 % Chg
Net Interest Income 81.8 65.6 24.6%
Other Income 47.2 41.6 13.4%
Net Income1
28.1 26.2 7.0%
Assets 2,668.1 2,325.0 14.8%
Deposits 2,121.0 1,905.2 11.3%
Gross Customer Loans 1,754.9 1,482.0 18.4%
Net Interest Margin 3.48% 3.24% --
Cost to Income Ratio 65.8% 65.3% --
Return on Ave. Common Equity2
10.2% 12.7% --
Gross Loans to Deposits Ratio 82.7% 77.8% --
Gross NPL to Gross Customer Loans 1.0% 1.1% --
Total CAR3
14.5% 12.3% --
Tier 1 Ratio 13.1% 10.9% --
CET1 12.9% 10.6% --
1. Excludes net income attributable
to minority interest
2. Return on Ave. Common Equity,
defined as NI to parent
shareholders less preferred
dividends / ave. common equity
(excluding preferred shares and
minority interests)
3. Per BSP, as seen in the published
statements of condition

Financials: BDO
40
15%
19% 20%17%
16%18%16%
16%
20%
14%
17%19%
2012 2013 2014 2015 2016 2017
BDO Industry
592 775 959 1,138 1,382 1,544 339 570
533 526
523 577
932
1,3451,492
1,6641,905
2,121
2012 2013 2014 2015 2016 2017
PH
P B
n
CASA Time Deposits
21.314.8 14.2 15.8 18.8 20.4
26.7 25.2 26.8 26.2 26.2 29.9
2.8%
1.6%1.3% 1.2% 1.3% 1.2%
-4.0%
-3.0%
-2.0%
-1.0%
0.0%
1.0%
2.0%
3.0%
4.0%
0.0
10.0
20.0
30.0
40.0
50.0
60.0
2012 2013 2014 2015 2016 2017
PH
P B
n
NPL Allow. for Impairment NPL Ratio
Deposits YoY∆ 44% 11% 11% 15% 11%
CASA YoY∆ 31% 24% 19% 21% 12%
CASA Ratio 58% 64% 68% 73% 73%
Cost of Deposits 0.96% 0.75% 0.81% 0.77% 0.74%
NPL Cover 171% 188% 166% 139% 146%
36.1 43.2
51.2 57.0 65.6
81.8 13.4 15.5
18.0 19.4
22.2
28.9 8.1
9.9
8.2
12.8 7.1
7.2
4.8
3.9
60.5
75.0 80.7
88.9
107.2
129.0
2012 2013 2014 2015 2016 2017
PH
P B
n
Net Int Inc Fees Insurance Premiums Trading/FX Others
YoY∆ Total ex-premiums 8% 10% 21% 20%
YoY∆ NII & Fees 18% 10% 15% 26%
Growth in sustainable sources of incomeImproving Asset Quality
Sustained growth in low-cost depositsStrong, quality loan growth

Financials: China Bank
41
1. Net Income/Average Equity
2. Per BSP, as seen in the
published statements of
condition
Financial Highlights (In PHP Bn) FY 2017 FY 2016 % Chg
Net Interest Income 19.6 16.7 17.4%
Non-Interest Income 6.1 5.1 19.6%
Net Income 7.5 6.5 15.4%
Assets 751.4 633.2 18.7%
Deposits 635.1 541.6 17.3%
Gross Customer Loans (ex-UDSCL) 453.9 389.0 16.7%
Net Interest Margin 3.1% 3.2% --
Cost to Income Ratio 62.0% 61.3% --
Return on Equity1
10.0% 10.4% --
Gross Customer Loans to Deposits Ratio 70.7% 71.4% --
Gross NPL Ratio 1.4% 1.9% --
Total CAR2
14.2% 12.2% --
Tier 1/CET 1 13.5% 11.3% --
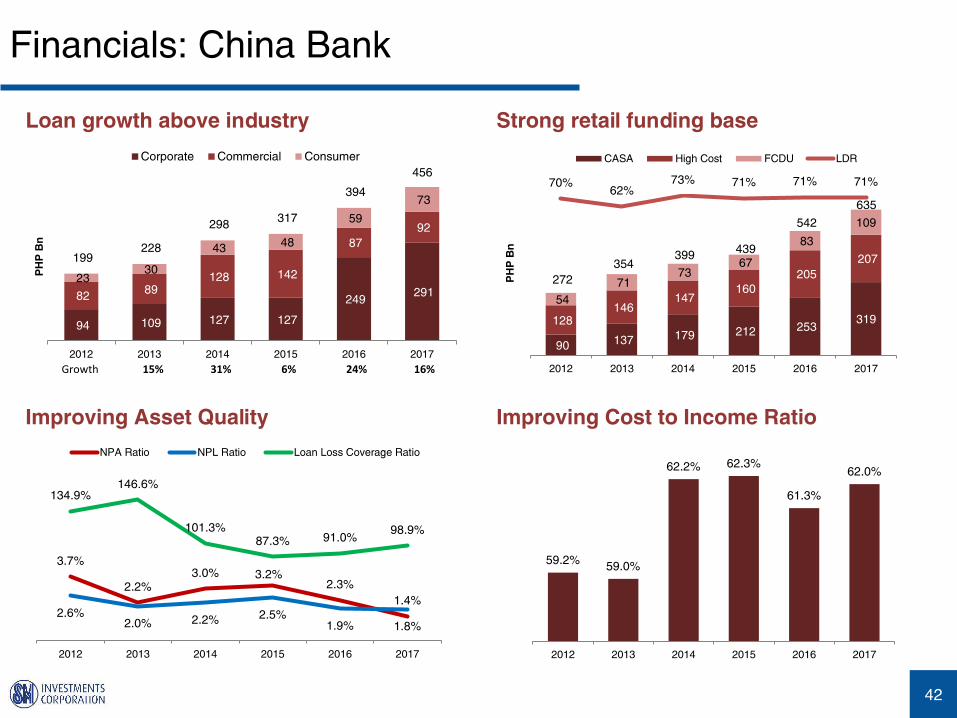
Financials: China Bank
42
90 137 179 212 253 319128
146 147
160
205
207
54
71 73
67
83
109
272
354 399
439
542
635
70%62%
73% 71% 71% 71%
-90%
10%
-
100
200
300
400
500
600
700
2012 2013 2014 2015 2016 2017
PH
P B
n
CASA High Cost FCDU LDR
94 109 127 127
249 291 82
89 128 142
87
92
23 30
43 48
59
73
199 228
298 317
394
456
2012 2013 2014 2015 2016 2017
PH
P B
n
Corporate Commercial Consumer
3.7%
2.2%3.0% 3.2%
2.3%
1.4%2.6%
2.0% 2.2% 2.5%1.9% 1.8%
134.9%146.6%
101.3%87.3% 91.0%
98.9%
0.0%
20.0%
40.0%
60.0%
80.0%
100.0%
120.0%
140.0%
160.0%
180.0%
0.0%
2.0%
4.0%
6.0%
8.0%
10.0%
2012 2013 2014 2015 2016 2017
NPA Ratio NPL Ratio Loan Loss Coverage Ratio
59.2%59.0%
62.2% 62.3%
61.3%
62.0%
2012 2013 2014 2015 2016 2017
Loan growth above industry Strong retail funding base
Improving Cost to Income RatioImproving Asset Quality
Growth 15% 31% 6% 24% 16%
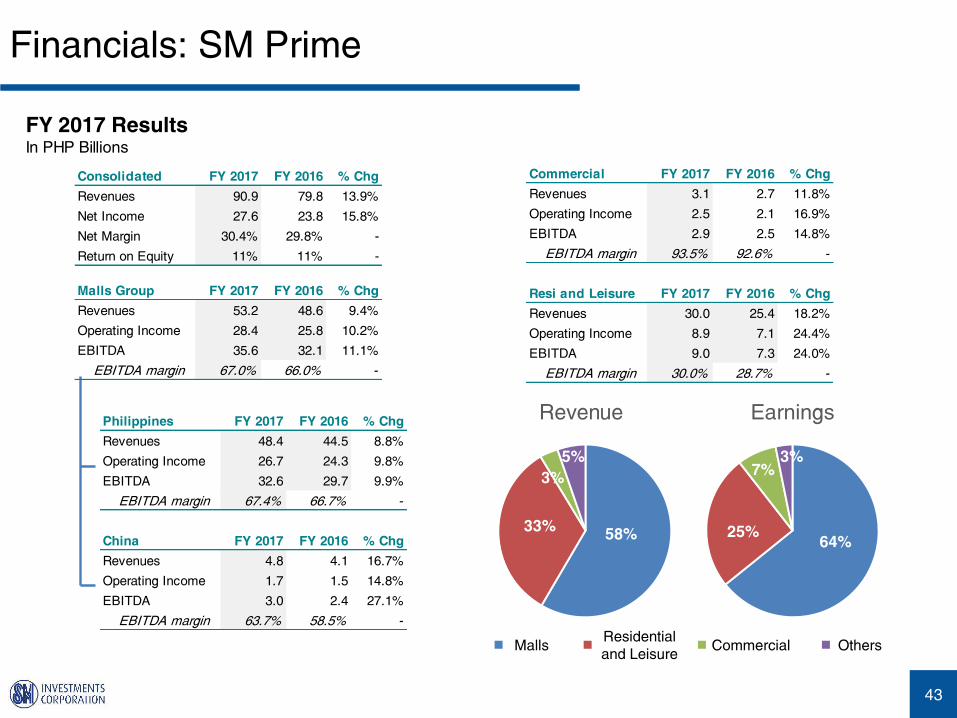
Financials: SM Prime
43
FY 2017 Results
In PHP Billions
Malls
64%25%
7%
3%
Earnings
58%33%
3%
5%
Revenue
Consolidated FY 2017 FY 2016 % Chg
Revenues 90.9 79.8 13.9%
Net Income 27.6 23.8 15.8%
Net Margin 30.4% 29.8% -
Return on Equity 11% 11% -
Malls Group FY 2017 FY 2016 % Chg
Revenues 53.2 48.6 9.4%
Operating Income 28.4 25.8 10.2%
EBITDA 35.6 32.1 11.1%
EBITDA margin 67.0% 66.0% -
Philippines FY 2017 FY 2016 % Chg
Revenues 48.4 44.5 8.8%
Operating Income 26.7 24.3 9.8%
EBITDA 32.6 29.7 9.9%
EBITDA margin 67.4% 66.7% -
China FY 2017 FY 2016 % Chg
Revenues 4.8 4.1 16.7%
Operating Income 1.7 1.5 14.8%
EBITDA 3.0 2.4 27.1%
EBITDA margin 63.7% 58.5% -
Commercial FY 2017 FY 2016 % Chg
Revenues 3.1 2.7 11.8%
Operating Income 2.5 2.1 16.9%
EBITDA 2.9 2.5 14.8%
EBITDA margin 93.5% 92.6% -
Resi and Leisure FY 2017 FY 2016 % Chg
Revenues 30.0 25.4 18.2%
Operating Income 8.9 7.1 24.4%
EBITDA 9.0 7.3 24.0%
EBITDA margin 30.0% 28.7% -
Residential
and LeisureOthersCommercial

Contact Information and Disclaimer
44
Investor Relations Office
Office Number: +63 2 857-0100
Email Address: [email protected]
SM Official Website: www.sminvestments.com
Official Facebook Account: www.facebook.com/sminvestments.ir
Official Twitter Account: @SM_INVESTMENTS
PSE Ticker SM
ADR Ticker SMIVY
Bloomberg Ticker SM PM Equity
Reuters Ticker SM.PH
Disclaimer
Except for historical financial and operating data and other information in respect of historical matters,
the statements contained herein are “forward-looking statements”. Any such forward-looking statement
is not a guarantee of future performance and involves a number of known and unknown risks,
uncertainties, and other factors that could cause the actual performance, financial condition or results
of operation of SM and its subsidiaries to be materially different from any future performance, financial
condition or results of operation implied by such forward-looking statement.