investor presentation nov 13 2015 v1 - clearwater presentation... · powerful industry fundamentals...
TRANSCRIPT

Investor Presentation
November 13, 2015
Forward looking statementsForward looking statements
This presentation may contain "forward-looking information" as defined in applicable Canadian securities legislation. All statements other thanstatements of historical fact, including, without limitation, statements regarding future plans and objectives of Clearwater, constitute forward-looking information that involve various known and unknown risks, uncertainties, and other factors outside management’s control.
Forward-looking information is based on a number of factors and assumptions which have been used to develop such information but whichmay prove to be incorrect including, but not limited to, total allowable catch levels, selling prices, weather, exchange rates, fuel and other inputcosts.
There can be no assurance that such information will prove to be accurate and actual results and future events could differ materially from thoseanticipated in such forward-looking information.
In addition, this presetnation contains forward-looking information relating to Clearwater’s acquisition of Macduff Shellfish Group Limited(“Macduff”), financing of the acquisition, enhancement of Clearwater’s scale of operations and accelerated growth, as well as expectationsregarding sales, adjusted EBITDA, adjusted earnings and leverage. This forward-looking information is based on a number of factors andassumptions which have been used to develop such information but which may prove to be incorrect including, but not limited to, Clearwater’sability to successfully integrate or grow the business of Macduff as planned, total allowable catch levels, selling prices, weather, exchange rates,fuel and other input costs. There can be no assurance that such information will prove to be accurate and actual results and future events coulddiffer materially from those anticipated in such forward-looking information. Risk factors that could cause actual results to differ materially fromthose indicated by forward-looking information contained in this press release include risks and uncertainties related to: (i) diversion ofy g p ( )management time and attention on the acquisition, (ii) any disruption from the acquisition affecting relationships with customers, employees orsuppliers, (iii) the timing and extent of changes in interest rates, prices and demand, and (iv) economic conditions and related uncertainties.
For additional information with respect to risk factors applicable to Clearwater, reference should be made to Clearwater's continuous disclosurematerials filed from time to time with securities regulators, including, but not limited to, Clearwater's Annual Information Form.
The forward-looking information contained in this presentation is made as of the date of this release and Clearwater does not undertake tog pupdate publicly or revise the forward-looking information contained in this presentation, whether as a result of new information, future events orotherwise, except as required by applicable securities laws.
No regulatory authority has approved or disapproved the adequacy or accuracy of this presentation.
2

Company overviewCompany overview
North merica’s largest vertically integrated harvester, processor, and distributor of premium shellfish
81 illi d ld i 2014• ~81 million pounds sold in 2014• key species include: lobster,
scallops, clams, coldwater shrimp and crab
• recognized for quality, eco-harvesting practices* and reliable
widest selection of MSC-certified species of any seafood harvester worldwideharvesting practices* and reliable
delivery
Largest holder of shellfish quotas in canada
worldwide
At-sea processing • company-owned state-of-the-art
factory vessels• advanced onshore processing,
storage and distribution capabilitiesg p
Global sales, marketing and distribution platform
• diverse customer base with local sales forces
3

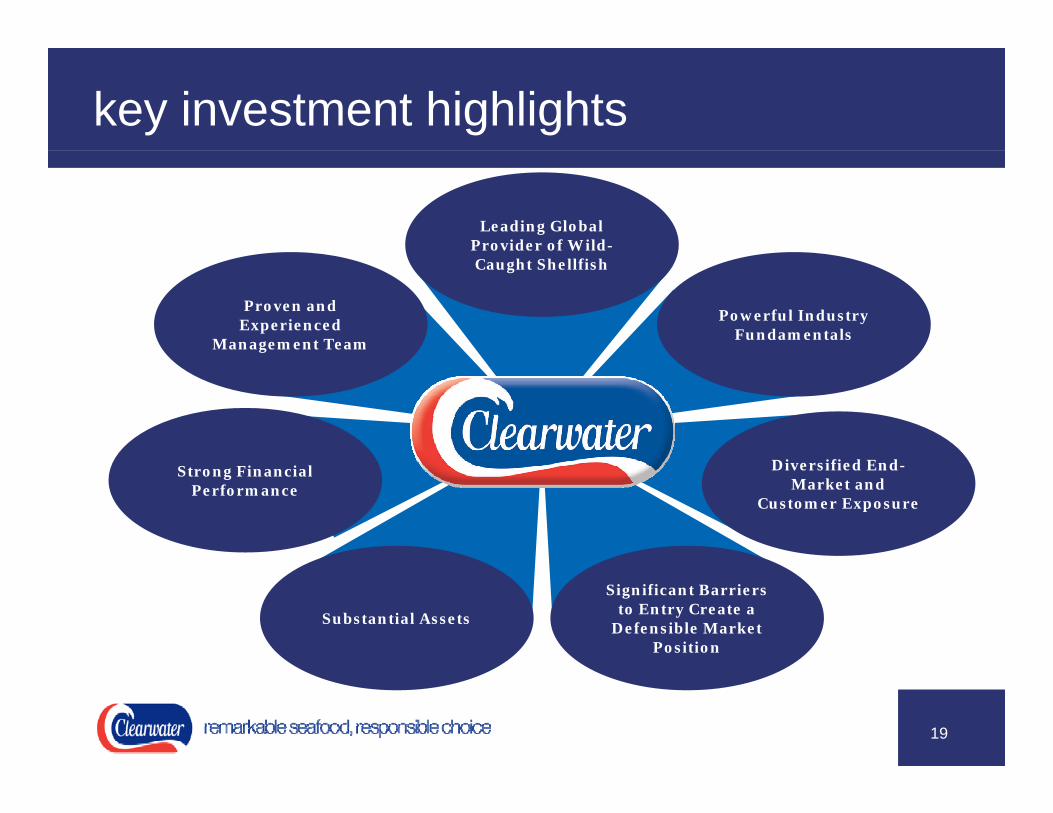
Key investment highlightsKey investment highlights
Leading Global Provider of Wild-Caught Shellfish
Powerful Industry Fundamentals
Proven and Experienced
Management Team
Strong Financial Performance
Diversified End-Market and
Customer Exposure
Substantial Assets
Significant Barriers to Entry Create a
Defensible Market Position
4
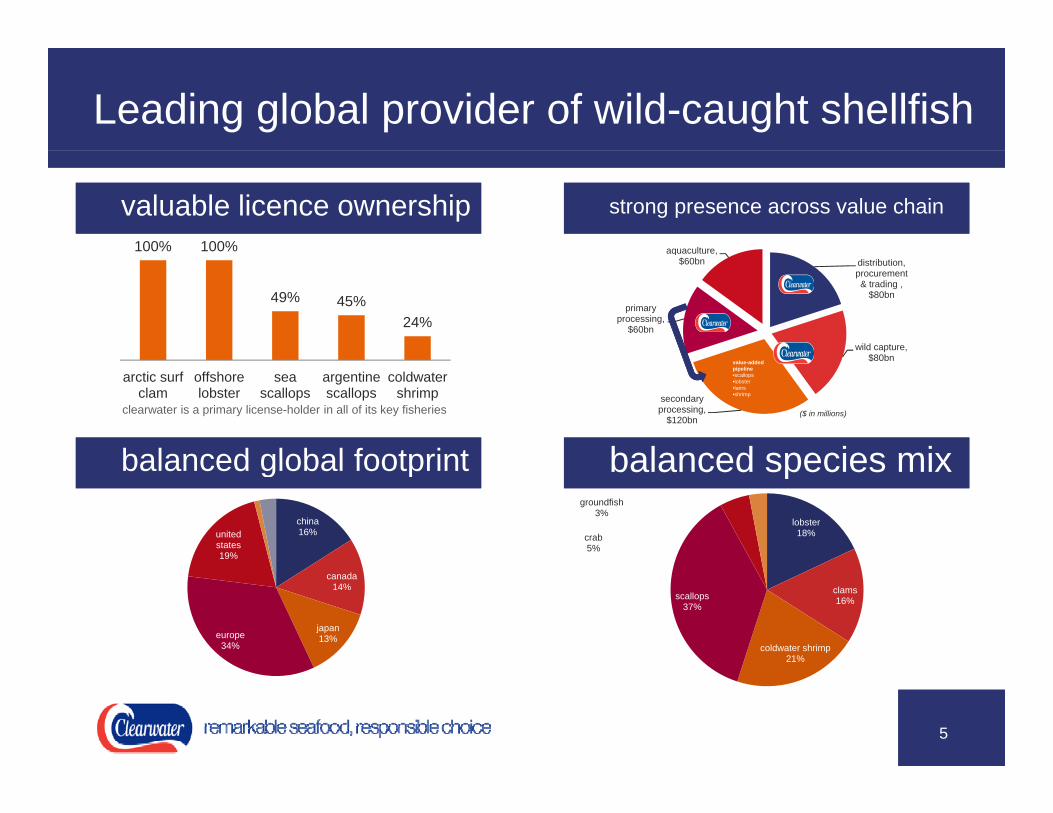
Leading global provider of wild-caught shellfishLeading global provider of wild-caught shellfish
100% 100% aquaculture,
valuable licence ownershipvaluable licence ownership strong presence across value chainstrong presence across value chain
49% 45%24%
distribution, procurement & trading ,
$80bn
wild capture, $80b
primary processing,
$60bn
aquaculture, $60bn
($ in millions)
arctic surf clam
offshore lobster
sea scallops
argentine scallops
coldwater shrimp
$80bn
secondary processing,
$120bn
value-added pipeline•scallops•lobster•lams•shrimp
clearwater is a primary license-holder in all of its key fisheries
balanced global footprintbalanced global footprint balanced species mixbalanced species mixchina 16%united
states19%
lobster18%crab
5%
groundfish3%
balanced global footprintbalanced global footprint balanced species mixbalanced species mix
canada14%
japan13%europe
34%
clams16%
coldwater shrimp21%
scallops37%
5

Powerful industry fundamentalsPowerful industry fundamentals
• global demand outstripping finite wild-caught supply sources• regulatory bodies managing wild-caught fisheries conservatively to Supplier pricing
projected 2000-2020price growth
23%30%
43%
50%
g y g g g yprotect long-term supply
• declining growth of both wild-caught and aquaculture production• customers willing to pay a premium for high-quality sustainable
supply
Supplier pricing power
19%23%
fish oil capture/wild
traded/exported
fish meal aqua-culture
• asia-pacific middle class sustainable growth provides a stable source of long-term demand (six-fold growth in consumer spending forecast through 2020)
• growing incomes have increased demand for high-quality premium products
Robust emerging
market demand 18% 7%
36%
14%
28%66%
10% 6%6% 5%2% 2%
% of global middle class by region
p• increasing adaptation of premium priced western-inspired productsmarket demand
f h lth d ll d i i i t t i “hi hDeveloped
7%2009 2030
North America EuropeAsia Pacific Central / South AmericaMiddle East / North Africa Sub-Sahara Africa
• consumer focus on health and wellness driving interest in “higher-quality” protein, such as seafood
• growing desire for sustainably-sourced food• desire for “authentic” taste experience (wild-caught vs. farm-raised)
Developed attractive market
“mega trends”
6
source: oecd, fao secretaries and pricewatershousecoopers

Expected seafood prices increases nearly 3x > other proteinsExpected seafood prices increases nearly 3x > other proteinspp
% price change
protein pricing % change protein pricing % change
% price change
2011-2014 2014-2020
b f 15 6% 3 8%
26.2 25.425
30
beef 15.6% -3.8%
pig 6.4% +10.7%
poultry -12.2% +8.0%10.7 10
10
15
20
p y
sheep -16.1% +10.0%
fish – wild 10.1% +26.2%
8
0
5
10
source: oecd fao agricultural outlook
fish - aqua 5.5% +25.4%-3.8
-10
-5
source: oecd-fao agricultural outlook
beef pig poultry sheep fish-wild fish-aqua
7
source: oecd-fao agricultural outlook
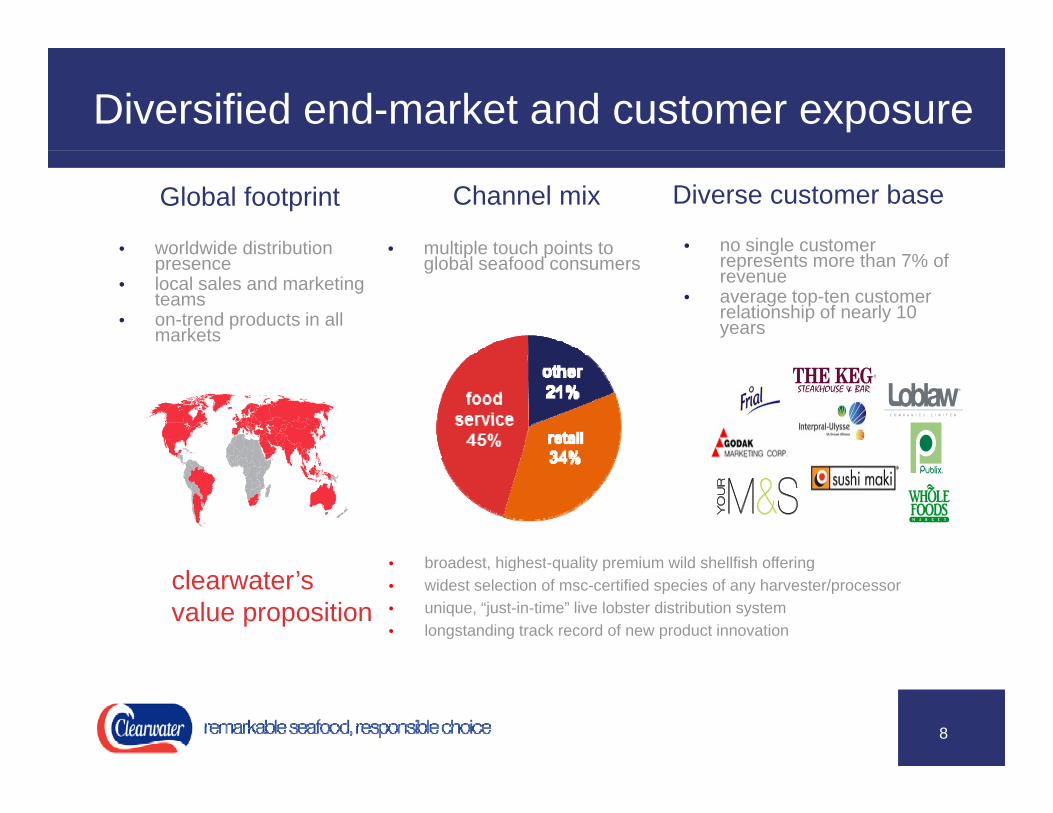
Diversified end-market and customer exposureDiversified end-market and customer exposure
Global footprint Diverse customer baseChannel mix
• worldwide distribution • multiple touch points to • no single customer worldwide distribution presence
• local sales and marketing teams
• on-trend products in all markets
multiple touch points to global seafood consumers
grepresents more than 7% of revenue
• average top-ten customer relationship of nearly 10 years
other21%21%
retail34%
broadest highest quality premium wild shellfish offeringclearwater’svalue proposition
• broadest, highest-quality premium wild shellfish offering• widest selection of msc-certified species of any harvester/processor• unique, “just-in-time” live lobster distribution system • longstanding track record of new product innovation
8

China consumer spending – an attractive long-term opportunityChina consumer spending – an attractive long-term opportunitypp ypp y
9
size of retail markets ($us tm)size of retail markets(us $ trn)
6
7
8
3
4
5 201220162022
0
1
2
china us india japan russia brazil
“This year, the Chinese retail sector is expected to complete a hat trick. It’s going to become the world’s largest grocery market, the world’s largest luxury market, and also the largest e-commerce market.”
9
source: the economist intelligence unit
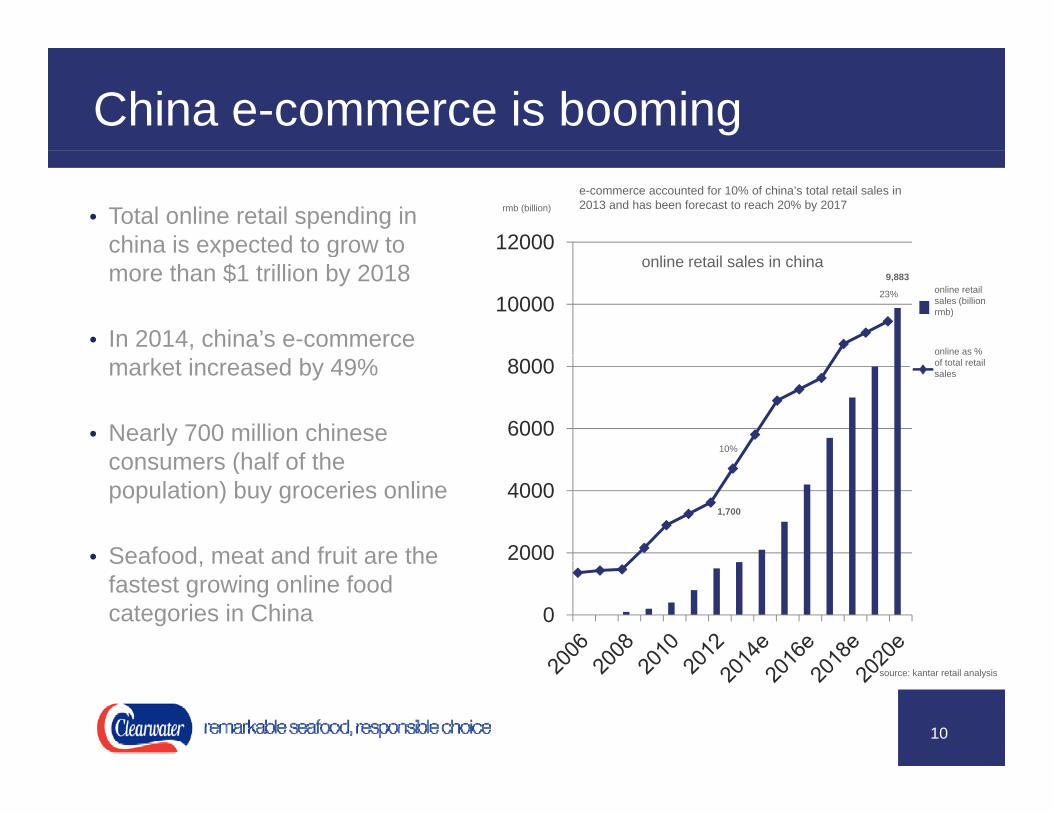
China e-commerce is boomingChina e-commerce is booming
• Total online retail spending in china is expected to grow to 12000
e-commerce accounted for 10% of china’s total retail sales in 2013 and has been forecast to reach 20% by 2017rmb (billion)
p gmore than $1 trillion by 2018
• In 2014, china’s e-commerce 10000
online retail sales (billion rmb)
online as %
23%
23%
9,883online retail sales in china
market increased by 49%
• Nearly 700 million chineseconsumers (half of the
6000
8000 of total retail sales
10%
consumers (half of the population) buy groceries online
• Seafood meat and fruit are the 2000
40001,700
Seafood, meat and fruit are the fastest growing online food categories in China 0
10
source: kantar retail analysis

Significant barriers to entry create a defensible market positionSignificant barriers to entry create a defensible market positionpp
• Licensing is required to catch all species harvested byClearwater in the Canadian and Argentine offshorefi h i R l t th iti i b th t i t i tl
automated shucking
fisheries. Regulatory authorities in both countries strictlycontrol the number of licensed enterprises and the grantingof new licenses is extremely rare.
• Significant capital is required to build or acquire and outfitg p q qvessels (Clearwater’s fleet and license values areestimated to be worth more than $500 million).
• Ongoing investments in R&D - Significant investments inproprietary technology and operations that reduce cost
branded lobster
p p y gy pand/or increase productivity require a knowledgeablemanagement team.
• Global reach - A global, direct sales force that is capableof interacting with and selling directly to diverse markets gis/ocean bottom mappingof interacting with and selling directly to diverse marketsworldwide is required in order to execute on pricingopportunities.
(C$ in millions)
11
(C$ in millions)

Expanding our supply: new vessel launched July 2015Expanding our supply: new vessel launched July 2015
l ifi ti
length oa 73.4 m
vessel specifications
breadth 16.5 mgross tonnage 4000 taccommodation 41 crewmain engine 2 Cat. 3606g
Th l h f ll f t blThe vessel has a full factory capable of processing and freezing cockle clams, surf clams and propeller clams
12

Expanding our supply (continued)Expanding our supply (continued)
• Expands access to cockle, surf and propeller clams
• Once fully operational, expected to increase y p pannual clam sales by up to 50%*
arctic surf clam
cockle clamcockle clam propeller clampropeller clam
13
* based on 2014 annual clam sales
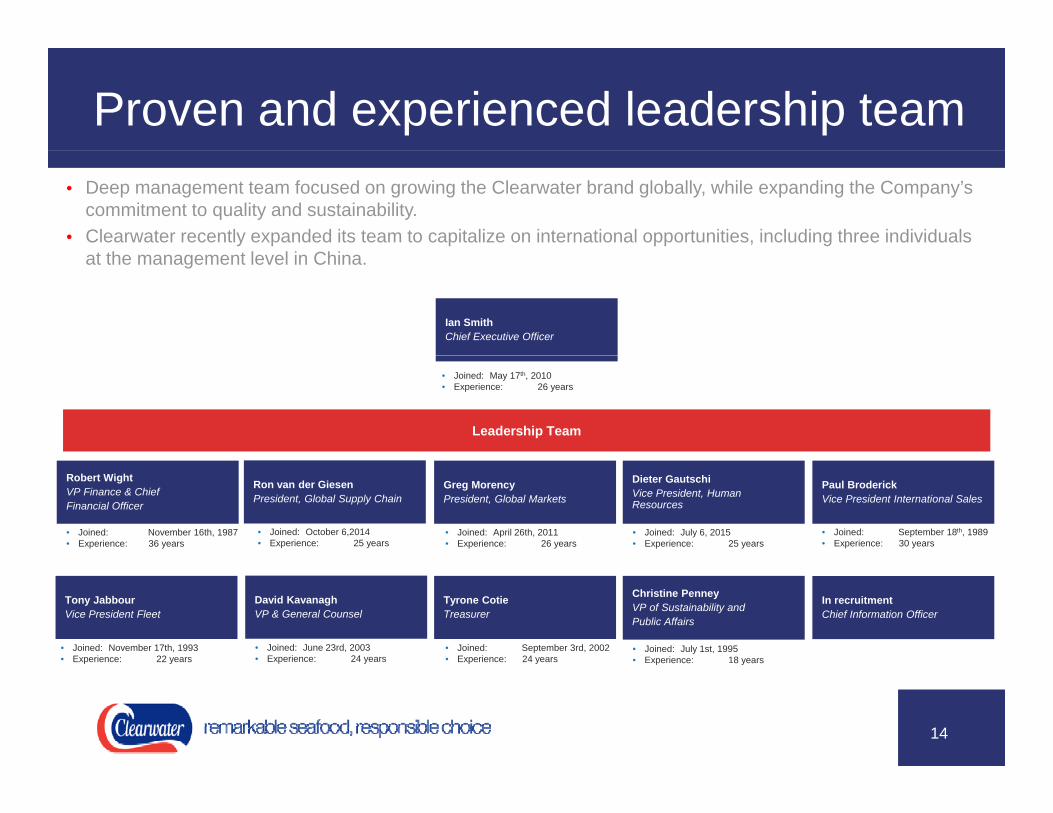
Proven and experienced leadership teamProven and experienced leadership team• Deep management team focused on growing the Clearwater brand globally, while expanding the Company’s
commitment to quality and sustainability.• Clearwater recently expanded its team to capitalize on international opportunities, including three individuals
t th t l l i Chiat the management level in China.
Ian SmithChief Executive Officer
• Joined: May 17th, 2010• Experience: 26 years
Leadership Team
Robert WightVP Finance & Chief Financial Officer
Dieter GautschiVice President, Human Resources
Greg MorencyPresident, Global Markets
• Joined: November 16th, 1987• Experience: 36 years
• Joined: April 26th, 2011• Experience: 26 years
• Joined: July 6, 2015• Experience: 25 years
Ron van der GiesenPresident, Global Supply Chain
• Joined: October 6,2014• Experience: 25 years
Paul BroderickVice President International Sales
• Joined: September 18th, 1989• Experience: 30 years
Tony JabbourVice President Fleet
Christine PenneyVP of Sustainability and Public Affairs
Tyrone CotieTreasurer
• Joined: November 17th, 1993• Experience: 22 years
• Joined: September 3rd, 2002• Experience: 24 years
• Joined: July 1st, 1995• Experience: 18 years
In recruitmentChief Information Officer
David KavanaghVP & General Counsel
• Joined: June 23rd, 2003• Experience: 24 years
14
p y p y pe e ce 8 yea sp y

Multiple sources of long-term cash flow stabilityMultiple sources of long-term cash flow stability
• Unique, protected access to a scarce, highly-regulated resource• Diminishing growth rates in global supply over next three decades• Growing focus on management of fisheries (i e licensing and quota protection)Scarcity Growing focus on management of fisheries (i.e. licensing and quota protection)• Scale of quota ownership attractive to major global customers (access to supply more important
than price)
• Robust global seafood fundamentals• Growth in per capita consumption in developed and developing markets• On-trend with consumers push toward higher quality, healthier proteins
Di d t d i i id lti l t t h i t
Demand
• Diverse product and species mix provides multiple customer touch points• Attractive value proposition for customers across all channels (retail, white table cloth, export,
etc.)• Track record of successful innovation (packaging, branding, value-added)
Productoffering
• Consistent track record of pricing gains• Focus on “high-value” premium species • MSCc certification, 100% traceability and food safety track record provides additional pricing halo
Pricing power
15
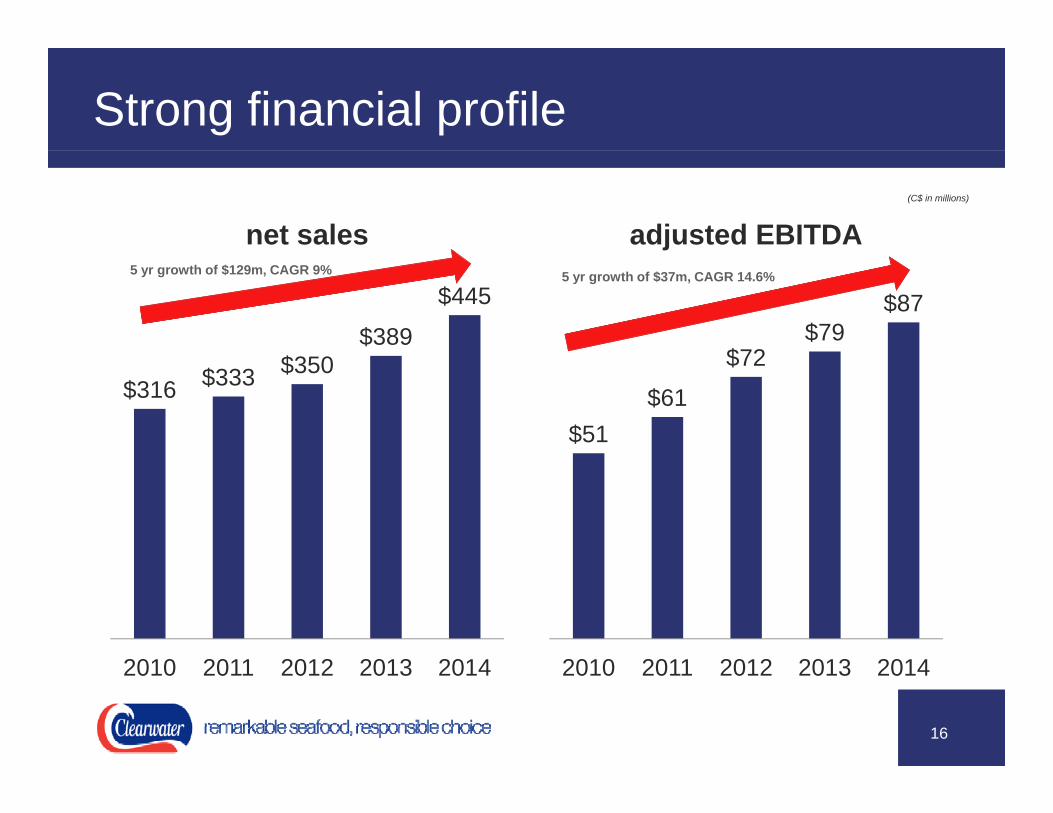
Strong financial profileStrong financial profile
net sales adjusted EBITDA(C$ in millions)
$$389
$445
$72$79
$875 yr growth of $129m, CAGR 9% 5 yr growth of $37m, CAGR 14.6%
$316 $333 $350
$51$61
$72
2010 2011 2012 2013 2014 2010 2011 2012 2013 20142010 2011 2012 2013 2014 2010 2011 2012 2013 2014
16
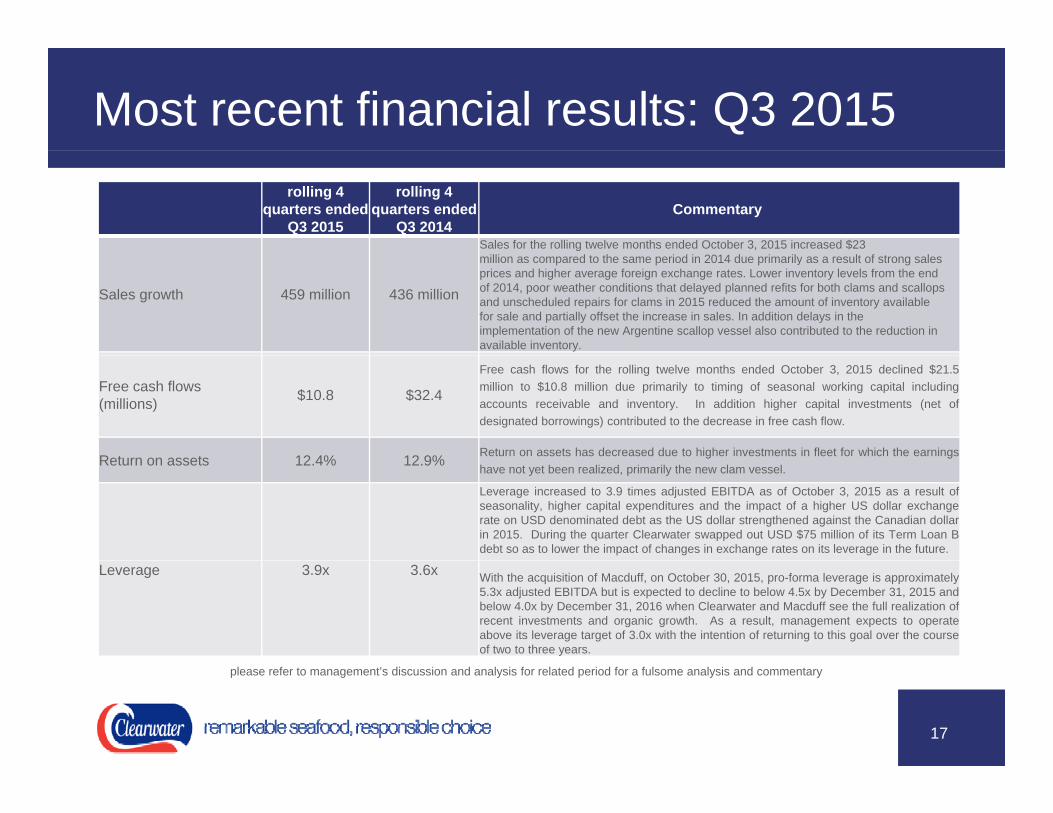
Most recent financial results: Q3 2015Most recent financial results: Q3 2015rolling 4
quarters ended Q3 2015
rolling 4 quarters ended
Q3 2014Commentary
Sales for the rolling twelve months ended October 3, 2015 increased $23
Sales growth 459 million 436 million
million as compared to the same period in 2014 due primarily as a result of strong salesprices and higher average foreign exchange rates. Lower inventory levels from the endof 2014, poor weather conditions that delayed planned refits for both clams and scallopsand unscheduled repairs for clams in 2015 reduced the amount of inventory availablefor sale and partially offset the increase in sales. In addition delays in theimplementation of the new Argentine scallop vessel also contributed to the reduction inavailable inventory.
Free cash flows (millions) $10.8 $32.4
Free cash flows for the rolling twelve months ended October 3, 2015 declined $21.5million to $10.8 million due primarily to timing of seasonal working capital includingaccounts receivable and inventory. In addition higher capital investments (net ofdesignated borrowings) contributed to the decrease in free cash flow.
Return on assets 12 4% 12 9% Return on assets has decreased due to higher investments in fleet for which the earningsReturn on assets 12.4% 12.9% g ghave not yet been realized, primarily the new clam vessel.
Leverage increased to 3.9 times adjusted EBITDA as of October 3, 2015 as a result ofseasonality, higher capital expenditures and the impact of a higher US dollar exchangerate on USD denominated debt as the US dollar strengthened against the Canadian dollarin 2015. During the quarter Clearwater swapped out USD $75 million of its Term Loan Bdebt so as to lower the impact of changes in exchange rates on its leverage in the future.
Leverage 3.9x 3.6x With the acquisition of Macduff, on October 30, 2015, pro-forma leverage is approximately5.3x adjusted EBITDA but is expected to decline to below 4.5x by December 31, 2015 andbelow 4.0x by December 31, 2016 when Clearwater and Macduff see the full realization ofrecent investments and organic growth. As a result, management expects to operateabove its leverage target of 3.0x with the intention of returning to this goal over the courseof two to three years.
17
please refer to management’s discussion and analysis for related period for a fulsome analysis and commentary
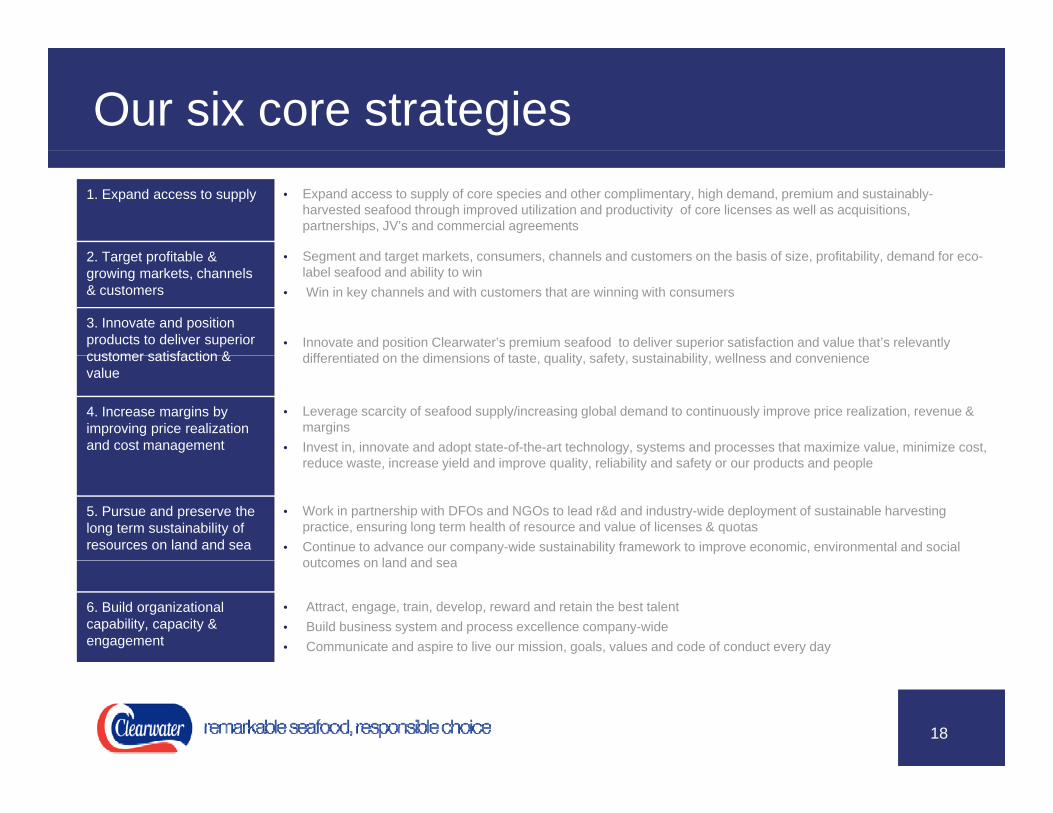
Our six core strategiesOur six core strategies1. Expand access to supply • Expand access to supply of core species and other complimentary, high demand, premium and sustainably-
harvested seafood through improved utilization and productivity of core licenses as well as acquisitions, partnerships, JV’s and commercial agreements
2 T t fit bl & S t d t t k t h l d t th b i f i fit bilit d d f2. Target profitable & growing markets, channels & customers
• Segment and target markets, consumers, channels and customers on the basis of size, profitability, demand for eco-label seafood and ability to win
• Win in key channels and with customers that are winning with consumers
3. Innovate and position products to deliver superior customer satisfaction &
• Innovate and position Clearwater’s premium seafood to deliver superior satisfaction and value that’s relevantly diff ti t d th di i f t t lit f t t i bilit ll d icustomer satisfaction &
valuedifferentiated on the dimensions of taste, quality, safety, sustainability, wellness and convenience
4. Increase margins by improving price realization and cost management
• Leverage scarcity of seafood supply/increasing global demand to continuously improve price realization, revenue & margins
• Invest in, innovate and adopt state-of-the-art technology, systems and processes that maximize value, minimize cost, d i i ld d i li li bili d f d d lreduce waste, increase yield and improve quality, reliability and safety or our products and people
5. Pursue and preserve the long term sustainability of resources on land and sea
• Work in partnership with DFOs and NGOs to lead r&d and industry-wide deployment of sustainable harvesting practice, ensuring long term health of resource and value of licenses & quotas
• Continue to advance our company-wide sustainability framework to improve economic, environmental and social outcomes on land and seaoutcomes on land and sea
6. Build organizational capability, capacity & engagement
• Attract, engage, train, develop, reward and retain the best talent• Build business system and process excellence company-wide • Communicate and aspire to live our mission, goals, values and code of conduct every day
18
key investment highlightskey investment highlights
Leading Global Provider of Wild-Caught Shellfish
Powerful Industry Fundamentals
Proven and Experienced
Management Team
Strong Financial Performance
Diversified End-Market and
Customer Exposure
Substantial Assets
Significant Barriers to Entry Create a
Defensible Market Position
19
Macduff transactionMacduff transaction
20
Transaction OverviewTransaction Overview• On October 30, 2015 Clearwater successfully completed its acquisition of Macduff Shellfish Group
Limited (“Macduff”), one of Europe’s leading wild shellfish companies for a purchase price of £94.4 million plus seasonal working capital debt.
• This investment strengthens Clearwater’s leading global market position in complementary premium wild seafood with an immediate 20% expansion of supply (approximately 15 million pounds) of high quality shellfish including; scallops, langoustine, whelk and crab.
• In addition, Macduff is positioned for growth in 2016. In June 2015 Macduff acquired an additional 4 scallop trawlers and licenses (bringing their fleet to 14 mid-shore scallop harvesting vessels) along with additional preferred procurement access in complementary shellfish species (i.e. whelk). This recent investment along with additional organic growth are projected to help Macduff grow adjusted EBITDAinvestment along with additional organic growth are projected to help Macduff grow adjusted EBITDA another 25% to £11.5 million in fiscal 2016. Looking out further, management have identified further opportunities to invest that can further enhance volume, revenue, margins and adjusted EBITDA.
• Taking into account the purchase price of £94 4 million (which excludes seasonal working capital debt)• Taking into account the purchase price of £94.4 million (which excludes seasonal working capital debt) and the pro-forma 2016 adjusted EBITDA of £11.5 million, management estimates the effective acquisition multiple on the transaction is approximately 8.2 times adjusted EBITDA. The transaction is expected to be accretive to adjusted EBITDA in 2016 by up to CAD $0.38 per share and adjusted earnings by up to CAD $0.17 per share.
21

Macduff OverviewMacduff OverviewTRANSACTION RATIONALE
Macduff is one of Europe’s leading wild shellfish processors and is avertically integrated business, Macduff is still run by the founder’sdescendants today
COMPANY AND INDUSTRY OVERVIEW
Macduff brings abundant access to additional seafood supply in keymarkets and channels along with a well-established brand, U.K.-basedharvesting and processing expertise, a strong local management team,y
Macduff owns one of UK’s largest scallop fishing fleet, comprised of 14vessels and sells its fresh and frozen harvests to European and Far Westnations
g p g p , g g ,and a talented workforce
The acquisition of Macduff will significantly enhance Clearwater’s scale,and provide opportunities to access additional supply and accelerate thegrowth of revenues, profit, and free cash flow
Provides Clearwater with access to approximately 28% of the UnitedKingdom’s supply of king scallops and whelk. Products include King and
Additionally, Macduff has two highly automated processing plants (inMintlaw and Stornoway) that allow the company to handle any size of
t h ith l d ti d ti l d t lit
Queen scallops, langoustines, brown crab and whelk and overall providesaccess on an annual basis to an approximately 15 million pounds of premium,wild caught, safe, traceable and complementary shellfish species.
Provides enhanced access to key distribution channels including food serviceand grocery retail in multiple markets including the UK, Italy, Spain andPortugal.
Expand the distribution of Macduff products with Clearwater providingcatch with lean production and optimal product quality
For the year ended September 30, 2015 MacDuff is expected to generateapproximately £52 million of sales and £9.2 million of adjusted EBITDA,representing annual growth of 13% and 30%, respectively
Significant barriers to entry to Scotland’s shellfish industry from highinvestment and start up costs
p p p gexpanded market and customer service/access as well as sales andmarketing strength in North America and Asia, especially Japan and China.
Expands Clearwater’s North Atlantic harvesting operations and providesintegrated UK-based primary and secondary processing capabilities andexpertise with land-based processing facilities in Scotland.
Creates a new growth platform for Clearwater that will complement our robustorganic growth plans. Having grown rapidly over the past four years, Macdufforganic growth plans. Having grown rapidly over the past four years, Macduffis the fishing company best positioned to lead and benefit from futureinvestment in the European Union and it has identified multiple opportunitiesto fuel such growth. This growth will provide opportunities to invest and,develop and engage our entire workforce.
22
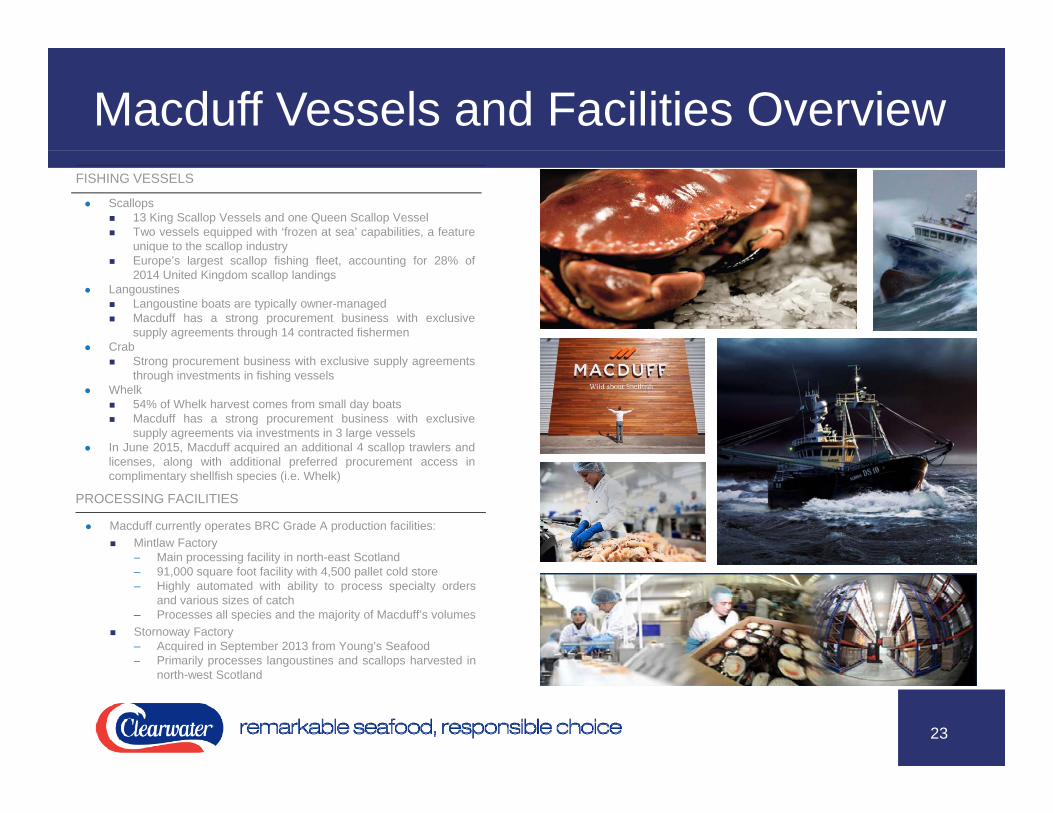
Macduff Vessels and Facilities OverviewMacduff Vessels and Facilities Overview
Scallops13 King Scallop Vessels and one Queen Scallop VesselTwo vessels equipped with ‘frozen at sea’ capabilities, a featureunique to the scallop industry
FISHING VESSELS
Europe’s largest scallop fishing fleet, accounting for 28% of2014 United Kingdom scallop landings
LangoustinesLangoustine boats are typically owner-managedMacduff has a strong procurement business with exclusivesupply agreements through 14 contracted fishermen
CrabStrong procurement business with exclusive supply agreementsthrough investments in fishing vessels
Whelk54% of Whelk harvest comes from small day boatsMacduff has a strong procurement business with exclusivesupply agreements via investments in 3 large vessels
In June 2015, Macduff acquired an additional 4 scallop trawlers andli l ith dditi l f d t ilicenses, along with additional preferred procurement access incomplimentary shellfish species (i.e. Whelk)
PROCESSING FACILITIES
Macduff currently operates BRC Grade A production facilities:Mintlaw Factory– Main processing facility in north-east ScotlandMain processing facility in north east Scotland– 91,000 square foot facility with 4,500 pallet cold store– Highly automated with ability to process specialty orders
and various sizes of catch– Processes all species and the majority of Macduff’s volumesStornoway Factory– Acquired in September 2013 from Young’s Seafood– Primarily processes langoustines and scallops harvested inPrimarily processes langoustines and scallops harvested in
north-west Scotland
23

Macduff productsMacduff products
24
Macduff productsMacduff products
25

Macduff productsMacduff products
26

Macduff productsMacduff products
27
AppendicesAppendices
28
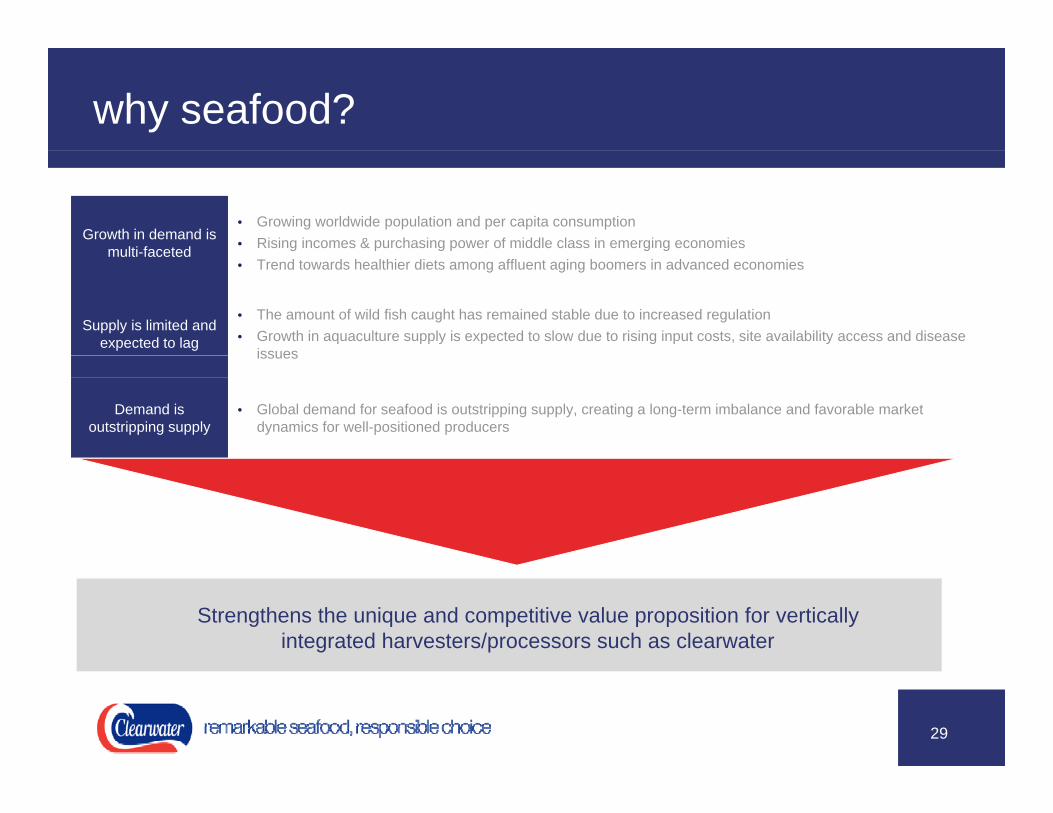
why seafood?why seafood?
Growth in demand is multi-faceted
• Growing worldwide population and per capita consumption• Rising incomes & purchasing power of middle class in emerging economiesmulti-faceted• Trend towards healthier diets among affluent aging boomers in advanced economies
Supply is limited and expected to lag
• The amount of wild fish caught has remained stable due to increased regulation• Growth in aquaculture supply is expected to slow due to rising input costs, site availability access and disease
issuesissues
Demand is outstripping supply
• Global demand for seafood is outstripping supply, creating a long-term imbalance and favorable market dynamics for well-positioned producers
Strengthens the unique and competitive value proposition for vertically integrated harvesters/processors such as clearwater
29
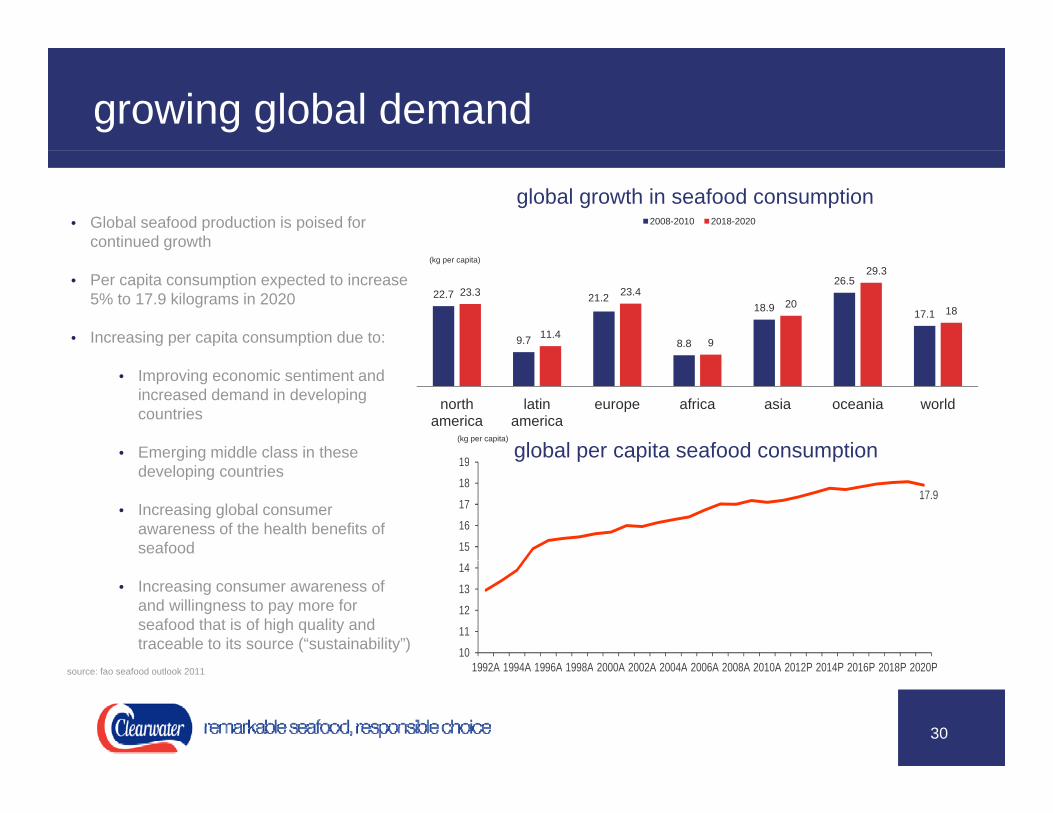
growing global demandgrowing global demand
global growth in seafood consumption2008-2010 2018-2020• Global seafood production is poised for
continued growth
22.7
9.7
21.2
8.8
18.9
26.5
17.1
23.3
11.4
23.4
9
20
29.3
18
(kg per capita)
• Per capita consumption expected to increase 5% to 17.9 kilograms in 2020
• Increasing per capita consumption due to:
north america
latin america
europe africa asia oceania world
19global per capita seafood consumption
(kg per capita)
• Improving economic sentiment and increased demand in developing countries
• Emerging middle class in these
17.9
15
16
17
18
19g p p pg g
developing countries
• Increasing global consumer awareness of the health benefits of seafood
10
11
12
13
14
1992A 1994A 1996A 1998A 2000A 2002A 2004A 2006A 2008A 2010A 2012P 2014P 2016P 2018P 2020P
• Increasing consumer awareness of and willingness to pay more for seafood that is of high quality and traceable to its source (“sustainability”)
30
1992A 1994A 1996A 1998A 2000A 2002A 2004A 2006A 2008A 2010A 2012P 2014P 2016P 2018P 2020Psource: fao seafood outlook 2011
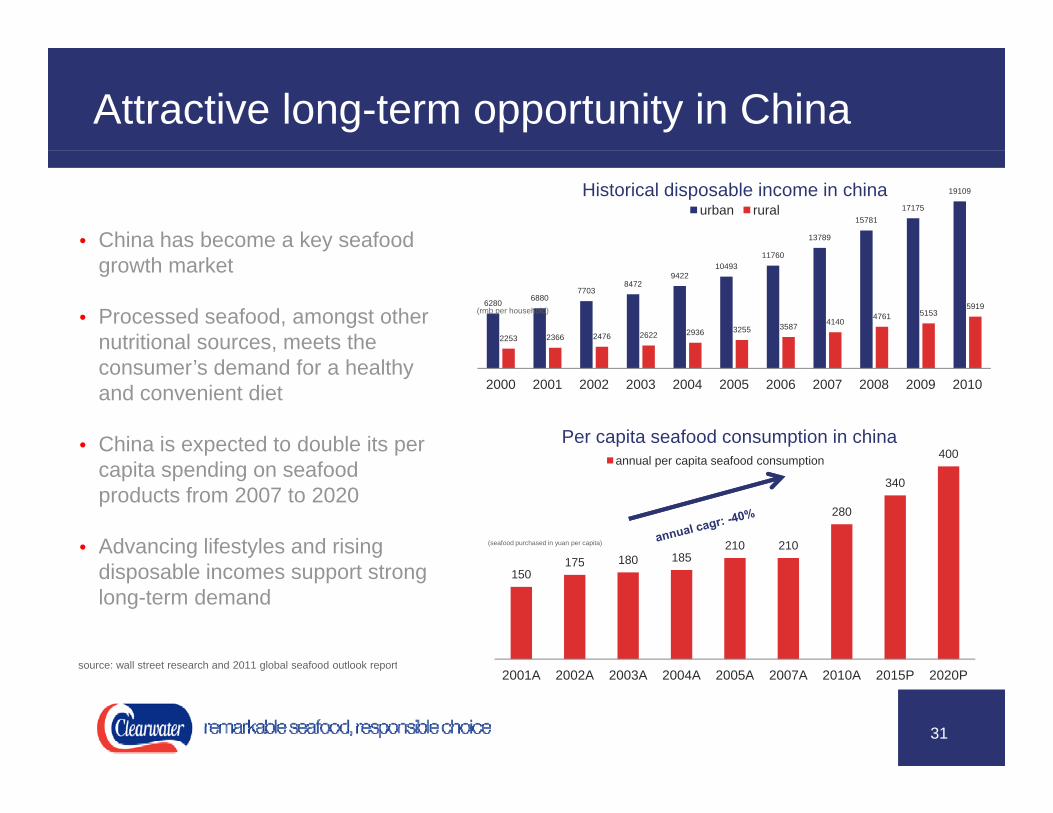
Attractive long-term opportunity in ChinaAttractive long-term opportunity in China
11760
13789
1578117175
19109Historical disposable income in chinaurban rural
• China has become a key seafood
6280 68807703
84729422
1049311760
2253 2366 2476 2622 2936 3255 3587 41404761 5153
5919(rmb per household)
growth market
• Processed seafood, amongst other nutritional sources, meets the
2000 2001 2002 2003 2004 2005 2006 2007 2008 2009 2010
400Per capita seafood consumption in china
l it f d ti
consumer’s demand for a healthy and convenient diet
• China is expected to double its per
175 180 185210 210
280
340
annual per capita seafood consumption
(seafood purchased in yuan per capita)
capita spending on seafood products from 2007 to 2020
• Advancing lifestyles and rising 150
175 180 185disposable incomes support strong long-term demand
so rce all street research and 2011 global seafood o tlook report
31
2001A 2002A 2003A 2004A 2005A 2007A 2010A 2015P 2020Psource: wall street research and 2011 global seafood outlook report
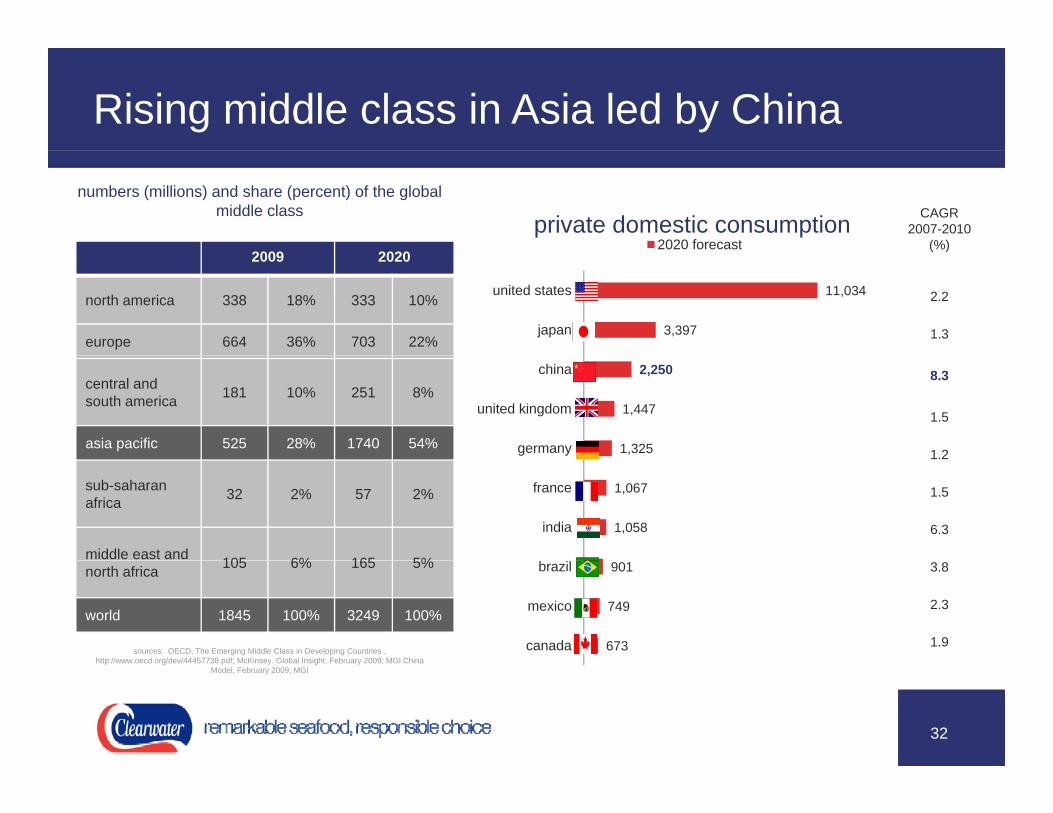
Rising middle class in Asia led by ChinaRising middle class in Asia led by China
2009 2020
numbers (millions) and share (percent) of the global middle class
private domestic consumption2020 forecast
CAGR2007-2010
(%)2009 2020
north america 338 18% 333 10%
europe 664 36% 703 22%3,397
11,034
japan
united states 2.2
1.3
central and south america 181 10% 251 8%
asia pacific 525 28% 1740 54% 1,325
1,447
2,250
germany
united kingdom
china 8.3
1.5
1.2
sub-saharanafrica 32 2% 57 2%
middle east and 105 6% 165 5%
1,058
1,067
india
france
1.2
1.5
6.3
north africa 105 6% 165 5%
world 1845 100% 3249 100%
sources: OECD, The Emerging Middle Class in Developing Countries , http://www.oecd.org/dev/44457738.pdf; McKinsey. Global Insight, February 2009; MGI China
673
749
901
canada
mexico
brazil 3.8
2.3
1.9
32
http://www.oecd.org/dev/44457738.pdf; McKinsey. Global Insight, February 2009; MGI China Model, February 2009; MGI

Seafood demand expected to continue to exceed supplySeafood demand expected to continue to exceed supply
Global “Wild Caught” Seafood Production
Global Population
Global Aquaculture Production
Per Capital Consumption
global “wild caught” seafood production
global population
global aquaculture production
per capita consumption
140Ton
s)
al P
rod
uct
ion
160
180
15.0
17.0
19.0
tion
(kg/
pp)
ns)
80
100
120
140
uct
ion
(M
illio
n
s) /
Pe
r C
ap
ita(k
g/P
P)
9.0
11.0
13.0
er c
apita
pro
duct
uctio
n (m
illio
n to
n
40
60
80
Glo
ba
l Pro
d
ula
tion
(b
illio
ns
3.0
5.0
7.0
latio
n (b
illio
ns)/p
e
glob
al p
rodu
1950
20
Po
pu
-1.0
1.0
1955 1960 1965 1970 1975 1980 1985 1990 1995 2000 2005 2010 2015 2020
popu
source: fao – fisheries and aquaculture information and statistics service; oecd-fao acgricultural outlook 2011-2020; moody’s economy.com; moody’s investors service estimates.
33

Seafood prices have been risingSeafood prices have been rising
160FAO fish price index (rebased, 2000=100)
120140160
6080
100
0204060
02000 2001 2002 2003 2004 2005 2006 2007 2008 2009 2010 2011 2012 2013 2014
fao fish price index (rebased, 2000=100)
34
source: fao

…and prices are expected to increase through 2020…and prices are expected to increase through 2020
• Supply-demand imbalance worldwide 140
150
estimated global seafood price growth (in nominal value)
• Increased product innovation and value-added product 100
110
120
130
development
• Higher cost required to maintain sustainable fisheries
80
90
2010 2011 2012 2013 2014 2015 2016 2017 2018 2019 2020
Aquaculture Fish, trade Capture
2000-2020 price growth by seafood segmentmaintain sustainable fisheries
• Primary capture harvesters expected to realize
19%
23%30%
43%
50%p g y g
papproximately 23% growth in price between 2000 and 2020
19%
fish oil capture/wild traded/ fish meal aquaculture
35
exportedsource: oecd and fao secretariats

Highly focused producer with a clear species-based strategy and global footprintHighly focused producer with a clear species-based strategy and global footprintgy g pgy g p
1 3
2
salmonidsatlantic salmoncohosea trout
Most companies in the seafood sector can be placed in one or more species-based subsectors 3
white fishcod
2
4
crustaceans and molluscsshrimpcrabslobstermolluscs (mussels, oysters)albalonesoctopus and squid
king salmon
1
alaska pollockhaketilapiapangasiusflatfish
4
6small pelagicmackerelsardineherringfish meal and fish oil
2
52
4 tunacanned tunacanned mackerels and sardother shelf stable seafood p
fish meal and fish oil
Other
5
5
56 value added and traders
36
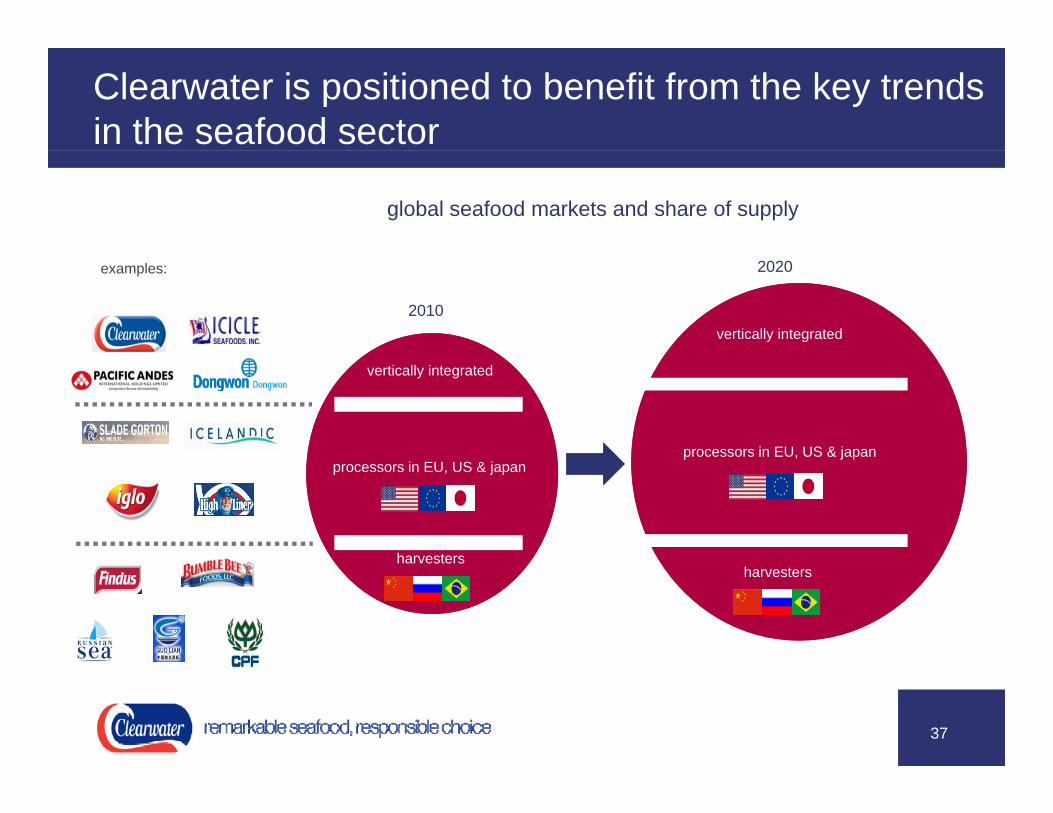
Clearwater is positioned to benefit from the key trends in the seafood sectorClearwater is positioned to benefit from the key trends in the seafood sector
global seafood markets and share of supply
vertically integrated2010
2020examples:
vertically integrated
processors in EU, US & japanprocessors in EU, US & japan
harvesters
p , j p
harvestersharvesters
37
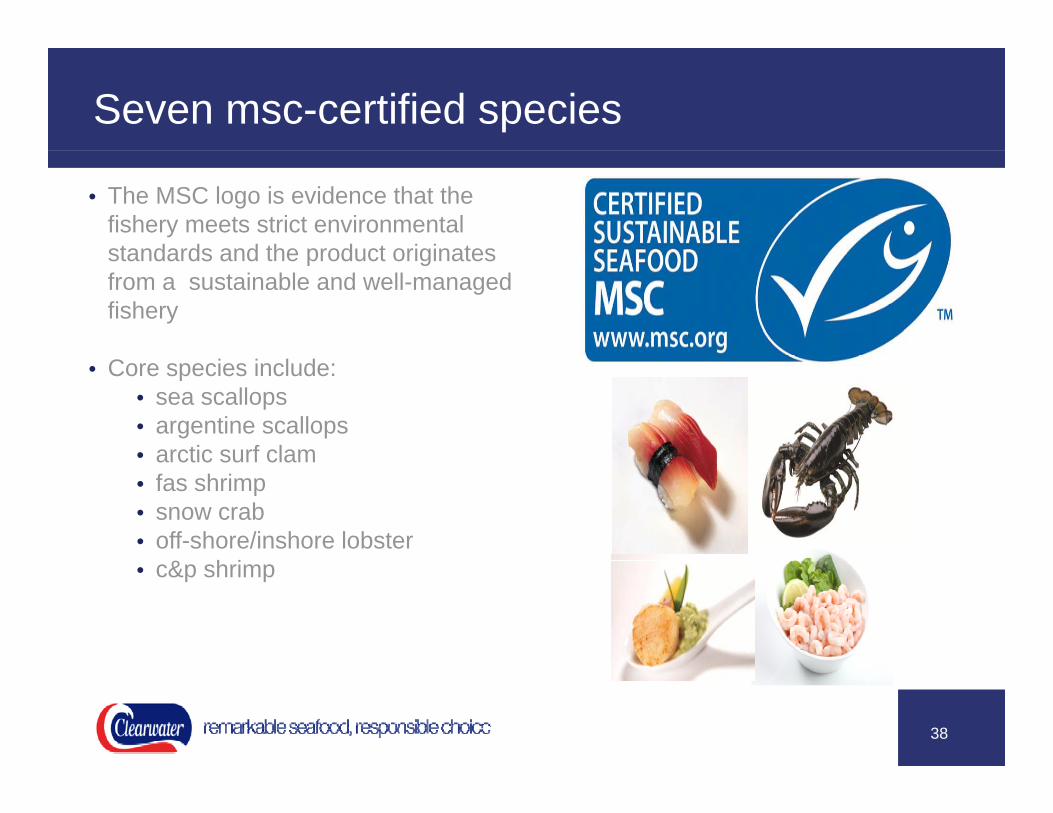
Seven msc-certified speciesSeven msc-certified species
• The MSC logo is evidence that the fishery meets strict environmental standards and the product originatesstandards and the product originates from a sustainable and well-managed fishery
• Core species include: • sea scallops• argentine scallops• arctic surf clamarctic surf clam• fas shrimp• snow crab• off-shore/inshore lobster
& h i• c&p shrimp
38
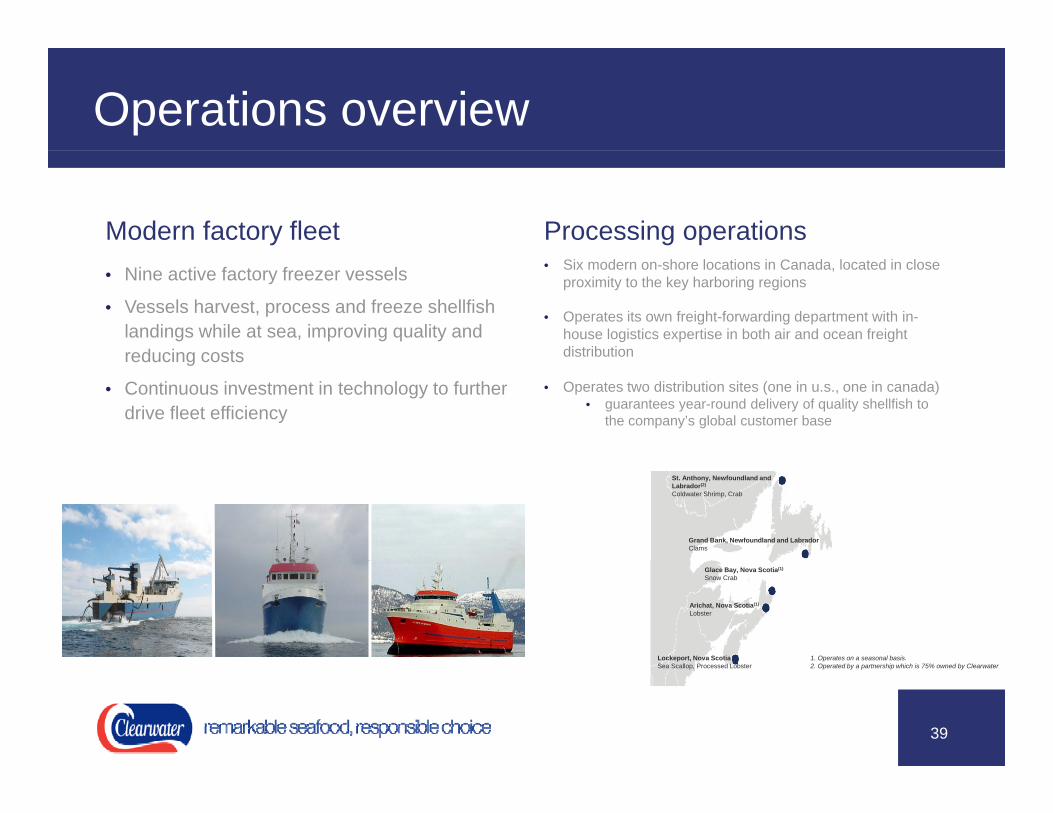
Operations overviewOperations overview
Modern factory fleet Processing operations• Nine active factory freezer vessels
• Vessels harvest, process and freeze shellfish landings while at sea, improving quality and reducing costs
• Six modern on-shore locations in Canada, located in close proximity to the key harboring regions
• Operates its own freight-forwarding department with in-house logistics expertise in both air and ocean freight distributionreducing costs
• Continuous investment in technology to further drive fleet efficiency
distribution
• Operates two distribution sites (one in u.s., one in canada)• guarantees year-round delivery of quality shellfish to
the company’s global customer base
St. Anthony, Newfoundland and Labrador(2)
Coldwater Shrimp, Crab
Grand Bank, Newfoundland and LabradorClams
Glace Bay, Nova Scotia(1)
Snow Crab
Arichat, Nova Scotia(1)
Lobster
Lockeport, Nova Scotia 1. Operates on a seasonal basis.
39
Sea Scallop, Processed Lobster 2. Operated by a partnership which is 75% owned by Clearwater
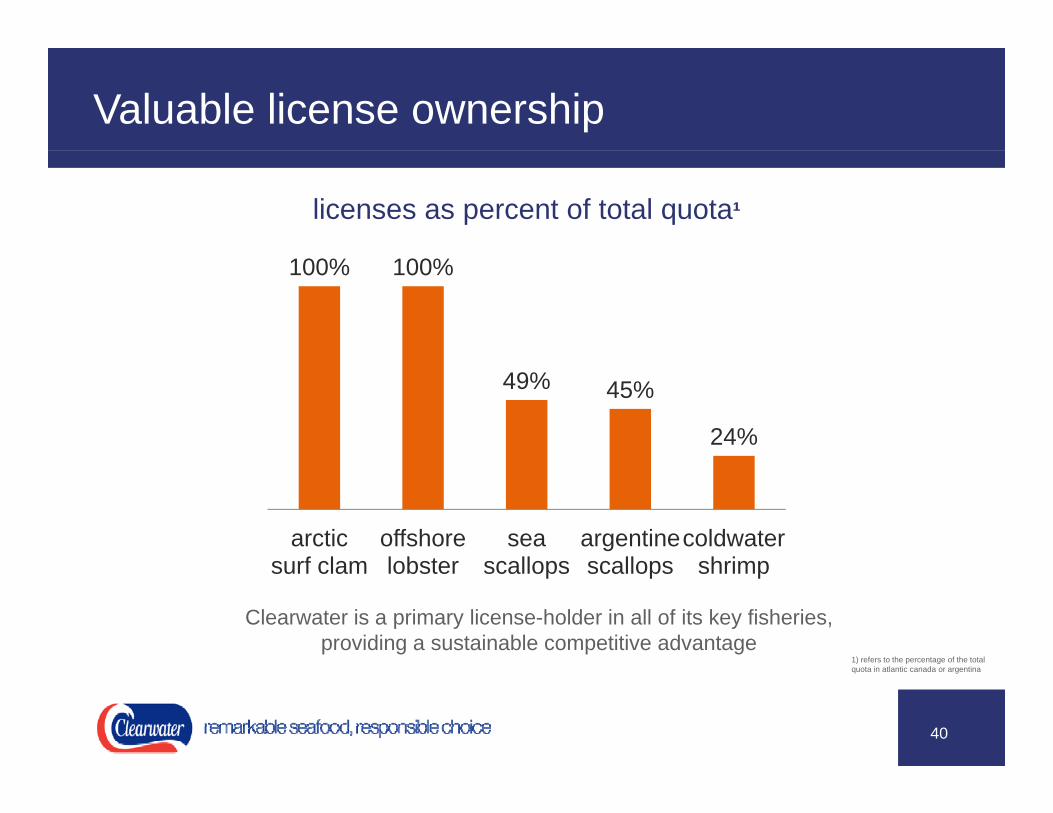
Valuable license ownershipValuable license ownership
licenses as percent of total quota¹
100% 100%
49% 45%
24%
arctic f l
offshore l b t
sea ll
argentine ll
coldwater h isurf clam lobster scallops scallops shrimp
Clearwater is a primary license-holder in all of its key fisheries, providing a sustainable competitive advantage
1) refers to the percentage of the total
40
) p gquota in atlantic canada or argentina
