investor presentation q2 f19 - mahindra & mahindra · presentation q2 f19 v s parthasarathy...
TRANSCRIPT

INVESTOR PRESENTATION
Q2 F19V S Parthasarathy
Group CFO14th Nov 2018

Economic ENVIRONMENTWORLD ECONOMY
Sustained US growth outlook – Expected to grow 2.9% in 2018 & 2.5% in 2019; USD strengthens
Crude eases from earlier highs, commodities moderating but sheet metal continues to be elevated
Fed hikes rates - US Fed hikes rates by 25bps, 1 more hike expected in 2018 and 3 in 2019
IMF marginally cut global growth forecast – Growth estimated at 3.7% in 2018 & 2019
China's economy slows – Growth down to 6.5% in Q3CY18; IMF revises to 6.2% in 2019
Trade disruptions – Further disruptions in trade policies and increasing uncertainty
Emerging economy risks – Lower investment & manufacturing cycles expected
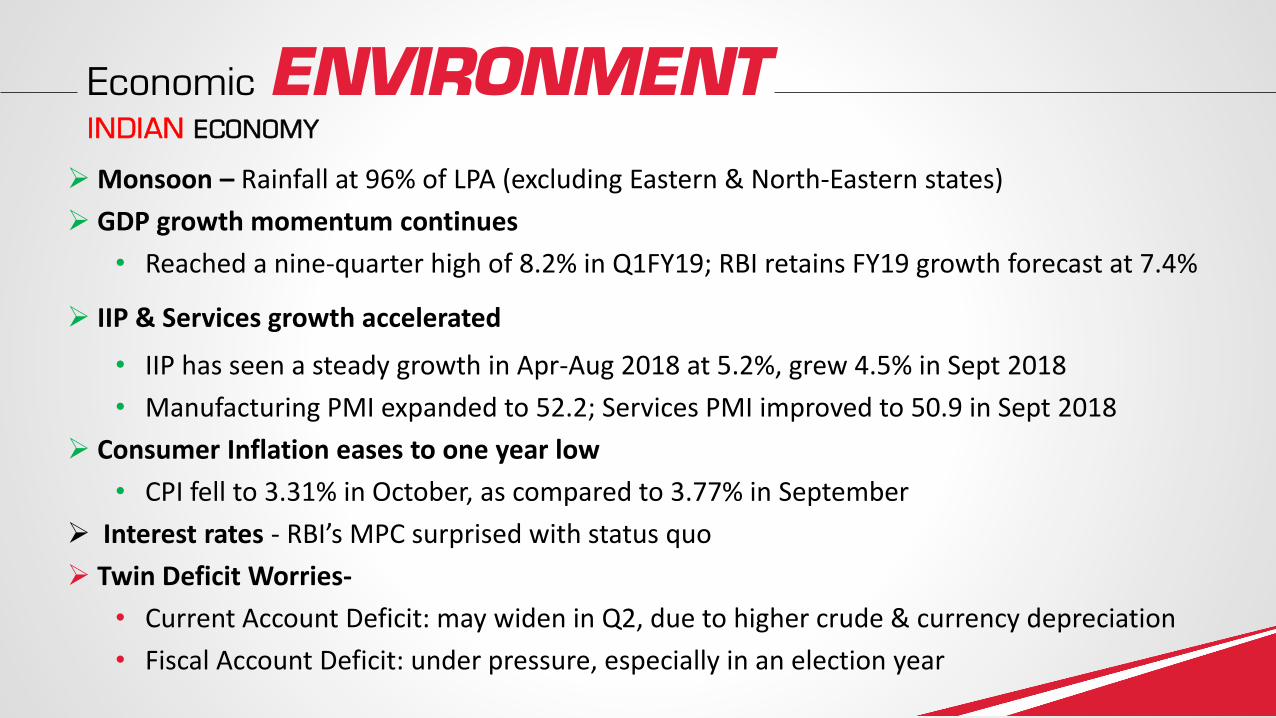
Economic ENVIRONMENTINDIAN ECONOMY
Monsoon – Rainfall at 96% of LPA (excluding Eastern & North-Eastern states)
GDP growth momentum continues
• Reached a nine-quarter high of 8.2% in Q1FY19; RBI retains FY19 growth forecast at 7.4%
IIP & Services growth accelerated
• IIP has seen a steady growth in Apr-Aug 2018 at 5.2%, grew 4.5% in Sept 2018
• Manufacturing PMI expanded to 52.2; Services PMI improved to 50.9 in Sept 2018
Consumer Inflation eases to one year low
• CPI fell to 3.31% in October, as compared to 3.77% in September
Interest rates - RBI’s MPC surprised with status quo
Twin Deficit Worries-
• Current Account Deficit: may widen in Q2, due to higher crude & currency depreciation
• Fiscal Account Deficit: under pressure, especially in an election year

Automotive Sector

Q2 F19 Domestic performance
Segment Q2F19 Q2F18 Growth
Utility Vehicles 55,656 61,516 -9.5%
Vans & Cars 5,211 4,098 27.2%
LCV up to 3.5T 57,592 46,910 22.8%
LCV>3.5T (incl Passenger) 1,857 1,540 20.6%
MHCV 3,078 2,079 48.1%
3W 17,769 13,611 30.5%
Domestic Total 141,163 129,754 8.8%

Auto Exports performance
7,772 9,244
Q2 FY 18 Q2 FY 19
Q2 F19 Auto Export
19%
Continued positive momentum
Key Markets Growth
South Asia 6%
MSA 10%
Rest of Africa 5%
Rest of the world 90%
Philippines Jeepney Deliveries
Chile CII & Mahindra Adventure Events

Farm Equipment Sector

Domestic Tractor Industry
* Ace, Captain, Preet joined TMA on 1 April 2018; Kubota and Indofarm joined TMA on 1 July 2018Market Share and Industry Growth updated F17 onwards

Tractor Exports performanceHighest ever Q2 exports
3,983 4,133
Q2 F18 Q2 F19
Tractor Export Q2 F19
3.8%
Key Markets Variation
SNBB 12.4%
MUSA - 4.8%
Africa - 1.3%
Highest ever Q2 exports

Key
Highlights

New LaunchesMarazzo Records over 10,000 + Bookings within just 1 month

New Launches: BLAZO X

Ranked #1 in JDP: SSI 2018
819
826
834
834
836
838
838
840
846
856
866
700 750 800 850 900
Renault
Volkswagen
Tata
Honda
Datsun
Maruti Suzuki
Hyundai
Mass Market Index
Ford
Toyota
Mahindra
Sales Satisfaction Index Ranking
20182017
816
818
818
826
838
842
844
856
860
871
876
883
700 750 800 850 900
Renault
Honda
Datsun
Maruti Suzuki
Tata
Mass Market Index
Volkswagen
Ford
Toyota
Jeep
Hyundai
Mahindra
2 years in a row, 3 times in 4 years

Ranked #3 in JDP: CSI 2018Better than Industry average, improved position from # 4 to # 3
770
775
791
806
807
831
832
844
871
877
893
893
923
Volkswagen
Renault
Chevrolet
Toyota
Ford
Honda
Datsun
Nissan
Mahindra
Mass market Average
Tata
Maruti Suzuki
Hyundai
Customer Service Index Ranking
20182017
789
793
794
796
804
810
815
827
829
838
865
874
912
Chevrolet
Nissan
Renault
Volkswagen
Maruti Suzuki
Honda
Datsun
Toyota
Ford
Mass market Average
Mahindra
Tata
Hyundai

Mahindra & Ford: Strategic AllianceStrategic Alliance progressing: Signs two Agreements
o M&M to supply BS VI compliant gasoline engines for Ford’s current and future vehicles
o M&M and Ford to jointly develop connected vehicle solutions
Both Companies continue to make progress on other areas:
o Leveraging respective strength on product development, which includes development of CSUV and electric vehicle
o Leveraging the benefits of Ford’s global reach & expertise

PF0 @ Pebble Beach
First private viewings at Pebble Beach, California in August 2018 – strong demand seen for limited PF0 allocation and significant interest from leading US luxury car retailers
Final design and name to be revealed in the Geneva Auto Show in March 2019

‘No-Worry’ LeasingA unique ownership experience for retail buyers
Introduced “Leasing by Mahindra”
Expands purchase options, makes ownership experience more affordable, convenient & hassle free

Mahindra Summit Agriscience Ltd JV with Sumitomo Corporation
Leverage deep presence in India’s rural market through Mahindra’s Ecosystem
Launch new-age crop protection molecules via relationships with large Japanese R&D Houses

Mahindra PowerolDebuts into Marine Engines segment with it’s all new Seahawk Series
Sea Hawk range of 8
marine engines and
3 Marine DG’s
24 HP to 300 HP
Marine engine range
and 15 Kva to 40 Kva
range of Marine DG’s

Re-affirmation of strong credit profile by all 4 rating agencies-5th year running and still counting
Highest competitive pricing, not only for M&M but also for group companies
Assurance to the entire ecosystem of vendors, suppliers, collaborators & other stakeholders
‘AAA’ Re-affirmation

Forbes 2018Global World’s Best Employers
Ranked # 55

Golden Peacock Award for excellence in Corporate Governance – Tech Mahindra

FINANCIALSNAPSHOT
Q2 F19

F 19 Q2 F 18 Q2
150407 137526 9.4 %
77145 80967 -4.7 %
12790 12019 6.4 %
1849 1923 -3.9 %
14.5 16.0 -150 bps
2199 2079 5.7 %
2161 2035 6.2 %
1642 1411 16.4 %
2298 2035 12.9 %
1779 1411 26.1 %24
QUARTERLY RESULTS SNAPSHOT(Rs. Crs)
Net Sales & Op. Income
OPM
PBIT
PBT (before EI)
PAT (before EI)
PBT (after EI)
PAT (after EI)
Volume – Auto
Volume - FES
EBITDA
25
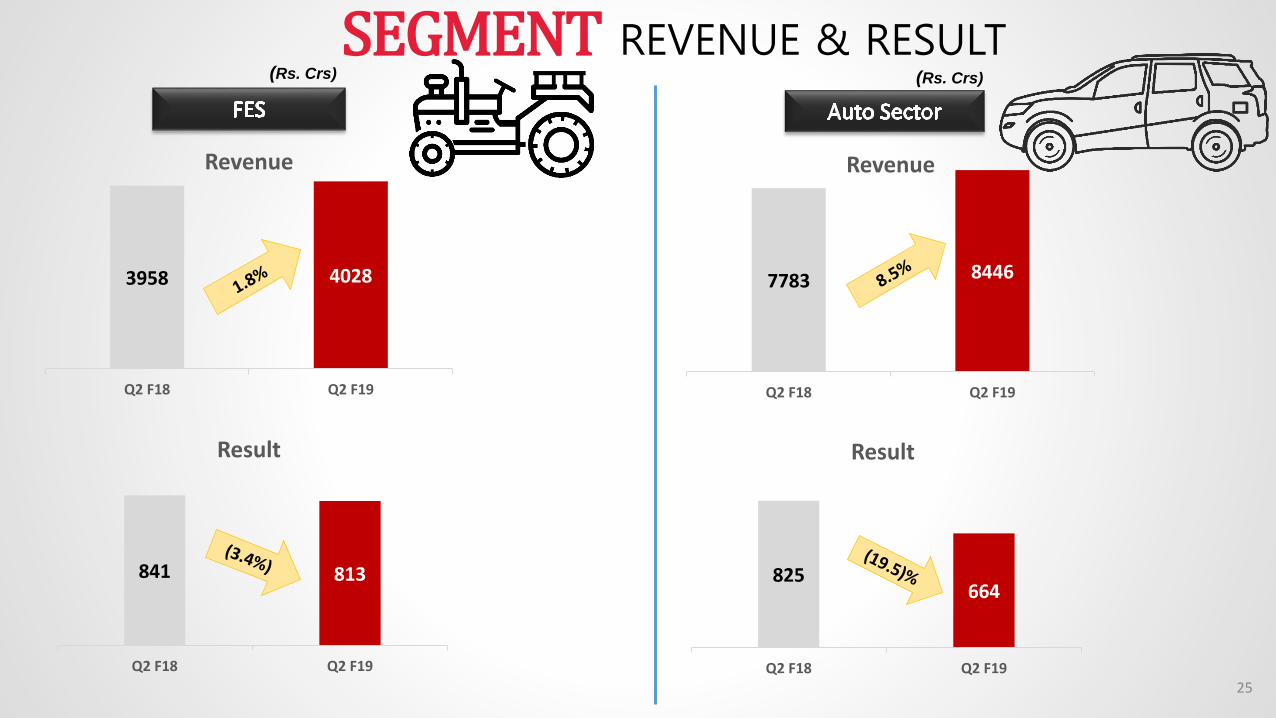
7783 8446
Q2 F18 Q2 F19
Revenue
825 664
Q2 F18 Q2 F19
Result
3958 4028
Q2 F18 Q2 F19
Revenue
841 813
Q2 F18 Q2 F19
Result
(Rs. Crs)
SEGMENT REVENUE & RESULT(Rs. Crs)

Highest ever PBIT, PBT & PAT at M&M+MVML
WOW !! LANDMARKS
Highest ever Q2
Revenue at M&M+MVML,
Segment Revenue at AD & FES

KEY LISTED COMPANIES PERFORMANCERs Crs
PAT (after NCI)
MMFSL results are on stand-alone basis as per IND-AS
MMFSL
381
164
MLDL
41
13
TML
1064
836
Q2 – F19
Q2 - F18
19
14
MLL
