inya economic journal · 2019-12-23 · inya economics about inya economics is a non-profit and...
TRANSCRIPT

Inya Economic Journal
Founded 2017
_____________________________________________
Volume 1 October 2017 No.1
_____________________________________________
Inya Economics Press
(Yangon University of Economics), Yangon
IEJ 1(1) 1-136 (2017)

This page intentionally left blank

(Acknowledgments)
"Poor countries are poor not because of their geographies or cultures,
or because their leaders do not know which policies will enrich their citizens."
Daron Acemoglu & James A. Robinson, Why Nations Fail.
႕ Inya Economics Inya Economic Journal (IEJ) IEJ ႕ ႕ ႕ ႕ ႕ ၊ ႕
႕ ၊ ႕ ႕ ၊ ႕ ႕
႕ ႕ ၊ ၊

Inya Economics
About
Inya Economics is a non-profit and nonpartisan think-tank organization. It is designed for
Economics policy discussion and Economics research/ analysis which are envisioned to
economic interest group. It is operated for demand-led academic activities based on frontier
research.
Who we are?
Inya Economics has been constituted with economic researchers from Yangon University of
Economics. The core-team majorly experiences in the field of economic research.
Our objectives?
Inya Economics aims to support policy consideration and evidence-based research to policy
makers, government organizations and non-government organizations. Furthermore, it is aimed
to become leading economic research institution.
Products?
Inya Economics regularly produces Inya Economic Journal, Policy Research, Report, Economic
briefing, Commentary, Economic Snapshot and Book.
What we do? (Areas of research)
Inya Economics emphasizes majorly on following areas of research;
a) Macroeconomics
b) Public Finance
c) Public policy
d) Economic development and more
Inya Economics’ Core Team
1) Pyai Nyein Kyaw
2) Sann Linn Aung
3) Saw Lalbwel Htoo
4) Si Thu Kyaw
5) Thurein Lwin
6) Ye Min Aung

Inya Economic Journal
Board of Editors
Pyai Nyein Kyaw Saw Lalbwel Htoo Ye Min Aung Thurein Lwin
______________________________________________________________________________
Consultants
Si Thu Kyaw Sann Linn Aung
Volume 1, Number 1 (October 2017)
Copyright © 2017 by Inya Economics. All rights reserved.
Contact for journal : [email protected]
Contact for Inya Economics : [email protected]
Facebook Page : Inya Economics

ARTICLES
Inya Economics 1
35
60
_______________________________________________________________________
PYAI NYEIN KYAW 67
Seeking an optimal policy path, least “negative externalities” on regional growth in Chin State
SANN LINN AUNG 86
The Impact of Exchange Rate on Myanmar Trade Sector
SAW LALBWEL HTOO 95
The Impact of Government Debt and Macro Variables on Economic Growth of Myanmar,
Cambodia, Laos PDR and Bangladesh
SI THU KYAW 109
Do Inflation And Its Volatility Impact On Economic Growth Rate In Myanmar?
THUREIN LWIN 121
Difficulties of Fixing the Minimum Wage and its Impact on Inflation in Myanmar

Inya Economic Journal
Volume 1 October 2017 No. 1
Crisis in Rakhine State
By
Inya Economics
႔
Advisory Commision on Rakhine State “Towards a Peaceful, Fair and Prosperous Future for
the People of Rakhine”
(Kofi A Annan)
႔ ႔ ( ) ႔ ႔
႕( ) ႕ ႔

Inya Economic Journal 2
Fig -1 Value of Foreign Trade
Fig -2 Prduction and export of Crude Oil and Natural Gas (US$ million)
Source: MEITI, March 2014
႔ ႕ ႕ ႕
႔ ႔

Crisis in Rakhine State 3
႕ (SEZ)
႔ ႔ ႕
႕
႔ ႕ ႕
(Skilled Labor) ႕ ဏ ဏ
႔ ႔ ႕
႕ (Skilled Labor
႕
Table -1
Source: www.dop.gov.mm
/
(
ၢ
/ ႔
႔
႕
1,690,992 59,276 167,683 46,458 332,503 127,249 89,698 16,951 257,454 391,025 99,459 11,319 91,917
782,862 38,676 124,873 37,201 237,334 45,764 50,762 8,797 131,598 11,217 37,171 5,370 54,099
908,130 20,600 42,810 9,257 95,169 81,485 38,936 8,154 125,856 379,808 62,288 5,949 37,818
74,899 8,672 4,103 1,812 14,346 8,005 3,115 654 11,207 15,946 2,388 340 4,311
37,916 6,957 3,269 1,392 10,804 3,011 1,829 342 6,100 582 900 150 2,580
36,983 1,715 834 420 3,542 4,994 1,286 312 5,107 15,364 1,488 190 1,731
(၁ ) ႔ /

Inya Economic Journal 4
၁ ႔ ႔ ၁ ( )
၆ ,၉ ၆ ႕
၉ ႔
၆ ႕
႕
႔
႕( ) ႕
႔ ႔ ႕ ႔ ႔ ႕
႔ ႕
႔ ႔ ႕
႔ ႔ Cox’s Bazar
Source: Google Earth
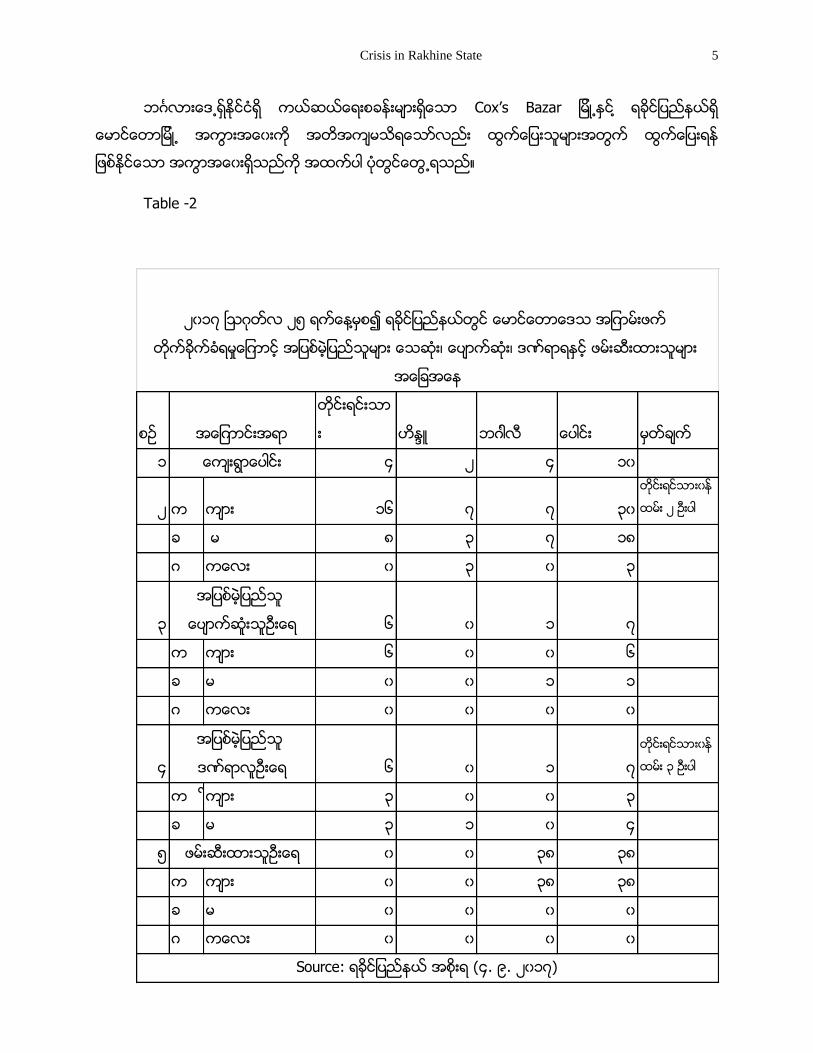
Crisis in Rakhine State 5
႕ Cox’s Bazar ႕ ႔
႕
႕
Table -2
ၵ
၁ ၁
၁၆
၁
၆ ၁
၆ ၆
၁ ၁
၆ ၁
၁
Source: ( . ၉. ၁ )
၁ ၿ ႔
ဏ
ဏ

Inya Economic Journal 6
Table - 3
၁ ၁၉ ၆ ၆
၆ ၁
၆ ၆ ၆
ဏၰ ၽ ၆ ၁
၉ ၆ ၁ ၁ ၁၆ ၉၉
၆ ၁
၆ ၁၁
၁ ၁၉ ၁
၆၁ ၁၁၆ ၁ ၁ ၁ ၆ ၆
( + )
.၉. ၁
႔
Source: ( .၉. ၁ )
႔

Crisis in Rakhine State 7
Table - 4
႔
(
၁ )
႕ / ႔
၁ ၁၆ ၁၁
ၵ ၁ ၆ ၆၁
၁ ၁
၁ ၁၁
၆၆ ၁ ၁
၆ ၉
၉ ၉ ၁ ၉
၉ ၉ ၁
၉ ၉ ၆
၁ ၁ ၁ ၁၁
၁၁ ၁ ၁ ၁ ၁၁
၁ ( ) ၁ ၁ ၉ ၆ ၉
၁ ( ) ၉ ၁ ၉
၁ ( ) ၆ ၁၁ ၁ ၁
၁ ၉ ၉ ၁ ၉
၁၆ ႔ ၆ ၁ ၆
၁ ၆ ၉ ၁
၁ ၁ ၁ ၁
၁၉ ၁၁ ၁ ၁
႔ ၆၆ ၁
၁ ၆ ၉ ၁
၁ ၁ ၁
၁ ၁၁ ၁
၁
၁
၁ ၉၆
( - - ၁ ) ႔ ႔ ႔ ႔
႔ ႔
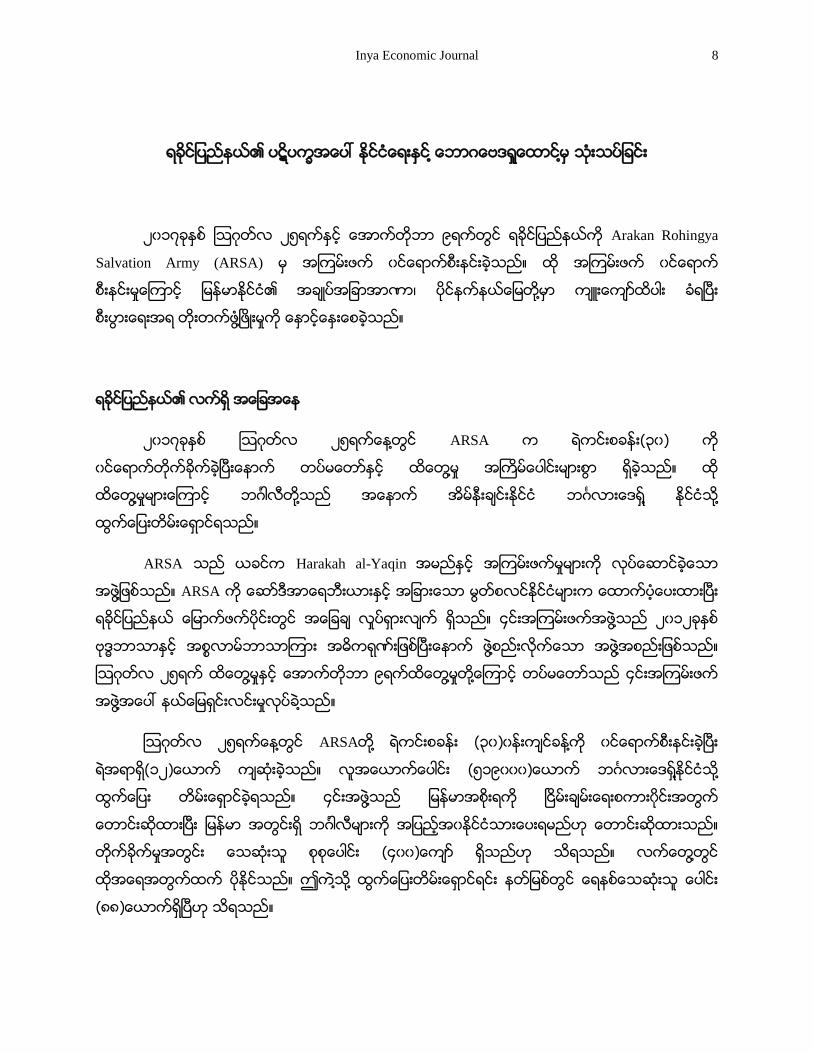
Inya Economic Journal 8
႔ ႔
၁ ၉ Arakan Rohingya
Salvation Army (ARSA)
ဏ ႔ ၿ
႔ၿ
၁ ႔ ARSA ( )
ၿ ႔
႔ ႔ ႔ ႔
ARSA Harakah al-Yaqin
႔ ARSA ၿ
႔ ၁
ဏ ၿ ႔ ႔
႔ ၉ ႔ ႔
႔ ႔
႔ ARSA ႔ ( ) ႔ ၿ
(၁ ( ၁၉ ႔ ႔
႔ ၿ
ၿ
( ႔
႔ ႔
( ၿ

Crisis in Rakhine State 9
႔ ( , ) ႔ ႔ ၿ
( , ) ႕ ႔
(၁ , )
႔ ႔ ႔
႔
႔
႔ ႔ ( ) ႔ ၿ ( ) ႔
၉ ၿ
(၁ )
( ) ႔ ႔
( ၆၆ ) ႔
႔
ၿ
( )
(၉) ၿ
(၁ )
(၁ ) ႔ ၿ
( ) ႔
၉ ၿ
ၿ ႕ (

Inya Economic Journal 10
Figure - 3
(State) ဏ
ဏ ႔
ၢ ဏ

Crisis in Rakhine State 11
ၢ
႔ ၿ ၿ
(Invasion) ႔
ဏ
De jure ARSA ႔
ဏ
ARSA
႔ ၿ
ၿ
ARSA
႔
ၿ
ARSA ႔
ARSA ႔
႔ ႔
႔ ႔
႔ ႕
႔ ႕
႔
႔
႔
႔
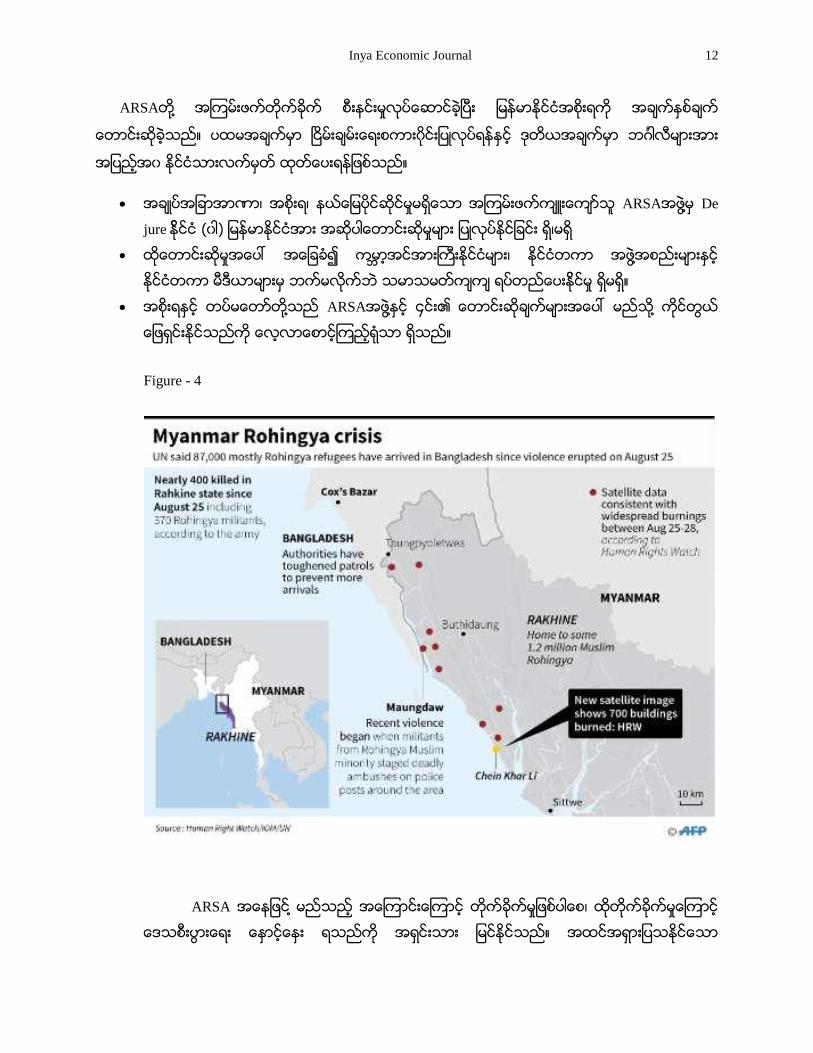
Inya Economic Journal 12
ARSA ႔ ၿ
ၿ
ဏ ARSA ႔ De
jure ( ႔
႔ ARSA ႔ ႔
Figure - 4
ARSA ႔

Crisis in Rakhine State 13
ၿ
Figure - 5
႔ၿ ႔ၿ (consumption) ၿ (Production)

Inya Economic Journal 14
႔ၿ (Economics Development) Classical Theory
Q = f (L, K, N, T)
Q = Total Output
L = Labor Force
K = Capital
N = Amount of available natural resource
T = Technology
Equation ႔ Labor force (L) Positive Relationship
Total Output (Q) Labor force (L)
Capital (K)
Advance Technology (T) ၿ Technology (T)
Total Output (Q) Labor force (L)
႔
Labor force (L) Wage( W) Iron
Law of Wages Wages (W) Labor force (L)
Labor force (L) Wages (W) Equation
L = f (W)
L = size of labor force
W = wage fund
Labor force (L) (investment) (Classical
Economists) ႔ Wages (W) (Capitalist) (Saving)
(Saving) (Investment)

Crisis in Rakhine State 15
Equation
W = f (I)
W = Wage fund
I = Investment
(Investment) Wages (W)
Wages (W) Labor force (L) ႔
(investment)
႔ (investment) Wages (W) Wages
(W) Labor force (L)
Labor
force (L) Labor force (L)
“
”
(၁ , )
ၿ
( , )

Inya Economic Journal 16
႔ၿ
႔
Human Capital
( ႔ )
႔
၁ (Total Weath) (Human
Capital) ၆ (Produce
Capital) ၿ (Natural Capital) ၁ ႔
႔ ၿ
Labor force
Labor force ႔ ႔
ARSA ႔
ဏ 1 ႔ၿ
႔ၿ
ARSA ႔
႔ ႔ၿ
႔
__________________________________________________________________
1- ၆ ၁၁၆၁၆၆၁ ၆ ႕ ႔ ၁. ၁ ၆ ၉ ႔ ၁

Crisis in Rakhine State 17
ရခငျပညနယတြင ျဖစေပၚလကရေသာ ပဋပကၡမားအေပၚ ႏငငတကာ၏ တ႕ျပနမႈမား
ရခငျပညနယေျမာကပငးတြင ျဖစေပၚခေသာ အၾကမးဖကခခရမႈမားႏင ပတသကၿပး ႏငငတကာ
အဖြ႕အစညးမားအေနျဖင ပစအမးမး၊ ရပတညခကဥးတညခကအမးမးမားျဖင ၎တ႔၏ အာဂငဒါ
(agenda) မားက ေခာလေရာထင ပစျဖငဖအားေပးၿပး၊ အစးရအေနျဖင အကဥးအၾကပ ျဖစေစခသည။
ထလပေဆာငခကမားသည အကအညထက ပမဆးရြားေသာ အေျခအေနသ႔ တြနးပ႔လကရသည။
ႏငငတကာ အဖြ႕အစညးဟ ဆရာ ဤေနရာတြင သသကြကြျဖင ခြ ေျပာရမညျဖစသည။ ေရးဥးစြာ
ႏငငတကာ အစးရမား၊ အစးရမဟတေသာ အဖြ႕အစညးမား၊ ႏငငတကာ မဒယာအဖြ႕အစညးမား
စသညတ႔ျဖစသည။ အဆပါ ႏငငတကာ မဒယာ အဖြ႕အစညးမားထတြင လြတလပၿပး သးျခားရပတညေသာ
ပဂၢလက မဒယာ ေအဂငစမားႏင အစးရတစရပ၏ ႏငငျခားေရးမ၀ါဒမားႏင အျခားမ၀ါဒမားက
အေကာငအထညေဖာရန တညေဆာကထားေသာ တစ၀ကတစပက မဒယာမားပါ၀ငသည။ ထ႔အျပင
လမးေရး၊ ဘာသာေရး အယအဆ ေရးရာ အေျချပ ဖြ႕စညးတညေဆာကထားေသာ မဒယာမား
စသညတ႔သည ရခငျပညနယ အေရးကစၥတြင အသးသးေသာ အခနးက႑မ ပါ၀င လႈပရားလကရသည။
ထ႔ေနာက ႏငငတကာ အစးရကသ႔ ႏငငေရး ပါ၀ါ ရေသာ အဖြ႕အစညးမားျဖစၾကသည ကလသမဂၢ၊
ဥေရာပ သမဂၢ တ႔၏ အခနးက႑သညလညး ရခငျပညနယ၏ ျဖစရပမားအေပၚ အေရးႀကးေသာ
အခနးက႑မ ပါ၀ငလကရသည။
ရခငျပညနယေျမာကပငးတြင ျဖစပြားခေသာ တငးသျပညသ၊ ကမၻာသ အၾကမးဖကမႈျဖစရပမား
မတငခင အဆပါေဒသတြင ဘာသာေရး၊ လမးေရး အစြနးေရာကသမားမား၏ ရာဇ၀တမႈကးလြနမႈမားသည
ပစအမးအမးျဖင မၾကာခဏဆသလ ျဖစေပၚေလရခသည။ သ႔ေသာ အဆပါသတငးမားမ ယခကသ႔
အပေအာသာငးနငး ျဖစပြားချခငးမရေပ။ အဘယေၾကာငဆေသာ ယခငႏငငေရးအေျခအေနအရႏင
ဆကသြယေရး အေဆာကအအမားႏင လမႈကြနယကမား အားမေကာငးခေသာေၾကာင အလြယ တက
မပႏခေပ။ မၾကာေသးမ ႀသဂတလ ၂၀၁၇ခႏစက ရခငျပညနယ ေျမာကပငးတြင ျဖစပြားခေသာ အၾကမး
ဖကမႈမားသည ၂၀၁၆ ခႏစ၊ ေအာကတဘာလ အၾကမးဖကတကခကမႈမ အစျပခ႔သည။ ထ႔ေနာက ျပညပမ
လကနကႏင ေငြေၾကး အေထာကအပမား ရယၿပး အၾကမးဖကသငတနးမား ေပးေနသည အစြနးေရာက
အၾကမးဖကသမားမားမ ေဆာငရြကေနျခငးျဖစေၾကာငး ႕
ျပညေထာငစ အစးရက ၂၀၁၇ ခႏစ၊ ဇလငလ ၁ ရကေန႔တြင သတငးထတျပနသည။
Inya Economic Journal 18
အဆပါ သတငးထတျပနခကအရ အစြနးေရာက အၾကမးဖကသမားမား၏ အၾကမးဖကလပ
ေဆာငမႈမားသည ႏစဖကအသငးအ၀ငးရ အရပသားမားႏင ေကးရြာ အပခပေရးမးမားက လမဆနစြာ
သတျဖတျခငး မားျပလပခသည ဟဆသည။
ထအၾကမးဖကမႈမားက နယေျမရငးလငးေရးလပငနးမား ျပလပရာတြင တပမေတာႏင
ျမနမာႏငငရတပဖြ႕တ႔ ပးေပါငးၿပး ေဆာငရြက ခသည။ ထသ႔ ရငးလငးေရး ေဆာငရြကရာတြင
ျမနမာႏငငရတပဖြ႕အေနျဖင ေဒသတြငး မတညမၿငမျဖစေအာင ေဆာငရြကေနသည
အစြနးေရာကအၾကမးဖကသမားမားက ေဖာထတႏငေရးႏင အျမစျပတရငးလငးဖယရားႏငေရးအတြက
အေရးယျခငးတ႔က ေဆာငရြကလကရေၾကာငး ျပညေထာငစ အဖြ႕အစးရအဖြ႕၏ ထတျပနခကတြင
ပါရသည။
တညၿငမေရးႏင နယေျမလၿခေရး ေဆာငရြကရာတြင လၿခေရးအငအားစမားျဖစသည တပမေတာ၊
ျမနမာႏငငရတပဖြ႕ႏင နယျခားေစာငတပမားျဖင ပးေပါငးေဆာငရြကလကရသည ဟ ရခငျပညနယ
လၿခေရးႏင နယစပေရးရာ၀နႀကး ဗလမးႀကး ထနလငးက ႕ ႕
၁ ေျပာၾကားခ႔သည။1
ထသ႔ လၿခေရးတပဖြ႕မားမ ေဒသလၿခေရး လပငနး အစအစဥမားႏင ပတသကၿပး
ႏငငတကာအသငးအ၀ငးအေနျဖင ျပငးျပငးထနထန႐ႈပခခၾကသည။ အဘယေၾကာငဆေသာ
လပၿခေရးတပဖြ႕မား၏ နယေျမရငးလငးေရး လပငနးမားသည ဘဂၤါလ ၄၂၀၀၀၀ ေကာက အမနးခငး
ဘဂၤလားေဒရႏငငသ႔ ထြကေျပးေစခသည။ ထ႔အျပင ၂၀၁၆ ခႏစ၊ ေအာကတဘာလတြင ျဖစပြားခေသာ
Arakan Rohingya Salvation Army (ARSA) ၏ အၾကမးဖကမႈမားတြင လၿခေရးတပဖြ႕မားက
နယေျမရငးလငးေရးမား ျပလပစဥ ရညရြယခကရရျဖင ဘဂၤါလမား၏ အမမားက မး႐ႈ႕ျခငး၊
ညငးပနးႏပဆကျခငး၊ လငပငးဆငရာ အႏငကငျခငး စသည လပရပမားက လပေဆာငခသညဟ RFA
သတငးဌာန ကေဖာျပသည။2
ထ႔အျပင ႏငငတကာ ဖအားတစခအေနျဖင တပမေတာသည လနညးစ ဘဂၤါလ (႐ဟငဂာ)မားအား
အၾကမးဖကၿဖခြငးခၿပး၊ လမ သကျဖတမႈမားက ကးလြနခၿပး အျပစရေၾကာငး Permanent People’s
Tribunal (PPT) ဆးျဖတ ႔သည။
ကလသမဂၢ အႀကးအကမားအေနျဖင ျမနမာႏငင၏ ျဖစစဥႏင ပတသကၿပး “genocide”
အသးအႏႈနးအစား “ethnic cleansing” ဟ သစြခသည။ သ႔ေသာ PPT အေနျဖင ၎တ႔၏
1 ႕ ႕ ၁ 2 RFA, International Pressure Poses Challenges to Security in Rakhine: Myanmar Military Chief, September, 21, 2017

Crisis in Rakhine State 19
ေျပာၾကားခကမားတြင “genocide” စသည အသးအႏနးမားက သးစြခသည။3 ထသ႔သာမက
အျပညျပညဆငရာ လြတၿငမးခမးသာေရး အဖြ႕ (Amnesty International) ကလညး ၎တ႔၏
ထတျပနခကတြင ျမနမာလၿခေရးတပဖြ႕မားသည စနစတက လသတျခငး၊ လငပငးဆငရာ ကးလြနျခငး၊
မး႐ႈ႕ျခငး စသည ကးလြနမႈမားက လပေဆာငခေၾကာငး ၂၀၁၇ ခႏစ ေအာကတဘာလ ၁၈ ရကေန႔ တြင
“Myanmar: Crimes against humanity terrorize and drive Rohingya out” ေခါငးစဥျဖင ထတျပနခ႔သည။4
ႏငငတကာ အဖြ႕အစညးမားအေနျဖင ျမနမာႏငငတြင ျဖစပြားခေသာ ရခငျပညနယရ အၾကမးဖကမႈ
ကစၥမားႏင ပတသက၍ အမား၏ စးရမမႈမာ အဆပါ ေဒသတြင လၿခေရးတပဖြ႕မား၏ နယေျမ
ရငးလငးေရးက လပငနးမားႏင ပတသကၿပး စးရမမကငးျဖစၾက သည။ ဥေရာပ သမဂၢအေနျဖင
ျမနမာလၿခေရးတပမားအေနျဖင ၀ငေရာကႏမနငးမႈမား ျပလပရာမာ ဘဂၤါလ(႐ဟငဂာ) ၅ သနးခန႔
ဘဂၤလားေဒရႏငငဘကသ႔ ထြကေျပးေစခသည။
ထ႔အျပင ၎တ႔၏ အမမားဖကဆးခခရၿပး၊ အမးသမးမားက မတရားျပကငခမႈမားရသညဟ
စြပစြထားၿပး၊ ျမနမာႏငင၏ ထပတနးစစဗလခပႀကးမားက ဥေရာပ သမဂၢႏငငမားသ ဖတေခၚမႈမားက
ရပဆငးခသည။5 ထ႔အျပင ဘဂၤါလ (႐ဟငဂာ)မား က လၿခေရးတပဖြ႕၀ငမားက ျမနမာႏငငမ
ထြကခြာသြားရန အသခစကမားမ တစဆင ၿခမးေျခာကေျပာဆ ခေၾကာငး ဘဂၤလားေဒရႏငင ဒကၡသည
စခနးသ႔ အသစေရာကရလာေသာ ဘဂၤါလ (႐ဟငဂာ) မားက ထြကဆၾကသည။
ထသ႔သာ မက လၿခေရးတပဖြ႕မားႏင ဗဒၶဘာသာ ေခါငးေဆာငတစဥးခငးမလညး
ဘဂၤါလ (႐ဟငဂာ) မား၏ ပငဆငမႈမားက စနစတက ဖကစးေစၿပး၊ ျမနမာႏငငတြငး (ယခင၎တ႔
ေနထငခေသာေနရာ) သ႔ ျပနလညလာေရာကရန မျဖစႏငေသာ အေျခအေနျဖစေအာင ရညရြယခကရရ
လပေဆာငခသညဟ စကတငဘာလ၂၀၁၇တြင ကလသမဂၢ မဟာမငးႀကးရးမ ထတျပနေသာ အစရငခစာက
ဆသည။ ထသ႔သာမက လၿခေရးတပမားအေနျဖင ဘဂၤါလ (႐ဟငဂာ) အသငးအ၀ငးတြင လႊမးမးမႈရသမား၊
ဆရာ/ဆရာမ မား၊ ဘာသာေရးေခါငးေဆာငမားက ပစမတထားၿပး၊ ဘဂၤါလ (႐ဟငဂာ) သမငးႏင
ယဥေကးမႈမားက ေပာကပကသြားေစရန ရညရြယ ခကရရျဖင လပေဆာငခသညဟ လညး
ေဖာျပပါရသည။6
တစဖကတြင ကလသမဂၢမ အသးျပခေသာ မးႏြယစ ရငးလငးျခငး “ethnic cleansing” ႏင
ပတသကၿပး ျမနမာအစးရအေနမ ျငငးဆနထားသည။7 ႕ ႕
3 RFA, Tribunal Finds Myanmar Guilty of Genocide Against Rohingya, September, 22, 2017 4 Amnesty International, Myanmar: Crimes against humanity terrorize and drive Rohingya out, October, 18, 2017 5 အာအဖေအ၊ ျမနမာစစဗလခပေတြက ဖတၾကားမႈ ဥေရားပ ႏငငမားအဖြ႕ရပဆငး၊ ေအာကတဘာ၊ ၁၆ ရက၊ ၂၀၁၇ ခႏစ 6 United Nations Human Rights Office of The High Commissioner, Mission report of OHCHR rapid response mission to Cox’s Bazer,
Bangladesh, September, 13-24, 2017 7 Reuters, Rohingya refugees scoff at Myanmar’s assurances on going home, October, 3, 2017

Inya Economic Journal 20
႔ ၢ ၿ ႔
႔ -
႕ Refugees International
႔
႔ 8
ႏငငတကာ မဒယာအမားစ အေနျဖင ရခငအေရးကစၥႏင ပတသကၿပး အစြနးေရာက
အၾကမးဖကအဖြ႕အစညးႏင ပတသက၍ ေဖာျပျခငးထက ျမနမာလၿခေရးတပဖြ႕မား၏
နယေျမရငးလငးေရးကစၥမားက ေ၀ဖနေျပားဆလကရသည။ ႏစဖကလ႔အဖြ႕အစညး က
ကာကြယရနအတြက လၿခေရးတပဖြ႕မား ေစလႊတျခငးႏင အၾကမးဖကအဖြ႕၀ငမားက
ရငးလငးျခငးလပျခငးအေပၚ တစဖကသက ေ၀ဖနေနျခငးမာ ေပၚလြငထငရားေစသည။
ထ႔အျပင လၿခေရးတပဖြ႕မား၏ နယေျမရငးလငးေရးလပငနးစဥမားေၾကာင ဘဂၤါလ (႐ဟငဂာ) မား
အမနးခငး ဘဂၤလားေဒရႏငငသ႔ အလးအရငးျဖင ထြကခြာသြားၾကေၾကာငး ေကာကခၾကသည။ မနကနေသာ
ျဖစရပ သ႔မဟတ မနကနေသာ သတငးအခကအလကမား ရရရနမာ ျပနာက ခဥးကပႏငရန
အေရးႀကးေပသည။ ဤျဖစစဥတြင အဓက ပါ၀ငေနၾကသမား၏ အခနးက႑က ခြျခမးစပျဖာရန
လအပေပမည။ ႏငငတကာ မဒယာမား၊ ျပညတြငး ပဂၢလက မဒယာမားႏင အစးရမဒယာမား၏
ေဖာျပခကမားမာ ျပနာ၏ ျဖစစဥက ပေဖာႏငရနမာ ခကခေပသည။ ထ႔အျပင ေဒသခမား၏
ေျပာဆခကမား မာ လညး ကြျပားလကရသညအတြက မညသည သတငးအခကအလကမာ
မနကနသညက မဆးျဖတႏငေပ။ ဘဂၤါလ (႐ဟငဂာ) မား တစဖကႏငငသ႔ အလးအရငးျဖစ
သြားေရာကျခငးမာ ၎တ႔အား အစၥလာမဘာသာ၀င ေခါငေဆာငမားမ တစဖကႏငငသ႔ ထြကခြာရန
ၿခမးေခာကမႈမားေၾကာငဟဆသည။
ထသ႔ တစဖကႏငငသ႔ ထြကခြာသအမားစသည အမးသမး၊ ကေလးသငယႏင သက ႀကးရြယအမား
အမားစျဖစၾကသညဟဆသည။ လငယမားႏင အမးသားႀကးမားသည ထြကခြာသြားသမားထတြင
ပါ၀ငျခငးမရဟ လညးသတငးရရထားသည။9 ႏငငတကာ အဖြ႕အစညးမားႏင ႏငငတကာ
မဒယာမားအေနျဖင ဘဂၤါလ (႐ဟငဂာ) မား အလးအရငး ျဖင ထြကခြာသြားျခငးမာ လၿခေရးတပဖြ႕၀ငမား၏
နယေျမရငးလငးေရးကစၥမားေၾကာငဟလညး တစဖကတြင ေဖာျပထားသည။ ၎တ႔၏
သတငးအခကအလကမားက အေျခခ၍ စဥးစားပါက ဘဂၤါလ (႐ဟငဂာ) မား အေနျဖင ေမာငးေတာၿမ႕ တြင
8 Refugees International, Bearing Witness to Crimes against Humanity The Forced Expulsion of the Rohingya from Myanmar, October 5, 2017 9 ေမာငေတာ ၿမ႕ ခ ကေကာမငးခင ႏင ဖနးအငတဗး၊ ေအာကတဘာ၊ ၁၈ ရက၊ ၂၀၁၇ ခႏစ

Crisis in Rakhine State 21
ဆကလကေနထငပါက လၿခေရးတပဖြ႕မား၏ ၿခမးေခာကမႈမားႏင အစၥလာမ ဘာသာေရးေခါငေဆာငမား၏
ၿခမးေခာကမႈမား က တစၿပငနကတညး ရငဆငေနရေသာေၾကာင တစဖကႏငငသ႔ အလးအရငးျဖင
ထြကခြာသြားရနသာရေတာသည။ သ႔ေသာလညး တစဖကတြင ျမနမာအစးရ၏ သတငးအရငးအျမစမားအရ
တစဖကႏငငသ႔ ထြကခြာရန ျပငဆငေနသမားက တားျမစခၿပး၊ ကည ေထာကပမႈမား ျပလပေပးသြားမညဟ
တာ၀နရသမားမ ဆြေဆာငေသာလညး ေအာငျမငျခငးမရခေၾကာငးေဖာျပထားသည။ ၎တ႔အ ေနျဖင
အာဏာပငမား၏ ကတ၊ က၀တမားက ယၾကညရန ခကခေသာ ေၾကာင ဆြေဆာငမႈမားက
ျငငးပါယခၾကသည။
သ႔ေသာ ႏငငတကာ မဒယာမားအေနျဖင ဘဂၤါလ (႐ဟငဂာ) မား အလးအရငးျဖင
ေနရပစြနခြာၾကသည ျဖစရပသည လၿခေရးတပဖြ႕ မား၏ နယေျမရငးလငးေရး
အေၾကာငးတစခကတညးေၾကာငျဖစေၾကာငး ေကာကခကချခငးသည မတမႈ မရေပ။ ဤပဋပကၡတြငပါ၀င
ပတသကသမား၏ အခနးက႑မားက လညးဆနးစစရမညျဖစသည။
( )
႔ ႔
႔ ႔ ႔
႔

Inya Economic Journal 22
႔
အစးရႏင ႔
တပမေတာမ
ကာလခၚရန
သေဘာထားကြလြ
ႏငငတကာ ဖအားမား
ပမမားလာျပး
လမးတနး
သတျဖတမႈကသ႕ စြတစြ
၁ ႀသဂတလ၊
၂၅ရကေနတြင
ARSAအၾကမးဖကအ
ဖြ႕မ တကခက
စကတငဘာ
၇ရကေန႕တြင အစးရမ
ကာလအစညးအေ၀း
ကသ႕ ျပလပ
စကတငဘာလ၊ ၁၉ရကေန႔႔
တြင ႏငငေတာ၏
အတငပငခပဂၢလမ
ႏငငတကာသ႕ မနခြနးေျပာ
ႏငငတကာမ
ဖအားေပးမႈမားပမ
တးလာျပး
ကမၻာ႕ဘဏမ
ေခးေငြကညရန ဆငးင
ေအာကတဘာလ ၁၅ရကေန႕တြင
အစးရမ ရခငျပညနယတြငး
လသားခငးစာနာမႈ
အကအညအေထာကအပေပးေရး၊
ျပနလညေနရာခထားေရး၊
ဖြျဖးေရးစမကနး ဖြ႕စညး
Crisis in Rakhine State 23
႔
႔
၁ - ႕ ႔
- ႔ ႔
- ႕ ( -
႕ )
႔ ႔
႔
၁ ?
႔
၁ ႔
၁ .၆ { ႔
႕( ) ႕ ႔ ႔ ႕ ႔ ႔ ႕ }
႕ ႔ ႕
႔
႔ Facebook ႔ ႔
႔ ႔ ႕
Inya Economic Journal 24
႔ ?
႕ ႕
႔
႔
႕ ႕
႔ ႔ ႔
႔ ႕
၁ ႕ ႔ ၉၆
႕
႕
႕ ႔ ႔
႔
႔ ႔ ႔
-
၁- ႔ ႔
႔ ႕ ARSA ႔ ႔
႕ ႔ ႔ ႔
႔
႔

Crisis in Rakhine State 25
- ႔ ႔
႔ ႔ ႔ ႔
႕
႕
႔ ႕ ႔
႕ ၵ
႕ ႔ ႕ ႔
႕ ႔ ႕
႕
႔ ႕
႕
၁ ႕ ႔
႔ ၁
႔ ႕
႔ ႕ ႔
( )
႔ ႔
႔ ႔ ႔
႕ ႔ ႔ ႔ ႔ ၆ ၁ ႔
႔ ႕ ႔ ႔ ႔
႔
႔ ႕ ႔ ႔ ႔

Inya Economic Journal 26
႔
႔
ၢ ၁၉ ႔
႕ ႕ ႔ ႔
RFA “ ႕ ႔ ႔ ႔ ႔ ႕ ႔ ႔ ”
“ ႔ ႔ ႔ ႔ ႕ ႔ ႔ ႔ ႔ ႕ ၁ ႔ ႔ ႔ ၆( ) ႔ ႔ ႔ ႔ ႔ ႔ ႔ ႕ ႔ ႔ ” ႔
႔ ႕ ႔ ႔
႔ ႔ ႔
႕
႕
႔ ႔ ႔ ႔ ႔ ႔
_____________________________________________________________________
၁ - ႔ ၁
- The Daily Eleven Newspaper, October 19, 2017

Crisis in Rakhine State 27
႔ ႔ ႔ ႔ ( ႔
၁ ၁ )
႔
၁ ႔ ႔ ႔ ႔
႔
႔ “ - ႔ ၉- ၁ ၁ - ၁ ႔ ႔ ႔ ႔ (၁၉ ႔ ႔ ႔ ႔ ႔
၁ - ၁ ႔ (၆) ႔ ႔ ႔ ႔ ႔ ႔ ( )
႔ ႔ ( ) ႕ ႔ ႔ ႔ ” ၁၉ ႕ ႔
႔ ႔
႕
႕ ႔ ႕
႔ ႔
႔ ႔ ႔
ဏ State Budget

Inya Economic Journal 28
႕
႕ ႕ Economic Theory
႔ Demand Factor ႔ ႕ ႔
႔
႔ ႔ ႔
႔
႔
႔ ႔
႔ ႔
႔ ႔
႔ ( )
႔
႔
ၢ ၍
( ) ႔ ႔
႔ ဏ ႔

Crisis in Rakhine State 29
႕ ႔ ႔
႔
႔
( ) ႕ ႕
႕ ႕ ႔
႕ ႔ ႔
႔ (Union Enterprise for Humanitarian Assistance, Resettlement and Development in
Rakhine) ၁ ၁ ႕ ႔ -
၁
႔
႔ ႕
႔
႔
/
႔ ႔ ႔
႔ ႕
႔ ႔ ႔
႔ ႕
႕

Inya Economic Journal 30
႕
႔
႔
႕ ႔ ဏ ဏ
႔
႕
႕
႔
႔
႔
႔ ႔
၁၉
၁၉ ႔
႕
႔ ႕
႔
႕ ႔ ႔
႔
႔

Crisis in Rakhine State 31
႔ ႔ ႔
ၵ ႕
႔ ႔ ၵ
႔
႕ ႕ ႔ ႔
႔ Super Power Game ႔
႔
Table - 5
Source: ၁ - ၁၆

Inya Economic Journal 32
႔
႔ ၁ ႔ ႔
႕ Democratization ႔
႔ ႔ ၁
႕ ႔ ႕
႕
႔ ႔ ႔ ၵ
႔
႔ ႕ ႔
UEHRD
႔ ႔
႔ UMFCCI UMFCCI
႕
႔
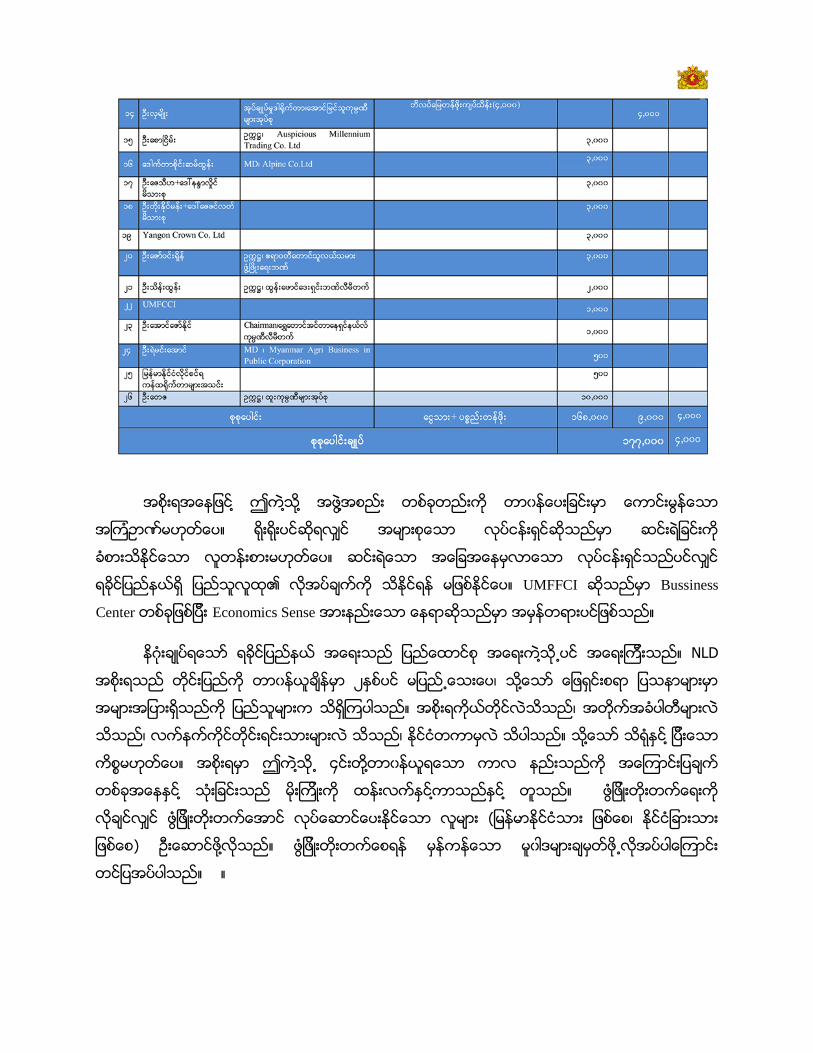
Crisis in Rakhine State 33
႔ ႔ ႔ ႔
ဏ
UMFFCI Bussiness
Center Economics Sense
႔ ႕ NLD
႕ ႔
႔ ႔
႔ ႕ ႔
႔ ႔ ႔
) ႔ ႕

Inya Economic Journal 34
References
1. http://www.economicsdiscussion.net/economics-2/adam-smith-theory-of-development-in-
economics-main-features/4514
2. http://www.economicsdiscussion.net/economic-growth/classical-theory-of-economic-
development-described/4534
3. http://www.newmandala.org/better-political-economy-rohingya-crisis/
4. https://www.acaps.org/country/myanmar/crisis-analysis?acaps_mode=slow&show_mode=1
5. http://blogs.worldbank.org/education/why-education-matters-economic-development
6. http://www.yourarticlelibrary.com/economics/the-role-of-education-in-economic-
development/38355
7. 2014 Myanmar Population and Housing Census, A Changing Populaion: Raking State Figures at
a Glance, May 2015www.dop.gov.mm
8. CSO 2016
9. Myanma Alin News Paper
10. MEITI_reconciliation_report_2013-2014_final_version
11. TOWARDS A PEACEFUL, FAIR AND PROSPEROUS FUTURE FOR THE PEOPLE OF
RAKHINE, Final Report of the Advisory Commission on Rakhine State, August 2017
12. Burma Citizenship Law 1982

Current Situation of Monetary Policy in Myanmar 35
၀ါဒ
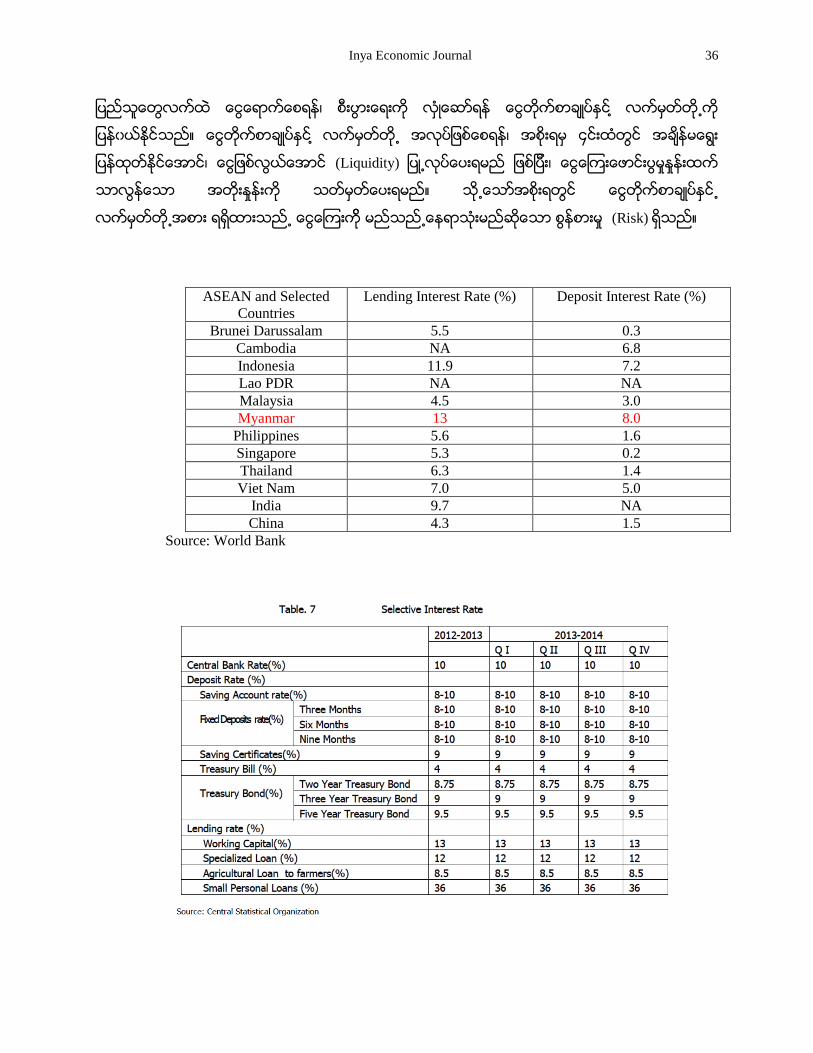
၁။
႔ (Lending Interest Rate -
13%) ႔ ။ ႔ (Deposit
Interest Rate) ႕ ၁၀ ။
Call Deposit ႕
႕၊ ၊ ၀၁ ႔ ။
႔
႕ ႔
႔ ။
(၁၃ ႔ ႔ ၀
႕ ။
႕ ႔ ( Treasury
Bond) . ႕ ၊ ၃ ႔
၊ . ႔ ၊ (Treasury Bill)
(၄) ႕ ႕ ႕ ။ ႕
၊ ၊ ( Low Liquidity) ႕ ႔ ၀
၊ ၀ (Inter-Bank Market) ႕
။
၀ါဒ ႕ ႔
ါ၀ ။ ၊
႕ ။ ႕
Inya Economic Journal 36
၊ ႔ ႕
၀ ။ ႔ ႕ ၊ ၄
၊ (Liquidity) ႕ ၊
။ ႕ ႕
႕ ႕ ႕ (Risk) ။
ASEAN and Selected
Countries
Lending Interest Rate (%) Deposit Interest Rate (%)
Brunei Darussalam 5.5 0.3
Cambodia NA 6.8
Indonesia 11.9 7.2
Lao PDR NA NA
Malaysia 4.5 3.0
Myanmar 13 8.0
Philippines 5.6 1.6
Singapore 5.3 0.2
Thailand 6.3 1.4
Viet Nam 7.0 5.0
India 9.7 NA
China 4.3 1.5
Source: World Bank

Current Situation of Monetary Policy in Myanmar 37
႔ ႔
ါ၀ ။ Risk ႕ ႔
႔
႕ ။
။
႔ ႔ ။
ါ ႔ ဒ
႔ ႕
႕ ။
ါ
။ ႔ ႔
႕ ါ
႕
႕ ႔ Milton Friedman ႔ ။
႕ ႔ Milton
Friedman ႔ ။ ႔ ႔ ႔
။ ႔ ႔
။ ၄ ၊
၊
။
႔
ါ ႕ ။ ႕
႕
႕ ႕ ႔
႕ ႔ ။ (Table - 2.2.2)

Inya Economic Journal 38
Source: CSO
0
2
4
6
8
10
12
20
15
, Ju
ne
July
Au
gust
Sep
tem
be
r
Oct
ob
er
No
vem
be
r
De
cem
ber
20
16
, Jan
uar
y
Feb
ruar
y
Mar
ch
Ap
ril
May
Jun
e
July
Au
gust
Sep
tem
be
r
Oct
ob
er
No
vem
be
r
De
cem
ber
20
17
, Jan
uar
y
Feb
ruar
y
Mar
ch
Ap
ril
May
Jun
e
July
Au
gust
Sep
tem
be
r
Annual Rate of Inflation
AnnualRate ofInflation

Current Situation of Monetary Policy in Myanmar 39
၃၁ ၃၃ ႕ ါ ႔ ။
႔ ႔
႔ ါ ။ ႕
ါ ။
႕
႔
။
႕ ႕ ။ ႔ ႔
။ ႔ ႕
ါ ႕
။ - ၊ ႔
၀ ါ ။

Inya Economic Journal 40
.၁
2.1.1 Money Supply
Money Supply ႔ ။ ါ
႕ ႔ Money Supply ။
Table – 2.1.2
Source: CSO
0
2000000
4000000
6000000
8000000
10000000
12000000
14000000
16000000
Money Supply (Kyat Million)
MoneySupply(KyatMillion)

Current Situation of Monetary Policy in Myanmar 41
ါ (Table 2.2) ႔ ႔ NLD Money
Supply ႕ ။
Table 2.2.1 State Budget Deficit

Inya Economic Journal 42
Table 2.2.2
Source: Sean Turnell, 2017)
Table 2.2.3
Source: Sean Turnell, (2017)
ါ Table (2.2.1, 2.2.2, 2.2.3) ႕ ႔ ၊
၊
႔ ႔ ႕ ။
As equation; GDP = C + I + (G - T) + (X-M) (Sean Turnell, 2017).
Current Situation of Monetary Policy in Myanmar 43
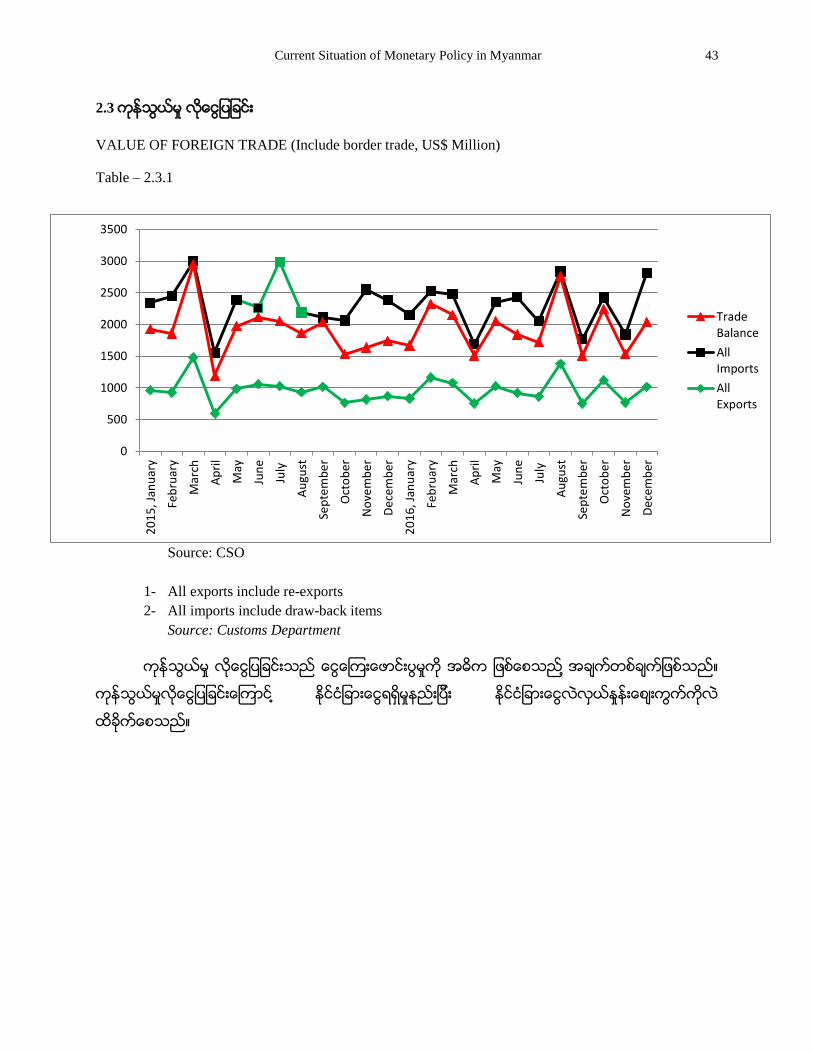
2.3
VALUE OF FOREIGN TRADE (Include border trade, US$ Million)
Table – 2.3.1
Source: CSO
1- All exports include re-exports
2- All imports include draw-back items
Source: Customs Department
႔ ။
႔
။
0
500
1000
1500
2000
2500
3000
3500
20
15
, Jan
uar
y
Feb
ruar
y
Mar
ch
Ap
ril
May
Jun
e
July
Au
gust
Sep
tem
be
r
Oct
ob
er
No
vem
be
r
De
cem
ber
20
16
, Jan
uar
y
Feb
ruar
y
Mar
ch
Ap
ril
May
Jun
e
July
Au
gust
Sep
tem
be
r
Oct
ob
er
No
vem
be
r
De
cem
ber
TradeBalance
AllImports
AllExports
Inya Economic Journal 44
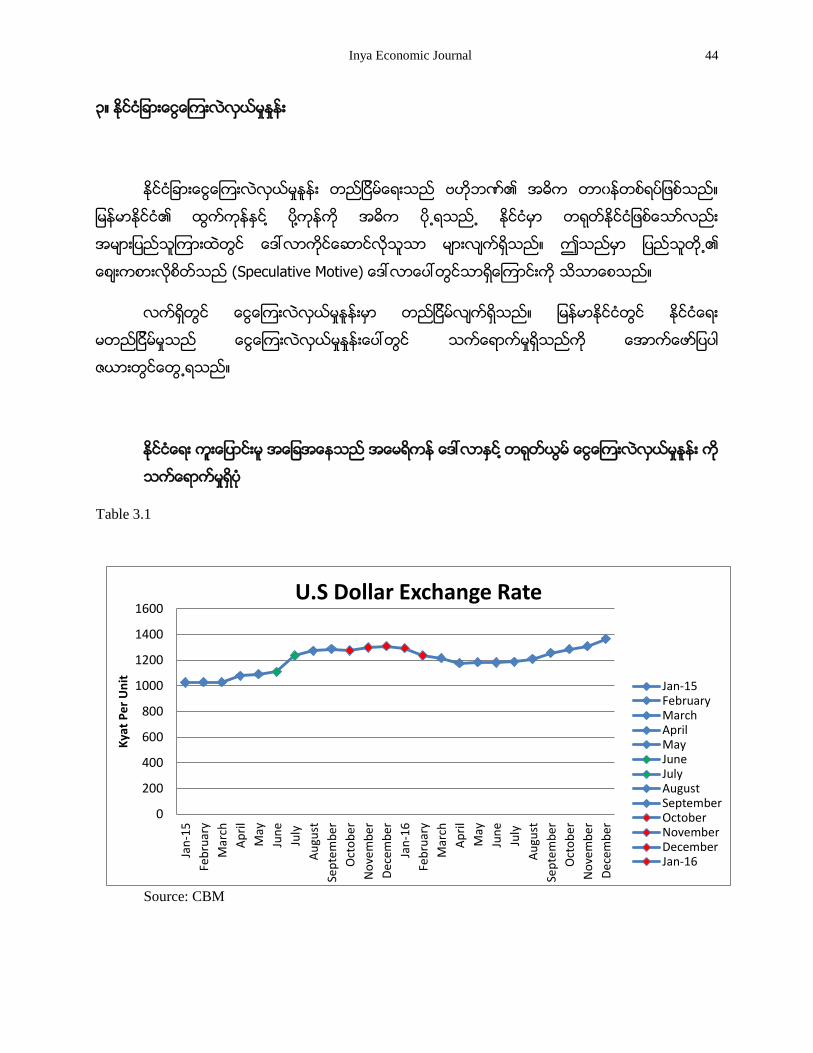
၃။
၀ ။
႔ ႔ ႕ ႕
ဒ ။ ႕
ဒ ။
။
ါ
႕ ။
ဒ ႔
Table 3.1
Source: CBM
0
200
400
600
800
1000
1200
1400
1600
Jan
-15
Feb
ruar
y
Mar
ch
Ap
ril
May
Jun
e
July
Au
gust
Sep
tem
be
r
Oct
ob
er
No
vem
be
r
De
cem
ber
Jan
-16
Feb
ruar
y
Mar
ch
Ap
ril
May
Jun
e
July
Au
gust
Sep
tem
be
r
Oct
ob
er
No
vem
be
r
De
cem
ber
Kya
t P
er
Un
it
U.S Dollar Exchange Rate
Jan-15FebruaryMarchAprilMayJuneJulyAugustSeptemberOctoberNovemberDecemberJan-16

Current Situation of Monetary Policy in Myanmar 45
Table 3.2
Source: CBM
ဒ ႔ Political
Pressure ဒ ႔
ါ
(Table 3.1, 3.2) ႔ ႔ ။ ါ ၊
၀ ၊ ဒ ၊ ၀၁ ၀ါ ဒ
႔ ႕ ။
(၄)၊ ၊ ၀၁ ၊ ႔
႔ ႕ ဒ 1110
1236 ႔ ႕ ။
႕ 178.78 ၊ 199.07
႔ ႕ ႕ ။
0
50
100
150
200
250
2015,…
Feb
ruar
y
Mar
ch
Ap
ril
May
Jun
e
July
Au
gust
Sep
tem
be
r
Oct
ob
er
No
vem
be
r
De
cem
ber
2016,…
Feb
ruar
y
Mar
ch
Ap
ril
May
Jun
e
July
Au
gust
Sep
tem
be
r
Oct
ob
er
No
vem
be
r
De
cem
ber
Chinese Yuan Exchange Rate
2015, January
February
March
April
May
June
July
August
September
October
November

Inya Economic Journal 46
Source: CBM
၀၁ ဒ ႕
ဒ ။ ၀၁ ၊
႔ ၀ ( ၀ )
ဒ ႔ ႕ ႔ ။
႕ ႔ Foreign Currency Reserve
($) ဒ ။ ႕
႕ ႔ ႕ ၀ ဒ ါ
Foreign Currency Reserve ဒ ။
႔ ဒ
႕ ႕ ါ ။ ႕ ါ
႕ ႕ ႕ ါ ။
႔ ဒ ၄ ႕
႕ ၀ ။
1240
1260
1280
1300
1320
1340
1360
1380
1400
10
/11
/20
16
11
/11
/20
16
15
/11
/20
16
16
/11
/20
16
17
/11
/20
16
18
/11
/20
16
21
/11
/20
16
22
/11
/20
16
23
/11
/20
16
25
/11
/20
16
28
/11
/20
16
29
/11
/20
16
30
/11
/20
16
1,1
2,2
01
6
2,1
2,2
01
6
5,1
2,2
01
6
6,1
2,2
01
6
7,1
2,2
01
6
8,1
2,2
01
6
9,1
2,2
01
6
12
,12
,20
16
13
,12
,20
16
14
,12
,20
16
15
,12
,20
16
16
,12
,20
16
19
,12
,20
16
20
,12
,20
16
21
,12
,20
16
22
,12
,20
16
23
,12
,20
16
26
,12
,20
16
27
,12
,20
16
28
,12
,20
16
30
,12
,20
16
2/1
/20
17
3/1
/20
17
5/1
/20
17
6/1
/20
17
9/1
/20
17
USD/MMK Exchange Rate
Current Situation of Monetary Policy in Myanmar 47
႕ ႕ ၄
ါ ၀၁ ဒ
႕ ။ 1
ါ၀
႕ ါ ႕ ႕
႔ ါ ႕ ဒ ဒ ၃ ႔ ဒ ၄ 2 ႕
႕ ။
ါ ႔ ($)
႔ ႕
႔ ႕ ($) ႔ ႔ ။
႕ ႕ ဒ ၀ ႔
ဒ ါ ။ ႕ ဒ ၃ ႔ ၄
။ ႔ ဒ
႔ ဒ ( ၁၊ ဒ ၊ ၀၁ ) ႔ ၁၃ ႕
႕ ။
၀၁ ၊ ဒ (-770 U.S$
Million) ႔ ။ ႔ ဒ
႔ ႔ ။
႕ ႕ ႕ ႕
၄ Monetary tools ႔ ဒ ႔
႕ ါ ။

Inya Economic Journal 48
(Conclusions)
ဒ ႕ ။ ႕ NLD
႔ ႕ ။
၀ါဒ ႔
႔ ၀ ။
ါ ႕ ။
႔ ၊
႔ ၊ ႕ ႔
႔၀ ၀
။

Current Situation of Monetary Policy in Myanmar 49
၊ ။ ါ
႔ ၊
ဒ ။ ႔ ႔
႔ ါ ဒ ႕ ။
႔ ႔ ဒ ။
ဒ ါ ၀ ၊ ၀
။
႕ ႕ ႔ ႔ ႕ ႕ ႔ ႕ ႔ ါ
Inya Economic Journal 50
႕ ။ ႔ ႕ ႔ ႔ ႔ ။ ႔ ဒ ၃ ၀၁ ၊ ၊ ၀၁ ။
Source: http://www.mof.gov.mm
၀ါဒ Monetary tools ႔ ၀ါဒ
။ ႕ ႕ ႕
႕ ။ ႔ ႔ ႕ ( Export-
Led Growth)3 ႔ ၊ ႔ ႔
၀ါဒ ႕ ႔ ။
႔ ႔ ႔
။

Current Situation of Monetary Policy in Myanmar 51
႕
႔
႔ ။
႔ (၁၃%) ႔ ႔ ။
႔ ႔ ႔
႔ ႔ ။
၀ါဒ
(Policy Recommendations)
ဒ ႕
၊ ါ
။ ႔ ။
႔ ႕ ႕
။
၁။ ႔
။ ။
ါ ႕ ။
၁ ၁
႔
႔ ႕ ႔ ႔ ။
႔ ၄ ႔
( ႔ ႔ ႕ ) ႕
႕ ႔ ။

Inya Economic Journal 52
႔ ဒ
႔ ။
႕
႕ ႔ ။
၀၁ ဒ
၀ါဒ ႔ ါ၀ ႔
႔ ။ ႔
၀ါဒ ႔ ႔ ။
႕
႕ ။
႕ ။
ဒ ႔ ါ ။ ႕ ႔ ႔
ါ ႔ ။
၁- ႔
၊ ႕ ၊ 4
- ႕ ၀ါဒ ၊
႔ ါ ႔
၃ - ႔ ၊
႔ ၊
၄- ႔
႔ ၊ ႔
-
႕ ႔ ၁၃ ႕

Current Situation of Monetary Policy in Myanmar 53
- ႔ ၀ါဒ ႕ ။
႔ ၀ါဒ
(Unemployment insurance)
႔ ။
- ႔ ဒ Research and Development Center
႔ ။
႔
၀ ႔
။ ႔ ႔
၀ါဒ ။5

Inya Economic Journal 54
(Notes)
1- ႔ ဒ၊ (၁ ၊ ဒ ၊ ၀၁ ) (၁၁)၊ ၊
၃ ။ ႔
။

Current Situation of Monetary Policy in Myanmar 55
၃ - ။ ၊ ၊ ၀ ႔
႔ ႔ ႔
။
၃ - ။ ႔
႔ ႔ ႔ ။
၃ - ။ ၊ ၀
႔
။
၃ - ဃ။ ႔ ႔
႔ ႔
၀ ။
(၁ )၊ ႔ ဒ ၊ ၄ ။ ဒ ၃ ႔ ဒ ၃ - ႔ ါ
႔ ဒ ၊ ဒ ၊ ဒ
႔ ႔
႔ ။
၄ - ။ ဒ ၃ - ၊ ဒ ၃ - ႔ ဒ ၃ -ဃ ႕ ါ
႔
ဒ ၊ ဒ ၊ ဒ ။
3 - ႔ ႔ ႔ Export-
Led Growth (or) Outward Looking StrategyI ႔ “A Collection of
Inspirational Tributes in memory of world-renowned Myanmar economist fore father of modern
economics, Professor DR HLA MYIT”(Sep,2017) ႕ ။
I-(Hla Myint.”The Inward and Outward Looking Countries of South East Asia and the Economic Future
of the Region”. Mimeographed. Paper for Symposium on Japan’s Future in South East Asia, Kyoto
University, 31 May to 2 June 1965.)
4-
။ ႔ IMF,
World Bank ႔ ႕ ႕ ႔ ဒ

Inya Economic Journal 56
၄ ႔ ၀ါဒ ႕ ၊
႕ ။
5 – ၊ (Skill Labour)
(White Colour Skill Labour) Productive Worker ါ ႔
႕ ။ ႕ ါ ႔ ႔
႕ ၄ ႕ ႔ ႕
ါ ၊ ၄ ႔ ႔ ၀ ။
၀ ႕ ႕ Polytechnic School
။ ႔ ႕ ႕
။
၊
၊ ။

Current Situation of Monetary Policy in Myanmar 57
(References)
1. CSO 2015, 2016
2. http://www.cbm.gov.mm/
3. http://www.mof.gov.mm/sites/default/files/04%20Union%20Planning%20and%20Finance%20M
inister%27s%20Budget%20Speech%20for%202017-
2018%20Fiscal%20Year%2830.1.2017%29.pdf
4. Selected Monthly Economic Indicators, CSO
5. Myanmar Economic Monitor, December 2016, World Bank Group
6. Myanmar’s Macro-Economy 2017: Taming the Dragons, Finding the Tigers, SEAN TURNELL,
August 24, 2017, Yangon
7. STIGLITZ, JOSEPH E., MAKING GLOBALIZATION WORK
8. KRUGMAN, PAUL, Who Was Milton Friedman?, The New York Time Journal, February 15,
2007 Issue
9. http://www.president-office.gov.mm/zg/?q=briefing-room/news/2017/10/02/id-13478

Inya Economic Journal 58
(APPENDIX)
(Years 1995/1996 – 2014/2015(PA), absolute values in kyat millions)
Source: CSO
ါ ႕ ၀၁ - ၀၁၃
႕ ႕ ၀၁၁
၊ ႕ ႕
ါ ႕ ႕ ါ ။
-2000000
-1500000
-1000000
-500000
0
500000
1000000
1500000
2000000
1995 -1996
2000 -2001
2005 -2006
2010 -2011
2011 -2012 2012 -2013
2013 -2014
2014 -2015
State Administrative Organizations
1995 - 1996
2000 - 2001
2005 - 2006
2010 - 2011
2011 -2012
2012 - 2013
2013 - 2014
2014 - 2015

Current Situation of Monetary Policy in Myanmar 59
State Administrative Organizations
Years 1995/1996 – 2014/2015(PA), absolute values in kyat millions)
Year Surplus (+) / Deficit (-)
1995 -1996 (-) 38819.5
2000 – 2001 (-) 214804.4
2005 – 2006 (-) 407217.2
2010 – 2011 (-) 1813559.8
2011 – 2012 (-) 1710015.5
2012 – 2013 + 1376813.5
2013 – 2014 (-) 755213.8
2014 – 2015 (PA) (-)782129.4 Source: Budget Department
2010-2011 2011-2012 2012-2013 2013-2014

Inya Economic Journal 60
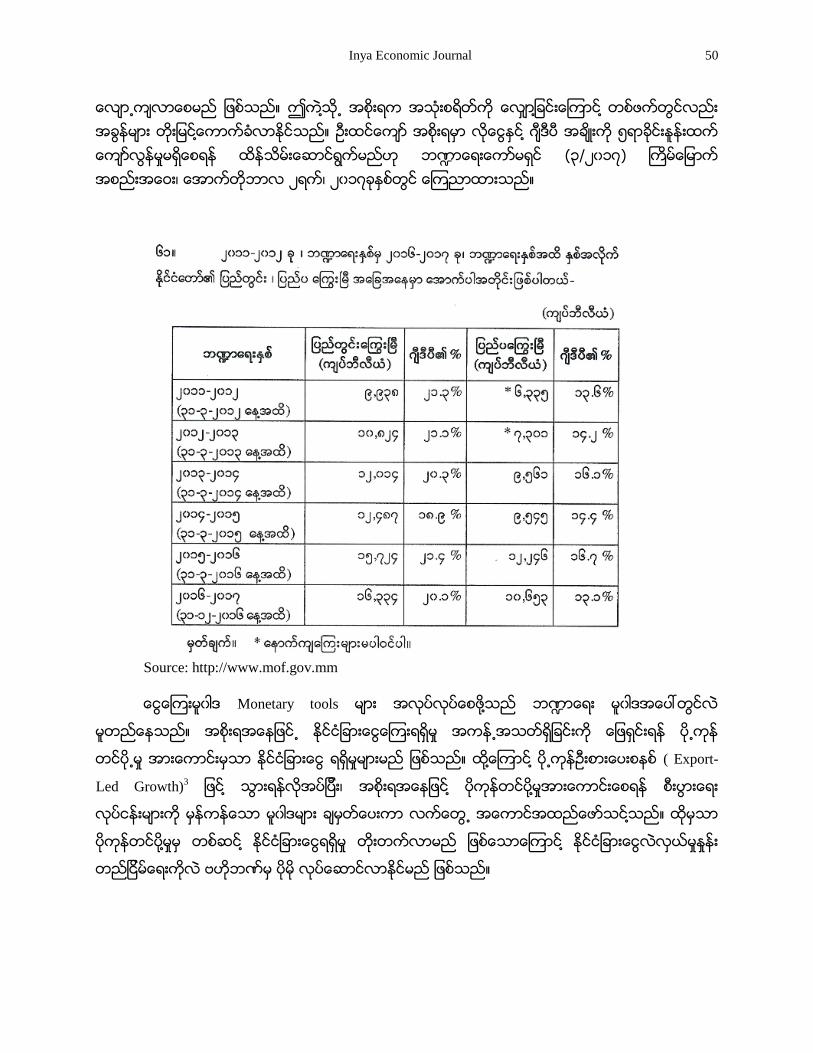
လကရ ျမနမာႏငင၏ အေျခအေနအရပရပမာ အႏတသေဘာေဆာငသည အေျခအေနမားစြာက ေတြ႔ရေနရပါသည။ လထအစးရသစ၏ မၿပးျပတေသးေသာ ၿငမးခမးေရး ကစၥရပမား၊ လပခတညးလညး စးပြားေရးကစၥရပမား၊ ႏစစဥလလ ျမနမာႏငငသ႔ သဘာ၀ေဘးအႏရာယမား အျပင ယခေလာေလာဆယတြင ရခငအေရးကစၥမားပါ ႀကေတြ႔ရလကရသညက ေတြ႔ရရပါသည။ သ႔ေသာ စးပြားေရး ျပျပငေျပာငး လမႈမားတြငမႈ တစဆငခငး ျပျပငေျပာငးလလကရသညက အစးရသစ၏ အခြနအေကာက ငရာ မ၀ါဒမား၊ ဘ႑ာေရးဆငရာ မ၀ါဒမား၊ ကနသြယေရးဆငရာ မ၀ါဒမားတြင ေလာေလာလတလတ ေတြ႔ရႏငသညဟ ေယဘယ ေျပာဆႏငပါသည သ႔ေသာ သကဆငရာ စြမးေဆာငရည နမအျမငမာမ မတညမႈမားစြာ ရသညက ေတြ႔ရရသည။
ဒတယသမၼတ(၁)ႏင ကနသညစကမႈလပငနးရငမားအသငး၏ ကနသြယေရးတးျမငေစရနအတြက ပးေပါငးေဆာငရြကမႈမား၊ အႏၵယႏငင၏ ပတငသြငးမႈအေပၚ ျမနမာႏငငရ ပလပငနးရငမားႏင အစးရမ ပးေပါငး ေဆာငရြကမႈမား၊ အျပ သေဘာေဆာငေသာ ပးေပါငးေဆာငရြကမႈမ ေျပာဆႏငပါသည။
(၃) ၊ ၊
၊
Current Situation of Taxation in Myanmar 61
(GDP)
အခြနမ၀ါဒ
၁။ ႏငငေတာ အစးရ၏ အသးစရတမားအတြကသာ အခြနက ေကာကချခငး မဟတဘ ႏငငေတာတြင ညညႊတမတေသာ အရအသးေငြေၾကးစနစက ေဖာေဆာင၍ ေငြေၾကးလညပတမႈ မနကနေစရန။
၂။ ေငြေၾကးေဖာငးပြမႈက ထနးသမးရန။
၃။ ျပညတြငးစားသးမႈ၊ ရငးႏးျမပႏမႈႏင စေဆာငးမႈတ႔က အခြနအေကာကစနစျဖင ထနးညေပးရန။
၄။ ကနေစးႏႈနးတညၿငမမႈအတြက အေထာကအကျပရန။
၅။ ၀ငေငြခြေ၀မတမႈေစရနႏင စးပြားေရးဖြ႔ျဖးတးတကမႈက အေထာကအကျပရန။
အသးစရတမ၀ါဒ
၁။ ပညာေရး၊ ကနးမာေရးႏင လမႈကာကြယေစာငေရာကေရး အသးစရတမားက ဆကလက တးျမငသးစြရန။
၂။ ျပညသလထက ခကခငးလကငငး အကးျပႏငသည အသးစရတမားက ဥးစားေပးသးစြရန။
၃။ ဖြ႔စညးပႏင ၀နထမးခန႔အပမႈမားက စနစတက စစစခြငျပရန။
၄။ စမကနးမားအား ဥးစားေပးအဆငခြၿပး လတတေလာမလအပေသးသည စမကနးမားက ေရႊ႔ဆငး ေဆာငရြကရန။
၅။ ပစၥညး၀ယယမႈမားက စနစတက စစစေဆာငရြကရန။
၆။ ျပညပအကအညရေငြႏင ျပညပေခးေငြမားက စစစရယရန။
၇။ ေကးလကေဒသဖြ႔ၿဖးေရး၊ လပစစမးရရေရး၊ ေသာကသးေရႏင စကပးေရ လေလာကစြာ ရရေရးတ႔ အတြက တးျမငသးစြရန။
Inya Economic Journal 62
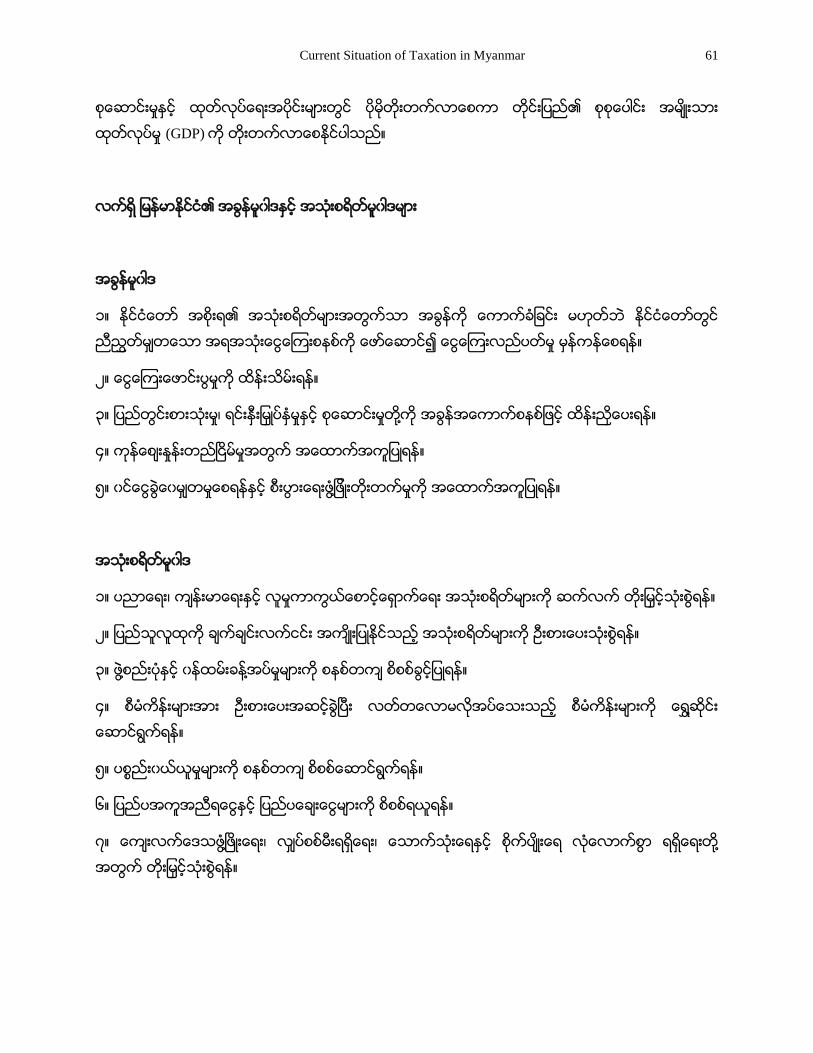
အခြနရရမႈပမာဏ
အဆပါ အခြနမ၀ါဒႏင အသးစရတမ၀ါဒမားအား ေလလာၾကညပါက အစးရသစအေနျဖင အခြနအား ပစအမးမးျဖင တးခ႔ ေကာကခရန အစအစဥရသလ အသးစရတအပငးတြငလညး အေလအလြငမရေအာင စစစသးစြရငး ျပညသလထအတြက အမနတကယလအပသည ေနရာမားတြင ပမသးစြရန လာထားသညဟ အၾကမးဖငး
အထကပါပ ၁၇.၁က ၾကည႔ပါက ၂၀၁၀ -၂၀၁၁ခႏစႏင႔ ၂၀၁၁-၂၀၁၂ခႏစတြင အစးရ၏ အသးစရတသည ရေငြထက ၂ဘလယကပ နးပါး ပသးသညကေတြ႕ရသည။ ၂၀၁၂-၂၀၁၃ခႏစတြင ႏငငျခား အကအညရေငြ၊ ေခးေငြမား၀ငေရာကလာေသာေၾကာင႔ ထတစႏစတြင ရေငြမာ သးေငြထက + 1376813.5 ကပမလယ ပမရရခ႔သည။ ၂၀၁၃-၂၀၁၄ခႏစတြင ၈သနးကပမလယ လေငြျပနျပခ႔ပါသည။
ထအကအညေငြမား ရျပး ေနာကႏစတြငလ အစးရမာ ဘတဂတလေငြဆကလကျ လကရသညက ၾကည႔ျခငးအာျဖင႔အဆပါႏငငျခားအကအညမားေၾကာင႔ရရေငြမားသည မညသည႔က႑တြင သးစြလက သညက မသရေပ။ ထေၾကာင႔ ႏငငျခားအကအညရေငြမာ အစးရဘတဂတလေငြျပမႈက ေျဖရငးႏငရန နညးလမးတစခ မဟတေပ။ အမနတကယလပေဆာငသင႔သညမာ အစးရတစရပအေနျဖင႔ အခြနမရေငြျဖင႔ သာ အဓက ရပတညသင႔သည။ ထ႔ေၾကာင႔ Tax Base ကခ႔ျခငးႏင႔ ႏႈနးတးခြန(Progressive Tax) ျဖင႔ ေကာကချခငးတ႔ လပသင႔ပါသည။ ျမနမာႏငငတြင ႏနးတးခြနျဖင႔ ေကာကခသညက ေတြႊရရသည၊ သ႔ေသာ ၀ငေငြျမင႔ လတနးစားမားအေပၚတြင အခြန စညးၾကပႏငဖ႔ လအပပါသည။

Current Situation of Taxation in Myanmar 63
ေအာကေဖာျပပါပက ၾကည႔ျခငးအားျဖင႔ အစးရ၏ ဘတဂတရေငြတြင အခြနမရေငြသည ၂၀၁၄-၂၀၁၅ခႏစအထ ၅ခး ၁ခးသာလငရသညကေတြ႔ရသည။
Relationships between Receipts Taxes and State Budget Receipts (Kyat Million)
Source: Budget Department.
၂၀၁၁ခႏစ သမၼတဥးသနးစနအစးရ တကလာသည ေနာကပငးတြင အခြနရရမႈအေျခအေနမာ တစစထကတစစ ပမတးတကလာသညက ေတြ႔ရရသည။ ျပညေထာငစ၏ အရအသးေငြစာရငးတြင အခြနမ ရေငြ အခးအစားမာ ၂၀၁၄-၂၀၁၅ခႏစအထ အတငးအတာတစခအထ နညးပါးလကရသညက ေတြ႔ရသည။ ထ႔ေၾကာင႔ ဥးထငေကာအစးရသည ေအာကတဘာလ(၁)ရကေန႔မ၍ ေအာကပါအတငး အေကာကခြန ႏႈနးမား ေျပာငးလ ေကာကခမညျဖစေၾကာငးေၾကညာခ႔သည။
0
5000000
10000000
15000000
20000000
25000000
2010 -2011
2011 -2012
2012 -2013
2013 -2014
2014 -2015
State Budget Receipts
Receipts Taxes

Inya Economic Journal 64

Current Situation of Taxation in Myanmar 65
အထကပါ အခြနႏနးမားသည ျဖစသင႔ျဖစထကေသာ ႏႈနးထားမားျဖစသည။ ၊
Year Fiscal Balance (to GDP) 1980-1981 667.5 1985-1986 -298.1 1990-1991 -7505.1 1994-1995 -16152.9 1995-1996 -25450.3 1996-1997 -25427.5 1997-1998 -10280.7 1998-1999 -7458.4 1999-2000 -38091.2 Source: CSO
Source: CSO
-45000
-40000
-35000
-30000
-25000
-20000
-15000
-10000
-5000
0
5000
1980-1981 1985-1986 1990-1991 1994-1995 1995-1996 1996-1997 1997-1998 1998-1999 1999-2000
Fiscal Balance (to GDP)

Inya Economic Journal 66
၊ ၊ ၊
1- CSO 2016 2- Ministry of Planning and Finance. (Citizens Budget 2017:2018) 3- The Voice Daily News.
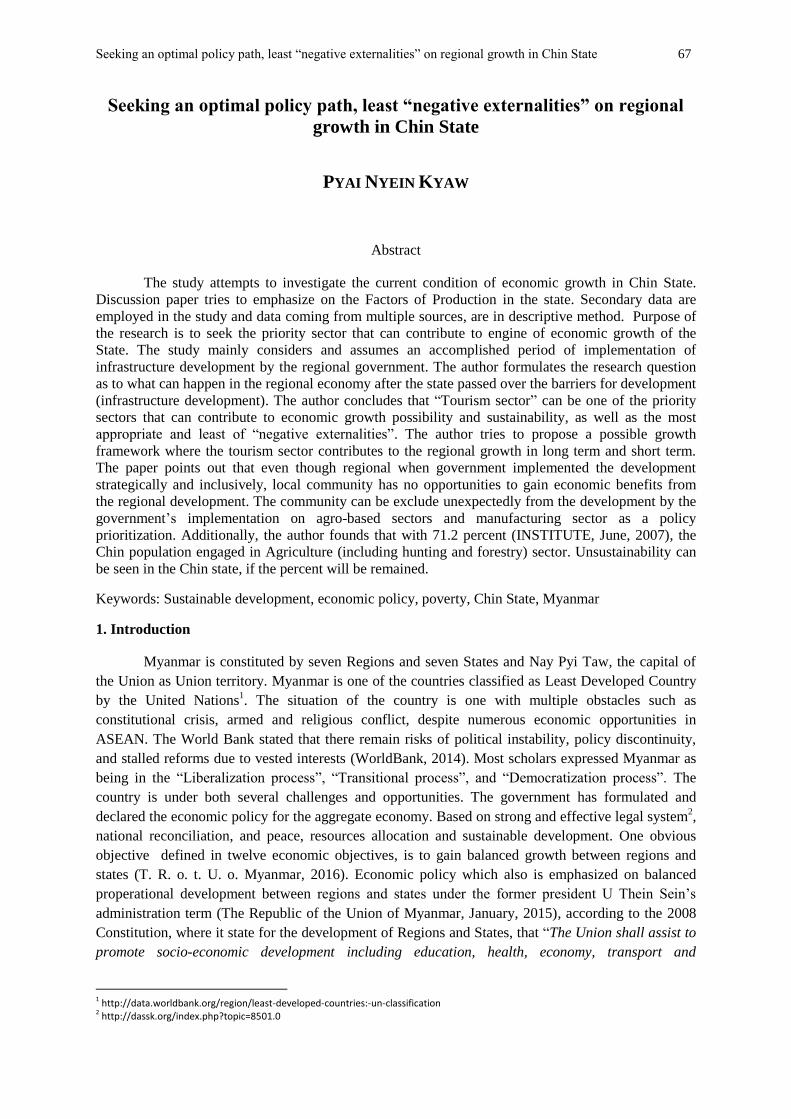
Seeking an optimal policy path, least “negative externalities” on regional growth in Chin State 67
Seeking an optimal policy path, least “negative externalities” on regional
growth in Chin State
PYAI NYEIN KYAW
Abstract
The study attempts to investigate the current condition of economic growth in Chin State.
Discussion paper tries to emphasize on the Factors of Production in the state. Secondary data are
employed in the study and data coming from multiple sources, are in descriptive method. Purpose of
the research is to seek the priority sector that can contribute to engine of economic growth of the
State. The study mainly considers and assumes an accomplished period of implementation of
infrastructure development by the regional government. The author formulates the research question
as to what can happen in the regional economy after the state passed over the barriers for development
(infrastructure development). The author concludes that “Tourism sector” can be one of the priority
sectors that can contribute to economic growth possibility and sustainability, as well as the most
appropriate and least of “negative externalities”. The author tries to propose a possible growth
framework where the tourism sector contributes to the regional growth in long term and short term.
The paper points out that even though regional when government implemented the development
strategically and inclusively, local community has no opportunities to gain economic benefits from
the regional development. The community can be exclude unexpectedly from the development by the
government’s implementation on agro-based sectors and manufacturing sector as a policy
prioritization. Additionally, the author founds that with 71.2 percent (INSTITUTE, June, 2007), the
Chin population engaged in Agriculture (including hunting and forestry) sector. Unsustainability can
be seen in the Chin state, if the percent will be remained.
Keywords: Sustainable development, economic policy, poverty, Chin State, Myanmar
1. Introduction
Myanmar is constituted by seven Regions and seven States and Nay Pyi Taw, the capital of
the Union as Union territory. Myanmar is one of the countries classified as Least Developed Country
by the United Nations1. The situation of the country is one with multiple obstacles such as
constitutional crisis, armed and religious conflict, despite numerous economic opportunities in
ASEAN. The World Bank stated that there remain risks of political instability, policy discontinuity,
and stalled reforms due to vested interests (WorldBank, 2014). Most scholars expressed Myanmar as
being in the “Liberalization process”, “Transitional process”, and “Democratization process”. The
country is under both several challenges and opportunities. The government has formulated and
declared the economic policy for the aggregate economy. Based on strong and effective legal system2,
national reconciliation, and peace, resources allocation and sustainable development. One obvious
objective defined in twelve economic objectives, is to gain balanced growth between regions and
states (T. R. o. t. U. o. Myanmar, 2016). Economic policy which also is emphasized on balanced
properational development between regions and states under the former president U Thein Sein’s
administration term (The Republic of the Union of Myanmar, January, 2015), according to the 2008
Constitution, where it state for the development of Regions and States, that “The Union shall assist to
promote socio-economic development including education, health, economy, transport and
1 http://data.worldbank.org/region/least-developed-countries:-un-classification 2 http://dassk.org/index.php?topic=8501.0

Inya Economic Journal 68
communication, so forth, of less-developed National races”(T. R. o. t. U. o. Myanmar, September,
2008). Nowadays, most LDC countries have been facing a dilemma between economic growth and
sustainable development to escape from LDC status. Although Government has led and tried to
reform various sectors, public participation has not been ready yet to support the agenda of
government. Only economic policy implementation (promotion of growth and investment) can
effectively drive aggregate economic growth. The community demands equitable resources
distribution among the Union government and States and Regions. Nowadays, Myanmar’s economy
is primed for sustainable growth; to causing government to replace the old perspectives with new
ideology of political economy, based on the classical economic implementation, management and
procedures. Therefore the new government has been facing insufficient capacity in economic
governance since the beginning.
2. Objective
The study aims to attempt an investigation that emphasize on Chin State’s economy. The
investigation is to expose the optimal solution to sectorial reform and prior implementation of revenue
of regional government. The study of reason is Chin State is one of least developed states and region
in Myanmar. According to UNDP report, Chin state is one of the poorest among states and regions
(U. MYANMAR, 2014), then the population is second smallest state in the country ("The 2014
Myanmar Population and Housing Census," 2015). Geographically, in the distribution of business of
Chin state is 1.1 percent (CSO, 2016) and the percent is least distribution among the states and
regions. In Chin state, there has 55.2 percent (Age group 15-64) of total state population that are
economically productive. Moreover, labor force participation rate is 64.8 percent and unemployment
rate of the state is 5.4 percent in that population.
3. Methodology
This paper analyzes the secondary data and information from different sources. The study is
prepared on the data from the publication by the ministries such as Ministry of Commerce, Central
Statistical Organization, Census data and others non-government institution. For the data analysis, the
author applies the descriptive methods that to gather and present the data. As a data requirement in
this study, multiple sectorial data of Chin State are insufficient that to apply in empirical analysis.
Nevertheless, major variables which are vital roles in this study are employed.
4. Conceptual Framework
The study investigate the local condition and features of the state, regional government’s
policy encourage on agro-based and livestock economy, in order to poverty reduction in Chin State
and appear to be food security. The community based tourism in Chin State, State government stated
it at the objective level that as a policy instrument, in order to reach the mission. Nevertheless, it has
been designed as low level prioritization. Following figure show that a conceptual framework on
regional economic well-being. Economic well-being can occur in the state if regional government
tries to emphasize on tourism sector. It is also the author’s proposal for the policy priority.
Prioritization on tourism sector, the state can gain the benefit from that sector and can be happen
regional economic well-being in the short term, according to the following framework. The author
assumes that implementation on community based tourism, can gain the economic benefit faster than
implementation on other sectors. Moreover, the community based tourism can encourage the
environmental conservation and sustainable development. To progress on tourism sector, regional
government must necessary that to implement on basic infrastructure. Infrastructure development will
Seeking an optimal policy path, least “negative externalities” on regional growth in Chin State 69
be necessary not only for tourism sector but also on all sectorial reform. In the infrastructure
development, there are multi transportation, electricity, clean waters etc. Additionally, there are
necessary that to set up emergency assistance or response to customers in tourism industry. It means
that try to support security staffs, well prepare administration, multiple use response channel etc. That
arrangement can be bewitching for the local and non-local guests. In the initial stage, there is
necessary to consider on local business’s management and other technical resources support by
regional government. Regional government can request the necessary financial resources to the union
government, it might receive financial resources fully or partially. Alternatively, regional government
already formulated a Strategy for the developmental programs for Small and Medium Enterprises in
Chin State. In that Development Strategy, Eco and Community Based Tourism is one of the strategy
consideration in the Chin State development. But it is not determination on as a priority sector for the
state development. Additionally, regional government’s revenue can earn from the taxation on the
tourism sector. Regional government can invest the some financial resources to the human resources
program for the sustainable development in the state. Tourism sector development can be gain the
benefit for the state sustainability in short term and long term.
Author hypothesize that tourism industry can contribute the economic benefit for local residents in
short-term (see in detail following figure). Figure (1) show that conceptual map for the possible
State’s economy, major thoughts based on tourism industry, there are necessary some financial
resources and implementation in order to tourism sector development initially. Chin State government
design the development plan and allocate the financial resources to the implementation which support
to tourism sector development such as infrastructure development, set up emergency plan and
assistance as well. While tourism industry develop, on the other hand, job and market opportunities
for the local SMEs and residents consequently. Moreover, Chin State government’s revenue become
from taxations (including categories income tax, commercial tax, property tax, consumption tax, etc.).
One component of hypotheses is that development of tourism industry lead to effect on rising of
individual income or household income. In term of fundamental concept of economics, when
household or individual’s income increase, consumption of them go up as will. High or moderate
consumption encourage to economic functioning well. When government’s revenue increase, sectorial
reform or implementation for attraction of investment (infrastructure development) is being
emphasized more. In the diagram, blue color or rectangle box indicate to long term journey of Chin
State development. Fundamentally and theoretically, the production sector is one of the economic
engine in an economy. Therefore, the author designs the economic development in Chin State, That is
production sector lead to contribute to rise up the total output of Chin State’s economy. Development
of production sector create more job and market opportunities. Nevertheless, there is necessary to
consider protection and recovery design and implementation for sustainable society by Chin State’s
government.
In the conceptual framework, the author eliminates the agricultural sector to consider in the Chin
State’s economy. In the government’s prior agenda for Chin State, agriculture and breeding sectors
are being considered. Because existing agricultural practices lead to deforestation and instability. For
the farmers who are from the whole country’s agriculture sector are necessary the technical supports
and capitals.

Inya Economic Journal 70
Figure (2) Proposed new strategy for Chin State’s economy
Source: Author’s design
The author employed a concept of sustainable development that is the triple bottom line concept
developed by Elkingtion. It can be considered simultaneously that balances economic, environmental
and social goals. The key idea is to suggest that at the intersection of Social, environmental and
economic performance affect positively to firms and society (Rogers, 2008). The triple bottom line
encourage that to become effect positively on the environmental and society, on the other hand, farms
also can gain the reputation. Figure (3) show that the best situation among the areas which are society,
environment and business. Every activities lead to sustainability aspect by economically and socially.
Nevertheless, organizational behavior and business models are considered that to redesign, in order to
equilibrate with this concept.
Figure (3) Triple bottom line
Source: Craig R. Carter, Dale S. Rogers, (2008) “A framework of sustainable supply chain management:
moving toward new theory”, International Journal of Physical Distribution & Logistics Management, Vol. 38
Issue: 5, pp. 360-387, https://doi/org/ 10.1108/09600030810882816
Seeking an optimal policy path, least “negative externalities” on regional growth in Chin State 71
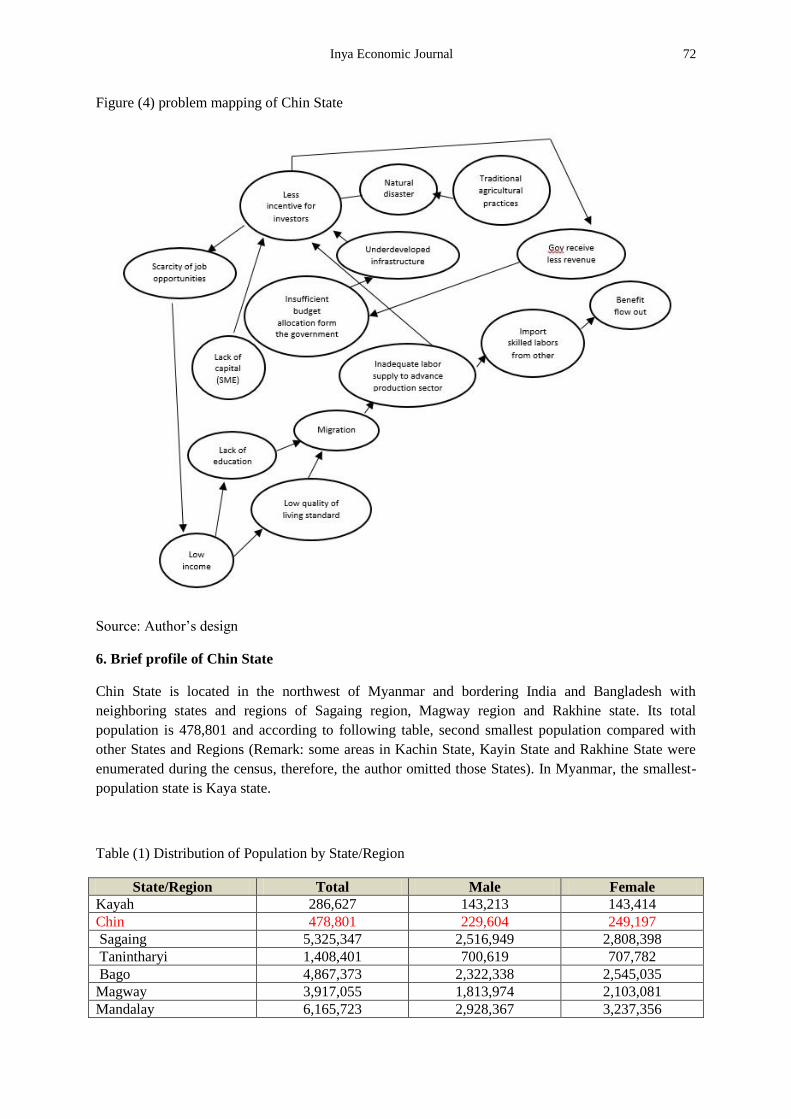
5. Problem Mapping
The author presents a mapping for the problems with the following figure. In the figure, infrastructure
and natural disaster are identified as a root cause of the problems in Chin State. Nevertheless, there
can be other causes of the problem, occasionally. For instance, natural disaster can cause less
incentive for investors, at the same, natural disaster can be effected by traditional agricultural
practices such as shift cultivation. Some factors are vicious cycle, for instance, lack of investment
leads to the state government receive less revenue from the investment; as a consequence, the state
government contributes less the financial resources from the revenue. Being less revenue from the
investment sector, government is not capable to invest in the infrastructure sufficiently. The problem
mapping indicate the causality. Moreover, lack of investment (less incentive for investors) places
burden on level of income and Job opportunities, then it encourages the local residents to become as a
diaspora. The people seek the opportunities of education and higher living standards outside of Chin
State. Also it is said that existing labor force cannot support the production sectors, thus when
economic windows open, investment and production benefits flow out from the Chin State, because
skilled labor will be imported from other States and Regions by the enterprises for the production
sector. The author assumes that infrastructure and natural disaster are primary barriers for the State’s
economy, and it is hard to visibly increase individual income of people living in Chin State. Local
residents in State, can gain economic benefits slightly from the State’s agenda setting. For reasons for
inadequate labor supply to advance production sector (see in figure), lack of skilled labors and then
lack of capital that to set up the SMEs in Chin State, there is not much room for entry into the State’s
development agenda in short-term setting. Regarding Small and Medium Enterprises, there are
perplexing procedures in applying loan for the business. The problem is emphasized after the
condition of developed transportation sector. Most of the studying state multidimensional aspects on
the current condition of Chin State. In the present study, the author’s major consideration is beyond
the period of transportation advancement. The author’s concern is that benefits flow out from the Chin
State. Economically, the State production can rise in the multiple sectors; nevertheless, the individual
income is not guaranteed that to rise up.
Inya Economic Journal 72
Figure (4) problem mapping of Chin State
Source: Author’s design
6. Brief profile of Chin State
Chin State is located in the northwest of Myanmar and bordering India and Bangladesh with
neighboring states and regions of Sagaing region, Magway region and Rakhine state. Its total
population is 478,801 and according to following table, second smallest population compared with
other States and Regions (Remark: some areas in Kachin State, Kayin State and Rakhine State were
enumerated during the census, therefore, the author omitted those States). In Myanmar, the smallest-
population state is Kaya state.
Table (1) Distribution of Population by State/Region
State/Region Total Male Female
Kayah 286,627 143,213 143,414
Chin 478,801 229,604 249,197
Sagaing 5,325,347 2,516,949 2,808,398
Tanintharyi 1,408,401 700,619 707,782
Bago 4,867,373 2,322,338 2,545,035
Magway 3,917,055 1,813,974 2,103,081
Mandalay 6,165,723 2,928,367 3,237,356

Seeking an optimal policy path, least “negative externalities” on regional growth in Chin State 73
Mon 2,054,393 987,392 1,067,001
Yangon 7,360,703 3,516,403 3,844,300
Shan 5,824,432 2,910,710 2,913,722
Ayeyawady 6,184,829 3,009,808 3,175,021
Nay Pyi Taw 1,160,242 565,155 595,087
Source: Population and Housing Census of Myanmar, 2014
According to following table, there are 3 Districts, 9 Townships, 40 Wards, 470 Village Tracts, and
1,501 Villages. Haka district is capital of Chin State, but with very small population when compared
with the other districts of Falam and Mindat. Mindat district is the biggest district with major
economic activities based on the related agriculture sectors. Paddy production is insufficient for Chin
population; therefore, in order to fulfil necessary food of 30 percent, the food is imported from other
States and Regions.
Table (2) Population of Chin State
Districts Sub-total population
of Districts Townships Both sex Male Female
HAKA 98,726 Haka 48,352 23,022 25,330
Thantlang 50,374 24,379 25,995
FALAM 167,578
Falam 41,457 20,350 21,107
Tedim 87,623 41,927 45,696
Tonzaung 20,722 10,107 10,615
Rihkhuadal (ST) 6,620 3,273 3,347
Cikha (ST) 11,156 5,585 5,571
MINDAT 212,497
Mindat 42,600 19,727 22,873
Matupi 39,086 18,680 20,406
Kanpalet 21,493 10,313 11,180
Paletwa 64,971 31,104 33,867
Reazu (ST) 12,265 5,471 6,794
Sami (ST) 32,082 15,666 16,416
Source: Population and Housing Census of Myanmar, 2014
Chin state is terrain and mountainous and its development is under the poverty line. The state is
composed of nine townships namely by Kanpatlat, Mindat, Palatwa, Matupi, Haka, Falam, Tiddim,
Tonzang and Htantalan townships. In religion, population majority is of Christian affiliation and Chin
ethnicity. Most of households’ livelihood are farming, agro-based and blue-collar. Paddy production
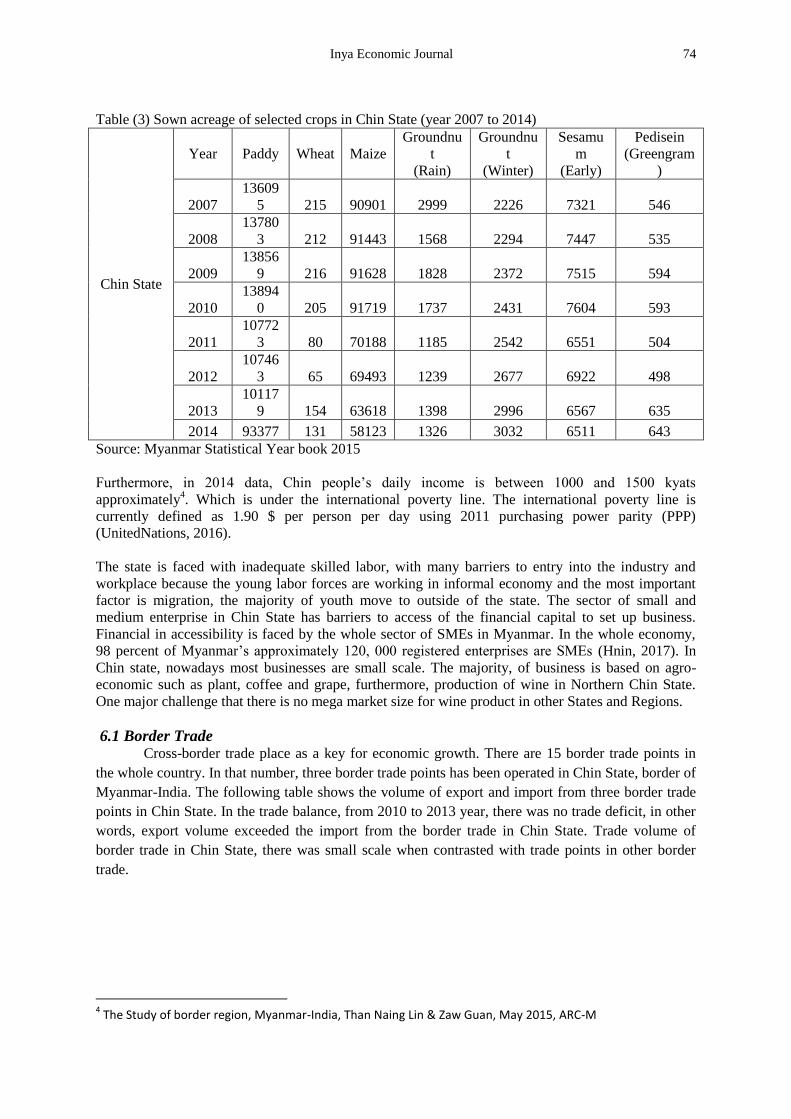
is the major role in Chin State, then maize is second major-production. The following table (3), shows
sown acreage in the Chin state of the selected crops of paddy, wheat and maize. In comparison with
other regions, Chin State of groundnut, sesamum and Pedisein have small-scale acres in plantation.
Local farmers exercise shift cultivation technique for agricultural production. Some studies found
very small scale of logging due to poor transportation. Furthermore, these studies concluded that there
is positive association between mega scale of logging and well-functioning transportation. It means
that when mode of transportation was well-functioning, amount of logging also went up.3
3 The Study of border region, Myanmar-India, Than Naing Lin & Zaw Guan, May 2015, ARC-M
Inya Economic Journal 74
Table (3) Sown acreage of selected crops in Chin State (year 2007 to 2014)
Chin State
Year Paddy Wheat Maize
Groundnu
t
(Rain)
Groundnu
t
(Winter)
Sesamu
m
(Early)
Pedisein
(Greengram
)
2007
13609
5 215 90901 2999 2226 7321 546
2008
13780
3 212 91443 1568 2294 7447 535
2009
13856
9 216 91628 1828 2372 7515 594
2010
13894
0 205 91719 1737 2431 7604 593
2011
10772
3 80 70188 1185 2542 6551 504
2012
10746
3 65 69493 1239 2677 6922 498
2013
10117
9 154 63618 1398 2996 6567 635
2014 93377 131 58123 1326 3032 6511 643
Source: Myanmar Statistical Year book 2015
Furthermore, in 2014 data, Chin people’s daily income is between 1000 and 1500 kyats
approximately4. Which is under the international poverty line. The international poverty line is
currently defined as 1.90 $ per person per day using 2011 purchasing power parity (PPP)
(UnitedNations, 2016).
The state is faced with inadequate skilled labor, with many barriers to entry into the industry and
workplace because the young labor forces are working in informal economy and the most important
factor is migration, the majority of youth move to outside of the state. The sector of small and
medium enterprise in Chin State has barriers to access of the financial capital to set up business.
Financial in accessibility is faced by the whole sector of SMEs in Myanmar. In the whole economy,
98 percent of Myanmar’s approximately 120, 000 registered enterprises are SMEs (Hnin, 2017). In
Chin state, nowadays most businesses are small scale. The majority, of business is based on agro-
economic such as plant, coffee and grape, furthermore, production of wine in Northern Chin State.
One major challenge that there is no mega market size for wine product in other States and Regions.
6.1 Border Trade Cross-border trade place as a key for economic growth. There are 15 border trade points in
the whole country. In that number, three border trade points has been operated in Chin State, border of
Myanmar-India. The following table shows the volume of export and import from three border trade
points in Chin State. In the trade balance, from 2010 to 2013 year, there was no trade deficit, in other
words, export volume exceeded the import from the border trade in Chin State. Trade volume of
border trade in Chin State, there was small scale when contrasted with trade points in other border
trade.
4 The Study of border region, Myanmar-India, Than Naing Lin & Zaw Guan, May 2015, ARC-M

Seeking an optimal policy path, least “negative externalities” on regional growth in Chin State 75
Table (4) Border trade points in Myanmar
Border Trade Points with Myanmar5
Myanmar-China 4 points
Myanmar-Thailand 6 points
Myanmar-Bangladesh 2 points
Myanmar-India 3 points
Total 15 points
Source: Discussion of Pyithuhluttaw
Table (5) Myanmar-India border trade points
Myanmar-India border trade points (Tamu, Rihkhawdar and Thantlang)
Year Export Import Trade volume (USD
currency) Trade balance
2010-2011 8.28 million 4.52 million 12.82 million 3.75 million (surplus)
2011-2012 8.869 million 6.54 million 15.4 million 2.329 million (surplus)
2012-2013 26.96 million 11.67 million 38.63 million 15.29 million (surplus)
Source: Discussion of Pyithuhluttaw
6.2 Yam plantation in Chin State
Table (6) Yam plantation in Chin State from 2013 to 2014
Yam Plantation in Chin State (2013-2014)6
Townships Acres
Taidam 315
Tonzan 1162
Kyikhar 150
Thantalang 235
Flame 65
Raeed 10
Hakha 99
Kanpalat 28
Chin State 2562 cares
Source: Discussion of Pyithuhluttaw
Yam plantation is possible income sources for agro based families. The input cost of the plantation
can be estimated at 300,000 kyats (equal with $221.4)7 approximately, the minimum requirement to
set up the farming. The profit return is between one million kyats ($738) and 1.5 million kyats
($1,107) approximately from the farming. Nevertheless, the quality of product are qualified to reach a
criteria of demand from foreign buyers. In order to become a marketable good quality product,
farmers faced major constraints in access to financial resources, technical assistance, and access to
timely market information. Even though the farmers are under the uncertain market, yam has been
planted widely in most townships in Chin State. Ministry of Agriculture and Irrigation has encouraged
and assisted technically the farmers to raise the volume of yam production8.
5 Parliament note, 27th day, 9th regular session, first Pyithuhluttaw, March 3, 2014 6 Parliament note, 35th day, 9th regular session, first Pyithuhluttaw, July 25, 2014 7 Exchange rate, $1=1355 in 1st week of August, 2017 8 Parliament note, 35th day, 9th regular session, first Pyithuhluttaw, July 25, 2014

Inya Economic Journal 76
6.3 policy diagram of Chin State
Figure (4) Existing policy of Chin State
Source: Chin stat government
Figure show that prior-policy of Chin State, Agriculture and animal farming are determined as a key
prior-policy of all. It is designed by the Chin State government and it is agro based policy
prioritization. On the other hand, SMEs and human resources development are targeted to consider as
a second priority.
The government determined the objectives, in order to fit with the policy, that to increase the volume
of agricultural production, attempt to development on the animal farming sectors, to improve the
mode of transportation, easy to access electricity, to promote community based tourism, and etc. The
objectives are majorly based on the agro-based sectors.
6.4 Data of Chin State
Following figure (5) show that the percent of literate and illiterate of people in Chin State. In each age
group, literate and illiterate percent are indicated separately. In 20-24 age group, 90.9 percent are
literate and illiterate are 9.1 percent, it lead to positive for the development of Chin State. In growth
theory, education also is one of the production factor of economic growth. The percentage or labor
force is potential for Chin State’s economy. In 25-29 and 30-34 age groups are also potential that to
contribute to the economy. From 20 to 49 age are literate majorly. According to following data, there
is no concern that to support skilled labor and to enter to the investments in Chin State, particularly in
production sector. Nevertheless, the data become from The 2014 Myanmar Population and Housing
Census conducted by the Ministry of Immigration and Population. The census data can only support
as a registration and record of the status of education of each member of household. Therefore, it is
arduous to imagine the certain number of the people who has been living in Chin State, moreover,
some percent of the people migrate to outside. Imagine that if all percentage which is in the following
graph exist inside or return to State, the local household and community members will be gained the
economic benefit.

Seeking an optimal policy path, least “negative externalities” on regional growth in Chin State 77
Figure (5) Percentage of literate and illiterate in Chin State
Source: 2014 census data of Myanmar
Following table show that the percentage of literate and illiterate of each age groups among the
districts which are Haka, Falam and Mindat. Particularly, among the three districts, high percentages
of illiterate occur in Mindat district.
Table (7) percentage of literate and illiterate in District level
Districts in Chin State
Haka Falam Mindat
five-
year
age
groups
Literate illiterate Literate illiterate Literate illiterate
20 - 24 95.1% 4.9% 96.1% 3.9% 84.1% 15.9%
25 - 29 92.5% 7.5% 93.7% 6.3% 77.6% 22.4%
30 - 34 91.9% 8.1% 92.5% 7.5% 75.2% 24.8%
35 - 39 90.0% 10.0% 90.5% 9.5% 73.2% 26.8%
40 - 44 88.8% 11.2% 88.9% 11.1% 69.4% 30.6%
45 - 49 83.7% 16.3% 84.3% 15.7% 62.4% 37.6%
Source: 2014 census data of Myanmar
Following table (7) show that the number of household members living abroad by country of
residence with person and percentage, in the table, majority has been staying in Malaysia and USA.
21.84 percent of total population has been living in abroad, precisely, 14.79 percent and 7.05 percent
are male and female in total people who has been living in abroad. In that population, smallest percent
occur in Korea. In conversation with some Chin ethnic based Civil Society Organizations supported
some related information that most of Chin ethnic has been staying as a refugee life in camps in
90.9
86.2
84.6
82.7
80.3
74.9
9.1
13.8
15.4
17.3
19.7
25.1
0% 10% 20% 30% 40% 50% 60% 70% 80% 90% 100%
20 - 24
25 - 29
30 - 34
35 - 39
40 - 44
45 - 49
Literate llliterate

Inya Economic Journal 78
Malaysia, a few people stay in Thailand as well as India. Then, they try to move to First World such
as US.
Table (8) Former conventional household members living abroad by country of residence with person
Country of residence
Total
populati
on
Total Thailan
d
Malays
ia
Singapo
re
Chin
a
Japa
n
Kore
a
Indi
a
US
A
Othe
r
Male 229,604 3397
5 436 19,751 168 183 24 56
3,50
2
7,63
6
2,21
9
Femal
e 249,197
1757
0 152 7,265 1,527 19 20 19
2,37
8
4,48
1
1,70
9
Source: 2014 census data of Myanmar
Table (9) Former conventional household members living abroad by country of residence with
percentage
Country of residence
Total
populati
on
Total Thaila
nd
Malays
ia
Singapo
re
Chin
a
Japa
n
Kore
a India USA
Oth
er
Male 100% 14.79
% 1.3% 58.1% 0.5%
0.5
%
0.1
%
0.2
%
10.3
%
22.5
%
6.5
%
Fema
le 100%
7.05
% 0.9% 41.3% 8.7%
0.1
%
0.1
%
0.1
%
13.5
%
25.5
%
9.7
%
Source: 2014 census data of Myanmar
Table (10) indicate that possible percent of labor force participation, unemployment and employment
in Chin State. Author categorize that particular age groups which are from 20 to 49 age. Furthermore,
above age groups are assumed that their productivity are possible to contribute into the economy.
According to the following table, three fourths of each age group are active economically in Chin
State, as well as it is theoretically possible for the economy. Nevertheless, being migration is unable
to support to the investment enterprises and production sectors.
Table (11) The ratio of Labor force participation, unemployment and employment in Chin State
Age groups Employed Unemployed Economically inactive total total
20 - 24 19,956 57% 3,265 9% 11,773 34% 34,994 100%
25 - 29 21,009 68% 1,792 6% 8,076 26% 30,877 100%
30 - 34 20,424 73% 941 3% 6,776 24% 28,141 100%
35 - 39 18,933 74% 517 2% 6,078 24% 25,528 100%
40 - 44 19,029 75% 286 1% 6,123 24% 25,438 100%
45 - 49 16,966 75% 190 1% 5,548 24% 22,704 100%
Source: 2014 census data of Myanmar
Following table (12) expresses that the percentage of industries in Chin State as a categorization. In
the table, each industry or sector has been operating in the Chin State. High proportion in existing
industries or sectors are agriculture, hunting and forestry, as a 71.2 percent in total. Second largest
number, 8.6 percent is transport, storage and communications sector or industries.

Seeking an optimal policy path, least “negative externalities” on regional growth in Chin State 79
Table (12) percentage of industrial categories in Chin State (INSTITUTE, June, 2007)
Industry code percent
1 Agriculture, hunting and forestry 71.2%
2 Fishing 0.2%
3 Mining and quarrying 0.8%
4 Manufacturing 1.1%
5 Electricity, Gas and water supply 0.0%
6 Construction 4.9%
7 Wholesale and retail trade, repair of motor
vehicles, motor cycles and personal and household goods 2.6%
8 Hotel and restaurants 1.3%
9 Transport, storage and communications 8.6%
10 Financial intermediation 0.0%
11 Real estate, renting and business activities 1.3%
12
Public administration and defense; compulsory social
security 2.9%
13 Education 2.5%
14 Health and social work 1.1%
15
Activities of private households as employers and
undifferentiated
production activities of private households
0.9%
16 Extra-territorial organizations and bodies 0.0%
Source: UNDP, Ministry of National Planning and Economic Development, UNOPS
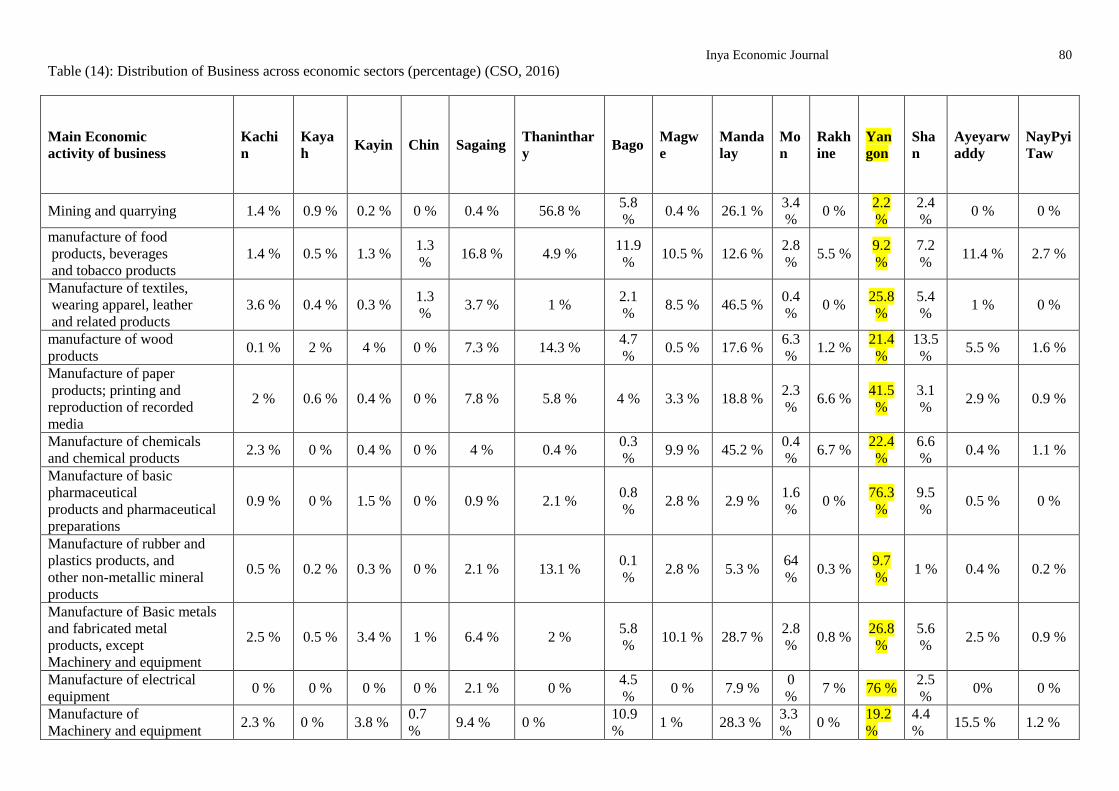
Table (13) show that distribution of main economic activities of business through States and Regions.
In Chin State, major economic activities are electricity, gas, steam and air conditioning supply and
construction sector is determined as a second major economic activity in Chin State. Compare with
other States and Regions, electricity, gas, steam and air conditioning sectors is second high
distribution for Chin State and Yangon region is determined as a first high distribution for electricity,
gas steam and air conditioning supply. Construction sectors is third major distribution of economic
activities for Chin State, first and second are Yangon Region and Shan State. The data indicate that
private enterprises has been operating with above major economic activities in Chin State.
Inya Economic Journal 80
Table (14): Distribution of Business across economic sectors (percentage) (CSO, 2016)
Main Economic
activity of business
Kachi
n
Kaya
h Kayin Chin Sagaing
Thaninthar
y Bago
Magw
e
Manda
lay
Mo
n
Rakh
ine
Yan
gon
Sha
n
Ayeyarw
addy
NayPyi
Taw
Mining and quarrying 1.4 % 0.9 % 0.2 % 0 % 0.4 % 56.8 % 5.8
% 0.4 % 26.1 %
3.4
% 0 %
2.2
%
2.4
% 0 % 0 %
manufacture of food
products, beverages
and tobacco products
1.4 % 0.5 % 1.3 % 1.3
% 16.8 % 4.9 %
11.9
% 10.5 % 12.6 %
2.8
% 5.5 %
9.2
%
7.2
% 11.4 % 2.7 %
Manufacture of textiles,
wearing apparel, leather
and related products
3.6 % 0.4 % 0.3 % 1.3
% 3.7 % 1 %
2.1
% 8.5 % 46.5 %
0.4
% 0 %
25.8
%
5.4
% 1 % 0 %
manufacture of wood
products 0.1 % 2 % 4 % 0 % 7.3 % 14.3 %
4.7
% 0.5 % 17.6 %
6.3
% 1.2 %
21.4
%
13.5
% 5.5 % 1.6 %
Manufacture of paper
products; printing and
reproduction of recorded
media
2 % 0.6 % 0.4 % 0 % 7.8 % 5.8 % 4 % 3.3 % 18.8 % 2.3
% 6.6 %
41.5
%
3.1
% 2.9 % 0.9 %
Manufacture of chemicals
and chemical products 2.3 % 0 % 0.4 % 0 % 4 % 0.4 %
0.3
% 9.9 % 45.2 %
0.4
% 6.7 %
22.4
%
6.6
% 0.4 % 1.1 %
Manufacture of basic
pharmaceutical
products and pharmaceutical
preparations
0.9 % 0 % 1.5 % 0 % 0.9 % 2.1 % 0.8
% 2.8 % 2.9 %
1.6
% 0 %
76.3
%
9.5
% 0.5 % 0 %
Manufacture of rubber and
plastics products, and
other non-metallic mineral
products
0.5 % 0.2 % 0.3 % 0 % 2.1 % 13.1 % 0.1
% 2.8 % 5.3 %
64
% 0.3 %
9.7
% 1 % 0.4 % 0.2 %
Manufacture of Basic metals
and fabricated metal
products, except
Machinery and equipment
2.5 % 0.5 % 3.4 % 1 % 6.4 % 2 % 5.8
% 10.1 % 28.7 %
2.8
% 0.8 %
26.8
%
5.6
% 2.5 % 0.9 %
Manufacture of electrical
equipment 0 % 0 % 0 % 0 % 2.1 % 0 %
4.5
% 0 % 7.9 %
0
% 7 % 76 %
2.5
% 0% 0 %
Manufacture of
Machinery and equipment 2.3 % 0 % 3.8 %
0.7
% 9.4 % 0 %
10.9
% 1 % 28.3 %
3.3
% 0 %
19.2
%
4.4
% 15.5 % 1.2 %

Seeking an optimal policy path, least “negative externalities” on regional growth in Chin State 81
n.e.c
Manufacture of transport
equipment 0 % 0 % 0 %
0.8
% 4.8 % 1.9 %
0.4
% 0 % 37.6 %
0
% 0 %
31.3
%
20.2
% 2.9 % 0 %
Manufacture of furniture 5.5 % 1.2 % 7.9 % 0 % 15.5 % 4.3 % 2.1
% 1.7 % 7.9 %
5.1
% 1.1 %
32.8
%
12.5
% 1 % 1.4 %
Other manufacturing;
repair and installation
of machinery and equipment
1.2 % 0.4 % 1.8 % 0.8
% 9.1 % 4.6 %
7.3
% 8.2 % 19.2 %
2.3
% 5.1 %
22.8
%
9.9
% 5.6 % 1.8 %
Electricity, gas, steam
and air conditioning supply 0 % 0 % 3.2 %
23.4
% 0 % 11.8 %
2.7
% 2.8 % 0 %
8.9
% 6.4 %
38.5
%
2.2
% 0 % 0 %
Water supply; sewerage,
waste management and
remediation
0 % 0 % 0 % 0 % 0 % 8.2 % 0 % 72 % 0 % 0
% 0 %
19.8
% 0 % 0 % 0 %
construction 0 % 1.1 % 0 % 13.1
% 9.5 % 5.3 %
1.4
% 0 % 3.2 %
0
% 1.4 %
28.4
%
24.6
% 0.6 % 11.4 %
Trade and repair of motor
vehicles and motorcycles 4.4 % 1.8 % 2.5 %
0.2
% 7.4 % 6.2 %
4.2
% 10.5 % 26 %
7.3
% 4.2 %
8.9
%
11.6
% 1.6 % 3.2 %
Wholesale trade (except
motor vehicles and
motorcycles)
0.7 % 1.1 % 1.6 % 0 % 7.2 % 9.7 % 7.4
% 22.1 % 9.6 %
2.1
% 5.1 % 20 %
7.2
% 3.3 % 3 %
Retail trade (except motor
vehicles and motorcycles) 1.6 % 1.2 % 3.3 %
2.1
% 4.8 % 10.3 %
9.1
% 7.2 % 13.2 %
7.1
% 4.7 %
19.7
%
9.1
% 4.3 % 2.3 %
Transportation and storage 0.4 % 0 % 1.4 % 1 % 15.4 % 19.6 % 5 % 7.2 % 6.1 % 5.5
%
16.5
%
10.6
%
6.5
% 2.3 % 2 %
Accommodation 4.3 % 0.6 % 2.7 % 0.3
% 7.3 % 4.2 %
3.7
% 2.9 % 18.4 %
3.6
% 6.4 %
12.2
%
23
% 7.7 % 2.7 %
Table: continued

Inya Economic Journal 82
Main Economic
activity of business
Kachi
n
Kaya
h
Kayi
n Chin
Sagain
g
Thaninthar
y
Bag
o
Magw
e
Mandala
y
Mo
n
Rakhin
e
Yango
n Shan
Ayeyarw
addy
NayPyiTa
w
Food and beverage
service activities 1.6 % 0.6 %
4.3
%
0.6
% 9.5 % 8 %
3.9
% 7.4 % 15.7 %
6.5
% 4.8 % 22.5 %
8.1
% 4.3 % 2.2
Publishing,
audiovisual and
broadcasting activities
1.5 % 0 % 2.7
%
0. 2
% 2.3 % 6.3 %
0.5
% 3.8 % 25 %
0.5
% 25.6 % 8.6 %
22.3
% 0.6 % 0
IT and other
information services 0 % 1.3 % 0 %
1.5
% 3.3 % 7.7 % 1 % 2.3 % 0.3 % 4 % 3.4 % 29.8 %
34.7
% 7.3 % 2.9
Real estate activities 0 % 0 % 0 % 0 % 0 % 21.9 % 24.8
% 0 % 0 % 0 % 0 % 41.8 %
11.4
% 0 % 0
Professional,
scientific and
technical activities
5 % 0.3 % 0.3
%
3.7
% 6.5 % 9.8 %
2.3
% 0.7 % 9.4 %
3.2
% 1.8 % 30 %
14.1
% 9.5 % 3.2
Administrative and
support service
activities
1 % 1.2 % 0.7
%
0.3
% 5 % 14.8 %
6.8
% 7 % 9.3 %
4.6
% 4.5 % 32.2 %
10.5
% 1.3 % 0.8
Education 3.2 % 4 % 0 % 6.3
% 3.2 % 24.4 %
1.5
%
10.9
% 9.9 % 0 % 0.4 % 33 %
3.3
% 0 % 0
Human health
activities 2.1 % 0.7 % 0 %
1.3
% 2.1 % 6.3 %
2.9
%
16.3
% 8.1 %
5.9
% 4.2 % 45.8 %
3.1
% 1 % 0
Arts, entertainment
and recreation 1 % 5.3 %
0.3
% 0 % 0 % 32.9 %
7.2
% 0.6 % 5 % 0 % 0 % 23.3 %
21.7
% 2 % 0.7
Other service
activities 2 % 0.6 %
3.3
%
0.8
% 1 % 14.1 %
11.4
% 8.2 % 11.2 %
3.9
% 2.1 % 22.5 %
17.9
% 0.6 % 0.4
Source: Central Statistical Organization

Seeking an optimal policy path, least “negative externalities” on regional growth in Chin State 83
7 Finding
The author founds that young labor force of education lead to positive in existing data, other word,
larger percent of young population are literate. No objection that it can support to economic growth
theoretically. In the actual condition, young population has been migrated from the Chin State. Mode
of transportation has been took obviously as a vital role in the economy of Chin State. Border trade
sector in Chin State, there has small trade volume when compare with other border trades. The border
trade points does not lead to attraction for wide export and import. The volume of agricultural
production does not sufficient for export, moreover, insufficient even in Chin State. Therefore, Chin
State has been faced with food insecurity, then foods are imported from others regions, in order to
fulfill the gap. Furthermore, major farmers in Chin State has been exercised traditional management
in farming. The exercises leads to deforestation and encourage to nature disaster, such as landslide
precisely. Other research finding said that logging has been happened for household used, not for
commercial.9
Existing policy and development strategy of Chin State government has been formulated with long
term vision. Nevertheless, the challenges are insufficiency which are productive labor force and
infrastructure for production based economy in long term. Agriculture sector has been designed as a
top priority of policy in Chin State, it can be considered that encourage on deforestation. The reason
become from agricultural practices and management in present. Furthermore, there is no competitive
power in the markets for agricultural products. Even food security for the state, 30 percent of food
security are imported from other states and regions.10
Number of business are situated in agriculture sector, on the other hand, SMEs sector are necessary to
grow. As a scenario, regional government has no expectation that to receive the revenue from local
business sectors. Financial resources for multi-development has been relying on the union budget and
international aid.
One obvious factor that natural beauty remains to open up the state’s economy. It is potential and
supportive factor on the tourism sector. There has interesting cultural and traditional sites for tourism.
One of the attraction is richest ethnic diversity and dialects in Chin ethnic communities.
8 Conclusion
In conclusion, existing data and documents encourage narrowing down of policy formulation.
Existing data such as labor force participation, migration rate domestic and international, low level of
capital and low number of private sectors, are insufficient to conclude that agriculture and livestock
sectors are key priority for the Chin State in the short term. Current situation leads to the worsening
off condition for sustainable development, and precise, formulation of prioritized policy which are
agriculture and animal farming lead to environmental damage under the situation which are lack of
labor force, poor power to compete with other in the market, lack of agricultural techniques (more
prefer traditional practices). Author conclude that in order to see the sustainable economic growth,
tourism sector might be key policy consideration for Chin State in short term. In the long term
economic, the policy which has been formulated by the Chin State government are possible to link
with production or industrial sector. Possible framework has already been developed by author in
9 The Study of border region, Myanmar-India, Than Naing Lin & Zaw Guan, May 2015, ARC-M
10 Government of Chin State’s presentation

Inya Economic Journal 84
above section. The key idea has been considered with a concept of sustainable development,
according to the concept, stakeholders who are from three components, the natural environment,
society, and economic performance. Nowadays, the world has been demanded a new concept of order
such as a “sustainable development”. The problem has been solving economically and it is an
insecurity and instability, then that community is forced to isolate, according to “Majority rule”. Only
one economic factor has not been considering as a key solution for the ultimate development or
escape from the poverty since many development experiences happened in the world.
For the Chin State’s development, tourism sector might be entry point that to restart engine of Chin
State’s economy in short term. The benefit which will gain from the sector, encourage to equitable
wealth distribution among States and Regions in short term. Negative externalities can be silent
environmentally and socially. The revenue of Chin State government can grow dramatically, then the
regional state actors can jump to production sector or industry based economy, in order to implement
long term strategy. In the same time, government can invest financial resources into human resources
and environmental protection as well as sector-wide reform.
In the long run strategy, Chin State can be escaped from poverty and can emerge equable resource
distribution among the state.

Seeking an optimal policy path, least “negative externalities” on regional growth in Chin State 85
References
. The 2014 Myanmar Population and Housing Census (D. o. P. M. o. I. a. Population, Trans.). (2015)
Census Report Volume 3 - D. Yangon, Myanmar: Government
CSO, U. a. (2016). MYANMAR BUSINESS SURVEY 2015, Data report Yangon, Myanmar: United
Nations Development Programme Myanmar and Central Statistical Organization.
Hnin, M. T. (2017, Monday, 31 July 2017). Three-stage SME plan: Research, access to finance,
training, News. The Global New Light of Myanmar, p. Page 5. Retrieved from
www.globalnewlightofmyanmar.com
INSTITUTE, I. I. (June, 2007). INTEGRATED HOUSEHOLD LIVING CONDITIONS SURVEY
IN MYANMAR POVERTY PROFILE Yangon, Myanmar: UNDP, Ministry of National
Planning and Economic Development, UNOPS.
Myanmar, T. R. o. t. U. o. (2016). Economic Policy, Myanmar. The Republic of the Union of
Myanmar
Constitution of the Republic of the Union of Myanmar (2008) § 22 (c) (September, 2008).
MYANMAR, U. (2014). Local Governance Mapping THE STATE OF LOCAL GOVERNANCE:
TRENDS IN CHIN. Yangon, Myanmar: United Nations Development Programme.
Rogers, C. R. C. a. D. S. (2008). A Framework of sustainable supply chain management: moving
toward new theory. International Journal of Physical Distribution & Logistics Management,
38(5), 360-387.
The Republic of the Union of Myanmar, M. o. N. P. a. E. D. (January, 2015). People-Centered
Development: National Development first 5 Year Planning (From 2012-2012 to 2015-2016).
Yangon, Myanmar: The Republic of the Union of Myanmar.
UnitedNations. (2016). The Sustainable Development Goals Report. New York: United Nations.
WorldBank. (2014). Myanmar Ending Poverty and boosting shared prosperity in a time of transition A
Systematic Country Diagnostic: World Bank.

Inya Economic Journal 86
The Impact of Exchange Rate on Myanmar Trade Sector
SANN LINN AUNG
This study aim to show how does the US Dollar and Chinese Yuan currently impact on Myanmar`s
trade sector. The analysis aims to determine whether the level of exchange rates is key factors in trade
flow. This paper focus on the level of exchange rates and trade in Myanmar with the selected United State
and China during 2014 April to 2016 December.
I. Introduction
In all modern economies, money (i.e. currency) is created and controlled by a central governing
authority. Currencies are developed by individual countries, because countries buy goods and services
from other countries and sell goods and services to other countries so it will be important to think about
how currencies of one country can be exchanged for currencies of other countries.
All central banks try to defend these rates within a certain range by buying or selling their country's
currency as the situation warrants. Trade is a driver for economic prosperity of a country as well as an
engine of growth for developing and developed countries. It is also a vital element of Myanmar's
economic growth. Myanmar has opened its economy after 1988 and its trade volume has increased year
after year. Policymakers want to increase not only the trade sector but also the level of exchange rates.
This paper is organized as follows: Section (I) is Introduction. Section (II) presents the exchange rates
and Trade Theory. Section (III) presents the trends of Myanmar exchange rates and trade in relation to
United States and China and (IV) Conclusion.

The Impact of Exchange Rate on Myanmar Trade Sector 87
II. Exchange Rate and Trade: Theory and Literature Review
2.1 Theory
Exchange rate policy that is one of the powerful tools of economic regulation. The exchange rate,
the price of a unit of currency is the amount of another currency that is needed to purchase it. For
example: Myanmar kyats 1360 equal 1$ of United States. Exchange rate level has important implication
for debt servicing and foreign investment flows. The exchange rate affects firms and country`s trade
balance. The value of all goods and services sold to other countries (exports) minus the value of all goods
and services bought from foreigners (imports) is called trade balance. If the value of trade balance is
positive, exports more than imports, that's trade surplus or favorable balance of trade. If the value of trade
balance is negative, imports more than exports, that's trade deficit or adverse balance of trade.
Changes in the price of a currency are referred to as appreciation and depreciation. Appreciation
occurs when a currency becomes more valuable and depreciation occurs when a currency becomes less
valuable. Economists say that currencies appreciate and depreciate specifically relative to other
currencies. Foreign currencies are more valuable cause of depreciation so we will receive a lot of foreign
currency from selling the exported good. On the other hand, the devaluation will effect on price of export.
First, the price will be depressed due to devaluation or depreciation; and second, the price rose due to
increase in demand. So, the exported volumes will be likely increased. The devaluation or depreciation
will effect on import as more expensive in domestic currency. This will stimulate domestic consumers to
choose for domestically produced goods and control to consume foreign goods.
Let us discuss when evaluating the impact of a currency fluctuation on the balance of trade with
the J-curve and Marshall-Lerner condition. When a currency depreciates imports fall and exports
increase, the balance of trade improves. When a currency appreciates, exports fall and imports increase
and thus our balance of trade will deteriorate. This analysis ignores the impact of price elasticity of
demand for imports and exports. The Marshall-Lerner condition makes us consider those price
elasticities. The Marshall-Lerner condition is set to hold when the sum of price elasticity of demand for
imports and exports is greater than 1. It means that the change in demand for imports and exports needs to
be greater than the change in value of the currency. So, if the currency depreciates by 10% the sum price
elasticity of demand for imports and exports needs to be greater than 10% for the depreciation to improve
the balance of trade. Note that the demand for goods and service which must be quite elastic with lots of
substitutes.
Further development of the theory suggested that we should differentiate between short and long
run effects because in short run some prices and volumes and production capacities are fixed. In this
situation, J-curve assumption suggested that in the short term, a depreciation of an exchange rate may not
improve the current account deficit of the balance of payments due to the low price elasticity of demand
for exports and imports in the immediate aftermath of an exchange rate change. Providing that the
elasticities of demand for exports and imports are greater than 1 in the long term the trade balance will
improve if the Marshall-Lerner condition holds.

Inya Economic Journal 88
MLC = Marshall-Lerner condition
The net effect of these two phenomena is that greater quantities of exports at lower prices and
diminished quantities of more expensive imports depends on import and export price elasticities. If
exported goods are price elastic, their quantity demanded will increase proportionately more than the
decrease in price, and total export revenue will increase. Similarly, if goods imported are elastic, total
import expenditure will decrease. The existence of J-curve is very individual across countries (Stucka
(2003), but it is crucial to a country's policy maker. The response of trade balance to exchange rate
changes also depends on whether a fixed or floating exchange rate regime is adopted in the country
(Gomez and Alvarez-Ude 2006).
III. Trends of Myanmar exchange rate and trade in relations to United States and China
3.1 Myanmar foreign trade with China
Myanmar and China are historically friendly neighbors sharing relations diplomatic, political, security
and economic. Myanmar transformed the border trade to a normal trade zone to enhance bilateral trade
between the two countries. The trade zone is connected to China’s Ruili in Yunnan province with
Myanmar’s border town of Muse. Border trade between the two countries has been legitimized,
regularized and institutionalized since the adoption of the open-door policy by Myanmar’s government.
Bilateral trade and economic relations between China and Myanmar have continued to develop in recent
period.
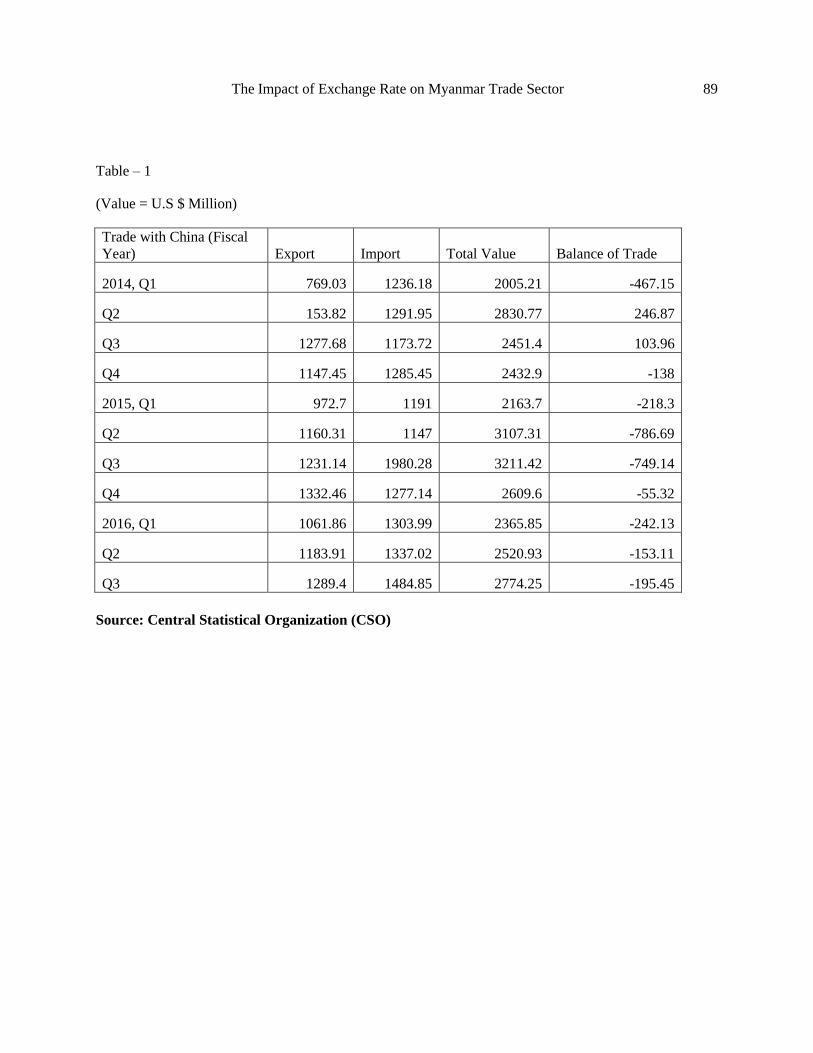
The Impact of Exchange Rate on Myanmar Trade Sector 89
Table – 1
(Value = U.S $ Million)
Trade with China (Fiscal
Year) Export Import Total Value Balance of Trade
2014, Q1 769.03 1236.18 2005.21 -467.15
Q2 153.82 1291.95 2830.77 246.87
Q3 1277.68 1173.72 2451.4 103.96
Q4 1147.45 1285.45 2432.9 -138
2015, Q1 972.7 1191 2163.7 -218.3
Q2 1160.31 1147 3107.31 -786.69
Q3 1231.14 1980.28 3211.42 -749.14
Q4 1332.46 1277.14 2609.6 -55.32
2016, Q1 1061.86 1303.99 2365.85 -242.13
Q2 1183.91 1337.02 2520.93 -153.11
Q3 1289.4 1484.85 2774.25 -195.45
Source: Central Statistical Organization (CSO)

Inya Economic Journal 90
CSO,
China has consistently ranked high among Myanmar’s trading partners than others. While Myanmar`s
exports to China increased from 769.03 US $ millions in the first quarter of 2014-2015 to 1289.24 US $
millions in the third quarter of 2016-2017, imports also increased from 1236.18 US $ millions to 1484.85.
3.2 Myanmar foreign trade with United States
The U.S government encourages investment in Myanmar as part of an overall strategy to encourage
the economic growth and improve the standard of living for people of Myanmar. The 2013 U.S.-
Myanmar Trade and Investment Framework Agreement (TIFA), created a platform for ongoing dialogue
on trade and investment issues between the two governments. Under the TIFA, the two governments
work together to identify initiatives that support Burma’s ongoing reform process and related
development activities.
-1000
-500
0
500
1000
1500
2000
2500
3000
3500
2014,Q1
Q2 Q3 Q4 2015,Q1
Q2 Q3 Q4 2016,Q1
Q2 Q3
Export
Import
Total Value
Balance of Trade

The Impact of Exchange Rate on Myanmar Trade Sector 91
Table-2
(Value = U.S $ Million)
Trade with U.S (F.Y) Export Import Total Value
Balance of
Trade
2014, Q1 15.07 34.07 49.14 -19
Q2 11 416.55 427.55 -405.55
Q3 9.29 16 25.29 -6.71
Q4 14.91 27.22 42.13 -12.31
2015, Q1 14.23 12.94 27.17 1.29
Q2 13.23 27.09 40.32 -13.86
Q3 19.49 35.37 54.86 -15.88
Q4 22.27 52.28 74.55 -30.01
2016, Q1 29.34 33 62.34 -3.66
Q2 54.28 35.03 89.31 19.25
Q3 44.42 94.15 138.57 -49.73
Source: Central Statistical Organization (CSO)
(Value = U.S $ Million)
-500
-400
-300
-200
-100
0
100
200
300
400
500
2014,Q1
Q2 Q3 Q4 2015,Q1
Q2 Q3 Q4 2016,Q1
Q2 Q3
Export
Import
Total Value
Balance of Trade

Inya Economic Journal 92
While U.S. trade with Myanmar remains small since the initial lifting of sanctions, it has grown
significantly. In 2014, Myanmar`s exports to U.S increased, to 44.42 US $ millions in the third quarter of
2016-2017.
3.3 Trends of Myanmar Exchange rate with United States and China
Table-3
Exchange rate volatility of China and U.S.A
F.Y Chinese Yuan U.S Dollar
2014, Q1 155.02 967
Q2 158.9 978
Q3 165.65 1020
Q4 164.55 1026.33
2015, Q1 176.15 1092.67
Q2 200.19 1265.33
Q3 201.95 1295.33
Q4 191.34 1249
2016, Q1 179.65 1179.33
Q2 182.46 1216.67
Q3 191.82 1357.25
Source: Central Statistical Organization (CSO)

The Impact of Exchange Rate on Myanmar Trade Sector 93
Figure -3
(Kyats)
According to figure 3, when Chinese Yuan has to few fluctuation but dollar is more fluctuation its
means people are willing to speculative motive on dollar. Cause dollar are more competition than other
currencies for the payments or reserve money or liquidity assets.
IV. Conclusion
Currently Myanmar has tries to be stable political and economic. After Myanmar joined Free
Trade Area of Asia Pacific (FTAAP), exports are less than imports so the currency of the importing
countries should be depreciated as good as for Myanmar. The currency of Myanmar also depreciated
otherwise improve the export goods are cheaper than other countries and then employments and incomes
will be increase.
But from the table ( 1, 2, 3 ) during 2014-2016 Myanmar trading with United State and China,
exports and imports are continually increasing and exchange rate are depreciated. Cause are the printing
money for the government budgets deficit so inflation will increased and the holder of US Dollar are
more accordingly imports are increased than export and The balance of trade are deficit. This depreciation
is not good for Myanmar according to M- L conditions, the goods and services must be quite elastic when
0
200
400
600
800
1000
1200
1400
1600
2014,Q1
Q2 Q3 Q4 2015,Q1
Q2 Q3 Q4 2016,Q1
Q2 Q3
Chinese Yuan
U.S Dollar

Inya Economic Journal 94
the currency depreciated. The depreciation of currency holding countries are more competing in export
than comparatively the dollar on the other hands, imports are limited. If Myanmar can’t export as China,
Myanmar currency should be appreciation.
V. References
Huchet-Bourdon, M. and J. Korinek (2011), “To What Extent Do Exchange Rates and their Volatility
Affect Trade?”, OECD Trade Policy Papers, No. 119, OECD Publishing, Paris.
Iuliia Tarasova (2009), “Exchange rate and trade: an analysis of the relationship for Ukraine”, Kyiv
School of Economics”.
Min Maung Oo (2003), “The Effect of Trade Liberalization on Myanmar Foreign Trade with Selected
Asia Countries”.

The Impact of Government Debt and Macro Variables on Economic Growth of Myanmar, Cambodia,
Laos PDR and Bangladesh 95
The Impact of Government Debt and Macro Variables on Economic
Growth of Myanmar, Cambodia, Laos PDR and Bangladesh
SAW LALBWEL HTOO
ABSTRACT
This study examines the impact of government debt and macro variables on economics growth
of Myanmar, Cambodia, Laos PDR and Bangladesh which are listed in the Least-Developed-
Countries by using ARDL. In this empirical research, dependents variable is GDP and
independent variables are government debt (GDEBT), inflation (INF), exchange rate (EX) and
current account balance (CA). The research methodology consist three steps which are Levin,
Lin & Chu, ADF unit root test and PP unit root test, ARDL approached Pooled Mean Group
estimation. The study of empirical results is significant at 1% and 5% in the short run and long
run. It is found that the government debt strongly impacts the economic growth: the results in
this research of the study which the government debt and macro variables have the effective
both positive and negative impact on economic growth during the period 2001-2015.
Keywords: Myanmar, Government Debt, Exchange Rate, Inflation, GDP and Current Account
Balance
JEL Classification: C24, C51, E31,F31, F32, H63
1. Introduction
In four least developed countries; Myanmar, Laos PDR, Cambodia and Bangladesh, the
governments have to take loans respectively from the World Bank (WB), the International
Monetary Fund (IMF), the Organization for Economic Co-operation and Development (OECD)
so as to fulfill their revenue for coming fiscal year as the governments gets deficit in some
sectors on the basic of financing; budget deficit and monetized deficit and on the basic of the
type of transaction; primary deficit, revenue deficit and effective revenue deficit.
The government debt is not a burden at all for the Least Developed Countries (LDCs).
Nevertheless, the governments can inject the loan (as capital) again to the aggregated economy
of Myanmar, Cambodia, Laos PDR and Bangladesh under the intervention programs so as to
increase the productivity of the countries. And the interest can be raised by driving the whole
economic mechanism in terms of the loan (as capital).If so, what is the problem of having the

Inya Economic Journal 96
loans from the international financial institutions such the World Bank, the International
Monetary Fund (IMF) and the Organization for Economic Co-operation and Development
(OECD), the Paris Club and so forth? The only problem for the Least Developed Countries is
that the countries cannot give back the debt to the international financial institutions. The debt
burdens become heavy, and on the other hand, the deficit in the countries’ current account
balance (% of GDP) was resulted more or less. It seems the countries cannot give back the loans
and the international financial institutions cannot offer more loans those countries under the
procurement regulations for borrowers. Hence, the government debt pull down the respective
country’s economy or it causes the stagnation in aggregated economies.
This research is to support the empirical research the Least Developed Countries (LDCs) with a
heavy burden of government debt. Since, Myanmar, Cambodia, Laos, and Bangladesh were
chosen to do a research on the impact of government debt on economic growth. Laos PDR and
Bangladesh share the borders with Myanmar except Cambodia: but it shares the region in the
ASEAN, thereby economic welfare is the most crucial for those border-sharing-countries, hence
other issues such as migrations, illegal narcotics-poppy trading in the golden triangle area, and
some criminal cases in relations to illegal migrant-workers, the internal conflicts flaring in
accordance with illegal weapon trade along the borders. Keeping the government debt stable
(one of the ways that will be mentioned in next chapters) would encourage the economic
growth. By an effort of economic growth, the issues which are caused due to being not rich
enough for living will be reduced more or less.
Myanmar
Myanmar is remained at low risk of distress of debt. The government debt indicators are below
their thresholds. In the long term, it will rise. While the risk of Myanmar debt distress is
characterized low, close monitoring is required, in particular because of potential or both
domestic and external downside risks to materialize that might affect the debt level. The
Myanmar government debt sustainability analyses are based on the DSA framework.

The Impact of Government Debt and Macro Variables on Economic Growth of Myanmar, Cambodia,
Laos PDR and Bangladesh 97
Table 1: Key Macroeconomic Assumption Underlying the DSA for the Baseline Scenario
(FY2015/16 – 2035/36)
Current DSA Previous DSA
Medium Term Long Tern Medium
Term
Long Term
2015/16–
020/21
2021/22 –
2035/36
2014/15–
019/20
2020/21 –
2034/35
Real GDP growth (%) 8.1 6.8 8.1 6.6
Inflation (%) 9.1 4.7 6.3 4.0
Overall fiscal balance (% of
GDP)
-4.5 -4.2 -4.6 -3.8
Noninterest current account
(% of GDP)
-7.3 -4.4 -4.7 -3.3
Revenue (nonfinancial public
sector, % of GDP)
21.3 23.8 24 25
Source: IMF staff estimates
Cambodia
The debt of Cambodia rating remains low with all debt burden indicators projected to remain
below the particular thresholds. The sustainability keeps being vulnerable to growth, exports,
fiscal shocks, and the materialization of contingent liabilities, and it calls to continue reforming
structure to increase the resilience of economy against external shocks, and to mobilize fiscal
revenues.

Inya Economic Journal 98
Table 2: External Public Debt of Cambodia
U.S dollar
(millions)
Share of total
External Debt
In percent of GDP
Total 5,483.5 100.0 33.1
Multilateral 1,696.8 30.9 10.3
Bilateral 3,786.6 69.1 22.9
Source: Cambodia authorities; and World Bank estimates
Laos PDR
Facing external debt distress, the risk of Lao P.D.R. remains moderate, however it is on the cusp
of a transition to high risk, with heightened vulnerabilities for public debt. Given the
considerable share of foreign currency denominated debt, large and unexpected exchange rate
depreciation could raise the debt-to-GDP and the debt service-to-revenue trajectories for
external and public debt even though revenues of large resource projects are to ease risks in the
long term. While external risk change is not necessary at this time because baselines breaking
the thresholds under both the traditional and probability approaches are minor and temporary,
the breaches suggest vulnerabilities, which should be addressed through fiscal consolidation by
strengthening public investment management capacity.
Table 3: External PPG debt indicators of Laos PDR
U.S dollar (billion) Share of total PPG
External debt (%)
In percent of GDP
Total 5.1 100 48
Multilateral 1.8 36 17
Bilateral 3.3 64 31
Commercial 0.1 3 1
Source: Laos RDR authorities; and IMF World Bank estimates

The Impact of Government Debt and Macro Variables on Economic Growth of Myanmar, Cambodia,
Laos PDR and Bangladesh 99
Bangladesh
Bangladesh is at a low risk of external public debt distress. In the absence of a permanent boost
to revenues, the public debt trajectory would become unsustainable.
As of the end of FY15, total public sector and public sector-guaranteed external nominal debt
amounted to 26 billion USD which was 13% of GDP. The World Bank and the Asian
Development Bank are the two largest creditors, with outstanding loans of US$12 and US$7
billion, respectively. The largest bilateral creditor is Japan, with outstanding loans of US$2
billion
2. Literature Review
Literature review is important to guide statement of hypotheses, determine an appropriate
methodology and to understand the measurement of variables in the analysis of this nature. In
this regard, this chapter analyses the theoretical framework underlying growth effects of public
debt as well as empirical works. An analysis of the different methodologies applied in the
econometric analysis of public debt and economic growth was also given consideration under
this chapter.
The relationship between the government debt and economic growth
In economic theory, at moderate levels of government debt, following typical Keynesian
behavior, fiscal policy may induce growth. The classical economic view argues that government
debt (manifesting deficit financing) can induce growth by stimulating aggregate demand and
output in the short run. Moderate levels of debt are found to have a positive impact on economic
growth through a range of channels: improved monetary policy, strengthened institutions,
enhanced private savings, and deepened financial intermediation. Government debt could be
used to smoothen distortionary taxation over time. Barro’s model predicts that debt responds to
the temporary deviation in income or government expenditure and hence, in the absence of
aggregate uncertainty, debt would be constant and equal to its ‘initial ‘level. Expansionary fiscal
policies that lead to debt accumulation are argued to have a positive effect on both short- and
long term growth (DeLong and Summers 2012). In a theoretical model integrating the
government budget constraint and debt financing, Adam and Bevan (2005) find increase in
Inya Economic Journal 100
growth during low debt levels as they observe interaction effects between deficits and debt
stocks, with high debt stocks exacerbating the adverse consequence of high deficits.
Historically, the theoretical literature argues that growth models amplified with governments
issuing debt to fund consumption or capital goods tend to exhibit a negative relationship
between government debt and economic growth. Modigliani (1961) argues that Government
debt is a burden for posterity, which results in waning flow of income from a reduced stock of
private capital. It is argued that government debt crowds out capital and leads to a slowdown of
output in the long run.
Both the neoclassical and endogenous growth models inform of the negative effect of
government debt on long-run growth. Government debt could have a substantial adverse
effect on economic outcomes if it affects the productivity of public expenditures. Analyzing the
impact of fiscal policy, peroxided inter alia by the level of government debt, in endogenous
growth models, Aizenman et al. (2007) find a negative relationship. While standard growth
theory advocates that an increase in government debt (due to a fiscal deficit) leads to slower
growth, the neoclassical growth theory suggests a temporary decline in growth along with the
transition path to a new steady state. However, the endogenous growth theory suggests a
permanent decline in growth as the debt increases.
Several studies report a negative non–linear correlation between government debt and economic
growth in advanced and emerging market economies. There is growing evidence that
government debt is negatively correlated with economic growth, and very few studies make a
strong case for a causal relationship going from debt to growth. (Swamy 2015)
Theoretical Literature
Conventional view of public debt based on the neoclassical setting informed theoretical
literature analysis in this study. According to the neoclassical theories, Adam & Bevan say that
the growth models are augmented with variables depicting issuance of debt to finance
government expenditure which include both consumption and capital goods (Adam & Bevan,
2005). Analysis of such models tends to depict a negative relationship between public debt and
economic growth. Besides, Cordella claims that the argument for this conclusion is well
explained using the crowding in/out and debt overhang hypotheses as some empirical studies
have done (Cordella et al, 2005). The theoretical arguments of crowding in/out and debt
overhang effects of public debts are thus discussed as follows.

The Impact of Government Debt and Macro Variables on Economic Growth of Myanmar, Cambodia,
Laos PDR and Bangladesh 101
Debt Overhang Hypothesis
The adverse effect of public debt stock on economic growth has largely been explained by debt
overhang hypothesis (Krugman 1988). Krugman, thus defines debt overhang as a situation in
which investments are reduced or postponed since the private sector anticipates that the returns
from their investment will serve to pay back creditors. Implying that, the expected future public
debt service of a country is likely to be an increasing function of the Country’s output level.
Therefore, huge accumulation of public debt stock creates uncertainty behavior among investors
on the actions and policies that the Government will adopt to meet its debt service obligations.
In this regard, Krugman (1988) contends that most potential investors will assume that
Government will finance its debt service obligations through distortionary tax measures, thus
they will adopt a wait and see attitude which will affect private investments and therefore
economic growth.
Isu also agrees empirical evidence to support the above theoretical arguments advanced by
Krugman (1988) can be found in studies undertaken by various scholar namely; (Ezeabasii, Isu
et al. 2010).
Theoretically, Rishi argues that a high level of public debt can have adverse consequences on
the macroeconomic stability, discouraging capital inflows while favoring capital flight (Cerra,
Rishi et al. 2008)
Focusing on the interaction effects of deficits and debt stocks, Adam and Bevan argue that a
high debt stock exacerbates the adverse consequences of high deficits. Using a simple
theoretical model integrating the Government budget constraint and debt financing, the study
found that an increase in productive Government expenditure, financed out of a rise in the tax
rate, will be growth-enhancing only if the level of public debt is sufficiently low(Adam and
Bevan 2005).
Methodology approach to analysis of growth with effect of government debt
Choice and application of methodology in econometric analysis relating to time series data and
the objective of the study is of particular importance. Notable estimation techniques employed
in the analysis of growth effects of debt include, the Ordinary Least Squares (OLS),
Instrumental Variables & Generalized Methods of Moments and the Vector Auto-Regressive
(VAR) framework. The methodologies cited here have their own weaknesses and strength when
it comes to choosing the appropriate model especially for studies like this one. An in-depth

Inya Economic Journal 102
understanding of the estimation technique to guide this research was therefore important. The
discussion of the above cited estimation techniques are presented below.
Autoregressive Distributed Lags (ARDL) Model
ARDL cointegration technique does not require pretests for unit roots unlike other techniques.
Consequently, ARDL cointegration technique is preferable when dealing with variables that are
integrated of different order, I(0), I(1) or combination of the both and, robust when there is a
single long run relationship between the underlying variables in a small sample size. The long
run relationship of the underlying variables is detected through the F-statistic (Wald test). In this
approach, long run relationship of the series is said to be established when the F-statistic
exceeds the critical value band. The major advantage of this approach lies in its identification of
the cointegrating vectors where there are multiple cointegrating vectors. However, this
technique will crash in the presence of integrated stochastic trend of I(2). To forestall effort in
futility, it may be advisable to test for unit roots, though not as a necessary condition. Based on
forecast and policy stance, there is need to explore the necessary conditions that give rise to
ARDL cointegration technique in order to avoid its wrongful application, estimation, and
interpretation. If the conditions are not followed, it may lead to model misspecification and
inconsistent and unrealistic estimates with its implication on forecast and policy.
("Autoregressive Distributed Lag (ARDL) Cointegration Technique: Application And
Interpretation")
2. Methodology
Research Design
The methodology of the paper mainly relies on ARDL approach to co-integration. These
processes are used to study the relationship between macroeconomic performances including
foreign direct investment (FDI), GDP per capita (GDPPC), Export (EXP) and labor force (LF)
in both short-run and long run. The time series econometrics methods namely Augmented
Dickey Fuller (ADF) unit root test, Philips-Perron (PP) unit root test, Autoregressive
Distributive Lag (ARDL) test, F-test, Error Correction Model (ECM) tests and diagnostics tests
are adopted in this research study to know whether there exist the short run and long run

The Impact of Government Debt and Macro Variables on Economic Growth of Myanmar, Cambodia,
Laos PDR and Bangladesh 103
relationship of macroeconomics performances. The combination of unit root test using ADF
test, PP test and ARDL approach to co-integration was introduced to test the hypothesized
relationships covering data for the 15 years from 2001 to 2015 in Myanmar, Cambodia, Laos
PDR and Bangladesh.
The stationary test was carried out under ADF and PP test to check whether the variables that
used in this research are stationary or not. The output results indicate the order of stationary at I
(0) and I (1). Autoregressive Distributive Lag (ARDL) is a suitable approach for the mixed
order united root test to do the research that has small samples and testing long-run and short-
run relationships. ARDL takes in the form as follows:
∑ ∑
The ARDL approach model will also provide an alternative test for examining the significance
of the impact of macro forces composition including gross domestic product (GDP), current
account balance (CA), exchange rate (EX) and inflation (INF) in Myanmar, Cambodia, Laos
PDR and Bangladesh.
The result is taken to be figure out an appropriate estimator. The data is estimated under the
Pooled Mean Group Estimator, the Mean Group Estimator, and the Hausman Test.
Pooled Mean Group Estimator
Pooled mean group (PMG) is an estimation method based on both pooling and averaging and
estimates the long-run and short-run correlation with one equation. The estimator allows error
variances, intercepts and short-run coefficients to differ freely across countries while long-run
coefficients remained constant across groups.
The main feature is that the responsiveness of cointegrated variables can have any deviation
from long-rum equilibrium. Therefore, this deviation from equilibrium influenced on short-run
dynamics of variables and thus error correction model needs to apply.
( ) ∑
∑

Inya Economic Journal 104
Mean Group Estimator
The estimation gives the averaged estimates of parameters but this does not considered that
certain parameters can be in same group. MG estimator allows that intercepts, error variances
and slope of coefficient vary across countries. The method discussed by (Pesaran and Smith
1995) mentioned that panel data has small (T) and large (N). Estimation of long run parameter’s
coefficient can be written as:
∑
Hausman Test
Hausman test is used to determine the best estimation to choose among PMG and MG. The test
statistic is described by 2.
( ) ( )
( ) which is generalized inverse
is the variance of coefficient
H0: Accept PMG if p value of 2> 0.05
HA: Reject MG if p value of 2< 0.05
3. Empirical Result
Levin, Lin & Chu test, Augmented Dicker-Fuller test and Phillip-Peron Unit Root Test
The standard unit root test namely Levin, Lin and Chu test, Augmented Dicky-Fuller (ADF) test
and Phillip-Perron test were applied to determine the degree of stationary of the variables used
in the model. The test was conducted with intercept and trend specification. Table 4 shows the
computed results of time series data namely gross domestic product (GDP), current account
balance (AC), exchange rate (EX), inflation (INF) and government debt (GDEBT)
Table 4: United Root Test result
Levin, Lin & Chu ADF test
PP test
Level 1st
difference
Level 1st
difference
Level 1st
difference
GDP
-1.95769
( 0.0251)*
-2.70243
(0.0034)*
13.6881
( 0.0903)
18.5220
( 0.0176)*
7.83603
(7.83603)
34.8768
(0.0000)

The Impact of Government Debt and Macro Variables on Economic Growth of Myanmar, Cambodia,
Laos PDR and Bangladesh 105
CA -1.18458
( 0.1181)*
-6.85070
(0.0000)*
9.07866
( 0.3357)*
35.3933
(0.0000)*
11.6452
( 0.1677)*
53.3619
( 0.0000)*
GDEBT -3.82020
( 0.0001)*
17.9897
(0.0213)*
29.8802
(0.0002)*
INF -6.12964
(0.0000)*
23.7859
(0.0025)*
22.7853
(0.0037)*
EX -1.45417
( 0.0729) -3.27436
(0.0005)*
9.88156
( 0.2734)* 18.8136
( 0.0159)*
12.2501
( 0.1404)*
26.2544
( 0.0010)*
*the value of probability
Source: Author
The probability of t-statistics is significant at level of 1% and 5%. By the result of the unit root
test the data of GDP, CA, and EX are stationary at the 1st different level by individual intercept
under Levin, Lin and Chu test which probability value are 0.0034 (GDP), 0.0000 (CA) and
0.0005 (EX), ADF test which probability value are 0.0176 (GDP), 0.0000 (CA) and 0.0159
(EX) and PP test which probability value are 0.000 (GDP), 0.0000 (CA) and 0.0010 (EX).
Nevertheless, GDEBT and INF are stationary at the level under the same unit root test which
probability values under the Levin, Lin and Chu test are 0.0001 (GDEBT) and 0.0000 (INF),
under ADF test are 0.0213 (GDEBT) and 0.0025 (INF) and under PP test are 0.0002 (GDEBT)
and 0.0037 (INF). Hence, the macro variables are stationary at mixed order. The result of unit
root test is approached to the panel ARDL approached Pooled Mean Group and Dynamic
Effect.
Pooled Mean Group Estimator
Pooled Mean Group Estimator is the most appropriated for ARDL method. The results for long
term and short term are exhibited.
Fig 5: Pooled Mean Group Estimator result for Long term cointegration under ARDL method
Panel Variable (i): Countrynum Number of obs = 56
Time Variable (t): Yr Number of groups = 4
Obs per group: min = 14
avg = 14.0
max = 14
Log Likelihood = -43.66701
GDP Coef Std.Err z P>|z| 95% Conf. Interval
Inf -.504418 .1102066 -4.58 0.000 -.7204189 -.288417

Inya Economic Journal 106
EX -.0038629 0012299 -3.14 0.002 -.0062735 -.0014523
CA -.0903682 .0650113 -1.39 0.165 -.2177879 .0370515
Gdebt .3914882 .0857212 4.57 0.000 .2234777 .5594988
Source: Author’s calculation
For the inflation, there is significantly correlation between GDP and INF; means the up and
down of inflation will impact the economic growth definitely owing to the significant
probability value 0.0000. If the exchange rate increases, the economic growth in measure of
GDP will increase. The correlation between GDP and exchange rate is proved by the value of
probability value 0.002. The main research of government debt is highly impact the economic
growth. Current account balance has positive relationship with economic growth, but the CA
slightly correlates to GDP. All are taken under the 5% probability value acceptance in long
term.
Fig 6: Pooled Mean Group Estimator result for short term cointegration under ARDL method
GDP Coef Std.Err z P>|z| 95% Conf. Interval
Inf .0477705 .0594873 0.80 0.422 -.0688225 .1643636
EX .0331335 .0351964 0.94 0.347 -.0358502 .1021172
CA .1021172 .1869537 -1.15 0.251 -.5812057 .1516395
Gdebt -.2225947 .2054185 -1.08 0.279 -.6252076 .1800183
Source: Author’s calculation
Owing to the result, the probability value of inflation, exchange rate, government debt and
current account balance is over the 10% probability acceptance with the values; 0.422, 0.347,
0.251, 0.279 respectively. So there is no correlation between inflation, exchange rate,
government debt and GDP in short term.

The Impact of Government Debt and Macro Variables on Economic Growth of Myanmar, Cambodia,
Laos PDR and Bangladesh 107
4. Conclusion
According to empirical analysis, in the lest development countries in sample of Myanmar,
Cambodia, Laos PDR and Bangladesh, government debt, inflation, exchange rate, and current
account balance have positive relationship with GDP: the impact of government debt and macro
variables on economic growth is too serious in long run. Almost every lest-development-
countries take loans from international financial institutions. That is not a barrier for economic
growth, nevertheless the LDCs could not keep the money assets in the market after taking loans
which causes the inflation. That situation leads to money depreciation. In a years after the year
taking loans, the government debt become burden gradually. So that, the contribution suggests
that the respective governments of LDCs should be good at debt management.
5. Reference
Abbas, S. A. and J. E. Christensen (2010). "The role of domestic debt markets in economic
growth: An empirical investigation for low-income countries and emerging markets."
IMF Staff Papers 57(1): 209-255.
Adam, C. S. and D. L. Bevan (2005). "Fiscal deficits and growth in developing countries."
Journal of Public Economics 89(4): 571-597.
Alesina, A. and D. Rodrik (1991). Distributive politics and economic growth, National bureau
of economic research.
Cerra, V., et al. (2008). "Robbing the riches: capital flight, institutions and debt." The Journal of
Development Studies 44(8): 1190-1213.
Dornbusch, R. (1984). External debt, budget deficits and disequilibrium exchange rates,
National bureau of Economic Research Cambridge, Mass., USA.
El-Mahdy, A. M. and N. M. Torayeh (2009). "Debt sustainability and economic growth in
Egypt." International journal of Applied Econometrics and quantitative studies 6(1): 21-
55.
Ezeabasii, N., et al. (2010). "Nigeria’s External Debt and Economic Growth."
Fontinelle, Amy. "Current Account Deficit". Investopedia. N.p., 2017. Web. 6 Feb. 2017.
"Autoregressive Distributed Lag (ARDL) Cointegration Technique: Application And
Interpretation". Webcache.googleusercontent.com. N.p., 2017. Web. 9 Feb. 2017.
Giannitsarou, C. and A. Scott (2008). Inflation implications of rising government debt. NBER
International Seminar on Macroeconomics 2006, University of Chicago Press.
Gujarati, D. N. (1995). "Basic econometrics, 3rd." International Edition.

Inya Economic Journal 108
Gross Domestic Product - GDP. (2017). Investopedia. Retrieved 16 January 2017, from
http://www.investopedia.com/terms/g/gdp.asp?ad=dirN&qo=serpSearchTopBox&qsrc=1
&o=40186
Im, K. S., et al. (2003). "Testing for unit roots in heterogeneous panels." Journal of
econometrics 115(1): 53-74.
Inflation. (2017). Investopedia. Retrieved 16 January 2017, from
http://www.investopedia.com/terms/i/inflation.asp?ad=dirN&qo=serpSearchTopBox&qsr
c=1&o=40186
"Interest Rates And Economic Growth: Are They Related? Barry P. Bosworth Abstract Each
Year The Board Of Trustees Of The Old-Age,". Webcache.googleusercontent.com. N.p.,
2017. Web. 9 Feb. 2017.
Karagol, E. (2002). "The causality analysis of external debt service and GNP: The case of
Turkey." Central Bank Review 1(2): 39-64.
Krugman, P. (1988). "Financing vs. forgiving a debt overhang." Journal of development
Economics 29(3): 253-268.
Levin, A., et al. (2002). "Unit root tests in panel data: asymptotic and finite-sample properties."
Journal of econometrics 108(1): 1-24.
Maddala, G. S. and S. Wu (1999). "A comparative study of unit root tests with panel data and a
new simple test." Oxford Bulletin of Economics and statistics 61(S1): 631-652.
Pattillo, C. A., et al. (2002). External debt and growth, International Monetary Fund.
Pesaran, M. H. and R. Smith (1995). "Estimating long-run relationships from dynamic
heterogeneous panels." Journal of econometrics 68(1): 79-113.
Ranis, G. and J. C. Fei (1961). "A theory of economic development." The american economic
review: 533-565.
Reinhart, C. M. and K. S. Rogoff (2010). "Growth in a time of debt (digest summary)."
American Economic Review 100(2): 573-578.
Sena, A. M. and R. E. S. Fontenele "The New Endogenous Growth Theory: An Investigation on
Growth Policy for Developing Countries."
Solow, R. M. (1956). "A contribution to the theory of economic growth." The quarterly journal
of economics: 65-94.
Swamy, V. (2015). "Government Debt and Economic Growth–Decomposing the Cause and
Effect Relationship." Browser Download This Paper.
Staff, I. (2017). Current Account. Investopedia. Retrieved 16 January 2017, from
http://www.investopedia.com/terms/c/currentaccount.asp?ad=dirN&qo=investopediaSite
Search&qsrc=0&o=40186

Do Inflation And Its Volatility Impact On Economic Growth Rate In Myanmar? 109
Do Inflation And Its Volatility Impact On Economic Growth Rate In
Myanmar?
SI THU KYAW
ABSTRACT
The aim of this paper is to examine the volatility of inflation and impacts of inflation on
economic growth of Myanmar using the yearly data over the period of 1980 to 2014. Inflation
volatility is estimated by developing ARMA (2, 2)-GARCH (1, 1) model which is the fitted
model for forecasting inflation volatility according to AIC and SIC values and Engle and
Granger co-integration is used to estimate the long run relationship between inflation, inflation
volatility, higher and lower inflation and economic growth rate. Finally, the empirical results
examine that inflation volatility is forecasted by ARMA (2, 2)-GARCH (1, 1) model and there
is inflation volatility in Myanmar economy. The inflation volatility positively influences on
economic growth rate. The results suggest that inflation volatility and economic growth rate
have long run relationship and co-integration.
Keywords: Economic growth, ARMA, GARCH, Inflation, Co-integration, Forecasting
JEL Classification: E310, E370, C220
1. Introduction
Inflation has become one of the key problems in the developing countries since the early
twenty first century so both policymakers and academicians have been studying this issue. Most
of the developing countries have been attempting to achieve sustainable economic growth in
order to enhance the welfare and its citizenry. Therefore, they consider that there is the
relationship between inflation, inflation volatility and economic growth. As Myanmar is the
developing country, Myanmar government in 1962 has been attempting to enhance economic
growth but there were mismanagements of economic agents when socialist economy was
practiced.
From 1960 to 1988, Myanmar adopted ‘the Burmese Way to Socialism’; a variation of central
planning economic system so economy was isolated from international economy. After more
than two decade, since 1988, market oriented system have been introduced to economy. In the
1989-90, the rice price had raised because the liberalization of domestic rice market and these
result lead to dynamic inflation (Fujita and Okamoto 2006). From this period, the inflation has

Inya Economic journal 110
been a core circumstance for the economy and a critical cause of the existing economic
problems. The long-lasting high inflation and fiscal deficit because of monetization of fiscal
deficit have been deep-rooted problems in Myanmar. In early 2000’s monetization of fiscal
deficit as a percentage of GDP averaged four percent.
As Burma economic review (2005-2006) written by Sein Htay, the actual CPI inflation data is
higher than the official released by SPCD consumer price index which is centered on unreliable
lower income basket of goods selected in 1985/86 and do not include imported goods and gives
a very low weighting to staple, containing rice, oil, meat, etc…. Budget deficit was the main
source of inflation and other factors leading to inflationary process were over-bidding of
agriculture sector export, over building of certain infrastructure facilities, depreciation of kyat.
In Myanmar, Kyat is the national currency. The inflation in the 1990s averaged around 25% per
year. Between 1990 and 1997, Myanmar inflation rate was running with the annual percentage
of 15 and 30. However, there was 51% in 1998 and reduced in 1999 to 18.4%. The highest rate
of inflation was 58% in 2002 and the lowest inflation rate was -0.11 in 2000. After 2002, it
reduced almost the half of its inflation to 36.7% in 2003. Then inflation rate was slowly
increasing to 2007. The average inflation between 2005 and 2007 was about 30.01% and
inflation in 2008 was 26.8%. Excess supply of money of money is the main problem for high
inflation in Myanmar. Therefore, the annual inflation rate in Myanmar was over 25 percent in
2007-2008. (See in figure 1)
Sources: World Bank data
Figure 0-1: Annual Inflation Rate in Myanmar (1990-2014)
According to World Bank Report on Myanmar, ending poverty and boosting shared prosperity
in a time of transaction (2014) inflation declined significantly in 2013/14 from 22.5% in
2008/09 to 5.7% due to government policy improved which is keeping fiscal deficit below 5%
of GDP. In addition, an important policy moves in the financing of the fiscal deficit from
dependence on the printing money to better use of treasury bonds. The exchange rate
management has also developed significantly next the floating exchange rate on April 1, 2012.
Myint, U. (2012) pointed out that high money supply (M2) growth to finance budget deficits is
believed to be the main cause of inflationary pressures in Myanmar. According to official
statistics, the rate of M2 growth averaged 28% over the period of 2000 to 2008 in table 3. There
were four others inflationary pressure in Myanmar since 2004. These included rising of official
gasoline and diesel prices by 700% in October 2005, shift of capital to Nay Pyi Taw in

Do Inflation And Its Volatility Impact On Economic Growth Rate In Myanmar? 111
November 2005, upward adjustment of public employees by 500% for low level employees and
over 1,200% for top official beginning in April 2006 and Cyclone Nargis in May 2008.
Table 0-1: Impact of money supply on Inflation of Myanmar
2000 2001 2002 2003 2004 2005 2006 2007 2008
Money supply rate
47.4 43.2 18.4 11 32.4 26 27.2 30 21.2
Inflation rate
-1.6 34.6 58 26.8 12 9 26.3 26.1 33.3
Notes: M2 “broad money” consists of currency, current and saving accounts and time deposits.
Economies have been listed in ascending order of average rate of money supply growth for the
period 2000–2008.
Sources: ESCAP, Economic and Social Survey of Asia and the Pacific 2006 and 2009 (New
York: United Nations, On-line Edition); Ministry of National Planning and Economic
Development, Yangon and Nay Pyi Taw.
As most developing countries, Budget deficit is the main cause of inflation in Myanmar. The
state expenditure is far exceeding the increases taxation revenue so the state finances it is
spending by making printing money. The result of signor-age is the fact of inflation in
Myanmar. Therefore, the study aims to examine the inflation volatility of Myanmar and its
impact on economic growth.
2. Literature review
Empirical literature explained about the relationship between inflation and inflation uncertainty
and mixed results are reported. Brunner and Hess (1993) and Grier and Perry (1998) used the
ARCH and GARCH models technique for G 7 countries and the evidence supported the
Friedman and Ball hypothesis. However, the study found a weakness of Cukierman and Meltzer
hypothesis.
Kontonokas, A. (2004) studied inflation and inflation uncertainty in United Kingdom using the
estimated conditional volatility from symmetric, asymmetric, and component GARCH-M
models and the positive relation between inflation and inflation uncertainty providing Friedman-
Ball hypothesis. The study used monthly and quarterly data from 1972 to 2002 to estimate
inflation. In unit root testing, PP and ADF teat the data are stationary at all levels. It speared two
periods before and after inflation targeting (IT). With monthly and quarterly data Chow F-
statistic for breakpoint in October 1992 1% level significant for monthly and failed to identify
with quarterly data. That is the result mean Autoregressive model is unsatisfied with no dummy.
After taking dummy variables two main advantages found that first, improve fit and a decade of
IT period in UK had negative effect, applied Wald test-statistic. Using Autoregressive model
(AR) it rejected null hypothesis that mean there is no homoscedasticity. According to GARCH-
M model there is strong positive link between current inflation volatility and past inflation. In
GARCH (1, 1) model, one period lag of inflation coefficient is positive and statistically
significant and agreed to Friedman-Ball. With quarterly data threshold GARCH model
examined the asymmetric effect is negative that is good news on inflation. GARCH (1, 1)-M
and TGARCH (1, 1)-M model explained inflation uncertainty was lower during the IT period.
Moradi, M. A. (2006) investigated the Iran inflation by using ARCH and GARCH models to
examine bi-directional causality between inflation uncertainty and inflation. In the study
threshold GARCH (TGARCH) and component GARCH (CGARCH) models was applied to
analysis the effect of inflation. It speared two periods 1959:03 to 1972:07 and 1972:08 to

Inya Economic journal 112
2008:02. In the first period, inflation situation have been lower and the second period of
inflationary regime have volatile. This is the sign of heteroskedastic. Therefore, GARCH
modeling method was applied to study. The Engle test in AR (60) model for whole period and
AR (24) model for first period explained there had ARCH effect over the whole period and
however the first period test only could not find ARCH effect. GARCH (1, 1) model result
explained there were positive relationship inflation and its variability, which means inflation,
raised inflation uncertainty. In the TGARCH model, the existence of negative sing on
asymmetric parameter is good news and positive is bad news. In both the period, the results
confirmed there was the presence of long memory in the conditional variance. Thornton (2007)
employed in 12 emerging markets’ the relationship between inflation and inflation uncertainty
by using a standard GARCH(q,v) model and the results were strongly support to Friedman
hypothesis in all countries economy. Using the two-step methodology, Karahan, O (2012)
studied that the first test, a conditional variance in an ARMA-GARCH model, estimated
inflation uncertainty and Granger causality test was applied in second covered the period from
2002M1 to 2011M1. The results provided Friedman-Ball hypothesis.
Oten-Abayie, E. f., & Doe, S .K. (2013) paper supported Cukierman and Meltzer hypothesis
which inflation uncertainty raises inflation using two approaches, GARCH-in-Mean and two-
step Granger causality. Used monthly inflation data, Barimah, A and Amuakwa-Mensah,
F studied Ghana economy inflation by using AR (3)-GARCH (1, 2)-M model and Granger
causality test over the period of 1964:04-2012:12. First, the study found that inflation
significantly raises inflation uncertainty as predicted by Friedman hypothesis. In the long- run,
the result provided Cukierman and Meltzer hypothesis.
Sharaf, M. F. (2015) studied the title of inflation and inflation uncertainty revisited: evidence
from Egypt using various version of the GARCH-M model. In the study Granger-causality and
asymmetric GARDH-M, EGARCH-M and TGARCH-M models informed a positively and
statistically significant, two-way link between inflation uncertainty and inflation, confirming the
Friedmand-Ball and Chuierman-Meltzer hypothesis. Fountas (2000), Crawford (1996), Samimi
and Motmeni (2009), Farshid and Mojtaba (2010) and Heidari and Bashiri (2010) found that the
period of higher inflation lead to higher inflation uncertainty in the various countries confirming
the theoretical predictions made by Friedman.
Popkarn Arwatchanankarn (2015) studied inflation and inflation volatility in Thailand using
GARCH model technique that the test supported Friedman-Ball hypothesis that the inflation
raises inflation volatility in Thailand. It suggested that a rise in inflation volatile lead to be lower
the inflation as anticipated by Holland. In this study autoregressive model AR (p) was not
satisfied there is homoscedastic and rejects null-hypothesis. The results of GARCH (1, 1),
TGARCH (1, 1) and EGARCH (1, 1) models informed to support Friedman-Ball hypothesis.
The standardized residuals and correlogram shows there is no serial correlation. The null
hypothesis of no Granger-cause inflation is rejected and in TGARCH (1, 1) and EGARCH (1,
1). Then, it-supported Holland’s stabilization hypothesis the higher rate of inflation raises the
inflation volatility. Granger test for inflation volatility and economic growth informed inflation
volatility is to lower economic growth on the period from 1994q1 to 2013q4.
3. Methodology
This paper used ARMA(p,q)-GARCH(m,r) model to forecast the inflation and Engle and
Granger co-integration model applied to test the impacts of inflation, inflation volatility and
high and low inflation on gross domestic product growth rate.

Do Inflation And Its Volatility Impact On Economic Growth Rate In Myanmar? 113
3.1 Autoregressive Moving Average model
The forecasting method of Autoregressive Moving Average model or ARMA (p, q) model has
been the method that forecast the stationary time series. The ARMA (p, q) model can be written
as equation (1) in the form as follow:
(1)
Where, = the time series needed to be model
= constant
p = the number of autoregressive orders
q= the number of moving average orders
= autoregressive coefficient
Moving average coefficient
= the error term
3.2 The GARCH (m, r) model of inflation
The mean inflation equation is developed to incorporate the existence of the time varying in the
residuals to build a measure of inflation uncertainty using ARMA-GARCH model in the
following equations:
(2)
(3)
In the above equation, the rate of inflation measured by Consumer Price Index percentage
changing (CPI) and a random error term is Autoregressive process with p-th order represents
inflation. is moving average term in equation (2), mean equation. The variance
equation (3), the time varying conditional variance of inflation, is dependent upon the ARCH
term that is the distributed lag of square residuals derived from mean equation, GARCH term
distributed lag of forested variance of past periods and the inflation rate.
3.3 Engle and Granger co-integration model
The Engle and Granger co-integration test will be used to estimate any link the rate of inflation,
inflation volatility and GDP growth. To apply the model, it will regress following equations (4)
and (5).

Inya Economic journal 114
Where, = dependent variable
= constant term
= the coefficients and co-integrating parameter
= independent variables
= error term
Then, it will estimate the equation and obtain residuals, . Besides, ADF unit root test will be
tested to the residual. The null hypothesis is the residual have unit root and alternative
hypothesis is residual is no unit root. The desired model is to reject the null hypothesis and it
will be stationary. Although Y and X are individually (I1) it will be interesting situation they
own stochastic term and their linear combination is at (I0). Then the linear combination cancels
out the stochastic term in two series.
To test the co-integration the equation there will be simple method of ADF unit root test on
residual estimated from the co-integration regression. If the residual is stationary Y and X
variables are co-integrated and have long run relationship or equilibrium relationship between
them. There is also long run model of equation (4). Testing the t-test, the coefficient of value
explains the relationship between Y and X.
4. Data
The data used in the research was collected from International Financial Statistics, International
Monetary Fund and World Bank. The study used yearly inflation and gross domestic product
rate time series data. The high and low dummy inflation data is determined as 10 percent and its
above is high and inflation volatility is created by the fitted model. Before the model
forecasting and estimation the unit root test was applied to the time series data.
Table 1: Unit root test results
Variables ADF test PP Test
level First difference level First difference
GDP -1.3098 -2.9945** -2.1763 -7.7430***
INF -4.083*** - -3.1660** -
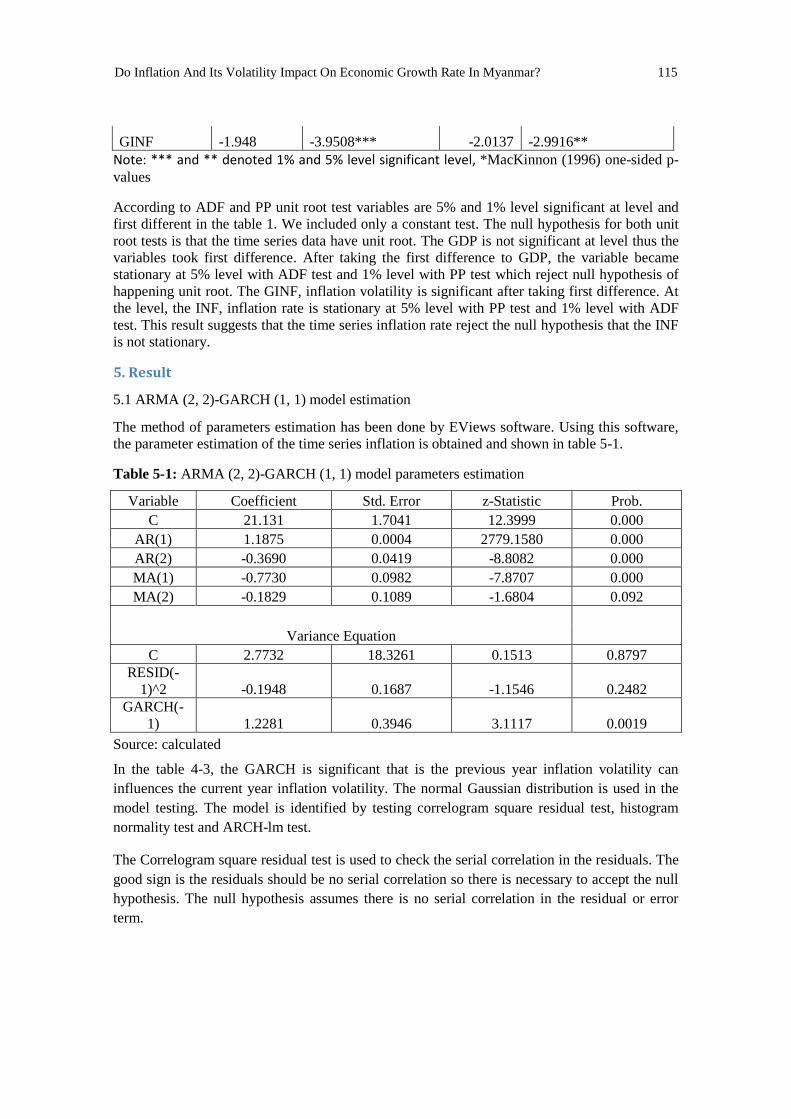
Do Inflation And Its Volatility Impact On Economic Growth Rate In Myanmar? 115
GINF -1.948 -3.9508*** -2.0137 -2.9916**
Note: *** and ** denoted 1% and 5% level significant level, *MacKinnon (1996) one-sided p-
values
According to ADF and PP unit root test variables are 5% and 1% level significant at level and
first different in the table 1. We included only a constant test. The null hypothesis for both unit
root tests is that the time series data have unit root. The GDP is not significant at level thus the
variables took first difference. After taking the first difference to GDP, the variable became
stationary at 5% level with ADF test and 1% level with PP test which reject null hypothesis of
happening unit root. The GINF, inflation volatility is significant after taking first difference. At
the level, the INF, inflation rate is stationary at 5% level with PP test and 1% level with ADF
test. This result suggests that the time series inflation rate reject the null hypothesis that the INF
is not stationary.
5. Result
5.1 ARMA (2, 2)-GARCH (1, 1) model estimation
The method of parameters estimation has been done by EViews software. Using this software,
the parameter estimation of the time series inflation is obtained and shown in table 5-1.
Table 5-1: ARMA (2, 2)-GARCH (1, 1) model parameters estimation
Variable Coefficient Std. Error z-Statistic Prob.
C 21.131 1.7041 12.3999 0.000
AR(1) 1.1875 0.0004 2779.1580 0.000
AR(2) -0.3690 0.0419 -8.8082 0.000
MA(1) -0.7730 0.0982 -7.8707 0.000
MA(2) -0.1829 0.1089 -1.6804 0.092
Variance Equation
C 2.7732 18.3261 0.1513 0.8797
RESID(-
1)^2 -0.1948 0.1687 -1.1546 0.2482
GARCH(-
1) 1.2281 0.3946 3.1117 0.0019
Source: calculated
In the table 4-3, the GARCH is significant that is the previous year inflation volatility can
influences the current year inflation volatility. The normal Gaussian distribution is used in the
model testing. The model is identified by testing correlogram square residual test, histogram
normality test and ARCH-lm test.
The Correlogram square residual test is used to check the serial correlation in the residuals. The
good sign is the residuals should be no serial correlation so there is necessary to accept the null
hypothesis. The null hypothesis assumes there is no serial correlation in the residual or error
term.
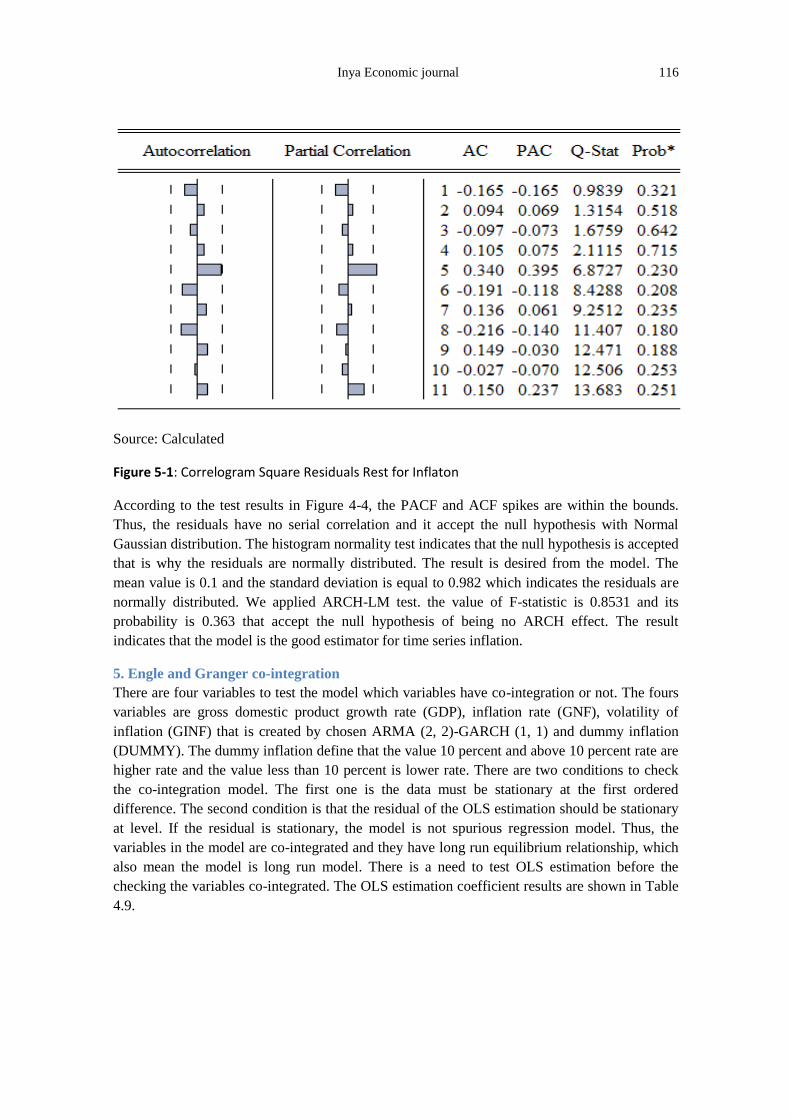
Inya Economic journal 116
Source: Calculated
Figure 5-1: Correlogram Square Residuals Rest for Inflaton
According to the test results in Figure 4-4, the PACF and ACF spikes are within the bounds.
Thus, the residuals have no serial correlation and it accept the null hypothesis with Normal
Gaussian distribution. The histogram normality test indicates that the null hypothesis is accepted
that is why the residuals are normally distributed. The result is desired from the model. The
mean value is 0.1 and the standard deviation is equal to 0.982 which indicates the residuals are
normally distributed. We applied ARCH-LM test. the value of F-statistic is 0.8531 and its
probability is 0.363 that accept the null hypothesis of being no ARCH effect. The result
indicates that the model is the good estimator for time series inflation.
5. Engle and Granger co-integration
There are four variables to test the model which variables have co-integration or not. The fours
variables are gross domestic product growth rate (GDP), inflation rate (GNF), volatility of
inflation (GINF) that is created by chosen ARMA (2, 2)-GARCH (1, 1) and dummy inflation
(DUMMY). The dummy inflation define that the value 10 percent and above 10 percent rate are
higher rate and the value less than 10 percent is lower rate. There are two conditions to check
the co-integration model. The first one is the data must be stationary at the first ordered
difference. The second condition is that the residual of the OLS estimation should be stationary
at level. If the residual is stationary, the model is not spurious regression model. Thus, the
variables in the model are co-integrated and they have long run equilibrium relationship, which
also mean the model is long run model. There is a need to test OLS estimation before the
checking the variables co-integrated. The OLS estimation coefficient results are shown in Table
4.9.

Do Inflation And Its Volatility Impact On Economic Growth Rate In Myanmar? 117
Table5-2: The result of OLS estimation for Co-integration
Variable Coefficient Probability
C 5.1291 0.0127
INF 0.0610 0.6104
GINF 0.0267 0.0998
DUMMY -4.5575 0.1688
Sources: calculated
According to Engle and Granger co-integration test, the R square value 0.134364 is less than the
Durbin-Watson statistics 0.80767so that it is not spurious regression. Therefore, the condition is
acceptable the model. In the OLS estimation, the inflation volatility, GINF is significant and the
probability of GINF0.0998. The coefficient of GINF is -0.0267 that the inflation volatility and
real gross domestic product have positively relation in the model. The others two variables, INF
and DUMMY are not significant but DUMMY have negative impact on GDP and INF
positively effects to GDP. The residuals unit root test checked by ADF unit root testing show
that the residuals have no unit root. Therefore, the significant variable GINF and GDP have long
run equilibrium relationship and they have co-integration in the model. According to the result,
the inflation volatility positively influences to DGP growth rate. This research support to Dotsey
and Sarte (2000) argue that inflation volatility can lead to increase economic growth.
Table 5-3: Residuals unit root for co-integration
ADF test
Critical values
T-statistics Probability Significant At 1%, 5% and 10% levels
Constant
-3.6537
-2.7565 0.0759 Stationary -2.9571
-2.6174
Source: calculated
In the table 5-3, the residuals unit root test checked by ADF unit root testing show that the
residuals have no unit root. Therefore, the significant variable GINF and GDP have long run
equilibrium relationship and they have co-integration in the model. According to the result, the
inflation volatility positively influences to DGP growth rate. This research support to Dotsey
and Sarte (2000) argue that inflation volatility can lead to increase economic growth.
6. Concluding Remarks
This paper was started to find a suitable ARMA and ARIMA-GARCH models for forecasting
inflation rate. ARMA-GARCH model is a very popular method for forecasting. According to
theoretical distribution of autocorrelation, the various methods have made to select the
appropriate model. This study applies four difference stages, which are model identification,
model estimation, diagnostic checking and forecasting. In the present study, ARIMA (2, 2)-
GARCH (1, 1) model is selected to forecast the inflation. After selecting the model to forecast
the inflation data the final step have create new variable that is made by fitted model to check
the co-integration with GDP growth rate. The new variable is the inflation volatility developed

Inya Economic journal 118
by the ARIMA (2, 2)-GARCH (1, 1) model. Then, the co-integration test explain that the
inflation volatility positively influence to GDP growth.
In this research, the study finds the fitted model forecast the inflation of Myanmar and
investigates the impacts of inflation volatility on the economic growth. The fitted model
explains the inflation is high volatile and fluctuation inflation that Myanmar needs to consider
this high volatile and fluctuation rate of inflation in Myanmar. The independency of CBM is
important to implement the monetary policy because of stabilization of inflation and its ability
is needed to rebuild under the four independencies that are functional independence, personal
independence, financial independence and prudential independence.
The next suggestion is that the inflation volatility positively affects to GDP growth rate.
Therefore, Myanmar needs to consider the impact of inflation volatility on economic growth
rate when they implement the policy for achievement of targeted growth rate. Myanmar needs
the believable statistical data to calculate the economic growth rate to protect the impact of
inflation.

Do Inflation And Its Volatility Impact On Economic Growth Rate In Myanmar? 119
REFERENCES
Asghar, A., Ahmad, K., Ullah, S., Bedi-uz-Zaman, B., & Rashid, M. T. (2011). The
relationship between inflation and inflation uncertainty: A case study for Saarc
Region countries. International Research Journal of Finance and Economics, 66, 85-
98.
Arwatchanakarn, P., & Hossain, A. A.(2015) Inflation and Inflation Volatility in
Thailand.
Barimah, A., & Amuakwa-Mensah, F. DOES INFLATION UNCERTAINTY
DECREASE WITH INFLATION? A GARCH MODEL OF INFLATION AND
INFLATION UNCERTAINTY.
Banerjee, S. (2013). Essays on inflation volatility (Doctoral dissertation, Durham
University).
Brunner, A. D., & Hess, G. D. (1993). Are higher levels of inflation less predictable? A
state-dependent conditional heteroscedasticity approach. Journal of Business &
Economic Statistics, 11(2), 187-197.
Caporale, G. M., Onorante, L., & Paesani, P. (2010). Inflation and inflation uncertainty
in the euro area.
Crawford, A., & Kasumovich, M. (1996). Does inflation uncertainty vary with the level
of inflation?. Available at SSRN 75354.
Engle, R. F.. (1983). Estimates of the Variance of U. S. Inflation Based upon the ARCH
Model. Journal of Money, Credit and Banking, 15(3), 286–301.
Entezarkheir, M. (2006). The relation between inflation and inflation uncertainty in
Iran. Iranian Economic Review, 11(17), 1-20.
Friedman, M.. (1977). Nobel Lecture: Inflation and Unemployment. Journal of Political
Economy, 85(3), 451–472.
Fountas, S., Karanasos, M., & Karanassou, M. (2000). A GARCH model of inflation
and inflation uncertainty with simultaneous feedback. Queen Mary and
Westfield College, Department of Economics Working Paper, (414).
Gujarati, D. N. (2003). Basic Econometrics Fourth Edition McGraw Hill Gujarati, DN,(2003).
Basic Econometrics.
Grier, K. B., & Perry, M. J. (1998). On inflation and inflation uncertainty in the G7
countries. Journal of International Money and Finance, 17(4), 671-689.
Heidari, H., & Bashiri, S. (2010). Inflation and inflation uncertainty in Iran: an
application of GARCH-in-Mean model with FIML method of estimation. International
Journal of Business and Development Studies, 2(1), 131-146.
Htay, S. Burma Economic Review.
Jiranyakul, K., & Opiela, T. P. (2010). Inflation and inflation uncertainty in the
ASEAN-5 economies. Journal of asian Economics, 21(2), 105-112.
Jafari Samimi, A., & Motameni, M. (2009). Inflation and Inflation uncertainty in Iran.
Australian Journal of Basic and Applied Sciences, 3(3), 2935-2938.
Karahan, Ö. (2012). The Relationship between Inflation and Inflation Uncertainty:

Inya Economic journal 120
Evidence from the Turkish Economy. Procedia Economics and Finance, 1, 219-228.
Kontonikas, A. (2004). Inflation and inflation uncertainty in the United Kingdom,
evidence from GARCH modelling. Economic modelling, 21(3), 525-543.
Koji, K. U. B. O. (2010). Natural Gas Export Revenue, Fiscal Balance and Inflation in
Myanmar.
Moroke, N. D., & Luthuli, A. (2015). An Optimal Generalized Autoregressive
Conditional Heteroscedasticity Model for Forecasting the South African Inflation
Volatility. Journal of Economics and Behavioral Studies, 7(4), 134.
Moradi, M. A. (2006). A GARCH Model of Inflation and Inflation Uncertainty in Iran
(No. 23800092). EcoMod.
Myint, M. (1997). Thoughts on a Development Strategy for Myanmar.
Myint, U. (2012). Myanmar economy: a comparative view (No. id: 4783).
Nazar, D., Farshid, P., & Mojtaba, K. Z. (2010). Asymmetry Effect of Inflation on
Inflation Uncertainty in Iran: Using from EGARCH Model, 1959-2009. American
Journal of Applied Sciences, 7(4), 535.
Oten-Abayie, E. F., & Doe, S. K. (2013). Inflation and inflation uncertainty in Ghana.
E3 Journal of Business Management and Economics, 4(12), 259-266.
Sharaf, M. F. (2015). Inflation and Inflation Uncertainty Revisited: Evidence from
Egypt. Economies, 3(3), 128-146.
Tashkini, A. (2007). Does Higher Inflation Lead to More Inflation Uncertainty? (The
case of Iran). Iranian Economic Review, (19), 73-87.
Thein, M. (2004). Economic development of Myanmar. Institute of Southeast Asian
Studies.
Thornton, J. (2007). The relationship between inflation and inflation uncertainty in
emerging market economies. Southern Economic Journal, 858-870.
Nian, L. C. (2009). Application of ARIMA and GARCH Models in Forecasting Crude
Oil Prices (Doctoral dissertation, A Dissertation Submitted in Partial Fulfillment of the
Requirement for the Award of the Degree of Master of Science (Mathematics)).
Difficulties of Fixing the Minimum Wage and its Impact on Inflation in Myanmar 121
Difficulties of Fixing the Minimum Wage and its Impact on Inflation in
Myanmar
THUREIN LWIN
Firstly, the paper shows political transaction period and minimum wage; the way of calculating the
minimum wage in Myanmar together with a comparison with that of ASEAN and selected countries.
Secondly, present some difficulties to set up minimum wage and barriers of policy effects to protect all
level of employees with minimum wage. Thirdly, it will background theory. Fourthly, it will explain
about the advantages and disadvantages of regular adjustment of minimum wage and inflation.
I. INTRODUCTION
During the term of U Thein Sein government, they made a decision on calculating the minimum wage
in only two months before the election to be held in November. In this case, minimum wage was
supposed to be concerned with political pressure and this concept seemed to arise from the strike of labors
from the textile industry. Their aim was to reveal that they were too poorly paid to make a living.
In fact, the reasonable amount of money designated as the minimum wage for an average laborer can
not only alleviate the poverty but also prevent the inequality among the laborers of the same skills.
1.1 How to calculate the minimum wage in Myanmar?
In 2013, November and December ILO and CESD1 started working to calculate the living cost
survey. According to the results of this first living cost survey, the average monthly living cost for a 4-6
members household was 203,465 Kyats in Yangon region, 166, 849 Kyats in Bago region, and 242,768
Kyats in Mandalay region.

Inya Economic Journal 122
Table-1. Average living cost per person in Myanmar
No. State / Region Average rate of proposal by
state and regions (Kyats)
Living Cost by regions and
states (Kyats)
1. Kachin 4000 2500
2. Kayah 3500 2600
3. Kayin 3500 2200
4. Chin 4000 3000
5. Sagaing 3000 2600
6. Tanintharyi 4000 3000
7. Bago 4000 3000
8. Magway 3500 2500
9. Mandalay 4000 3500
10. Mon 4000 2200
11. Rakhine 4000 2800
12. Yangon 5000 3500
13. Shan 5000 3000
14. Ayeyarwaddy 3000 2500
15 Nay Pyi Taw 3500 2600
Source: Ministry of Labor, Employment, and Social Security in 2015.
In 2015, the Ministry of Labor, Employment, and Social Security conducted its own living cost survey for
a total of 22,032 households from 108 different townships, and calculated an average living cost per
person. The main ideas of the decision of minimum wage come from the negotiation between employee
and employer groups. Then the government made a final decision that the specific amount of money to be
determined as the daily minimum wage was 3600Kyats. In this way, the process of calculating and
designating of the daily minimum wage per person was successfully done on the 1st of September, 2015.
_____________________________________________________________________________
1- The Centre for Economic and Social Development (CESD) is an independent and non-political
think tank supporting evidence-based policy making that mobilises development resources, both
domestic and international, to bring Myanmar to her rightful place in the region and the world

Difficulties of Fixing the Minimum Wage and its Impact on Inflation in Myanmar 123
II. Difficulties in setting the minimum wage and barriers of policy effects to protect the
employees from all levels by means of this
There are many difficulties relating to the implementation of the concept of the daily minimum
wage. The first difficulty is how to define the minimum wage. There is no generally accepted definition
of the minimum wage. The necessary factors to be taken into account are the minimum wage that can
enable a worker and his family to meet their social security needs, the efficient wage for a worker and his
family to ensure a decent standard of living and to overcome the poverty issue measured by the poverty
line formulated by the World Bank.
The ILO definition is: The Committee considered that the minimum wage may be understood to mean
“the minimum sum payable to a worker for work performed or services rendered, within a given period,
whether calculated on the basis of time or output, which may not be reduced either by individual or
collective agreement, which is guaranteed by law and which may be fixed in such a way as to cover the
minimum needs of the worker and his or her family, in the light of national economic and social
conditions”. (ILO, 2014)
In fixing the minimum wage, it is necessary to balance the cost and benefits of the two parties i.e
of the employers and the employees from the legal point of view. Unlike the calculations of an
employee’s living cost, the calculation of an employer’s (a company) cost and benefit is really difficult. It
is generally true that neither a report nor a record is made to indicate the exact amount of profit that a
business owners or a company makes every year or every quarter. In other words, there is no evidence to
clearly declare the economic status of a company due to no transparency in every aspect of life, the bad
legacy of the past regime. Therefore, business owners (companies) should prepare their financial reports
annually to submit to the authorities concerned so that transparency can be ensured. The government
should manage on companies for transparency in their financial reports and can properly levy taxes on the
capital gains of business firms.
It seems impossible to enact a law of fixing the minimum wage to be followed by all citizens in a
country. However, this concept should be adopted as a useful measure to prevent the majority of laborers
from being exploited by the employers. Despite this, in the cases of house keeper, domestic maids,
temporary laborers of the seasonal workers, migrant workers and small entrepreneurs, the law stipulating
the minimum wage is unlikely to protect them effectively. The minimum wage law is supposed to have a
positive impact on the general public of Myanmar, one of the least developed countries in the World,
because it can facilitate poverty reduction. Thus, the laborers will be able to enjoy a better life through the
passing of this wage.
On the other hand, the minimum wage bill is likely to give a considerable benefit for the welfare
of laborers and employees alike. On the other, it may probably have a negative impact on the employers’
attitude towards the employees. The employers may possibly change their incentive schemes to promote
productivity and to create a pleasant working environment.
In general, employers or the owners of business firms tend to offer bonus to their employees or
staff members in addition to their usages and salaries. They also tend to award the outstanding workers.
They organize holidays and other trips, make arrangements for sickness benefits and insurances.
Moreover, some business firms provide their workers with perks such as free lunch, ferry service, and

Inya Economic Journal 124
health care free of charge such attempts of employees to provide a job satisfaction for the workers are
very likely to change when they need to follow the instructions concerning the basic minimum wage for
the workers.
Some factory owners may probably push their workers to do overtime to cover the increases they
have to pay to an average worker. Consequently, the workers’ health may break down leading either to
the loss of job or to lack of money to support the family. The employer is responsible to pay a double
wage to a worker if he has to work more than eight hours a day. In some cases, the factory owners may
offer the overtime wages to the workers but they may either raise the fees for ferry service or reduce the
amount of bonus etc as a response to the bill of the minimum wage. The employees from the formal
sector (steady job) will probably lose their jobs due to an increase in the daily minimum wage. They may
have to work at informal sector or self-employment.
Another difficulty is to fix proper minimum wages for child laborers. Many children under 18
years of age are found to be working at tea-shops and restaurants etc in poor countries like Myanmar.
Their parents are too poor to send them to school. Being middle school drop outs, they become child
laborers. So, the government is supposed to determine their daily minimum wage to support, their
livelihood. Another way of helping such children is open evening classes for them. Only when these
children are made accessible to the opportunity to learn or to suitable jobs, will their future be good
enough for them to enjoy social security. And their younger generations will also be able to enjoy social
security. The new government is spending money more on education and health sectors. But those large
expenses are still insufficient to develop human resources continuously. The main problem of education
sector seems to be the shortage of competent teachers due to the wrong focus on quantity rather than on
quality.
If the fixing of minimum wages is not done properly, there will be extra cost both for the
employer and the employees. For instance, if the minimum wage is fixed less than it should be, the
employees will get into trouble as they cannot afford the costs for their social security such as expenses
for health care and social functions. Thus, there will be loss of human resources.
For these reasons, fixing the amount of new minimum wages should be done at least three months
in advance the time of next general election. Although it is appropriate to conduct the renewal process of
fixing minimum wages of the workers at least every two years, it is more important to do this activity at a
quite distant time before the time of general election. A law that requires the two activities to be
performed as separately as possible should be stipulated. Or else, the bill of calculating minimum wage
will become an exploitation tool for political parties rather than a useful measure to solve the social issue
between the employers and the employees.
It is found that the minimum wage for workers on daily wage in government service is less than it
should be. A sum of 80,000Kyat (or) 61$ per month is too little for them to meet their basic needs. Even
the government servants are not supposed to be well-protected by the law. Let alone the workers in the
private sector. So, it is necessary to check if the enforcement of minimum wage law can effectively
enforce the private sector. Unless the penalty for the isolation of this law is serious, the level of
effectiveness will be low. To ensure the effectiveness of this law, the government is required to create a
channel through which complaints can be sent to the authorities concerned whenever each party either the
employer or the employee violates this law.

Difficulties of Fixing the Minimum Wage and its Impact on Inflation in Myanmar 125
Besides, it is learnt that the new democratic government led by the President U Htin Kyaw will
change the starting point of a fiscal year from April to October. Therefore, calculating the minimum
wages should be done at the start of a fiscal year when the government allots the budget in order to
control the inflation by indirect way.
In terms of the prices of goods, if the amount of the minimum wage is changed according
to the law at least every two years, there will be inflation as this process can encourage the undesirable
drive in the business people who always want to do speculation of prices. It is evident that price rapidly
rise in our country every time the government increased the salaries of the service personnel. Likewise,
the increase in the minimum wages of workers may also create such a dilemma. On part of the employees,
they might possibly go on a strike to demand more wages that will be legally allowed by the government.
As a consequence, the nearer to the month designated to allow a new wage, the more likely there will be
strikes. So, the government should consider the link between strikes and increased wages. The new
method of fixing minimum wages, adopted in 2011, still takes into account the increase in the cost of
living, or more specifically the forecast inflation, with a corrective to compensate for the difference
between the forecast inflation rate and the CPI for the previous six months.
2.1 Minimum wage can cause of rise of short-term unemployment and inflation.
In 1967, however, Friedman gave a presidential address to the American Economic Association in which
he argued that the correlation between inflation and unemployment, even though it was visible in the
data, did not represent a true trade-off, at least not in the long run. “There is,” he said, “always a
temporary trade-off between inflation and unemployment; there is no permanent trade-off.” In other
words, if policymakers were to try to keep unemployment low through a policy of generating higher
inflation, they would achieve only temporary success. According to Friedman, unemployment would
eventually rise again, even as inflation remained high. The economy would, in other words, suffer the
condition Paul Samuelson would later dub “stagflation.” Paul Krugman
2.2 How to calculate the minimum wage in selected countries?
1. Brazil
In Brazil, a law has established that minimum wage adjustments be determined by a formula that
considers past inflation and GDP growth. In the case of inflation, the formula considers the inflation
accumulated during the previous year (t-1), while for GDP, due to the lag in receiving final results, they
apply the rate of increase of year t-2.
Brazil’s formula for determining adjustments (where MW is minimum wage) is as follows:
∆ MW t = ∆ CPI t-1 + ∆ GDP t-2
Inya Economic Journal 126
The law establishes that this formula should be revised every four years. It was first adopted in 2008, and
renewed in 2012 and 2016.
2. Malaysia
In the case of Malaysia, the minimum wages rate was set using a combination of several socio-
economic indicators grouped as either base criteria or adjustment criteria. The base criteria were the
Poverty Line Income (PLI) per worker and median wages. The PLI is used to account for the basic cost of
living per worker in a household while median wages of the lower half of wage earners in the private
sector reflects the firms’ ability to pay. These two elements were then averaged to represent the floor
wage. This floor wage is then adjusted by the adjustment criteria. This second group of criteria includes:
labour productivity growth, the percentage change in the Consumer Price Index (CPI) and real
unemployment rate, as illustrated below:
MW = Minimum Wages (RM)
PLI = Poverty Line Income (RM)
P = Productivity growth (%)
CPI = Consumer Price Index (% change)
UE = Real Unemployment Rate (%) = (Unemployment rate – 4%)
i = Region (Peninsular Malaysia, Sabah and Sarawa
3. France
In France, annual minimum wage adjustments are linked to the evolution of the CPI, as well as to the
increase in the purchasing power of blue-collar workers’ basic hourly wage. The minimum wage
adjustment takes place every January. It incorporates the change in the CPI over 12 months (November t-
2 to November t-1).
The annual revision of the minimum wage also incorporates half the annual increase in the hourly
basic rate of blue collar wages (from September t-2 to September t-1), resulting from a specific survey
carried out quarterly by the Ministry of Labour.
France’s formula is:
∆ MWt = ∆ CPI Nov t-2/Nov t-1 + 0.50 * ∆ Blue collar hourly wage Sep t-2/Sep t-1
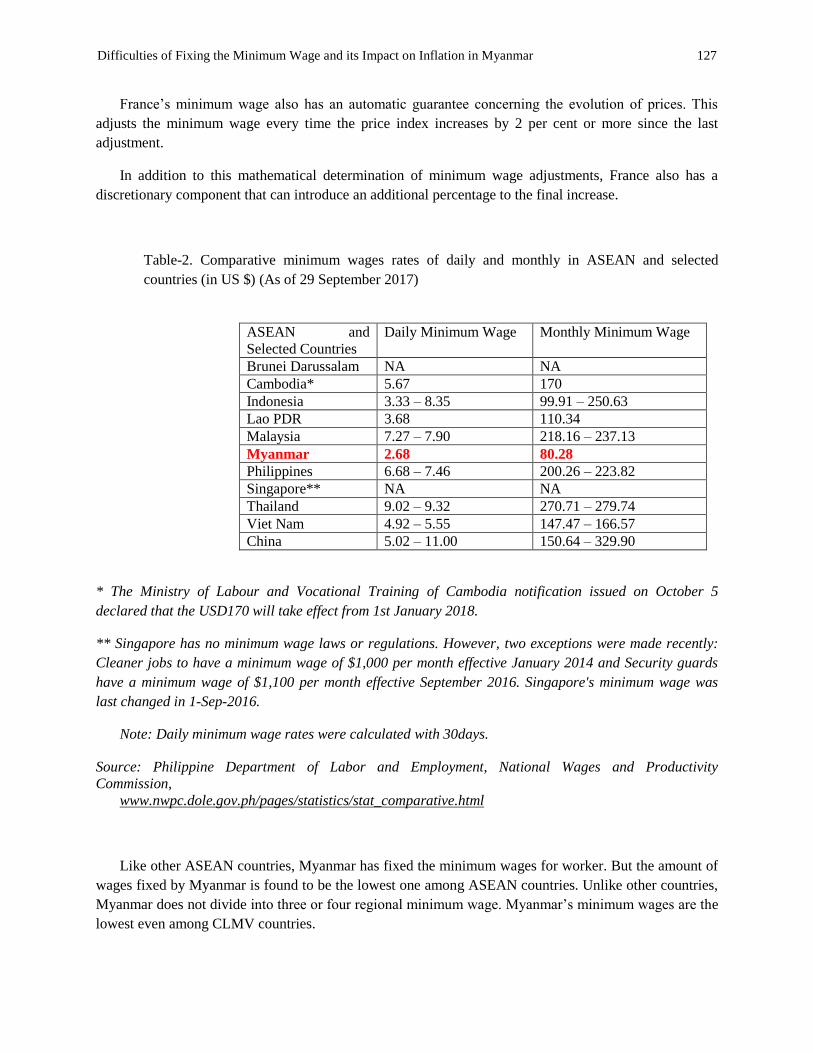
Difficulties of Fixing the Minimum Wage and its Impact on Inflation in Myanmar 127
France’s minimum wage also has an automatic guarantee concerning the evolution of prices. This
adjusts the minimum wage every time the price index increases by 2 per cent or more since the last
adjustment.
In addition to this mathematical determination of minimum wage adjustments, France also has a
discretionary component that can introduce an additional percentage to the final increase.
Table-2. Comparative minimum wages rates of daily and monthly in ASEAN and selected
countries (in US $) (As of 29 September 2017)
ASEAN and
Selected Countries
Daily Minimum Wage Monthly Minimum Wage
Brunei Darussalam NA NA
Cambodia* 5.67 170
Indonesia 3.33 – 8.35 99.91 – 250.63
Lao PDR 3.68 110.34
Malaysia 7.27 – 7.90 218.16 – 237.13
Myanmar 2.68 80.28
Philippines 6.68 – 7.46 200.26 – 223.82
Singapore** NA NA
Thailand 9.02 – 9.32 270.71 – 279.74
Viet Nam 4.92 – 5.55 147.47 – 166.57
China 5.02 – 11.00 150.64 – 329.90
* The Ministry of Labour and Vocational Training of Cambodia notification issued on October 5
declared that the USD170 will take effect from 1st January 2018.
** Singapore has no minimum wage laws or regulations. However, two exceptions were made recently:
Cleaner jobs to have a minimum wage of $1,000 per month effective January 2014 and Security guards
have a minimum wage of $1,100 per month effective September 2016. Singapore's minimum wage was
last changed in 1-Sep-2016.
Note: Daily minimum wage rates were calculated with 30days.
Source: Philippine Department of Labor and Employment, National Wages and Productivity
Commission,
www.nwpc.dole.gov.ph/pages/statistics/stat_comparative.html
Like other ASEAN countries, Myanmar has fixed the minimum wages for worker. But the amount of
wages fixed by Myanmar is found to be the lowest one among ASEAN countries. Unlike other countries,
Myanmar does not divide into three or four regional minimum wage. Myanmar’s minimum wages are the
lowest even among CLMV countries.

Inya Economic Journal 128
III. Theory Background
3.1 Theory of inflation
The two main causes of inflation are demand-pull inflation and cost-push inflation.
1. Demand-pull inflation
If the economy is at or close to full employment, then an increase in AD leads to an increase in
the price level. As firms reach full capacity, they respond by putting up prices leading to inflation. Also,
near full employment with labor shortages, workers can get higher wages which increase their spending
power.
Aggregate Demand can increase due to an increase in any of its components C+I+G+X-M
We tend to get demand-pull inflation if economic growth is above the long-run trend rate of growth. The
long run trend rate of economic growth is the average sustainable rate of growth and is determined by the
growth in productivity.
2. Cost-push inflation
If there is an increase in the costs of firms, then businesses will pass this on to consumers. There
will be a shift to the left in the AS.
Cost-push inflation can be caused by many factors.
1. Rising wages
2. Import prices
3. Raw material prices
4. Profit push inflation
5. Declining productivity
6. Higher tax
7. Rising house prices
8. Printing more money
9. Inflation expectations

Difficulties of Fixing the Minimum Wage and its Impact on Inflation in Myanmar 129
The above diagram shows how inflation is caused by wage increase.
IV. Advantages and Disadvantages of Regular Adjustments on Minimum Wage
4.1 The advantages of regular adjustments
Most frequently, countries adjust their minimum wages once a year. Some countries, adjust rates
every six months, while others have 2-years intervals. Annual adjustments seem adequate in periods of
low or moderate inflation, providing workers and employers with appropriate predictability and allowing
for regular adjustments, in line with evolving economic circumstances.
Findings on the impact of minimum wage policies on inequality are also mixed. Various studies find
that minimum wage legislation plays a role in reducing wage inequality among wage workers and that
minimum wages help compress wages among workers in the lower part of the wage distribution. Ximena
Del Carpio and Laura Pabon,(2014)
Inflation
Wage Increas
e
Higher Labour
Cost
Producers raise prices

Inya Economic Journal 130
Figure 1: Impact of Minimum Wage on Wage in Myanmar
Source: CESD
According to the figure 1, before the minimum wage employee are not sure to get regular wage but
after increase in wage for employee, its sure to get basic salary. Passing the bill of fixed minimum wage
can reduce the conflict between the employer and the employee. Thus there is an increase of job pleasure
for the employees proper intervention and mediate of the government between the employers and
employees can also bring about benefits.
4.2 The disadvantages of regular adjustments
The problem of inflation linked to increased minimum wage is a difficult one to solve just as the
problem of egg and the hen in which no one can calculate which one is origin. It is evident that, inflation
has already taken place in Myanmar long before the wage adjustment process is introduced. Myanmar has
experienced of speculative motive inflation of firms on increase of government servants salaries.
Wage adjustment process to be performed every two years can have negative impact on economy.
The first one is the rapid rise of prices especially in rental of flats and hostels. So, the government should
control and monitor the macroeconomics conditions before it introduces increased wages.
In Myanmar, the punishment for the violation of the minimum wage law for employer is one year’s
imprisonment (or) a fine of 500,000 Kyats. This mode if punishment is a major difficulty for negotiation
between employers and employees. Employers don’t need to care the law because the punishment of law
is minor. According to the Myanmar’s minimum wage law, NMWC has right to adjust the minimum
wage at least once every two years.

Difficulties of Fixing the Minimum Wage and its Impact on Inflation in Myanmar 131
Fixing the minimum wage is not now. In 1949, there was a similar measure to fix the minimum
wages in Myanmar. In 2015, minimum wage adjustment was re-introduced to Myanmar sixty six years
after it was first initiated. So this activity had no considerable effect on inflation. But this activity is
supposed to be done every two years. If so, it can have significant effects on inflation rate.
4.3 Inflation Rate
In July 2015, The National Minimum Wage Committee (NMWC) 2
calculated the inflation rate of
three months. The problem is that April is also included in those three months. Yet, there is water festival
in April so every office and business are closed for 10days. Meanwhile, people prepare to collect their
basic needs such food and water. At that time, inflation rate increases for 2 point compared with that of
the previous month. Then NMWC collected the data of inflation rate in living cost for the three months
yet, calculation might be higher than the real price. {The National Minimum Wage Committee (NMWC)
waited 60 days}.
On the 1st of September 2015, the Minimum Wage rate was designated to be 3,600 Kyats per day for
working eight hours per day by government. After this decision, the annual inflation rate continuously
increased starting from September 2015. Inflation and minimum wage are positively related and they
affect each other.
Table- 3: Annual Rate of Inflation 2015 to 2017(July)
0
2
4
6
8
10
12
20
15
, Ju
ne
July
Au
gust
Sep
tem
be
r
Oct
ob
er
No
vem
be
r
De
cem
ber
2016,…
Feb
ruar
y
Mar
ch
Ap
ril
May
Jun
e
July
Au
gust
Sep
tem
be
r
Oct
ob
er
No
vem
be
r
De
cem
ber
2017,…
Feb
ruar
y
Mar
ch
Ap
ril
May
Jun
e
July
Au
gust
Sep
tem
be
r
Annual Rate of Inflation
AnnualRate ofInflation
Source: CSO

Inya Economic Journal 132
4.4 Impacts and effects of minimum wage in ASEAN countries
Minimum Wage in a Competitive Labor Market
Source: Ximena Del Carpio
Specifically, increases in the minimum wage reduce the number of wage workers and increase
self-employment. The number of wage workers declines because many workers with informal contracts
lose their jobs, but only a fraction of them is absorbed by the creation of jobs outside of the formal
economy or self-employment. In addition, the analysis found that minimum wages in Vietnam help raise
the average wages of workers who remain employed. Del Carpio, Nguyen, Nguyen, Wang, 2013
According to the figure, increase in minimum wage effect on unemployment rate. Increased
wages can solve the problem of living cost for employees but they cannot assure in productivity increase.
Del Carpio, Nguyen, Nguyen, Wang, 2013
Some studies focusing on the ASEAN region have found that impacts of raises in the level of the
minimum wage can disproportionally reduce the employment opportunities of subsets female workers
(mainly less skilled workers), younger workers, recent entrants to the labor market, and lesser skilled
workers Del Carpio, Nguyen, Nguyen, Wang, 2013
Notably, a study measuring the impact of minimum wage increases on inflation in Vietnam
between 1994 and 2008 finds that, when properly measured, minimum wage level increases did not cause
inflation during those years; rather, price increases came about due to increased consumption of goods
around the Vietnamese New Year festivals Del Carpio, Nguyen, Nguyen, Wang, 2013
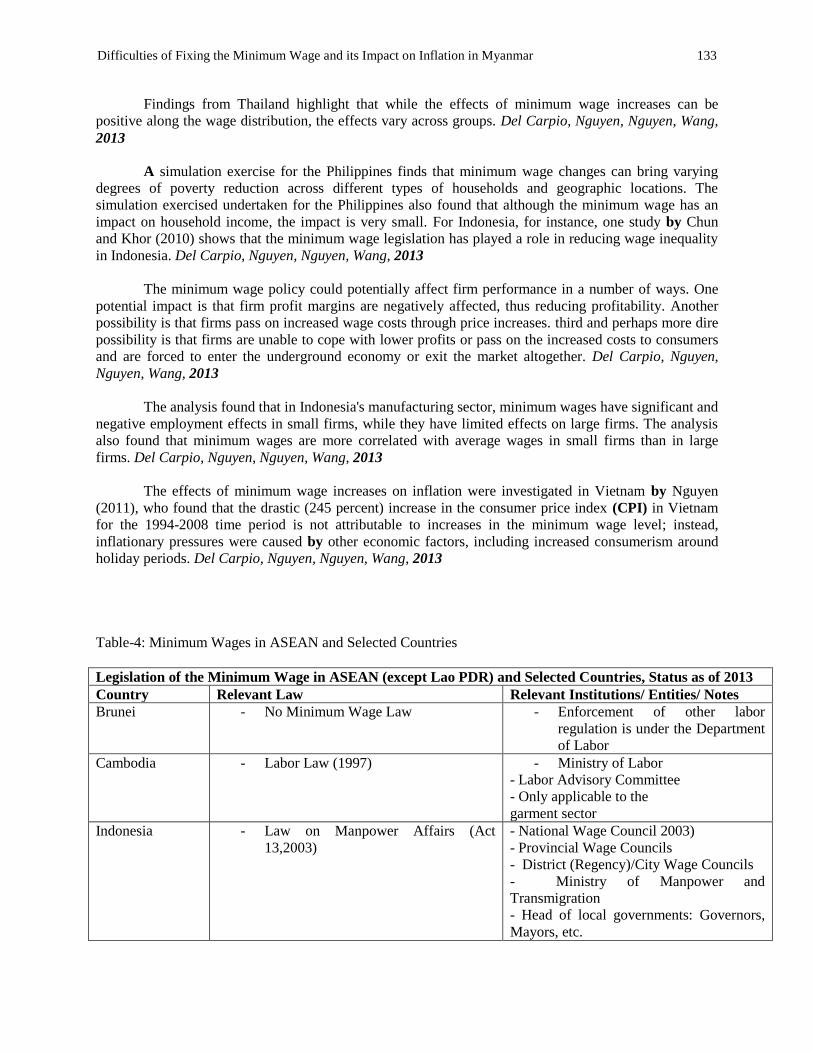
Difficulties of Fixing the Minimum Wage and its Impact on Inflation in Myanmar 133
Findings from Thailand highlight that while the effects of minimum wage increases can be
positive along the wage distribution, the effects vary across groups. Del Carpio, Nguyen, Nguyen, Wang,
2013
A simulation exercise for the Philippines finds that minimum wage changes can bring varying
degrees of poverty reduction across different types of households and geographic locations. The
simulation exercised undertaken for the Philippines also found that although the minimum wage has an
impact on household income, the impact is very small. For Indonesia, for instance, one study by Chun
and Khor (2010) shows that the minimum wage legislation has played a role in reducing wage inequality
in Indonesia. Del Carpio, Nguyen, Nguyen, Wang, 2013
The minimum wage policy could potentially affect firm performance in a number of ways. One
potential impact is that firm profit margins are negatively affected, thus reducing profitability. Another
possibility is that firms pass on increased wage costs through price increases. third and perhaps more dire
possibility is that firms are unable to cope with lower profits or pass on the increased costs to consumers
and are forced to enter the underground economy or exit the market altogether. Del Carpio, Nguyen,
Nguyen, Wang, 2013
The analysis found that in Indonesia's manufacturing sector, minimum wages have significant and
negative employment effects in small firms, while they have limited effects on large firms. The analysis
also found that minimum wages are more correlated with average wages in small firms than in large
firms. Del Carpio, Nguyen, Nguyen, Wang, 2013
The effects of minimum wage increases on inflation were investigated in Vietnam by Nguyen
(2011), who found that the drastic (245 percent) increase in the consumer price index (CPI) in Vietnam
for the 1994-2008 time period is not attributable to increases in the minimum wage level; instead,
inflationary pressures were caused by other economic factors, including increased consumerism around
holiday periods. Del Carpio, Nguyen, Nguyen, Wang, 2013
Table-4: Minimum Wages in ASEAN and Selected Countries
Legislation of the Minimum Wage in ASEAN (except Lao PDR) and Selected Countries, Status as of 2013
Country Relevant Law Relevant Institutions/ Entities/ Notes
Brunei - No Minimum Wage Law - Enforcement of other labor
regulation is under the Department
of Labor
Cambodia - Labor Law (1997) - Ministry of Labor
- Labor Advisory Committee
- Only applicable to the
garment sector
Indonesia - Law on Manpower Affairs (Act
13,2003)
- National Wage Council 2003)
- Provincial Wage Councils
- District (Regency)/City Wage Councils
- Ministry of Manpower and
Transmigration
- Head of local governments: Governors,
Mayors, etc.

Inya Economic Journal 134
Malaysia* - Wages Councils Act (1947)
- Employment Act (1955, revised, 1981)
- Industrial Relations Act (1967,
amended 1980)
- National Minimum Wage Act (2011
with implementation scheduled for
2013)
- National Wages Council
- Ministry of Human Resources
- National Wages Consultative
Council (as of 2011)
Myanmar*** - Minimum Wage Law was set in 1949
- Minimum Wage Law (2013)
- Minimum Wage Rules (2013)
- National Minimum Wage
Committee under the office of the
President was formed in
September 2013
- Ministry of Labor, Employment,
and Social Security
- In March 2013, new Minimum
Wage Law was enacted by
Parliament, replacing the 1949
Minimum Wage Act.
Implementation started on 1
September 2015.
Philippines - Labor Code (1974)
- Wage Rationalization Act (1989)
- Regional Tripartite Wage and
Productivity Boards
- National Wages and Productivity
Commission
- Department of Labor and
Employment
- Parliament has power to enact a
legislation setting statutory
minimum wage rate
Singapore - No Statutory minimum wage - Enforcement of other labor
regulations is under the Ministry of
Manpower
Thailand** - - Labor Protection Act (1998) - National Wage Committee
- Provincial Minimum Wage Sub-
Committees (appointed by the
National Wage Committee)
- Major (uniform) 2013 reform
Vietnam - - 1990 government decree
{introducing two minimum wage rates
(one for domestic establishment and
another for foreign invested
enterprises)}
- Labor Code (1994)
- Series of decrees, latest in November
2007
- Decree 49/2013/ND-CP in July 2013
to establish National Wages Council
- Ministry of Labor (MOLISA)
- National Wage (Policy) Reform
{Steering} Board [governmental
body]
- Four zones, four distinct levels
- National Wages Council {Since
2013}
China - Regulations on Minimum Wage in
Enterprises[1993, revised in 2004]
- Labor and social security bureaus
in each province, autonomous

Difficulties of Fixing the Minimum Wage and its Impact on Inflation in Myanmar 135
- Labor Law (1994) region or municipality and city
- Ministry of Human Resources and
Social Security (MOHRSS)
Source: Various. World Bank, 2013 and ILO's Database of Conditions of Work and Employment
- Laws
Notes: *Malaysia just passed the Minimum Wage Law, and enforcement began in 2013.
**Thailand has recently introduced a uniform minimum wage across the country, but the law for future
revisions of the level continues to be at the provincial level.
***Edited from CESD Labor Market Reform Working Paper No. 1/2016, Thomas Bernhardt , S Kanay
De, Mi Win Thida and Aung Myo Min, JULY 2016
Source: Various, author's research from reviewing legal documents.
Figure 2: Tax Wedge on Labor for OECD and ASEAN Countries, 2010 (% of Labor Costs)
Figure 2 disaggregates tax wedge by components 2010 as a share of the labor costs. In most countries,
social security contributions account for the largest share of the tax wedge, and within these, the
employers' contributions dominate, except in Singapore and Brunei. China imposes the highest tax rate
for social security among the countries reviewed; it represents 22 percent of the total labor cost for a
worker. Singapore on the other hand, imposes most of the tax burden for social security on workers; they
contribute 17 percent of the total labor cost for social security, while employers only pay 13 percent of
total labor costs in social security contributions.

Inya Economic Journal 136
There is a clear association in ASEAN between high non-wage labor costs, lower employment
rates and higher unemployment. And this is true for all workers as well as youth and women. This finding
is consistent with evidence from around the world. Del Carpio, Nguyen, Nguyen, Wang, 2013
V. CONCLUSIONS
"The case [of minimum wage] is in one respect very much like public housing. In both, the people who
are helped are visible-the people whose wages are raised; the people who occupy the publicly built units.
The people who are hurt are anonymous and their problem is not clearly connected to its cause: the
people who join the ranks of the unemployed or, more likely, are never employed in particular activities
because of the existence of the minimum wage and are driven to even less remunerative activities or to the
relief rolls; the people who are pressed ever closer together in the spreading slums that seem to be rather
a sign of the need for more public housing than a consequence of the existing public housing." Milton
Friedman, Capitalism and Freedom, 2002
The factors to be taken into account in fixing the minimum wage in Myanmar.
a) To be a moderate wage for both the employer and employee
b) To designate the minimum wage in a proper time depending on the fiscal year
c) To prevent the potential problems and loss that may arise from fixing the minimum wage like
inflation rate by seeking various means of solution for them on government’s part
d) To change the weakness of law enforcement
e) To establish a system through which the government can check and balance the potential conflicts
between the employer and employee due to the increased minimum wage.

Difficulties of Fixing the Minimum Wage and its Impact on Inflation in Myanmar 137
References
1. https://mdricesd.files.wordpress.com/2016/01/presentation-myanmar_s-minimum-wage-
cambodia.pdf
2. http://www.ilo.org/wcmsp5/groups/public/---asia/---ro-bangkok/---ilo-
yangon/documents/publication/wcms_546641.pdf
3. https://www.thebalance.com/causes-of-inflation-3-real-reasons-for-rising-prices-3306094
4. http://www.s-cool.co.uk/a-level/economics/inflation-and-monetary-policy/revise-it/what-are-the-
causes-of-inflation
5. http://www.economicshelp.org/macroeconomics/macroessays/what-causes-sustained-period-
inflation/
6. Minimum Wage Policy: Lessons with a Focus on the ASEAN Region, Ximena Del Carpio and
Laura Pabon, January 2014. World Bank
7. Minimum Wages Law 2013, Myanmar
8. Minimum Wages Rules 2013, Myanmar
