iob evaluation. the two-pronged approach ... - oecd.org · iob evaluation | no. 349 the two-pronged...
TRANSCRIPT

IOB Evaluation | no. 349
The two-pronged approach: Evaluation of N
etherlands support to prim
ary education in Bangladesh
IOB Evaluation
Evaluation of Netherlands support to primary education in Bangladesh | IOB Evaluation | no. 349 | The two-pronged approach: Evaluation of Netherlands support to formal and The two-pronged approach: Evaluation of Netherlands support to primary education in Bangladesh | IOB Evaluation | no. 349 | The two-pronged approach: Evaluat
The two-pronged approach: Evaluation of Netherlands support to primary education in Bangladesh
Published by:
Ministry of Foreign Affairs of the NetherlandsP. O. Box 20061 | 2500 eb The Hague | The Netherlandswww.minbuza.nl | www.rijksoverheid.nl © Ministry of Foreign Affairs of the Netherlands | August 2011
11Buz283327 | E
The Netherlands provided considerable support to formal and non-formal primary education in Bangladesh in the period 1999-2009. This support was channeled through both govern-mental and non-governmental channels. Rather than following the Dutch Euro, this
report aims to assess the results accomplished through these channels in terms of access to education and education quality. The evaluation in Bangladesh is one of the building blocks for IOB’s policy review of Netherlands support to basic education in developing countries.
VKB041-1 WTK Rapport IOB 349 omslag.indd 1 11-10-11 10:10

August 2011
IOB Evaluation
The two-pronged approach: Evaluation of Netherlands support to primary education in Bangladesh
VKB041-1 283324_B85_BW v5.indd 1 10-10-11 09:55

| 2 |
VKB041-1 283324_B85_BW v5.indd 2 10-10-11 09:55

The two-pronged approach: Evaluation of Netherlands support to primary education in Bangladesh
| 3 |
ContentsList of figures, tables and boxes 5Acronyms and abbreviations 9Preface 13Main findings and conclusions 17
1 Research questions and methods 261.1 Research questions 271.2 Quantitative data and data limitations 291.3 Measuring changes in education quality 30
2 Context 362.1 Introduction 372.2 General context 372.3 Economic context 402.4 The primary education system 422.5 PEDP-II and BRAC 502.6 Constraints in primary education – the situation in 2000 60
3 Netherlands support to primary education in Bangladesh 623.1 Introduction 633.2 Netherlands support to primary education in the period 1999-2009 633.3 Alignment 653.4 Strategy pursued by the Netherlands – a two-pronged approach 673.5 Netherlands embassy & policy dialogue in the education sector 703.6 Summary 79
4 Education Finance and Governance 824.1 Introduction 834.2 Education Spending and Sources of Finance 834.3 Internal and external efficiency 964.4 Primary education budgeting and budget execution, financial management
and leakages 994.5 Institutions governing the primary education system 1034.6 Summary 105
VKB041-1 283324_B85_BW v5.indd 3 10-10-11 09:55

| 4 |
5 Trends in primary education inputs 1085.1 Introduction 1095.2 School infrastructure 1095.3 Teachers and teacher training 1125.4 The Curriculum and Textbooks 1185.5 The Primary Education Stipend Programme 1185.6 School supervision and monitoring 1205.7 Community involvement and SMCs 1235.8 Summary 128
6 Trends in Access 1306.1 Introduction 1316.2 Enrolment 1316.3 School attendance, repetition, dropout and survival rates 1476.4 Completion rate and secondary enrolment rates 1496.5 Summary 154
7 Trends in quality 1567.1 Introduction 1577.2 Changes inside the classroom 1577.3 End of primary school examination 1657.4 Student assessments 1687.5 Quantitative analysis of education quality 1707.6 Summary 174
AnnexesAnnex 1: About IOB 176Annex 2: Terms of Reference 177Annex 3: Netherlands support to education in Bangladesh, 1999-2009 182Annex 4: Other education programmes supported by the Netherlands 184Annex 5: Statistical analysis 190Annex 6: Interviewees 194Annex 7: References 196Evaluations of the Policy and Operations Evaluation Department (IOB) published between 2007-2011 206
VKB041-1 283324_B85_BW v5.indd 4 10-10-11 09:55
The two-pronged approach: Evaluation of Netherlands support to primary education in Bangladesh
| 5 |
List of figures, tables and boxesFigure 1.1 Intervention logic 28Figure 2.1 Bangladesh population, 1960-2009 38Figure 2.2 Percentage of people living in poverty by division and at national level,
2000 and 2005 41Figure 2.3 PEDP-II budget utilisation by main component (up to 31 March 2010) 54Figure 3.1 Netherlands bilateral support to basic education in Bangladesh
(disbursements in € 000) 64Figure 4.1 Share of education in Government budget, 2002-2010 84Figure 4.2 Public spending on education (Taka million) by education level 86Figure 4.3 Public education sector spending and external aid flows to education
(Billion taka) 89Figure 4.4 Benefit incidence of primary education subsidy in Bangladesh 2000
and 2005 93Figure 5.1 Average number of classrooms per type of school, 2005 and 2009 111Figure 5.2 Proportion of teachers with at least C-in-Ed, 2005 and 2009 116Figure 6.1 Gender gap in net enrolment by quintile in 2000 and 2005
(percent point difference) 138Figure 6.2 Grade wise enrolment by age, 2005 142Figure 6.3 Percentage of 6 year old children enrolled in pre-primary and primary
by quintile 143Figure 6.4 Completion of each grade by age, 2005 150Figure 6.5 Completion rate by gender 151Figure 6.6 Completion rates by income quintile 152Figure 6.7 Completion rates in urban and rural areas 153Figure 7.1 Participation and pass rates of 2009 national examination by
school type 166
Table 1.1 Sampling of schools 33Table 1.2 School level research tools 35Table 1.3 Other research tools 35Table 2.1 Evolution of Bangladesh’s primary education system, 1970-2000 46Table 2.2 Evolution of post-primary education, 2000, 2005 and 2008 47Table 2.3 PEDP-II funding – Government and donor commitments, 2004-2010 51Table 2.4 Donor and Government cumulative expenditure under PEDP-II in
US$ millionTable 2.5 Summary statistics on BPS/BAPS and ESP schools by
socio-economic-geographical areas 57Table 2.6 BEP-II funding commitments (US$ million equivalent) 58Table 2.7 Comparing Government and BRAC schools 59Table 3.1 Netherlands project and programme funding commitments, 2000-2009 65Table 3.2 Themes and objectives of Netherlands supported education
interventions 66
VKB041-1 283324_B85_BW v5.indd 5 10-10-11 09:55

| 6 |
Table 4.1 Government and donor spending on education, 1999-2008 in US$ million 85
Table 4.2 Support provided by Government, community and parents to different types of schools 87
Table 4.3 Estimated financing gap to achieve EFA (US$ billion) 90Table 4.4 Distribution of annual Government and household primary
schooling spending 2005 (Taka) 91Table 4.5 Public revenue and development expenditure and private spending
on primary education by school type (in constant 2006/2007 Taka) 94Table 4.6 Private education expenditures by school type, gender and
economic status, 2008 (Taka) 95Table 4.7 Composition of total public education spending on primary education,
various years (constant 2006/2007 Taka million) 96Table 4.8 Total allotment for selected budget lines, 2003-04 (Taka million) 101Table 5.1 Number of schools by school type, 2001-2009 109Table 5.2 Number of classrooms by school type in 2005 and 2009
(PEDP-II covered only) 110Table 5.3 Infrastructure characteristics of formal schools in 2005 and 2009 112Table 5.4 Number of teachers by type of school in 2003, 2005, 2007 and 2009 (000) 113Table 5.5 Number of teachers at BRAC schools in 2005, 2007 and 2009 (000) 113Table 5.6 Trends in % female teachers, 2001-2009 114Table 5.7 Trends in student – teacher ratios, 2001-2009 114Table 5.8 Teacher qualifications in primary schools in 2005 and 2009 116Table 5.9 Findings school visits Bogra and Sunamganj 126Table 6.1 Student enrolment by school type, 2001-2008/2009 (000) 132Table 6.2 Enrolment in BRAC schools, 2001, 2005, 2007 and 2009 (000) 133Table 6.3 Gross and Net primary school enrolment ratios, 2000-2009 134Table 6.4 Percentage girls’ enrolment in primary education, 2001-2009 137Table 6.5 Share of students by wealth quintile and school type, 2006 139Table 6.6 Share of students by economic status and school type, 2008 140Table 6.7 School level enrolment by age, 2000 and 2005 141Table 6.8 Attendance rates by school type, 2000 and 2008 148Table 6.9 Reported data on survival to Grade V, dropout and grade repetition 148Table 6.10 Overall completion rates in 2002, 2005 and 2008 151Table 6.11 Gross and net lower secondary school enrolment ratios in 2000,
2005 and 2006 154Table 7.1 Teaching environment by school type and location 158Table 7.2 Classroom teaching and learning practices by school type and location 159Table 7.3 Percentage score in CAMPE assessments by school type and subject,
2000 and 2008 169Table 7.4 Regression analysis learning achievements 2008 170
VKB041-1 283324_B85_BW v5.indd 6 10-10-11 09:55
The two-pronged approach: Evaluation of Netherlands support to primary education in Bangladesh
| 7 |
Table A3.1 Financial support of Netherlands to the education sector in Bangladesh by year and programme 182
Table A5.1 The Effect of AID and GDP on Public Spending on Education, 1990-2008 190
Table A5.2 Regression analysis learning achievements 2008 192
Box 2.5 BRAC Non Formal Primary Education (NFPE) and Basic Education Programme (BEP) 55
Box 3.1 History of PEDP-I 67Box 3.2 LCG and ELCG 71Box 4.1 Private and public benefits of primary education 98Box 6.1 Regional constraints to enrolment 136Box 6.2 ILO UIE approach to provide Non-Formal Education 145Box 6.3 School stipend programmes 146Box 7.1 The case of FIVDB: Active Learning and Assessment 164Box 7.2 Private tutoring on the rise
VKB041-1 283324_B85_BW v5.indd 7 10-10-11 09:55

| 8 |
VKB041-1 283324_B85_BW v5.indd 8 10-10-11 09:55
The two-pronged approach: Evaluation of Netherlands support to primary education in Bangladesh
| 9 |
Acronyms and abbreviationsADB Asian Development Bank ADSL Associates for Development Services Limited ADP Annual Development Plan AIID Amsterdam Institute of International Development ASPR Annual Sector Performance Review AUEO Assistant Upazila Education Officer AusAID Australian Agency for International Development BANBEIS Bangladesh Bureau of Educational Information and Statistics BAPS BRAC Adolescent Primary Schools BBS Bangladesh Bureau of Statistics BEOC Basic Education for Older Children BEP BRAC Education Programme BNP Bangladesh Nationalist Party BOOM Bangladesh Overleg Ontwikkelingssamenwerking en Mensenrechten BPS BRAC Primary Schools BRAC Former acronym for Bangladesh Rural Advancement Committee BU-IED BRAC University Institute for Educational Development CAMPE Campaign for Popular Education CHT Chittagong Hill Tracts CIDA Canadian International Development Agency C-in-ED Certificate in Education CLC Community Learning Centre CLU Child Labour Unit CoC Code of Conduct CPEP Comprehensive Primary Education Project CPI Corruption Perception Index CSO Civil Society Organisation DCC Dhaka City Corporation DC District Commissioner DFID Department for International Development (UK) DP Development Partner DPE Directorate of Primary Education DPEO District Primary Education Officer EC European Commission EFA Education For All EKN Embassy of the Kingdom of the Netherlands ELCG Local Consultative Sub Group on Education ERD Economic Relations Division ESP Educational Support Programme ESTEEM Effective Schools through Enhanced Education Management FGD Focus Group Discussion FIVDB Friends in Village Development Bangladesh FMRP Financial management Reform Programme
VKB041-1 283324_B85_BW v5.indd 9 10-10-11 09:55
| 10 |
FRMSFP Financial Risk Mitigation Strategy in Finance and Procurement GDP Gross Domestic Product GER Gross Enrolment Rate GoB Government of Bangladesh GPS Government Primary School GTZ German Technical Cooperation (Deutsche Gesellschaft für
internationale Zusammenarbeit) HIES Household Income and Expenditure Survey ICT Information and Communication Technologies IDA International Development Association IDEAL Intensive District Approach to Education for All ILO International Labour Organisation IMF International Monetary Fund IOB Policy and Operations Evaluation department JARM Joint Annual Review Mission KPI Key Performance Indicators LCG Local Consultative Group LFS Labour Force Survey (Sri Lanka) MDG Millennium Development Goal MICS Multiple Cluster Indicator Studies MoE Ministry of Education MoFA Ministry of Foreign Affairs MoLE Ministry of Labour and Employment MoPME Ministry of Primary and Mass Education MPC Multi-Purpose Centre MTBF Medium Term Budgeting Framework MTR Mid Term Review NAPE National Academy of Primary Education NCTB National Curriculum Textbook Board NEP National Education Policy NER Net Enrolment Rate NFE Non-Formal Education NFPE Non-Formal Primary Education NGO Non-Governmental Organisation NSAPR National Strategy for Accelerated Poverty Reduction ODA Official Development Aid OPM Oxford Policy Management PCU Programme Coordination Unit PEDP Primary Education Development Programme PEDPQI Primary Education Development Project for Quality Improvement PFWG Procurement and Finance Working Group PLU Programme Liaison Unit PMED Primary and Mass Education Division PP Project Proforma (I-)PRSP (Interim) Poverty Reduction Strategy Paper
VKB041-1 283324_B85_BW v5.indd 10 10-10-11 09:55

The two-pronged approach: Evaluation of Netherlands support to primary education in Bangladesh
| 11 |
PSPMP Primary School Performance Monitoring Project PSQL Primary School Quality Level PTI Primary Training Institutes RNGPS Registered Non-Governmental Primary School ROSC Reaching Out of School Children SDC Swiss Development Cooperation SESIP Secondary Education Sector Investment Programme SIDA Swedish International Development Agency SLIP School Level Improvement Plans SMC School Management Committee SPESP Second Primary Education Sector Project SWAp Sector Wide Approach TA Technical Assistance UEO Upazila Education Officer UIE Urban Informal Economy UNFPA United Nations Population Fund UNICEF United Nations Children’s Fund UNO Upazila Nirbahi Officer UPEP Upazila Primary Education Plans URC Upazila Resource Centre USAID United States Agency for International Development VTC Vocational Training Centre WFCL Worst Forms of Child Labour WFP World Food Programme
VKB041-1 283324_B85_BW v5.indd 11 10-10-11 09:55

| 12 |
VKB041-1 283324_B85_BW v5.indd 12 10-10-11 09:55

The two-pronged approach: Evaluation of Netherlands support to primary education in Bangladesh
| 13 |
PrefaceOn 21 November 2001, the Netherlands parliament adopted a resolution (‘Motie Hessing’) requesting the Government that 15% of official development assistance be set aside for support to basic education. This boost in investment would support developing countries in achieving the Millennium Development Goals, particularly Millennium Development Goal (MDG) 2: ‘Achieve universal primary education’, ensuring that all boys and girls would complete a full course of primary schooling by 2015, and MDG 3: ‘Promote gender equality and empower women’, targeting the elimination of ‘gender disparity in primary and secondary education preferably by 2005, and at all levels by 2015’.
A framework for Netherlands support to basic education in developing countries is provided by its policy document ‘Education: A Basic Human Right’ of 1999. The document underscores that education is ‘a crucial element in efforts to improve the position of poor people and groups at risk of marginalisation and social exclusion. It contributes to a more equitable distribution of opportunities, and to the social, economic and political empowerment people need in order to play an active role in society’.1 The following objectives were formulated: (i) To maintain and improve the quality and relevance of basic education; (ii) To achieve social justice by providing equal opportunities for people from disadvantaged social groups in order to help them gain a basic level of essential knowledge, values and skills necessary to ensure a productive, peaceful and equitable existence, and; (iii) To reduce gender disparities in educational achievement and to enhance gender justice through education by promoting empower ment of women’.2 Realisation of these aims is expected to contribute to the overall objective of Dutch development cooperation regarding sustainable poverty reduction. Worldwide, the Netherlands’ investments in basic education through bilateral, multilateral and non-governmental channels increased from € 199 million in 2003 to € 793 million in 2009.
In 2007, the Policy and Operations Evaluation Department (IOB) of the Netherlands Ministry of Foreign Affairs initiated a series of impact evaluations of Netherlands support to basic education in Zambia and Uganda. These studies were published in April 2008.3
In 2009, IOB started a broader policy review of Netherlands support to basic education covering the period 1999-2009. This review aims to account for policies pursued, to provide policy makers with an opportunity to learn from experiences in the past and to contribute to the reliability of the policy information used by the Netherlands government. Bangladesh was selected as one of the case studies for this policy review. One reason for selecting Bangladesh was that it has been one of the largest recipients of aid for education – close to € 119 million since 1999. Another reason was that Netherlands support has been provided
1 Ministry of Foreign Affairs (2000). 2 Ministry of Foreign Affairs (2000).3 Ministry of Foreign Affairs (2008). Primary Education in Uganda. IOB Impact Evaluation No. 311. April
and Ministry of Foreign Affairs (2008). Primary Education in Zambia. IOB Impact Evaluation No. 312. April.
VKB041-1 283324_B85_BW v5.indd 13 10-10-11 09:55

| 14 |
through two distinct channels – for non-formal primary education through BRAC,4 a major NGO player in Bangladesh, and for formal primary education through the Government’s second Primary Education Development Programme (PEDP-II) that is run by the Ministry of Primary and Mass Education (MoPME). The country evaluation would also allow comparing the effectiveness of these channels in reaching the MDGs and the aims of Education for All (EFA).
The objective of this country study is to evaluate the relevance, efficiency, effectiveness, and sustainability of the Netherlands contribution to basic education in Bangladesh. It focuses on formal and non-formal primary education as this accounted for 90% of Netherlands education support.
The evaluation is based on an extensive literature review, an analysis of quantitative data of the education sector, interviews with key players in the education sector in Dhaka and a qualitative field study that was conducted in two districts among local education officials, different types of primary schools, and teacher training institutes. No primary quantitative data collection was done for the purpose of the impact evaluation.
The structure of the report is as follows. Chapter 1 describes the evaluation methodology used. Chapter 2 provides the context in which the support was given and the achieve-ments in primary education at the turn of the century. It also includes a description of the main features of PEDP-II and BRAC’s initiatives in education. Chapter 3 concerns the role of the Netherlands and other donors in the education sector in Bangladesh. It analyses the rationale and modalities of Netherlands support and issues of policy dialogue, donor harmonisation and alignment, Government – NGO relationships as well as issues of education sector governance and fiduciary risks. Chapter 4 documents public and private spending in education and assesses whether resources have been used effectively to provide education services. Attention is also paid to education sector governance at the central level. Chapter 5 analyses trends in primary education inputs and the changes therein during the evaluation period. Chapters 6 and 7 document trends in access and learning (as measured in assessments) in primary education and assess the impact of the provision of education programmes and governance reforms. Particular attention is paid to changes in teaching and learning in the classroom. Each chapter is concluded with a short summary of main findings. The annexes to the report include the terms of reference for the evalua-tion, an overview of Netherlands aid flows to aid in Bangladesh and details on various other projects and programmes that have been supported, the results of the regression analysis as well as overviews of persons and documents consulted.
4 Originally BRAC stood for Bangladesh Rural Advancement Committee; currently the organisation is simply known by its acronym.
VKB041-1 283324_B85_BW v5.indd 14 10-10-11 09:55
The two-pronged approach: Evaluation of Netherlands support to primary education in Bangladesh
| 15 |
The study was made possible thanks to the contributions of the Ministry of Primary and Mass Education, the Department of Primary Education, BRAC, the Campaign for Popular Education (CAMPE), Friends in Village Development Bangladesh (FIVDB) and the ILO Urban Informal Economy (UIE) project as well as the Netherlands Embassy in Dhaka. An international reference group, including Nick Taylor (JET Education Services), Yusuf Sayed (University of Sussex) and Chris de Nie (Ministry of Foreign Affairs) that commented and advised on the draft report. A reference group in Dhaka, consisting of Rasheda K. Choudhury (CAMPE), Zakir Hossain Akanda (MoPME), Manzoor Ahmed (BU-IED), James Jennings (AusAid) and Theo Oltheten (Netherlands Embassy) commented and advised on the report as well. Within IOB, the report was reviewed by Phil Compernolle, Antonie de Kemp and myself.
The report is written by Paul G. de Nooijer (IOB) with support from Simone Verkaart (IOB). Inputs were provided by Menno Pradhan, Hillary Thornton, Vincent Paqeo and Astrid Zwager of the Amsterdam Institute of International Development (AIID). Nurjahan Begum and Shahjahan Mian Tapan assisted the team. Field work was furthermore done by Rubaya Monzur, Hosne Ara Begum and a team of junior field researchers. IOB is fully responsible for the report’s content.
Prof. dr. Ruerd Ruben
Director Policy and Operations Evaluation DepartmentMinistry of Foreign Affairs, The Netherlands
VKB041-1 283324_B85_BW v5.indd 15 10-10-11 09:55

| 16 |
VKB041-1 283324_B85_BW v5.indd 16 10-10-11 09:55
The two-pronged approach: Evaluation of Netherlands support to primary education in Bangladesh
| 17 |
Main findings and conclusionsThis report presents the findings of the evaluation of Netherlands support to primary education in Bangladesh over the period 1999-2009 that took place in the period April 2010 - June 2011. It focuses on support to:
• formal primary education under the second Primary Education Development Programme (PEDP-II). This is a joint programme of the Government of Bangladesh, represented by the Ministry of Primary and Mass Education (MoPME), and a consortium of bilateral and multilateral donors, comprising the Asian Development Bank, the World Bank, UNICEF, and the European Commission as well as Australia, Canada, Japan, the Netherlands, Norway, Sweden and the United Kingdom (UK). The Programme started in 2004 with a total budget of US$ 1.8 billion and lasts until December 2011. The Netherlands contribu-tion to PEDP-II equals some US$ 46.3 million, which is close to 8% of the total budget. PEDP-II focuses on improving the quality of primary education, primarily through the construction of classrooms, water and sanitation facilities, the provision of teaching and learning materials, teacher training and re-training and strengthening of educa-tion sector management. The Programme covers Government Primary Schools (GPS), Registered Non-Governmental Primary Schools (RNGPS) and experimental schools as well as primary teacher training institutes (PTI) and upazila resource centres (URC); and
• non-formal primary education channelled through the Bangladeshi NGO BRAC. BRAC, previously known as the Bangladesh Rural Advancement Committee, has been providing non-formal education to out-of-school children since 1985, most recently through it’s Basic Education Programme (BEP-I). Most BRAC schools are in rural areas targeting disad-vantaged children who have either never attended or dropped out from school. Priority is given to girls. Education is provided in basically equipped one-classroom schools by a teacher, mostly female, that is recruited from the local community. BRAC schools follow the Government curriculum. Netherlands support (52% of the BEP-I budget) is provided alongside funding from Canada, Norway, UK and Oxfam Novib as well as BRAC itself; the total value of BEP-I is the equivalent of some € 107 million for the period 2004-2009.
Rather than evaluating the activities financed by the Dutch Euro, the evaluation seeks to evaluate the overall relevance, effectiveness and efficiency of these programmes that together account for 87% of the Netherlands support to education in Bangladesh. The evaluation is one of several building blocks for the broader policy review of Netherlands support to basic education that is due in 2011.
The main questions that have framed the evaluation were the following: (i) What have been the key characteristics of Netherlands support for the education sector and what has been the rationale behind its portfolio? (ii) Did increased Government and NGO funding for primary education result in an efficient and equitable distribution of education inputs (schools, trained teachers, learning materials, etc.)? (iii) What has been the effectiveness of the supported education interventions in terms of access and enhanced quality of the primary education provision? and (iv) What is the likelihood of future institutional and financial sustainability of the results accomplished?
VKB041-1 283324_B85_BW v5.indd 17 10-10-11 09:55
| 18 |
To answer these questions, the evaluation used a mixed-method approach, including both qualitative (interviews, focus group discussions, school visits and classroom observations, document analysis, etc.) and quantitative research methods. The evaluation was hampered by a lack of consistent, comprehensive and up-to-date data on various key indicators such as dropout and school completion rates. Moreover, the history of student assessment is limited in Bangladesh.
Relevance5Focusing initially on BRAC, Netherlands education sector support has diversified over the evaluation period following a ‘two pronged’ approach. This approach provided the frame-work for a balanced portfolio that combined: (i) support for formal primary education quality under PEDP-II and (ii) support to equity of access by providing low-cost, non-formal primary education for some 1 million children enrolled in a series of BRAC education programmes. Equity of access was also addressed through Netherlands support for ‘hard to reach’ children in very remote areas through FIVDB’s Jonoshilon programme and children involved in worst cases of child labour in slums of Dhaka through ILO’s Urban Informal Economy project. In the absence of an overriding policy for the sector, Netherlands support to PEDP-II – which de facto functioned as the Government’s education policy for primary education – was well aligned with the aims pursued by the Government and its focus on primary education quality. Supporting the broad themes ‘education quality’ and ‘equity of access’ also implied a compliance with the Netherlands overall policy ‘Education: A Basic Human Right’ of 1999.
Within a context of already high enrolment in primary education, with the Net Enrolment Ratio increasing from 65% in 2000 to 81% in 2009, with virtual gender parity in enrolment and serious concerns about learning outcomes, the focus of PEDP-II on addressing educa-tion quality has been appropriate. This is particularly the case since the available literature shows that primary education in Bangladesh has had an important impact on raising agri-cultural productivity, the adoption of new agricultural technologies, improved food intake as well as family planning. The focus on equity of access has been appropriate as well, since some 10% of the children targeted by BRAC, FIVDB and ILO traditionally remain outside the formal education system.
The evaluation shows that external aid through PEDP-II has been valuable for the devel-opment of primary education in Bangladesh but did not ‘crowd out’ public expenditure. Regression analysis confirms for the period 1999-2000 that a one percent increase in aid is associated with: (i) a 0.3% increase in public primary education spending; (ii) a 0.2% increase of the revenue budget for primary education and (iii) a 0.5% increase in the develop ment budget for primary education.
The evaluation shows that Government spending on education has been slightly pro poor. Nevertheless, reforms in the planning, allocation and design of education public expenditures to further improve the distribution of education benefits in favour of the poor appear necessary.
5 Relevance is defined as ‘the extent to which the objectives of an intervention are consistent with beneficiaries’ requirements, country needs, global priorities and partners’ and donors’ policies’. OECD/DAC (2002), Glossary of key terms in evaluation and results based management.
VKB041-1 283324_B85_BW v5.indd 18 10-10-11 09:55
The two-pronged approach: Evaluation of Netherlands support to primary education in Bangladesh
| 19 |
Effectiveness6Effectiveness of the Netherlands contribution to the education sector in Bangladesh is measured on the basis of the results and outcomes of the Bangladesh education policies with regard to access, quality and equity
The evaluation shows that the overall net enrolment rate (NER) has increased from 65% in 2000 to 81% in 2009. Equity of access still remains a key concern with children from the poorest quintiles completing primary education at a later age and appearing to drop out more frequently. In 2005, some 50% of children from the poorest quintile completed primary education by age 16 as against close to 90% of the richest quintile. Introducing more flex-ibility with regard to models of schooling, particularly for the poor in remote and poorly connected areas as well as the urban slums, continues to be a challenge. Households contribute about 20% to total education costs at the primary level – with the actual costs incurred varying considerably between the poorest and the richest quintiles. Private tuition is a major cost component, together with the costs of school uniforms and teaching and learning materials.
The evaluation moreover shows that some 10% of the primary school-aged children can still be considered as ‘hard-core out of school’. The available data indicates that improvements in the supply of educational inputs (from the expansion of existing schools to a reduction in the teacher-student ratios by employing additional teachers at these schools) do not ensure that those left out will now join the education system. Much more consideration is warranted for the socio-economic characteristics of these children as has been endeavoured under the non-formal education programmes supported by the Netherlands. This is particu-larly true for the Government’s primary stipend programme. This programme requires further scrutiny in view of: (i) the considerable costs incurred by the Government to distribute relatively small amounts to individual households, who are moreover not always as poor as was originally intended, and (ii) diverging opinions of the effectiveness of this programme on primary school enrolment, attendance, attainment and completion of boys and girls and for different strata of society.
Both Government and NGOs like BRAC have made targeted efforts to increase girls’ enrol-ment in school. These ranged from awareness raising campaigns to (secondary) school stipends. The combined efforts have resulted in virtual gender parity in primary education in Bangladesh. More or less equal numbers of girls and boys enrol in school since 2005 – with the NER of girls exceeding that of boys by some 3% in 2006 – except in the richest quintile where there is still a (diminishing) gender gap in favour of boys. Moreover, girls do better than boys in terms of completing primary education though boys outperformed girls in the 2009 end of school examination. Increasingly, the non-enrolment and attendance of boys from poor families is becoming an issue. The evaluation points to various reasons for this phenomenon, ranging from higher prevalence of male child labour to a lack of interest in education among boys. While beyond the scope of this evaluation, this topic needs further analysis as this phenomenon occurs not only in Bangladesh but also in other countries (e.g. in Pakistan). At the
6 Effectiveness assesses the extent to which the direct results, or output, of an intervention contributed to the objectives, or outcomes (OECD/DAC, 2002, Glossary of key terms in evaluation and results based management).
VKB041-1 283324_B85_BW v5.indd 19 10-10-11 09:55

| 20 |
same time, the disparity in favour of girls shrinks rapidly with progression through (lower secondary) school.
School attendance has improved as well, from 60% in 2000 to 68% in 2008, though this is still at a low level. Improvements are observed for all types of schools, with higher attend-ance rates in non-formal education, such as provided by BRAC, in comparison with formal schools. School attendance is correlated with the child’s health status, family income, the area in which children live, parent’s educational background and occupation, as well as school-community relations and regular participation of mothers in school meetings.
The evaluation finds that the classroom environment at GPS and RNGPS has definitely improved as a result of key PEDP-II interventions – from the construction of additional classrooms, to serviceable blackboards and the provision of teaching and learning resources at the beginning of the school year. At the same time, these investments and initiatives to employ more teachers still appear to have had little impact on student contact hours at the GPS and RNGPS. These have remained low, also in comparison with other South Asian countries, with 2 hours in Grades I and II and 3.5 hours in Grades III to V. A large majority of Government schools continues to function on a double shift system.
The evaluation also identifies important changes in classroom practices in both GPS and RNGPS in comparison with the findings of the Primary School Performance Monitoring Project at the start of the new Millennium. While a teacher-centred approach still predomi-nates, teachers’ attitudes towards the children appear to have changed: there is more emphasis on children’s engagement in the class, there is more support for children who have questions, and a lower incidence of physical or verbal abuse. At the same time, teaching remains highly textbook and memorisation focused – also in BRAC schools. Further changes in classroom teaching and learning practices – away from the traditional lecture approach – will take time to materialise. Factors identified that continue to hamper such a move include: (i) high student-teacher ratios (except in the case of BRAC and to a certain extent also RNGPS); (ii) the quality of the teacher training, which does not encourage teachers to actually apply more student-centred learning approaches. Proposed changes to make the teacher training curriculum more relevant and practical have failed to materialise; (iii) few changes made to the overloaded national curriculum and associated textbooks; and (iv) an assessment system, including the end of primary school completion examination that was introduced in 2009, which is primarily based on recalling facts from the textbooks. Curriculum, textbooks and assessment remain issues to be addressed with vigour.
Primary school completion rates are also improving – up from 53% of the children in 2000 to some 74% in 2008. This completion rate is, however, only reached around age 14 and only 10% manages to complete primary school by the intended age of 10 as a result of: (i) the high rate of delayed enrolment, and (ii) the fact that many children take around eight rather than five years to complete the primary education cycle. Moreover, around 20% never appears to complete primary school. Delayed enrolment has furthermore important repercussions in terms of increased opportunity costs and higher chances of children drop-ping out before they have completed the primary cycle – because they have to work, in the
VKB041-1 283324_B85_BW v5.indd 20 10-10-11 09:55

The two-pronged approach: Evaluation of Netherlands support to primary education in Bangladesh
| 21 |
case of boys, and because they are told to get married in the case of girls. Substantial age differences in the classroom also have consequences for the teaching and learning process. Against the background of a standard national curriculum and standard textbooks, these differences require close attention.
CAMPE data for 2002 and 2008 show an increase in learning achievements among Grade V students. This is the case for students at both GPS and RNGPS (under PEDP-II) as well as for non-formal schools, with children in non-formal schools outperforming children at GPS and RNGPS and children at GPS performing better than their peers at RNGPS. These differ-ences in performance are also evident from the results of the examination that was held in 2009, with 98% of the children from BRAC schools passing, which is above the levels of both GPS and RNGPS. The same data indicate that students at the different madrasah schools – where also school attendance lags behind the reported average – score well below the national figures. In view of the increased enrolment at these madrasahs this is a major concern that needs further analysis.
The above-mentioned performance of children from BRAC schools reconfirms the relevance of support for BRAC’s non-formal primary education programmes. The BRAC experience shows that, at a time when Government is shaping its own education system, it is possible to provide non-formal education through NGOs that is less costly, takes less time than formal education, and yields good results in terms of learning outcomes. Sustainability of this external support for non-formal education initiatives remains, nevertheless, a key concern.
Overall, the regression analysis confirms earlier findings as regard improvements in learning but remains somewhat inconclusive with regard to the determinants of these improvements. This is caused by the data issue referred to above and the fact that a programme like PEDP-II was rolled out centrally and not phased, making it difficult to establish a proper counterfactual. The regression analysis nevertheless shows that student performance in primary education is correlated with a range of child and household charac-teristics, such as the child’s gender and health status, household income, the area in which children live, as well as the parents’ educational background and occupation. Increased income translates into more time spent studying outside school (with study replacing work, especially for boys) and increased resources available for private tutoring. Unexpectedly, there are no significant correlations between test scores and facilities of the school or teacher characteristics. This might be attributed to the low number of contact hours in the vast majority of primary schools and the significant positive effect of private tutoring.
Private tutoring, as in other countries (e.g. Egypt), has been on the rise for several years and concerns about two thirds of all children enrolled in primary school, with 42% getting such tutoring at a fee. At the same time, in conjunction with the introduction of the end of primary examination, coaching classes were introduced at many schools. The increase in private tutoring is an indication of parents’ interest in the quality of education. However, private tutoring: (i) tends to favour boys, thus contributing to unequal performance of male and female students; (ii) has negative equity implications, as the rich are in a position to pay for more time and better tutoring for their children, and; (iii) may risk to become an excuse
VKB041-1 283324_B85_BW v5.indd 21 10-10-11 09:55

| 22 |
for slack performance of teachers, who are also providing tutoring to the very same pupils. Private tutoring remains an issue that may affect incentives for further improving primary education quality and equity in Bangladesh.
The analysis shows that an active School Management Committee (SMC) has considerable impact on student attendance and learning outcomes. Indications are that the functioning of the SMCs has improved somewhat, possibly as a result of training provided under PEDP-II and other programmes.
One of the key aims of the ‘two-pronged approach’ has been to improve relationships between government and NGO-providers in the education sector. The evaluation shows that there are some indications of improvement, though Government still views BRAC as an alternative education provider serving poor students only: BRAC pre-primary schools operate next to and feed into GPS schools, with the Government providing free textbooks to NGO schools that follow the national curriculum, and with children from selected NGO schools – including those of BRAC and FIVDB – having been allowed to compete in the 2009 examination. At the same time, there has been little spill over of innovations between the govern-ment primary system and the non-formal system of BRAC, though informal exchanges have taken place. This modest success has been mainly achieved through the bridging function played by the local NGO CAMPE that has been supported by the Netherlands since 2002. Moreover, its Education Watch publications have been one of the few consistently reliable sources of information on the state of primary education in Bangladesh.
Efficiency7The evaluation shows that the Netherlands, while advocating for a sector-wide approach since the mid-1990s, only became involved in providing sub-sector budget support for primary education in Bangladesh when: (i) both Government and other key donors (Asian Development Bank, the World Bank, DFID) were convinced that the project-based approach to aid was indeed ineffective, and (ii) when it was evident that concerns with respect to the high level of corruption in Bangladesh could be effectively addressed. The Netherlands embassy has played a pivotal role in different forums for consultations with Government and among members of the donor community, in the adoption of a Code of Conduct or ‘gentleman’s agreement’ for PEDP-II governance and in vigorously addressing some rela-tively modest fiduciary issues that have come up in the course of PEDP-II implementation. This role has found broad recognition.
The Government’s primary education system provides access for many children at low cost. This continues to be achieved by large class sizes and low teaching hours, with some 80% of government schools still operating in double shifts. It is however less efficient when it comes to years spent to complete the primary education cycle of five years – i.e. an
7 Efficiency can be defined as ‘a measure of how economically resources/inputs (funds, expertise, time, etc.) are converted into results’ (OECD/DAC, 2002, Glossary of key terms in evaluation and results based management). In this evaluation efficiency refers to the way in which Netherlands support to basic education is provided, focusing on the support to the PEDP-II and what have been the financial and institutional issues related to the Government’s education system.
VKB041-1 283324_B85_BW v5.indd 22 10-10-11 09:55

The two-pronged approach: Evaluation of Netherlands support to primary education in Bangladesh
| 23 |
average of eight years. Compared to this, BRAC schools are particularly efficient with their low drop out and high completion rates, with per student costs (ranging between US$ 23 and 31 per child per year) that are below the US$ 42 per student at GPS, and with children completing the primary cycle within four to five years. It is worth noting in this respect that – despite concerns expressed about the efficient use of resources and irregularities in public spending – there is very little evidence of government spending not being used for the intended purposes. Leakage does not appear to be significant. Teacher absenteeism appears substantial, though most absences, primarily for training, are officially sanctioned by the authorities. Recent reports of Transparency International Bangladesh also show important improvements with respect to informal payments that were demanded from parents.
One of the reasons for providing sector support through basket funding of PEDP-II was that it would reduce transaction costs for both Government and donor community. The evalu-ation finds that these costs were indeed reduced for the Government but that this is still to materialise for the donors. Like other donor representatives, the Netherlands embassy was frequently drawn into discussions around programme implementation and manage-ment in the absence of an agreement of division of labour within the donor community. Progress has been made with regard to streamlining audit procedures. However, a number of different procurement procedures are still followed and the move to harmonise finan-cial management procedures has been only partially successful at the cost of delays in implementation.8
The limited institutional capacity of the Government system has shown to be another factor prompting considerable donor involvement in PEDP-II management. The evaluation shows that in terms of institutional development of the Government’s education system progress has been slow. Progress has been affected by: (i) the absence of a realistic assessment of the limited institutional capacity of MoPME and DPE in the preparations for PEDP-II, and (ii) insufficient attention for the bureaucratic environment in which MoPME and DPE operate, in particular the role of the Ministries of Finance and the Establishment Commission. As a result, and despite MoPME’s repeated assurances, this has implied that a ‘teaching cadre’ that would regulate, amongst others, teacher incentives and rewards for performance and promotion, is still not in place. Frequent staff changes in the course of programme imple-mentation have affected institutional development as well.
Key outstanding issues with respect to institutional capacity furthermore relate to: (i) the importance of strengthening the social accountability of school and local education authorities for results-based performance, including regular performance assessment for greater transparency and improved oversight by community, parents, and other education stakeholders, and (ii) forging a better public-private partnership between the Government and NGOs. The evaluation confirms that in programming sector aid attention is warranted for the actual responsibilities of the Government bodies that are expected to steer education sector programmes and reforms and their capability to assume these responsibilities. It underlines the need for: (i) carrying
8 See also: Bernard Wood et al. (2011). Final Report on the Evaluation of the Paris Declaration, DIIS: Copenhagen.
VKB041-1 283324_B85_BW v5.indd 23 10-10-11 09:55
| 24 |
out an institutional assessment and proposing appropriate measures to timely address existing capacity constraints at all levels of the education system and (ii) early identification of issues that are beyond the remit of the education ministry – good examples being education finance and (decentralisation of ) educa-tion management – that need to be addressed in consultation with other Government institutions.
While monitoring of PEDP-II has improved and annual sector performance reports have been produced since 2008, the system of education data collection and analysis is frag-mented and, regrettably, does not generate the necessary information on the primary education sector as a whole. Like elsewhere, education sector policy making and management in Bangladesh requires integrated, reliable and up-to-date data sets that cover the entire primary educa-tion system, both formal and non-formal and including primary education provided at the different types of madrasahs. This will allow: (i) analysis of the interactions taking place between the different types of schools – also in relation to the issue of dropouts; (ii) keeping an eye on the rapidly increasing enrolment in the madrasahs, where the quality of education is below that of other types of schools. Future efforts in this area will require close cooperation between MoPME and the Ministry of Education (MoE) as well as between Government and NGO sector and the Madrasah Education Board. There also remains a need for sufficient numbers of dedicated staff to handle data collection and analysis and for streamlining of data flows.
Sustainability9There appears to be a strong societal demand for good quality primary education – as is evidenced by the private costs incurred for primary education. Moreover, primary education appears to have considerable economic and social returns, especially for women. However, further study on the returns to education is required since a majority of the population does not participate in the formal economy.
With stronger economic growth in the foreseeable future, the demand for a literate and numerate work force is likely to accelerate. Further improvement in the quality of primary educa-tion and the internal efficiency of the primary education system is needed for economic growth and educa-tional progress to be mutually reinforcing. It is worth noting in this respect that, independent of their political signature, successive governments of Bangladesh have committed themselves to the EFA goals and the MDGs. Annual expenditures on education have increased in real terms from US$ 205 million in 2000 to US$ 777 million in 2008, primarily as a result of GDP growth. As a percentage of GDP, however, they have remained still fairly modest: 2.3% in 2000 and 2.4% in 2008. This is low compared to other Asian countries, especially since a major part of MoPME’s recurrent budget is devoted to teacher salaries. Moreover, while the Government has sufficient funds to sustain the current level of primary education, with the expansion of access to secondary education, the share of the budget for primary education has fallen from 43% in 2000 to 41% in 2008. This decline is understandable with larger numbers of children who have completed primary education and want to enrol in
9 Defined as ‘’the continuation of benefits from a development intervention after major development assistances has been completed’ (OECD/DAC, 2002, Glossary of key terms in evaluation and results based management). Focus is in this evaluation on an assessment of the financial and institutional capacity of the education system to function in the longer run.
VKB041-1 283324_B85_BW v5.indd 24 10-10-11 09:55

The two-pronged approach: Evaluation of Netherlands support to primary education in Bangladesh
| 25 |
secondary education. Moving forward, it is important for the Government to thoughtfully keep a good balance between the continuing financial needs of primary education and the growing emerging demands of secondary education. Failure to maintain financial balance could raise the risk of creating serious distortions in the allocation of education outcomes and hinder educational careers.
A key question is whether the Government’s future revenue budget will be sufficient to finance the increase in recurrent expenditure (in terms of e.g. salaries, maintenance and operational costs of infrastructure, etc.) that is expected from the investments made under PEDP-II. Catering to more children and addressing the hardcore out of school, has implica-tions for the budget as well. Whether the revenue budget can expand to fulfil these needs is an important question. In the short to medium term, indications are that donor funding will continue – with the exception of the Netherlands – and commitments have already been made to the follow-on programme to PEDP-II. However, in the long term, it is evident that the Government will need to raise more revenue to meet the increasing costs of primary education service delivery. The main constraint for further increases in public sector funding of education is the very low share of public expenditure in GDP (only 9%) as a result of a domestic tax system that is insufficiently developed. With a comparatively small tax burden and a tax system that is not working properly, and the comparatively modest share of GDP and public expenditure going to education, Bangladesh still requires a high claim of donor funding.
Major part of funding for all NGO programmes comes from external sources such as the Netherlands – without this funding some of the programmes would be unable to run. With regard to BRAC, the investments make sense for the medium term as it is unlikely that the Government system will be able to expand to such an extent that it can effectively absorb the nearly one million children that go to the BRAC schools. At the same time, it has been observed that BRAC is apparently finding it increasingly difficult to identify sufficiently large groups of out of school children between the ages of 8 and 10. This could indicate that chil-dren are increasingly attending government-subsidised schools, or, alternatively, increas-ingly find their way into the madrasah system. This evidently needs further investigation together with the development of alternative future funding scenarios.
As mentioned above, the education system of Bangladesh continues to be hampered by restrained institutional capacity at all tiers and in key areas. Addressing these constraints is needed if the primary education system is to further develop and improve.
VKB041-1 283324_B85_BW v5.indd 25 10-10-11 09:55

1
Research questions and methods
VKB041-1 283324_B85_BW v5.indd 26 10-10-11 09:55

| 27 |
The two-pronged approach: Evaluation of Netherlands support to primary education in Bangladesh
1.1 Research questions
The objective of this evaluation is to evaluate the relevance, effectiveness, efficiency, and sustainability of the Netherlands’ support to formal and non-formal primary education in Bangladesh in the period 1999-2009.
The following main research questions have guided the evaluation:
• What have been the key characteristics (in terms of aid modalities, institutions supported and themes covered, as well as cooperation and alignment) of Netherlands support for the education sector and what has been the rationale behind its portfolio?
• Did increased Government and NGO funding for primary education result in an efficient and equitable distribution of education inputs (schools, trained teachers, learning materials, etc.)?
• What has been the effectiveness of the supported education interventions in terms of access and attainment and enhanced quality of the primary education provision?
• What is the likelihood of future institutional and financial sustainability of the results accomplished?
In line with the IOB evaluations of primary education in Uganda and Zambia as well as Elbers et all (2009),10 the evaluation does not follow the Dutch Euro but primarily concerns the second Primary Education Development Programme (PEDP-II) and the BRAC education programme as a whole. It does not make a distinction between the resources stemming from the Netherlands, the Government or BRAC and other donors. Like in these other IOB evaluations, focus is on the efficiency and effectiveness of interventions in primary educa-tion co-financed by the Netherlands and their contribution to the improvement of access, equity and learning achievement as the main outcome variables.
The intervention logic that is at the basis of the evaluation is depicted in Figure 1.1. It distinguishes the influence of both school supply factors – in terms of school infrastructure, management, teaching and learning materials and teachers – and of factors related to the students and their background.
10 Ministry of Foreign Affairs, IOB Impact Evaluation No. 311, Primary Education in Uganda, April 2008; Ministry of Foreign Affairs, IOB Impact Evaluation No. 312, Primary Education in Zambia, April 2008; and Elbers, Chris, Gunning, Jan Willem and Kobus de Hoop (2009). Assessing Sector-wide Programs with Statistical Impact Evaluation: A Methodological Proposal. World Development, 37 (2): pp. 513–520.
VKB041-1 283324_B85_BW v5.indd 27 10-10-11 09:55

Research questions and methods
| 28 |
Figure 1.1 Intervention logic
INTERVENTIONS BY GOVERNMENT, NGOS AND DONORS• Educationsectorpolicy(PEDP-IIpolicyframework;I-PRSP;BRACpolicy)•Budget• Implementationarrangements(MoPMEandDPEsystem;BRACsystem)
SCHOOL CHARACTERISTICS• Ownership• Fundingsource• Schoolfees• Civilsociety
engagement (community and SMC)
• Schooltype/grade• Location/
Distance
Independent of policy
SCHOOL INFRASTRUCTURE AND RESOURCES• Classrooms
(condition and type)
• Useschoolresources (computers, health programmes, meals, stipends)
• Watersources• Sanitation
MANAGEMENT• Teacher
support, inspection and supervision
• Curriculummanagement
• Qualificationshead teacher
TEACHING MATERIALS• Usetextbooks
and teacher manuals
• Languageofinstruction
• Classperiods/contact hours
TEACHERS• Numbers(m/f)• Educationlevel• Responsibilities• Salaryscaleand
other incentives• Competence/
knowledge• Qualification/
Training and re-training
• Teacherabsenteeism
• Non-teachingstaff
PRIMARY SCHOOL RELEVANCE AND QUALITY
ACCESS/ATTAINMENT• Enrolmentrate• Survivalrate• Completionrate• Dropoutrate• Repetitionrate• Genderandsocio-economic
equity• Absenteeism/attendance
LEARNING ACHIEVEMENT• Literacy• Numeracy• Science• Lifeskills• Testscores• Furthereducation
PUPIL, HOUSEHOLD and COMMUNITY CHARACTERISTICS• Gender• Age• Parents• Welfare/resourcesandsources
of income• Educationmotherandfather• Language• Location• Privateeducationexpenditure
(tutoring, teaching and learning materials, etc.)
WELFARE OUTCOMES(health, employment, socio-economic status, etc.)
VKB041-1 283324_B85_BW v5.indd 28 10-10-11 09:55
The two-pronged approach: Evaluation of Netherlands support to primary education in Bangladesh
| 29 |
1.2 Quantitative data and data limitations
The evaluation is based on an analysis of the following sources of quantitative data.
Annual school census as the main source of data on the formal education system. The census is carried out by the Department of Primary Education (DPE) and held among over 75,000 formal schools. Data are used from the 2001, 2005 and 2009 rounds. The survey includes questions on enrolment, repetition, teacher qualifications and school infra-structure. The census does not include information on schools that are outside the formal system – thus excluding non-formal NGO schools, including those of BRAC – while data on madrasah education is neither complete nor up-to-date. Still, the data has been used for identifying trends in the number of government subsidised schools and other inputs as well as computing enrolment figures. BRAC administrative data was provided on the supply of BRAC schools and enrolment by upazila in 2000, 2005 and 2009.
Household Income and Expenditure Survey (HIES), conducted by the Bangladesh Bureau of Statistics (BBS) in cooperation with the World Bank, and available for 2000 and 2005 only.11 The HIES is conducted on a nationally representative sample (some 7,500 households in 2000 and 10,000 in 2005) and collected, among others, information on school enrol-ment and grade completion for all types of schools. As the HIES is a household survey it includes all school types and figures are not distorted by children moving between different types of schools. This is not the case for other sources, including the school census, which do not follow whether a child has registered in another school and consider it as having dropped out of primary education. The HIES makes it possible to compute enrolment and completion figures not only on a national level, but also for different income quintiles and areas (districts and urban versus rural). At the same time, the usefulness of the most recent HIES (2005) in measuring impact of PEDP-II is limited as the Programme had barely started at the time of the survey.
Multiple Index and Cluster Survey (MICS), a national representative household survey conducted every three years by BBS together with UNICEF.12 The MICS focuses mainly on women and children and collects data about health and education with limited socio-economic information. On education, the MICS includes enrolment, attendance and completion figures. Data on drop-out and repetition could not be reconciled with the completion rates, which suggest higher drop-out rates in each grade. As mentioned in the Bangladesh Primary Education Annual Sector Performance Report 2010 (GoB, 2010), this points to parents wrongly reporting, mistakenly or deliberately, in what grade their children were
11 At the time of the evaluation, the results and raw data of the 2010 HIES were not available. It was intended to use these data for an analysis of determinants for education access. A regression using 2000 and 2005 HIES data was therefore performed instead. However, this did not lead to robust results. Applying a total programme effects model to explain the impact of PEDP-II, which started end 2004, was not possible on the basis of the 2000 and 2005 HIES data as this model does not permit extra-polation of findings for the years 2005-2009.
12 The MICS 2006 covered some 62.4 thousand households (MICS, 2006), the MICS 2009 covered close to 300 thousand households (MICS, 2009).
VKB041-1 283324_B85_BW v5.indd 29 10-10-11 09:55

Research questions and methods
| 30 |
enrolled in the previous school year. The most recent full data set available is from the MICS 2006; the raw data of the MICS 2009 were not available for additional analysis at the time of the evaluation. Figures from the MICS 2009 report have nevertheless been used for purposes of presentation.
Education Watch surveys carried out annually by CAMPE on a specific theme related to primary or secondary education, e.g. education quality in 2000 and 2008 and education finance in 2007. To assess changes in the level of educational attainment, CAMPE conducted the same assessment in 2000 (2,509 students in 186 schools) and 2008 (7,093 Grade V students in 440 schools). In addition to Government Primary Schools (GPS) and Registered Non-Governmental Primary School (RNGPS),13 the CAMPE surveys also covered ebtedayee madrasahs, non-formal schools – which include the BRAC schools – as well as primary schools attached to high schools or high madrasahs. This made a comparison of test results across different school types possible.14
As is recognised in several sources,15 the validity of data provided in either household surveys and data generated by the Government continues to be troublesome and data could be biased. Issues in this respect include: (i) the lack of appropriate birth registration and birth records; (ii) a fragmented system of data collection, recording and analysis which is not consistent e.g. with respect to the definitions of different school types or income cate-gories, and; (iii) the likelihood of incentives to inflate data on enrolment and attendance (e.g. in relation to the primary school stipend) in school records (and subsequently national education data). In view of this state of affairs, different data and different data sources have been compared as appropriate to ensure sufficient triangulation.
1.3 Measuring changes in education quality
1.3.1 Quantitative researchSince the first nation-wide end of primary school examination was held in 2009, it was not possible to use it to compare learning achievements over time. The results of this examina-tion are therefore mainly used for a presentation of achievements and the examination process as such (see chapter 7).
At the same time, student assessments were carried out in a representative sample of GPS and RNGPS to test skills in Bangla and mathematics among Grade III and Grade V students.
13 GPS are fully financed by the Government, while RNGPS are ‘privately operated but heavily subsidized’ (World Bank, 2008b). Currently, the Government provides 90% support in case of the RNGPS to meet teachers’ monthly salaries and limited allowances (house rent, etc.). Both use the national curriculum and are provided with textbooks by the Government free of charge. While initially teacher recruitment for RNGPS was done by the schools, this is no longer the case and also RNGPS teachers are recruited centrally. On this topic, see further section 5.2.1.
14 Since the schools covered in 2000 were not the same as in the 2008 survey, regression over time, comparing 2000 and 2008 was not possible
15 See for example Manzoor and Hossain (2010).
VKB041-1 283324_B85_BW v5.indd 30 10-10-11 09:55
The two-pronged approach: Evaluation of Netherlands support to primary education in Bangladesh
| 31 |
The assessments were done under the aegis of the Government in 2002 and 2008. In addi-tion to the student assessment, data was collected on characteristics of the schools and teacher qualifications. However, they were done in different schools and used different tests, which did not permit comparing the results of the two years. To compare the rela-tive difficulty of the two tests in both subjects, a pilot was done within the framework of this evaluation. However, this did not lead to sufficiently reliable and credible results. Henceforth, the evaluation relied on the results of the tests that were conducted by CAMPE in 2000 and 2008 among Grade V students from different types of schools.
CAMPE 2008 assessment data was also used to undertake a statistical analysis of the rela-tionship between student achievements on the tests and different types of inputs – ranging from school-based inputs to student characteristics. Since the CAMPE assessment includes information on the students’ background it was possible to correct for student background at the student level.
The model used can be written as:
score5ij = Zijγ + Xjβ + εij
where:
i denotes the student,
j denotes the school,Z is a vector of student characteristics as depicted in Figure 1.1 under ‘Pupil, household and
community characteristics;X is a vector of school and teacher characteristics as depicted in Figure 1.1 under ‘School
characteristics’, ‘School infrastructure and resources’, ‘Management’, ‘Teaching materials and ‘Teachers’, and;
ε is an error term.
In estimating the model we have allowed for a correlation of the errors between students in the same school. Descriptive statistics for the variables included in the model, the results of the statistical analysis and the analysis thereof are presented in chapter 7.
1.3.2 Qualitative researchQualitative research was an integral part of the evaluation to collect information on the functioning of primary education, to feed the quantitative research and support the analysis of its findings.
Qualitative research first of all comprised key informant interviews with stakeholders engaged in education. These interviews were semi-structured and were held with repre-sentatives of the MoPME and DPE, other Government institutions, the Netherlands Embassy and the donor community in Dhaka united in the Education Working group of the Local Consultative Group as well as staff of NGOs, the ILO UIE project and research institutes (see annex 6 for an overview of the interviewees). Triangulation of data from interviews with findings from the use of other evaluation tools was performed. Secondly,
VKB041-1 283324_B85_BW v5.indd 31 10-10-11 09:55

Research questions and methods
| 32 |
a comprehensive review was undertaken of the literature on education development in Bangladesh. An overview of the references used is provided in annex 7. Thirdly, qualitative research was undertaken at school level. This was based on the methodology used for the main qualitative study undertaken at the beginning of the evaluation period: the Primary School Performance Monitoring Project (PSPMP), a 3-year project funded by the Asian Development Bank (ADB) that ran from 1999 to 2001.
Qualitative research was done in four Upazilas in two purposively selected districts in two divisions, i.e. Sunamganj in Sylhet division in the north east and Bogra in Rajshahi divi-sion in northwest Bangladesh. Both districts have medium to high incidence of poverty according to the poverty maps of BBS.16 At the same time, when considering indicators from the MICS 2009 study related to health, education and water and sanitation, Bogra performs considerably better than Sunamganj. Moreover, Bogra has relatively good communication while this is poor in Sunamganj due to the large expanses of wetlands. Differences and similarities have allowed for a comparison between the districts. Within the two districts, 25 schools were included, 8 GPS and 8 RNGPS, 5 BRAC primary schools, 2 BRAC pre-primary schools and 2 FIVDB schools (see Table 1.1). The schools were selected by government officials and BRAC staff who generally responded to the request to select good and less good schools. One limitation was that the team could not access very remote areas due to weather conditions. However, discussions with local level officials provided information about the challenges of these areas.
16 The maps are based on the HIES survey of 2005 and can be found at http://www.bbs.gov.bd/dataindex/povertymb.pdf
VKB041-1 283324_B85_BW v5.indd 32 10-10-11 09:55
The two-pronged approach: Evaluation of Netherlands support to primary education in Bangladesh
| 33 |
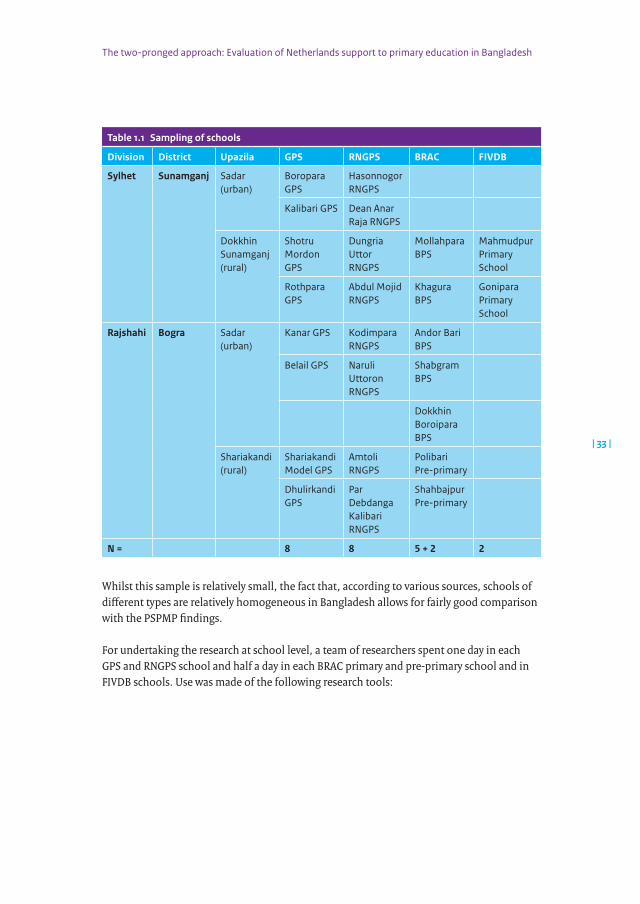
Table 1.1 Sampling of schools
Division District Upazila GPS RNGPS BRAC FIVDB
Sylhet Sunamganj Sadar (urban)
Boropara GPS
Hasonnogor RNGPS
Kalibari GPS Dean Anar Raja RNGPS
Dokkhin Sunamganj (rural)
Shotru Mordon GPS
Dungria Uttor RNGPS
Mollahpara BPS
Mahmudpur Primary School
Rothpara GPS
Abdul Mojid RNGPS
Khagura BPS
Gonipara Primary School
Rajshahi Bogra Sadar (urban)
Kanar GPS Kodimpara RNGPS
Andor Bari BPS
Belail GPS Naruli Uttoron RNGPS
Shabgram BPS
Dokkhin Boroipara BPS
Shariakandi (rural)
Shariakandi Model GPS
Amtoli RNGPS
Polibari Pre-primary
Dhulirkandi GPS
Par Debdanga Kalibari RNGPS
Shahbajpur Pre-primary
N = 8 8 5 + 2 2
Whilst this sample is relatively small, the fact that, according to various sources, schools of different types are relatively homogeneous in Bangladesh allows for fairly good comparison with the PSPMP findings.
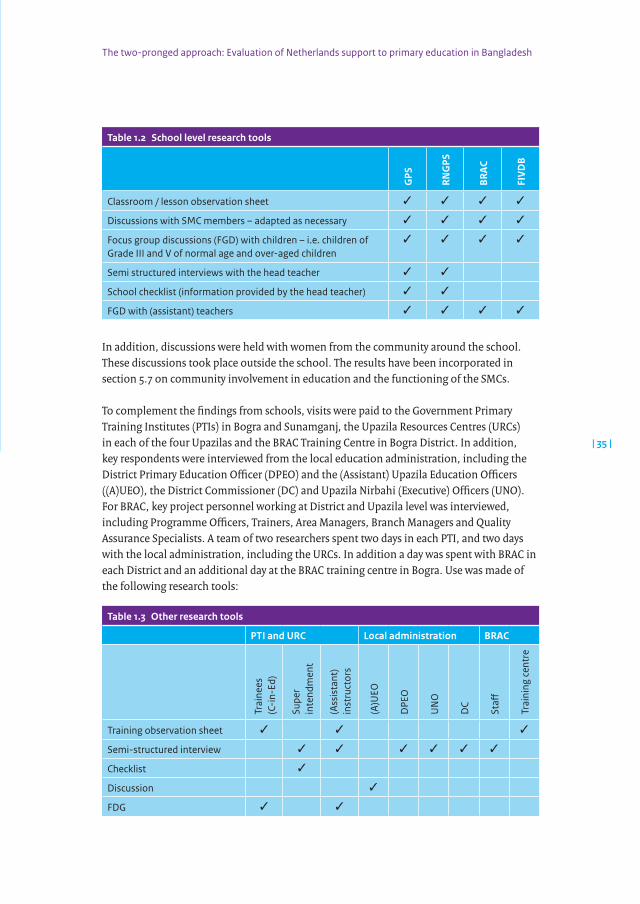
For undertaking the research at school level, a team of researchers spent one day in each GPS and RNGPS school and half a day in each BRAC primary and pre-primary school and in FIVDB schools. Use was made of the following research tools:
VKB041-1 283324_B85_BW v5.indd 33 10-10-11 09:55
Research questions and methods
| 34 |
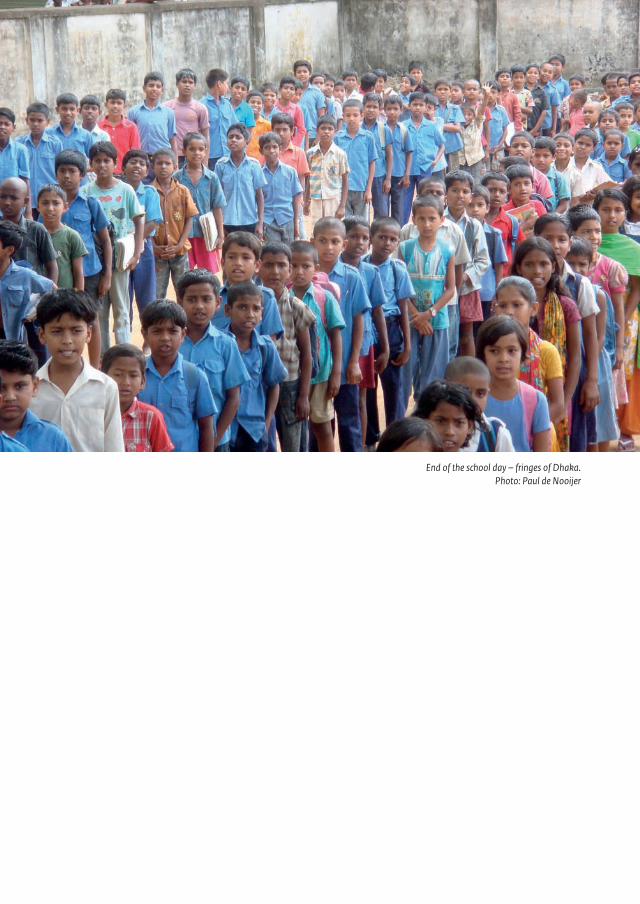
End of the school day – fringes of Dhaka. Photo: Paul de Nooijer
VKB041-1 283324_B85_BW v5.indd 34 10-10-11 09:55
The two-pronged approach: Evaluation of Netherlands support to primary education in Bangladesh
| 35 |
Table 1.2 School level research tools
GPS
RNG
PS
BRA
C
FIV
DB
Classroom / lesson observation sheet ✓ ✓ ✓ ✓
Discussions with SMC members – adapted as necessary ✓ ✓ ✓ ✓
Focus group discussions (FGD) with children – i.e. children of Grade III and V of normal age and over-aged children
✓ ✓ ✓ ✓
Semi structured interviews with the head teacher ✓ ✓
School checklist (information provided by the head teacher) ✓ ✓
FGD with (assistant) teachers ✓ ✓ ✓ ✓
In addition, discussions were held with women from the community around the school. These discussions took place outside the school. The results have been incorporated in section 5.7 on community involvement in education and the functioning of the SMCs.
To complement the findings from schools, visits were paid to the Government Primary Training Institutes (PTIs) in Bogra and Sunamganj, the Upazila Resources Centres (URCs) in each of the four Upazilas and the BRAC Training Centre in Bogra District. In addition, key respondents were interviewed from the local education administration, including the District Primary Education Officer (DPEO) and the (Assistant) Upazila Education Officers ((A)UEO), the District Commissioner (DC) and Upazila Nirbahi (Executive) Officers (UNO). For BRAC, key project personnel working at District and Upazila level was interviewed, including Programme Officers, Trainers, Area Managers, Branch Managers and Quality Assurance Specialists. A team of two researchers spent two days in each PTI, and two days with the local administration, including the URCs. In addition a day was spent with BRAC in each District and an additional day at the BRAC training centre in Bogra. Use was made of the following research tools:
Table 1.3 Other research tools
PTI and URC Local administration BRAC
Trai
nees
(C
-in-
Ed)
Supe
r in
tend
men
t
(Ass
ista
nt)
inst
ruct
ors
(A)U
EO
DPE
O
UN
O
DC
Staff
Trai
ning
cen
tre
Training observation sheet ✓ ✓ ✓
Semi-structured interview ✓ ✓ ✓ ✓ ✓ ✓
Checklist ✓
Discussion ✓
FDG ✓ ✓
VKB041-1 283324_B85_BW v5.indd 35 10-10-11 09:55

2
Context
VKB041-1 283324_B85_BW v5.indd 36 10-10-11 09:55
| 37 |
The two-pronged approach: Evaluation of Netherlands support to primary education in Bangladesh
2.1 Introduction
This chapter pictures first of all the general context and focuses on those factors which influence education in Bangladesh, including the economic context, the extent of poverty, and health, particularly in relation to children. Secondly, some education statistics are provided on the years preceding the evaluation period; more recent data is found in the chapters 5 to 7. This is followed by an overview of the current primary education system in Bangladesh. It includes short descriptions of the second Primary Education Development Programme (PEDP-II) and BRAC’s main education initiatives as supported by the Netherlands. The chapter finishes with a summary of the key constraints experienced in primary education at the start of the evaluation period.
2.2 General context
Bangladesh is a relatively new country, formed after gaining independence from Pakistan in 1971. Lying at the delta of three great rivers, the Jamuna (Brahmaputra), the Padma (Ganges) and the Megna, the country is close to sea level and is subject to frequent natural disasters. Much of the country experiences chronic environmental instability, in the form of annual flooding of up to 80% of its land area. Some areas, for example the alluvial islands (chars), coast and a major tectonic depression (hoars), face environmental insecurity, with annual local-level conflicts over the claiming of newly formed or shaped land as it emerges from the receding floodwaters. In northern Bangladesh, an annual period of unemployment and famine (monga) is experienced after the planting of rice paddy (Seel, 2007).
Bangladesh is one of the most densely populated countries in the world, with an average of 1,050 people per square kilometre in 2005 (in contrast, the Netherlands has almost 400 people per square kilometre). Population growth has been some 1.4% over the past decade and currently the population is around 160 million people (see Figure 2.1). Life expectancy at birth is presently 67 years for women and 65 for men. About one third of the population is below 14 years of age (BBS, 2009).
While in 1990 women gave birth to 4.4 children on average, this number almost halved to 2.3 in 2008. This has resulted in a substantial drop in the growth of the school aged popula-tion. BANBEIS reports an estimated 16.4 million primary school aged children in school in 2008. Estimates using census data from 2001 and updates carried out by BBS suggest an average annual growth of the primary school aged population of 1.3%.17
17 According to the Baseline Report of PEDP-II, the total number of new entrants in Grade I numbered 3.9 million children in 2005 (DPE, 2006); in 2007 there were 3.4 million children entering this grade (DPE, 2008).
VKB041-1 283324_B85_BW v5.indd 37 10-10-11 09:55

Context
| 38 |
Infant mortality, under-five mortality and the rate of immunization against measles18 have improved substantially over the period 1991-2009 with a clear trend towards achieving the MDG related to children’s health (GoB, 2009).
Figure 2.1 Bangladesh population, 1960-2009
0
20
40
60
80
100
120
140
160
180
20092005200019951990198519801975197019651960
Year
No.
of p
eopl
e (m
illio
n)
Source: World development indicators
Malnourishment remains however a serious problem and could present a significant obstacle to children’s performance in school.19 In 2008, around 40% of the under-five population was underweight. The trend has been declining since 1990, but since 2003 the decline seems to have stopped and it is still questionable if the target of the MDG, ‘to halve the percentage of underweight children’, will be met.20 Although there is a clear nega-tive relation between income and the incidence of underweight children, almost 30% of
18 Infant mortality is the number of infants that die before the age of one per 1,000 live births. Under-five mortality is the number of children that die before the age of five per 1,000 live births. Immunization against measles is a proxy for the rate of immunization against communicable diseases.
19 On the relationship between health and education see also Pridmore, 2007; Asadullah and Chaudhury, 2008; and Khanam and Nghiem, 2009.
20 The 2008 progress report on the Millennium Development Goals in Bangladesh refers to 43% of underweight children in 2004 and 41% in 2007 (GoB/UNDP, 2008).
VKB041-1 283324_B85_BW v5.indd 38 10-10-11 09:55

The two-pronged approach: Evaluation of Netherlands support to primary education in Bangladesh
| 39 |
the children in the richest quintile21 were also underweight, suggesting other factors are playing an important role (GoB, 2009).22
Administratively Bangladesh is divided into 6 Divisions, Dhaka, Rajshahi, Sylhet, Khulna, Chittagong and Barisal. There are 64 Districts and 481 Sub-Districts or Upazilas. Most people live in rural areas though the proportion is decreasing, from 76.4% in 2000 to 72% in 2009 (World development indicators) as more people move to the cities in search of work and better opportunities. According to UNICEF (2008), the population of slums in 2008 was esti-mated at some 6-7 million, i.e. about 15% of the overall urban population and about 5% of the total population. The population is homogenous, with about 98% Bengali speaking; the remainder are from ethnic minorities, many of whom live in the Chittagong Hill Tracts area which borders Myanmar. Muslims account for nearly 90% of the population and Hindus 9%; the remaining 1% includes Buddhists, Christians and other religions.
Progress with respect to the position of women is impressive as reported by for example the World Bank (2008b). Women and girls are having better access to education, as will be discussed below, and the gender gap with respect to literacy rates has been closing over the past decade though the difference is still 10 percentage points (World development indicators). The female literacy rate increased from 16% in 1981 (BANBEIS, 1987), 41% in 2001 to 50% in 2009 compared to an overall adult literacy rate of 55%.23 In comparison, in 1970, the literacy rate was 11% for adult women and 35% for adult men (Mujeri, 2003). Women’s participation in the formal economy remains low, with only 26% of women participating in paid work (especially in the garments sector). Their participation in government employ-ment has seen some improvement through the setting of quotas for numbers of women in post. This includes targets for 60% of primary teachers and 30% of secondary teachers to be women. According to Al-Sammarai (2006), women have moved out of low productivity and into higher productivity and more skilled occupations, e.g. as teachers, nurses or para-medics in the health sector. Moreover, their wages have grown considerably faster, leading to a substantial narrowing of the gender wage gap, largely because of increased levels of education since 2000.
21 The mean per capita income per month per quintile in US$ equivalent was the following according to the HIES 2005 – poorest: 8, second: 11, third: 14, fourth: 19 and richest: 38. The ranges of per capita income per month per quintile in US$ equivalent were as follows in the same year: poorest: 2-10, second: 10-12, third: 12-16, fourth: 16-23 and richest: 23-454.
22 Factors would include: per capita household food intake; infant feeding practices; maternal schooling and hygiene practices; access to safe drinking water, sanitation and health facilities, quality of village infrastructure and protection against natural disasters (GoB, 2009).
23 Other sources mention a literacy rate for women of 49.1% and 48.6% for men (GoB/UNDP, 2008). ALiteracyAssessmentSurveyconductedwithUNESCOshowsthat33%oftherespondentswerenon-literate, 18% were semi-literate and 49% were literate in 2008.
VKB041-1 283324_B85_BW v5.indd 39 10-10-11 09:55

Context
| 40 |
2.3 Economic context
Though Bangladesh remains a poor country, its Gross Domestic Product (GDP) has been growing steadily since the 1980s. It currently stands at US$ 80.4 billion compared to US$ 60.3 billion in 2005. The annual GDP growth rate averaged 3.2% between 1980 and 1985 and 6.3% between 2005 and 2008. Comparing average growth of 5.8% in Bangladesh in the years 2000-2008 to other countries in the region, only India has experienced a higher average annual growth rate of 7.1% in this period.24 In combination with the decreasing growth of the population, GDP per capita has been growing at a steady pace. GDP per capita was US$ 394 in 2005 and US$ 551 in 2009. This increase, together with stable income inequality, has led to a significant reduction in poverty, i.e. from 50% in 2000 to 40% in 2005 with a similar rate reported for 2007.25 In comparison, Bangladesh’s poverty level was estimated at over 80% at independence in 1971 (GoB, 2009). Available data indicates that not only the percentage of people living below the poverty line has decreased, but also the severity of poverty (World Bank, 2008a). In 2010, Bangladesh ranked 129th on UNDP’s human develop-ment index.
The Gini coefficient26 saw little change and stood at 31 in 2000, 2005 and 2009 (World devel-opment indicators; UNDP Human Development Report, 2009), which is comparable to the Netherlands. There are at the same time considerable regional differences in the level and size of the decline in poverty (see Figure 2.2) as a result of which inequality between regions has increased.
24 Theaveragegrowthrateover2000-2008was3.9%forNepal,4.8%forPakistanand5.2%forSriLanka.25 In comparison, the poverty level was estimated at over 80% immediately after independence in 1971.
OntheissueofpovertyratesinBangladeshseealsoMcLeod(2007).26 The Gini index measures the extent to which the distribution of income (or, in some cases, consumption
expenditure) among individuals or households within an economy deviates from a perfectly equal distribution.ALorenzcurveplotsthecumulativepercentagesoftotalincomereceivedagainstthecumulative number of recipients, starting with the poorest individual or household. The Gini index measurestheareabetweentheLorenzcurveandahypotheticallineofabsoluteequality,expressedasa percentage of the maximum area under the line. Thus a Gini index of 0 represents perfect equality, while an index of 100 implies perfect inequality. The CIA Factbook reports a Gini coefficient of 33.6 for 1996 and 33.2 for 2005.
VKB041-1 283324_B85_BW v5.indd 40 10-10-11 09:55

The two-pronged approach: Evaluation of Netherlands support to primary education in Bangladesh
| 41 |
Figure 2.2 Percentage of people living in poverty by division and at national level, 2000 and 2005
0
10
20
30
40
50
60
NationalSyllhetKhulnaChiagongDhakaBarisalRajshahi
Division
Hou
seho
ld ra
te (%
)
Poverty rate (%) 2005Poverty rate (%) 2000
Source: World Bank, 2008c (using HIES 2000 and 2005)
Rajshahi and Barisal Divisions had the highest percentage of people living in poverty in 2000 and experienced the lowest rate of decline. Khulna even had an increase in the headcount rate of poverty. The highest decline in poverty occurred in Dhaka Division. The incidence of poverty has been higher in rural areas than in urban areas, which moreover saw a higher rate of decline in poverty between 2000 and 2005 due to rapid expansion of the private sector. On average, rural areas did better than urban areas in reducing the depth and severity of poverty, which implies that growth in rural areas was more pro-poor than in urban areas (GoB, 2009). According to the Bangladesh progress report on the Millennium Development Goals of 2008, while one-third of the districts, ‘mostly from the central part of Bangladesh, have already achieved the MDG target’ and decreased their poverty level to less than 30%, ‘most of the coastal districts and districts from the monga (drought)-prone areas (greater Rangpur district)’ still have more than half of their population living below the poverty line (GoB/UNDP, 2008).
Agriculture continues to be the most significant source of economic growth and has a fundamental role to play in the fight against poverty (GoB, 2009). In 2006-2007, agriculture accounted for some 21% of GDP, industry 30% and services 49%. In the same year, the agri-cultural sector employed 48% of the country’s labour force.
VKB041-1 283324_B85_BW v5.indd 41 10-10-11 09:55

Context
| 42 |
2.4 The primary education system
2.4.1 Basic characteristicsPrimary education, comprising Grades I to V and aimed at 6-10 year old children, is the first stage of formal education in Bangladesh. It leads into lower secondary education covering Grades VI to X for 11-16 year old that is concluded with a Secondary School Certificate and then higher secondary education (Grades XI to XII) for 17-18 year old which leads to a Higher Secondary Certificate and finally tertiary education. In addition, many schools have a pre-primary class for 5 year olds.
Bangladesh is characterised by ‘a pluralist system’ of education (Chowdhury et al, 2003; Mushtaque et al, 2003) and primary education is delivered by a wide range of providers from government, NGOs and a very small private sector serving the urban elite.
Government statistics27 include ten types of schools providing primary education. The main types of schools that are considered as ‘government’ provision are the GPS, RNGPS, experimental schools attached to the PTIs, and community schools.28 Data on the enrol-ment in non-formal education and private schools is not included in the Government statistics while information on the madrasah system is incomplete and not up to date (Sabur and Ahmed, 2010). 75% of primary schools (GPS, RNGPS, experimental and community schools) and secondary schools with primary sections receive government funding. 20% are religious schools (including ebtedayee madrasahs and primary sections of higher madrasahs),29 which also receive some government funding, while the remainder includes NGO and private schools. GPS and experimental schools are fully funded by the government whilst RNGPS receives a lower level of funding, mainly in the form of subventions for teachers. The subvention was 90% of the teachers’ salary for most of the period; it increased to 100% in 2009. Community schools are owned by the community and, until 2010, when they started to be treated as RNGPS, government funding was limited. Section 4.2 provides more details on the various school types and the support received from Government.
NGO and private schools do not receive government financing and may follow their own curriculum. Some of the major NGOs in the country offering non-formal educa-tion are BRAC, Proshika, Dhaka Ahsania Mission (DAM), FIVDB, Action Aid and Swanirvar Bangladesh. Some NGOs also provide non-formal secondary and technical and vocational
27 BANBEIS (2008). Until 2004 there were eleven categories including the so-called satellite schools. These schools have ceased to exist.
28 PEDP-II mainly covers these four types of schools (DPE, 2007). 29 Madrasah education was officially introduced in 1882 following the Hunter Education Commission
Report. The public madrasah system comprises: (i) ebtedayee madrasah (primary education); (ii) dakhil madrasah (junior secondary, SSC); (iii) alim madrasah (higher secondary (HSC); and, at higher education level (iv) fazil madrasah and kamil madrasah. Another category are the private madrasahs mostly residential and outside of the remit of the Government. According to MoE data, in 2005, private madrasah education was provided in 6,685 dakhil madrasahs (2.24 million students, over 98.1 thousand teachers), 1,315 alim madrasahs (550.8 thousand students, 25.6 thousand teachers), 1,039 fazil madrasahs (529.9 thousand students, 23.3 thousand teachers) and 172 kamil madrasahs (27.9 thousand students, 4.8 thousand teachers).
VKB041-1 283324_B85_BW v5.indd 42 10-10-11 09:55
The two-pronged approach: Evaluation of Netherlands support to primary education in Bangladesh
| 43 |
education and training (e.g. the Underprivileged Children’s Education Programme (UCEP) and DAM) targeting the urban poor (Islam and Mia, 2007).
Primary education comes under the jurisdiction of the Ministry of Primary and Mass Education (MoPME). The Ministry of Education (MoE) takes responsibility for secondary and higher education, all madrasah education (through the Bangladesh Madrasah Education Board),30 including primary education, as well as for primary sections of mainstream secondary schools. MoPME, as the main decision making body, is in charge of setting primary education policy. Its Directorate of Primary Education (DPE) is responsible for the delivery of primary education, both centrally and through its network of DPEOs, who are responsible for the management of primary education in each of the 64 districts. The DPEOs have a specific responsibility for inclusive education and the UPEP. DPEOs manage teams of (A)UEOs who are responsible for primary education in each of the Upazilas in their respec-tive districts. This includes, particularly for the AUEOs, a responsibility for monitoring and supervision of schools (monitoring about 25-30 schools in a ‘cluster’) and for delivering bi-monthly sub-cluster training to the teachers in this cluster. There is no external school inspection service.
In terms of management, the Government education system is highly centralized with MoPME and DPE determining what happens in schools in terms of curriculum, textbooks, school management and teaching and learning processes. The ultimate responsibility for appointing GPS teachers also lies with DPE centrally. Decision making outside the Ministry in Dhaka tends to be limited to decisions on the transfer of teachers between schools, granting leave to teachers and selection of teachers for in-service training courses.
2.4.2 Government education policiesAccording to Article 17 of the Constitution of 1971, primary education is the responsibility of the State. It states that: ‘The State shall adopt effective measures for the purpose of (a) establishing a uniform, mass-oriented and universal system of education and extending free and compulsory education to all children to such stage as may be determined by law; (b) relating education to the needs of the society and producing properly trained and moti-vated citizens to serve those needs; and (c) removing illiteracy within such time as may be determined by law’ (DPE and MoE, 2004).
Between 1973 and 2001, government education policy was reflected in a series of five year plans. It was also influenced by Bangladesh’s commitment to the outcomes of the World Conference on Education for All (EFA) of 1990 and the Millennium Development Goals (MDGs), including those related to enrolment in primary education (MDG 2) and to educa-tion for girls (MDG 3). The commitment to EFA was renewed at the World Education Forum of April 2000 in Dakar and a second National Plan of Action was developed for the period 2003-2015 as a follow up to the Forum. A key step in the structuring of the education sector
30 This Bangladesh Madrasah Education Board was set up in 1978 and has the following functions as regard to madrasah education: grants affiliations to different levels of madrasahs from ebtedayee to kamil; prescribes syllabi and curricula; conducts public examinations (dhakhil to kamil) and scholarship examinations. (BANBEIS, 2006).
VKB041-1 283324_B85_BW v5.indd 43 10-10-11 09:55
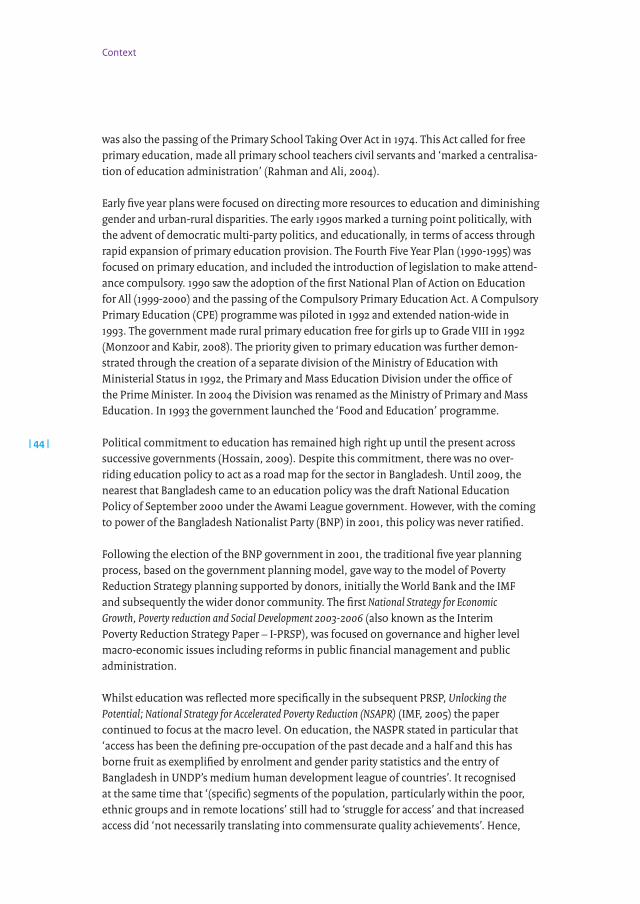
Context
| 44 |
was also the passing of the Primary School Taking Over Act in 1974. This Act called for free primary education, made all primary school teachers civil servants and ‘marked a centralisa-tion of education administration’ (Rahman and Ali, 2004).
Early five year plans were focused on directing more resources to education and diminishing gender and urban-rural disparities. The early 1990s marked a turning point politically, with the advent of democratic multi-party politics, and educationally, in terms of access through rapid expansion of primary education provision. The Fourth Five Year Plan (1990-1995) was focused on primary education, and included the introduction of legislation to make attend-ance compulsory. 1990 saw the adoption of the first National Plan of Action on Education for All (1999-2000) and the passing of the Compulsory Primary Education Act. A Compulsory Primary Education (CPE) programme was piloted in 1992 and extended nation-wide in 1993. The government made rural primary education free for girls up to Grade VIII in 1992 (Monzoor and Kabir, 2008). The priority given to primary education was further demon-strated through the creation of a separate division of the Ministry of Education with Ministerial Status in 1992, the Primary and Mass Education Division under the office of the Prime Minister. In 2004 the Division was renamed as the Ministry of Primary and Mass Education. In 1993 the government launched the ‘Food and Education’ programme.
Political commitment to education has remained high right up until the present across successive governments (Hossain, 2009). Despite this commitment, there was no over-riding education policy to act as a road map for the sector in Bangladesh. Until 2009, the nearest that Bangladesh came to an education policy was the draft National Education Policy of September 2000 under the Awami League government. However, with the coming to power of the Bangladesh Nationalist Party (BNP) in 2001, this policy was never ratified.
Following the election of the BNP government in 2001, the traditional five year planning process, based on the government planning model, gave way to the model of Poverty Reduction Strategy planning supported by donors, initially the World Bank and the IMF and subsequently the wider donor community. The first National Strategy for Economic Growth, Poverty reduction and Social Development 2003-2006 (also known as the Interim Poverty Reduction Strategy Paper – I-PRSP), was focused on governance and higher level macro-economic issues including reforms in public financial management and public administration.
Whilst education was reflected more specifically in the subsequent PRSP, Unlocking the Potential; National Strategy for Accelerated Poverty Reduction (NSAPR) (IMF, 2005) the paper continued to focus at the macro level. On education, the NASPR stated in particular that ‘access has been the defining pre-occupation of the past decade and a half and this has borne fruit as exemplified by enrolment and gender parity statistics and the entry of Bangladesh in UNDP’s medium human development league of countries’. It recognised at the same time that ‘(specific) segments of the population, particularly within the poor, ethnic groups and in remote locations’ still had to ‘struggle for access’ and that increased access did ‘not necessarily translating into commensurate quality achievements’. Hence,
VKB041-1 283324_B85_BW v5.indd 44 10-10-11 09:55

The two-pronged approach: Evaluation of Netherlands support to primary education in Bangladesh
| 45 |
‘a paradigm shift towards a pre-occupation with quality while retaining the focus on equity has thus become an urgent necessity’ (GoB, 2005).
A Non-Formal Education policy framework was adopted in 2006. It defines NFE as ‘a purposeful and systematically organised form of learning that generally occurs outside the formal educational institutions’. It covers early childhood education, non-formal basic education, adult education and continuing education (e.g. post-literacy programmes).
The revised NSAPR II, 2009-2011, approved by the caretaker government in 2008 and revised by the present Awami League Government, continues the focus on economic growth, but is more forthcoming with regard to other goals, including those for education. The need to promote the right sort of education to create a knowledge based society is highlighted together with an acknowledgement that this cannot be achieved by the government alone and that partnerships with NGOs and the private sector are needed. It sets ambitious targets including reaching 100% literacy by 2014 and having all children enrolled in school by 2011. It also suggests that the quality of education has deteriorated, especially in institutions where the children from poor families go. However, it is less forthcoming on how this issue will be addressed.
The Awami League Government also revitalised discussions over education policy. A National Education Policy 2009 was drafted by an Education Commission and adopted by Parliament in June 2010 (IGS, 2011). This will set the direction for future development of the education sector as a whole and is currently informing planning for the successor to PEDP-II, referred to as PROG3 (EKN, 2009a).
2.4.3 Evolutions in education prior to 2000In 1971, independent Bangladesh inherited an out-dated and elitist education system devel-oped by its previous rulers. In 1970, the country had some 29.1 thousand primary schools, of which 9% privately operated, 117.2 thousand teachers, of which 2.2% female, catering for some 5.2 million children of which 32% girls (BANBEIS).
Basic data on the evolution of Bangladesh’s primary education system reveals a dramatic growth in the provision of primary education (see Table 2.1) in the years preceding the evaluation period. As will be shown in chapter 6, this growth has levelled off in the first decade of the new Millennium.
VKB041-1 283324_B85_BW v5.indd 45 10-10-11 09:55

Context
| 46 |
Table 2.1 Evolution of Bangladesh’s primary education system, 19702000
No. of primary schools (000)
No. of pupils (000) %girls
No. of teachers (000)
% female
Pupil teacher
ratioPublic Private Total Total Girls Total Female
1970 26.4 2.7 29.1 5,250.8 1,671.3 31.8% 117.3 2.5 2.2% 44.8
1980 36.6 7.3 43.9 8,219.3 3,011.0 36.6% 174.1 10.8 6.2% 47.2
1990 37.6 9.6 47.2 12,051.2 5,388.7 44.7% 189.5 39.6 20.9% 63.6
2000 37.7 39.1 76.8 17,667.9 8,635.3 48.9% 309.3 104.5 33.8% 57.1
Source: BANBEIS (2011)
Between 1995 and 2001, the average annual increase in the number of teachers and the development of school infrastructure did not keep pace with the rapidly increasing student enrolment. As a result, 95% of the schools operated on a double shift system with limited contact hours: Grade I and II in the morning for 2.5 hours and Grade III to V in the after-noon for 3.75 hours for 6 days per week (ADB, 2000;ADB, 2003a). On an annual basis, actual contact hours in two-shift schools were less than in one-shift schools: about 178 hours less for Grades I and II, and 400 hours less for Grades III – V. Moreover, compared with the required or ideal contact hours, the contact hours in one-shift schools were about 25% less than the ideal, while those in two-shift schools were 45 and 52% less than the ideal for Grade I-II and Grades III-V respectively. Instructional hours were among the lowest in Asia. Schools used a block system for Grades I and II, whereby one teacher teaches a class for all subjects, and a subject-based system for Grades III to V.
According to the HIES of 2005, Bangladesh had achieved a primary school gross enrolment of 91% and net enrolment of 65% by the beginning of the century. Statistics provided by the school census in combination with school age population estimates are higher. Both sources suggest that Bangladesh had achieved gender parity before 2000. Up till 2000, learning outcomes did not keep pace with the large improvements in access. Many of the children that started primary education did not finish the five year cycle. In 1990, 29% of the people older than 15 had completed primary school. This improved slightly to 33% in 2000 (World Bank, 2007). Those who did graduate, completed in more than five years and the skills acquired were low (CAMPE, 2000).
At independence, lower secondary education was provided in some 5.8 thousand schools, of which 97% private, employing 52 thousand teachers (7% women) for around 1.4 million pupils of which 18% girls. Higher secondary education was provided by 7.5 thousand teachers for 300 thousand students (close to 10% girls) in just short of 400 schools. In terms of higher education, in the year preceding independence, Bangladesh counted 6 universi-ties with 26.4 thousand students and 1.4 thousand teaching staff.
Some basic data on the evolution of post-primary education in the period 2000-2008 is provided in Table 2.2.
VKB041-1 283324_B85_BW v5.indd 46 10-10-11 09:55
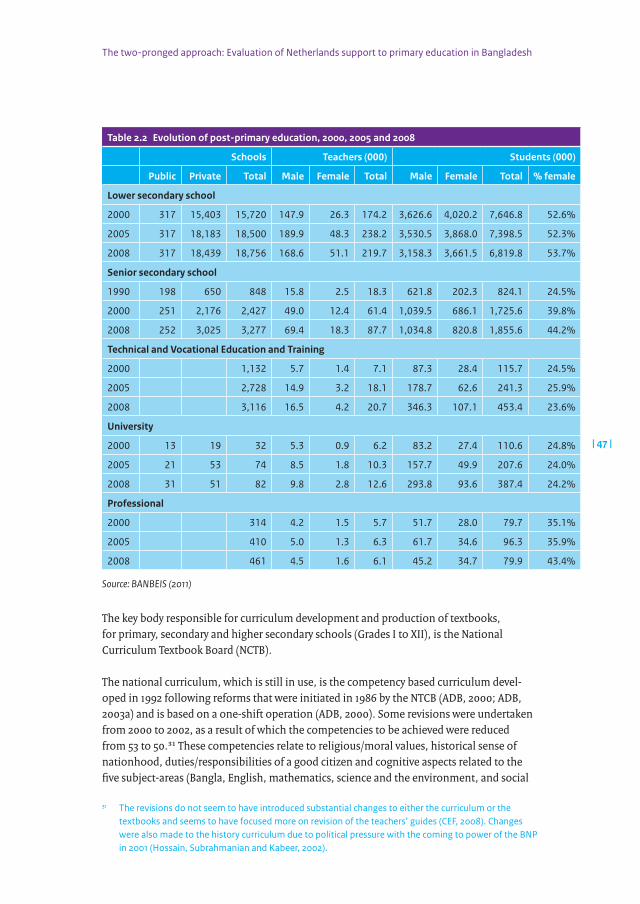
The two-pronged approach: Evaluation of Netherlands support to primary education in Bangladesh
| 47 |
Table 2.2 Evolution of postprimary education, 2000, 2005 and 2008
Schools Teachers (000) Students (000)
Public Private Total Male Female Total Male Female Total % female
Lower secondary school
2000 317 15,403 15,720 147.9 26.3 174.2 3,626.6 4,020.2 7,646.8 52.6%
2005 317 18,183 18,500 189.9 48.3 238.2 3,530.5 3,868.0 7,398.5 52.3%
2008 317 18,439 18,756 168.6 51.1 219.7 3,158.3 3,661.5 6,819.8 53.7%
Senior secondary school
1990 198 650 848 15.8 2.5 18.3 621.8 202.3 824.1 24.5%
2000 251 2,176 2,427 49.0 12.4 61.4 1,039.5 686.1 1,725.6 39.8%
2008 252 3,025 3,277 69.4 18.3 87.7 1,034.8 820.8 1,855.6 44.2%
Technical and Vocational Education and Training
2000 1,132 5.7 1.4 7.1 87.3 28.4 115.7 24.5%
2005 2,728 14.9 3.2 18.1 178.7 62.6 241.3 25.9%
2008 3,116 16.5 4.2 20.7 346.3 107.1 453.4 23.6%
University
2000 13 19 32 5.3 0.9 6.2 83.2 27.4 110.6 24.8%
2005 21 53 74 8.5 1.8 10.3 157.7 49.9 207.6 24.0%
2008 31 51 82 9.8 2.8 12.6 293.8 93.6 387.4 24.2%
Professional
2000 314 4.2 1.5 5.7 51.7 28.0 79.7 35.1%
2005 410 5.0 1.3 6.3 61.7 34.6 96.3 35.9%
2008 461 4.5 1.6 6.1 45.2 34.7 79.9 43.4%
Source: BANBEIS (2011)
The key body responsible for curriculum development and production of textbooks, for primary, secondary and higher secondary schools (Grades I to XII), is the National Curriculum Textbook Board (NCTB).
The national curriculum, which is still in use, is the competency based curriculum devel-oped in 1992 following reforms that were initiated in 1986 by the NTCB (ADB, 2000; ADB, 2003a) and is based on a one-shift operation (ADB, 2000). Some revisions were undertaken from 2000 to 2002, as a result of which the competencies to be achieved were reduced from 53 to 50.31 These competencies relate to religious/moral values, historical sense of nationhood, duties/responsibilities of a good citizen and cognitive aspects related to the five subject-areas (Bangla, English, mathematics, science and the environment, and social
31 The revisions do not seem to have introduced substantial changes to either the curriculum or the textbooks and seems to have focused more on revision of the teachers’ guides (CEF, 2008). Changes were also made to the history curriculum due to political pressure with the coming to power of the BNP in 2001 (Hossain, Subrahmanian and Kabeer, 2002).
VKB041-1 283324_B85_BW v5.indd 47 10-10-11 09:55

Context
| 48 |
studies) studied in primary school (CAMPE, 1999). There is a framework, called the’ Essential Learning Continuum’ outlining which competencies should be achieved at the end of each grade and learners are expected to reach the terminal competencies at the end of Grade V.
Documents from a number of sources suggest that the curriculum is appropriate for Bangladesh (USAID, 2002; World Bank, 2000) though the ADB found it too ambitious to match the level of competencies of primary school students (ADB, 2003a). The competen-cies related to school based subjects (i.e. Bangla, mathematics, science, social science, and English) are captured in the textbooks developed by the NCTB. These are distributed free of charge to all schools following the government curriculum, including schools outside the formal system.
About 75-80% of the schools, including most NGO schools, follow the national curriculum. Mainstream madrasahs follow a similar but less scientific curriculum with more attention for religious (Islamic) education. Most English medium schools (based mainly in the capital and larger cities) follow their own curricula leading up to entering students for interna-tional examinations at the end of Grade X.
The main qualification for primary school teachers is the Certificate in Education (C-in-Ed), a one-year course delivered by the country’s 58 Primary Training Institutes (PTIs). Teachers undertake the C-in-Ed course, the only long professional education programme for primary school teachers, after they have been appointed to their post. In 2000, about 70% of the primary school teachers did indeed have a C-in-Ed (female teachers for close to 100% and 56% of the male teachers).
At the beginning of the evaluation period there were substantial numbers of untrained teachers, particularly at the RNGPS. To address this situation, Norway provided funding to train 35,000 RNGPS teachers. To accommodate this, the PTIs that are responsible for the delivery of the C-in-Ed course, moved to a 2-shift system. The training provision increased during the evaluation period with the establishment of 481 Upazila Resource Centres (URCs) for in-service training in all Upazilas in the country. BRAC has its own system of pre-service and in-service teacher training as explained in section 2.5.2. The National Academy for Primary Education (NAPE, originally established in 1978 as the Academy for Fundamental Education), the apex institution for training, research, academic supervision and educa-tional management of primary education in Bangladesh, manages the primary teacher training programme and has oversight of the PTIs. It also offers courses for education managers, including UEOs and AUEOs. Most NAPE staff is part of the administrative cadre and on deputation.
VKB041-1 283324_B85_BW v5.indd 48 10-10-11 09:55

The two-pronged approach: Evaluation of Netherlands support to primary education in Bangladesh
| 49 |
In addition to pre-service training, all teachers from GPS, RNGPS and community schools are expected to attend sub-cluster training. The model, whereby teachers from a cluster (5-6 schools) come together at one of the schools for one day every two months, was intro-duced in 1993 with the objective of imparting new ideas to teachers. Sub-cluster training has been continued in the same manner to date using leaflets on selected topics (e.g. use of learning aids, subject-based training, SLIP and SMC training) that are provided by DPE.
In terms of quality assurance in primary education, a system of ‘continuous pupil assess-ment’ was introduced. This requires teachers to assess students regularly for every compe-tency acquired in a particular lesson (through observation, oral/written assessment) and to record achievement on a monthly basis. There is a policy of automatic promotion in Grades I and II. In Grades III to V, pupils are promoted on the basis of their achievement in the annual examinations (Hughes d’Aeth and Mannan, 2010). A public examination at the end of the primary education cycle called the Shomaponi exam was introduced in selected districts in 2008 and nationwide in 2009 (Ahmed and Hossain, 2010). This examination is now the gateway into the secondary stage. It replaces the merit-based secondary school admission tests that were administered in the past for the top 20% performers in Grade V of primary school (MoE, 2004).
All government supported primary schools are required to have a School Management Committee (SMC) comprising eleven members, three of whom must be women (up until 2009 this was one only). These committees, ‘responsible for the overall management and development of the school’ (Al-Samarrai, 2009) were set up as ‘part of the decentralisation process in 1981 (…) to augment the democratic governance of school administration’ (World Bank, 2000). An SMC consists of teachers and parents, representatives of local government and individuals interested in the school or education. The head teacher acts as SMC secre-tary. Membership of the SMC is through election and members hold their post for four years before being re-elected.
With decentralisation not being adopted, and without ‘the financial resources needed to function effectively’ (World Bank, 2000) the SMC’s role has been limited, focusing primarily on school level planning and supporting the administration of interventions, such as the Primary School Stipend Programme. At the start of the evaluation period, 99% of GPS and RNGPS and 76% of non-formal schools were reported to have a SMC. Their effectiveness was however questionable and whilst records indicate that they met regularly, this was ques-tioned by CAMPE (CAMPE, 1999). In addition to the SMC, schools are also required to have Parent Teacher Associations (PTAs). Made up primarily of parents, the PTA’s role is ‘to create effective school community partnership in education’ by increasing the involvement of parents in the life of the school (Nath and Mahbub, 2008).
VKB041-1 283324_B85_BW v5.indd 49 10-10-11 09:55

Context
| 50 |
2.5 PEDP-II and BRAC
The following paragraphs capture the main features of the second Primary Education Development Programme (PEDP-II) which has provided the main framework for primary education development in Bangladesh and BRAC’s non-formal primary education programmes. The section is concluded with a brief comparison between Government and BRAC schools.
2.5.1 The second Primary Education Development Programme (PEDP-II)PEDP-II is a sub-sector primary education programme that aims to provide quality primary education to eligible children in Bangladesh (ADB, 2003). It has provided the framework for virtually all bilateral and multilateral support to primary education.32 Ultimately it seeks to reduce poverty and to contribute to sustainable socioeconomic development and equity in Bangladesh as envisaged in the MDGs. The programme is government-led and covers all key aspects of the public primary education system through the following four main components:
1 Quality improvement through organisational development and capacity building as well as the provision of teaching and learning resources such as textbooks, supplemen-tary materials and teaching aids, including teacher text books, guides and aides
2 Quality improvement in schools and classrooms through improved pre-service and in-service training for teachers together with management training for head teachers and SMC members
3 Quality improvement through infrastructure development, i.e. the construction and refurbishment of classrooms and improvements in water and sanitation facilities and
4 Improving equitable access to quality schooling through an increased emphasis on access for children with special needs.
PEDP-II covers the GPS, RNGPS, community and experimental schools, as well as the PTIs and URCs. It excludes madrasahs and non-formal education offered by NGOs given the government’s ambivalent attitude vis-à-vis multiple providers of education (Ahmed, 2011). The programme is delivered by the Directorate of Primary Education (DPE), both centrally and through the District and Upazila Primary Education system. NAPE and the NCTB have a role in the implementation of PEDP-II as well. Overlaying all activities is an emphasis on increased capacity of DPE, both nationally and locally to deliver primary education more effectively and efficiently. On the Government side, PEDP-II was formalised in a Project Proforma (PP).
32 An exception was WFP’s ‘nutrition for education’ for primary school children in high food insecure areas (ADB, 2008). Also USAID did not join PEDP-II.
VKB041-1 283324_B85_BW v5.indd 50 10-10-11 09:55
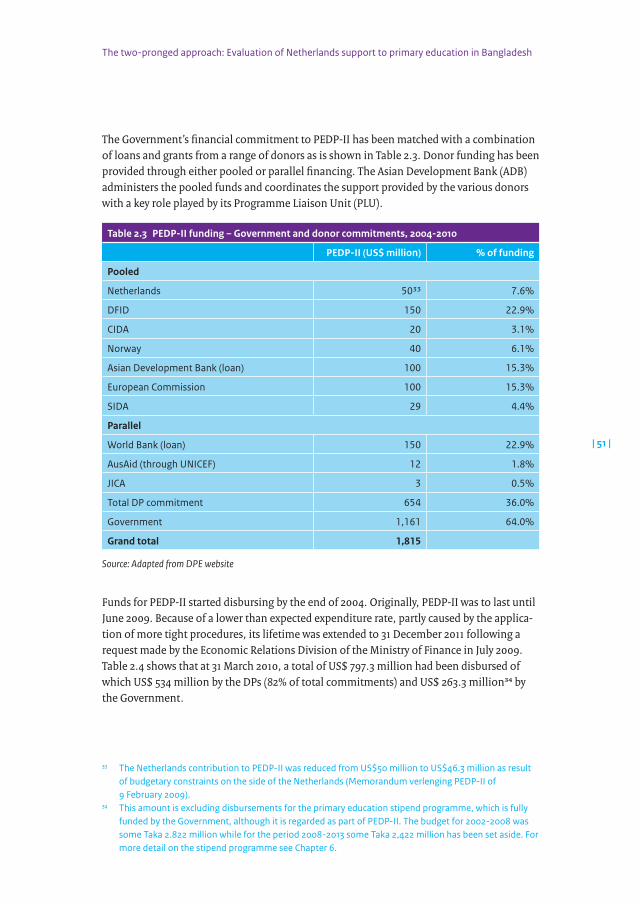
The two-pronged approach: Evaluation of Netherlands support to primary education in Bangladesh
| 51 |
The Government’s financial commitment to PEDP-II has been matched with a combination of loans and grants from a range of donors as is shown in Table 2.3. Donor funding has been provided through either pooled or parallel financing. The Asian Development Bank (ADB) administers the pooled funds and coordinates the support provided by the various donors with a key role played by its Programme Liaison Unit (PLU).
Table 2.3 PEDPII funding – Government and donor commitments, 20042010
PEDPII (US$ million) % of funding
Pooled
Netherlands 5033 7.6%
DFID 150 22.9%
CIDA 20 3.1%
Norway 40 6.1%
Asian Development Bank (loan) 100 15.3%
European Commission 100 15.3%
SIDA 29 4.4%
Parallel
World Bank (loan) 150 22.9%
AusAid (through UNICEF) 12 1.8%
JICA 3 0.5%
Total DP commitment 654 36.0%
Government 1,161 64.0%
Grand total 1,815
Source: Adapted from DPE website
Funds for PEDP-II started disbursing by the end of 2004. Originally, PEDP-II was to last until June 2009. Because of a lower than expected expenditure rate, partly caused by the applica-tion of more tight procedures, its lifetime was extended to 31 December 2011 following a request made by the Economic Relations Division of the Ministry of Finance in July 2009. Table 2.4 shows that at 31 March 2010, a total of US$ 797.3 million had been disbursed of which US$ 534 million by the DPs (82% of total commitments) and US$ 263.3 million34 by the Government.
33 The Netherlands contribution to PEDP-II was reduced from US$50 million to US$46.3 million as result of budgetary constraints on the side of the Netherlands (Memorandum verlenging PEDP-II of 9 February 2009).
34 This amount is excluding disbursements for the primary education stipend programme, which is fully funded by the Government, although it is regarded as part of PEDP-II. The budget for 2002-2008 was some Taka 2.822 million while for the period 2008-2013 some Taka 2,422 million has been set aside. For more detail on the stipend programme see Chapter 6.
VKB041-1 283324_B85_BW v5.indd 51 10-10-11 09:55
Context
| 52 |
Table 2.4 Donor and Government cumulative expenditure under PEDPII in US$ million35
Total Donors Government
Components Amount % Amount % Amount %
1.QualityImprovementthroughOrganisational Development and CapacityBuildingatSystemLevel
45.2 5.7% 35.2 77.9% 10.0 22.1%
2.QualityImprovementinSchoolsand Classrooms
270.5 33.9% 197.5 73.0% 73.0 27.0%
3.QualityImprovementthroughInfrastructure Development
465.4 58.4% 288.3 62.0% 177.1 38.0%
4.ImprovedAccesstoQualitySchooling
3.4 0.4% 3.2 91.5% 0.3 8.5%
PEDP-II Management 12.8 1.6% 9.8 76.9% 2.9 23.1%
Total 797.3 534.0 67.0% 263.3 33.0%
Source: ADB/PLU, 2010b
The largest percentage of PEDP-II expenditures has gone to component 3 (58.4%) followed by component 2. PEDP-II management accounted for only 1.6% of total disbursement. Progress on the four components of the Programme, which has been mixed (GoB, 2010), can be summarised as follows on the basis of the Annual Sector Performance Review of 2010.
1 Quality Improvement through Organisational Development and Capacity Building at System Level. A human resource development plan was prepared together with an organisational development and capacity building guide. A position paper was prepared by DPE on chronic vacancies at the field level and an action plan to fill vacancies in PTIs, DPEOs and UEOs has been under implementation but not yet completed. A strategic development plan for NAPE was completed in 2009 but staffing of NCTB and NAPE was not completed as planned. Data bases for the EMIS were established but the filling of vacancies at the EMIS cell has been cumbersome (World Bank 2009). By May 2010, 243 Upazilas were brought under the so-called Upazila Primary Education Plan (UPEP) component with a total amount spent of Taka 5.9 million. Issues experienced under this component relate to delays in approvals of key plans and strategies, delays in technical assistance, a high turnover among senior staff and limited staff at field level coupled with a low planning capacity.
35 As at 31 March 2010, donors’ share of expenditure also includes the expenditure from parallel funding i.e. UNICEF/AusAid and JICA. The Government’s share of expenditure includes 100% CDVAT and 37.35% of all local expenditures excluding local training, workshop/seminar and expenditure related to textbooks. As per the RDPP, the overall share of donors is 66.3% and the Government’s share is 33.7%.
VKB041-1 283324_B85_BW v5.indd 52 10-10-11 09:55
The two-pronged approach: Evaluation of Netherlands support to primary education in Bangladesh
| 53 |
2 Quality Improvement in Schools and Classrooms. Up to May 2010, 316 Upazilas (64%) had been brought under PEDP-II’s School Level Improvement Plans (SLIP) component, with over 39 thousand GPS, RNGPS and community schools receiving a grant of Taka 10-30,000 (i.e. between US$ 145 and 335). Total expenditures equalled Taka 1.16 billion (i.e. some US$ 16.9 million). An issue has been that government financial rules did not allow the channelling of funds to schools directly. In terms of teacher recruitment, 35,000 positions were created of which over 24 thousand (70%) were filled; efforts to ensure pre-training had started in 2010 and were still limited. Subject guides for teachers were prepared and under printing. Little progress was made as regard incentive schemes for teachers, including the establishment of an ‘education cadre’.
3 Quality Improvement through Infrastructure Development. In terms of classroom construction, the ASPR 2010 reports a total of 26,848 classrooms constructed up to March 2009.36 At times, a problem has been the availability of sufficient land. In relation to the school-level water provision, particular attention was paid to ensure access to water that was free from arsenic. According to the ASPR, the share of schools with arsenic free water had increased from 56% in 2005 to 71% in 2007 after which it decreased to 60%.
4 Improved Access to Quality Schooling. Guidelines for developing inclusive plans were prepared and distributed and an inclusive primary education cell was established at DPE. A total of 215 DPE staff at various levels (including (A)UOEs, URC and PTI instructors) together with more than 46 thousand head teachers were trained on inclusive education. Reference is made to the enrolment of over 53 thousand disadvantaged children in 2007 and close to 78 thousand in 2008.
Expenditures under PEDP-II by main categories of expenditure are reflected in Figure 2.3 below. The figure shows a clear focus on infrastructure improvement, with over 50% of resources spent on civil works according to the most recent data on expenditures. It does not include the Government’s expenditure on the stipend programme that was introduced in 2002 as a sequel to the food for education programme. On the stipend programme see further sections 5.2 and 6.2.
36 According to the ASPR ‘(the) evidence shows that a lower proportion of the total current stock of classrooms have been built in schools in hard to reach (11%) than in easy to reach areas (13%) (GoB 2010). Current stock of classrooms was built in schools in haor (11.7%) and hilly (9.9%) areas compared to the average in other areas (12.8%) but that schools in char areas were given relative priority (13.3%) (GoB, 2010).
VKB041-1 283324_B85_BW v5.indd 53 10-10-11 09:55

Context
| 54 |
Figure 2.3 PEDP-II budget utilisation by main component (up to 31 March 2010)
Other, 9%
Maintenance & repair of schools, 2%
CDVAT, 3%
Furniture, 3%
SLIP & UPEP, 3%
Teaching & learning materials, 4%
Local training, 7%
Textbooks, 7%
Manpower, 9%
Civil works, 53%
Adapted from GoB, 2010
2.5.2 BRAC Non-Formal Primary Education ProgrammeBRAC started its primary education programme in 1985 in response to community demand for education. BRAC began with a non-formal education programme which provided three years of primary education for children aged eight to ten who had never enrolled in school or who had dropped out of Grade I. After these three years, the children were expected to continue into formal primary education as these three years were considered insuffi-cient (Nath et al, 1999). This model was replaced under BRAC’s 3rd Non-Formal Education Programme (NFEP-III) by a four year programme which gave children the opportunity to complete a full five-year primary education cycle.
The main objectives of BRAC’s non-formal and basic education programmes have remained broadly the same over the years. In particular, a link is made with the aims of achieving EFA (BRAC, 2009b) and the education related MDGs, reducing poverty through quality educa-tion and filling in the gaps that have remained in the coverage of the Government’s primary education provision. BRAC has broadened its programme in more recent years though primary education has remained at the heart of its education programme (see Box 2.1).
VKB041-1 283324_B85_BW v5.indd 54 10-10-11 09:55

The two-pronged approach: Evaluation of Netherlands support to primary education in Bangladesh
| 55 |
Box 2.5 BRAC Non Formal Primary Education (NFPE) and Basic Education Programme (BEP)37
NFPE-III (1999-2004) envisaged four main outputs, i.e.: (i) equitable access to cost effective primary education ensured for poor children, especially girls providing non-formal primary education for 9-10 year olds and Basic Education for Older Children (BEOC) for 11-16 year olds who had dropped out or never attended school; (ii) quality improvement in curriculum and training for staff and teachers and the establishment of an Educational Development Unit; (iii) quality improvement through development of learning materials and the setting up of a Materials Development Unit and (iv) continuing education catering to adults of the commu-nity as well as NFPE graduates (BRAC, 1998).
The specific objectives of BEP-I (2004-2009) were: (i) to provide quality primary education for children outside formal education institutions; (ii) to improve access to education, especially for girls; (iii) to build capacity of small NGOs by providing financial and technical support for replication of the BRAC primary school model; (iv) to enhance the success of formal primary education through pre-primary schools; (v) to improve the quality of secondary education; (vi) to empower adolescents by improving their life skills, and; (vii) to build capacities through the establishment of lifelong education and training. The programme included the following interventions (BRAC, 2004): (i) BRAC primary schools (BPS) for children (8-10 years) not currently served by the government system, the poor, in remote areas, adolescent girls, those with special needs, ethnic minorities and Bangladesh Adolescent Primary Schools (BAPS) for 11-14 year olds;38 (ii) BRAC pre-primary schools to enhance school readiness in GPS catchment areas; (iii) Adolescent Development Programme expanding opportunities for girls in finishing primary, entering secondary or engaging in income generation; (iv) Continuing education through the expansion of schools and mobile library programme and (v) post-primary basic interventions, improving teaching and learning and management in formal post-primary (secondary) schools.
The new programme covering the period 2009-2014 (BEP-II) will take these interventions forward and concentrate on building stronger relations with the government education system. A feature of both programmes was primary education for older children and the Educational Support Programme (ESP). Under ESP, the BRAC primary education model for Grades I to III only, was delivered by a number of NGOs, who in turn were supervised by BRAC. After completing these three years, children are expected to continue in the formal education system.
37 Sources: BRAC, 1998 and BRAC, 2004.38 This was consolidated under BEP-II, with the target group being 9-12 year old children as fewer groups
of out-of-school children in the age groups of 8-10 and 11-14 year could be found (see also BRAC 2009a). In addition, the condition that 70% should be girls has been relaxed as fewer out of school girls are identified with more girls attending formal primary education and with girls’ enrolment and retention being on a par with that of boys.
VKB041-1 283324_B85_BW v5.indd 55 10-10-11 09:55
Context
| 56 |
The model of education developed by BRAC has been the most popular model of primary education for out of school children throughout Bangladesh for the last 25 years. BRAC and its partner NGOs operate pre-primary and primary schools in all 64 districts of the country. Most BRAC schools are in rural or semi-rural areas, though the main school programme does not specifically target those living in the most remote areas. The proposal for BEP-I mentions the intention to improve targeting ‘to areas where there is a shortage of formal primary schools and where literacy rates are lower than average’ (BRAC, 2004). The strategy is to withdraw from areas where there is no longer a need for non-formal schools.
The BRAC model is based on need and has broadly followed the same pattern over the years. Before starting a school, BRAC studies community demand for education and whether there are sufficient numbers of out-of-school children, making sure ‘that they are not already enrolled in the formal system’ (BEP, 2004). BRAC also verifies that there are potential teachers in the proximity of the future school.
BRAC’s current school planning policy is to provide primary education to the disadvantaged children of the poor, targeting those who have never enrolled in the government’s primary schools and the drop-outs. Priority is given to girls with the target of achieving at least 60% of the total enrolment, and children with special needs.39 In targeting those children, BRAC opens schools in the remote and hard-to-reach areas, poor and ultra-poor areas, disaster-prone areas, urban slums, and ethnic areas including the Chittagong Hill Tracts.
BRAC has detailed guidelines and procedures and makes use of the geographical and demo-graphic information and statistics contained in the Specially Targeted Ultra Poor framework developed by its Economic Development Programme. It also carries out door-to-door surveys for identifying and targeting eligible children. According to Boeren et al (2008), over the years, BRAC has been able to implement this targeting policy and guidelines to quite a large extent. Table 2.5 shows that out of the 26,500 BRAC Primary Schools (BPS) and BRAC Adolescent Primary Schools (BAPS) that are currently operating, 63% are located in the ultra-poor, remote, and disaster-prone areas, 29% are located in the generally poor areas, 6% are located in ethnic areas, and 2% are operating in the CHT.
39 For opening a new school in a village the following criteria are applied (Ryan et al, 2007): 1. No other primary school within at least 1 km of the village; 2. There are between 30-33 children (of whom 65% girls) between 8-10 years (BAPS 11-14 years) who are not in school; 3. These children are from ‘poor’ households, i.e. those with not more than 50 decimals of land and other marginalised groups such as children with special needs, etc.; 4. There is a house or land available for building the school house; 5. Availability of a suitable person to become the teacher. This should be a female aged 20-35 years with SSC (Grade X) and preferably married; 6. A certificate of non-enrolment should be signed by the GPS in the area to confirm the potential BPS students are not enrolled elsewhere.
VKB041-1 283324_B85_BW v5.indd 56 10-10-11 09:55

The two-pronged approach: Evaluation of Netherlands support to primary education in Bangladesh
| 57 |
Table 2.5 Summary statistics on BPS/BAPS and ESP schools by socioeconomicgeographical
areas
Types (December 2007) BPS/BAPS ESP
No. % No. %
Number of schools in the generally poor areas, including urban areas
7,601 29% 1,604 29%
Number of schools in the ultra-poor, remote and disaster areas
16,649 63% 3,573 65%
Number of schools in the ethnic areas 1,647 6% 53 1%
Number of schools in the Chittagong Hill Tracts areas 603 2% 270 5%
Total 26,500 100 5,500 100
Source: Boeren et al. (2008)
BRAC schools are one-classroom-one-teacher schools (often made of bamboo with a tin roof ) that are provided by the community. Once the building is provided, 30-33 children (22-30 children in case of ethnic minority schools) between the ages of 8 and 10 are subse-quently enrolled.40
BRAC appoints its own teachers; it gives preference to female secondary school graduates living in the locality of the school being established. Appointments are for the four years that the school runs after which there is no assurance of another post, though many BRAC teachers do move on to run new schools once their school is complete. After the teacher has followed a short 2-week training course, she starts the school. After this initial training, monthly training is organised focused on the lessons to be delivered in the following month. In addition, needs based workshops and training sessions are organised for both teachers and BRAC support staff.
Children are taught sitting on mats on the floor – each child has its own place, books and materials. The medium of instruction is Bengali.41 BRAC schools are open for 265-270 days per year on a 12-month calendar. For Grades I and II, contact time is 3 hours a day, and for Grades III to V, contact time is 4 hours a day or longer. The school runs for 6 days a week, usually in the morning, though class times and vacation schedules are decided together by parents and the teacher to allow for seasonal work and other family needs.
BRAC follows the formal government curriculum using government textbooks that are provided free of charge by the government. These are supplemented with resources developed by BRAC, particularly in the lower grades. Children stay with the same teacher for the four years that they attend the school, during which time they progress as a class
40 Children that enter BPS are usually 8-10 years old, which is too old to be admitted into government primary schools.
41 Though the programme also included the production of rhymes in 14 mother tongue ethnic languages, and story books and other learning materials in Bangla, but drawn from the cultural traditions and heritage of 14 ethnic communities (Boeren et al., 2008)
VKB041-1 283324_B85_BW v5.indd 57 10-10-11 09:55
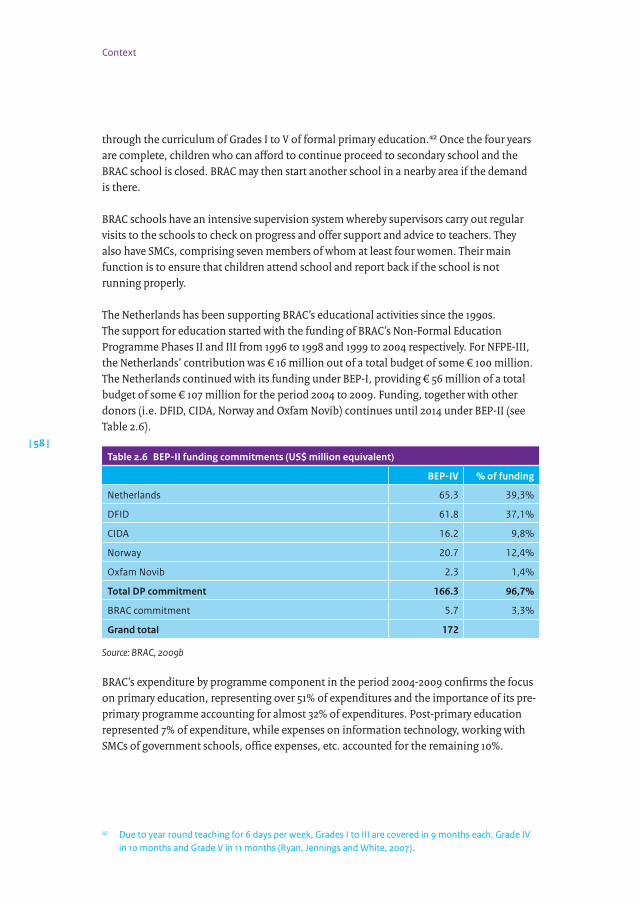
Context
| 58 |
through the curriculum of Grades I to V of formal primary education.42 Once the four years are complete, children who can afford to continue proceed to secondary school and the BRAC school is closed. BRAC may then start another school in a nearby area if the demand is there.
BRAC schools have an intensive supervision system whereby supervisors carry out regular visits to the schools to check on progress and offer support and advice to teachers. They also have SMCs, comprising seven members of whom at least four women. Their main function is to ensure that children attend school and report back if the school is not running properly.
The Netherlands has been supporting BRAC’s educational activities since the 1990s. The support for education started with the funding of BRAC’s Non-Formal Education Programme Phases II and III from 1996 to 1998 and 1999 to 2004 respectively. For NFPE-III, the Netherlands’ contribution was € 16 million out of a total budget of some € 100 million. The Netherlands continued with its funding under BEP-I, providing € 56 million of a total budget of some € 107 million for the period 2004 to 2009. Funding, together with other donors (i.e. DFID, CIDA, Norway and Oxfam Novib) continues until 2014 under BEP-II (see Table 2.6).
Table 2.6 BEPII funding commitments (US$ million equivalent)
BEPIV % of funding
Netherlands 65.3 39,3%
DFID 61.8 37,1%
CIDA 16.2 9,8%
Norway 20.7 12,4%
Oxfam Novib 2.3 1,4%
Total DP commitment 166.3 96,7%
BRAC commitment 5.7 3,3%
Grand total 172
Source: BRAC, 2009b
BRAC’s expenditure by programme component in the period 2004-2009 confirms the focus on primary education, representing over 51% of expenditures and the importance of its pre-primary programme accounting for almost 32% of expenditures. Post-primary education represented 7% of expenditure, while expenses on information technology, working with SMCs of government schools, office expenses, etc. accounted for the remaining 10%.
42 Due to year round teaching for 6 days per week, Grades I to III are covered in 9 months each, Grade IV in 10 months and Grade V in 11 months (Ryan, Jennings and White, 2007).
VKB041-1 283324_B85_BW v5.indd 58 10-10-11 09:55

The two-pronged approach: Evaluation of Netherlands support to primary education in Bangladesh
| 59 |
2.5.3 Comparing Government supported and BRAC schoolsTable 2.7 below summarises some of the key characteristics and differences between the Government supported schools and the schools operated by BRAC. Further details on the various items are provided in subsequent chapters.
Table 2.7 Comparing Government and BRAC schools
Government supported schools BRAC schools
Funding Variable Government funding for the different types of formal schools. Children enrolled at formal schools may be eligible for the school stipend programme. Government expenditure are some US$ 42 per student per year at GPS.
No Government funding – apart from textbooks that are provided free of charge. Students are not eligible for the Government’s school stipend programme. The costs at BRAC schools range between US$ 23 and 31 per student per year (2008).
Curriculum Government curriculum used. School books are provided by DPE for all grades free of charge.
Government curriculum is used. School books are provided by DPE for Grades III to V. For the lower grades, BRAC uses its own materials.
Teachers Teachers are recruited centrally by DPE for GPS and RNGPS. The share of female teachers ranges from 51% at GPS to 75% at community schools (2009). Teachers (74% in 2009) are to have a C-in-Ed diploma, obtained at a PTI, after completion of lower (women) or senior secondary education (men). GPS and RNGPS teachers participate in sub-cluster training organised by AUEOs and in-service training (basic and subject-based) at URCs. In 2009, the average student-teacher ratio was 53:1 at GPS and 41:1 at formal subsidised schools such as RNGPS.
The teacher (98-99% female) is recruited by BRAC from the school community. Minimum requirement is a secondary school certificate. Teachers are trained by BRAC. Monthly teacher training is organised by BRAC preparing the teacher for the programme of the coming month. Over a four year period, teachers participate in 120 training days. In 2009, the average student-teacher ratio was 29:1.
Students There is gender equity in the main types of Government supported schools, with the exception of kinder garten and madrasahs where the share of boys is higher than that of girls.
Between 57% of students (EEC schools) and 72% of students (ESP schools) are girls. BRAC focuses on urban and rural poor, including students from ethnic minorities and remote areas.
Duration and contact hours
Primary education takes in principle 5 years. 81% of the schools operate in double shift (2009) – i.e. Grades I and II in the morning and Grades III to V in the afternoon. At GPS and RNGPS, there are 2 contact hours for Grades I and II and 3.5 hours for Grades III to V.
The 5-year cycle of primary education is provided in 4 years. Schools are open 265-270 days per year. Schools run six days per week. There are 3 contact hours per day for Grades I and II and 4 hours for Grades III to V.
VKB041-1 283324_B85_BW v5.indd 59 10-10-11 09:55
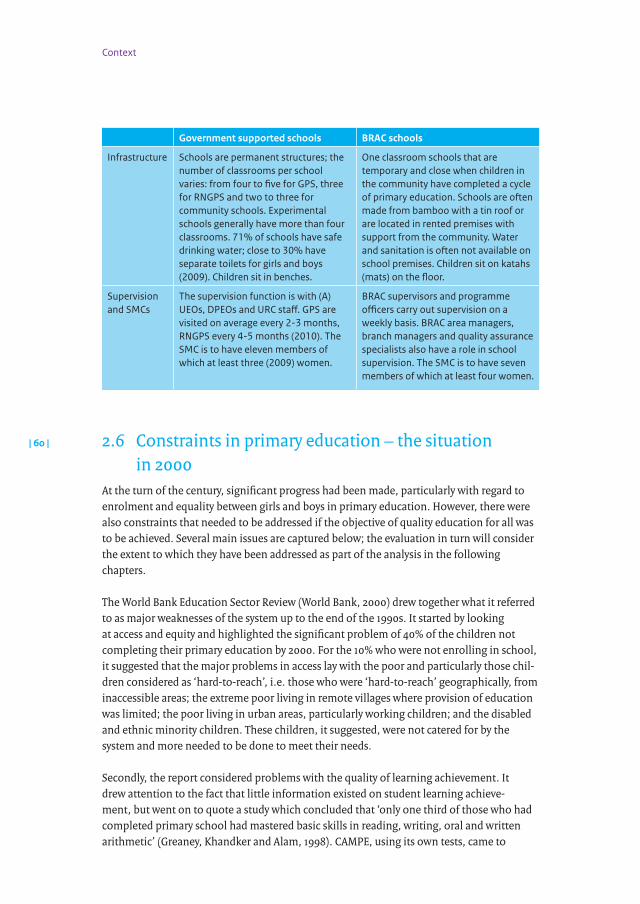
Context
| 60 |
Government supported schools BRAC schools
Infrastructure Schools are permanent structures; the number of classrooms per school varies: from four to five for GPS, three for RNGPS and two to three for community schools. Experimental schools generally have more than four classrooms. 71% of schools have safe drinking water; close to 30% have separate toilets for girls and boys (2009). Children sit in benches.
One classroom schools that are temporary and close when children in the community have completed a cycle of primary education. Schools are often made from bamboo with a tin roof or are located in rented premises with support from the community. Water and sanitation is often not available on school premises. Children sit on katahs (mats) on the floor.
Supervision and SMCs
The supervision function is with (A)UEOs, DPEOs and URC staff. GPS are visited on average every 2-3 months, RNGPS every 4-5 months (2010). The SMC is to have eleven members of which at least three (2009) women.
BRAC supervisors and programme officers carry out supervision on a weekly basis. BRAC area managers, branch managers and quality assurance specialists also have a role in school supervision. The SMC is to have seven members of which at least four women.
2.6 Constraints in primary education – the situation in 2000
At the turn of the century, significant progress had been made, particularly with regard to enrolment and equality between girls and boys in primary education. However, there were also constraints that needed to be addressed if the objective of quality education for all was to be achieved. Several main issues are captured below; the evaluation in turn will consider the extent to which they have been addressed as part of the analysis in the following chapters.
The World Bank Education Sector Review (World Bank, 2000) drew together what it referred to as major weaknesses of the system up to the end of the 1990s. It started by looking at access and equity and highlighted the significant problem of 40% of the children not completing their primary education by 2000. For the 10% who were not enrolling in school, it suggested that the major problems in access lay with the poor and particularly those chil-dren considered as ‘hard-to-reach’, i.e. those who were ‘hard-to-reach’ geographically, from inaccessible areas; the extreme poor living in remote villages where provision of education was limited; the poor living in urban areas, particularly working children; and the disabled and ethnic minority children. These children, it suggested, were not catered for by the system and more needed to be done to meet their needs.
Secondly, the report considered problems with the quality of learning achievement. It drew attention to the fact that little information existed on student learning achieve-ment, but went on to quote a study which concluded that ‘only one third of those who had completed primary school had mastered basic skills in reading, writing, oral and written arithmetic’ (Greaney, Khandker and Alam, 1998). CAMPE, using its own tests, came to
VKB041-1 283324_B85_BW v5.indd 60 10-10-11 09:55

The two-pronged approach: Evaluation of Netherlands support to primary education in Bangladesh
similar findings on the state of the quality of primary education (CAMPE, 2000). Reasons for this low achievement were low time on task, under-qualified teachers, particularly in RNGPS schools, and weak supervision and monitoring of teachers by the local administra-tion. In addition teachers were reported to have low attendance and poor motivation due to a lack of incentives.
The Education Sector Review, citing weaknesses in planning, also highlighted weak capacity within the government to address sector wide issues. This was compounded by the limited data available, and the problems of centralised decision making which resulted in over-loaded implementation responsibilities for the centre. It suggested that the centre needed to focus more on the policy level leaving some decisions to the lower levels of administra-tion. Further, it suggested that accountability needed strengthening and that steps needed to be taken to empower communities and parents to ensure that the schools and their managers were indeed accountable.
BRAC school. Photo: Simone Verkaart
VKB041-1 283324_B85_BW v5.indd 61 10-10-11 09:55

Netherlands support to primary education in Bangladesh
3
VKB041-1 283324_B85_BW v5.indd 62 10-10-11 09:55
| 63 |
The two-pronged approach: Evaluation of Netherlands support to primary education in Bangladesh
3.1 Introduction
This chapter focuses on Netherlands support to primary education in Bangladesh. It starts with a brief overview of the various initiatives supported43 during the period 2000-2009. It then describes and explains the rationale behind this support in terms of the selection of the channels and instruments and the approach taken. The chapter subsequently analyses the role played by the Netherlands, as represented by its embassy in Dhaka, as a member of the donor community in Bangladesh. Focus is on the areas of harmonisation and align-ment – with the Government, among donors and between the Government and the NGO community – and the results accomplished. The chapter concludes with an assessment of the attention paid to issues of governance and fiduciary risk.
3.2 Netherlands support to primary education in the period 1999-2009
In the period 1999-2009, Netherlands education sector support was provided for formal and non-formal primary education as well as education and other support for hard to reach children. It also financed initiatives in the areas of advocacy and research in the education sector. Support to formal primary education has been through PEDP-II. Non formal primary education and other support for hard to reach children has been channelled through NGOs, both directly (BRAC Education Programme and the Jonoshilon Programme of Friends in Village Development Bangladesh (FIVDB)) and indirectly through Dutch NGOs44 (e.g. funding for BRAC provided by the Dutch NGO Oxfam Novib). The Netherlands also funded the Urban Informal Economy (UIE) Project of the International Labour Organisation (ILO) addressing the educational needs of children involved in the worst forms of child labour in Dhaka city. Support for advocacy and research was channelled through CAMPE and the BRAC University Institute for Educational Development (BU-IED, with co-financing from Oxfam Novib).45
The evolution of Netherlands bilateral support in the period 1999-2009, which was close to a total of € 119 million, is depicted in Figure 3.1.46
43 More details on initiatives funded by the Netherlands, other than PEDP-II and BRAC, is provided in sections 6.2.6, 7.2.3 and Annex 4.
44 The ‘Mede-financieringsorganisaties’ are Dutch NGOs receiving co-funding through the various NGO programmes of the Netherlands Ministry of Foreign Affairs.
45 In addition, some small projects were financed, e.g. for school rehabilitation after cyclone Sidr in 2007 and Aila in 2009. These remain outside the scope of this evaluation.
46 The Netherlands supported technical and vocational education with a contribution of € 25 million through the Underprivileged Children’s Educational Programmes (UCEP) for the period 2010-2015. The overall purpose of the programme is to achieve that underprivileged and working children are provided with quality general and technical education, employment support, that they get a job or are self-employed and that they are aware of their rights (EKN, 2010). The programme targets some 76,000 children (equally boys and girls), providing general education in at least 84 Integrated General and Vocation Schools and technical education in 17 Technical Schools. The UCEP programme is outside the scope of this evaluation.
VKB041-1 283324_B85_BW v5.indd 63 10-10-11 09:55

Netherlands support to primary education in Bangladesh
| 64 |
Figure 3.1 Netherlands bilateral support to basic education in Bangladesh (disbursements in € 000)
0
5.000
10.000
15.000
20.000
25.000
30.000
20092008200720062005200420032002200120001999
Year
Amou
nt (0
00)
Other
BUIED
ILO
FIVDB
CAMPE
PEDP II
BRAC
Source: IOB calculations based on Ministry of Foreign Affairs, Piramide, December 2010
Disbursements, which were only € 79 thousand in 1999, focused initially on non-formal education through BRAC which was joined by ILO as of 2001. Following the end of the second phase of the BRAC Non-formal Education Programme, disbursements reached a low of € 4.3 million in 2002.47 They picked up substantially in 2005 with the start of PEDP-II and expanded support for BRAC’s BEP-I. Disbursements reached a high of € 24.8 million in 2007 while 2008 and 2009 saw lower disbursements for PEDP-II, mainly due to delays in PEDP-II implementation.
Since 2008 there has been greater diversification of the non-formal education portfolio, though BRAC remained the largest recipient. While the Netherlands was the sole external source of funding for the interventions with ILO and FIVDB, Netherlands support of PEDP-II, BRAC, CAMPE and BU-IED was provided together with other donors. Table 3.1 shows that the Netherlands’ share of total donor funding commitments in the period 2000-2009 ranged between 7.6% (PEDP-II) and over 60% in the case of CAMPE.
47 The low level of disbursements in the period 2001-2003 reflects the Netherlands decision not to enter into PEDP-I once it became clear that it would not follow a programmatic approach and a period of negotiation prior to entering into support for PEDP-II.
VKB041-1 283324_B85_BW v5.indd 64 10-10-11 09:55
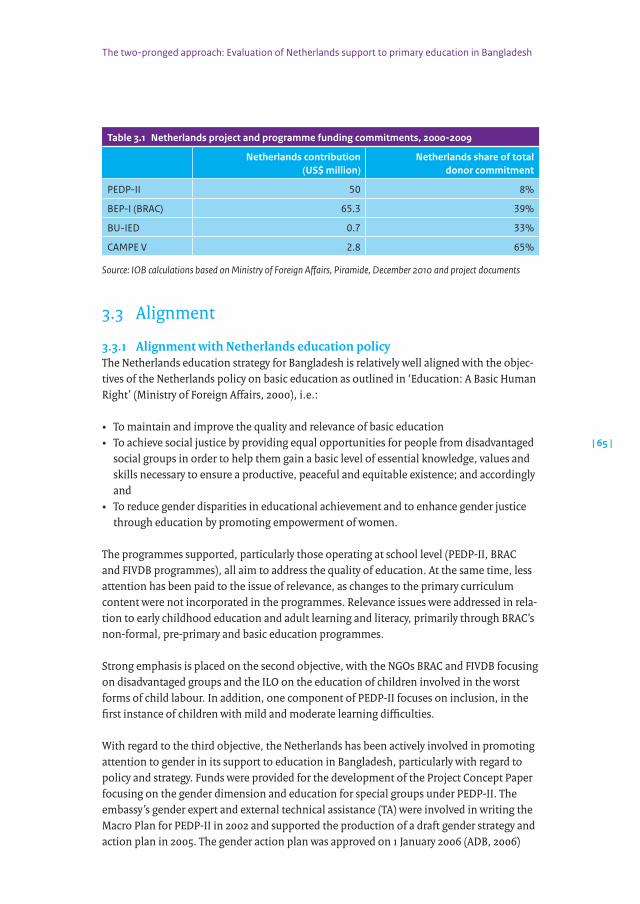
The two-pronged approach: Evaluation of Netherlands support to primary education in Bangladesh
| 65 |
Table 3.1 Netherlands project and programme funding commitments, 20002009
Netherlands contribution (US$ million)
Netherlands share of total donor commitment
PEDP-II 50 8%
BEP-I (BRAC) 65.3 39%
BU-IED 0.7 33%
CAMPE V 2.8 65%
Source: IOB calculations based on Ministry of Foreign Affairs, Piramide, December 2010 and project documents
3.3 Alignment
3.3.1 Alignment with Netherlands education policyThe Netherlands education strategy for Bangladesh is relatively well aligned with the objec-tives of the Netherlands policy on basic education as outlined in ‘Education: A Basic Human Right’ (Ministry of Foreign Affairs, 2000), i.e.:
• To maintain and improve the quality and relevance of basic education• To achieve social justice by providing equal opportunities for people from disadvantaged
social groups in order to help them gain a basic level of essential knowledge, values and skills necessary to ensure a productive, peaceful and equitable existence; and accordingly and
• To reduce gender disparities in educational achievement and to enhance gender justice through education by promoting empowerment of women.
The programmes supported, particularly those operating at school level (PEDP-II, BRAC and FIVDB programmes), all aim to address the quality of education. At the same time, less attention has been paid to the issue of relevance, as changes to the primary curriculum content were not incorporated in the programmes. Relevance issues were addressed in rela-tion to early childhood education and adult learning and literacy, primarily through BRAC’s non-formal, pre-primary and basic education programmes.
Strong emphasis is placed on the second objective, with the NGOs BRAC and FIVDB focusing on disadvantaged groups and the ILO on the education of children involved in the worst forms of child labour. In addition, one component of PEDP-II focuses on inclusion, in the first instance of children with mild and moderate learning difficulties.
With regard to the third objective, the Netherlands has been actively involved in promoting attention to gender in its support to education in Bangladesh, particularly with regard to policy and strategy. Funds were provided for the development of the Project Concept Paper focusing on the gender dimension and education for special groups under PEDP-II. The embassy’s gender expert and external technical assistance (TA) were involved in writing the Macro Plan for PEDP-II in 2002 and supported the production of a draft gender strategy and action plan in 2005. The gender action plan was approved on 1 January 2006 (ADB, 2006)
VKB041-1 283324_B85_BW v5.indd 65 10-10-11 09:55

Netherlands support to primary education in Bangladesh
| 66 |
after the establishment of an Access and Inclusive Education Cell within DPE in June 2005. The embassy envisaged that it would focus on the gender dimension of PEDP-II during annual reviews and would provide technical assistance (TA) and backstopping as needed in the area of gender (EKN, 2004b). In practice the attention to gender has been less than anticipated. This was primarily due to the fact that, (i) gender became less of an issue in primary education since equity in enrolment was reached; and (ii) gender concerns were sufficiently raised by other donors, in particular DFID. At the same time, BRAC’s focus on educating girls and employing female teachers is seen as a contribution to the gender objective.
Table 3.2 shows that the various projects and programmes adequately cover several key themes identified in the above policy document. It also demonstrates how, in Bangladesh, the strong emphasis on governance of the overall Netherlands development policy is trans-lated into specific education sector concerns.
Table 3.2 Themes and objectives of Netherlands supported education interventions
Literacy Quality Access Governance
•Functional (post) literacy classes for adults and adolescents (FIVDB) •Livelihoodtraining
and vocational skills (FIVDB;ILO)•Community learning
centres (FIVDB) and establishment of libraries (BRAC)•Training in
entrepreneurial skills plus micro credits for parents and guardians of working children (ILO)
•Curriculum development (PEDP-II) •Development of
(supplementary) teaching and learning materials (PEDP-II; BRAC; BU-IED)•Reduced pupil-
classroom ratio through the construction of classrooms (PEDP-II)•Reduced pupil-
teacher ratio through the recruitment of teachers (PEDP-II)•Teacher training
(PEDP-II, FIVDB, BRAC,ILO)
•Provision of school infrastructure – including the construction of classrooms, supply of basic furniture etc. (BRAC, FIVDB)•Recruitment of
teachers (BRAC, FIVDB)•Enhanced access to
pre-primary education (BRAC, BU-IED)•Strategies for
mainstreaming children with special needs (PEDP-II)•Providing non-
formal education to working children (ILO)
•Strengthened planning, human resource development and management through capacity building at MoPME, DPE (PEDP-II)•Establish national M&E
system (PEDP-II)•Dialogue with BRAC,
GoB (PEDP-II; BRAC)•Policy dialogue and
harmonisation (PEDP-II)•Establishment Child
LabourUnit(CLU)inMoLE(ILO)•Training of school
management committees (PEDP-II, BRAC, FIVDB)•Evidence based policy
development through research, publications and advocacy (CAMPE, BU-IED)
VKB041-1 283324_B85_BW v5.indd 66 10-10-11 09:55

The two-pronged approach: Evaluation of Netherlands support to primary education in Bangladesh
| 67 |
A final area indicated in the Netherlands’ education policy is that of HIV/AIDS. The evalu-ation shows that little seems to have happened apart from a workshop on HIV/AIDS and Life Skills-Based Education that was supported by the Netherlands, AusAid and UNICEF, in 2006. While it was recognized that ‘the workshop on HIV/AIDS had raised important issues which needed to be followed up’ (ELCG, 2006b) it was given no further attention in donor meetings. The main reason for this appears to have been the low incidence rate of HIV/AIDS in Bangladesh, which was moreover limited to very specific population groups like adult drug users.
3.3.2 Alignment with Bangladesh education policiesAssessing the extent to which the Netherlands’ strategy for education in Bangladesh is aligned with government policy is less easy given the lack of an over-riding policy for education in Bangladesh during the years 1999-2009 apart from the targets and objectives for (primary) education in the PRSP and PEDP-II. However, as is evident from Table 3.2, the Netherlands’ strategy is well aligned with policy as captured in PEDP-II with its emphasis on (i) quality of and equitable access to education; and (ii) improved governance and manage-ment of the education sector.
3.4 Strategy pursued by the Netherlands – a two-pronged approach
From the late 1990s onwards, the Netherlands has demonstrated an interest in supporting formal primary education in Bangladesh through a sector wide approach (SWAp). This interest is evident from the embassy’s involvement, together with the World Bank and SIDA, in developing the concept of the first Primary Education Development Programme (PEDP-I). However, in 1997 it became apparent that the government was not ready for a SWAp and that PEDP-I would be implemented through a project approuch (see Box 3.1).
Box 3.1 History of PEDP-I
The move towards a more coordinated approach towards primary education sector support started during the mid/late 1990’s at the time of preparation of PEDP-I (1997-2003), the predecessor of PEDP-II. In its original design, it was intended that PEDP-I would follow a programmatic approach to facilitate coordination and build up capacity within Government institutions instead of setting up parallel imple-mentation structures. However, the Government, World Bank and other donors faced difficulties in reaching agreement on key policies and other issues before negotiations (World Bank, 2004).
VKB041-1 283324_B85_BW v5.indd 67 10-10-11 09:55
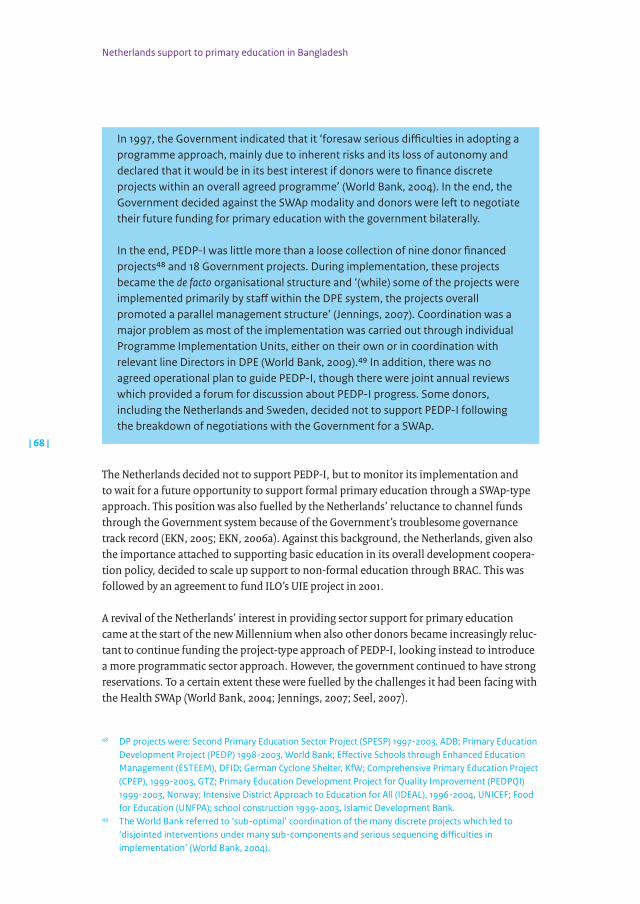
Netherlands support to primary education in Bangladesh
| 68 |
In 1997, the Government indicated that it ‘foresaw serious difficulties in adopting a programme approach, mainly due to inherent risks and its loss of autonomy and declared that it would be in its best interest if donors were to finance discrete projects within an overall agreed programme’ (World Bank, 2004). In the end, the Government decided against the SWAp modality and donors were left to negotiate their future funding for primary education with the government bilaterally.
In the end, PEDP-I was little more than a loose collection of nine donor financed projects48 and 18 Government projects. During implementation, these projects became the de facto organisational structure and ‘(while) some of the projects were implemented primarily by staff within the DPE system, the projects overall promoted a parallel management structure’ (Jennings, 2007). Coordination was a major problem as most of the implementation was carried out through individual Programme Implementation Units, either on their own or in coordination with relevant line Directors in DPE (World Bank, 2009).49 In addition, there was no agreed operational plan to guide PEDP-I, though there were joint annual reviews which provided a forum for discussion about PEDP-I progress. Some donors, including the Netherlands and Sweden, decided not to support PEDP-I following the breakdown of negotiations with the Government for a SWAp.
The Netherlands decided not to support PEDP-I, but to monitor its implementation and to wait for a future opportunity to support formal primary education through a SWAp-type approach. This position was also fuelled by the Netherlands’ reluctance to channel funds through the Government system because of the Government’s troublesome governance track record (EKN, 2005; EKN, 2006a). Against this background, the Netherlands, given also the importance attached to supporting basic education in its overall development coopera-tion policy, decided to scale up support to non-formal education through BRAC. This was followed by an agreement to fund ILO’s UIE project in 2001.
A revival of the Netherlands’ interest in providing sector support for primary education came at the start of the new Millennium when also other donors became increasingly reluc-tant to continue funding the project-type approach of PEDP-I, looking instead to introduce a more programmatic sector approach. However, the government continued to have strong reservations. To a certain extent these were fuelled by the challenges it had been facing with the Health SWAp (World Bank, 2004; Jennings, 2007; Seel, 2007).
48 DP projects were: Second Primary Education Sector Project (SPESP) 1997-2003, ADB; Primary Education Development Project (PEDP) 1998-2003, World Bank; Effective Schools through Enhanced Education Management (ESTEEM), DFID; German Cyclone Shelter, KfW; Comprehensive Primary Education Project (CPEP),1999-2003,GTZ;PrimaryEducationDevelopmentProjectforQualityImprovement(PEDPQI)1999-2003,Norway;IntensiveDistrictApproachtoEducationforAll(IDEAL),1996-2004,UNICEF;Foodfor Education (UNFPA); school construction 1999-2003, Islamic Development Bank.
49 The World Bank referred to ‘sub-optimal’ coordination of the many discrete projects which led to ‘disjointed interventions under many sub-components and serious sequencing difficulties in implementation’ (World Bank, 2004).
VKB041-1 283324_B85_BW v5.indd 68 10-10-11 09:55

The two-pronged approach: Evaluation of Netherlands support to primary education in Bangladesh
| 69 |
The Government perceived the proposed education SWAp primarily as a mechanism for donor control and expressed preference for PEDP-II being the next phase of coordi-nated projects in support of primary education.50 The donors needed to move slowly in persuading government that there was nevertheless a rationale for adopting some features of the SWAp modality in the education sector, whilst learning from the experiences in the health sector (Seel, 2007). In the end, the government agreed to enter into discussions around a possible SWAp. Starting in 2001, the Netherlands embassy became closely involved in the preparation of PEDP-II. Initially that was through participation in an assessment of PEDP-I (DFID/EKN, 2002). Subsequently, inputs were provided for the development of the Macro Plan for PEDP-II together with MoPME, other donors and ADB consultants. This Plan, later referred to as the ‘PEDP-II Final Plan’ (MoPME, 2003), served as a ‘broad framework for supporting the primary education sub-sector’.51 Finally, the embassy participated in nego-tiations of the Plan with the Government which resulted in an agreement on the PEDP-II approach in December 2002.
The agreement to co-fund PEDP-II through ADB came only when the embassy felt that concerns about fiduciary risks were sufficiently addressed during PEDP-II appraisal (2003) and when suggested risk mitigating measures with respect to (financial) management had been accepted. It was acknowledged that a full SWAp was not possible and the embassy shared the opinion that ‘(basket) funding or other modalities of co-financing with other donors (were) the option for the short and medium-term future’ (EKN, 2004b).
Since its involvement in PEDP-II, the Netherlands has been following what is referred to as a ‘two-pronged approach’, ‘seeking active partnerships with both government and NGOs in a balanced way to contribute in partnership to attaining the MDGs, also aiming at increased Government-NGO co-operation’ (EKN, 2005). This position has been advocated both in relation to MoPME and in the negotiations with FIVDB and BRAC, most recently during the exchanges on BRAC’s proposal for BEP-II. It has increasingly been realised that (exclusive) ‘reliance on NGOs for quick fixes and results would discredit the essence of a sustainable development process in which government takes its responsibilities’ (EKN, 2004a; EKN, 2003a). The embassy also cautioned against ‘supporting permanent parallel NGO structures which may hinder the development of a responsible and responsive local government structure’ (EKN, 2005).
The continuation of the ‘two pronged’ approach throughout the evaluation period can be explained by the following factors:
50 As Jennings (2007) suggests ‘At the time the Primary and Mass Education Division (PMED), the Ministry in charge of primary education, was wary of a sector wide approach, even for the sub-sector, and the official view of GoB was ambivalent. Officials within PMED had unpleasant memories of what they considered the very aggressive push by donors for a SWAp at the end of the General Education Project. Whenever the term was used, it seemed to attract negative reactions. These reactions often prevented meaningful dialogue on what was actually meant by a SWAp, the supposed emphasis on Government ownership or the need for coordination and comprehensive planning’.
51 Since there were, and still are two ministries, MoE and MoPME, a SWAp for the education sector as whole was not conceived as an option.
VKB041-1 283324_B85_BW v5.indd 69 10-10-11 09:55

Netherlands support to primary education in Bangladesh
| 70 |
• The Government’s governance track record was one of the reasons for maintaining various aid channels as this permitted spreading the risks of aid delivery.
• Though the formal primary education system has expanded, it was not yet sufficiently robust to cater for the educational needs of all primary school aged children. ‘In order to achieve the education MDGs and EFA goals, NGOs will have to continue playing an important complementary role (…) for the coming years, in particular in order to reach the underprivileged and children in remote areas as well as for the provision of alterna-tive streams for drop-outs and out-of-school children’. (EKN, 2004b; EKN, 2008). Limited progress of PEDP-II in this respect suggests that this need will remain, at least in the short to medium term.
• It had not been feasible to incorporate support for non-formal education (NFE) through NGOs into the design of PEDP-II. Although the ideal would have been ‘one sector programme for the entire basic education sector’, it was realised ‘that financing NGOs via GoB will not be an easy thing to achieve in Bangladesh; this is mainly related to the lack of trust between these (…) players in the field of education’ (EKN, 2004a; EKN, 2003a).52
• Continued confidence in organisations like BRAC and FIVDB, coupled with the commit-ment of the NGO sector to the Government’s education sector policy, was deemed ‘suffi-ciently positive to justify continued channelling of funds to a limited number of strategic partners’ (EKN, 2008).
3.5 Netherlands embassy & policy dialogue in the education sector
Throughout the evaluation period there has been a full-time embassy staff member almost exclusively responsible for the education sector programmes supported by the Netherlands. The embassy has been an active member of the education sector donor community in Bangladesh. It sees itself as a relatively small player in the case of PEDP-II and consider-ably more important in the case of the programmes with BRAC, FIVDB, ILO, CAMPE and BU-IED. This evaluation confirms that this ‘active partnership’ has been appreciated, by the Government, other donors and the NGO community. Together with other ‘like-minded’ donors such as DFID, the embassy has stressed the importance of:53 (i) relationships between donors and the Government in general and MoPME and DPE in particular, with a focus on cooperation, harmonisation and alignment; (ii) education sector governance, with particular attention for issues of financial management and fiduciary risks and (iii) coopera-tion between MoPME and the Bangladeshi NGOs receiving external funding for education.
52 A separate programme was implemented with NGOs by GoB under the World Bank supported ‘Reaching out of School Children (ROSC)’ project. Closure of the Government’s Bureau for Non-Formal Education in 2003 following allegations of mismanagement and corruption reinforced the position of the Netherlands and other DPs that support to NFE could only be provided directly through NGOs.
53 For consultations between the embassy and Netherlands NGOs, the ‘Bangladesh Overleg Ontwikkelingssamenwerking en Mensenrechten’ (BOOM) was set up. However, to date BOOM has been more operational in the field of sexual and reproductive rights and health while the thematic group on education is ‘not active’ (BOOM, 2008). At the same time, the embassy and Oxfam Novib meet in forums related to BRAC and CAMPE, which receive support from both parties.
VKB041-1 283324_B85_BW v5.indd 70 10-10-11 09:55
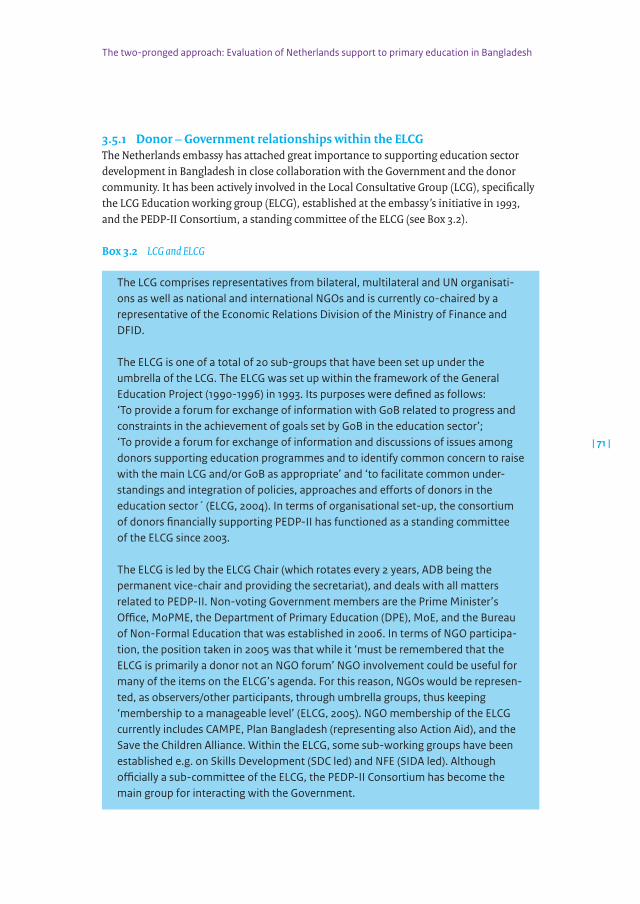
The two-pronged approach: Evaluation of Netherlands support to primary education in Bangladesh
| 71 |
3.5.1 Donor – Government relationships within the ELCG The Netherlands embassy has attached great importance to supporting education sector development in Bangladesh in close collaboration with the Government and the donor community. It has been actively involved in the Local Consultative Group (LCG), specifically the LCG Education working group (ELCG), established at the embassy’s initiative in 1993, and the PEDP-II Consortium, a standing committee of the ELCG (see Box 3.2).
Box 3.2 LCG and ELCG
TheLCGcomprisesrepresentativesfrombilateral,multilateralandUNorganisati-ons as well as national and international NGOs and is currently co-chaired by a representative of the Economic Relations Division of the Ministry of Finance and DFID.
TheELCGisoneofatotalof20sub-groupsthathavebeensetupundertheumbrellaoftheLCG.TheELCGwassetupwithintheframeworkoftheGeneralEducation Project (1990-1996) in 1993. Its purposes were defined as follows: ‘To provide a forum for exchange of information with GoB related to progress and constraints in the achievement of goals set by GoB in the education sector’; ‘To provide a forum for exchange of information and discussions of issues among donors supporting education programmes and to identify common concern to raise withthemainLCGand/orGoBasappropriate’and‘tofacilitatecommonunder-standings and integration of policies, approaches and efforts of donors in the educationsector´(ELCG,2004).Intermsoforganisationalset-up,theconsortiumof donors financially supporting PEDP-II has functioned as a standing committee oftheELCGsince2003.
TheELCGisledbytheELCGChair(whichrotatesevery2years,ADBbeingthepermanent vice-chair and providing the secretariat), and deals with all matters related to PEDP-II. Non-voting Government members are the Prime Minister’s Office, MoPME, the Department of Primary Education (DPE), MoE, and the Bureau of Non-Formal Education that was established in 2006. In terms of NGO participa-tion, the position taken in 2005 was that while it ‘must be remembered that the ELCGisprimarilyadonornotanNGOforum’NGOinvolvementcouldbeusefulformanyoftheitemsontheELCG’sagenda.Forthisreason,NGOswouldberepresen-ted, as observers/other participants, through umbrella groups, thus keeping ‘membershiptoamanageablelevel’(ELCG,2005).NGOmembershipoftheELCGcurrently includes CAMPE, Plan Bangladesh (representing also Action Aid), and the SavetheChildrenAlliance.WithintheELCG,somesub-workinggroupshavebeenestablished e.g. on Skills Development (SDC led) and NFE (SIDA led). Although officiallyasub-committeeoftheELCG,thePEDP-IIConsortiumhasbecomethemain group for interacting with the Government.
VKB041-1 283324_B85_BW v5.indd 71 10-10-11 09:55

Netherlands support to primary education in Bangladesh
| 72 |
The Netherlands embassy chaired the ELCG and the PEDP-II Consortium from August 2002 to April 2004 and most recently chaired the ELCG since April 2008. The embassy took up this role since it viewed the ELCG as an important forum for furthering collaboration in the education sector. Moreover, the position of ELCG chair provided ‘valuable insights on a wide diversity of issues in education’ (ELCG, 2005).
Interviews, records of meetings, and PEDP-II documentation indicate that the ELCG has:
• Facilitated the exchange of information among donors, amongst others in relation to PEDP-II.
• Functioned as a forum at which donors could jointly develop and express views on key education policy initiatives.54
• Provided the framework for the organisation of meetings, workshops and retreats, e.g. on school nutrition (2005) and on ‘Future roles and partnerships in NFE’ (ELCG, 2009).
The ELCG is commonly regarded as a donor forum. Government involvement has remained limited to occasional attendance of meetings or annual retreats. It is nevertheless under-stood that MoE and MoPME have considered the arrangements to date as ‘functional’. It has been suggested that the lack of involvement relates to: (i) the turn-over of Government staff55 and (ii) the presence of other forums for discussion between MoPME and donors. It has recently been agreed ‘that Government will take over the chairing of the different LCG Working Groups and that a donor will be the co-chair (to be implemented in 2010)’ (EKN, 2009). This implies a change in comparison with the early years. It is however too early to assess how this will work in practice.
The embassy has been actively involved in the Joint Annual Review Missions (JARM) of PEDP-II and in PEDP-II thematic working groups that were set up following the PEDP-II Mid Term Review of 2007, in particular those concerning Management, Procurement and Finance (member), Quality (member) and Governance (chair). Unlike the ELCG, these working groups have significant representation from Government and PEDP-II donors. In addition, common quarterly meetings with the Secretary of MoPME have been held since October 2005 together with regular ‘thematic reviews’ e.g. on school level planning (2005) and teacher recruitment and professional development (2006). The embassy also partici-pated in a PEDP-II Task Force on Innovative Grants in 2005.
The embassy has also been instrumental in reaching agreement on the Code of Conduct (CoC) among donors for PEDP-II. This CoC, though not a legally binding document and more a ‘gentlemen’s agreement’, (EKN, 2003c) outlines the governance of the donor
54 For example, in relation to the educational components of the Government’s Draft PRSP (Unlocking the Potentials), the amended concept-paper on post PEDP-II and the Draft National Education Policy 2009.
55 This issue was also observed by the World Bank in relation to the first primary education development project. The World Bank related this to the fact that many positions at DPE were filled by seconded staff on fixed term contracts who returned to their institutions once the project was over. See also Hughes d’Aeth and Mannan, 2010.
VKB041-1 283324_B85_BW v5.indd 72 10-10-11 09:55
The two-pronged approach: Evaluation of Netherlands support to primary education in Bangladesh
| 73 |
consortium as well as rules and regulations concerning PEDP-II.56 The evaluation shows that, although it took time to get the different donors on board, the CoC has been a significant document in Bangladesh for cooperation in the education sector. Even though it has not always been easy to make sure that donors comply with the Code (ELCG, 2006b), the existence of the CoC and the donor commitment to it mark a significant improve-ment in donor harmonisation. This is supported by the view, both within MoPME and among the donors, that, over the years, relationships between the Government and donors have improved and that Government leadership and ownership have been enhanced. For example MoPME and DPE have played a stronger role in meetings with the donor Consortium, during the Joint Annual Review Missions (JARM) and in the preparation of a successor to PEDP-II.
3.5.2 Donor – Government relationships within the framework of PEDP-IIPEDP-II can be viewed as a test case to assess to what extent donors and Government are serious about harmonising procedures. Harmonisation requires adjustment from both sides. This section argues that some progress has been made, but at the cost of delays in implementation and large time investments.
A key feature of PEDP-II has been that separate Programme Implementation Units were not established. Rather, it operated through government systems with the same DPE officials ‘responsible for regular works (…) also responsible for programme implementation’, which ‘guards against discontinuities of project staff and loss of institutional memory’ (Natural Resources Partners Ltd., 2008). The evaluation confirms that combining regular work and the responsibility for PEDP-II implementation has not been easy and that, certainly during the early years, this implied ‘a pretty steep learning curve that involved a long ‘learning by doing’ exercise’ (ADB, 2007). Key issues in this respect have been:
• The complex design of PEDP-II, coupled with inadequate background analysis of the sector and the institutional capacity of DPE at the design stage. The situation was compounded by the fact that PEDP-II, in the absence of a regulatory framework for sector-wide programmes, started under a ‘conventional ‘Project Proforma’ (PP) that was normally used for singular projects. The rigidity of the PP did not allow for sufficient flexibility in responding to emerging needs and requirements and implied that, where activities were not incorporated into the PP, it was not possible for DPE to implement them. Following the MTR of 2007 it was agreed that for effective implementation of PEDP-II this needed to change. The revised format, which focused on the ability to real-locate funds and the provision of separate uncommitted funds to support unforeseen but
56 The CoC stipulates that members of the donor Consortium ‘are committed to a systemic development of primary education in Bangladesh, with the ensuing commitment to support the policies of the Government of Bangladesh (GoB), work with GoB systems, and accept common procedures and requirements (…)’. The document also stresses that donors will endeavour to communicate to GoB and other stakeholders with a common voice. Moreover, ‘(reporting) will be harmonised so that one common reporting system will be used for all activities under the PEDP-II’ … Finally, ‘Audit requirements will be harmonised so that one common financial reporting system and one set of audit requirements will be used for all activities funded through GoB in PEDP-II, and by all Consortium members’.
VKB041-1 283324_B85_BW v5.indd 73 10-10-11 09:55

Netherlands support to primary education in Bangladesh
| 74 |
related activities, was approved on 26 May 2008. This was a major accomplishment and a further indication of the improving relations between the government and donors (ADB/PLU, 2008). The PP was revised once more after the Joint Annual Review Mission of 2009 (ADB/PLU, 2009a).
• Unrealistic expectations as regard the Government’s capacity to handle the Programme, ‘to introduce reforms and improvements as well as to introduce and scale up implemen-tation of substantial activities through its regular system – which is already stretched in implementing its regular work’ (MoF GoB, 2008).57
• Problems of staff deputation, transfers and chronic staff vacancies. Reports suggest that this was particularly acute for DPE which was staffed by people from the Administrative Cadre and the Education Cadre (for secondary teachers and officials under MoE). They lacked the necessary knowledge to quickly adjust once they were appointed to post (Jennings, 2007). The situation was compounded by the fact that matters like the primary education cadre, filling of vacancies and finances were outside the jurisdiction of MoPME and/or DPE.
There is evidence of progress made in terms of harmonisation and alignment of procedures as described below.
Firstly, there has been some streamlining of financial management and the introduction of common Financial Monitoring Reports. Nevertheless, three different dollar accounts58 continue to be used. Moreover, until the MTR of 2007, DPE had to prepare two sepa-rate budgets, one mainly for the donors, and the other for MoPME and the Planning Commission. At the MTR of 2007, agreement was reached to have only one. In a number of cases, the complexities of financial systems under PEDP-II have slowed down progress.59 This concerned in particular the SLIP and Upazila Primary Education Plans (UPEP) components.
Secondly, there has been a streamlining of procurement regulations, though different sets of rules and regulations are followed.60 While further alignment to the Government’s procurement system has been recommended, the ‘recent change of the Public Procurement
57 An Organisational and Institutional Capacity Review, planned for April 2005 was approved only in January 2007. While a Human Resource Development and Management (HRDM) strategy was approved in 2006, approval of the HRMD action plan followed only in February 2008. Since this was a condition foroverseastrainingtotakeplace,capacitybuildingstartedonlyinthesecondhalfof2008(ADB/PLU,2008). The situation was compounded by the late deployment of TA, which was moreover not always of the quality needed (World Bank, 2009). Coordination among the different TA packages has been an issue flagged by the donors.
58 I.e. ADB funds, ADB administered bilateral grants and IDA fund, in addition to the Government fund that was routed through the accountant general’s office in a commercial bank (see ADB, 2008b).
59 Hence,parallelfundingfortheSLIPswasprovidedbyUNICEFthroughADBadministeredbilateralgrants and the IDA fund.
60 The different sets of rules and regulations are: (i) for local procurement financed by pool funding GoB proceduresareused,basedonthe2003ProcurementLaw,whichhadbeenpositivelyappraisedbytheWorld Bank; (ii) ICB goods financed by IDA follow World Bank procedures, while for other DPs the ADB guidelines are followed. Recruitment of international TA mostly follows ADB guidelines but occasionally the rules of the individual donors.
VKB041-1 283324_B85_BW v5.indd 74 10-10-11 09:55

The two-pronged approach: Evaluation of Netherlands support to primary education in Bangladesh
| 75 |
Act 2009 has raised concerns regarding the transparency and effectiveness of the public procurement system’. These were discussed between the World Bank, ADB and the Government. The World Bank decided to make the use of its own procurement rules mandatory for World Bank funded projects (EKN, 2009).
Thirdly, it was agreed to have common auditing procedures with audits done by the Controller and Auditor General of Bangladesh. Unless the situation required a special external or additional audit, this was the single external audit used by both the Government and the donors for pooled funding under PEDP-II. It was also commonly agreed for pooled funds to have an annual post review procurement audit by a private, independent firm that would be carried out on a sample basis covering at least 20% of the contracts. Such out-sourcing of the audits remained necessary since DPE did not have the necessary in-house auditing capacity.
Finally, since the start of PEDP-II there has been a common set of qualitative and quan-titative indicators, the Primary School Quality Level (PSQL) indicators. These feature in a common annual operational plan, which is the basis for the Annual Sector Performance Reports prepared since 2008. In addition, common Annual Progress Reports have been prepared. These reports have provided inputs for the Joint Annual Review Missions (JARM) that have been organised since the start of PEDP-II.
It was anticipated that following a programmatic approach would reduce ‘transaction costs’, i.e. the costs involved in developing and implementing PEDP-II, for both MoPME and donors. Interviews and documentation show that PEDP-II may have resulted in reducing transaction costs for MoPME, but that this was not the case for donors (ADB, 2008; World Bank, 2010; Hughes d’Aeth and Mannan, 2010). That donors incurred higher transaction costs than expected, was caused by:
• The time consuming harmonisation and alignment process itself and the institutional set-up for collaboration with both the Government and among a considerable number of donors, coupled with limited division of labour within the donor community (ADB, 2008).
• Limited confidence of donors in the ability of the ADB’s Programme Liaison Unit. The PLU was to operate on behalf of donors as intermediary between the Government and donors and to streamline and coordinate PEDP-II implementation to avoid micro-management by individual donors. Two issues stand out in this respect: (i) a lack of qualified staff at the PLU and (ii) a tendency to speak and act on behalf of GoB and not on behalf of the (donors) ‘as they should’ (EKN, 2008).
• Continued concerns about the DPE’s ability to effectively monitor and report. Fortunately, this substantially improved as of 2008 with the institutionalisation of Results Based Management (RBM) at DPE and the preparation of high quality Annual Sector Performance Reports.
VKB041-1 283324_B85_BW v5.indd 75 10-10-11 09:55

Netherlands support to primary education in Bangladesh
| 76 |
3.5.3 Government – NGO cooperationOne aim of the Netherlands ‘two-pronged approach’ was that it could contribute to enhanced Government – NGO collaboration so that their combined efforts would enable Bangladesh to attain MDG 2.
The consortia that were set up for the programmes with CAMPE and BRAC have been used by the Netherlands embassy as a platform to convince NGOs of the importance of enhanced NGO-Government collaboration. The embassy has also held meetings with representatives of BRAC, FIVDB, and CAMPE, stressing the importance of liaising with the Government and discussing Government policy priorities and developments, e.g. in the fields of teacher training and curriculum development. The two-pronged approach also explains why support has been provided to CAMPE since 2002 as it was a ‘strategic and relatively low-cost intervention’ that supplemented PEDP-II and BRAC funding. CAMPE has been characterised as an NGO undertaking a ‘balancing act’ between Government, NGOs and civil society organisations ‘towards achieving the common goal of EFA’ (EKN, 2007).
Efforts to enhance Government – NGO collaboration, have been slowly bearing fruit over the years after a considerable period of mutual mistrust (CIDA, 2009). Relations have been more positive, especially since the Caretaker Government (2008-2009) ‘showed a more pragmatic approach and intensified’ the policy dialogue between the Government, NGOs and civil society (EKN, 2008). It is also evident that not only the Netherlands but also other donors have taken steps aimed at strengthening cooperation between MoPME and the NGO sector.
Signs of a more positive relationship include the following:
• The agreement (2004) between the Government and BRAC on the establishment of NGO pre-schools either on the premises of a GPS or within its catchment area. This feeds children directly into Grade I in the GPS. This is coupled with increased contacts between BRAC, other NGOs and local education officers and head teachers of GPS. MoPME is also invited to attend annual BRAC meetings. BRAC schools, like other NGO schools following the national curriculum, are also provided with free textbooks. At the same time, there is no evidence of BRAC approaches or materials spilling over into government schools. Discussions with Government officials suggest that MoPME still regards the BRAC schools very much as second chance schools for poorer children. Hence the interest in learning from the BRAC experience appears to be limited.61
• BRAC is actively working in secondary education and has built a good relationship with MoE through its Post Primary and Continuing Education Programme. This Programme works with government supported secondary schools, delivering teacher training, running community libraries and producing materials including textbooks and
61 In 2001, a Primary Initiative in Mainstreaming Education was initiated by BRAC. The initiative included the training of head teachers, teachers and SMC members of all primary schools. In 2005 the initiative was renamed Partnership with Primary Schools. It was implemented in close to 1,000 schools in three Upazilas. A BRAC proposal for more formal cooperation was not followed-up (Boeren, 2009) despite the positive results reported (Nath et al, 2007b).
VKB041-1 283324_B85_BW v5.indd 76 10-10-11 09:55
The two-pronged approach: Evaluation of Netherlands support to primary education in Bangladesh
| 77 |
IT resources. BU-IED has also worked on the development of materials for secondary education and is in the initial stages of working with NCTB on primary education materials.
• Opening up of PEDP-II for NGOs through its component for innovative grants. CAMPE organised a workshop to discuss the grants in 2008 but indications are that progress has been slow.
• The involvement of CAMPE in education policy making and information dissemination related to PEDP-II. CAMPE has represented the NGO community in national committees related to EFA, early childhood policy formulation, literacy assessment survey and the development of the New Education Policy (for which BRAC was consulted as well). BU-IED is also represented on committees related to development of Early Childhood Care for Development policy and a new government teacher training diploma.
• After concerns raised by civil society about the progress of PEDP-II, MoPME organised several events to brief the NGO community (e.g. in 2007). During the Literacy Week of September 2006, CAMPE moreover organised a series of workshops for the dissemina-tion of the Government’s new NFE Policy (ELCG, 2007). At the request of DPE, CAMPE also organized a consultation forum on the state of primary education in general and PEDP-II in particular in May 2009.
Despite these positive trends, there is still scope for further improvement, especially since there is still insufficient ‘recognition by the government of NFE initiatives by the NGOs and weak recognition of the government’s NFE initiatives by the NGOs’ and a ‘(lack) of strategic partnership between the government and NGOs in NFE’ as a result of the ‘focus on contrac-tual relationship rather than strategic and supportive relationship’ (EKN, 2008). Effective partnership arrangements for mutual service delivery between NGOs and the Government have therefore remained a key issue for the Netherlands.
Netherlands core funding has been instrumental in enabling CAMPE to influence education sector policy making. The 2004 review of support to CAMPE mentions anecdotal evidence which ‘shows visible impact coming from CAMPE’s endeavours to create an enabling environment through its advocacy activities’. Further, it suggests that CAMPE is seen as ‘a critical actor in the NGO sub-sector and more broadly, in the basic education sector’ (Asseldonk, 2004). The profile of CAMPE was raised due to the Executive Director of CAMPE being adviser on education to the Caretaker Government and this may have influenced its ability to influence policy during that period. A review (CAMPE, 2009), identifies a signifi-cant number of policy areas and developments that have been influenced by CAMPE. These include:
• Free school books provided by the Government to NGO schools• A circular issued by MoPME to reinforce the ban on physical and humiliating punishment• A circular issued by MoPME on a flexible school calendar• Private companies getting a tax break when engaged in educational activities• The formulation of the NFE Policy and the draft National Education Policy• Involvement in the process to develop the follow on programme to PEDP-II.
VKB041-1 283324_B85_BW v5.indd 77 10-10-11 09:55

Netherlands support to primary education in Bangladesh
| 78 |
3.5.4 Education sector governance and fiduciary risksGovernance and fiduciary risk have been high on the Netherlands embassy’s agenda especially in relation to PEDP-II (EKN, 2004a). This is in line with the overall Netherlands development policy in Bangladesh which emphasises increasing transparency and account-ability in public sector management. It also follows logically from the Netherlands’ involve-ment, together with DFID, in the Financial Management Reform Programme (EKN, 2004a). Attention for governance and fiduciary risks also explains the embassy’s prominent role in the ELCG and in the thematic working groups on governance, management, procurement and finance.
A donor Consortium Governance Working Group was set up in 2006, involving representa-tives from the Netherlands, ADB, DFID, Norway, SIDA and the World Bank. This working group was to assist the Consortium in reviewing, analysing and monitoring progress in education governance reforms envisaged under PEDP-II. In parallel, a Governance review committee (GRC) was set up in December 2006 within DPE. Rather than developing a comprehensive governance strategy, it was agreed to go for practical actions and plans in agreed areas of concern (ADB, 2007). This incremental approach has been advocated over the years (Steel, 2007).62 In June 2007, the embassy financed participation of DPE and BRAC representatives to attend training at the International Institute for Education Planning (IIEP) on ‘Transparency, accountability and anti-corruption measures in education’. The embassy also pushed for a Governance Report for mainstreaming governance in PEDP-II activities to be accepted by MoPME (Governance Working Group, 2008) – this happened in 2008.
On education sector financing and fiduciary risks, following the study on risks and risk reduction (Wood, 2003), a Financial Risk Mitigation Strategy in Finance and Procurement (FRMSFP) was developed. The strategy, approved in December 2006, aimed to introduce a system of financial management and internal control that provided reasonable assurance for proper financial management and application of the existing procurement law and rules and regulations. The FRMSFP included a set of measurable procurement performance indi-cators and provided for ‘comprehensive mitigating measures to address potential risks in financial management and procurement under PEDP-II and a code of conduct for officials involved in finance and procurement actions’ (EKN, 2008). A Financial Management Unit and a new Finance and Procurement Division were established at MoPME and DPE respec-tively and manuals were introduced for financial management and procurement.
Despite these improvements, the Netherlands embassy, together with other donors, has continued to press for adequate follow-up on remaining weaknesses and irregulari-ties. A good example is its active role in the audit sub-group of the Procurement and
62 Initiatives were undertaken in the following areas: (a) public information (establishment of a management information cell within DPE, producing more reliable basic data, a documentation centre and website); (b) human resource planning and management through the introduction of a more transparent and fairer primary school teacher recruitment system for GPS, thereby avoiding undue influence from officials and political parties on the process of appointing teachers; (c) streamlining administrationandsupportingdecentralization(throughe.g.theSLIPSandsupportforSMCs).
VKB041-1 283324_B85_BW v5.indd 78 10-10-11 09:55
The two-pronged approach: Evaluation of Netherlands support to primary education in Bangladesh
| 79 |
Finance Working Group. This sub-group took serious action to address unresolved post-procurement observations that were made by external auditors on expenditures for school construction in 2003-2004 and 2004-2005. The action taken has resulted in the cancella-tion of 15 contract packages with a total value of some US$ 1.1 million or 0.1% of the total PEDP-II budget. Moreover, it was agreed that questionable expenditures were ‘non-eligible’ and withdrawn from the donor contribution to PEDP-II (ADB/PLU, 2009a). Agreement was reached between the Government and donors on ‘checks and balances to further mitigate these risks’ (EKN, 2008) and the number of critical audit observations has shown a decline since 2008. Nevertheless, donors indicated in early 2010 ‘that serious efforts are required from the concerned agencies to strengthen procurement and financial control and manage-ment mechanisms to ensure that the system function effectively and the number of audit observations will be minimised’ (DP, 2010).
Other concerns voiced by the embassy related to the low expenditure rate on PEDP-II and the management and level of long outstanding advances. It was at the same time acknowl-edged that there were a number of reasons for such low expenditure. These included:
• Start-up delays due to inadequate preparation• Low implementation capacity, especially in non-infrastructural activities• Increased additional funding from some donors and the Government ‘despite low
absorptive capacity’ (World Bank, 2009; EKN, 2009) and • Delays in the implementation of activities as a result of tighter financial management and
procurement practices.
The issue of under-spending was shared with other donors and MoPME, as it implied the risk that funds set aside for PEDP-II would have to be returned if they remained unused. Expenditure rates improved in 2009.
In comparison with PEDP-II, the embassy’s approach vis-à-vis BRAC, CAMPE and BU-IED has been considerably more hands-off. In these cases, agreements were reached on a common system of progress and financial reporting, regular meetings between donors and organisa-tions, joint review and auditing of accounts. The evaluation indicates that the arrangements have been efficient. They have allowed for regular consultations but did not compel the donors, like the Netherlands, to get involved in micro-management. In these cases, transac-tion costs for the embassy were considerably less than in the case of PEDP-II. The same can be observed in relation to FIVDB.
3.6 Summary
This chapter presented the way in which Netherlands support to primary education in Bangladesh has moved from solely supporting informal education to a two-pronged approach channelling resources through both the formal education system (PEDP-II) and education related efforts undertaken by a series of NGOs (BRAC, CAMPE, ILO, BU-IED and FIVDB) and ILO. Netherlands support to primary education during the period 1999-2009
VKB041-1 283324_B85_BW v5.indd 79 10-10-11 09:55
Netherlands support to primary education in Bangladesh
| 80 |
was close to € 119 million, of which 24% devoted to PEDP-II and the balance through other channels. Focusing on issues of access and quality as well as education sector governance, Netherlands’ supported initiatives have been close to the aims of the overall Netherlands policy on basic education as outlined in ‘Education: A Basic Human Right’. The sub-sector approach followed under PEDP-II has ensured alignment with the education policies of the Government of Bangladesh.
The emphasis, as part of the two-pronged approach, on stimulating Government – NGO collaboration has seen some modest success stories, with a pivotal role played by CAMPE. There is, however, still some way to go in ensuring full cooperation between the formal and non-formal education sectors. Effective partnership arrangements for mutual service delivery between NGOs and the Government have remained a key issue especially since both sides insufficiently recognise the importance of their respective initiatives. As will be shown in subsequent chapters, the two-pronged approach has enabled the annual enrolment of close to 1 million children catered for by BRAC, ILO and FIVDB who were outside the formal education system – including poor children in remote areas, children involved in worst cases of child labour and children from other deprived groups.
The Netherlands only agreed to support education through the Government system when (i) other key representatives of the donor community in Bangladesh as well as the Government agreed to replace the system of individual and uncoordinated projects by a common approach for the primary education sub-sector as a whole and (ii) sufficient guar-antees were in place to avoid corruption and fiduciary risks. The Netherlands, through its embassy in Dhaka, has played an active role in the time-consuming process of developing the sub-sector programme PEDP-II. It has continued to be active in the different forums that were set up to ensure coordination among the donors involved in the education sector and between donor community and the Government. A prominent role was also played in, successfully, solving relatively small financial concerns that have cropped up during PEDP-II implementation.
The chapter argues that some progress has been made in harmonisation and alignment, but that this has been at the cost of delays in implementation and considerable time investments and an increase in transaction costs, especially on the donor side. Progress was realised in terms of working through the Government system, streamlining of financial management and, to a certain extent, of procurement, and a common system of auditing as well as reporting on the basis of agreed upon qualitative and quantitative indicators. At the same time, working through the Government has been affected by the complex design of PEDP-II and, from the design stage onwards, insufficient attention for the restrained capacity of the Government system to effectively manage the Programme.
VKB041-1 283324_B85_BW v5.indd 80 10-10-11 09:55

The two-pronged approach: Evaluation of Netherlands support to primary education in Bangladesh
| 81 |
VKB041-1 283324_B85_BW v5.indd 81 10-10-11 09:55

4
Education Finance and Governance
VKB041-1 283324_B85_BW v5.indd 82 10-10-11 09:55

| 83 |
The two-pronged approach: Evaluation of Netherlands support to primary education in Bangladesh
4.1 Introduction
This chapter focuses on education finance and governance. It provides information on Government and donor spending on education, public resources going to different types of schools, the sustainability of funds flowing to the education sector and the question to what extent public expenditure on education has been pro-poor. It also analyses public and private spending on education and pays attention to issues of internal and external efficiency. Particular attention is paid to budget execution, financial management and leakages that may occur in the education system. The chapter is concluded with a brief on institutional developments in the primary education sector at central level. Focus is in this respect on MoPME and DPE.
4.2 Education Spending and Sources of Finance
4.2.1 Public education spendingThat Government gives priority to education in general and primary education in particular is evidenced by the following key indicators:63 (i) the share of education in the Government’s budget; (ii) the share of education in GDP from the 1980s to the 2000s and (iii) the percentage of the total education budget allocated to primary education. Education has consistently been one of the sectors receiving the largest share of the Government budget hovering at around 14.5% of total government spending without a clear upward or downward trend (see Figure 4.1). Public education expenditure represented some 16% of total government expenditure in 2007; this is close to what has been reported for Lao PDR, Nepal and Pakistan but below the shares reported for Malaysia (28%) and Thailand (25%).64
63 It should be kept in mind that various studies have come up with different estimates of the share of primary education in total public spending on education as well as GDP. Since the Ministry of Finance publishes updates of budget allocation and expenditures estimates at certain times annually, the variation observed may be related to the studies using these estimates at different stages of update. The series used stops in 2008 because actual education expenditures were not yet available at the time data were being collected for this report. What was available for 2009 are budget allocation estimates, which would tend to be higher than actual spending. The figures used are therefore indicative.
64 World Bank, Development Indicators and adapted from DPE/PINZ, 2010.
VKB041-1 283324_B85_BW v5.indd 83 10-10-11 09:55
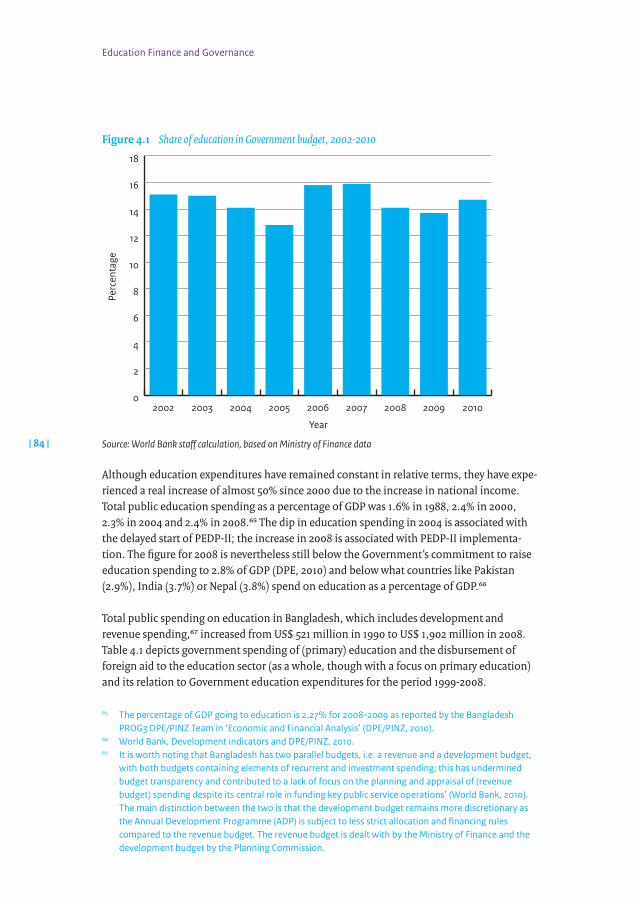
Education Finance and Governance
| 84 |
Figure 4.1 Share of education in Government budget, 2002-2010
0
2
4
6
8
10
12
14
16
18
201020092008200720062005200420032002
Year
Perc
enta
ge
Source: World Bank staff calculation, based on Ministry of Finance data
Although education expenditures have remained constant in relative terms, they have expe-rienced a real increase of almost 50% since 2000 due to the increase in national income. Total public education spending as a percentage of GDP was 1.6% in 1988, 2.4% in 2000, 2.3% in 2004 and 2.4% in 2008.65 The dip in education spending in 2004 is associated with the delayed start of PEDP-II; the increase in 2008 is associated with PEDP-II implementa-tion. The figure for 2008 is nevertheless still below the Government’s commitment to raise education spending to 2.8% of GDP (DPE, 2010) and below what countries like Pakistan (2.9%), India (3.7%) or Nepal (3.8%) spend on education as a percentage of GDP.66
Total public spending on education in Bangladesh, which includes development and revenue spending,67 increased from US$ 521 million in 1990 to US$ 1,902 million in 2008. Table 4.1 depicts government spending of (primary) education and the disbursement of foreign aid to the education sector (as a whole, though with a focus on primary education) and its relation to Government education expenditures for the period 1999-2008.
65 The percentage of GDP going to education is 2.27% for 2008-2009 as reported by the Bangladesh PROG3 DPE/PINZ Team in ‘Economic and Financial Analysis’ (DPE/PINZ, 2010).
66 World Bank, Development indicators and DPE/PINZ, 2010. 67 It is worth noting that Bangladesh has two parallel budgets, i.e. a revenue and a development budget,
with both budgets containing elements of recurrent and investment spending; this has undermined budget transparency and contributed to a lack of focus on the planning and appraisal of (revenue budget) spending despite its central role in funding key public service operations’ (World Bank, 2010). The main distinction between the two is that the development budget remains more discretionary as the Annual Development Programme (ADP) is subject to less strict allocation and financing rules compared to the revenue budget. The revenue budget is dealt with by the Ministry of Finance and the development budget by the Planning Commission.
VKB041-1 283324_B85_BW v5.indd 84 10-10-11 09:55

The two-pronged approach: Evaluation of Netherlands support to primary education in Bangladesh
| 85 |
Table 4.1 Government and donor spending on education, 19992008 in US$ million68
Year Total GoB Education
expenditure
Total GoB Primary
Education expenditure
GoB primary education
expenditure as % of total
education expenditure
External aid for education
utilized
External aid as % of GoB
education expenditure
1999 998.1 496.1 50% 98.3 10%
2000 1,050.3 522.5 49% 104.6 10%
2001 1,058.6 735.4 69% 95.4 9%
2002 1,109.1 450.2 40% 113.5 10%
2003 1,209.6 464.6 38% 71.2 6%
2004 1,257.9 553.2 44% 78.5 6%
2005 1,376.2 565.5 41% 164.4 12%
2006 1,468.9 624 42% 171.7 10%
2007 1,759.5 689.3 39% 159.2 9%
2008 1,902.8 777.5 41% 187.9 10%
Sources: Composite series from (ERD, 2010; World development indicators; and Rahman, Kabir and Alam, 2005). Taka were converted according to the historical US$ – Taka exchange rates for the years concerned.
Public spending on education has increased annually in the period 1999-2008, except for 2002 when it equalled only 64% of the expenditure of 2001. In between 2000 and 2008, the increase in public spending exceeded the reported annual inflation rate which averaged 6.5% per year. Public primary education spending increased from US$ 205 million to US$ 777 million in the same years.69 As a share of total public spending on education, it was 55% in 2004, 43% in 2000, 44% in 2004 and 41% in 2008.
Figure 4.2 provides an overview of total public education sector spending across the different levels of the education system, administration of the system as well as mainte-nance and other expenditures for the period 2000-2006.
68 Unless otherwise indicated, the data on education are in fiscal years starting on 1 July and closing by 30 June. DPE (2010) estimates that in 2009 the share of primary education of GNP was 45%.
69 Estimates of the share of primary education in the total education budget also vary.
VKB041-1 283324_B85_BW v5.indd 85 10-10-11 09:55
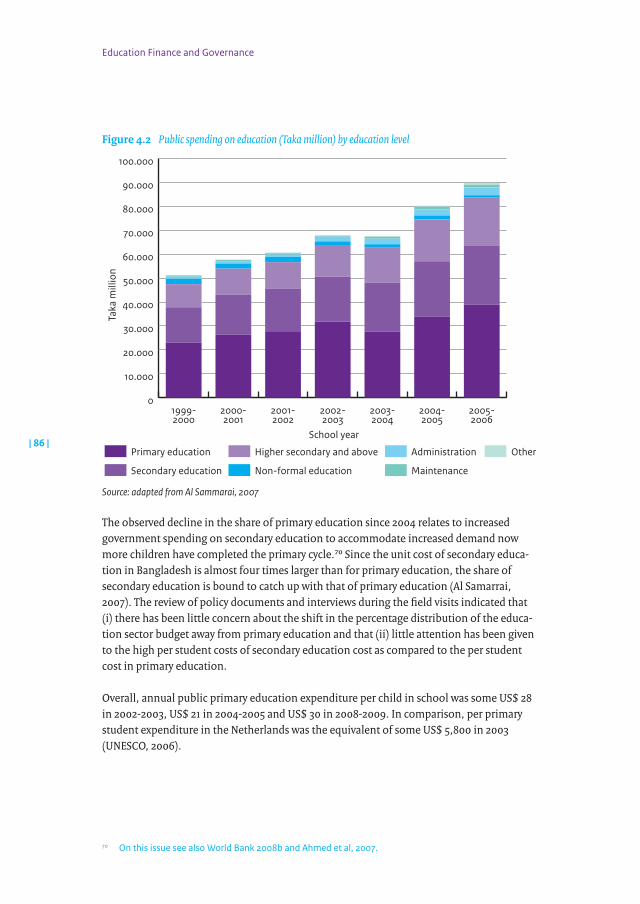
Education Finance and Governance
| 86 |
Figure 4.2 Public spending on education (Taka million) by education level
0
10.000
20.000
30.000
40.000
50.000
60.000
70.000
80.000
90.000
100.000
2005-2006
2004-2005
2003-2004
2002-2003
2001-2002
2000-2001
1999-2000
School year
Taka
mill
ion
Other
Maintenance
Administration
Non-formal education
Higher secondary and above
Secondary education
Primary education
Source: adapted from Al Sammarai, 2007
The observed decline in the share of primary education since 2004 relates to increased government spending on secondary education to accommodate increased demand now more children have completed the primary cycle.70 Since the unit cost of secondary educa-tion in Bangladesh is almost four times larger than for primary education, the share of secondary education is bound to catch up with that of primary education (Al Samarrai, 2007). The review of policy documents and interviews during the field visits indicated that (i) there has been little concern about the shift in the percentage distribution of the educa-tion sector budget away from primary education and that (ii) little attention has been given to the high per student costs of secondary education cost as compared to the per student cost in primary education.
Overall, annual public primary education expenditure per child in school was some US$ 28 in 2002-2003, US$ 21 in 2004-2005 and US$ 30 in 2008-2009. In comparison, per primary student expenditure in the Netherlands was the equivalent of some US$ 5,800 in 2003 (UNESCO, 2006).
70 On this issue see also World Bank 2008b and Ahmed et al, 2007.
VKB041-1 283324_B85_BW v5.indd 86 10-10-11 09:55

The two-pronged approach: Evaluation of Netherlands support to primary education in Bangladesh
| 87 |
The Government, in addition to fully funding the GPS, has increasingly been providing financial and in-kind support to RNGPS and other schools. For example, the Government is now paying for teacher salaries and providing textbooks to RNGPS and a similar subsidy scheme has also been worked out for community schools (see also Table 4.2 below; coloured squares imply a contribution from the side of Government, community or parents as appropriate; school types supported under PEDP-II are in italics).
Table 4.2 Support provided by Government, community and parents to different types of schools
Government Community Parents
Scho
ol b
uild
ings
, cl
assr
oom
s, fu
rnit
ure
Teac
her s
alar
ies
and
allo
wan
ces
Shor
tte
rm a
nd lo
ngt
erm
te
ache
r tra
inin
g
Free
text
book
s fo
r all
grad
es
Stip
ends
for s
tude
nts
(up
to 4
0% o
f enr
olm
ent)
Oth
er (c
onti
ngen
cies
, re
pair
s, e
tc.)
Insi
gnifi
cant
Som
e co
ntri
buti
on
Subs
tant
ial c
ontr
ibut
ion
Adm
issi
on fe
es
Regi
stra
tion
fees
Exam
inat
ion
fees
Tuit
ion
fees
Fees
GPS
RNGPS71
Experimental school attached to PTI
Community school72
Primary school attached to secondary school
Non-registered non-govern-mental school
NGO run full primary school
Kindergarten
Ebtedayee madrasahs
Primary sections of high madrasahs
Source: Adapted from ADB, 2003a, Chowdury et al, 2004, and ADB, 2008
71 Government provides 90% support to meet teachers monthly salaries and limited allowances (house rent, medical, head teacher, and 0.25 months festivals, and pension).
72 Up to Taka 750 for teacher salaries per teacher per month.
VKB041-1 283324_B85_BW v5.indd 87 10-10-11 09:55

Education Finance and Governance
| 88 |
Teacher salaries are the largest driver of differences in unit expenditure between the different types of schools (World Bank, 2010). The available data indicates that GPS teachers are paid better than those at RNGPS – i.e. for head teachers between some 5.5 and 12.5 thousand Taka per month at GPS and 4.7 thousand at RNGPS, while for assistant teachers the amounts are between 4.7 and 9.1 thousand Taka at GPS and 4 thousand at RNGPS.73 In comparison, BRAC teachers earn an average of 1,300 Taka per month but receive no additional benefits.74
Salaries of GPS teachers have increased almost threefold from 1997 to 2009 in nominal terms, but less so for RNGPS teachers and dissatisfaction with the differentials between their salary and that of their government colleagues remains.75 According to Al-Samarrai (2007), government teachers earn a salary that is comparable to that of medical assistants who require similar levels of educational qualifications. Salaries of GPS teachers tend to be 3 to 4 times GDP per capita, compared to 3.4 and 3.6 times GDP per capita in India and Pakistan respectively.
4.2.2 Donor education spendingTable 4.1 shows that though the expansion of education in Bangladesh was mostly financed by domestic resources (World Bank 2003), donors have been providing significant financial assistance. Over the period 2000-2008, external aid for education utilised76 was the equiva-lent of around some US$ 1,146.4 million. This represents some 9.4% of government primary education expenditure in this period (4.5% in 1990), and 1.6% of total public spending on education in the same years, up from 0.6% in 1990 (ERD, 2010). During the period 2000-2008, aid disbursements reached a low in 2003 and 2004 in anticipation of the start of PEDP-II.
The utilization rate of external aid, expressed as a percentage of external funds allocated, was an average of 87% in the period 2000-2008. In these years, this rate was lowest in 2002 and 2003 (78 and 65% respectively) but picked up considerably in 2004 after the start of PEDP-II. It reached an average of 94% in the period 2004-2008. This high utilisation rate of external aid continued into 2009.
73 Figures for GPS teachers reflect a yearly increment up to the maximum amount given. 40 to 50% of GPS teachers’ basic salary is made up of a housing allowance depending on place of posting. It also includes other benefits such as medical allowance. RNGPS teachers do not have any scale, no yearly increment. Their consolidated salary is given (including Taka 100 as medical allowance and Taka 200 for house rent allowance). Teacher salary scales are moreover flat, primarily based on seniority and qualifications and not on performance. Promotion chances are slim (1% of GPS and 2% of RNGPS teachers according to OPM, 2006); the only possibility for advancement is a promotion from assistant teacher to head teacher. PEDP-II also aimed to develop revised job descriptions with well-defined incentives, career paths and recruitment rules but this target has not yet been achieved.
74 The BRAC teacher salary is based on average number of teachers over the period 2004-2009 and total spending on salaries over the same period.
75 Teacher associations representing RNGPS and community schools therefore advocated for nationalisa-tion of these schools so that teachers at the schools would get the same benefits and job security as GPS teachers.
76 A fraction of this aid served religious activities.
VKB041-1 283324_B85_BW v5.indd 88 10-10-11 09:55

The two-pronged approach: Evaluation of Netherlands support to primary education in Bangladesh
| 89 |
Figure 4.3 shows public education sector spending and external aid flows to education in the period 1999 to 2008. An analysis of the trends depicted in the graph indicates that an increase in aid does not result in a decrease in the amount Government spends in the education sector, rather the opposite. A one percent increase in the volume of aid is associ-ated with a: (i) 0.3% increase in public primary education expenditure; (ii) 0.16% increase of the revenue budget for primary education expenditure and (iii) 0.54% increase in the development budget for primary education expenditure. No effects of aid were found on public spending in post-primary education. These results indicate that aid does not ‘crowd out’ public expenditure; rather, aid and public expenditure seem to be complementary. The regression on which this conclusion is based, covering the years 1990 to 2008, is discussed in Annex 5.
Figure 4.3 Public education sector spending and external aid flows to education (Billion taka)
0
20
40
60
80
100
120
20082007200620052004200320022001200019990
500
1000
1500
2000
2500
3000
3500
Year
Real
aid
and
edu
catio
n ex
pend
iture
(bill
ion
Taka
)
Real
GD
P(m
illio
n Ta
ka)
GDP
Aid
Post primary education
Primary education
Total education expenditure
Sources: ERD, 2010; World Bank World Indicators; Rahman et al, 2005
As observed above, external funding was also provided through non-governmental chan-nels for (non-formal) primary education, in particular through BRAC. This external funding has been a sine qua non for programmes to take place and has implied considerable depend-ency on donors (Asadullah and Chaudhury, 2008). In the case of BRAC, donors provided over 96% of the required funding.77
77 Long-termfinancialsustainabilityconsiderationsfeaturedintheinstitutionalandorganisationanalysisthat was presented in Van Gerwen, 2003. It is understood that the situation has remained the same to date.
VKB041-1 283324_B85_BW v5.indd 89 10-10-11 09:55

Education Finance and Governance
| 90 |
4.2.3 Sustainability of education financingOn future education sector financing, allocating a higher percentage of the budget to education, keeping the total Government budget unchanged, would be difficult. In fact, the country is faced with a paradox that it is underfunding its public sector – while at the same time, parts of the public sector are not spending what has been allocated, MoPME being one of the few exceptions in this respect.
Due to structural and tax collection issues, taxes constitute only about 9% of GDP (ERD, 2010) in Bangladesh. This is well below the rates reported in 2008 for countries like India (12%), the Philippines (14%), Sri Lanka (13%), Thailand (17%) or the Netherlands (23%) (World development indicators). To realize a change in the overall tax rate, the Government will have to forge a domestic political consensus to improve the tax intake.78
Projections have been made of potentially available resources and of the financial implica-tions of achieving the national EFA goal in 2015, with expenditures expected to grow from some US$ 1.3 billion in 2011 to US$ 1.7 billion in 2015. This allows for estimating the size of the financial gap under alternative economic growth scenarios as is shown in Table 4.3.79
Table 4.3 Estimated financing gap to achieve EFA (US$ billion)
2011 2012 2013 2014 2015 Total
Funding Required 1.28 1.38 1.48 1.58 1.70 7.42
Funding Potentially Available
IfLowGrowth 0.96 1.04 1.11 1.20 1.29 5.60
If Medium Growth 1.00 1.09 1.20 1.32 1.44 6.05
If High Growth 1.04 1.16 1.29 1.43 1.59 6.51
Financing Gap
IfLowGrowth 0.32 0.34 0.36 0.39 0.41 1.82
If Medium Growth 0.28 0.28 0.28 0.27 0.26 1.37
If High Growth 0.25 0.22 0.19 0.15 1.10 0.92
Adapted from DPE/PINZ, 2010 on the basis of the average exchange rate over 2009 (World development indicators)
78 According to the World Bank, total public revenues have stagnated at about 10% of GDP over the last seven years, with tax revenues at about 8.5% of GDP. This low level of tax collection is due to: ‘(i) heavy reliance on trade taxes and low level of domestic taxes; (ii) significant tax expenditure which erodes the tax base and (iii) major organisation and institutional weaknesses in tax administration’ (World Bank, 2010).
79 The estimates of DPE/PINZ 2010 are based on calculations in the Government/UNDP report ‘Millennium Development Goals; Needs assessment and costing 2009-2015 of July 2009. DPE/PINZ revised the cost calculation in this report to allow for (i) steadily declining student numbers (i.e. from some 15.8 million in 2010 to some 14.4 million by 2015); (ii) more gradual progress towards replacement of double shift by single shift schools – through the construction of some 120 thousand classrooms and the employment of an addition 120 thousand teachers; (iii) higher costs of the construction of new classrooms and (iv) recurrent price changes since 2005. On the expenditure side, account is moreover taken of the provision of cash and food benefits for 30% and 20% of the student population. On the public funding available, the estimates differ in terms of GDP growth rate, share of primary education as a percentage of GDP and of public expenditure on education.
VKB041-1 283324_B85_BW v5.indd 90 10-10-11 09:55
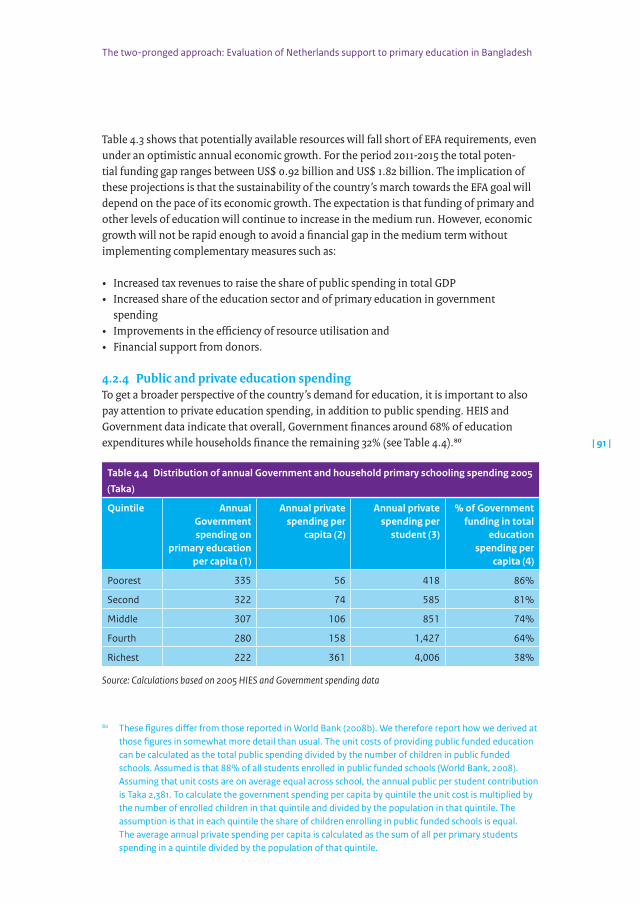
The two-pronged approach: Evaluation of Netherlands support to primary education in Bangladesh
| 91 |
Table 4.3 shows that potentially available resources will fall short of EFA requirements, even under an optimistic annual economic growth. For the period 2011-2015 the total poten-tial funding gap ranges between US$ 0.92 billion and US$ 1.82 billion. The implication of these projections is that the sustainability of the country’s march towards the EFA goal will depend on the pace of its economic growth. The expectation is that funding of primary and other levels of education will continue to increase in the medium run. However, economic growth will not be rapid enough to avoid a financial gap in the medium term without implementing complementary measures such as:
• Increased tax revenues to raise the share of public spending in total GDP • Increased share of the education sector and of primary education in government
spending• Improvements in the efficiency of resource utilisation and • Financial support from donors.
4.2.4 Public and private education spendingTo get a broader perspective of the country’s demand for education, it is important to also pay attention to private education spending, in addition to public spending. HEIS and Government data indicate that overall, Government finances around 68% of education expenditures while households finance the remaining 32% (see Table 4.4).80
Table 4.4 Distribution of annual Government and household primary schooling spending 2005
(Taka)
Quintile Annual Government spending on
primary education per capita (1)
Annual private spending per
capita (2)
Annual private spending per
student (3)
% of Government funding in total
education spending per
capita (4)
Poorest 335 56 418 86%
Second 322 74 585 81%
Middle 307 106 851 74%
Fourth 280 158 1,427 64%
Richest 222 361 4,006 38%
Source: Calculations based on 2005 HIES and Government spending data
80 These figures differ from those reported in World Bank (2008b). We therefore report how we derived at those figures in somewhat more detail than usual. The unit costs of providing public funded education can be calculated as the total public spending divided by the number of children in public funded schools. Assumed is that 88% of all students enrolled in public funded schools (World Bank, 2008). Assuming that unit costs are on average equal across school, the annual public per student contribution is Taka 2,381. To calculate the government spending per capita by quintile the unit cost is multiplied by the number of enrolled children in that quintile and divided by the population in that quintile. The assumption is that in each quintile the share of children enrolling in public funded schools is equal. The average annual private spending per capita is calculated as the sum of all per primary students spending in a quintile divided by the population of that quintile.
VKB041-1 283324_B85_BW v5.indd 91 10-10-11 09:55

Education Finance and Governance
| 92 |
Even though the enrolment rate in primary education is lower among poor children (78% for the poorest compared to 90% for the richest quintile MICS, 2006), poor households have on average more children. As can be observed (column 1), this results in public spending for primary education being pro-poor. Moreover, the share that Government finances increases from 38% for households from the richest quintile (column 4) to over 80% for the poorest quintiles which are henceforth more dependent on public contributions.
Average annual private spending per capita (column 2) is around 6.4 times higher in the richest quintile as compared to the poorest one. As poor families have more children, the difference between the poorest and richest quintiles in per student spending is even higher at around 9.6 times (column 3). Part of the differences between household expenditure groups is due to the fact that a greater proportion of students from richer households are attending higher grades and expenses increase with grades. Differences in the expenditure for male and female students are very small except for the richest quintile (Sulaiman, 2009).
It is finally worth noting that opinions differ on whether expenditures are pro-poor or not. According to ADB/World Bank (2002) and Mujeri (2003), primary education spending was strongly pro-poor with 56% of public primary education resources going to the 50% of the population that is poor. This position differs from what is observed by the World Bank (World Bank, 2010) indicating that (i) while the poor represent 40% of the total population of school-aged children, they receive only 32% of the total recurrent education expenditure and (ii) that even the primary stipend programme was only marginally pro-poor.
While public spending has been slightly pro poor, the question is whether the benefits were pro poor as well. New estimates of the benefit incidence among income quintiles were carried out, using the HIES of 2000 and 2005; the incidence rate is based on enrolment but does not take into account school attendance or the distribution of resources. The results are depicted in Figure 4.4.81
81 The graph shows on the horizontal axe the cumulative percentage of the population, sorted from poor to rich. On the vertical axe is the cumulative percentage of the benefit received by sending a child to school. A line above the 45 degree line indicates that the targeting is pro-poor.
VKB041-1 283324_B85_BW v5.indd 92 10-10-11 09:55
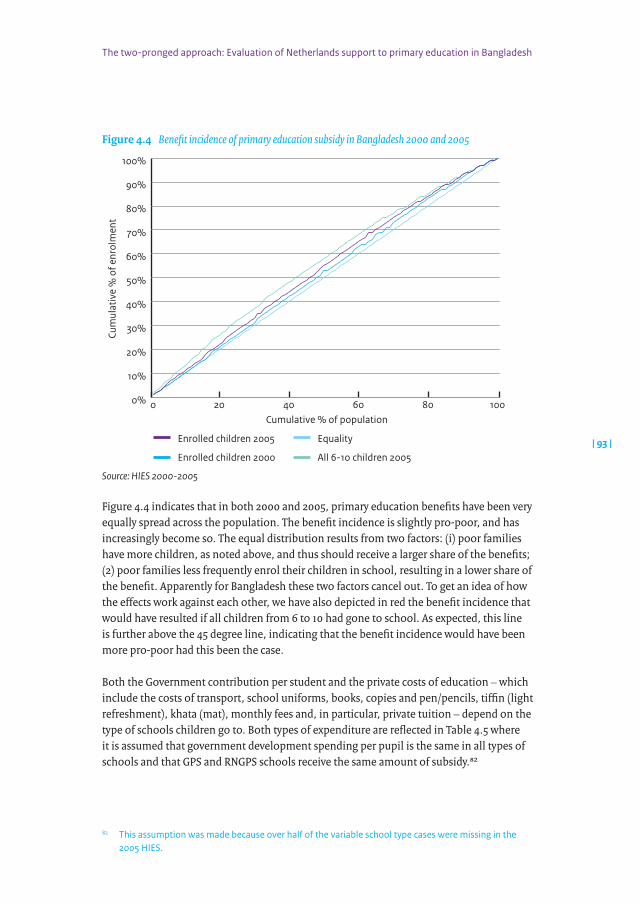
The two-pronged approach: Evaluation of Netherlands support to primary education in Bangladesh
| 93 |
Figure 4.4 Benefit incidence of primary education subsidy in Bangladesh 2000 and 2005
0%
10%
20%
30%
40%
50%
60%
70%
80%
90%
100%
100806040200Cumulative % of population
Cum
ulat
ive
% o
f enr
olm
ent
All 6-10 children 2005
Equality
Enrolled children 2000
Enrolled children 2005
Source: HIES 2000-2005
Figure 4.4 indicates that in both 2000 and 2005, primary education benefits have been very equally spread across the population. The benefit incidence is slightly pro-poor, and has increasingly become so. The equal distribution results from two factors: (i) poor families have more children, as noted above, and thus should receive a larger share of the benefits; (2) poor families less frequently enrol their children in school, resulting in a lower share of the benefit. Apparently for Bangladesh these two factors cancel out. To get an idea of how the effects work against each other, we have also depicted in red the benefit incidence that would have resulted if all children from 6 to 10 had gone to school. As expected, this line is further above the 45 degree line, indicating that the benefit incidence would have been more pro-poor had this been the case.
Both the Government contribution per student and the private costs of education – which include the costs of transport, school uniforms, books, copies and pen/pencils, tiffin (light refreshment), khata (mat), monthly fees and, in particular, private tuition – depend on the type of schools children go to. Both types of expenditure are reflected in Table 4.5 where it is assumed that government development spending per pupil is the same in all types of schools and that GPS and RNGPS schools receive the same amount of subsidy.82
82 This assumption was made because over half of the variable school type cases were missing in the 2005 HIES.
VKB041-1 283324_B85_BW v5.indd 93 10-10-11 09:55

Education Finance and Governance
| 94 |
Table 4.5 Public revenue and development expenditure and private spending on primary
education by school type (in constant 2006/2007 Taka)
2001 2005
School type Public Private Total % Private Public
GPS 1,355 1,034 2,388 43% 1,788
RNGPS 479 815 1294 63% 786
Community schools 177 552 730 76% 235
Primary section of high madrasahs 4,106 - - - 3,797
Ebtedayee madrasahs 52 1,103 1,155 95% 65
Government development spending per pupil
914 1,083
Source: Al Samarrai, 2007
The data shows that public per student cost in both 2001 and 2005 was highest for the primary sections of high madrasahs83 with the GPS ranking second. In 2005, revenue spending per pupil at a RNGPS was less than half the amount spent at GPS and less than a fifth at primary sections of high madrasahs. The ebtedayee madrasahs and community schools receive the lowest amounts; they equalled only 4% and 13% of public revenue spending per student at a GPS respectively. In 2001, the share of private cost of schooling was highest at the ebtedayee madrasah and community schools at 95% and 76% respectively. It was lowest for GPS students at 43%.
Data from CAMPE on private education expenditures for 2008 are summarised in Table 4.6. These figures are more or less in line with those provided by Hossain (Hossain, 2010 and Hossain and Zeitlyn, 2010) with slightly larger amounts spent for boys than for girls. The amounts mentioned are all well above the annual stipend in primary education of Taka 1,200.84
83 According to the ADB (2003), parents’ annual direct cost per student ranged from US$ 14 at public schools, US$ 15 at non registered private schools and US$ 21 at private madrasahs. Uniforms and books and stationary accounted for more than 85% of the costs incurred in public schools and close to 60% in private madrasahs where school fees represented 12% and other expenses equalled 24% of total costs.
84 Hossain moreover observed that the ‘(yearly) average school expenditure is strongly related to the children’s progression status at school, children who are not progressing well are spending compara-tively less’(Hossain, 2010).
VKB041-1 283324_B85_BW v5.indd 94 10-10-11 09:55
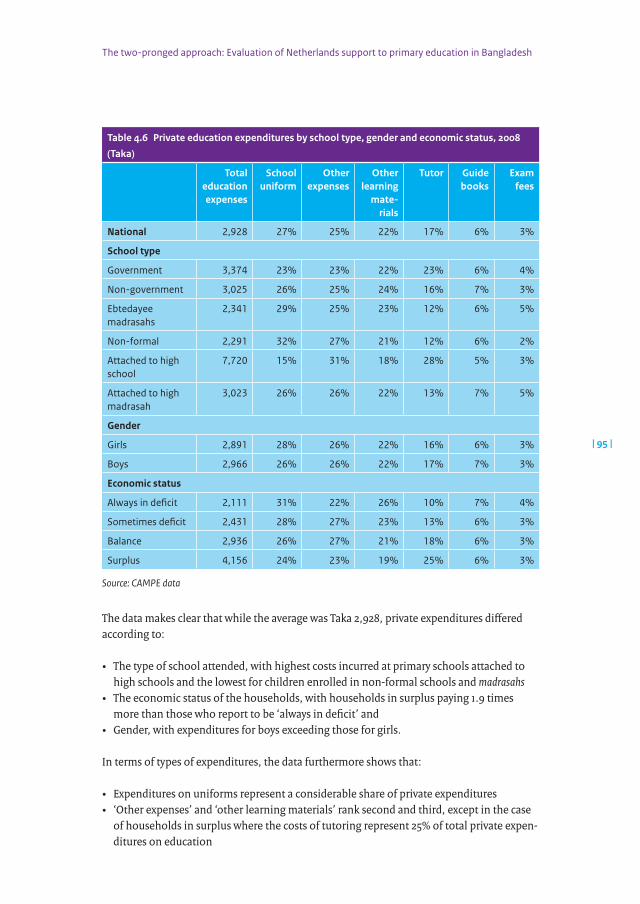
The two-pronged approach: Evaluation of Netherlands support to primary education in Bangladesh
| 95 |
Table 4.6 Private education expenditures by school type, gender and economic status, 2008
(Taka)
Total education expenses
School uniform
Other expenses
Other learning
materials
Tutor Guide books
Exam fees
National 2,928 27% 25% 22% 17% 6% 3%
School type
Government 3,374 23% 23% 22% 23% 6% 4%
Non-government 3,025 26% 25% 24% 16% 7% 3%
Ebtedayee madrasahs
2,341 29% 25% 23% 12% 6% 5%
Non-formal 2,291 32% 27% 21% 12% 6% 2%
Attached to high school
7,720 15% 31% 18% 28% 5% 3%
Attached to high madrasah
3,023 26% 26% 22% 13% 7% 5%
Gender
Girls 2,891 28% 26% 22% 16% 6% 3%
Boys 2,966 26% 26% 22% 17% 7% 3%
Economic status
Always in deficit 2,111 31% 22% 26% 10% 7% 4%
Sometimes deficit 2,431 28% 27% 23% 13% 6% 3%
Balance 2,936 26% 27% 21% 18% 6% 3%
Surplus 4,156 24% 23% 19% 25% 6% 3%
Source: CAMPE data
The data makes clear that while the average was Taka 2,928, private expenditures differed according to:
• The type of school attended, with highest costs incurred at primary schools attached to high schools and the lowest for children enrolled in non-formal schools and madrasahs
• The economic status of the households, with households in surplus paying 1.9 times more than those who report to be ‘always in deficit’ and
• Gender, with expenditures for boys exceeding those for girls.
In terms of types of expenditures, the data furthermore shows that:
• Expenditures on uniforms represent a considerable share of private expenditures• ‘Other expenses’ and ‘other learning materials’ rank second and third, except in the case
of households in surplus where the costs of tutoring represent 25% of total private expen-ditures on education
VKB041-1 283324_B85_BW v5.indd 95 10-10-11 09:55
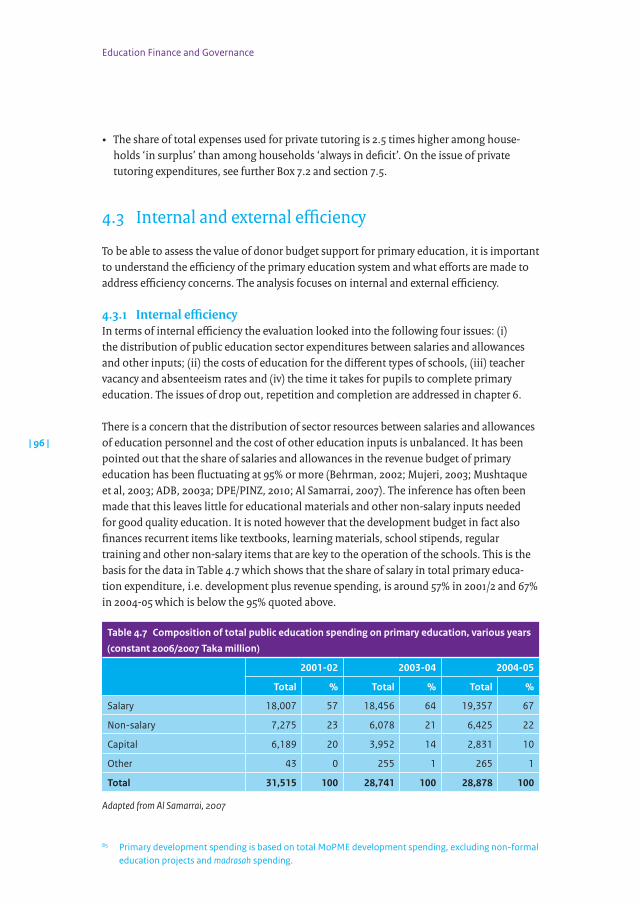
Education Finance and Governance
| 96 |
• The share of total expenses used for private tutoring is 2.5 times higher among house-holds ‘in surplus’ than among households ‘always in deficit’. On the issue of private tutoring expenditures, see further Box 7.2 and section 7.5.
4.3 Internal and external efficiency
To be able to assess the value of donor budget support for primary education, it is important to understand the efficiency of the primary education system and what efforts are made to address efficiency concerns. The analysis focuses on internal and external efficiency.
4.3.1 Internal efficiencyIn terms of internal efficiency the evaluation looked into the following four issues: (i) the distribution of public education sector expenditures between salaries and allowances and other inputs; (ii) the costs of education for the different types of schools, (iii) teacher vacancy and absenteeism rates and (iv) the time it takes for pupils to complete primary education. The issues of drop out, repetition and completion are addressed in chapter 6.
There is a concern that the distribution of sector resources between salaries and allowances of education personnel and the cost of other education inputs is unbalanced. It has been pointed out that the share of salaries and allowances in the revenue budget of primary education has been fluctuating at 95% or more (Behrman, 2002; Mujeri, 2003; Mushtaque et al, 2003; ADB, 2003a; DPE/PINZ, 2010; Al Samarrai, 2007). The inference has often been made that this leaves little for educational materials and other non-salary inputs needed for good quality education. It is noted however that the development budget in fact also finances recurrent items like textbooks, learning materials, school stipends, regular training and other non-salary items that are key to the operation of the schools. This is the basis for the data in Table 4.7 which shows that the share of salary in total primary educa-tion expenditure, i.e. development plus revenue spending, is around 57% in 2001/2 and 67% in 2004-05 which is below the 95% quoted above.
Table 4.7 Composition of total public education spending on primary education, various years
(constant 2006/2007 Taka million)
200102 200304 200405
Total % Total % Total %
Salary 18,007 57 18,456 64 19,357 67
Non-salary 7,275 23 6,078 21 6,425 22
Capital 6,189 20 3,952 14 2,831 10
Other 43 0 255 1 265 1
Total 31,515 100 28,741 100 28,878 100
Adapted from Al Samarrai, 2007
85 Primary development spending is based on total MoPME development spending, excluding non-formal education projects and madrasah spending.
VKB041-1 283324_B85_BW v5.indd 96 10-10-11 09:55

The two-pronged approach: Evaluation of Netherlands support to primary education in Bangladesh
| 97 |
The second issue concerns the major variance in per student public spending across the different types of schools as observed above. Government spending per student at madra-sahs and GPS is considerably higher than that for children enrolled at RNGPS or community schools. Government spending at GPS (the equivalent of some US$ 42 per student in 2005 on the basis of the data of Table 4.7) is also considerably higher than the per-student costs at the BRAC schools of between US$ 23 and US$ 31 per student per year (Boeren et al, 2008). The justification for these differences is increasingly being questioned in the view of the results of the 2009 national primary end of school examination (see further chapter 7).86 Against this background, the World Bank therefore recently called for a review of funding norms ‘to ensure that they serve the government’s equity goals’ (World Bank, 2010).
Third, there has been concern about both teacher absenteeism and teacher tardiness as they could shorten student-teacher contact time and/or disrupt teaching-learning activi-ties. With the hiring of thousands of teachers within the framework of PEDP-II, the teacher vacancy rate has started to fall, thus addressing earlier concerns of high vacancy rates. It is expected that this decline of the vacancy rate will continue.
On the issues of teacher absenteeism and tardiness – which is by no means a purely Bangladeshi phenomenon87 – data from a study of Oxford Policy Management (OPM) of 2006 showed that 16% of GPS teachers and 11% of RNGPS teachers were not present in school on any given day.88 Interestingly, the predominant cause of long-term teacher absences is training, particularly C-in-Ed and B-in-Ed training. Unauthorized long-term absence concerned less than 1% of the observed cases for both GPS and RNGPS; unau-thorised short-term absence concerned between 1 and 2% of the observed cases at GPS and RNGPS respectively.89 The issue of teacher absenteeism was also recognised in the Government’s National Strategy for Economic Growth, Poverty Reduction and Social Development (GoB, 2003).
The OPM study at the same time confirmed the common perception that many teachers go to school late. It shows that about a third of GPS and RNGPS teachers were observed arriving more than 15 minutes late. Female teachers were slightly more likely to be late than males at GPS, whilst the opposite was true at RNGPS. Unsurprisingly, teachers living further away from the school were more likely to be late. According to Poisson (2010), regression analysis moreover found a positive correlation between teacher absenteeism and teachers’ age, length of service, and qualifications. The situation is further compounded by the fact that teachers are frequently involved in activities that ‘encroach’ on the (limited) number of contact hours such as compiling voter lists, annual child surveys, monitoring immunisation programmes (SIDA, 2008).
86 OPM observed that the difference in the learning achievement of GPS students and those of RNGPS and alia madrasahs was remarkably small, controlling for differences in family and other school and student characteristics (OPM, 2006).
87 See e.g. Glewwe et al (1999) and IOB, 2008b. 88 The World Bank referred to an estimated average of 15% of primary teachers absent, with uncertified
teachers more likely to be absent (World Bank, 2004). 89 See on this issue also Chaudhury et al, 2004.
VKB041-1 283324_B85_BW v5.indd 97 10-10-11 09:55

Education Finance and Governance
| 98 |
Finally, the costs of primary education completion greatly exceed the cost of five years of education as on average it takes much longer to complete primary school.90 Available data (DPE/Pinz, 2010; DPE, 2010) indicate that to produce one primary school graduate in 2005, it took 8.1 school years of input, 8.5 years in 2006 and 2007, 8.6 years in 2008 and 8.2 years in 2009, with boys taking more time than girls. This still falls short of the PEDP-II target for this indicator of 7.5 years.
4.3.2 External efficiencyAs regards external efficiency, the term refers to the benefits arising from investing in education relative to its cost. A review of the available literature indicates several public and private benefits associated with primary education (see Box 4.1).
Box 4.1 Private and public benefits of primary education
Benefits of (primary) education include amongst others the following. Education matters in raising agricultural (rice) productivity, boosting output and improving efficiency in a modernising Bangladesh where modern varieties of seeds and inputs are increasingly available. According to Asadullah and Rahman (2006), a household head having primary or secondary education over and above zero years of educa-tion has a significant impact on productivity. Along the same lines Hojo (2001) found that primary education was important in the decision of technology adoption for the production of commercial vegetables.
According to Ahmad (2003) integrated programmes with an important education component have contributed to declines in fertility rates which have been followed by slowing down of population growth and decline in infant mortality. El Zayed et al. (undated) found that ‘if a person is poor, primary education will decrease the number of children. Similarly, Bhuyan (1991) found that the rate of adoption of family planning increased among respondents with an increase in educational levels.
Rashid et al (2006) found that women’s education was a significant determinant in household diet quality and protein intake (together with income, household composition and prices of protein-rich commodities). They suggest that household decisions on food intake are influenced by women’s knowledge regarding nutritio-nal benefits of different foods and their ability to direct household resources towards high quality foods. Male education, with men doing the food shopping, is also a factor for improving dietary diversity.
90 The issue of dropouts from primary education is further discussed in chapter 6.
VKB041-1 283324_B85_BW v5.indd 98 10-10-11 09:55

The two-pronged approach: Evaluation of Netherlands support to primary education in Bangladesh
| 99 |
Kapsos (2008) found a link between education and wages earned: being literate increased the expected hourly wage by 6% and completing primary education by 14%. In addition, increased education could play a significant role in lowering the gender wage gap (see also Monzoor and Kabir, 2008). Finally, on a macro level, education expenditure and GPD growth are working in tandem and have helped each other to grow – a ‘ bidirectional causality running from GDP to education and vice versa’ (Islam et al, 2007).
Estimates of the economic rate of return to primary education in Bangladesh ranged between an estimated 13.4% for women and 4.2% for men (HIES, 2005).91 In comparison, these rates were 6.7% for women and 8.2% for men in India (2004), 5.4% and 4.1% in Pakistan (2000-2001) and 1.9% and 7.6% in Sri Lanka (2001-2002) (Riboud et al, 2007). It is not known why these rates of return are so high for women and why they differ so sharply from these other countries. Asadullah highlights in this respect that since a majority of the Bangladeshi work force does not participate in the formal labour market, ‘future studies should estimate returns to education in household production context, informal sector and self-employment in farm and non-farm activities’ (Asadullah, 2005).
4.4 Primary education budgeting and budget execution, financial management and leakages
4.4.1 Budgeting practicesA call has been made to improve education planning and budgeting practices as current practices hamper an efficient and equitable allocation of public resources for education (Al Samarrai, 2009).
There are several grounds for this observation. First, there are no transparent, clear and realistic formulae or rules that systematically determine allocation of public education expenditures, favouring the poor and efficient use of resources (Hossain, 2004). The lack of such rules has generated intense lobbying for greater resources for schools and has led to elite capture and elite bias to flourish (Al Samarrai, 2008). Second, the historical practice of uncritical incremental budgeting, which distributes resources on the basis of past year’s allocation (plus some adjustments), tends to favour the status quo and results in weak links between sector objectives and budgets (Al Samarrai, 2008). It also makes it difficult to translate government policy into resource allocation. A consequence of this ‘incremen-talism’ is to build inertia into the budgetary system, preserving funding of programmes that are ineffective and have become irrelevant. This situation is compounded by the weakness of accountability institutions and a lack of transparency in terms of resource allocations. Third, due to the existence of two ministries dealing with education (MoPME and MoE),
91 On the issue of rates of return to education see also Asadullah, 2005; Asadullah, 2008; Monzoor and Kabir, 2008.
VKB041-1 283324_B85_BW v5.indd 99 10-10-11 09:55

Education Finance and Governance
| 100 |
budget prioritization and funding of primary schools by both ministries have been compro-mised due to lack of coordination. Fourth, qualified staff and good and timely information relevant to planning and budgeting are inadequate. Finally, the classification of develop-ment versus revenue budgets is confusing. The processes for determining and evaluating these two budgets are largely separate, and taken care of by different Government bodies, i.e. the Planning Commission handling the development budget and the Ministry of Finance the revenue budget. Henceforth, consistency and coordination in budget decisions among current and proposed activities have suffered (World Bank, 2010).
Initiatives have been taken within the framework of PEDP-II to address some of these constraints. However, since they are to a large extent beyond the remit of MoPME, it remains to be seen whether these will actually result in changing the budgeting practices.
4.4.2 Budget executionBudget execution has been a problem as well, but appears to be improving in recent years, including the utilization rate of external financial assistance for education as mentioned above. Comparing total expenditure against total revised allotments for the entire revenue budget and using Ministry of Finance data, OPM (2006) calculated the overall budget execu-tion rate for the primary education revenue budget to be about 92% in 2003-2004.92 The study showed at the same time that the execution rates of the development budgets were very low, especially against the original budget. In 2004-2005 just over half of the original development budget (51%) was spent by the end of the year, although in relation to the revised budgets, actual expenditure was higher at 97%. The OPM report attributed this low execution rate to ‘teething problems’ with PEDP-II.
Recent financial management assessments reveal improvements in the country’s financial management arrangements. These relate amongst others to the roll-out of a medium-term budgeting framework, application of improved accounting principles and standards, and scaling up the use of a government-wide financial management information system. These improvements are partly due to the donors’ policy dialogue with the Government and external assistance provided under PEDP-II. Enough progress has been achieved that, with some additional strengthening93, the use of the Bangladeshi country systems is being considered by some donors for the successor of PEDP-II.
Within the framework of PEDP-II, audits and other fiduciary mechanisms are in place to ensure that funds are used according to the agreed rules. As mentioned, donors, including the Netherlands, have closely monitored compliance with these mechanisms. It is at this stage not evident, how this has impacted on the audit system of the education sector in recent times.
92 Similar high rates have been reported for MoPME by the Ministry of Finance in recent years. See e.g. http://www.mof.gov.bd/en/budget/adp/adp_july_june10.pdf.
93 For example, the World Bank observed that more needs to be done to make the audit function independent of the executive to turn it into a key instrument of accountability (World Bank, 2010).
VKB041-1 283324_B85_BW v5.indd 100 10-10-11 09:55

The two-pronged approach: Evaluation of Netherlands support to primary education in Bangladesh
| 101 |
4.4.3 Leakage In 2001 and 2002, the Corruption Perception Index (CPI) published by Transparency International listed Bangladesh as the most corrupt country among 102 surveyed countries. This reputation has had a great influence on decisions made by the Netherlands to initially not channel their funds through the Government system. Despite renewed attention to reduce corruption and improvements realised in 2009 (USAID, 2010), Bangladesh ranks 134th out of 178 countries on the CPI of 2010 (Transparency International).
The question is to what extent measures like those referred to above have reduced corrup-tion and to what extent corruption has impacted on the education sector. Many concerns about the flow of programme benefits to their intended beneficiaries, particularly the poor, are for a large part based on anecdotes and a few observations. The exception is the OPM study mentioned above (OPM, 2006). The relevant findings of the report can be summa-rized as follows. Leakage is quite small, contrary to the perception of many, and does not significantly divert resources away from intended beneficiaries.94 This can also be seen from the tracking of five budget lines in the revenue budget that together constituted 98% of budgeted and actual expenditures on primary education in 2003-04 and 2004-05 (Table 4.8). OPM noted some small discrepancies—both positive and negative—between central and local data. According to OPM, it was not certain whether these differences were caused by incomplete records, recording differences or a leakage of funds. OPM in this regard empha-sized that the differing formats of the records precluded the analysis of expenditure patterns and the understanding of discrepancies.
Table 4.8 Total allotment for selected budget lines, 200304 (Taka million)
Ministry of Finance MoPME Difference (%)
Description Salary Nonsalary Salary Nonsalary Salary Nonsalary
GPS 13,019.3 181.2 13,019.3 181.2 0 0
RNGPS 1,903.4 34.8 1,882.9 - -1 -
UEO offices 388.3 18.0 388.3 18.0 0 0
DPEO offices 87.2 20.9 77.1 14.4 -12 -31
Small repairs n/a 200.0 n/a 200.0 n/a 0
Adapted from OPM, 2006
Informal payments95 are notable but the frequency and size of payments depend on the nature of the transaction; nevertheless, they hurt the credibility of the education system. The OPM study observed; (i) that ‘officials are sometimes being asked to make ‘speed payments’ to ensure the receipt of allotment letters or the release of funds,’ and (ii) that this
94 Leakageisdifferentfrom‘misallocation’,asemphasizedbyOPM.Leakageoccurswhenresourcesdonot reach recipients, i.e. resources are diverted away from their original purpose (OPM, 2006). Misallocation on the other hand refers to the delivery of resources to recipients who were not the intended beneficiaries or to intended beneficiaries in quantities that they were not eligible for.
95 Popularly called ‘speed money’ because the payments grease the bureaucratic wheels and speed up transactions.
VKB041-1 283324_B85_BW v5.indd 101 10-10-11 09:55

Education Finance and Governance
| 102 |
practice of informal charges would not be visible in expenditure records and may not be identifiable during the institutionalized audit process (OPM, 2006).96 The report indicates that salaries were hardly ever subjected to informal payments. The bills that did attract speed payments formed a very small part of the overall budget, so overall leakage from informal payments—even those that charge a percentage of the total bill—was also small.
The general conclusion that the value of the leakage was relatively small is encouraging. However looking at other cases of informal payment, the picture is less comforting. In 2006, approximately one in six households reported having to pay to receive their stipend payment and 46% of the households reported that they had to make an informal payment to get a stipend card. This occurred more frequently at RNGPS than GPS.97 It was also indicated that 20% of stipend recipients in the poorest quintile of the population reported having to make payments compared to only 9% in the richest quintile.98 The situation appears to have improved since then. Transparency International Bangladesh reports that while still some 15.3% of households had been victim of ‘corruption and irregularities’ in 2010, this represented a considerable decrease in comparison with 2007 when this was close to 40% (see also Dzhumashev et al, 2010). According to the same source, the average amount of unauthorized money paid per household was the equivalent of some US$ 2.4. Transparency International Bangladesh furthermore highlighted that the incidence of irregularities in 2007 was higher in rural than in urban areas though at the same time students in urban areas made unauthorized payments almost three times higher than those in rural areas (Transparency International Bangladesh, 2007).
Finally, the available sources, while not conclusive in terms of the incidence of informal payments, share a common position on who bears the brunt: the poor who are more likely to pay and to pay bigger amounts, because of their ‘weaker social position’ and the lack of strong social networks that can help them to avoid paying (Al Sammarai, 2008; Dhzumashev
96 As noted by the OPM, these ‘probably are conservative estimates of the incidence of speed payments owing to the sensitive nature of the question (though interviewers were trained to remind the respondent about the confidentiality of the survey at this point)‘ (OPM, 2006).
97 On households making informal payments to the school, the OPM report concluded as follows: ‘More than one in five students have been required to pay informal payments at some point. RNGPS students are slightly more likely to do so than those attending GPS, and pay more on average when they do incur them. For RNGPS students, payments to receive authorised textbooks are the most common type of informal payments. At GPS, the most common payments are those to ensure participation in the school admission process. This is perhaps a reflection of the fact that places at GPS are relatively more sought after. It appears that, when students are required to pay informal payments, the amounts involved are fairly modest. However, it must be noted that payments for textbooks, promotion and stipend payments are likely to be recurrent, and thus over time the aggregate expenditures involved could be substantial. It is also possible that these estimates may underestimate the proportion of students paying informal payments, due to both the sensitivity of the issue and because of potential confusion by households as to whether payments made to schools were informal payments or formal (but potentially unauthorised) school fees’ (OPM, 2006).
98 These figures are rather different from those presented by Al Samarrai referring to 3% reporting to have paid for getting a stipend card and 6% for getting the stipend payment (Al Sammarai, 2008).
VKB041-1 283324_B85_BW v5.indd 102 10-10-11 09:55

The two-pronged approach: Evaluation of Netherlands support to primary education in Bangladesh
| 103 |
et al, 2010).99 According to Transparency International Bangladesh, ‘households situated in the first 40% are greater victims of corruption and unauthorized money or bribe compared to the households situated in the second 40% and households situated in the last 20%’ (Transparency International Bangladesh, 2010).
4.5 Institutions governing the primary education system
Increased and better quality resources are necessary for improving education but do not by themselves automatically lead to improved student learning achievement (Hanushek and Wößmann, 2007). There are intervening factors that amplify or undermine the strength and duration of the impact of increased inputs. These factors relate to the existing institu-tions, defined as the norms and rules of the game that drive the ability and propensity of the system to translate inputs into outcomes. They deal with the structure of decision-making authority, social accountability and incentives.
It is not possible at this point to have a fair assessment of the contribution of PEDP-II in these areas, one reason being the aforementioned delay in implementation and lack of quantitative and qualitative information. The discussion below is therefore limited to a broad overview of institutional developments in recent years.
The World Bank’s public expenditure review of 2003 called attention to the fact that ‘(accountability) and incentive mechanisms and checks and balances for teachers and administrators are extremely weak. The Government’s centralized administration also hand-icaps the efficiency and effectiveness of resources devoted to education’ (World Bank, 2003).
Recognising the importance of these issues, PEDP-II, under the heading of ‘Organisational development and capacity building’ included two strands of activities to: (i) enhance the capacity of MoPME and DPE and affiliated institutions such as NAPE and NCTB and field offices to ensure quality and equitable provision of primary education; and to (ii) enhance the capacity of EMIS to support monitoring and evaluation and planning. The information available indicates that progress in these areas has been limited (DPE, 2009; GoB, 2010; ADB/PLU, 2010): (i) Training of DPE staff and central and decentralised levels was realised only partially as a result of (a) delays in approval and subsequent implementation of a human resource development plan for ‘filling up of chronic vacancies at the field level’ by DPE and (b) frequent turnover of key staff (see also chapter 3); (ii) the plan to establish a primary education cadre has not been realised and (iii) a plan to have qualified staff at NAPE and NCTB was completed in 2009 but not yet implemented and staff continues to be on deputation. NAPE and NCTB staff development is not implemented as planned.
99 Already in 2002, ADB and World Bank called for ‘(improving) governance in the health and education sectors with the view to reducing the burden on the poor of supplementary fees and charges in schools and at health facilities (including payments for inputs which are intended to be provided free of charge’ (ADB/World Bank, 2002).
VKB041-1 283324_B85_BW v5.indd 103 10-10-11 09:55
Education Finance and Governance
| 104 |
Along the same lines, strengthening of the Education Management Information System (EMIS) cell at DPE has been troublesome: there continue to be vacancies and profes-sional development is off target (GoB, 2010). This has affected timely reporting on key performance indicators and PSQL though, as observed above, the quality of reporting has improved in recent years. Moreover, as recognised by DPE, revised job descriptions for teachers – with well-defined incentives, career paths and recruitment rules – are not yet in place as this requires decisions from institutions other than MoPME and DPE (DPE, 2009) – in particular the Ministries of Establishment and Finance. For the future Teacher Registration Board, some initial steps have been taken by MoPME and DPE but ‘it may take some time’ for the Board to ‘become operational’ (ADB/PLU, 2010).
The above issues and concerns have been shared by DPE, donors and others.100 DPE specifi-cally attributes them to (i) insufficient attention insert to human resource constraints in the education system (including DPE, PTIs, URCs, DPEOs and (A)UEOs) to implement a programme like PEDP-II in the very diverse context of Bangladesh and (ii) an unrealistic assessment of the type and timing of TA, much of which has ‘remained under-utilized, unfocused and ineffective’ (DPE, 2009).
By and large the observation made by the World Bank in 2000 that ‘Bangladesh has one of the largest centralized systems of basic education’ which is made possible by ‘Bangladesh’s compact size’ but’ is not necessarily desirable’ (World Bank, 2000) remains valid to date. MoPME and DPE are still centrally determining what happens in the schools in terms of curriculum, textbooks, school management and teaching and learning processes. DPE also decides on education finance and expenditure, the number of teachers to hire, and school construction. As a result, decision-making outside the centre tends to be limited to decisions regarding transfer of teachers between schools, granting leave to teachers and selection of teachers for in-service training courses. Though ‘the importance of the empow-erment of schools in a decentralized system has been raised in PEDP-II planning’, ‘almost nothing substantial has been achieved’ (CEF, 2008). On this point, it has been argued that the highly centralized system is stifling innovations and that to improve education it is critical to give local and school authorities some autonomy to innovate and address their issues as they see fit, without waiting for instructions from Dhaka.
On a more positive note, until recently, following the introduction of the School Level Improvement Plans (SLIPs), further explored in chapter 5, schools had practically no discre-tionary funds to improve their teaching and student learning. However, as observed by DPE, ‘(the) difficulty of sending Government funds directly to schools, which is essential for the sustainability of the programme, is still to be resolved’ (DPE, 2009). Moreover, a start has been made with Upazila Primary Education Plans and some funding (Taka 5.9 million) for these Plans was made available under PEDP-II.
100 For example Ahmed (2011) concludes: ‘The capacity constraints of governments in setting directions and priorities and managing resources for results and the external agencies’ limitations in compen-sating for these constraints or helping overcome these have combined to pose high obstacles. This is so despite the SWAp rhetoric of national capacity building, and harmonisation and alignment among external agencies themselves and with the national priorities’.
VKB041-1 283324_B85_BW v5.indd 104 10-10-11 09:55
The two-pronged approach: Evaluation of Netherlands support to primary education in Bangladesh
| 105 |
4.6 Summary
Focusing on the Government’s education system, main findings related to education sector finance and governance are the following.
Education received some 14.5% of the Government budget over the years. This is more or less at par with countries like Lao PDR, Nepal and Pakistan but well below spending in Malaysia and Thailand. Total public education spending was on average 2.4% of GDP which is below the share for countries like India, Nepal or Pakistan. It increased in real terms to US$ 1,902 million in 2008 primarily as a result of an increase of GDP. Public primary educa-tion spending increased in real terms but declined as a share of total public spending on education, mainly because of more money going into secondary education. The evaluation questions current budgeting practices, the absence of appropriate formulae for the alloca-tion of public education expenditures and the historical practice of uncritical incremental budgeting. At the same time it highlights improvements in financial management prac-tices, that actual leakages in the education system have been small and that unauthorised payments, mainly affecting the poor, have seen a decline.
Donor support to the education sector has been important and the utilisation rate of avail-able external aid has been high (an average of 87% in the years 2000-2008, representing the equivalent of around some US$ 1,146.4 million). At the same time, donor funding has complemented Government investments and did not ‘crowd out’ public expenditure as in confirmed by regression analysis. Continued donor involvement is one of the ways to finance the total potential funding gap in primary education for the period 2011-2015, together with initiatives to increase the share of the (primary) education budget and increased tax revenues to raise the share of public spending in total GDP.
The Government has different types of funding arrangements for the various types of schools. Government spending per GPS student per year was some US$ 42 per student in 2005; this is above the costs at BRAC schools ranging between US$ 23 and 31 per student per year. Increasingly, the justification for the observed differences is being questioned and the World Bank has called for a review of funding norms ‘to ensure that they serve the government’s equity goals’. Major part of the Government’s revenue budget for education goes to teacher salaries (well over 90%); though this share declines to around 60% when also considering the Government’s development budget which also finances recurrent expenditures.
Overall, Government finances around 68% of education expenditures and households the remainder (costs of transport, school uniforms, teaching and learning materials, fees and, in particular, private tuition). Private education expenditures of the poorest house-holds equal just over 10% of the richest ones; they differ according to (i) the type of school attended; (ii) the economic status of the household, and; (iii) gender. Opinions differ on whether Government expenditures on education are indeed (slightly) pro-poor or not.
VKB041-1 283324_B85_BW v5.indd 105 10-10-11 09:55

Education Finance and Governance
| 106 |
In terms of internal efficiency, the evaluation shows that while unauthorised teacher absen-teeism is limited, there is a tendency of teachers to be late. This affects the actual number of contact hours, which are still limited and below what is reported for other Asian countries. Moreover, the costs of primary education are inflated as on average it takes much longer than five years to complete primary school. As regards external efficiency, several studies confirm the importance of education for increasing agricultural production and the adop-tion of agricultural innovation, as well as health and income. Moreover, though further study is needed, the rates of return to primary education in Bangladesh appear consider-able, especially for women.
In terms of education sector governance, the chapter highlights that, despite some small initiatives through SLIPS and UPEP, the education remains highly centralised, with few responsibilities at the lower levels of the education system. Attention is finally drawn to the human resource constraints that continue to hamper the effectiveness of key education sector institutions and the delays experienced in the reform of salary and incentive structures.
VKB041-1 283324_B85_BW v5.indd 106 10-10-11 09:55
The two-pronged approach: Evaluation of Netherlands support to primary education in Bangladesh
| 107 |
VKB041-1 283324_B85_BW v5.indd 107 10-10-11 09:55
5
Trends in primary education inputs
VKB041-1 283324_B85_BW v5.indd 108 10-10-11 09:55

| 109 |
The two-pronged approach: Evaluation of Netherlands support to primary education in Bangladesh
5.1 Introduction
Focusing on PEDP-II and BRAC, this chapter documents the trends in the primary education provision in terms of schools, classrooms and teachers and teacher training, the curric-ulum, and teaching and learning materials. It also provides information on other key inputs such as the stipend programme and the systems of monitoring and supervision that have been put in place. Particular attention is paid to the issue of community involvement and the functioning of the School Management Committees at the different types of schools. The information provided is the basis for the analysis in the chapters 6 and 7 which concern changes in access and education quality respectively.
5.2 School infrastructure
Data on the number of different types of schools for the period 2001-2009 are provided in Table 5.1 together with data on the BRAC schools. Table 5.2 provides some basic information on the number of classrooms for the PEDP-II supported types of schools in 2005 and 2009.
Table 5.1 Number of schools by school type, 20012009
2001 2003 2005 2007 2009 change +/ 2001
2009
Formal subsidised
GPS 37,671 37,671 37,672 37,672 37,672 1
RNGPS 19,428 19,428 19,862 20,107 20,061 633
Experimental schools 53 53 54 54 55 2
Community schools 3,268 3,260 3,027 3,186 2,991 -277
Primary sections of secondary schools
1,576 1,618 1,353 1,314 959 -617
Formal nonsubsidised
Non-registered non-govern-mental primary schools
1,971 1,670 946 973 819 -1,152
Kindergarten 2,477 3,088 2,281 2,253 2,744 267
NGO schools 170 345 289 229 230 60
Satellite schools 4,095 4,823 0 0 0 -4,095
Formal madrasahs
Ebtedayee madrasahs 3,842 6,581 6,768 6,726 6,744 2,902
Primary sections of high madrasahs
3,574 8,200 8,329 8,920 9,233 5,659
Total 78,125 86,737 80,581 81,434 81,508 3,383
VKB041-1 283324_B85_BW v5.indd 109 10-10-11 09:55
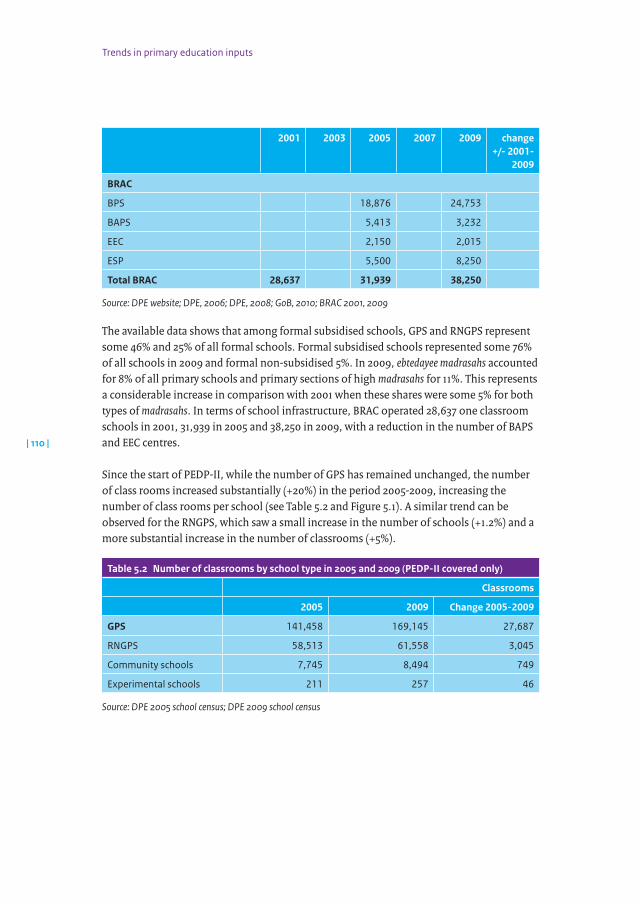
Trends in primary education inputs
| 110 |
2001 2003 2005 2007 2009 change +/ 2001
2009
BRAC
BPS 18,876 24,753
BAPS 5,413 3,232
EEC 2,150 2,015
ESP 5,500 8,250
Total BRAC 28,637 31,939 38,250
Source: DPE website; DPE, 2006; DPE, 2008; GoB, 2010; BRAC 2001, 2009
The available data shows that among formal subsidised schools, GPS and RNGPS represent some 46% and 25% of all formal schools. Formal subsidised schools represented some 76% of all schools in 2009 and formal non-subsidised 5%. In 2009, ebtedayee madrasahs accounted for 8% of all primary schools and primary sections of high madrasahs for 11%. This represents a considerable increase in comparison with 2001 when these shares were some 5% for both types of madrasahs. In terms of school infrastructure, BRAC operated 28,637 one classroom schools in 2001, 31,939 in 2005 and 38,250 in 2009, with a reduction in the number of BAPS and EEC centres.
Since the start of PEDP-II, while the number of GPS has remained unchanged, the number of class rooms increased substantially (+20%) in the period 2005-2009, increasing the number of class rooms per school (see Table 5.2 and Figure 5.1). A similar trend can be observed for the RNGPS, which saw a small increase in the number of schools (+1.2%) and a more substantial increase in the number of classrooms (+5%).
Table 5.2 Number of classrooms by school type in 2005 and 2009 (PEDPII covered only)
Classrooms
2005 2009 Change 20052009
GPS 141,458 169,145 27,687
RNGPS 58,513 61,558 3,045
Community schools 7,745 8,494 749
Experimental schools 211 257 46
Source: DPE 2005 school census; DPE 2009 school census
VKB041-1 283324_B85_BW v5.indd 110 10-10-11 09:55
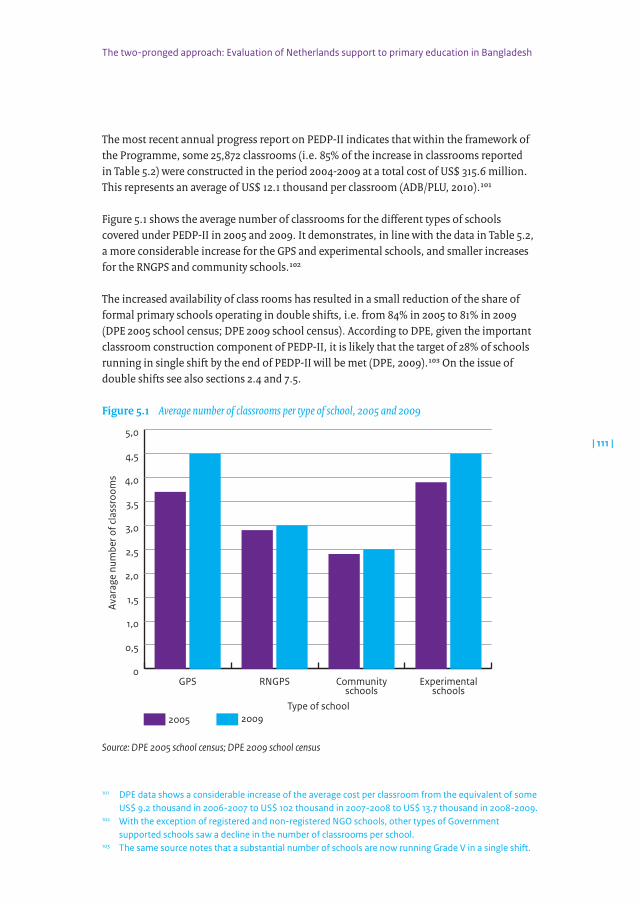
The two-pronged approach: Evaluation of Netherlands support to primary education in Bangladesh
| 111 |
The most recent annual progress report on PEDP-II indicates that within the framework of the Programme, some 25,872 classrooms (i.e. 85% of the increase in classrooms reported in Table 5.2) were constructed in the period 2004-2009 at a total cost of US$ 315.6 million. This represents an average of US$ 12.1 thousand per classroom (ADB/PLU, 2010).101
Figure 5.1 shows the average number of classrooms for the different types of schools covered under PEDP-II in 2005 and 2009. It demonstrates, in line with the data in Table 5.2, a more considerable increase for the GPS and experimental schools, and smaller increases for the RNGPS and community schools.102
The increased availability of class rooms has resulted in a small reduction of the share of formal primary schools operating in double shifts, i.e. from 84% in 2005 to 81% in 2009 (DPE 2005 school census; DPE 2009 school census). According to DPE, given the important classroom construction component of PEDP-II, it is likely that the target of 28% of schools running in single shift by the end of PEDP-II will be met (DPE, 2009).103 On the issue of double shifts see also sections 2.4 and 7.5.
Figure 5.1 Average number of classrooms per type of school, 2005 and 2009
0
0,5
1,0
1,5
2,0
2,5
3,0
3,5
4,0
4,5
5,0
Experimentalschools
Communityschools
RNGPSGPS
Type of school
Avar
age
num
ber o
f cla
ssro
oms
20092005
Source: DPE 2005 school census; DPE 2009 school census
101 DPE data shows a considerable increase of the average cost per classroom from the equivalent of some US$ 9.2 thousand in 2006-2007 to US$ 102 thousand in 2007-2008 to US$ 13.7 thousand in 2008-2009.
102 With the exception of registered and non-registered NGO schools, other types of Government supported schools saw a decline in the number of classrooms per school.
103 The same source notes that a substantial number of schools are now running Grade V in a single shift.
VKB041-1 283324_B85_BW v5.indd 111 10-10-11 09:55

Trends in primary education inputs
| 112 |
Table 5.3 shows trends in characteristics of schools and indicates that progress has been made in terms of school accessibility (especially during the rainy season) and the share of schools with safe drinking water (PEDP-II envisaged the sinking of some 18.2 thousand tube wells; 13.5 thousand were completed by April 2010 (ADB/PLU, 2010)). Other characteristics of schools show a worsening trend.104
Table 5.3 Infrastructure characteristics of formal schools in 2005 and 2009
2005 2009
Schools that are easily accessible 76% 79%
Formal classrooms with a blackboard 92% 72%
Formal schools with safe drinking water 45% 71%
Formal schools with a separate toilet for boys and girls 30% 28%
Source: DPE 2005 school census; DPE 2009 school census
5.3 Teachers and teacher training
5.3.1 Teachers employed in primary educationTable 5.4 provides data on the number of teachers in the different types of schools in recent years.
The data shows first of all that between 2005 and 2009 the total number of teachers has increased by some 5%. Secondly, it is evident that the growth has been biggest in GPS (+ close to 21 thousand or 11%), with community schools ranking second. Other types of schools have seen little change or a small decline in the number of teachers employed.
104 It is worth noting that PEDP-II targets the Construction of 18.5 thousand teacher toilets of which some 15.1thousandwerecompletedbyApril2010(ADB/PLU,2010)butonly5thousandtoiletsforstudentsofwhichsome1.6thousandwerecompletedbyApril2010(ADB/PLU,2010).
VKB041-1 283324_B85_BW v5.indd 112 10-10-11 09:55
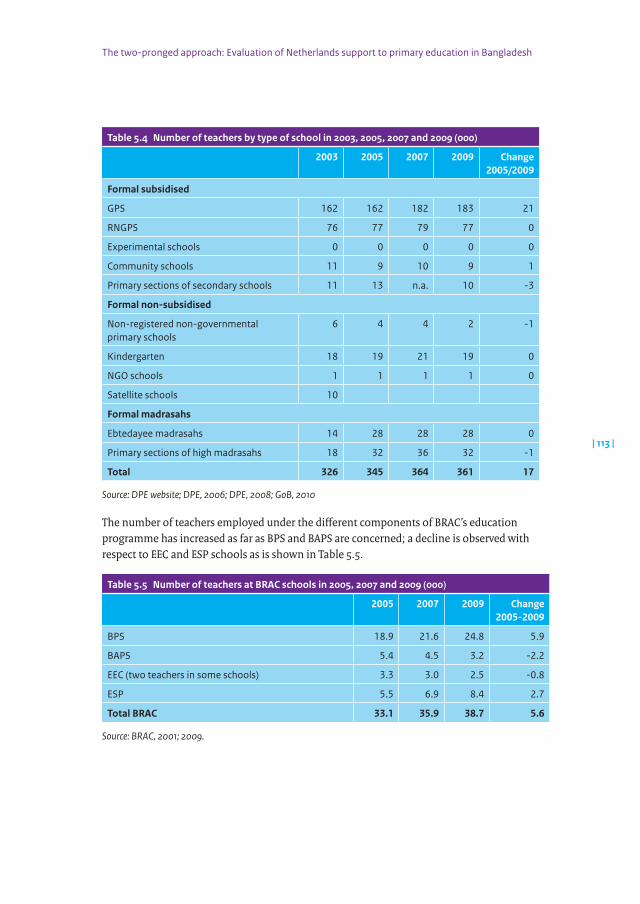
The two-pronged approach: Evaluation of Netherlands support to primary education in Bangladesh
| 113 |
Table 5.4 Number of teachers by type of school in 2003, 2005, 2007 and 2009 (000)
2003 2005 2007 2009 Change 2005/2009
Formal subsidised
GPS 162 162 182 183 21
RNGPS 76 77 79 77 0
Experimental schools 0 0 0 0 0
Community schools 11 9 10 9 1
Primary sections of secondary schools 11 13 n.a. 10 -3
Formal nonsubsidised
Non-registered non-governmental primary schools
6 4 4 2 -1
Kindergarten 18 19 21 19 0
NGO schools 1 1 1 1 0
Satellite schools 10
Formal madrasahs
Ebtedayee madrasahs 14 28 28 28 0
Primary sections of high madrasahs 18 32 36 32 -1
Total 326 345 364 361 17
Source: DPE website; DPE, 2006; DPE, 2008; GoB, 2010
The number of teachers employed under the different components of BRAC’s education programme has increased as far as BPS and BAPS are concerned; a decline is observed with respect to EEC and ESP schools as is shown in Table 5.5.
Table 5.5 Number of teachers at BRAC schools in 2005, 2007 and 2009 (000)
2005 2007 2009 Change 20052009
BPS 18.9 21.6 24.8 5.9
BAPS 5.4 4.5 3.2 -2.2
EEC (two teachers in some schools) 3.3 3.0 2.5 -0.8
ESP 5.5 6.9 8.4 2.7
Total BRAC 33.1 35.9 38.7 5.6
Source: BRAC, 2001; 2009.
VKB041-1 283324_B85_BW v5.indd 113 10-10-11 09:55

Trends in primary education inputs
| 114 |
The Government has applied an affirmative action policy to get more females recruited as teachers. A 60% quota was set for female teachers in recruitment; since 1990 female appli-cants need only 10 years of education (SSC) to qualify compared to 13 years for men (HSC) as a way to increase the number of female teachers. Table 5.6 indicates that the share of female teachers increased considerably at GPS but that progress was considerably less for the RNGPS. Conversely, BRAC has an exceptionally high percentage of female teachers (98-99%) which is in line with its hiring policy as explained in chapter 2.
Table 5.6 Trends in % female teachers, 20012009
2001 2003 2005 2007 2009
Total formal education 36% 39% 37% 50% 47%
Government primary schools 38% 38% 41% 50% 51%
Registered non-government schools 27% 32% 30% 32% 34%
Community schools 63% 64% 72% 74% 75%
Experimental schools 41% 48% 37% 39% 64%
Primary sections of high schools 42% 41% 44% 48% 48%
Non registered non-government schools 47% 48% 63% 65% 66%
Kindergarten 61% 69% 52% 55% 56%
NGO schools 58% 72% 63% 66% 60%
Ebtedayee Madrasahs 12% 21% 14% 11% 26%
Primary sections of high Madrasahs 10% 13% 9% 10% 17%
Source: DPE 2002, MoPME n.d., DPE 2005 school census, DPE 2009 school census
Since the number of teachers grew faster than the number of students enrolled this has had repercussions for the student-teacher ratios as is evident from Table 5.7.105 The data shows that overall, the increase in the number of teachers has resulted in a decline in student teacher ratios. BRAC, with its one-classroom-one teacher approach is an obvious exception.
Table 5.7 Trends in student – teacher ratios, 20012009
2001 2003 2005 2007 2009
GPS 67 66 58 51 53
Formal subsidized (incl. RNGPS) 51 51 42 50 41
Formal non-subsidized 31 28 18 17 16
Formal Madrasah 28 27 36 32 -
BRAC 32 - 29 30 29
Source: DPE 2002, MoPME n.d., DPE 2005 school census, DPE 2009 school census, BRAC 2009
105 It is not known whether these statistics include the so-called ‘para teachers’ that are employed and paid by the schools or school management committees directly.
VKB041-1 283324_B85_BW v5.indd 114 10-10-11 09:55

The two-pronged approach: Evaluation of Netherlands support to primary education in Bangladesh
| 115 |
Table 5.7 also confirms that the GPS have the highest student teacher ratios; this ratio declined from 67 in 2001 to 51 in 2007 but increased again to 53 in 2009, as a result of increased student enrolment associated with higher popularity of these schools.
5.3.2 Government teacher trainingThe Government teacher training system comprises pre-service training to obtain the certificate in education (C-in-Ed), in-service training and what is referred to as ‘sub-cluster training’. Information on these initiatives is provided in the following paragraphs.
Pre-service teacher training
As mentioned above, the one-year C-in-Ed course, delivered through the country-wide system of PTIs is the only long professional education programme for primary school teachers. Prior to their teaching service, a limited number of primary teachers receive a Bachelor of Education, Diploma in Education, or even Master of Education, though these courses are designed for secondary school teachers.
The PTIs moved to a 2-shift system to cater for increased numbers of teachers to be trained at the beginning of the evaluation period.106 This 2-shift system has remained problem-atic since the PTIs have continuously suffered from acute staff shortages, with half of the 12 instructor posts being vacant in many of the institutes. Though there has been some improvement in a number of PTIs over the last two years by appointing teachers from the experimental schools attached to the PTIs as instructors, there remain PTIs that are seri-ously understaffed. Review Missions, including the JARM of 2009, have repeatedly drawn attention to the vacancies but as yet there has been little progress to address this issue.
In the early years of the evaluation period, Norway also funded the revision of the C-in-Ed curriculum. This proved a cumbersome and time-consuming undertaking and whilst the aim of the revision was to provide a more up-to-date and practical curriculum, the process resulted in an overloaded theoretical curriculum with little practical application. Donors were particularly concerned about delays in the process and the quality of the product since they saw the C-in-Ed as one of the key tools for improving the quality of teaching and learning in primary schools (EKN, 2004). Nevertheless, the curriculum and manuals are still in use today.
Provision was made for further revision under PEDP-II but progress has been slow. To replace the 12-months C-in-Ed course, NAPE, together with external TA, has developed a Diploma in Primary Education course of 18 months. A peer review of this programme was undertaken by external experts. Based on their assessment, a new committee, chaired by NAPE and including members from NAPE, DPE Training Division, PTIs and BU-IED as well as national and international consultants provided by DFID and UNICEF, was formed to refine the diploma. There is still some way to go before the new diploma course is in place.
106 This is very different from the underutilisation of PTI capacity reported in the 1980s (BANBEIS, 1987).
VKB041-1 283324_B85_BW v5.indd 115 10-10-11 09:55
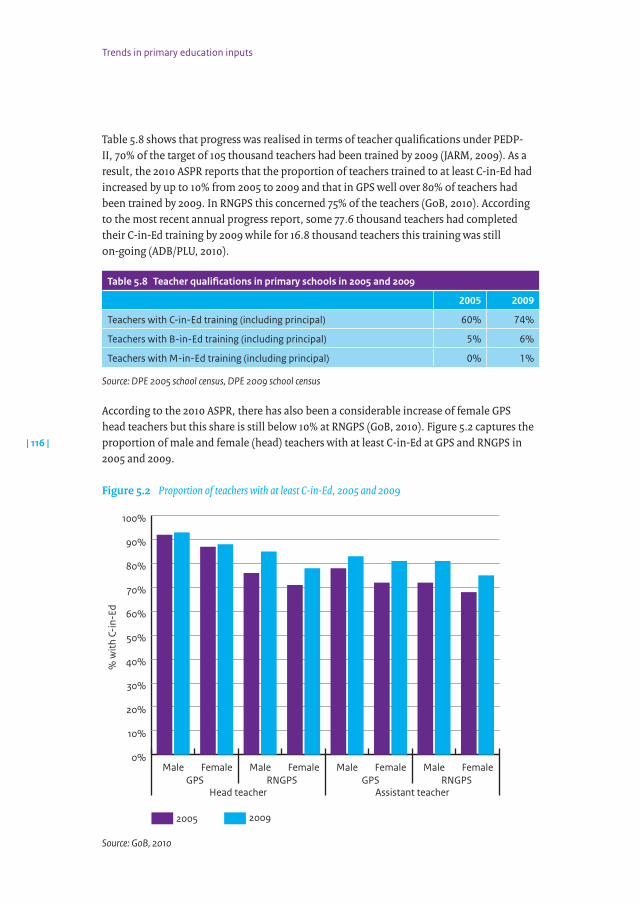
Trends in primary education inputs
| 116 |
Table 5.8 shows that progress was realised in terms of teacher qualifications under PEDP-II, 70% of the target of 105 thousand teachers had been trained by 2009 (JARM, 2009). As a result, the 2010 ASPR reports that the proportion of teachers trained to at least C-in-Ed had increased by up to 10% from 2005 to 2009 and that in GPS well over 80% of teachers had been trained by 2009. In RNGPS this concerned 75% of the teachers (GoB, 2010). According to the most recent annual progress report, some 77.6 thousand teachers had completed their C-in-Ed training by 2009 while for 16.8 thousand teachers this training was still on-going (ADB/PLU, 2010).
Table 5.8 Teacher qualifications in primary schools in 2005 and 2009
2005 2009
Teachers with C-in-Ed training (including principal) 60% 74%
Teachers with B-in-Ed training (including principal) 5% 6%
Teachers with M-in-Ed training (including principal) 0% 1%
Source: DPE 2005 school census, DPE 2009 school census
According to the 2010 ASPR, there has also been a considerable increase of female GPS head teachers but this share is still below 10% at RNGPS (GoB, 2010). Figure 5.2 captures the proportion of male and female (head) teachers with at least C-in-Ed at GPS and RNGPS in 2005 and 2009.
Figure 5.2 Proportion of teachers with at least C-in-Ed, 2005 and 2009
0%
10%
20%
30%
40%
50%
60%
70%
80%
90%
100%
FemaleMaleFemaleMaleFemaleMaleFemaleMaleRNGPSGPS
Head teacherGPS
Assistant teacherRNGPS
% w
ith C
-in-
Ed
20092005
Source: GoB, 2010
VKB041-1 283324_B85_BW v5.indd 116 10-10-11 09:55

The two-pronged approach: Evaluation of Netherlands support to primary education in Bangladesh
| 117 |
5.3.3 In-service training teacher trainingPEDP-II has seen the expansion of the URC network into all Upazilas. URCs are resource centres set up at the main primary school in the Upazila (‘model school’), in which much of the in-service training is carried out. They are to be staffed by an Instructor and Assistant Instructor107 (there is a significant number of vacancies) who are to provide short courses and have a role in primary school supervision.
During the earlier years of the evaluation period, the training followed what was initiated under the IDEAL project: starting with basic teaching courses, followed by subject based training courses in mathematics and English. Teachers interviewed in Sunamganj and Bogra could remember much of what they had been taught during these courses and indicated that they found them helpful.
With PEDP-II, the basic courses were gradually phased out and replaced by subject based training in all five primary school subjects. The main objective of this training is to enhance the subject knowledge of the teachers and, in the end, to improve the classroom teaching-learning process by using appropriate teaching aids, increasing student participation and assessing learning properly. Many of the trainers are teachers themselves. A study conducted by NAPE in 2009 found that teachers became more skilled in preparing lessons and identifying learning objectives, had increased their subject knowledge and were using teaching aids more effectively. Teachers interviewed in Sunamganj and Bogra confirmed that the in-service training initiatives under PEDP-II had allowed more short courses (basic and subject based training) to be held throughout the country. A number of these teachers had found the training helpful and expressed the desire for further subject based training courses.
The more practical approach, grounded in the textbooks that the teachers and students use on a daily basis and integrating the use of teaching aids and assessment, appears to be meeting the teachers’ needs. Data from the PEDP-II annual progress report for 2009-2010 indicate that some 102.8 thousand teachers participated in basic in-service training sessions and some 480 thousand in subject-based training sessions in the period 2004-2010 (ADB/PLU, 2010).
5.3.4 Sub-cluster trainingSub-cluster training has been continued under PEDP-II in the same manner as it was origi-nally set up. The training imparted by the AUEO, who may have little classroom expertise, follows a series of leaflets produced by DPE on various topics and provides a forum for teachers to discuss their problems. It also includes a presentation of a lesson by one of the teachers followed by discussion – teachers interviewed saw this as particularly helpful since it gave them opportunities to discuss similar problems that they were experiencing in the classroom. Data from the PEDP-II annual progress report for 2009-2010 refer to a total of
107 In 2005, the posts of Instructor and Assistant Instructor were absorbed into the revenue budget, thus assuring staffing for URCs (DPE, 2007).
VKB041-1 283324_B85_BW v5.indd 117 10-10-11 09:55

Trends in primary education inputs
| 118 |
10.2 thousand sub-clusters in which 30 teachers per sub-cluster were trained six times per year (ADB/PLU, 2010).
5.3.5 BRAC teacher trainingBRAC, like most other NGOs in Bangladesh, does not have any long centralised training courses like the C-in-Ed. For BEP, teachers receive initial basic training, monthly refresher training, new grade orientation training and specific training on English and mathematics for Grades IV and V. Training is decentralised and each teacher receives about 120 days training over the 4-year period that the school runs. Basic training, which lasts for twelve days, is practical and focused on the job that the teachers will be doing; how to organise the class, how to conduct activities (songs and dances etc.), what methods of teaching and learning to use and how to conduct a parents’ meeting. Monthly follow up training, carried out with a group of teachers who teach the same grade, focuses on problems with last month’s activities and planning for the month to come. These monthly training sessions are also the occasion for teachers to get paid. Teachers are provided with lesson plans for the following month, which they are expected to follow, using their own creativity, as well as question papers that they are expected to use at the end of each lesson. Refresher training is delivered by the area manager whilst other courses are delivered by dedicated trainers. Most of the trainers interviewed were recruited with a master’s qualification, not necessarily related to education. They therefore received training from BRAC to enable them to act as trainers. The MTR of BEP 2004-2009 highlighted the efficient use of training time and the quality of training in terms of transference of knowledge and skills to teachers.
5.4 The Curriculum and Textbooks
Under PEDP-II the main intervention directly related to the primary school curriculum was the proposal for all teachers to undergo ‘curriculum-upgrading’ training. TA was provided to support DPE’s Training Division in developing and delivering this training course which would help teachers to teach the revised curriculum more effectively. Since more than five years had elapsed since the revisions and since the revisions had not been that substantial, it was decided to reallocate the resources that had been set aside. TA was also provided for NCTB. However, discussions with NCTB revealed that it was not that productive and that they did not get beyond discussion of planning. Henceforth an opportunity for much needed capacity building in curriculum development was missed.
5.5 The Primary Education Stipend Programme
To support school enrolment and attendance of poor children in rural areas, the Government introduced the primary education stipend programme in 2002. It replaced the food for education programme that provided assistance in kind (Hossain, 2009). The objec-tives of the programme are to improve student enrolment, attendance and completion rates, establish equity in financial assistance to primary school-aged children and enhance the quality of primary education (DPE quoted in Al-Samarrai, 2007b).
VKB041-1 283324_B85_BW v5.indd 118 10-10-11 09:55

The two-pronged approach: Evaluation of Netherlands support to primary education in Bangladesh
| 119 |
The first phase of the programme (Akhter et al, 2009; Baulch, 2010; World Bank, 2008b) ran from 2002 to 2008. It provided 100 Taka per month per pupil when attending primary schools for 85% of the time and getting 40% marks on the school examinations. The programme only concerned primary schools with a full 5-year programme, thus including GPS, RNGPS, religious and other NGO schools, but excluding BRAC schools.108 If the house-hold had more than one eligible child, the family received an additional Taka 25 per month on the same conditions. Funds were paid directly into a bank account opened in the name of the mother (or the father/legal guardian where necessary), meaning that she was held responsible for ensuring that her child attended and performed at the required minimum level (Hossain, 2009). The benefit amount has not been adjusted since 2002 and has thus been declining in real terms: whereas Taka 100 would buy 11 kilos of rice in 2003 it is worth only 3 kilos of rice in 2008.
From July 2002 to June 2008, the Government spent about Taka 2,822 million from its own resources on the programme (from 2004 onwards as part of its contribution to PEDP-II). During this phase around 5.5 million children benefited. Only rural families were eligible, thus excluding the urban poor despite the relatively high levels of urban poverty (Al Samarrai, 2008). Further targeting was done by SMCs who, with oversight from educa-tion officers, were supposed to target the poorest 40% of the households. At this level mis-targeting occurred as schools wished to maximise the number of children receiving payments (Al Samarrai 2008). Moreover, at community level is was found that the stipend ought to be ‘provided to all students not just the poor, partly to prevent stigmatisation but also to promote socialisation at school and to minimise the administration and conflict created by having to make selections of eligible students’ (SIDA, 2010).
Concerns were expressed in the early years about the monitoring system being ‘fragile and probably under-resourced’ (Tietjen, 2003). Household surveys suggest that targeting was indeed poor. In 2005, 52% of the beneficiaries were from the lowest two income quintiles, the remainder went to non-targeted groups (Hossain, 2009). For each income quintile, the odds of participation were 0.3, 0.3, 0.2, 0.2, and 0.1 respectively (World Bank, 2008b). On the issue of the school stipend programme see further section 6.2.
The second phase of the programme started in 2008 and will be in place till 2013; Taka 2,442 million (around US$ 36 million) has been set aside for this period targeting some 4.8 million students. This second phase uses a new targeting method in order to reach more poor children. The poverty rate of each Upazila now determines the percentage of children that should receive the stipend. It is unclear whether targeting has improved in practice.
The school stipend programme comes in addition to the school ‘tiffin’ programmes that were introduced with the aid of the World Food Programme and, more recently, under the
108 Schools also had to meet eligibility criteria, which included having 10% of students appearing in the scholarship examinations; holding exams in an orderly manner; ensuring at least 60% of students are in attendance during school inspections; and a minimum of 100 students enrolled in the case of madrasah schools (Aga Khan Foundation team, 2007).
VKB041-1 283324_B85_BW v5.indd 119 10-10-11 09:55
Trends in primary education inputs
| 120 |
EC assisted school feeding programme (2009-2013). Under these programmes, 75 grams fortified biscuits are provided as mid-day food in inter alia selected poverty-stricken districts and districts affected by the cyclone Sidr (2007). The aim is to ensure 100% enrolment and to retain students in the school throughout the day. The various initiatives concern some 1.2 million primary school students. The actual impact of these initiatives is unknown.
5.6 School supervision and monitoring
Monitoring and supervision are important factors that could influence school performance. The argument is that if this is handled well, it will impact on teachers’ and ultimately the students’ performance. This section explores the functioning of supervision and moni-toring that is either internal (head teacher/peers) or external to the school (UEO/AUEO/BRAC supervisors). It draws strongly on the qualitative research findings as the literature related to school supervision in Bangladesh is scarce.
5.6.1 Government system
Internal supervision and monitoring
Interviews with teachers and head teachers at GPS and RNGPS in Sunamganj and Bogra indicate that head teachers’ involvement in monitoring and advising assistant teachers is variable – some do (10 out of 17 schools), occasionally or more regularly, others do not. One reason for a limited role in this respect is that they have time constraints: head teachers have to teach themselves and handle administrative affairs of the school. Moreover, like the assistant teachers they are involved in out-of-school activities that affect their presence at school and student contact hours.109
External supervision and monitoring
As observed in chapter two, the (A)UEOs are to play a major role in school supervision, monitoring and giving feedback. AUEOs are required to visit some 10 schools per month within a cluster of 25 to 30 schools.
By the late 1990s, AUEOs were reported to be carrying out supervision visits to most schools. According to the CAMPE study ‘Hope Not Complacency’ of 1999 (CAMPE 1999), AUEOs visited 94% of GPS and 79% of RNGPS survey schools in 1998. The story from PSPMP reveals that ‘frequency of supervision was not uniform (…) schools located in the close vicinity were
109 SIDA in this respect refers to inter alia: Updating voter lists – annual (new voters) and when required before national and local elections; Manning polling centres for national and local elections; Annual child survey; – estimated 7 days; National census (every 10 years); 7-10 days; National Immunization Days (twice per year); overseeing de-worming and polio vaccinations; 2 days. In addition, teachers have been involved in ‘one off’ tasks, for some of which they have received modest remuneration e.g. (i) Supporting the provision of national ID cards during the Caretaker Government; 20-30 days; (ii) Provision of post Cyclone Sidr support (South 2008); (iii) Conducting sanitation survey for UNICEF (Central 2009). 5-6 days + 3 days of training. Administration of stipend programme is time consuming as well (SIDA, 2010) in addition to other administrative responsibilities of school staff (see e.g. Rahman and Ali, 2004; Hossain, 2004).
VKB041-1 283324_B85_BW v5.indd 120 10-10-11 09:55

The two-pronged approach: Evaluation of Netherlands support to primary education in Bangladesh
| 121 |
frequently visited leaving inaccessible ones unvisited’ (Ferdous and Rahman, 2000). This was mainly caused by:
• Significant delays in filling vacant posts, which resulted in some (A)UEOs being respon-sible for even more schools (CAMPE, 2006)
• The low transport allowance, which limited visits to more remote schools• The additional tasks (A)UEOs had to perform, including delivering bi-monthly sub-cluster
training, distributing food and textbooks and filling out detailed inspection forms for all schools in their cluster, in addition to their role in supervising teachers in the classroom (World Bank, 2000; Thornton, 2004), and
• Their involvement as trainees and trainers in a range of externally funded projects, particularly IDEAL, ESTEEM and CPEP (Latif, 2004).
Furthermore, (A)UEOs were primarily recruited directly to their post and most had no teaching experience. With their appointments being within the administrative side of education, this led to an over emphasis on administration with their role in classroom supervision seen as secondary to administration (Thornton, 2004).
The evaluation shows that the multi-tasking of the AUEOS has somewhat been reduced following (i) the introduction of the sub-sector approach of PEDP-II which implied a centralisation of the management of training and AUEOs no longer being subject to the demands of different projects and (ii) the expansion of the URC network. This has resulted in additional supervisors (i.e. the (assistant) URC Instructors) who are supposed to visit schools and less extensive use of AUEOs as trainers for in-service training. In addition, the DPEOs have a responsibility for undertaking school visits.
Interviews with head and assistant teachers as well as (A)UEOs indicate that in the last three years there has also been an increase in the number of school visits. This primarily concerns the AUEOs as the UEOs are rarely seen at the school. There is a difference, however, in that (unannounced) visits to the GPS were more frequent (on average every 2-3 months) than to RNGPS (on average every 4-5 months).
(A)UEOs interviewed also felt that the quality of the supervision had improved, concen-trating on the indicators of quality learning (students asking questions, teachers using effective and appropriate teaching aid, teachers using different approaches for teaching learning rather than lecturing, etc.) rather than only the quantitative measures (number of students, number of question asked, time of lesson delivery, etc.). They suggested that this was mainly due to the detailed prescribed format for classroom observations and because people with higher educational qualifications are now joining as supervisors, but not as a result of training. This view was not fully shared by the teachers; especially in the RGNPS, teachers emphasised the administrative nature of the visits.110 Their usefulness for the
110 Administrative tasks include: verifying school records (e.g. attendance of students and teachers), granting of leave of teachers, preparation of salary payments, administration of stipends, etc. According to Islam (2010), ‘(the) current inspection system of schools is too bureaucratic to upgrade the quality of school performance’.
VKB041-1 283324_B85_BW v5.indd 121 10-10-11 09:55

Trends in primary education inputs
| 122 |
teaching and learning process was therefore limited and teachers referred to their peers for support. Teachers nevertheless tried to maintain good relations with the AUEOs as they decide on who goes for training.
Yet some of the earlier problems remain:
• There are still vacancies in the administration• Allowances for transport are low resulting in irregular visits to more distant and/or
inaccessible schools• Most UEOs/AUEOs are still appointed directly to post, and • Continued administrative demands for forms to be filled up and for provision of statistics
to the District and the centre.
In addition, demands that interfere with doing their job as educational supervisor effec-tively, were mentioned by the (A)UEOs in Sunamganj, similar to those reported by the head teachers. Moreover, they continue to have a key role in the sub-cluster training sessions.
Overall though, AUEOs and, UEOs and URC instructors suggested that increased frequency of school visits has resulted in greater teacher accountability. This view was supported by the (head) teachers who confirmed this increase and who felt that this was making them more attentive to time keeping and carrying out their duties in the classroom.
5.6.2 BRAC systemFor BRAC, the main supervisors are the Programme Officers, who look after 12-15 schools each. With schools having one teacher only, they are required to visit more frequently (2-3 times a week). Like in the government system, there is a local level supervision network of Area Managers, Branch Managers and Quality Assurance Specialists who all have a role in school monitoring and supervision. For BRAC, supervision has always been seen as a strength of its education system. The appraisal of BRAC’s NFPE Phase III drew attention to the hard work of supervisors but suggested that there should be more emphasis on peda-gogy and less on student attendance and teaching schedules (BRAC, 1998). For BRAC, vacan-cies have never been a problem though the number of teachers promoted to supervisor is limited with most supervisors being recruited directly to post.
BRAC’s extensive system of supervision and monitoring is still in place as was confirmed in the interviews with the teachers as well as members of the SMCs at the BRAC schools. The visits of the supervisors (and at times also the BRAC managers) served to monitor whether teachers were following the lesson plans and to render advice on teaching issues. During the visits meetings were also held with the members of the SMC. These meetings not only served to discuss school matters and to emphasise the importance of education but were also used to give advice on e.g. health issues, mother and child care.111
111 A similar intense system of supervision, monitoring and teacher support is in place at the FIVDB schools.
VKB041-1 283324_B85_BW v5.indd 122 10-10-11 09:55
The two-pronged approach: Evaluation of Netherlands support to primary education in Bangladesh
| 123 |
5.7 Community involvement and SMCs
In its document Education for All: the year 2000 assessment Bangladesh Country Report (GoB, 2000), the Government highlighted that the development of primary education and reduction of illiteracy hinge on positive response from the community, which can best be administered through local government supervision and management. It is considered important that local governments accept the responsibilities and mobilize resources at the local level to supplement resources made available by the central government. The following paragraphs aim to analyse what has happened in this respect and focuses on issues of community and SMC involvement. They draw primarily on the qualitative research undertaken in Sunamganj and Bogra.
5.7.1 Community involvementThe CAMPE 1999 report highlighted that few parents showed an interest in school affairs in 1998. Anecdotal evidence suggested that in many cases, this was because they themselves had received little education. Moreover, they had low expectations of what their children could hope to achieve.
Focus group discussions with community people in Sunamganj and Bogra indicate that the situation has changed. Most parents in Sunamganj were very aware about the importance of getting their children educated, irrespective of their own level of education. Many of the women interviewed had become mothers at an early age and had not been able to complete or continue their education. They did not want this to happen to their daughters any more, though early marriages still take place.112 People in Bogra district, who were generally economically better off, were particularly motivated about the education of their children. At the same time, increased interest does not always translate into increased participation in school meetings as parents, especially fathers, remain too busy to make ends meet.
One of the reasons mentioned for this increased interest was that parents saw education as an investment: if their children are educated then there is a greater chance of them getting a job.113 This also explains why many were paying for private tutors – irrespective of their income – or arranged for relatives to provide tutoring free of charge, in addition to any
112 This is in line with Blunch and Das (2007) observing that the ‘local populations take great pride in the expansion of girls’ education in their areas, and in the impact they see of this on the community, on children’s well-being and on women’s empowerment’. They note an increase in the share of women that is in favour of equal or better (than their husband’s) education of girls. At the same time, they conclude that while attitudes towards education have changed, ‘in terms of their attitudes to their marriages, Bangladeshi women are still very conservative and education has done little to change that’.
113 Schuler (undated) highlights the importance attached by parents (and family-in-law) to girls’ education as ‘educating their daughters would improve their chances of marrying well and being treated well … as well as making it possible for them to work and support themselves if something went wrong in their marriages’. Schuler et al (2008) at the same time observed inconsistencies in aspirations regarding ‘education and delayed marriage and childbearing for daughters’ and that ‘some mothers, or fathers, or both, were inclined to seize upon a reasonable opportunity to marry their daughter, especially if there was no dowry demand. Moreover, in this society it remains socially unacceptable to keep a mature daughter at home if she is not in school. When a family cannot afford the private tutoring that is almost essential for a student to do well and pass exams, it is difficult to keep the girl in school’.
VKB041-1 283324_B85_BW v5.indd 123 10-10-11 09:55

Trends in primary education inputs
| 124 |
coaching classes that were organised by the schools themselves. This was particularly the case for GPS where private tutoring was almost seen as mandatory; the introduction of the end of primary school examination in 2009 further fuelled the demand for tuition. For children in BRAC schools this was less of an issue since all costs were covered and the cost of additional coaching provided by BRAC for class V children was reported to be limited to Taka 100 per month (on the issue of private tuition see further chapter 7).
Parents were aware of the merits of different schools and some moved their children from one school to another in the hope of getting them a better education, confirming the difficulties with respect to the interpretation of available drop out figures (see chapter 6). Preference for different types of schools varied, but generally GPS, BRAC, FIVDB and kinder-garten schools were favoured as they were perceived to offer quality education – though kindergarten education was beyond the means of the poor. The GPS, especially in urban and semi-urban areas, were becoming increasingly popular, despite being overcrowded, as they achieved better results in the examination. Whilst BRAC schools too were seen as achieving good results, some parents saw them as schools for poor children and less prestigious than the GPS. RNGPS schools and madrasahs were criticised for poorer performance and less care taken by teachers.
Private school costs are clearly a factor in the decision making in the selection of schools, in addition to safety concerns (especially for smaller children and girls). The Government’s stipend programme plays a certain role in school choice (children at BRAC and FIVDB schools are not eligible) but does not seem decisive as school costs, including the costs of private tuition, are well above the monthly stipend amount.
The response from schools to the increasing interest by parents in their children’s education has been mixed. Generally teacher-parent relations were stronger in Sunamganj than in Bogra and the community in Sunamganj was reported to take care of the school both during and after school hours. In Bogra many parents complained that the GPS teachers showed no interest in maintaining any relations with them. Head teachers rarely called a meeting with the parents and few teachers undertook home visits.
VKB041-1 283324_B85_BW v5.indd 124 10-10-11 09:55

The two-pronged approach: Evaluation of Netherlands support to primary education in Bangladesh
| 125 |
However, what has changed is that parents seem less frightened to approach the school and hold it to account. The issue of teachers using physical punishment in class was cited a number of times in the interviews; it was evidently another factor in school choice. It became clear from interviews with children and parents that physical punishment is being questioned and has reduced over time, though it is still practiced, particularly in the GPS.114 Previously parents reported that they saw physical punishment as part of school life but now they are aware that it is wrong. Parents also channelled their complaints about physical punishment through the SMC. In part, this awareness may have been influenced by the example of NGO programmes, including those of BRAC, where physical punishment is hardly ever used and, if it is, the teacher is reproached rather than the child.
In contrast, in BRAC schools teachers have maintained the high quality of parent-school interactions that were observed in the past. Teachers arranged monthly meetings, which were regularly attended by the parents. These meetings were also attended by BRAC super-visors and provided an occasion to inform parents on the importance of education, advise them on how to overcome children’s problems with learning and provide information on other topics other as mentioned above. Teachers also visited the children’s homes if they missed school.
5.7.2 School Management Committee and SLIPsLiterature from the late 1990s and the early years of the new Millennium shows a critical attitude vis-à-vis the school management committees (e.g. CAMPE, 1999; Creative Associate, 2002; Tietjen, 2003; Chowdury et al, 2004). By and large it was concluded that though most schools reported to have an SMC, this committee was either inactive, did not appear to be operating as envisaged and met only occasionally and without committed membership. The SMCs were generally considered ‘ineffective’ (Tietjen 2003).
Findings from the school visits in Bogra and Sunamganj as well as the focus group discus-sions are summarised in the overview provided below for both GPS and RNGPS and BRAC schools.
114 This is in line with Children’s Opinion Poll 2008 which, looking at punishment throughout the school system, also highlights its prevalence but indicates that it has reduced, with 30% of teachers never using it. (UNICEF, 2009). The study also puts its prevalence down to the fact that it is difficult to control large classes without some deterrent, hence children tend to accept it, particularly when it is mild and not used that often.
VKB041-1 283324_B85_BW v5.indd 125 10-10-11 09:55

Trends in primary education inputs
| 126 |
Table 5.9 Findings school visits Bogra and Sunamganj
GPS and RNGPS BRAC
SMC established Yes. One SMC was set up only recently. Yes
Meetings SMC meetings are held regularly, with one exception. Meetings are called for by the head teacher.
SMC meetings are held monthly, coinciding with visits of BRAC supervisors.
Decision making There is a tendency for the head teacher and influential SMC members to take important decisions.
Decisions are taken unani-mously. For decisions on key issues, SMC refers to the BRAC supervisor.
School attendance SMC members, with one exception among the GPS and RNGPS, monitor school attendance of both children and teachers. They may conduct home visits if a child is away from school for 3-4 days. If these visits do not bear fruit, the teacher may conduct home visits. Such home visits, which take place in all BRAC schools, are also an occasion to emphasise the importance of education with parents.
Education quality SMC members may occasionally visit the school to see the way teachers are performing in the classroom and under what conditions.
Stipend programme
In rural schools, SMC members participate in the selection of students for the primary school stipends together with the head teacher (Bangladesh Reality Check, 2008). They may also mediate in case of conflicts on the stipend payments.
Not applicable as children in BRAC schools are not eligible.
Generation of additional resources
SMCs may get involved in generating additional resources and funding for the school (e.g. to employ additional so-called ‘para teachers’, extend available school infrastructure, pay for a cleaner for the school or the school’s electricity bill). The fact that some SMC members interviewed thought that they should not expect everything from government but mobilize resources locally indicates a change in mind-set.
Main resources needed for teaching and learning are catered for through BRAC.
The introduction of the end of primary school examination in 2009 may have provided a catalyst for promoting better school performance. SMC members interviewed were keen that their school performed well in the examination and this has led to them calling for teachers to take more care of students and teach well. SMC members of one of the RNGPS in this respect highlighted the importance of teachers taking classes regularly and of improving their teaching. They also expressed dissatisfaction with the admin-istrative burdens of the head teacher. These are an indication of their commitment to ensuring that the school performs well – something that was not evident at the start of the evaluation period.
VKB041-1 283324_B85_BW v5.indd 126 10-10-11 09:55

The two-pronged approach: Evaluation of Netherlands support to primary education in Bangladesh
| 127 |
The key focus of work with SMCs under PEDP-II was the introduction of School Level Improvement Plans (SLIP) together with SLIP-related training. Under the SLIP component, schools received up to Taka 30,000 to improve school facilities.115 A pilot was conducted in 13 Upazilas in 2007 (2 thousand schools), a ‘more informal version built around 40 UEO ‘champions’ was undertaken in 2008-9 followed by roll out to a total of 316 Upazilas and 39.2 thousand schools in 2009-10 (GoB/DPE, 2010). At school level, the SLIP budget is managed by the SLIP committee which comprises SMC members, school teaching staff and members of the PTA. However, a formative evaluation of SLIP conducted in 2009 highlights that the SMC plays the central role in management and oversight of SLIP at the school level (UNICEF, 2009). SMC training under PEDP-II has been instrumental in ensuring the effective management of SLIP funds. An issue has been that members of the SLIP committee had to spend first from their own money and to submit vouchers or bills to the UEO and claim disbursement. Generally, the funding of such advances is ‘not always easy’ (GoB/DPE, 2010).
From the school visits, SLIP seems to have played a significant role in increasing SMC members’ engagement in school management. Examples of such actions from the field work include an SMC taking a decision to build a boundary wall for the school (50% of the money came from SLIP and the remainder was collected locally). This was also reported by UNICEF (2009): ‘It was apparent from all of the school authorities and SMCs interviewed that SLIP is making a major difference to their status as managers; they can now not simply make expenditure plans, but also act on them’. The same UNICEF report also draws atten-tion to the fact that gains are fragile and will need consolidating. It also indicates that the SLIP has been successful in meeting the modest objective of providing ‘a small-scale, guaranteed fund to enable schools to plan and implement limited improvements in their physical environment, toward creating a more welcoming learning space for children’. DPE has nevertheless realised that it is too early ‘to comment whether or not SLIP activities have brought effective results for the betterment of primary education’(GoB/DPE, 2010). UNICEF moreover observed that with the SLIPs, little progress has been made with regard to the more complex objective of ‘a more expansive and potentially significant innova-tion in decentralized education, shifting control for direction setting and management of teaching-learning to the local level’ (UNICEF, 2009). This assumes a clear decentralisation agenda which, as yet, is not being pursued by the government.
115 SLIPshavebeenusedfor:newteacher’sroomwhicheasedclassroomspaceshortage,furnitureforteacher’s room, school benches; new chairs, repairs to benches, cleaning and repair of toilets and septic tank, playfield filling, fans and re-wiring; new toilet, repainting and repair of walls, repair of television, Sports Day; Repairs, replacement of blackboard and fans; Office and classroom floors repaired, repair of window; Repair of electric wiring and building; repair of benches (SIDA, 2010).
VKB041-1 283324_B85_BW v5.indd 127 10-10-11 09:55
Trends in primary education inputs
| 128 |
5.8 Summary
Comparing 2001 and 2009, for the school types covered by PEDP-II, the chapter shows an increase in the number of RNGPS and community schools while the number of GPS and experimental schools has remained virtually unchanged. At the same time, GPS and RNGPS have seen a major increase in the number of classrooms of over 30 thousand resulting in an increase of the number of classrooms per school, especially at GPS. The share of schools operating in single shift has increased from 16% in 2005 to 19% by 2009. The number of BRAC schools increased from 28.6 thousand in 2001 to 38 thousand in 2009; in line with this increase, the number of BRAC teachers increased as well by over 5.5 thousand. BRAC has continued its programme of pre-service and monthly in-service training.
Following the Government’s teacher recruitment wave, schools covered by PEDP-II have seen an increase in the number of teachers employed. This increase occurred especially at GPS; other types of schools have seen little change or a decline. The affirmative action policy of the Government has resulted in gender parity among GPS teachers; RNGPS are still lagging behind with only 34% female teachers. Student-teacher ratios have decreased between 2001 and 2009 though at popular GPS, the ratio increased slightly between 2007 and 2009. Almost 75% of the teachers have the required C-in-Ed diploma, up from 60% in 2005, following the pre-service teacher training initiatives under PEDP-II. Basic and subject-based in-service training and sub-cluster training have continued under the Programme and have addressed substantial numbers of teachers. Little has effectively happened in terms of curriculum development and strengthening of NCTB.
The Government has provided considerable funding for its primary education stipend programme, i.e. Taka 2,822 million for the period 2002-2008 and Taka 2,442 million for 2008-2013. However, targeting has been poor, did not cover all types of schools, and, in real terms, the value of the stipend has seen a considerable decline since it was introduced. As will be shown in chapter 6, the impact of the programme is moreover debatable and needs further investigation.
In terms of school supervision, some improvements in the functioning of the Government system have been observed in terms of the frequency of school visits undertaken by (A)UEOs and the quality of the supervision. Their actual influence on the teaching and learning process remains, however, limited. Remaining problems include the vacancies in the administration, insufficient transport allowances, lack of (teaching) experience among (A)UEOs and the fact that they, similar to the (head) teachers, have to perform other tasks as well (distribution of textbooks, food, surveys, national census, etc.). The intensive system of teacher supervision introduced by BRAC continues to date; in addition to monitoring teacher and school performance, the visits of BRAC supervisors also serve to provide infor-mation on e.g. health care and child care issues.
VKB041-1 283324_B85_BW v5.indd 128 10-10-11 09:55
The two-pronged approach: Evaluation of Netherlands support to primary education in Bangladesh
| 129 |
The evaluation shows increased interest in and recognition of the importance of education – also for girls. This also explains the observed increase in private education expenditure, especially for tutoring, among parents sending their children to government-supported schools. School response to this increased interest in education has been mixed. BRAC schools stand out positively in linking with the community and the organisation of regular meetings between parents and teachers.
Along the same lines, school management committees at BRAC schools appear to func-tion somewhat better than those at GPS or RNGPS, e.g. in terms of liaising between school and community. Some positive changes have nevertheless taken place in comparison with the state of affairs described in 2003: SMC members appear to get more involved in home visits, monitoring teacher presence and performance in the classroom or in generating funding for the school. The introduction of the end of primary school examination in 2009 may have been a catalyst in stimulating parents’ increased interest in the education of their children. The same may be said with respect to the SLIPs that were provided to schools under PEDP-II and which have enabled teachers and parents to take decisions as to how to invest the limited funds (up to Taka 30,000) available. The impact of the SLIPs on educa-tion quality is however not yet known. Moreover, the introduction of the SLIP has not gone hand-in-hand with a shift of education management to the local level.
VKB041-1 283324_B85_BW v5.indd 129 10-10-11 09:55

6
Trends in Access
VKB041-1 283324_B85_BW v5.indd 130 10-10-11 09:55
| 131 |
The two-pronged approach: Evaluation of Netherlands support to primary education in Bangladesh
6.1 Introduction
As described above, earlier policies focussed on providing equitable access to primary education. While attention for education quality has increased, access remains an issue that receives much needed attention by the Government, donors and NGOs. This focus on access is also reflected in the choice of the Dutch government to channel a major part of its support through BRAC, FIVDB and ILO as explained above. Access to primary educa-tion is not only a question of enrolment, but also one of which children progress through the system – and how – and whether those enrolled actually attend school to eventually complete primary education. The analysis below focuses on the following access related issues: (i) gender and poverty dimensions of enrolment in primary education; (ii) primary school attendance as well as repetition and drop out;116 (iii) delayed enrolment and (iv) primary school completion. The chapter highlights both education supply factors affecting access and issues related to the demand for education and socio-economic factors that shape this demand.
6.2 Enrolment
6.2.1 GeneralTable 6.1 captures the evolution of student enrolment in the period 2001 - 2009 for the different types of formal schools.117
The available data shows that:
• The evolution in total enrolment shows a decline from 2001 to2005 after which it increased again from 2007 onwards. This increase is primarily due to a reported increased enrolment at the GPS, where student numbers increased by some 271 thousand between 2005 and 2009, and at the primary sections of high madrasahs (plus 201 thousand students). Enrolment at kindergartens also saw a considerable increase. Enrolment declined especially at RNGPS and the ebtedayee madrasahs. Changes, plus or minus, were less pronounced at other types of schools.
• GPS account for well over 50% of total enrolment in primary education throughout the years. However, this share has seen a decline from 61% in 2001 to some 59% in 2009. According to Ahmed and Hossain (2010), ‘it appears that a proportion of children who relied in the past on government schools were walking away from government institu-tions, indicating a preference for NGO schools and even private kindergartens’. A decline
116 Keeping in mind that data on the latter two issues are often conflicting as none of the available data sources track the same children over time, so that what they do this year can be compared with what they did last year.
117 An obvious caveat is the lack of information on student enrolment in the primary sections of high schools and the madrasah schools for 2009. As a result, the figure on total enrolment in 2009 is therefore only an estimate.
VKB041-1 283324_B85_BW v5.indd 131 10-10-11 09:55

Trends in Access
| 132 |
is also observed for the RNGPS. On the other hand, while in 2001 enrolment at madrasahs represented a mere 5% of total enrolment, since 2005 this share increased to some 12%.118
Table 6.1 Student enrolment by school type, 20012008/2009 (000)
2001 2003 2005 2007 2009
Formal subsidised
GPS 10,831 10,665 9,484 9,378 9,755
RNGPS 4,164 4,125 3,573 3,539 3,525
Experimental schools 12 12 10 10 11
Community schools 491 502 426 436 398
Primary sections of secondary schools
338 316 295 451 339
Formal nonsubsidised
Non-registered non-governmental primary schools
299 206 158 165 123
Kindergarten 364 255 246 255 361
NGO schools 29 45 38 33 37
Satellite schools 276 488
Formal madrasahs
Ebtedayee madrasahs (2008) 439 454 850 948 637
Primary sections of high madrasahs (2008)
417 394 1,146 1,100 1,353
Total 17,659 17,463 16,225 16,313 16,539
Source: DPE 2002; DPE, 2006; DPE, 2005; GoB, 2010
Data on enrolment at the different types of BRAC schools show an overall increase in enrol-ment of some 10% between 2001 and 2009 as is shown in Table 6.2. Between 2003 and 2009, growth in enrolment was strongest among the ESPs (150%) followed by the BPS (120%) while enrolment at EEC and BAPS has seen a decline. Enrolment at BRAC schools accounted for 5% of total recorded enrolment in primary education in 2001 and over 6% in 2007.
118 The reasons for the substantial growth of enrolment at madrasahs are not known; no recent study was found on the determinants of selection into religious schools. Creative Associates Inc et al (2004) identified the following factors that stimulated parents to enrol their children in the madrasah education system: (i) religious factors and a preference among religious families to educate at least one male child in religion; (iii) madrasahs are notorious for their discipline and trouble-making children were sent to madrasahs to improve their behaviour, and; (iii) some families tended to send children deemed less intelligent to madrasahs. Other factors include: (i) madrasahs charge lower fees and thus may attract children from poorer households, (ii) proximity of madrasahs compared to other types of schools.
VKB041-1 283324_B85_BW v5.indd 132 10-10-11 09:55
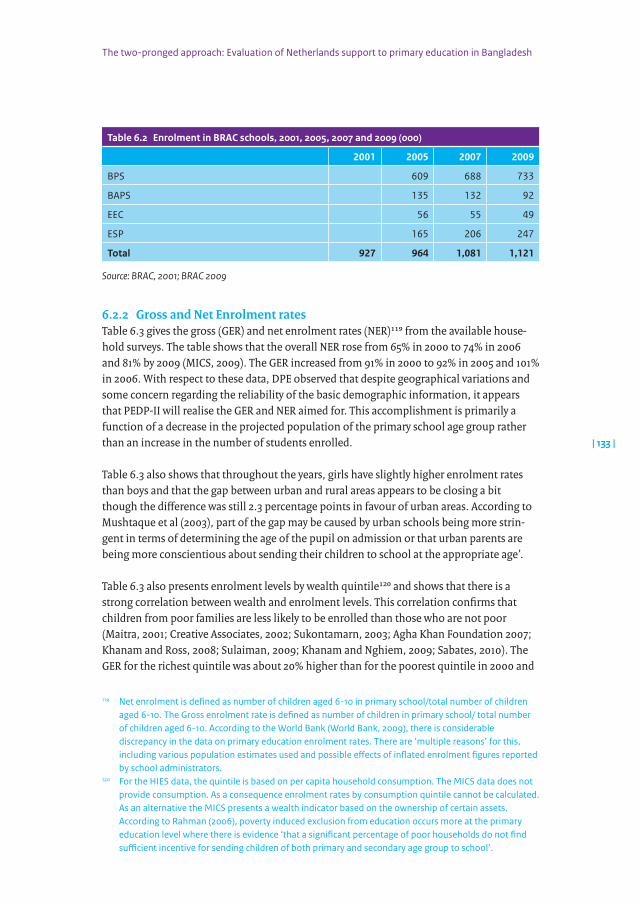
The two-pronged approach: Evaluation of Netherlands support to primary education in Bangladesh
| 133 |
Table 6.2 Enrolment in BRAC schools, 2001, 2005, 2007 and 2009 (000)
2001 2005 2007 2009
BPS 609 688 733
BAPS 135 132 92
EEC 56 55 49
ESP 165 206 247
Total 927 964 1,081 1,121
Source: BRAC, 2001; BRAC 2009
6.2.2 Gross and Net Enrolment ratesTable 6.3 gives the gross (GER) and net enrolment rates (NER)119 from the available house-hold surveys. The table shows that the overall NER rose from 65% in 2000 to 74% in 2006 and 81% by 2009 (MICS, 2009). The GER increased from 91% in 2000 to 92% in 2005 and 101% in 2006. With respect to these data, DPE observed that despite geographical variations and some concern regarding the reliability of the basic demographic information, it appears that PEDP-II will realise the GER and NER aimed for. This accomplishment is primarily a function of a decrease in the projected population of the primary school age group rather than an increase in the number of students enrolled.
Table 6.3 also shows that throughout the years, girls have slightly higher enrolment rates than boys and that the gap between urban and rural areas appears to be closing a bit though the difference was still 2.3 percentage points in favour of urban areas. According to Mushtaque et al (2003), part of the gap may be caused by urban schools being more strin-gent in terms of determining the age of the pupil on admission or that urban parents are being more conscientious about sending their children to school at the appropriate age’.
Table 6.3 also presents enrolment levels by wealth quintile120 and shows that there is a strong correlation between wealth and enrolment levels. This correlation confirms that children from poor families are less likely to be enrolled than those who are not poor (Maitra, 2001; Creative Associates, 2002; Sukontamarn, 2003; Agha Khan Foundation 2007; Khanam and Ross, 2008; Sulaiman, 2009; Khanam and Nghiem, 2009; Sabates, 2010). The GER for the richest quintile was about 20% higher than for the poorest quintile in 2000 and
119 Net enrolment is defined as number of children aged 6-10 in primary school/total number of children aged 6-10. The Gross enrolment rate is defined as number of children in primary school/ total number of children aged 6-10. According to the World Bank (World Bank, 2009), there is considerable discrepancy in the data on primary education enrolment rates. There are ‘multiple reasons’ for this, including various population estimates used and possible effects of inflated enrolment figures reported by school administrators.
120 For the HIES data, the quintile is based on per capita household consumption. The MICS data does not provide consumption. As a consequence enrolment rates by consumption quintile cannot be calculated. As an alternative the MICS presents a wealth indicator based on the ownership of certain assets. According to Rahman (2006), poverty induced exclusion from education occurs more at the primary education level where there is evidence ‘that a significant percentage of poor households do not find sufficient incentive for sending children of both primary and secondary age group to school’.
VKB041-1 283324_B85_BW v5.indd 133 10-10-11 09:55
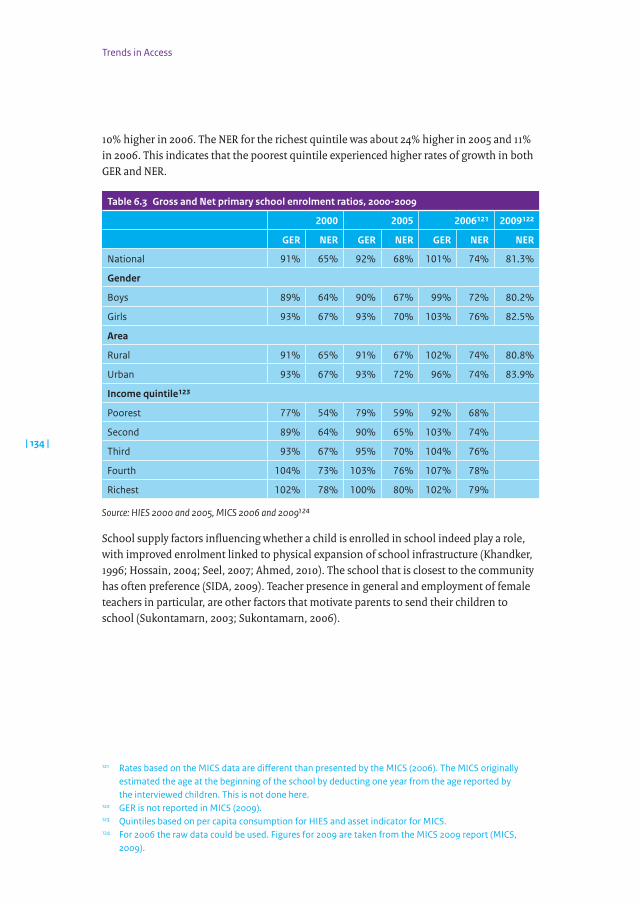
Trends in Access
| 134 |
10% higher in 2006. The NER for the richest quintile was about 24% higher in 2005 and 11% in 2006. This indicates that the poorest quintile experienced higher rates of growth in both GER and NER.
Table 6.3 Gross and Net primary school enrolment ratios, 20002009
2000 2005 2006121 2009122
GER NER GER NER GER NER NER
National 91% 65% 92% 68% 101% 74% 81.3%
Gender
Boys 89% 64% 90% 67% 99% 72% 80.2%
Girls 93% 67% 93% 70% 103% 76% 82.5%
Area
Rural 91% 65% 91% 67% 102% 74% 80.8%
Urban 93% 67% 93% 72% 96% 74% 83.9%
Income quintile123
Poorest 77% 54% 79% 59% 92% 68%
Second 89% 64% 90% 65% 103% 74%
Third 93% 67% 95% 70% 104% 76%
Fourth 104% 73% 103% 76% 107% 78%
Richest 102% 78% 100% 80% 102% 79%
Source: HIES 2000 and 2005, MICS 2006 and 2009124
School supply factors influencing whether a child is enrolled in school indeed play a role, with improved enrolment linked to physical expansion of school infrastructure (Khandker, 1996; Hossain, 2004; Seel, 2007; Ahmed, 2010). The school that is closest to the community has often preference (SIDA, 2009). Teacher presence in general and employment of female teachers in particular, are other factors that motivate parents to send their children to school (Sukontamarn, 2003; Sukontamarn, 2006).
121 Rates based on the MICS data are different than presented by the MICS (2006). The MICS originally estimated the age at the beginning of the school by deducting one year from the age reported by the interviewed children. This is not done here.
122 GER is not reported in MICS (2009).123 QuintilesbasedonpercapitaconsumptionforHIESandassetindicatorforMICS.124 For 2006 the raw data could be used. Figures for 2009 are taken from the MICS 2009 report (MICS,
2009).
VKB041-1 283324_B85_BW v5.indd 134 10-10-11 09:55

The two-pronged approach: Evaluation of Netherlands support to primary education in Bangladesh
| 135 |
In addition to income, other household related factors influencing whether a child is enrolled in school include in particular the following:
• Father’s and mother’s education125 • Father’s occupation126 • The child’s health status (Khanam and Nghiem, 2009) with improving health associated
with greater chances to start or re-enter school (Sabates, 2010) • Child labour which is negatively associated with a child’s current school enrolment and
schooling progress, and • Other household characteristics, like being a child of the household head increases
the likelihood of schooling (Khanam and Ross, 2008) and the dependency ratio within the household.127
Various sources (UNICEF, 2010; Ahmed and Hossain, 2010) point to the fact that enrolment in urban slums has become worse than in rural areas.128 Also the enrolment of minorities, e.g. in the Chittagong Hill Tracts remains below the national average, especially for girls (Chowdhury et al, 2003; Mustaque et al, 2003) because of less accessible terrain, higher poverty rates, a higher incidence of child labour and prevailing attitudes towards girls’ education (Seel, 2007; WFP, 2006).
Observations from the field visits to Sunamganj and Bogra suggest that problems in enrol-ment are often associated with remoteness and lack of access. This particularly concerns people inhabiting the haor (land which is underwater part of the year) in the case of Sunamganj and the char (non permanent land close to a river that is changing course) in the case of Bogra. Box 6.1 explores the cases of Rajshahi and Sylhet divisions in more detail.
125 Having a mother (Khandker, 1996; Maitra, 2001; Khanam and Ross, 2008) and/or father who can read and write enhances the probability of being enrolled in due time (Sukontamarn, 2003) and of studying full-time (Khanam, 2004; Khanam, 2006; Khanam and Ross, 2008; Khanam and Nghiem, 2009).
126 When the father is a day or wage labourer, is involved in another type of unskilled labour or involved in trade, this has a negative impact on enrolment keeping in mind that parental occupation may also reflect earning potential (Khanam, 2006; Khanam and Ross, 2008; Ahmed and Hossain, 2010; Ahmed et al, 2010). This kind of employment increases the probability that a child will combine study and work or work only (Raihan, 2003; Khanam, 2004). Moreover, parents who are forced to migrate seasonally in search of employment may show little motivation to send their children to school and they are more likely to be employed (Raihan, 2009). These children are unlikely to be included in educational programmes (Giani, 2006).
127 A higher dependency ratio indicates more strain on household resources because there are fewer people of productive age resulting in lower enrolment (Grenzke, 2007; Sabates et al, 2010).
128 Ahmed and Hossain report that around 75% of primary school age children (6-10) were enrolled in Dhaka slums which is below the national NER (Ahmed and Hossain, 2010).
VKB041-1 283324_B85_BW v5.indd 135 10-10-11 09:55
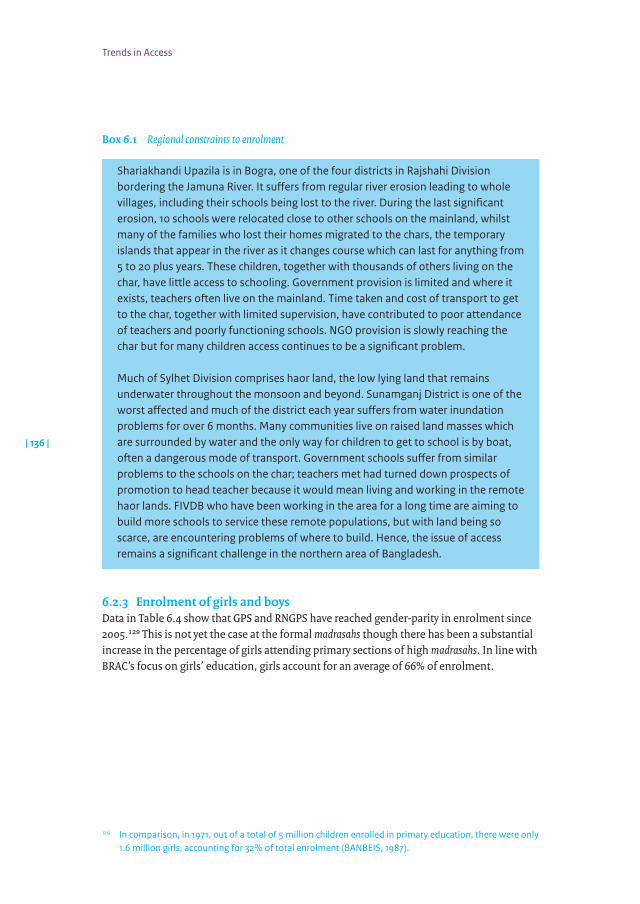
Trends in Access
| 136 |
Box 6.1 Regional constraints to enrolment
Shariakhandi Upazila is in Bogra, one of the four districts in Rajshahi Division bordering the Jamuna River. It suffers from regular river erosion leading to whole villages, including their schools being lost to the river. During the last significant erosion, 10 schools were relocated close to other schools on the mainland, whilst many of the families who lost their homes migrated to the chars, the temporary islands that appear in the river as it changes course which can last for anything from 5 to 20 plus years. These children, together with thousands of others living on the char, have little access to schooling. Government provision is limited and where it exists, teachers often live on the mainland. Time taken and cost of transport to get to the char, together with limited supervision, have contributed to poor attendance of teachers and poorly functioning schools. NGO provision is slowly reaching the char but for many children access continues to be a significant problem.
Much of Sylhet Division comprises haor land, the low lying land that remains underwater throughout the monsoon and beyond. Sunamganj District is one of the worst affected and much of the district each year suffers from water inundation problems for over 6 months. Many communities live on raised land masses which are surrounded by water and the only way for children to get to school is by boat, often a dangerous mode of transport. Government schools suffer from similar problems to the schools on the char; teachers met had turned down prospects of promotion to head teacher because it would mean living and working in the remote haor lands. FIVDB who have been working in the area for a long time are aiming to build more schools to service these remote populations, but with land being so scarce, are encountering problems of where to build. Hence, the issue of access remains a significant challenge in the northern area of Bangladesh.
6.2.3 Enrolment of girls and boysData in Table 6.4 show that GPS and RNGPS have reached gender-parity in enrolment since 2005.129 This is not yet the case at the formal madrasahs though there has been a substantial increase in the percentage of girls attending primary sections of high madrasahs. In line with BRAC’s focus on girls’ education, girls account for an average of 66% of enrolment.
129 In comparison, in 1971, out of a total of 5 million children enrolled in primary education, there were only 1.6 million girls, accounting for 32% of total enrolment (BANBEIS, 1987).
VKB041-1 283324_B85_BW v5.indd 136 10-10-11 09:55

The two-pronged approach: Evaluation of Netherlands support to primary education in Bangladesh
| 137 |
Table 6.4 Percentage girls’ enrolment in primary education, 20012009
2001 2005 2007 2009
Total formal education 49% 50% 51% 50%
Government primary schools 50% 51% 52% 51%
Registered non-government schools 49% 50% 51% 50%
Experimental schools 47% 49% 49% 50%
Community schools 48% 51% 51% 51%
Primary sections of high schools 55% 53% 56% 52%
Non registered non-government schools 49% 49% 49% 49%
Kindergarten 51% 42% 43% 43%
NGO schools 48% 51% 50% 49%
Ebtedayee madrasahs 49% 49% 48% n.a.
Primary sections of high madrasahs 31% 46% 47% n.a.
BRAC 66% 65% 66%
BPS 64% 64% 64%
BAPS 68% 67% 67%
EEC 56% 57% 57%
ESP 72% 72% 72%
Source: DPE 2002; DPE, 2005 school census; DPE, 2009 school census; BRAC, 2001, 2009b.130
Figure 6.1 presents for 2000 and 2005 the difference in NER between boys and girls, the so-called ‘gender gap’, which is measured as the NER of boys minus the NER of girls, by quintile.
130 It is noted that since different sources were used for compiling the table, it is difficult to compare numbers and ratios over the years.
VKB041-1 283324_B85_BW v5.indd 137 10-10-11 09:55

Trends in Access
| 138 |
Figure 6.1 Gender gap in net enrolment by quintile in 2000 and 2005 (percent point difference)
-8%
-6%
-4%
-2%
0%
2%
4%
6%
8%
RichestFourthThirdSecondPoorest
income quintile
NER
gen
der g
ap
mor
e gi
rls th
an b
oys
mor
e bo
ys th
an g
irls
20092005
Source: HIES 2000 and 2005
The figure makes clear that when comparing 2000 and 2005, boys in the poorest quintile have fallen further behind girls with the net enrolment gap in 2005 increasing to 6%. For all other quintiles the difference between boys and girls has fallen. Only in the richest quintile, girls lag behind boys, but this difference has diminished between 2000 and 2005. The avail-able data suggest that boys in the poorest quintile may become a concern. Since this is a trend that is also observed in other countries (e.g. Pakistan, Ethiopia, Jordan) the declining enrolment of poor boys merits further research.131
Though it is difficult to single out the effects of any supply side interventions, better enrol-ment figures for girls than boys have been attributed to:
• The Government’s ‘positive discrimination’ or ‘affirmative action’ policies (Mushtaque, 2003; CAMPE, 2006) coupled with Government and donor investments in girls’ educa-tion (Ahmad, 2003, Schuler et al, 2008; GoB, 2009) and the secondary school stipend
131 The SIDA Reality Check Bangladesh of 2008 refers to ‘a growing problem of boys’ self-exclusion from school against their parents’ wishes (SIDA, 2009) as they prefer to play, loiter, see little value in education, feel outshone by girls and have frequently had a poor experience of school (SIDA, 2009).
VKB041-1 283324_B85_BW v5.indd 138 10-10-11 09:55

The two-pronged approach: Evaluation of Netherlands support to primary education in Bangladesh
| 139 |
programme for girls which has attracted more girls to enter primary school (Ravallion and Woodon, 2000; Khanam, 2004)132, and
• NGO educational and poverty alleviation programmes, including community based health and family planning services, microcredit and training in skills for income generation, that have focused on women and girls (Maitra, 2001).
In terms of socio-economic factors, it is worth pointing to (i) the increased importance attached in society to girls’ education – also because the ‘educated bride’ costs less or no money to the parents in terms of dowry (Khan, 2001; Heissler, 2007; SIDA, 2008; Asadullah et al, 2009);133 and (ii) lower opportunity costs of sending girls to school, even among poor households (Sabates et al, 2010), with boys qualifying for paid work, as opposite to domestic work (which is done by girls), at an earlier age.
6.2.4 Enrolment by type of schoolTable 6.5 is based on the MICS 2006 classification of schools and asset index. The table shows that relatively more pupils from the poorest quintiles are enrolled in non-formal schools, including non-formal madrasahs. Though overall differences are small, this indi-cates that non-formal education succeeds in picking up relatively more poor children and that GPS serve relatively more students from higher quintiles.
Table 6.5 Share of students by wealth quintile and school type, 2006
Wealth indicator Total
Poorest Second Middle Fourth Richest
Formal 24% 22% 20% 18% 16% 100%
Non-formal 30% 21% 18% 14% 16% 100%
Ebtedayee madrasah 22% 23% 24% 20% 11% 100%
Non-formal madrasah 26% 25% 20% 14% 15% 100%
Total 24% 22% 20% 18% 15% 100%
Source: MICS, 2006
Data from CAMPE divides the schools into different categories: government, non-government (but formal), ebtedayee madrasah, non-formal, attached primary and attached madrasah (see Table 6.6). The latter two are also formal school types. Furthermore, data is
132 In relation to the secondary school stipend programme it has been observed, that it may have been ‘an incentive for girls to complete primary school’, thus impacting on primary school enrolment, and helped in ‘improving the communities’ perceptions of the returns to secondary education’ (Grenzke, 2007; SIDA, 2009). For boys, however, the same programme could be a deterrent to complete primary education as families would not be able to pay for continuation of their education.
133 Even though the payment of dowry is illegal in Bangladesh since the Dowry Prohibition Act of 1980.
VKB041-1 283324_B85_BW v5.indd 139 10-10-11 09:55
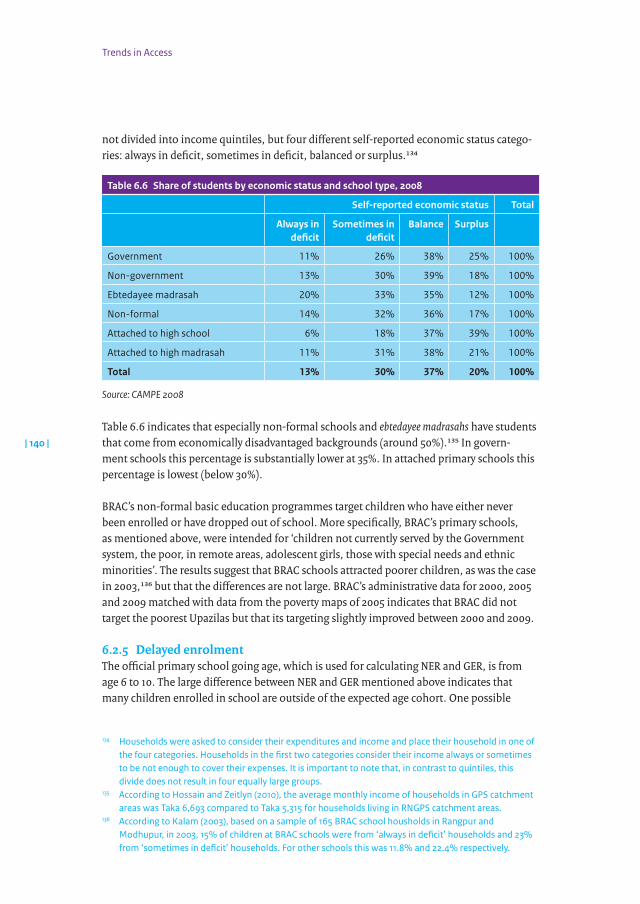
Trends in Access
| 140 |
not divided into income quintiles, but four different self-reported economic status catego-ries: always in deficit, sometimes in deficit, balanced or surplus.134
Table 6.6 Share of students by economic status and school type, 2008
Selfreported economic status Total
Always in deficit
Sometimes in deficit
Balance Surplus
Government 11% 26% 38% 25% 100%
Non-government 13% 30% 39% 18% 100%
Ebtedayee madrasah 20% 33% 35% 12% 100%
Non-formal 14% 32% 36% 17% 100%
Attached to high school 6% 18% 37% 39% 100%
Attached to high madrasah 11% 31% 38% 21% 100%
Total 13% 30% 37% 20% 100%
Source: CAMPE 2008
Table 6.6 indicates that especially non-formal schools and ebtedayee madrasahs have students that come from economically disadvantaged backgrounds (around 50%).135 In govern-ment schools this percentage is substantially lower at 35%. In attached primary schools this percentage is lowest (below 30%).
BRAC’s non-formal basic education programmes target children who have either never been enrolled or have dropped out of school. More specifically, BRAC’s primary schools, as mentioned above, were intended for ‘children not currently served by the Government system, the poor, in remote areas, adolescent girls, those with special needs and ethnic minorities’. The results suggest that BRAC schools attracted poorer children, as was the case in 2003,136 but that the differences are not large. BRAC’s administrative data for 2000, 2005 and 2009 matched with data from the poverty maps of 2005 indicates that BRAC did not target the poorest Upazilas but that its targeting slightly improved between 2000 and 2009.
6.2.5 Delayed enrolmentThe official primary school going age, which is used for calculating NER and GER, is from age 6 to 10. The large difference between NER and GER mentioned above indicates that many children enrolled in school are outside of the expected age cohort. One possible
134 Households were asked to consider their expenditures and income and place their household in one of the four categories. Households in the first two categories consider their income always or sometimes to be not enough to cover their expenses. It is important to note that, in contrast to quintiles, this divide does not result in four equally large groups.
135 According to Hossain and Zeitlyn (2010), the average monthly income of households in GPS catchment areas was Taka 6,693 compared to Taka 5,315 for households living in RNGPS catchment areas.
136 According to Kalam (2003), based on a sample of 165 BRAC school housholds in Rangpur and Modhupur, in 2003, 15% of children at BRAC schools were from ‘always in deficit’ households and 23% from ‘sometimes in deficit’ households. For other schools this was 11.8% and 22.4% respectively.
VKB041-1 283324_B85_BW v5.indd 140 10-10-11 09:55

The two-pronged approach: Evaluation of Netherlands support to primary education in Bangladesh
| 141 |
reason is that children are enrolled in primary school late (delayed enrolment), which is investigated in this section.137
Table 6.7 shows in which school level children are enrolled by age cohort. Levels are divided in pre-primary, primary and post primary education.
Table 6.7 School level enrolment by age, 2000 and 2005
Age
5 6 7 8 9 10 11 12 13 14 15 16 17
Out of school
2000 71% 46% 27% 17% 14% 20% 22% 29% 34% 38% 53% 53% 61%
2005 69% 43% 18% 13% 10% 15% 14% 25% 26% 36% 48% 58% 60%
Pre-primary 2000 15% 18% 11% 6% 2% 1% 0% 0% 0% 0% 0% 0% 0%
2005 20% 23% 16% 7% 2% 1% 1% 0% 0% 0% 0% 0% 0%
Primary 2000 14% 36% 61% 76% 82% 72% 58% 38% 21% 10% 4% 2% 0%
2005 11% 34% 66% 80% 88% 76% 61% 34% 18% 7% 3% 2% 0%
Post primary education
2000 0% 0% 1% 1% 2% 7% 20% 33% 45% 52% 43% 45% 39%
2005 0% 0% 0% 0% 0% 8% 24% 41% 56% 57% 49% 40% 40%
Source: HIES 2000 and 2005
Delayed enrolment is a common phenomenon. Of the 6 year old children only 36% was enrolled in primary school in 2000. In both 2000 and 2005, the highest enrolment was reached at the age of 9, when 82% and 88% of children respectively went to school. Many children were still enrolled in primary school beyond the official primary school age. In 2005, this concerned 61% of the 11 year olds and 34% of the 12 year olds. Delayed enrol-ment increased slightly between 2000 and 2005, with only 34% of 6 year old children enrolled in primary school in 2005 compared to 36% in 2000. This decrease was offset by a larger increase in 6 year old children going to pre-primary schools, which occurred for all children between the age of 5 and 8. If pre-primary education is included in the analysis, the percentage of 6 year old children enrolled increased from 34% to 57% in 2005. CAMPE data shows that the rate of 6 years olds enrolled in primary school increased to 45% in 2008.
Figure 6.2 shows, for each age cohort, the grade in which children are enrolled. Each grade is characterized by a colour and stacked on top of each other so that the height of the bar indicates the percentage of children enrolled in the age group. Enrolment in secondary school is also shown in the graph, but not separated by grade.
137 According to the 2010 ASPR, the 2009 school census validation survey ‘found that for a large proportion of students there was no information on their age: 20-26% in GPS, 25-35% in RNGPS and 37-42% in community schools. There were differences between the school census and the validation survey. For example, the proportion of Grade V students aged 11 years or older in GPS was 9% according to the school census but 25% according to the validation survey. This means that the school census overestimates the net enrolment rate as the number of overage children is higher than reported’.
VKB041-1 283324_B85_BW v5.indd 141 10-10-11 09:55

Trends in Access
| 142 |
Figure 6.2 Grade wise enrolment by age, 2005
0
10
20
30
40
50
60
70
80
90
100
17161514131211109876
Age
Enro
lmen
t
Higher
Grade 5 Right grade for age
Grade 4
Grade 3
Grade 2
Grade 1
Source: HIES 2005
The figure shows that the majority of children are in a lower grade than is appropriate for their age and that only a small proportion of children is in the right grade for their age – indicated by the orange block. Only around 20% of the children manage to complete their primary education by the age of 10.
Figure 6.3 shows furthermore that the timing of sending children to school is related to poverty (Sulaiman, 2009).138 According to Sulaiman ‘(about) three-quarters of the 6-10 years old male students from the poorest quintile households are attending a lower grade than what they are expected to attend for their age’ a main reason being ‘entry into school at a higher than expected age’ (Sulaiman, 2009). Other factors that contribute to delayed enrol-ment include parents’ perceptions that the child is not old enough to enrol at the age of 6, certainly not when the school is far away, difficult to reach or at a dangerous spot, or has insufficient places available (Grira, 2007; Ahmed and Hossain, 2010). Moreover, the absence of birth registration and birth records may lead to a ‘casual approach’ to determining the appropriate age for starting school (Sabates et al, 2010). Parents in the richest quintile are more likely to send their 6 year old children to school (as is confirmed by Sulaiman, 2009 and Hossain, 2010).
138 According to Grira (2007), the ‘fixed and random effects models both strongly support the hypothesis that malnourished children enter school late’.
VKB041-1 283324_B85_BW v5.indd 142 10-10-11 09:55

The two-pronged approach: Evaluation of Netherlands support to primary education in Bangladesh
| 143 |
Figure 6.3 Percentage of 6 year old children enrolled in pre-primary and primary by quintile
0%
10%
20%
30%
40%
50%
60%
70%
80%
90%
100%
2005200020052000200520002005200020052000SecondPoorest
Income quintile
Thirth Fourth Richest
Enro
lmen
t
Pre-primaryPrimary
Source: HIES 2000 and 2005
Figure 6.3 also shows that the increase in pre-primary enrolment has been strongest for the richest quintile. The popularity of this option among the richest households seems even to have resulted in the drop in the share of 6 year old children enrolled in primary school.
Delayed enrolment has various repercussions:
• Since ‘(the) older they become, the higher the opportunity cost of schooling in terms of the forgone income that is needed to cover for household needs’, late starters ‘face a high risk of leaving schooling, possibly without even completing a full cycle of primary educa-tion’ and thus ‘learn little’ (Sabates et al, 2010; Islam et al, 2009; Khanam, 2006)
• Over age children in higher school grades are much more likely to drop out than over age children in lower school grades (Sabates et al, 2010)
• For girls, late enrolment enhances changes of dropping out: soon after reaching puberty, there is family and community pressure to marry and increased concern among parents about safety and security of older girls walking to, from or within the school (Ahmed and Hossain, 2010; Ahmed et al, 2010), and
• It has implications for educational approaches and a ‘pressing problem is to ensure that the needs of this wide age group of children are being met in de classroom. The teaching-learning process needs to be adjusted for this problem to ensure that teachers are not using mono grade teaching strategies in a multi-grade setting’ (Hossain, 2010).
VKB041-1 283324_B85_BW v5.indd 143 10-10-11 09:55

Trends in Access
| 144 |
6.2.6 Out of school childrenOne of the aims of PEDP-II is to address ‘the needs of children who have never attended formal primary school or who have dropped out before completing primary school due to poverty, disability or any other reason’ (GoB, 2010). To date the emphasis has however been on increasing the number of special needs children, defined mainly as those children with mild to moderate sight, hearing or physical problems. The ASPR 2010 identifies enrol-ment of special needs children as a success, with the number of children with disabilities enrolled far exceeding the annual target growth rate of 5% since 2005 (GoB, 2010). This was confirmed during visits to GPS, RNGPS and community schools, with about half of the schools having between 1 and 5 children with special needs. Observed teacher attention towards children with special needs was mixed. OPM (2008), while recognising some of the positive changes that had occurred, noted that ‘(in) fact it is difficult to identify the actual impact of PEDP-II on social inclusion at the local and school levels, which is not surprising as the focus remains on improving quality for mainstream schooling, with limited attention to excluded groups’.
BRAC also widened its focus on inclusivity under BEP-I to ‘integrate children with mild to moderate disability within classes and to address the specific needs of children from ethnic minority groups’. The former included the broader agenda of changing attitudes towards children with disabilities as well as a practical focus on their inclusion in schools. BRAC schools all attempt to recruit at least one child with disabilities. During field work teachers were observed to be particularly aware of the needs of these children and were giving them individual attention during class. BRAC pays particular attention to inclusive education for ethnic minority groups in the Chittagong Hill Tracts.
Despite these initiatives, the available data indicates that a considerable share of the primary school-aged children remains out of school. Data from CAMPE and the MICS 2006 give the following percentages: 23% in 1998, 20% in 2000, 13% in 2005, 15% in 2006 and 14% in 2008. It has been observed in this respect that ‘equity in access by the poorest groups, has not improved much’ (Ahmed, 2011). The recommendations of an ADB evaluation study to target hard core poverty groups including the urban poor, in particular children in urban slums (UNICEF, 2010; Ahmed and Hossain, 2010), in remote areas and ethnic minorities remains valid. According to Sabates et al (2010) it concerns a ‘severely marginalised group of children, who require special education or other forms of intervention to secure their inclusion into education and aid their progression through the cycle of primary and lower secondary schooling if meaningful learning is to be achieved’.
The Netherlands has aimed to enhance access for ‘hard to reach’ out of school children by providing support to FIVDB and the ILO UIE project (see Box 6.2).
VKB041-1 283324_B85_BW v5.indd 144 10-10-11 09:55

The two-pronged approach: Evaluation of Netherlands support to primary education in Bangladesh
| 145 |
Box 6.2 ILO UIE approach to provide Non-Formal Education
TheILOUIEprojectprovidednon-formaleducationtochildlabourersinDhakacitybetween5and18yearsthatwereengagedintheWorstFormsofChildLabour.The baseline survey conducted by the UIE Project in 2001 among some 5 thousand small-scale enterprises employing child labourers, provided the first accurate profiles of child labourers (8-15 years) working in the urban informal economy of Dhaka City. It was found that:
• Child labourers work on average 12 hours per day and earn on average Taka 14 per day.
• 78 % of working children live in slum areas.• Average monthly household income, including children’s earnings, is less than
Taka 3,500.• 72 % never attended school while only 14 % have basic reading and writing skills.• 24 % of working children reside at their workplace, with employers acting as their
guardians. • 70 % of surveyed children were aged 12 years and above. They are generally
engaged in more high-skilled sectors, e.g. automobile repair, carpentry and shoe manufacturing. More than one third (38%) of this group are apprentices and receive no wages at all.
• The 30 % of children under 12 years old are mainly involved in low-skilled sectors such as plastic recycling and battery breaking, which is often more hazardous but relatively better paid.
• Hazards relate to excessive working hours, circumstances and nature of the work, e.g. exposure to harmful chemicals, equipment and machinery, heat, noise and insufficient lighting and ventilation.
• Children suffered from diverse health problems, e.g. infections, eyesight, hearing and breathing problems and headaches. Many are underweight and suffer from stunted physical and cognitive growth.
The Non-Formal Education (NFE) component of the UIE programme encompassed the provision of a one year course of non-formal education, which included basic and functional literacy, numeracy and life skills classes. Annually, staff identified working children from selected hazardous sectors in specified geographical areas in Dhaka city and invited them to enrol in the programme. Enrolment was discussed with guardians and employers who were requested to release the children during working hours. Each school had three daily 2.5 hour NFE shifts with 30 children (8-15 years) in each class. Multi-grade teaching was applied, meaning that children in each class were subdivided into three different grades based on the result of an admission test. Upon graduation, children were mainstreamed into either formal or non-formal primary schools or referred to the Skills Development Programme, depending on their age, educational background and aspirations.
VKB041-1 283324_B85_BW v5.indd 145 10-10-11 09:55
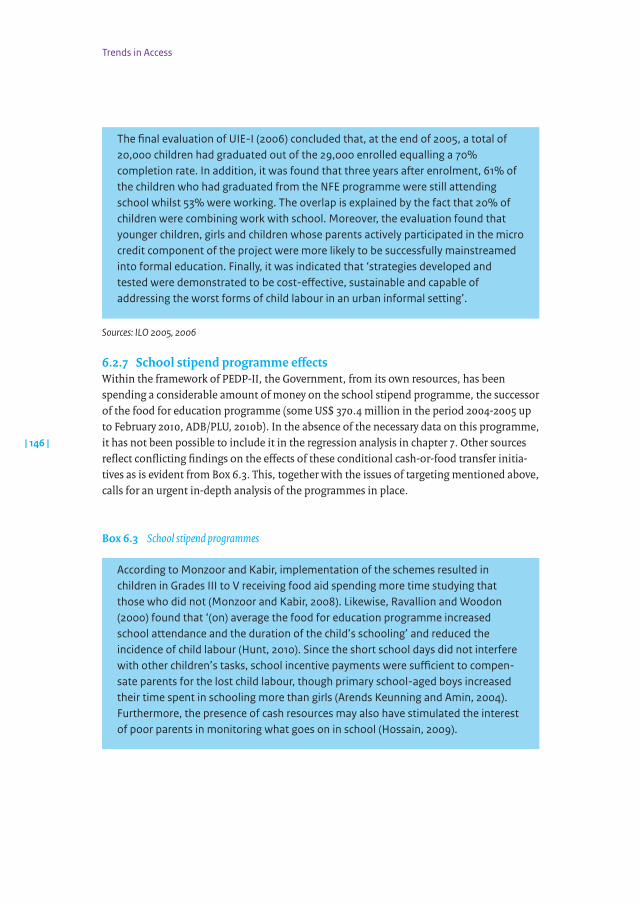
Trends in Access
| 146 |
The final evaluation of UIE-I (2006) concluded that, at the end of 2005, a total of 20,000 children had graduated out of the 29,000 enrolled equalling a 70% completion rate. In addition, it was found that three years after enrolment, 61% of the children who had graduated from the NFE programme were still attending school whilst 53% were working. The overlap is explained by the fact that 20% of children were combining work with school. Moreover, the evaluation found that younger children, girls and children whose parents actively participated in the micro credit component of the project were more likely to be successfully mainstreamed into formal education. Finally, it was indicated that ‘strategies developed and tested were demonstrated to be cost-effective, sustainable and capable of addressing the worst forms of child labour in an urban informal setting’.
Sources: ILO 2005, 2006
6.2.7 School stipend programme effectsWithin the framework of PEDP-II, the Government, from its own resources, has been spending a considerable amount of money on the school stipend programme, the successor of the food for education programme (some US$ 370.4 million in the period 2004-2005 up to February 2010, ADB/PLU, 2010b). In the absence of the necessary data on this programme, it has not been possible to include it in the regression analysis in chapter 7. Other sources reflect conflicting findings on the effects of these conditional cash-or-food transfer initia-tives as is evident from Box 6.3. This, together with the issues of targeting mentioned above, calls for an urgent in-depth analysis of the programmes in place.
Box 6.3 School stipend programmes
According to Monzoor and Kabir, implementation of the schemes resulted in children in Grades III to V receiving food aid spending more time studying that thosewhodidnot(MonzoorandKabir,2008).Likewise,RavallionandWoodon(2000) found that ‘(on) average the food for education programme increased school attendance and the duration of the child’s schooling’ and reduced the incidence of child labour (Hunt, 2010). Since the short school days did not interfere with other children’s tasks, school incentive payments were sufficient to compen-sate parents for the lost child labour, though primary school-aged boys increased their time spent in schooling more than girls (Arends Keunning and Amin, 2004). Furthermore, the presence of cash resources may also have stimulated the interest of poor parents in monitoring what goes on in school (Hossain, 2009).
VKB041-1 283324_B85_BW v5.indd 146 10-10-11 09:55

The two-pronged approach: Evaluation of Netherlands support to primary education in Bangladesh
| 147 |
On a more critical note, data from several years from a sample of 600 households with primary school going children, suggest that the impact of the stipend has not been substantial with respect to school outcomes like enrolment and dropout rates (Baulch, 2010).139 This is not very different from what was reported by Al Samarrai (2008), highlighting that inequalities in access between poor and non-poor did not decline significantly between 2000 and 2005. Moreover, exclusion of NGOs and private schools from the stipend programme had also introduced ‘incentives for households to shift their children into government recognised schools. Moreover, according to SIDA, the attendance and performance criteria to qualify for a stipend are the most hard to meet for poor children (SIDA, 2008).
6.3 School attendance, repetition, dropout and survival rates
Being enrolled in school is not equal to attending school. Significant differences exist in attendance rates140 across sources, with the CAMPE surveys showing lower rates (60% in 2000 and 67.7% in 2008) than the MICS which reported an overall attendance rate of 89% in 2006 (see Table 6.8).141
139 Baulch (2010) evaluates the programme using a panel dataset of around 600 households which were followed from 2000 – before the programme was introduced- to 2006. Using a combination of matching and difference in difference estimators, he finds that the programme did not have a significant effect on enrolment in primary school. As many of the households that received the PES programme also participated in its predecessor, the food for education program, this could be an underestimate of the real effect. Further restricting the sample to exclude children that participated in the food for education program increases the point estimate, but the estimated effect remains insignificant. It should however be noted that the sample size for this latter estimation is extremely small,70households,whichcouldalsohavecontributedtotheinsignificanteffect.Lookingatgradeprogression, the author actually finds a significant negative effect of the stipend. According to Hossain, a ‘large proportion of children who are repeating classes are not getting the primary education stipend money compared to those who are progressing well. It indicates that the redistribution of resources to disadvantaged groups by improving their educational investment and attainments thereby is being inhibited’ (Hossain, 2010).
140 Attendance rate provided by school census surveys is measured as the ratio of children present at the day of the survey and the number of children in the registers. The MICS asked how many days a child went to school the past week.
141 A possible explanation for the high rates in the MICS is that parents might overstate the attendance of their children. This could also be true for school records as 85% of attendance is needed to continue receiving the stipend. CAMPE surveys on the other hand calculate attendance by comparing the number of registered children with the number of children that are actually present in class. This might result in understatement of attendance if some of the children registered have actually dropped out or transferred to another school, without this being properly recorded. Actual attendance rates will thus lie somewhere in between the two different rates.
VKB041-1 283324_B85_BW v5.indd 147 10-10-11 09:55
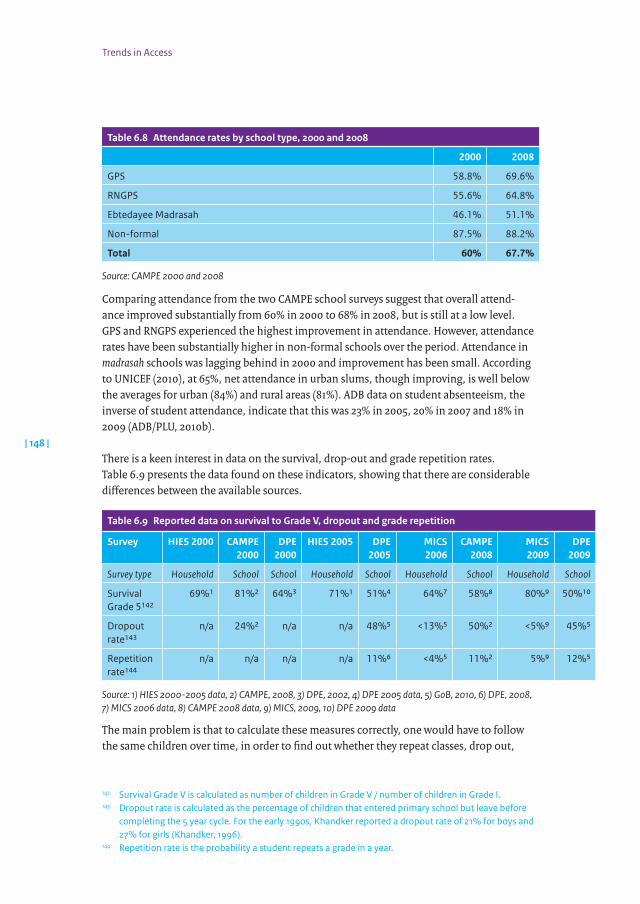
Trends in Access
| 148 |
Table 6.8 Attendance rates by school type, 2000 and 2008
2000 2008
GPS 58.8% 69.6%
RNGPS 55.6% 64.8%
Ebtedayee Madrasah 46.1% 51.1%
Non-formal 87.5% 88.2%
Total 60% 67.7%
Source: CAMPE 2000 and 2008
Comparing attendance from the two CAMPE school surveys suggest that overall attend-ance improved substantially from 60% in 2000 to 68% in 2008, but is still at a low level. GPS and RNGPS experienced the highest improvement in attendance. However, attendance rates have been substantially higher in non-formal schools over the period. Attendance in madrasah schools was lagging behind in 2000 and improvement has been small. According to UNICEF (2010), at 65%, net attendance in urban slums, though improving, is well below the averages for urban (84%) and rural areas (81%). ADB data on student absenteeism, the inverse of student attendance, indicate that this was 23% in 2005, 20% in 2007 and 18% in 2009 (ADB/PLU, 2010b).
There is a keen interest in data on the survival, drop-out and grade repetition rates. Table 6.9 presents the data found on these indicators, showing that there are considerable differences between the available sources.
Table 6.9 Reported data on survival to Grade V, dropout and grade repetition
Survey HIES 2000 CAMPE 2000
DPE 2000
HIES 2005 DPE 2005
MICS 2006
CAMPE 2008
MICS2009
DPE 2009
Survey type Household School School Household School Household School Household School
Survival Grade 5142
69%1 81%2 64%3 71%1 51%4 64%7 58%8 80%9 50%10
Dropout rate143
n/a 24%2 n/a n/a 48%5 <13%5 50%2 <5%9 45%5
Repetition rate144
n/a n/a n/a n/a 11%6 <4%5 11%2 5%9 12%5
Source: 1) HIES 2000-2005 data, 2) CAMPE, 2008, 3) DPE, 2002, 4) DPE 2005 data, 5) GoB, 2010, 6) DPE, 2008, 7) MICS 2006 data, 8) CAMPE 2008 data, 9) MICS, 2009, 10) DPE 2009 data
The main problem is that to calculate these measures correctly, one would have to follow the same children over time, in order to find out whether they repeat classes, drop out,
142 Survival Grade V is calculated as number of children in Grade V / number of children in Grade I.143 Dropout rate is calculated as the percentage of children that entered primary school but leave before
completing the 5 year cycle. For the early 1990s, Khandker reported a dropout rate of 21% for boys and 27% for girls (Khandker, 1996).
144 Repetition rate is the probability a student repeats a grade in a year.
VKB041-1 283324_B85_BW v5.indd 148 10-10-11 09:55

The two-pronged approach: Evaluation of Netherlands support to primary education in Bangladesh
| 149 |
or eventually reach Grade V. Such panel data are not available and most likely the truth is somewhere in between the above rates.
In line with what has been observed with respect to enrolment, the available data indicates that primary school attendance and attainment is influenced by:
• Household income145 • Literacy of the parents146 • Parents’ occupation147 • The child’s health status148, and • Relationships between the community and the school.149
Moreover, in certain parts of the country, children stop attending during the seasonal drought or ‘monga’ period, to support their families or because hunger makes travel and study impossible (Seel, 2007).
Rather than trying to solve the discrepancies between the different data, the evaluation focuses on primary school completion rates and entrance into junior secondary. These are readily observable in the HIES 2000 and 2005 data and thus less prone to measurement errors than the constructed indicators presented above.
6.4 Completion rate and secondary enrolment rates
Hypothetically, a perfectly functioning system with no delayed enrolment, no drop out and no repetition, would have a 100% completion rate by age 11.
145 The net attendance rate of primary education may have ‘significant correlation with income/expenditure poverty’ (UNICEF, 2010) and children from wealthier families have a significantly higher attendance rate (Creative Associates, 2002; Khanam, 2006; Mujeri, 2003; Khaman and Nghiem, 2009; Raihan, 2009; Sabates et al, 2010; Ahmed et al, 2010). Other sources observed that there was no significant difference in income between high attendees and low attendees and ‘many poor children are coming to school as regularly as the non-poor – but are nevertheless failing to achieve equally’ (Hossain, 2010; Hossain and Zeitlyn, 2010). School attendance of the poor was also more affected by the increase in costs of food and transport in 2008 (Raihan, 2009).
146 The attendance rate is higher (and child labour lower) when both parents can read and write (Ravallion and Woodon, 2000; Mujeri, 2003; Grenzek, 2007; Khanam and Nghiem, 2009; Islam et al, 2009; Ahmed et al, 2010).
147 A higher proportion of parents of children who dropped out had unskilled occupations or irregular work, compared with children who remained in school (Sukontamarn, 2003; Seel, 2007; Sabates et al, 2010).
148 A (reported) improved child’s health status reduces the likelihood of drop out (Khanam and Nghiem, 2009; Sabates et al, 2010) though being underweight is not associated with an increased likelihood of drop out (Sabates et al, 2010) – as being underweight occurs irrespective of household income, with almost 30% of the children of the richest quintile being underweight, as mentioned in section 2.2.
149 Especially mothers’ participation in school meetings is important for school attendance (Sukontamarn, 2006). Also WFP found an ‘important potential correlation’ between school non-attendance or early drop-out, poor teacher attendance, low quality of teaching and dilapidated school structure and the degree of community participation in school management (WFP, 2006).
VKB041-1 283324_B85_BW v5.indd 149 10-10-11 09:55
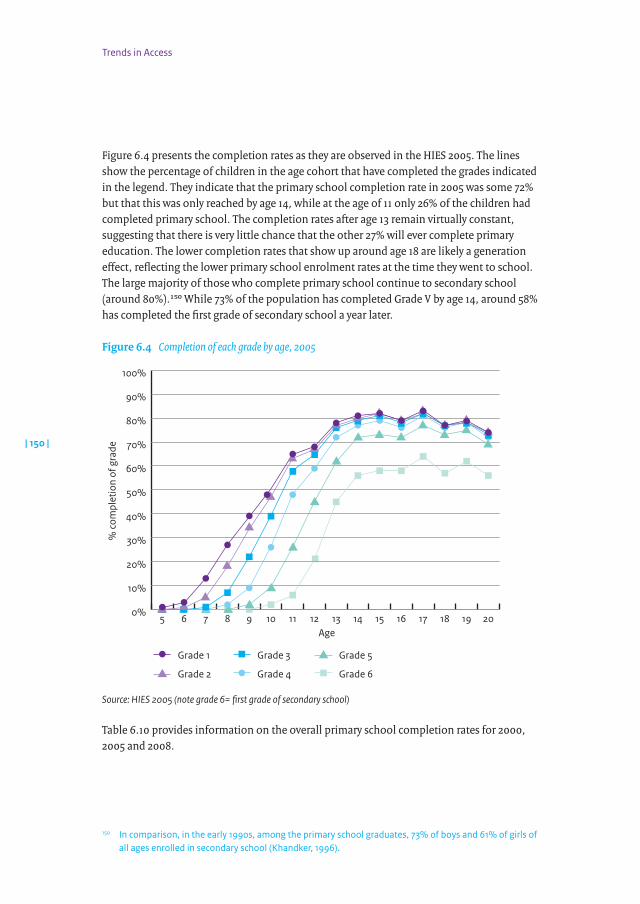
Trends in Access
| 150 |
Figure 6.4 presents the completion rates as they are observed in the HIES 2005. The lines show the percentage of children in the age cohort that have completed the grades indicated in the legend. They indicate that the primary school completion rate in 2005 was some 72% but that this was only reached by age 14, while at the age of 11 only 26% of the children had completed primary school. The completion rates after age 13 remain virtually constant, suggesting that there is very little chance that the other 27% will ever complete primary education. The lower completion rates that show up around age 18 are likely a generation effect, reflecting the lower primary school enrolment rates at the time they went to school. The large majority of those who complete primary school continue to secondary school (around 80%).150 While 73% of the population has completed Grade V by age 14, around 58% has completed the first grade of secondary school a year later.
Figure 6.4 Completion of each grade by age, 2005
Age
% c
ompl
etio
n of
gra
de
Grade 6
Grade 5
Grade 4
Grade 3
Grade 2
Grade 1
0%
10%
20%
30%
40%
50%
60%
70%
80%
90%
100%
201918171615141312111098765
Source: HIES 2005 (note grade 6= first grade of secondary school)
Table 6.10 provides information on the overall primary school completion rates for 2000, 2005 and 2008.
150 In comparison, in the early 1990s, among the primary school graduates, 73% of boys and 61% of girls of all ages enrolled in secondary school (Khandker, 1996).
VKB041-1 283324_B85_BW v5.indd 150 10-10-11 09:55
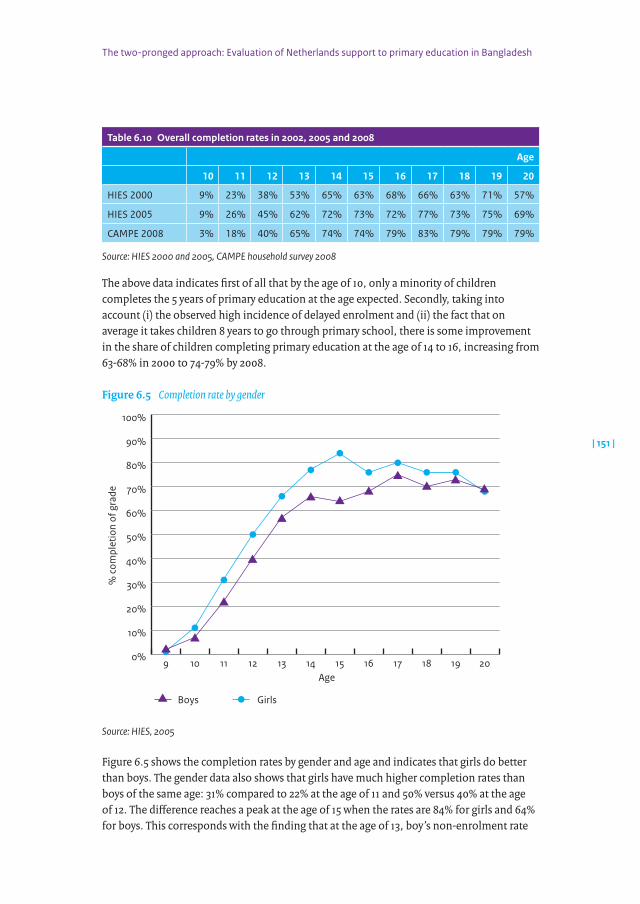
The two-pronged approach: Evaluation of Netherlands support to primary education in Bangladesh
| 151 |
Table 6.10 Overall completion rates in 2002, 2005 and 2008
Age
10 11 12 13 14 15 16 17 18 19 20
HIES 2000 9% 23% 38% 53% 65% 63% 68% 66% 63% 71% 57%
HIES 2005 9% 26% 45% 62% 72% 73% 72% 77% 73% 75% 69%
CAMPE 2008 3% 18% 40% 65% 74% 74% 79% 83% 79% 79% 79%
Source: HIES 2000 and 2005, CAMPE household survey 2008
The above data indicates first of all that by the age of 10, only a minority of children completes the 5 years of primary education at the age expected. Secondly, taking into account (i) the observed high incidence of delayed enrolment and (ii) the fact that on average it takes children 8 years to go through primary school, there is some improvement in the share of children completing primary education at the age of 14 to 16, increasing from 63-68% in 2000 to 74-79% by 2008.
Figure 6.5 Completion rate by gender
0%
10%
20%
30%
40%
50%
60%
70%
80%
90%
100%
20191817161514131211109Age
% c
ompl
etio
n of
gra
de
GirlsBoys
Source: HIES, 2005
Figure 6.5 shows the completion rates by gender and age and indicates that girls do better than boys. The gender data also shows that girls have much higher completion rates than boys of the same age: 31% compared to 22% at the age of 11 and 50% versus 40% at the age of 12. The difference reaches a peak at the age of 15 when the rates are 84% for girls and 64% for boys. This corresponds with the finding that at the age of 13, boy’s non-enrolment rate
VKB041-1 283324_B85_BW v5.indd 151 10-10-11 09:55

Trends in Access
| 152 |
is higher than that of girls, (Mushtaque et al, 2003; Chowdhury et al, 2003; Khanam, 2004; Khanam, 2006; Khanam and Ross, 2008; DPE, 2009).
Figure 6.6 makes clear that completion rates improve remarkably with wealth. For children from the poorest quintile, the primary school completion rate does not exceed 60% at the age of 15. On the other hand completion is just below 90% for the richest quintile at the age of 14.
Figure 6.6 Completion rates by income quintile
0%
10%
20%
30%
40%
50%
60%
70%
80%
90%
100%
20191817161514131211109Age
% c
ompl
etio
n of
gra
de
Richest
Fourth
Third
Second2
Poorest
Source: HIES, 2005
Figure 6.7 finally indicates that completion rates in urban areas exceed those in rural areas. The difference is small at the age of 10 but is above 10% for children between 11 and 14.
VKB041-1 283324_B85_BW v5.indd 152 10-10-11 09:55

The two-pronged approach: Evaluation of Netherlands support to primary education in Bangladesh
| 153 |
Figure 6.7 Completion rates in urban and rural areas
0%
10%
20%
30%
40%
50%
60%
70%
80%
90%
100%
20191817161514131211109
Age
% c
ompl
etio
n of
gra
de
Area RuralArea urban
Source: HIES, 2005
Lower secondary school gross and net enrolment ratios are presented in Table 6.11. The low net enrolment ratio is a reflection of the delays that many children experience in primary school. The gross enrolment ratio, of around 61% in 2005 is in line with the completion rates of Figure 6.4. Secondary school enrolment is increasing, which will have consequences for the budget that will be needed for secondary education as also observed in chapter 4. Boys are lagging behind girls but have seen more rapid increases in enrolment over the period 2000 to 2005.
VKB041-1 283324_B85_BW v5.indd 153 10-10-11 09:55
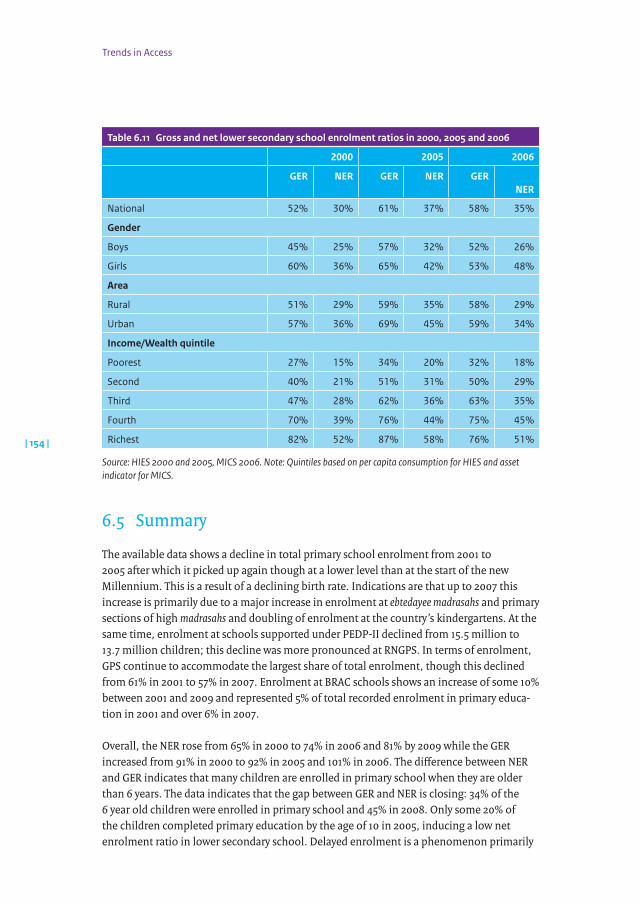
Trends in Access
| 154 |
Table 6.11 Gross and net lower secondary school enrolment ratios in 2000, 2005 and 2006
2000 2005 2006
GER NER GER NER GER NER
National 52% 30% 61% 37% 58% 35%
Gender
Boys 45% 25% 57% 32% 52% 26%
Girls 60% 36% 65% 42% 53% 48%
Area
Rural 51% 29% 59% 35% 58% 29%
Urban 57% 36% 69% 45% 59% 34%
Income/Wealth quintile
Poorest 27% 15% 34% 20% 32% 18%
Second 40% 21% 51% 31% 50% 29%
Third 47% 28% 62% 36% 63% 35%
Fourth 70% 39% 76% 44% 75% 45%
Richest 82% 52% 87% 58% 76% 51%
Source: HIES 2000 and 2005, MICS 2006. Note: Quintiles based on per capita consumption for HIES and asset indicator for MICS.
6.5 Summary
The available data shows a decline in total primary school enrolment from 2001 to 2005 after which it picked up again though at a lower level than at the start of the new Millennium. This is a result of a declining birth rate. Indications are that up to 2007 this increase is primarily due to a major increase in enrolment at ebtedayee madrasahs and primary sections of high madrasahs and doubling of enrolment at the country’s kindergartens. At the same time, enrolment at schools supported under PEDP-II declined from 15.5 million to 13.7 million children; this decline was more pronounced at RNGPS. In terms of enrolment, GPS continue to accommodate the largest share of total enrolment, though this declined from 61% in 2001 to 57% in 2007. Enrolment at BRAC schools shows an increase of some 10% between 2001 and 2009 and represented 5% of total recorded enrolment in primary educa-tion in 2001 and over 6% in 2007.
Overall, the NER rose from 65% in 2000 to 74% in 2006 and 81% by 2009 while the GER increased from 91% in 2000 to 92% in 2005 and 101% in 2006. The difference between NER and GER indicates that many children are enrolled in primary school when they are older than 6 years. The data indicates that the gap between GER and NER is closing: 34% of the 6 year old children were enrolled in primary school and 45% in 2008. Only some 20% of the children completed primary education by the age of 10 in 2005, inducing a low net enrolment ratio in lower secondary school. Delayed enrolment is a phenomenon primarily
VKB041-1 283324_B85_BW v5.indd 154 10-10-11 09:55

The two-pronged approach: Evaluation of Netherlands support to primary education in Bangladesh
| 155 |
among the poorest strata of society. It has repercussions in terms of higher opportunity costs and higher chances of dropout, especially among girls. It also has implications for teaching and learning approaches in the classroom.
Throughout the evaluation period, girls have slightly higher enrolment rates than boys and GPS and RNGPS have reached gender-parity in enrolment since 2005. Though it is difficult to single out the effects of any supply side interventions, better enrolment figures for girls have been attributed to ‘affirmative action’ policies, more value attached to girls’ educa-tion, lower opportunity costs of sending girls to school, poverty alleviation programmes focusing on women and girls, as well as the introduction of the secondary school stipend programme for girls. The issue of poor boys lagging behind in enrolment, attendance and school completion is becoming a serious issue that warrants further investigation.
The gap in enrolment between urban and rural areas appears to be closing. Enrolment in urban slums and among ethnic minorities nevertheless remains a key concern. At the same time there has been some increase in recent years in the enrolment of children with special needs The available data shows that in 2008, 14% of school-aged children were still out of school, particularly among hard core poverty groups. The programmes of ILO, BRAC and FIVDB supported by the Netherlands have catered for these groups. Though overall differences are small, non-formal schools (of e.g. BRAC) and ebtedayee madrasahs appear to succeed in picking up relatively more poor children while GPS serve relatively more students from higher quintiles.
School supply factors (school infrastructure, presence of teachers, in particular women) have indeed played a role in enhanced enrolment. In addition to income, other household related factors, such as parents’ education, father’s occupation, incidence of child labour, etc. have influenced enrolment as well. The Government has furthermore been spending considerable resources on the primary school stipend programme. Opinions differ on the successfulness of the stipend programme and further research into the effectiveness of this programme is called for.
School attendance has improved between 2000 and 2008, especially at GPS and RNGSP. It is still at a low level and below the levels reported for non-formal (including BRAC) schools. The data are inconsistent as far as survival, drop-out and grade repetition rates are concerned. Similar to enrolment, primary school attendance and attainment is influenced by household income, parents’ educational background and occupation, the child’s health status and school-community relations.
The primary school completion rate is around 73%, but it is only reached around age 14. Only a minority of children completes the 5 years of primary education at the expected age. Completion rates vary according to income, with between 60% of children from the poorest quintile just below 90% for the richest quintile, and gender, with girls doing better than boys. The rates in urban areas are slightly better than those in rural areas.
VKB041-1 283324_B85_BW v5.indd 155 10-10-11 09:55
7
Trends in quality
VKB041-1 283324_B85_BW v5.indd 156 10-10-11 09:55
| 157 |
The two-pronged approach: Evaluation of Netherlands support to primary education in Bangladesh
7.1 Introduction
This chapter first of all provides information on current teaching and learning practices inside the classroom. A comparison is made between findings of the Primary School Performance Monitoring Project that was implemented in the early years of the new Millennium and the outcomes of classroom observations, interviews and focus group discussions that were held in Sunamganj and Bogra as part of the evaluation. It subse-quently pays attention to the national end of primary school examination of 2009, and the different student assessments that were carried under the auspices of CAMPE (2000 and 2008). The chapter is concluded with a presentation of the regression model and the outcomes of the quantitative analysis.
7.2 Changes inside the classroom
7.2.1 IntroductionWhat actually happens in the classroom plays a significant role in determining how effec-tively children learn, how confidently they progress through school and their readiness for the next stage of their education.
According to a number of reports from the late 1990s and early 2000s, GPS and RNGPS were characterised by one-way, teacher-centred teaching and learning approaches. The approaches used emphasised memorisation and children were treated as passive listeners (Chowdhury, Haq and Ahmed, 1997; GoB, 2000; Latif, 2004).151 In government schools, the introduction of more child-focused teaching and learning methods was hampered by factors such as overcrowded classrooms and insufficient qualified teachers – explaining the emphasis on classroom construction and teacher recruitment and training under PEDP-II. Likewise, education in BRAC schools was found to be characterised by a lack of student-teacher interaction, repetition to ensure student retention and memorisation (without real understanding) and the predominance of the textbook as the main source of learning (Imam and Khan, 1998).
More research was called for if there was to be a move towards more effective teaching and learning in primary schools (Chowdhury, Haq and Ahmed, 1997). Some research was indeed conducted that gives some insights into the situation in primary school classrooms at the beginning of the evaluation period. Of particular relevance is the Primary School
151 According to Nath et al (2007): ‘Studies based on classroom observations successively reminded us that rote learning was the main way of teaching learning in the majority of the classrooms. This actually hampered students’ development at the understanding level. Without a meaningful change in class room practice one cannot expect any improvement in this regard. We should make the teachers understand the situation and help them to take effective measures to improve higher level skills of the students’.
VKB041-1 283324_B85_BW v5.indd 157 10-10-11 09:55

Trends in quality
| 158 |
Performance Monitoring Project (PSPMP)152 that included an assessment of classroom practices in 150 schools.
Findings from the PSPMP and a review of studies of BRAC schools by Nath (2006) are used as a baseline against which to assess change with regard to teaching and learning practices over the evaluation period. The results from the classrooms observations during this evalua-tion are then assessed against this baseline. Whilst sample sizes are not directly comparable, the use of the same tool as used in PSPMP allows relatively firm conclusions to be drawn which are complemented by other data sources where available.
7.2.2 Teaching environmentThe PSPMP (Ferdous and Rahman, 2000) found that the classroom environment was not particularly conducive to learning. Whilst space was not a significant problem, 30% of schools had no partition between classes and half the chalkboards were almost unusable. There were very few teaching aids other than textbooks available.
The evaluation shows that since then, the classroom environment at GPS and RNGPS has improved. Classrooms visited during the field work were neat and tidy and virtually all had a serviceable chalkboard. Nevertheless, with the exception of BRAC schools, few schools had resources other than the textbooks available in the classroom or had children’s work displayed on the walls, though all schools had resources for teachers to use in the teachers room. More teachers used teaching resources other than the text book though this was not observed in the BRAC schools despite the presence of such materials. See also the overview in Table 7.1 which is based on the classroom observations in different types of schools. Given the small number of observations, the findings are indicative.
Table 7.1 Teaching environment by school type and location
GPS
RNG
PS
BRA
C
Urb
an
scho
ols
Rura
l sc
hool
s
Neat and tidy classroom
All the students were able to see the teacher all the time
Serviceable blackboard in the classroom
Student’s work displayed on the classroom walls
Teaching resources other than textbooks available in the classroom.
80 - 100% of classrooms 20 - 50% of classrooms
50 - 80% of classrooms 0 - 20% of classrooms
152 Objective of PSPMP was to develop ‘a model of effective monitoring of teaching/learning practices in the classroom to provide government and funding agencies with information about school and classroom practices’ (PSPMP, 2001).
VKB041-1 283324_B85_BW v5.indd 158 10-10-11 09:55
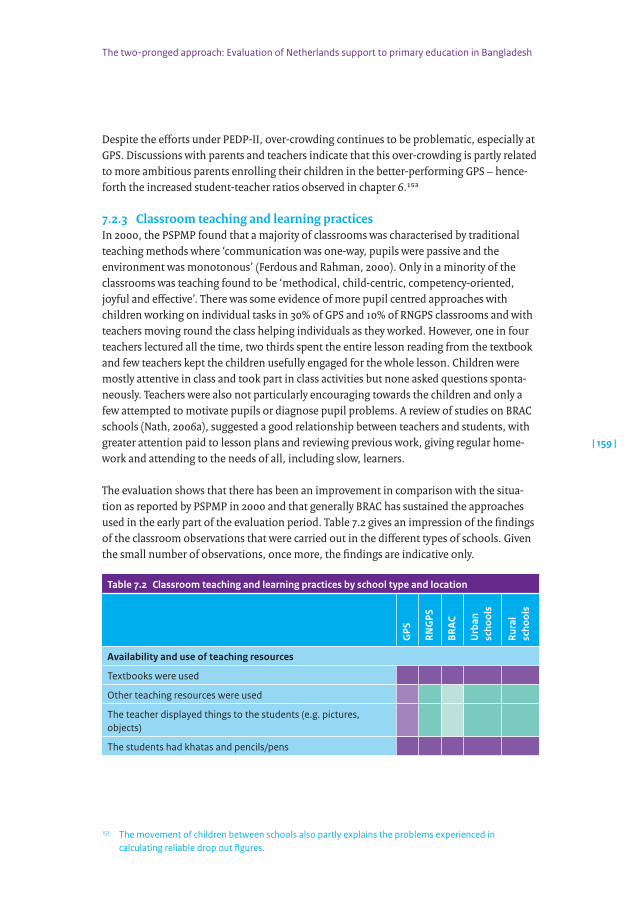
The two-pronged approach: Evaluation of Netherlands support to primary education in Bangladesh
| 159 |
Despite the efforts under PEDP-II, over-crowding continues to be problematic, especially at GPS. Discussions with parents and teachers indicate that this over-crowding is partly related to more ambitious parents enrolling their children in the better-performing GPS – hence-forth the increased student-teacher ratios observed in chapter 6.153
7.2.3 Classroom teaching and learning practicesIn 2000, the PSPMP found that a majority of classrooms was characterised by traditional teaching methods where ‘communication was one-way, pupils were passive and the environment was monotonous’ (Ferdous and Rahman, 2000). Only in a minority of the classrooms was teaching found to be ‘methodical, child-centric, competency-oriented, joyful and effective’. There was some evidence of more pupil centred approaches with children working on individual tasks in 30% of GPS and 10% of RNGPS classrooms and with teachers moving round the class helping individuals as they worked. However, one in four teachers lectured all the time, two thirds spent the entire lesson reading from the textbook and few teachers kept the children usefully engaged for the whole lesson. Children were mostly attentive in class and took part in class activities but none asked questions sponta-neously. Teachers were also not particularly encouraging towards the children and only a few attempted to motivate pupils or diagnose pupil problems. A review of studies on BRAC schools (Nath, 2006a), suggested a good relationship between teachers and students, with greater attention paid to lesson plans and reviewing previous work, giving regular home-work and attending to the needs of all, including slow, learners.
The evaluation shows that there has been an improvement in comparison with the situa-tion as reported by PSPMP in 2000 and that generally BRAC has sustained the approaches used in the early part of the evaluation period. Table 7.2 gives an impression of the findings of the classroom observations that were carried out in the different types of schools. Given the small number of observations, once more, the findings are indicative only.
Table 7.2 Classroom teaching and learning practices by school type and location
GPS
RNG
PS
BRA
C
Urb
an
scho
ols
Rura
l sc
hool
s
Availability and use of teaching resources
Textbooks were used
Other teaching resources were used
The teacher displayed things to the students (e.g. pictures, objects)
The students had khatas and pencils/pens
153 The movement of children between schools also partly explains the problems experienced in calculating reliable drop out figures.
VKB041-1 283324_B85_BW v5.indd 159 10-10-11 09:55

Trends in quality
| 160 |
GPS
RNG
PS
BRA
C
Urb
an
scho
ols
Rura
l sc
hool
s
Teaching and Learning Strategies – the teacher
The teacher mostly lectured during the lesson
The teacher tried to get the students to respond to questions
The teacher asked questions to specific students
The teacher tried to get the students involved in a discussion
The teacher asked students for their own opinions
The teacher wrote or drew on the chalk board
The teacher engaged students actively in the lesson
The teacher explained carefully if any student did not understand something
The teacher emphasised rote memorisation
The teacher had good subject knowledge and understood what he/she was teaching
Teaching and Learning Strategies – the students
Students engaged in group or pair work
Students worked individually
Students helped or discussed with each other as they worked
The students seemed relaxed and comfortable during the lesson
The children spontaneously asked the teacher for help with written work
The students asked spontaneous questions to clarify their understanding
Assessment and Feedback
The teacher gave praise when students responded correctly to questions
The teacher helped the students if they did not understand
The teacher checked on the progress of work during the lesson
Most of the students understood the lesson
80 - 100% of classrooms 20 - 50% of classrooms
50 - 80% of classrooms 0 - 20% of classrooms
VKB041-1 283324_B85_BW v5.indd 160 10-10-11 09:55
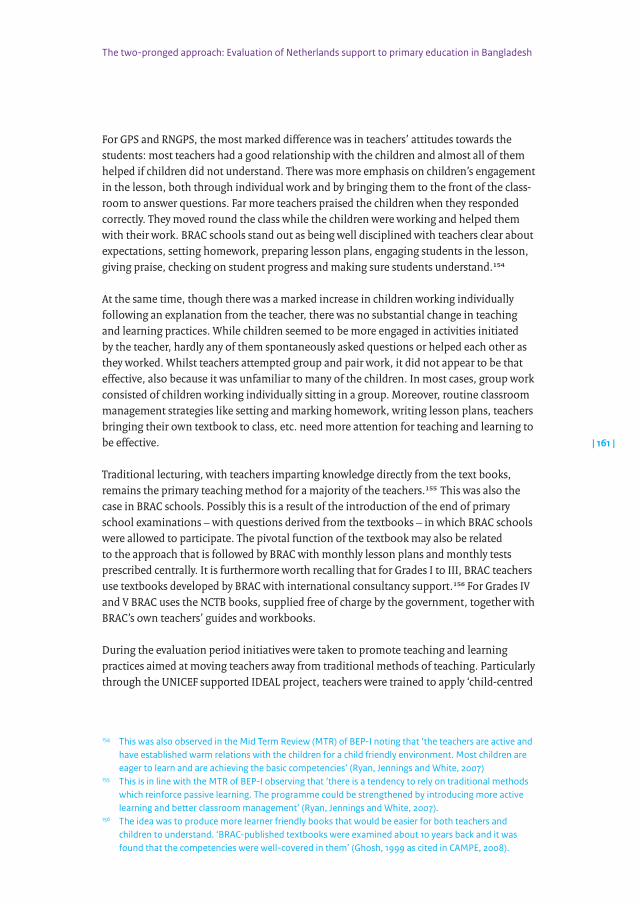
The two-pronged approach: Evaluation of Netherlands support to primary education in Bangladesh
| 161 |
For GPS and RNGPS, the most marked difference was in teachers’ attitudes towards the students: most teachers had a good relationship with the children and almost all of them helped if children did not understand. There was more emphasis on children’s engagement in the lesson, both through individual work and by bringing them to the front of the class-room to answer questions. Far more teachers praised the children when they responded correctly. They moved round the class while the children were working and helped them with their work. BRAC schools stand out as being well disciplined with teachers clear about expectations, setting homework, preparing lesson plans, engaging students in the lesson, giving praise, checking on student progress and making sure students understand.154
At the same time, though there was a marked increase in children working individually following an explanation from the teacher, there was no substantial change in teaching and learning practices. While children seemed to be more engaged in activities initiated by the teacher, hardly any of them spontaneously asked questions or helped each other as they worked. Whilst teachers attempted group and pair work, it did not appear to be that effective, also because it was unfamiliar to many of the children. In most cases, group work consisted of children working individually sitting in a group. Moreover, routine classroom management strategies like setting and marking homework, writing lesson plans, teachers bringing their own textbook to class, etc. need more attention for teaching and learning to be effective.
Traditional lecturing, with teachers imparting knowledge directly from the text books, remains the primary teaching method for a majority of the teachers.155 This was also the case in BRAC schools. Possibly this is a result of the introduction of the end of primary school examinations – with questions derived from the textbooks – in which BRAC schools were allowed to participate. The pivotal function of the textbook may also be related to the approach that is followed by BRAC with monthly lesson plans and monthly tests prescribed centrally. It is furthermore worth recalling that for Grades I to III, BRAC teachers use textbooks developed by BRAC with international consultancy support.156 For Grades IV and V BRAC uses the NCTB books, supplied free of charge by the government, together with BRAC’s own teachers’ guides and workbooks.
During the evaluation period initiatives were taken to promote teaching and learning practices aimed at moving teachers away from traditional methods of teaching. Particularly through the UNICEF supported IDEAL project, teachers were trained to apply ‘child-centred
154 This was also observed in the Mid Term Review (MTR) of BEP-I noting that ‘the teachers are active and have established warm relations with the children for a child friendly environment. Most children are eager to learn and are achieving the basic competencies’ (Ryan, Jennings and White, 2007)
155 This is in line with the MTR of BEP-I observing that ‘there is a tendency to rely on traditional methods which reinforce passive learning. The programme could be strengthened by introducing more active learning and better classroom management’ (Ryan, Jennings and White, 2007).
156 The idea was to produce more learner friendly books that would be easier for both teachers and children to understand. ‘BRAC-published textbooks were examined about 10 years back and it was found that the competencies were well-covered in them’ (Ghosh, 1999 as cited in CAMPE, 2008).
VKB041-1 283324_B85_BW v5.indd 161 10-10-11 09:55

Trends in quality
| 162 |
learning’157 which focused on children being more engaged in the lesson, through individual and group work, on making learning more enjoyable and on understanding of lessons and encouraging teachers to teach as per children’s needs. Modules for in-service training under PEDP-II (with UNICEF support) also continued to stress the ‘child centred approach’ (DPE, 2007). It is likely that the improved relationship between teachers and students and the use of more individual learning time in lessons has been influenced by these interventions.
In GPS schools, particularly, the size of the class is a first key factor determining which approaches work. With large classes of 50, 60 or even more children it is difficult to use ‘child-centred’ approaches. Also BRAC teachers, who have a limit of 33 children, suggested that their approaches to teaching and learning would be difficult with much larger classes. Evidence from the field work suggests that some of the best results in the 2009 end of primary school examination were achieved by GPS schools with large classes. However, this relates more to the fact that children at GPS schools are likely to have more educated parents, with greater support for learning at home (including private tuition), than to the teaching methods used.
The centrality of the textbooks and the fact that they have undergone few changes since 1992 is a second important factor explaining why teaching and learning practices have not changed substantially.
The evaluation shows that for most teachers, the ‘textbooks have become the curriculum’.158 In addition, some of the textbooks are difficult, as is the case for math-ematics and English in Grades III to V (CEF, 2008). More specifically, the approach used in English relies on teachers having a relatively wide vocabulary and being at ease with the language. Since this is not the case for most teachers, the textbooks present significant problems and teachers and children rely on reading and repetition of the text without understanding in order to answer questions in the examinations. For mathematics, analysis of the Grade III to V primary school text books (NCTB, 2009) reveals that the approach from Grade III onward is very theoretical. By Grades IV and V this is even more pronounced and children rely on memorisation of algorithms rather than on any meaningful understanding of the subject. A further problem identified was the pressure placed on Grade III children
157 NGO programmes, particularly FIVDB, and the follow on programme to PEDP-II (MoMPE, 2009) use the term ‘active learning’, an approach which places strong emphasis on children taking an active part in the lesson, through asking questions, working collaboratively with others and speaking out if they do not understand.
158 This situation reflects the predominant situation in the Indian sub-continent as reported in Kumar, 2004.
VKB041-1 283324_B85_BW v5.indd 162 10-10-11 09:55
The two-pronged approach: Evaluation of Netherlands support to primary education in Bangladesh
| 163 |
due to the sudden increase in subjects.159 With simpler language and reduced content in the BRAC-published textbooks in Grades I to III, children in BRAC schools seem to experi-ence fewer problems. However, the BRAC school teachers expressed similar concerns about Grades IV and V. Classroom observations suggest that parts of the curriculum are too hard for the children to understand and hence need to be learned by heart.
A third factor coming into play in perpetuating the traditional teacher-led approaches to teaching and learning is the way in which teacher training is handled. Whilst the increase in numbers of teachers trained is commendable, key issues remain: (i) the actual C-in-Ed training follows an overloaded curriculum, and (ii) with large classes (60-70 students were observed in most training sessions), the lecturing predominates apart from some work in smaller groups. The model used does not encourage teachers to promote more active learning in the classroom. Also in case of BRAC, the primary method of delivery of teacher training was through lecturing.
A fourth factor is the approach to assessment. One of the main purposes of school based assessment in GPS and RNGPS schools is to assess whether children are ready to be promoted to the next class. Half-yearly and mid-term examinations are also held in each class as of Grade III. However, it is suggested that there is a ‘question of quality and standard of these assessments at the school level including malpractices in the examinations’ (CAMPE, 2008). Thus children may be promoted without necessarily having passed the school examinations. Moreover, interviews with teachers also revealed that class tests are based directly on examples taken from the textbook. As a result, with few exceptions, much of the preparation for these tests focuses on memorisation of lessons learnt and repeating questions from the text book over and over again.
In BRAC schools children are automatically promoted to the next class and assessment is regularly carried out at the end of each section of work with papers provided from the BRAC office. Here again the emphasis is on what they have covered in the lessons from the textbook. Children receive their marks but are not given direct feedback though it is under-stood from the teachers that how children perform provides helpful information on which children need support.
159 As a group of teachers mentioned during the field research: ‘For Grade III the curriculum becomes a pressure for the students as they have to read 6 books instead of 3 books and they have to write their answer in a separate paper during the examination where as they had to write their answer in the question paper in class 1 and 2. So, the whole system goes through a drastic change. Students become worried to see the increased number of books and content. Even the good students of class 1 and 2 suddenly deteriorate. The students are interested in Bangla, English and mathematics but social science and science are the subjects they want to read less as the content is too large for them’.
VKB041-1 283324_B85_BW v5.indd 163 10-10-11 09:55

Trends in quality
| 164 |
The emphasis on memorisation questions and answers from the textbooks is also found in the end of primary school examination of 2009: questions were taken directly from the text books and children were memorizing to maximize their chances of performing well. The implications of the contradiction between a ‘child-centred’ learning approach and the end of school examination is particularly evident in the case of the FIVDB schools (see Box 7.1) that are supported by the Netherlands.
Box 7.1 The case of FIVDB: Active Learning and Assessment
FIVDBfollowsachild-centredActiveLearningteachingapproach,baseduponthethought that ‘successful learning is being fully engaged, being an active partner in discovery, rather than a passive receiver of knowledge.’160 Teaching methods like songs, games, puzzles, group work, etc. are preferred to lecturing. FIVDB has developed its own curriculum and teaching-learning materials for the pre-school class, whereas for Grades I toV FIVDB developed, tested, and revised materials that are to be used alongside government NCTB textbooks. FIVDB also provides training to teachers and supervisors on how to use these materials.
Classrooms observed during the field visit were characterized by teachers moving around the room working with groups of children, and children themselves comparing answers and discussing their work with each other. The activities seemed easier than in other schools – children of Grade I and II took time but seemed to understand what they were doing and asked if they did not. There was little use of the ‘lecture method’ and all children got attention and a chance to speak.
Yet, only 42% of children from FIVDB schools passed the primary school comple-tion examination in 2009. Their performance in the test raises questions about the place of more learner centred approaches. FIVDB students understand what they are learning but are progressing more slowly through the curriculum than children in other schools. Their skills in problem solving may be better but they have limited experience in memorising answers from the book; few up until now have been receiving private coaching.
FIVDB however indicated they only received notification that their children could take part two months before the examination. In response, FIVDB has taken steps to ensure that the children can compete and has appointed an additional teacher for each school to work with Class V children in preparation for the examination during morning session. Sessions will focus initially on understanding, but they are aware that they will need to teach the children different strategies.
Source: Based on discussions with FIVDB and observations during field work
160 FIVDBPrimaryEducationProgramme(n.d.).ActiveLearning:Methodology,CurriculumandTraining.
VKB041-1 283324_B85_BW v5.indd 164 10-10-11 09:55
The two-pronged approach: Evaluation of Netherlands support to primary education in Bangladesh
| 165 |
7.3 End of primary school examination
Until 2009, the only external examination for primary school students was the Class V scholarship exam which determined who would qualify for a secondary school scholarship. Initially taken by 20% of students, it was gradually opened up to more students and in 2008 40% of students were allowed to sit for it (CAMPE, 2008). In almost all primary schools, an additional scholarship class was set up and the students sitting for the exam would get extra coaching in the morning to maximise their chances. Other Class V students would continue to attend the afternoon sessions only, thus receiving less teaching time than their peers in the coaching class. Success of a school was determined by how many scholarships were allo-cated. The system was essentially elitist – which does not make it a proper tool for assessing education quality – as it only favoured the brightest students, though students either not sitting for the exam and or who had failed were still allowed to progress to secondary school.
The scholarship exam was discontinued with the introduction of the primary school completion examination in November 2009. The greatest significance of the exam is that, contrary to the past, students must pass to get enrolled in Grade VI. Children from a wide variety of schools, both from the government system and from outside, including NGOs such as BRAC, were allowed to sit for the exam, though some, including FIVDB as mentioned above, only received notification of eligibility shortly before it took place.
The exam was the largest public examination in Bangladesh. Nearly 2 million Grade V students from over 81 thousand schools were eligible out of which just over 1.8 million appeared. 1.6 million Grade V students (88.5%), of which 751.5 thousand boys (90.4%) and 868.6 thousand girls (87.5%) passed. While a higher percentage of boys passed, the girls dominated the merit list; in addition more girls than boys sat for the exam. Scholarships for secondary school were awarded on the basis of the results with half awarded to boys and half to girls
Figure 7.1 indicates that at RGNPS the participation and pass rates for the exam were substantially below those in GPS while BRAC schools outperformed children in Government schools with 98% of the children who entered passing the exam (BRAC, 2009b).161
161 Comparability is, however, not so straightforward given that the pupil cohort attending, amongst others, BRAC schools is potentially different in motivation and ability from those attending public primary schools – e.g. many children attending BRAC schools are older students who dropped out and are now returning to education (Chaudhury et al, 2004).
VKB041-1 283324_B85_BW v5.indd 165 10-10-11 09:55

Trends in quality
| 166 |
Figure 7.1 Participation and pass rates of 2009 national examination by school type
0
10
20
30
40
50
60
70
80
90
100
BRACRNGPSGPS
School type
Part
icip
atio
n an
d pa
ss ra
tes
Pass rateParticipation rate
Source: GoB, 2010
The primary completion exam has been hailed as a success for the government. The process of holding the exam was transparent with children moving to other sites to take the exami-nation and with teachers from other schools marking the papers. However, discussions with teachers, children and parents indicate that it has had a number of consequences, both positive and negative. On the positive side, discussions revealed that:
• The exam presents a fair opportunity to all children and all schools. BRAC teachers particularly felt that it put them on an equal footing with government schools. According to SIDA (2010), it also implies that ‘there is no longer a need to transfer students to government schools for this final year’ to sit for the scholarship exams
• Teachers feel that (A)UEOs visit the schools more often than before to check on the teachers – though as observed in chapter 5, this is evidently not the case for all schools
• Extra contact time in school is being provided for all children in Grade V, not just those in the scholarship ‘coaching’ classes. Virtually all schools were running additional classes in the morning session for Grade V students.162 This was also the case in BRAC schools.
162 See also SIDA’s Reality Check: ‘The introduction of the new public exam for all has radically changed this and free coaching for at least an hour a day was being provided in all GPS and RNGPS schools in all our study areas to all Grade V students. Some schools even offered extra classes on a Friday (rural North) and in school holidays (peri-urban Central). In some classes, less able students were now sitting at the front rather than the back’ (SIDA, 2010).
VKB041-1 283324_B85_BW v5.indd 166 10-10-11 09:55
The two-pronged approach: Evaluation of Netherlands support to primary education in Bangladesh
| 167 |
More critical implications of the introduction of the exam have been the following: (i) increased repetition, with children being held back in Grades III and IV if it is thought that they will not pass the exam,163 and; (ii) undue stress placed on children as teachers and supervisors, from all types of schools were putting pressure on children to study all the time. Moreover, the exam appears to have given an additional boost to private tutoring, which has been on the increase for several years,164 as further elaborated in Box 7.2.165
Box 7.2 Private tutoring on the rise
Private tutoring and coaching have been on the rise in Bangladesh in recent years – like in other countries in the region including China and Korea (e.g. Nath 2006 and 2007; Khan, 2001; Amin and Chandrasekhar, 2009; Aga Khan, 2007). It is done outside the school by relatives, (head) teachers (over 50%), students (over 30%), etc. and is provided free of charge or at a fee.
The high and increasing incidence of private tutoring may reflect (i) an increased interest in the quality of education among parents; (ii) social pressure from peers and neighbours, and; (iii) the need to make up for low quality education provided inside the classroom associated with crowded classrooms, lack of school facilities, insufficiently qualified teachers and limited contact hours. Moreover, parents may not have had the time to tutor their children after school hours (Nath, 2007).
On private tutoring, the available data indicates that only about a third of the students does not get supplementary private tutoring, some 26% gets it at no cost while the remaining 42% (21% in 2000) have to pay (Nath, 2006). There is a gender difference in that 47% of the boys get paid supplementary tutoring compared to 37% of the girls (34% for boys and 28% for girls reported in Nath, 2006).166 For ‘no tutoring’ or ‘no-cost tutoring’ the picture is the inverse (for girls 34.4% and 28% and for boys 30% and 24% respectively). This gender discrimination reflects existing social values and attitudes and evidently impacts negatively on the school performance of girls. The percentages of students getting supplementary tutoring vary across the different types of schools. Figures from 2006 on the incidence of private tutoring by school type found are: GPS 32%, RNGPS 29%, non-formal 12%, madrasah 20%, kindergarten 69% and secondary attached 63% (Nath, 2006).
163 In one of the schools visited, Grade III and IV had nearly 100 children each whilst there were only 30 children in Grade V. As a result 100% of children had passed.
164 The CAMPE Education Watch survey conducted in 2003-2004 found that 43% of children (across all types of providers) had private tutors, paying an average of Taka 152 per month for eight months a year. CAMPE observed that children who needed the most extra help with their studies (first generation learners) could afford it the least (CAMPE, 2004).
165 On the importance of tutoring for student accomplishments, see further section 7.5.166 According to Schuler (n.d.), the proportion of students employing private teachers increase with grade
level, family economic status and the presence of sons.
VKB041-1 283324_B85_BW v5.indd 167 10-10-11 09:55
Trends in quality
| 168 |
Primary school students from the wealthiest households are 2-4 times more likely to pay for extra tuition compared to the poorest students (Al Sammarai, 2008).167 Educated parents are more likely to send their children for tutoring than the ‘first generation learners’ of parents without education and it is more prevalent in urban (52%) than in rural (28%) areas (Nath, 2006). The incidence of private tutoring increases along the primary school grades and reaches a peak in Grade V. The length of tutoring ranges from 1 to 12 months per year and from half an hour to five hours per day. The amounts paid vary but increase with the level of education. Payments range from Taka 5 to 600 per month with a majority paying Taka 100. According to Nath, the costs of private tutoring increase ‘inequities in educational opportunities and performance which in turn creates job market inequities’ (Nath, 2006).168
7.4 Student assessments
Since the national primary school completion exam was held for the first time in 2009, no comparable data is available for previous years. Outcomes of the exam can also not be compared with the secondary school scholarship exam it replaced as explained above. The assessments of learning achievements in Bangla and mathematics that were conducted under the aegis of the Government in 2002 and 2008 were also not considered appropriate as (i) different sets of questions were used and (ii) the assessments excluded BRAC schools and were only conducted in GPS and RNGPS.
To find out whether there has been an improvement in learning outcomes, use was there-fore made of the learning assessments that were conducted by CAMPE in 2000 and 2008, testing Grade V students in mathematics and Bangla. Since the assessments used the same test instrument a direct comparison of learning results is possible. Table 7.3 presents the percentage of questions correctly answered in the mathematics and Bangla components of the test and the mean number of competencies achieved.
167 This corresponds with the findings in chapter 4 (Table 4.7), indicating the households ‘in surplus’ pay more than five times as much on private tutoring than households that are ‘always in deficit’.
168 Similar critique is offered by Hossain and Zeitliyn stating that ‘(the) scale and importance of private tutoring is a phenomenon that is perpetuating inequality in education in Bangladesh’ (Hossain and Zeitlyn, 2010).
VKB041-1 283324_B85_BW v5.indd 168 10-10-11 09:55

The two-pronged approach: Evaluation of Netherlands support to primary education in Bangladesh
| 169 |
Table 7.3 Percentage score in CAMPE assessments by school type and subject, 2000 and 2008
2000 2008
Math Bangla Mean no of competencies
achieved
No of obser
vations
Math Bangla Mean no of competencies
achieved
No of obser
vations
Government 37% 57% 16.1 832 44% 65% 19.0 1275
RNGPS 36% 58% 15.2 831 41% 59% 18.0 1,220
Ebtedayee madrasah
n.a. n.a. n.a. n.a. 34% 47% 15.2 828
Non-formal 44% 62% 17.2 846 50% 69% 20.0 1,291
Primary section of secondary school
n.a. n.a. n.a. n.a. 51% 71% 20.8 1,167
Primary section of high madrasah
n.a. n.a. n.a. n.a. 38% 56% 17.0 1,312
Mean 39% 59% 16.1 2,509 44% 65% 18.7 7,093
Source: IOB calculations based on CAMPE assessment data 2000 and 2008; Boeren, 2009.
The CAMPE data indicate an improvement in learning outcomes. For GPS, the percentage of correctly answered mathematics questions increased from 37% to 44% and Bangla questions from 57% to 65%. NGO schools, including both registered and non-registered non-governmental primary schools, scored slightly below the GPS in 2008. Children at non-formal schools, which include the BRAC schools, scored higher in 2002 and 2008 than those enrolled at the GPS on both topics. Children at primary schools attached to secondary schools and non-formal schools appeared to perform better than those at other schools.
Children attending ebtedayee madrasahs had the lowest scores on both subjects in 2008, followed by those enrolled at primary schools attached to high madrasahs –both types of schools are beyond the remit of PEDP-II. In terms of the mean number of competen-cies achieved, the ebtedayee madrasahs are lagging behind the other types of schools. This worrisome picture of the quality of madrasah primary education is also underscored in other sources and is reconfirmed in the quantitative analysis in section 7.5. The picture is
VKB041-1 283324_B85_BW v5.indd 169 10-10-11 09:55

Trends in quality
| 170 |
particularly worrisome as there appears a trend towards increased madrasah enrolment as mentioned in chapter 6.169
7.5 Quantitative analysis of education quality
Using the available CAMPE data for 2008, a regression analysis was carried out to answer the question: what are the important determinants that help to explain the observed changes in learning?
Table 7.4, which is a simplified version of the outcomes of the regression analysis provided in Annex 5, shows the correlations between student learning in Grade V and student and school characteristics. The dependent variable is the outcome of the assessment which is scored on a 0 to 100 scale based on the percentage of questions correctly answered for mathematics and Bangla in the CAMPE assessments. The table incorporates, for the data available, the main elements of the intervention logic that is reflected in Figure 1.1 above.
Table 7.4 Regression analysis learning achievements 2008
All school types
Sig Only boys Sig Only girls Sig
Student and household characteristics
Male student + *** n.a. n.a.
Student age - - -
Education mother + *** + *** + ***
Education father + *** + *** + ***
Household always in deficit + * + * +
Household sometimes in deficit + + +
Household is always in surplus + * + +
Household has electricity + - + *
Months of tutoring received + *** + *** + ***
The child has access to TV + + +
169 According to Amin and Chandrasekhar (2009), ebdetayee madrasah attendance exerts a ‘significant negative’ effect on test scores even after accounting for school-specific unobservable determinants of learning’ with children spending less time inside school and studying less outside school. Children at these schools are worse of than those attending secular schools (Sukontamarn, 2003; Chowdhury et al, 2003; Nath et al, 2007; Asadullah et al, 2009). See also Sulaiman (2009): ‘Over the last few years, it has been observed that an increasing proportion of the students are attending different types of madrasahs and this is becoming more prevalent among the poor. This trend is important since return to education is the lowest for these religious education institutes’. The impact of low quality madrasah education is also felt in secondary school where graduates of primary madrasahs significantly under-perform compared to public primary schools (Asadullah, 2009).
VKB041-1 283324_B85_BW v5.indd 170 10-10-11 09:55

The two-pronged approach: Evaluation of Netherlands support to primary education in Bangladesh
| 171 |
All school types
Sig Only boys Sig Only girls Sig
School characteristics
Urban + + +
The school is a RNGPS - - -
The school is a formal Madrasah - * + *** -
The school is non formal + ** + + ***
The school is attached to a secondary school
+ - +
The school is attached to a high madrasah - - -
Number of students in the school + *** + ** + ***
School facilities
The school has a toilet - * - -
The school has safe water supply - - -
School has electricity - - -
% Classrooms with a blackboard + + +
Teacher characteristics
% Female teachers - - -
% Teachers with professional training - + -
Experience of teachers - - -
Teacher student ratio + + +
Classroom teacher ratio + + -
School – community interaction
SMC meetings + ** + + ***
Constant term + *** + *** + ***
Number of observations 5,748 2,686 3,062
R-square 0.240 0.207 0.276
* = significant at p<0.1; ** = significant at p < 0.05 and *** = significant at p < 0.01;
Source: Author’s calculations based on CAMPE assessment 2008
The findings mirror, at least to a considerable extent, what has been observed in relation to enrolment and attendance and show that there are clear correlations between the student background characteristics and the test scores.
First of all the data shows that boys score better than girls. This corresponds with the find-ings presented above. It is also in line with other sources indicating that while their level of enrolment is below that of girls, boys outperform and have higher test scores than girls, with the male advantage being more pronounced in urban than in rural areas (Creative Associates, 2002; Mushtaque et al, 2003; Nath et al, 2007; Khan Foundation team,2007; Nath et al, 2007; Seel, 2007). Factors that could explain this phenomenon include:
VKB041-1 283324_B85_BW v5.indd 171 10-10-11 09:55

Trends in quality
| 172 |
• Boys, who are more at risk of dropping out than girls, are more likely to get supplemen-tary tutoring than girls when remaining in school as mentioned in Box 5.2
• Girls are more likely than boys to combine schooling with work (Khanam, 2006), especially in households with a considerable number of younger siblings (Khanam, 2004; Khanam and Ross, 2008). As a result, they spend less time studying outside school (Amin and Chandrasekhar, 2009).
Secondly, years of education of the parents has a strong positive influence on the perfor-mance of the children. This is also confirmed in the literature on education development in Bangladesh, indicating that ‘(better) educated parents, by ensuring that their children make more efficient use of the non-labour time for study, will help to reduce the damage done to the child’s learning by (its) work hours’ (Khanam and Ross, 2008). Moreover, children from educated parents have a lower probability of falling behind in grade attainment (Khanam and Ross, 2008; Khanam and Nghiem, 2009) and of dropping out (Sabates et al, 2010; Seel, 2007). Maitra observed that ‘(mother’s) education significantly and positively affects educational attainment of both boys and girls’. According to Maitra the effect is ‘stronger on the educational attainment of girls (Maitra, 2001)170 – this is, however, not confirmed by the regression.
Thirdly, the influence of household wealth on learning results is somewhat ambiguous. This contradicts with findings reported elsewhere indicating that students from the richest quintile are significantly more likely to attain literacy (Sulaiman, 2009): they are more likely to spend more time studying at home (Amin and Chandrasekhar, 2009), with increases in permanent income of the household contributing more to the educational attainment of boys relative to girls’ (Maitra, 2001). Students from wealthier families also have a lower probability of falling behind in grade attainment (Khanam and Nghiem, 2009) and have less chance of dropping out (Khandker, 1996; Ahmed and Hossain, 2010; Sabates et al, 2010; Hossain et al, 2009).
Fourthly, the data shows that receiving tutoring – which equals an increase in contact hours, but outside school – is positively and significantly related to test scores.171 Considering that learning can be associated with receiving supplementary private teaching, the (ultra) poor, with many of the poor students being first generation learners and without family support for doing their homework (Sulaiman, 2009), are at a disadvantage (Khan, 2001; Creative Associates, 2002).
170 Similar findings were also reported by Khandker (1996) observing that ‘increasing the mother’s education has a larger effect on both the school participation and the school attainment of girls, and thus, in reducing the gender gap’.
171 See in this respect also Box 7.2 on the issue of private tutoring and Sen, 2010.
VKB041-1 283324_B85_BW v5.indd 172 10-10-11 09:55
The two-pronged approach: Evaluation of Netherlands support to primary education in Bangladesh
| 173 |
Turning to school types and taking differences in student and school characteristics into account, it is found that RNGPS schools score substantially below GPS schools. Non-formal schools on the other hand, which include the BRAC schools, excel. In addition, larger schools generally have better learning results. This is likely related to the fact that (i) larger schools are generally GPS, with the RNGPS schools being (considerably) smaller, and; (ii) good schools attract more children – in case there is indeed a choice – and, henceforth, grow in terms of student population as observed in section 7.2.2 and chapter 6.
With respect to education input factors, the results do not show significant correlations between the test scores and the facilities of the school, i.e. water supply, electricity and blackboards, whereas the significant negative influence of toilets cannot be explained. This finding might indicate that learning had little to do with the available infrastructure and that learning results in schools which are not that well equipped can be equally good, if not better as is the case for the non-formal schools.
Unexpectedly, there are also no significant effects of the teacher/student ratio172 or class-room/teacher ratio on learning. This may be related to the increased popularity of the GPS, which have been performing comparatively well and have seen student enrolment and student-teacher ratios increase in recent years. One should recall also the considerable rates of (authorised) teacher absences – primarily because of participation in training.
The regression also finds very little effect of the composition of the teaching force and teacher qualifications; moreover, no major effect can be found of the gender of the teacher on boys’ and girls’ learning.
When considering the absence of significant effects of teachers and school infrastructure on test results it is worth recalling that one of the key components of PEDP-II is the move towards a one-shift system. This is to be realised by building additional classrooms in existing schools and employing an additional 35,000 teachers. This is to improve primary education quality as it will allow for more student contact hours and reduce pupil-teacher and pupil-classroom ratios. First of all, chapter 5 shows that the share of schools operating in single shift increased from 16% in 2005 to 19% in 2009. Secondly, in terms of contact hours, according to the ASPR of 2010, the 2-shift schools on average continue to have 2 to 2.5 hours for Grades I and II, with children reaching only 520 contact hours per year of the 900 targeted, and 3.5 hours for Grades III to V (GoB, 2010).173 This continues to be below the mean number of contact hours reported for other Asian countries.174
172 For this regression, observations were omitted where the teacher-student ration was more than 0.1. This often occurred with schools attached to other (secondary) schools or PTIs. Most likely the number of teachers for the entire school was recorded rather than those teaching in the primary section, resulting in a very high teacher-student ratio.
173 Islam quotes figures of 595 hours per year for Grades I and II and 865 hours for Grades III to V but remarks that the ‘actual number of hours is substantially lower than the official figures’ (Islam, 2010). It is not known whether these estimates include (authorised) teacher absenteeism mentioned in section 4.3.
174 UNESCO refers to 800-1,000 hours in Thailand, 1,260 for Indonesia, 761 for Malaysia and 987 hours and 1,182hoursforSriLankaandthePhilippinesrespectively(UNESCO,2006).SeealsoUNESCO,2008.
VKB041-1 283324_B85_BW v5.indd 173 10-10-11 09:55

Trends in quality
| 174 |
There is, however, a clear positive association between the number school management committee meetings and learning in the school. This finding suggests that schools that perform well are able to mobilize support from parents and, vice versa, that school commit-tees may indeed influence school performance: e.g. by making sure the teacher is present and in time, by visiting schools to see what is happening in the classroom and by generating financial support to employ additional teachers or pay for school inputs or school events.
7.6 Summary
Drawing on a series of school visits, this chapter concludes that, in comparison with the start of the new Millennium, there has been a positive change in the teaching environment at school level. More teaching resources appear available other than the textbooks provided by the Government. To a certain extent, these are also used. The evaluation also finds that teachers’ attitudes towards the students had improved at GPS and RNGPS, with most teachers maintaining good relationships with the children, praising them when responding correctly, and helping them when they do not understand. There is also more emphasis on children’s engagement in the lesson. BRAC schools stand out in this respect.
At the same time, and this applies to all school types, there has been little change in the traditional teacher-centred approach and the focus on memorisation of the textbooks. This approach appears reinforced by current teacher training practices, the way in which assessment and examinations are held, an overloaded and theoretical curriculum and high student teacher ratios, particularly at GPS. In terms of end-of-primary school examina-tions, the chapter highlights the comparatively good performance of non-formal (including BRAC) schools and the GPS and the higher scores of boys than girls. It also identifies positive aspects of the introduction of the examination in terms of e.g. putting non-formal schools on an equal footing with government supported schools, enhanced teacher supervision and the introduction of coaching classes. More critical consequences include an increased repetition rate in Grades III and IV and a further increase of private tutoring, the costs of which risks to increase inequities in educational opportunities and performance between the rich and the poor.
Since the first national end of primary school examination was held in 2009, the results could not be compared with earlier years. It was also not possible to use other tests, including the secondary school scholarship tests, in which only a minority of Grade V children participated, and the tests carried out by Government in 2002 and 2008, using different sets of questions. The evaluation therefore used the assessments conducted by CAMPE in 2000 and 2008. These tests indicate an improvement in learning outcomes, with students from GPS outperforming those from both registered and non-registered non-governmental primary schools. They also show that children at non-formal schools (such as BRAC) improved their scores and performed better than those enrolled at the GPS on both mathematics and Bangla. Students from madrasahs, which are outside PEDP-II, scored lowest on the tests, a worrying finding in view of the increase in student population observed in recent years.
VKB041-1 283324_B85_BW v5.indd 174 10-10-11 09:55
The two-pronged approach: Evaluation of Netherlands support to primary education in Bangladesh
| 175 |
Using the CAMPE data for 2008, a regression analysis was carried out to answer the ques-tion: what are the important determinants that help to explain the observed changes in learning? The regression shows that there are clear correlations between the student background characteristics and the test score of the student: boys score better than girls and parent education has a strong positive influence on performance. Contrary to find-ings reported elsewhere household wealth seems to have an ambiguous influence on the learning results. Turning to school types, the regression confirms the findings from the learning assessment. Taking differences in student and school characteristics into account, RNGPS schools score substantially below GPS schools and non-formal schools, which include the BRAC schools, excel. Unexpectedly, there are no significant correlations between test scores and facilities of the school or teacher characteristics. This might be attributed to the low contact hours in the vast majority of primary schools – with close to 80% still operating in two shifts. At the same time, a significant positive effect is found of private tutoring. There is furthermore a clear positive association between the number of SMC meetings and learning in the school. Overall, the regression analysis confirms previous findings but remains somewhat inconclusive with regard to the determinants of the improvements in learning.
VKB041-1 283324_B85_BW v5.indd 175 10-10-11 09:55

| 176 |
Annexes
Annex 1: About IOBObjectivesThe objective of the Policy and Operations Evaluation Department (IOB) is to increase insight into the implementation and effects of Dutch foreign policy. IOB meets the need for independent evaluation of policy and operations in all policy fields falling under the Homogenous Budget for International Cooperation (HGIS). IOB also advises on the plan-ning and implementation of the evaluations for which policy departments and embassies are responsible. Its evaluations enable the Minister of Foreign Affairs and the Minister for Development Cooperation to account to parliament for policy and the allocation of resources. In addition, the evaluations aim to derive lessons for the future.
Efforts are accordingly made to incorporate the findings of evaluations into the Ministry of Foreign Affairs’ policy cycle. Evaluation reports are used to provide targeted feedback, with a view to improving both policy intentions and implementation. Insight into the outcome of implemented policy allows policymakers to devise measures that are more effective and focused.
Approach and methodologyIOB has a staff of experienced evaluators and its own budget. When carrying out evalu-ations, it calls on the assistance of external experts with specialised knowledge of the topic under investigation. To monitor its own quality, it sets up a reference group for each evaluation, which includes not only external experts but also interested parties from within the Ministry.
ProgrammeThe evaluation programme of IOB is part of the programmed evaluations annexe of the explanatory memorandum to the budget of the Ministry of Foreign Affairs.
An organisation in developmentSince IOB’s establishment in 1977, major shifts have taken place in its approach, areas of focus and responsibilities. In its early years, its activities took the form of separate project evaluations for the Minister for Development Cooperation. Around 1985, evaluations became more comprehensive, taking in sectors, themes and countries. Moreover, IOB’s reports were submitted to parliament, thus entering the public domain.
1996 saw a review of foreign policy and a reorganisation of the Ministry of Foreign Affairs. As a result, IOB’s mandate was extended to the Dutch government’s entire foreign policy. In recent years, it has extended its partnerships with similar departments in other countries, for instance through joint evaluations.
Finally, IOB also aims to expand its methodological repertoire. This includes greater emphasis on statistical methods of impact evaluation. As of 2007, IOB undertakes policy reviews as a type of evaluation.
VKB041-1 283324_B85_BW v5.indd 176 10-10-11 09:55

The two-pronged approach: Evaluation of Netherlands support to primary education in Bangladesh
| 177 |
Annex 2: Terms of ReferenceIntroductionThe Policy and Operations Evaluation Department of the Ministry of Foreign Affairs of the Netherlands (IOB)175 is responsible for a policy review of Netherlands support to basic education by 2011.176 For this review, IOB will draw on several country evaluations, including the impact evaluations of primary education conducted in Uganda and Zambia.177 These terms of reference (ToR), informed by an inception visit to Bangladesh in March 2010, describe the objective, scope, methodology and organisation for the Bangladesh country evaluation.
ObjectiveIn line with the broader policy review, the objective is to evaluate the relevance, effective-ness, efficiency and sustainability of the Netherlands support to the basic education sector in Bangladesh.
ScopeThe country evaluation concentrates on bilateral cooperation and covers the period 1999-2009. It will not follow the Netherlands Euro but will consider Netherlands support amidst the support of other donors and the inputs provided by the Government. While in the policy review basic education is defined as primary education and first stage secondary education for children and youth,178 the evaluation will focus on formal and non-formal primary education comprising Grades I to V and aimed at 6-10 year old children. Primary educa-tion has been supported through the Second Primary Education Development Programme (PEDP-II) and the BRAC education programmes which together account for some 90% of the Netherlands education support to Bangladesh during the evaluation period. Support was also provided to NGOs active in the education sector, i.e. CAMPE and Friends in Village Development Bangladesh (FIVDB), ILO and the BRAC University Institute for Educational Development (BU-IED).
Evaluation questionsThe questions that form the structure of the evaluation are based on the Netherlands policy on basic education and are organised according to the standard OECD/DAC evaluation criteria of relevance, efficiency, effectiveness and sustainability.
Context• What are the main characteristics of the formal and non-formal primary education
system in Bangladesh (national policies, priority interventions and activities, objectives,
175 Policy and Operations Evaluation Department (IOB), www.minbuza.nl/iob-en.176 For more information, see IOB (2009), Terms of Reference Policy evaluation: Dutch policy on basic
education and development cooperation.177 Uganda: IOB (2008), Impact Evaluation: Primary Education in Uganda, IOB Evaluation no. 311; and
Zambia: IOB (2008), Impact Evaluation: Primary Education in Zambia, IOB Evaluation no. 312. 178 UNESCO ISCED definition, http://www.unesco.org/education/information/nfsunesco/doc/isced_1997.
htm.
VKB041-1 283324_B85_BW v5.indd 177 10-10-11 09:55
| 178 |
Annexes
targets and key indicators, institutional and organisational set-up, decentralisation processes, private sector and civil society engagement, involvement and cooperation of donors, etc.)?
• What are the main characteristics in terms of education financing and costs in the period 1999-2009?
• What are the main characteristics of education sector management and governance at different levels of the system?
• What have been main developments in formal and non-formal primary education in the period 1999-2009 (geographical distribution, advantaged /disadvantaged Upazilas and districts) in terms of (a) school infrastructure (schools, classrooms, water and sanita-tion, school resources), (b) teaching materials and pedagogy (class periods, language of instruction, etc.) and (c) teachers (responsibilities, educational background, in-service and pre-service teacher training, etc.)
Policy relevance of Netherlands support to basic education in Bangladesh• What has been the portfolio of NL education sector support in Bangladesh between 1999
and 2009? What have been the main instruments and modalities for this support and what factors explain the evolution of this portfolio?
• What has been the role of the Netherlands embassy and the Education and Research Division (DSO/OO) of the Netherlands Ministry of Foreign Affairs in this respect?
• What have been the core themes emphasized by the Netherlands and how were these emphasized, monitored, etc.?
• What have been the activities of Bangladeshi NGOs, other than BRAC, and international organisations that have been receiving direct funding and what results have they accom-plished? This will focus on the following organisations: CAMPE, BUIED, FIVDB and ILO.
• To what extent are the objectives of NL support to formal and non-formal primary educa-tion in line with those of the national education sector policy (as reflected primarily through PEDP-II) and BRAC (BEP)?
Effectiveness• Access and attainment: (i) What have been the changes in terms of access to primary
education? Are more children going to primary school? Who are they, where are they going and why are they going there? (ii) What specific initiatives were taken to support children from poor families and working children to access primary education and were these effective? (iii) What have been the changes in repetition, attendance, survival, drop out and completion rates?
• Quality and relevance of basic education: (i) What have been the results of initiatives taken in terms of teacher training, classroom practices, curriculum development, devel-opment of teaching and learning materials? What have been the changes in learning achievements in schools as measured by learning assessments in the period 2000-2009? To what extent are expected competencies effectively reached by the end of primary school and how relevant are these within the Bangladeshi context? (ii) What have been the changes in terms of demand for and access to lower secondary education? (iii) Are innovations in the delivery of primary education spilling over from public schools to BRAC schools and vice versa and if so, in what ways?
VKB041-1 283324_B85_BW v5.indd 178 10-10-11 09:55

The two-pronged approach: Evaluation of Netherlands support to primary education in Bangladesh
| 179 |
• Equal opportunities and (gender) equity: How do the above-mentioned changes vary by gender, Upazila/district, level of income, and type of school (GPS, RNGPS and BRAC)? Who is not enrolling in school?
• What are the main material and non-material determinants of these developments in primary education (individual/household, community, school characteristics)?
• Which education interventions were the most cost-effective in terms of realizing impact? What has been the role of the Netherlands in promoting these interventions?
Efficiency• What has been the actual process of introducing a sub-sector wide approach as well as
harmonisation and alignment in primary education and what role did the Netherlands play in this? Why did the Netherlands opt for this position and what aims did it pursue?
• What results have been accomplished in the area of harmonisation and alignment, what difficulties were encountered and how were these addressed?
• What has been the evolution of MoPME – NGO relationships in the provision of primary education over the period of 1999-2009 and what role did the Netherlands play in this area?
Sustainability• What are the institutional and financial capacity as well as commitment to education of
the public and non-governmental institutions that implemented PEDP-II and BEP? What is the institutional capacity at decentralised and school levels? Have increased invest-ments in school infrastructure, more (qualified) teachers, etc. been followed by increases in recurrent budgets to ensure continued operation and maintenance?
• To what extent did the Netherlands support contribute to the sustainability of the national education sector policies (e.g. investments in capacity building, support for decentralisation processes) and are exit-strategies related to withdrawal from support to primary education prepared?
Lessons:• Based on the findings, what lessons can be drawn that are relevant to policy and policy
implementation?
Research methodsThe evaluation will use a mixed method approach, combining qualitative and quantita-tive methodologies, using existing data sets. Qualitative research will feed into quantita-tive models; vice versa, the results of quantitative analysis will be analysed with the aid of qualitative research results. Underpinning the entire evaluation will be an in-depth review of documentation related to basic education in Bangladesh. Triangulation of data from interviews with findings from the field work, the quantitative analysis and the document review is intended to enable the evaluation team to reach robust conclusions.
Qualitative research will consist of (1) semi-structured, key informant interviews with stakeholders engaged in the education sector, primarily in Dhaka and (2) qualitative research in Bogra district in Rajshahi Division in northwest Bangladesh and Sunamganj
VKB041-1 283324_B85_BW v5.indd 179 10-10-11 09:55

| 180 |
Annexes
district in Sylhet Division in the north east, that will provide first-hand knowledge of the current situation in primary education in both urban and rural areas. The district studies will cover GPS, RNGPS and BRAC schools and will make it possible to assess changes over the evaluation period and how they impact on access to school and student learning. Various research tools will be used within the framework of these studies, including (i) semi-structured interviews with key informants (Government and NGO officials at District, Upazila and school level); (ii) Focus Group Discussions (FGDs) at (a) school level (teachers, children, SMC members, parents); (b) Upazila level ((A)UEOs); and (c) teacher training insti-tutes and (iii) classroom observations at schools and teacher training institutes.
As regards quantitative methods, the evaluation aims to identify net effects, i.e. the educational outcomes in basic education versus a counterfactual, and link those back to government policies supported by the Netherlands (attribution). At sector level, it is a chal-lenge to establish the so-called counterfactual for an evaluation, i.e. to identify what would have happened to education access and quality outcomes without or with different kinds of support. As such, understanding the relation between inputs and education outcomes is of crucial importance. This is not straightforward as achievements are dependent on a range of observable inputs179 + unobservable inputs180 + student characteristics.181 Moreover, a correlation between only observable inputs and outcomes would not be a good estimate of the impact of the intervention because of omitted variable bias as it would attribute too much to the observable inputs. Schools with high observable inputs will probably also have high unobservable inputs and good students and as a result have better outcomes.
Quantitative research will permit to reason backward and to:
• Determine what have been the trends in the primary education access and quality outcomes as defined above in the past 10 years in GPS and RNGPS and BRAC schools.
• Determine whether inputs, financed through PEDP-II and BEP, have had an impact on access and quality outcomes. This includes an analysis of whether observed changes in learning achievements can be attributed to changes in the inputs made available.
• Determine which inputs have been most important in raising the level of learning achievements, and which ones failed to cause the anticipated effect.
The reasoning behind the proposed quantitative approach is as follows: Netherlands financial support to the education sector in the period 1999-2009 has contributed to an expansion of the availability of inputs for primary education (school infrastructure, teachers, school management, teaching and learning materials) and the quality of these inputs. Improvement in the availability and quality of education inputs is expected to have resulted in improvements in indicators such as reduced pupil-classroom ratios, lower pupil-(qualified) teacher ratios, etc. which, in turn, may have contributed to higher rates of
179 I.e. such as number and quality of classrooms, availability of teachers, availability of textbooks.180 I.e. such as effort of the teacher, training teacher received, efforts of schools to involve parents in
the learning process181 I.e. such as education of mothers of students, poverty status of students.
VKB041-1 283324_B85_BW v5.indd 180 10-10-11 09:55

The two-pronged approach: Evaluation of Netherlands support to primary education in Bangladesh
| 181 |
enrolment, attendance, and completion rates and lower repetition and drop-out rates as well as improved learning achievements.
For access, the evaluation will use the administrative data from DPE collected through the Government monitoring system as well as the administrative data from BRAC. In addition, the analysis will be based on HIES and/or MICS data. For quality outcomes, the analysis will first of all be based on a comparison between schools included in the surveys for CAMPE’s Education Watch studies of 2000 and 2008. Data will also be used from the national assess-ments that were carried out by the consulting firm ADSL on behalf of MoPME in 2002 and 2008 for children in Grade V. These assessments will primarily be used for a trend analysis of learning outcomes; they will not be used to explain learning achievements with inputs. Unlike the CAMPE assessments, the ADSL assessment used different instruments which hampers a comparison. To overcome this we will collaborate with ADSL to conduct a small pilot in which the 2002 and 2008 tests are made by the same children. This will provide a comparison of the difficulty of the 2002 and 2008 assessments and will make it possible to make the two assessments comparable.
VKB041-1 283324_B85_BW v5.indd 181 10-10-11 09:55

| 182 |
Annexes
Annex 3: Netherlands support to education in Bangladesh, 1999-2009
Table A3.1 Financial support of Netherlands to the education sector in Bangladesh by year and programme
Project/Programme (in 000 Euro) Start End 1999 2000 2001 2002 2003 2004 2005 2006 2007 2008 2009 Total
BRAC/NFPE-II 1996 1999 79 27 0 0 0 0 0 0 0 0 0 106
BRAC/NFPE-III 1999 2006 0 7,260 3,686 3,176 1,815 0 0 0 0 0 0 15,937
BRAC Pre Primary Schools 2003 2006 0 0 0 0 2,703 143 0 0 0 0 0 2,846
BRAC, BEP phase I 2004 2009 0 0 0 0 0 3,000 6,000 10,432 12,787 14,500 9,562 56,281
BRAC University, IED I 2006 2010 0 0 0 0 0 0 0 149 185 134 23 491
BRAC University, IED II 2009 2015 0 515 515
BRAC, IOA Education Programme 2003 2004 0 0 0 0 40 0 0 0 0 0 0 40
Assessment PEDP 2001 2001 0 0 36 0 0 0 0 0 0 0 0 36
Preparation PEDP-II 2002 2004 0 0 0 124 22 0 0 0 0 0 0 146
PEDP-II 2004 2009 0 0 0 0 0 4,756 5,651 4,998 10,841 1,860 0 28,106
CAMPE II 2002 2004 0 0 0 24 0 0 0 0 0 0 0 24
CAMPE III 2002 2008 0 0 0 320 84 159 189 424 80 0 0 1,256
CAMPE IV 2007 2013 0 0 0 0 0 0 0 0 492 301 362 1,155
FIVDB Jonoshilon 2008 2014 0 0 0 0 0 0 0 0 2,100 1,736 3,836
ILOUIEI 2000 2005 0 0 1,979 682 1,122 658 355 0 0 4,796
ILOUIEBridging 2005 2007 0 0 0 0 0 0 644 0 0 0 0 644
ILOUIEII 2006 2011 0 0 0 0 0 0 0 995 435 599 510 2,539
Education Programme Support Fund 2006 2011 0 0 0 0 0 0 0 0 44 43 5 92
Other 1999 2009 0 0 58 3 0 0 0 0 0 0 0 61
Total 1999 2009 79 7,287 5,759 4,329 5,786 8,716 12,839 16,998 24,864 19,537 12,713 118,907
VKB041-1 283324_B85_BW v5.indd 182 10-10-11 09:55
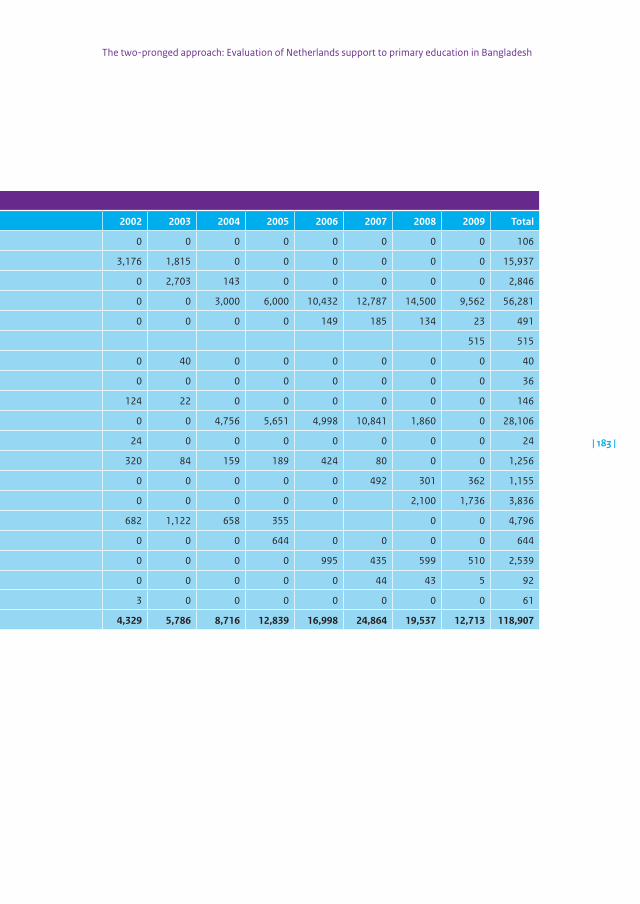
The two-pronged approach: Evaluation of Netherlands support to primary education in Bangladesh
| 183 |
Annex 3: Netherlands support to education in Bangladesh, 1999-2009
Table A3.1 Financial support of Netherlands to the education sector in Bangladesh by year and programme
Project/Programme (in 000 Euro) Start End 1999 2000 2001 2002 2003 2004 2005 2006 2007 2008 2009 Total
BRAC/NFPE-II 1996 1999 79 27 0 0 0 0 0 0 0 0 0 106
BRAC/NFPE-III 1999 2006 0 7,260 3,686 3,176 1,815 0 0 0 0 0 0 15,937
BRAC Pre Primary Schools 2003 2006 0 0 0 0 2,703 143 0 0 0 0 0 2,846
BRAC, BEP phase I 2004 2009 0 0 0 0 0 3,000 6,000 10,432 12,787 14,500 9,562 56,281
BRAC University, IED I 2006 2010 0 0 0 0 0 0 0 149 185 134 23 491
BRAC University, IED II 2009 2015 0 515 515
BRAC, IOA Education Programme 2003 2004 0 0 0 0 40 0 0 0 0 0 0 40
Assessment PEDP 2001 2001 0 0 36 0 0 0 0 0 0 0 0 36
Preparation PEDP-II 2002 2004 0 0 0 124 22 0 0 0 0 0 0 146
PEDP-II 2004 2009 0 0 0 0 0 4,756 5,651 4,998 10,841 1,860 0 28,106
CAMPE II 2002 2004 0 0 0 24 0 0 0 0 0 0 0 24
CAMPE III 2002 2008 0 0 0 320 84 159 189 424 80 0 0 1,256
CAMPE IV 2007 2013 0 0 0 0 0 0 0 0 492 301 362 1,155
FIVDB Jonoshilon 2008 2014 0 0 0 0 0 0 0 0 2,100 1,736 3,836
ILOUIEI 2000 2005 0 0 1,979 682 1,122 658 355 0 0 4,796
ILOUIEBridging 2005 2007 0 0 0 0 0 0 644 0 0 0 0 644
ILOUIEII 2006 2011 0 0 0 0 0 0 0 995 435 599 510 2,539
Education Programme Support Fund 2006 2011 0 0 0 0 0 0 0 0 44 43 5 92
Other 1999 2009 0 0 58 3 0 0 0 0 0 0 0 61
Total 1999 2009 79 7,287 5,759 4,329 5,786 8,716 12,839 16,998 24,864 19,537 12,713 118,907
VKB041-1 283324_B85_BW v5.indd 183 10-10-11 09:55

| 184 |
Annexes
Annex 4: Other education programmes supported by the NetherlandsThis annex describes other programmes that have been supported by the Netherlands on a smaller scale. Over the period 1999-2009, these programmes accounted for 13% of the total Netherlands support for the education sector in Bangladesh.
ILO Urban Informal Economy project – phase 1 and 2 To address the problem of child labour, support has been provided by the Netherlands for the first and second phase of the Urban Informal Economy project that has been carried out by the International Labour Organisation’s (ILO) International Programme on the Elimination of Child Labour (IPEC) since 2000. The Netherlands was the only donor with a contribution of some € 15 million for the period 2000-2011. Phase 1 (UIE-1) was the first major project in Bangladesh to address hazardous child labour in the urban informal economy. It aimed to ‘contribute to the elimination and prevention of the WFCL in the urban informal economy (UIE) of Bangladesh’. In 2000, the Ministers for Development Cooperation and Social Affairs and Employment from the Netherlands personally indicated that UIE-I had to be supported (EKN, 2000).
The project targeted children in Dhaka city between 5 and 18 years that were engaged in hazardous work. It aimed to physically identify the children at risk, to gradually remove them from their hazardous workplaces and refer them to protection and rehabilitation services where they are provided with educational alternatives appropriate to their age, experience and aspirations (ILO, 2008a). The project initially focussed on testing strategies and models for validity and cost-effectiveness. In terms of approach, the project envisaged the establishment of 84 Multi-Purpose Centres (MPCs) and 2 Vocational Training Centres (VTCs). These centres would organise non-formal education, act as focal points for commu-nity mobilization and provide supplementary services such as basic health care. They were to be operated by a number of sub-contracted NGOs.
The evaluation of UIE-I (2006) strongly recommended to have a smooth transition to the second phase and stressed that ‘government institutions needed to be involved in main-stream service provision in order to develop a more sustainable approach.’ In line with this recommendation, Dhaka City Corporation (DCC) was identified as the most appropriate (local) Government stakeholder. One reason was that since DCC provides trade licences to informal businesses for tax purposes it can put formal pressure on employers engaging in WFCL by threatening to withhold their licence. The UIE-II Programme (ILO, 2008b) identi-fied the following objectives for DCC: (i) Development and implementation of regula-tory and monitoring mechanisms to address WFCL; (ii) Execution of NFE, SDT and SEE programmes through contractual arrangements with NGOs; (iii) Social mobilization and advocacy and awareness raising activities; and (iv) Strengthening conditions for sustain-ability of the project by developing a Sustainability Plan.
VKB041-1 283324_B85_BW v5.indd 184 10-10-11 09:55
The two-pronged approach: Evaluation of Netherlands support to primary education in Bangladesh
| 185 |
Though timing and funding constraints were overcome to prevent disruption of service delivery via an extension and bridging phase for UIE-I, commencement of the second phase of the project faced considerable delay. Service delivery to beneficiaries came to a standstill between March 2007-November 2009 and by July 2010 the Programme was still imple-mented in a semi-authorised condition. As a result, the MPCs that were set up during the first phase had to be dismantled and an important outlet for advocacy and awareness raising was lost. This has had immediate repercussions for the number of beneficiaries the project was able to service.
The delay can be attributed to protracted negotiations between ILO, DCC and MoLE on their respective financial and technical responsibilities and selection of partner NGOs coupled with a prescriptive, rather expert driven and unnecessary complex design of the project. In terms of reasons for the delay, the Follow-Up review (Jeddere-Fisher, 2010) of the Independent Mid-term Evaluation concluded that ‘throughout the process the issue has never been the project strategies or objectives but the implementation modality and accountability’. This was confirmed by interviewees.
In relation to sustainability of the project it has been noted that the current action programmes are financially heavily dependent on UIE-II. Subsequently, it was advised that any further phases of support to DCC and CLU institutions should be dependent on increased levels of financial contribution from them or their ministries. In July 2010, DCC was still at an early stage with regard to developing a Sustainability Plan, which would include a cost-sharing plan for future interventions. However, DCC had been more active in revising its regulation to incorporate the possibility to withhold trade licenses if employers engaged in WFCL. A draft plan was formulated and sent for legal review and enforcement. DCC expected to start implementing its proposed regulatory revisions before the end of August 2010.
The Netherlands embassy has closely monitored the programme and regularly conveyed its concerns regarding the delay of UIE-II to the ILO and MoLE. It was noted in the embassy’s 2008 education sector track record that ‘if no substantial improvements would be recorded, discontinuation of the activity would be seriously considered’. The 2009 annual report further noted that the ‘ILO project on the prevention and elimination of the worst forms of child labour has started supporting field-level interventions in Dhaka through the DCC. Progress thus far, however, is still behind schedule and original targets will not be achieved. Focus in 2010-2011 will be on monitoring results and capacity building of the DCC’ (EKN, 2009). A second review, scheduled for the beginning of 2011, will form the basis to decide upon a possible (no-cost) extension of the programme.
FIVDB – Jonoshilon Programme Friends in Village Development Bangladesh (FIVDB) is a non-governmental organisa-tion, based in the north-eastern district of Sylhet (Bangladesh), that has been working for the development of disadvantaged communities since 1981. The Netherlands supports
VKB041-1 283324_B85_BW v5.indd 185 10-10-11 09:55

| 186 |
Annexes
FIVDB’s Jonoshilon182 Programme with € 36.5 million for the period 2008-2013 ‘to empower communities by enhancing access to and completion of education and reduce poverty by enhancing economic activities in disadvantaged communities of Bangladesh’ (FIVDB, 2008). The Programme focuses on hard-to-reach rural and peri-urban communi-ties in isolated parts of Northern Bangladesh. The Netherlands contribution equals 83% of total programme costs, the remainder is financed by FIVDB (2%), local communities (15%) donating land and labour for school construction, while textbooks are financed by the Government.
The main activities are: (i) Primary education component: Assisting communities to construct, staff and maintain a primary school from pre-school (1 year) through to Grade V that uses the Government curriculum coupled with FIVDB’s active learning methods and moves towards registration as an RNGPS; and (ii) Community education component: Establishing Community Learning Centres (CLC) run by community members, providing library facilities and livelihood-oriented literacy and lifelong learning classes for adoles-cents and adults. The per child cost of FIVDB schools is Taka 2,918 per year which is the equivalent of € 28.3.
Jonoshilon builds upon a previous programme funded by DFID183 but envisages a substan-tial up scaling of services. The Netherlands support is provided for an expansion of the FIVDB school network from 112 schools for 204 villages to 512 schools covering 850 villages catering for some 56,450 children (of which at least 50% girls) by 2013 (up from some 15,700 in 2008). Unlike other NFE providers in Bangladesh, primary education is provided in permanent school facilities (including three classrooms, one teachers’ room and a resource room as well as two toilets and a tube-well). With a total of close to 1,200 teachers in 2013, identified from within the community and trained by FIVDB, the teacher-student ratio is 1:30, with each teacher teaching both a morning and an afternoon shift. FIVDB follows a child-centred Active Learning (AL) teaching approach and developed AL-based curriculum and teaching-learning materials that can be used alongside government NCTB textbooks. A certain degree of flexibility is incorporated into the school calendar which permits adjusting the teaching periods to the occurrence of local events, festivals, harvest periods, monsoons and flooding.
FIVDB’s long term plan is to support communities in formally registering their schools as RNGPS to be eligible for government financial support for teacher salaries, school mainte-nance, etc. The organisation envisions a primary education scenario where communities are responsible for governance, resource mobilization and planning; the Government provides funding and monitors quality of learning; and FIVDB provides technical assistance, training and academic supervision. However, it is confronted with inflexible school registra-tion requirements in terms of minimum teacher qualifications, amount of land and school operating time that are difficult to change.
182 Meaning ‘popular education’ in Bangla.183 DFIDfundedtheActiveLearningCoreProject(ALCP),whichranfromJune1999toJuly2008.
VKB041-1 283324_B85_BW v5.indd 186 10-10-11 09:55

The two-pronged approach: Evaluation of Netherlands support to primary education in Bangladesh
| 187 |
Netherlands support is also furnished for the establishment and/or refurbishing of 850 CLCs and finances the provision of books as well as the training of librarians and CLC manage-ment. These CLCs will function as a basis for the organisation of functional literacy classes for adolescents (17,200 participants) and adults (87,400) and of post literacy training for adults (34,200) and lifelong learning activities (124,900). Funding is also foreseen for equipping small ICT centres, IT facilitator training and the introduction of ICT in Grade V of primary education. It is envisaged that these centres will reach close to 8,000 youngsters.
At the request of the Netherlands embassy, a system audit was performed in December 2009 by KMPG_RRH to assess the administrative organisation and internal control of the Jonoshilon programme. With some exceptions, the audit indicated that the compliance, administrative and control systems and performance at the area and sub-area offices, schools and CLCs were satisfactory. The Programme was, however, characterised by under-spending, primarily as a result of: (i) delays in obtaining NGO Affairs Bureau approval and in finding appropriate staff for various positions; and (ii) delays related to the geographical extension of the programme implying a move to work in unexpectedly difficult areas with extreme shortages of land. It is expected that the budget utilisation rate will pick up in 2010.
BU-IED – phase 1 and 2The first project with the Institute of Education Development of BRAC University (BU-IED) was co-financed by the Netherlands with Swiss Development Cooperation (SDC) and Norway, each with a contribution of some € 578.3 thousand. The project was approved for a period of 2 years (March 2006-February 2008), extended to 31 August 2008 (BU-IED, 2008). According to the Netherlands embassy there is a role for BU-IED as it ‘combines policy and capacity development, through research and the development of academic training programmes, with more practical work in the development of learning packages and teacher training models’. Moreover, ‘BU-IED can play an important role in bridging the gap between formal and non-formal education.’ (EKN, 2006b; EKN, 2006c). The relevance of support to BU-IED was reconfirmed by the external review that was conducted in January 2008 highlighting the ‘need for local research capacity which will be capable of producing evidence-based research results and advice and of local training opportunities for personnel working in the education sector’ (EKN, 2008).
The overall objective of the BU-IED project is to improve the quality of primary and basic education of Bangladesh. This will be done through the improvement of teachers’ and learner’s methods and materials, professional staff development to train public primary education support providers like NAPE, PTI and selected head of institutions and teachers, in addition to research, policy studies, and advocacy in education’. The areas in which the project operated and the results accomplished are (EKN, 2006c):• Research, Policy Studies, and Advocacy in education: Identifies problems and gaps in
the education sector policies. The dissemination of findings will inform policy makers to develop and/or reform policies for quality education and inform the general mass on issues pertaining to education. The research group will also play an important role in monitoring progress of field-based activities’. BU-IED is ‘lead implementor of CAMPE’s Education Watch research project, which is the education watchdog of Bangladesh’.
VKB041-1 283324_B85_BW v5.indd 187 10-10-11 09:55

| 188 |
Annexes
• Development and trials for learning materials for primary Grades I to III for Bangla and mathematics; and science, mathematics, and English in Grade VI to VIII at the secondary level. The Learning Packages for the primary and secondary grades include the development of cost-effective and subject based curriculum which will be piloted in 30 ‘Laboratory Schools’.
• Professional staff development through short and advanced courses in collaboration with recognized international university and also through on-the-job training.
• Development and trial of curriculum and module for a pilot Certificate in Education (for primary school teachers).
• Lifelong Learning Initiatives to initiate community learning centres with partner organi-sations and to develop models of NFE activities based on relevant national and interna-tional experience.
The Netherlands decided to continue support to BU-IED in view of the Institute’s cred-ibility, strategic position in the Bangladeshi education landscape and the role it continued to play in the policy discussion on formal and non-formal primary and basic education (EKN, 2009). In February 2009 BRAC was informed about the Netherlands contribution of Taka 504.250.600 for the ‘Educational Research, Training and Advocacy’ (ERTA) project for the period 2009-2014, this time only together with SDC. Objectives of the project are: Strengthen the knowledge base for effective approaches to improve teaching and learning through strategy development and action research. BU-IED II envisages contributing ‘to quality improvement and equity in primary and secondary education through its packages of teaching, training and learning materials’ (BU-IED, p. 6).
CAMPEIn the period 2002-2013, the Netherlands contributed to CAMPE funding with a total budget of some € 3.5 million. Support was given for phases II (2002-2004), III (2002-2008) and IV (2007-2013). Oxfam Novib and SDC are also funding phase IV. According to the Netherlands embassy, the support of CAMPE fits in its strategy to enhance cooperation between the government and NGO’s and its choice to focus on both formal and non-formal education (EKN, 2007).
Established in 1991 as an NGO forum to network in the area of literacy and non-formal education in Bangladesh, CAMPE has emerged as a strong network of more than 222 NGOs and 1,100 partners working in the basic education sector in Bangladesh. A major strand running through CAMPE’s work is the importance of strengthening both NGO-NGO and NGO-Government relations to address EFA in a concerted manner. According to its mission statement, CAMPE aims to: ‘advocate and lobby for sustainable and pro-poor policy framework and effective program interventions for ensuring qualitative improvements in the overall education system by forming networks with organisations having similar vision towards achieving the goal of EFA both nationally and globally’ (CAMPE, 2007).
The two main roles of CAMPE are: (i) managing its network of member NGOs, and; (ii) policy advocacy among all stakeholders in the education system. As a result of its extensive grassroots network CAMPE is considered as one of the most important representative of
VKB041-1 283324_B85_BW v5.indd 188 10-10-11 09:55
The two-pronged approach: Evaluation of Netherlands support to primary education in Bangladesh
| 189 |
civil society in the field of education (CAMPE, 2009a). CAMPE operates its activities through four major functional programme units, namely:
• The Policy, Advocacy and Mass Communication (PAMC) Unit which organises confer-ences, seminars, debates, roundtable dialogues, meetings and discussions on policy issues regarding literacy and education.
• The Institutional Development and Continuing Education (IDCE) Unit which focuses on the facilitation of training programmes and institutional development support to strengthen the capacity of grassroots NGOs on literacy programme management, literacy trainers’ training, teaching learning process, early childhood education, etc.
• The Research, Monitoring, Evaluation and Documentation (RMED) Unit which under-takes policy research in collaboration with other organisations at the national and inter-national level. One of its most lauded achievements is the production of the Education Watch Reports.
• The Management and EFA Capacity Building Unit which focuses on strengthening the management of CAMPE and giving support to partner NGOs
The above mentioned Education Watch reports are an important tool in providing the evidence-base for CAMPE’s advocacy activities. They are regarded to be of good quality and the data collected is used in various evaluations, including this study. CAMPE is now providing assistance to replicate the Education Watch in several other countries in the region. In addition Community Watch Groups are being piloted, which aims to map education related issues at the local level (CAMPE, 2009). CAMPE has been successful in influencing government policy as is also mentioned in chapter 3 of the report.
Education Programme Support FundThe Fund was set up in April 2006 with a budget of € 450,000 for a period of 5 years to finance (short-term) assignments and missions, such as assessments, monitoring and review missions can be financed that aim at ‘ensuring effective preparation, implementa-tion, monitoring and evaluation of programmes in the education sector in Bangladesh supported by EKN’ (EPSF, 2006). Over the years, available resources were used for: (i) partici-pation MoPME staff in the IIEP summer school ‘Transparency, accountability, and anti-corruption measures in education’ in 2007; (ii) consultants for an external evaluation of CAMPE in 2006; (iii) a consultant to participate in mid-term review of PEDP-II on resource utilisation in November 2006; (iv) a consultant for the external evaluation of BU-IED in January 2008 and review cum appraisal of BEP-IV in April 2008, and; (v) a consultant for an institutional assessment of FIVDB in 2009.
VKB041-1 283324_B85_BW v5.indd 189 10-10-11 09:55
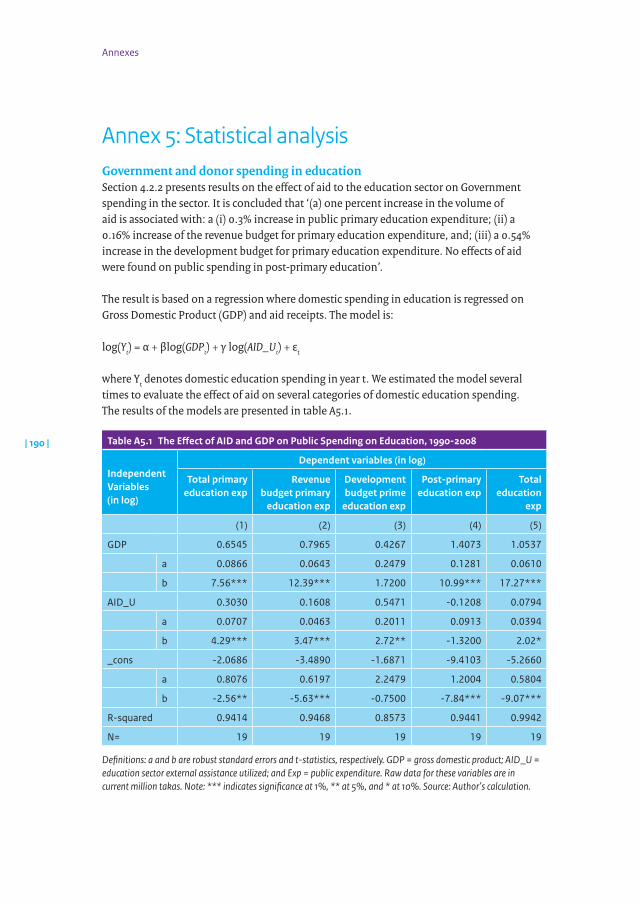
| 190 |
Annexes
Annex 5: Statistical analysisGovernment and donor spending in educationSection 4.2.2 presents results on the effect of aid to the education sector on Government spending in the sector. It is concluded that ‘(a) one percent increase in the volume of aid is associated with: a (i) 0.3% increase in public primary education expenditure; (ii) a 0.16% increase of the revenue budget for primary education expenditure, and; (iii) a 0.54% increase in the development budget for primary education expenditure. No effects of aid were found on public spending in post-primary education’.
The result is based on a regression where domestic spending in education is regressed on Gross Domestic Product (GDP) and aid receipts. The model is:
log(Yt) = α + βlog(GDPt) + γ log(AID_Ut) + εt
where Yt denotes domestic education spending in year t. We estimated the model several times to evaluate the effect of aid on several categories of domestic education spending. The results of the models are presented in table A5.1.
Table A5.1 The Effect of AID and GDP on Public Spending on Education, 19902008
Independent Variables (in log)
Dependent variables (in log)
Total primary education exp
Revenue budget primary
education exp
Development budget prime
education exp
Postprimary education exp
Total education
exp
(1) (2) (3) (4) (5)
GDP 0.6545 0.7965 0.4267 1.4073 1.0537
a 0.0866 0.0643 0.2479 0.1281 0.0610
b 7.56*** 12.39*** 1.7200 10.99*** 17.27***
AID_U 0.3030 0.1608 0.5471 -0.1208 0.0794
a 0.0707 0.0463 0.2011 0.0913 0.0394
b 4.29*** 3.47*** 2.72** -1.3200 2.02*
_cons -2.0686 -3.4890 -1.6871 -9.4103 -5.2660
a 0.8076 0.6197 2.2479 1.2004 0.5804
b -2.56** -5.63*** -0.7500 -7.84*** -9.07***
R-squared 0.9414 0.9468 0.8573 0.9441 0.9942
N= 19 19 19 19 19
Definitions: a and b are robust standard errors and t-statistics, respectively. GDP = gross domestic product; AID_U = education sector external assistance utilized; and Exp = public expenditure. Raw data for these variables are in current million takas. Note: *** indicates significance at 1%, ** at 5%, and * at 10%. Source: Author’s calculation.
VKB041-1 283324_B85_BW v5.indd 190 10-10-11 09:55
The two-pronged approach: Evaluation of Netherlands support to primary education in Bangladesh
| 191 |
GDP refers to Gross Domestic Product which is taken from World Development Indicators (WDI), an online World Bank database. The data on various types of education expendi-tures are from Rahman, A., M. Kabir, and M. Alam (2005), ‘Public Expenditure in Primary Education in Bangladesh: An Analysis’ for 1990-2004, while those for 2005 onwards are from WDI (Rahman et al and WDI’s series for 1990-2003 are comparable) and from various budget documents of the Economic Relations Division of the Ministry of Finance of Bangladesh.AID_U refers to external assistance to the education sector as a whole, which unfortunately was not broken down by level of education. AID_U includes financial aid for religious activi-ties, although it constitutes a relatively small portion of AID_U. External assistance data came from the recent report, Flow of External Resources into Bangladesh (ERD, 2010).
Because all the variables in the model are in logarithms, the coefficients can be inter-preted as elasticities. An elasticity is the ratio of the percentage change in one variable (aid) to the percentage change in another variable (domestic spending on education). For example the 0.3% quoted above stems from the estimated coefficient on AID_U in the first column (0.3030).
VKB041-1 283324_B85_BW v5.indd 191 10-10-11 09:55
| 192 |
Annexes
Regression analysis learning achievements
Table A5.2 Regression analysis learning achievements 2008
All school types only boys only girls
Student and household characteristics
Student is male 2.027*** n.a. n.a.
(1=yes, 0=no) (0.687) n.a. n.a.
age -0.110 -0.106 -0.090
(0.076) (0.168) (0.084)
Years education mother 0.769*** 0.868*** 0.671***
(0.131) (0.186) (0.162)
Years education father 0.623*** 0.563*** 0.670***
(0.111) (0.150) (0.138)
Household is always in deficit 2.113* 2.524* 1.605
(1=yes, 0= breakeven) (1.099) (1.507) (1.388)
Household is sometimes in deficit 0.672 1.178 0.112
(1=yes, 0=breakeven) (0.788) (1.054) (1.018)
Household is always in surplus 1.368* 1.479 1.235
(1=yes, 0=breakeven) (0.794) (1.069) (1.021)
Household has electricity 1.036 -0.070 2.164*
(1=yes, 0=no) (1.044) (1.273) (1.233)
Months of tutoring student receives 0.907*** 0.875*** 0.906***
(0.116) (0.153) (0.136)
The child has access to TV 1.534 1.659 1.426
(1=yes, 0=no) (0.939) (1.264) (1.091)
School characteristics
The school is located in an urban area 1.637 0.340 2.668
(1=yes, 0=no) (1.527) (1.686) (1.697)
The school is a RNGPS -2.555 -2.520 -2.205
(1=yes, 0=GPS) (2.234) (2.369) (2.697)
The school is a formal Madrasah -7.639* 12.576*** -2.266
(1=yes, 0=GPS) (3.925) (3.761) (4.984)
The school is non-formal 11.075** 4.929 16.389***
(1=yes, 0=GPS) (4.612) (4.760) (5.663)
The school is attached to a secondary school 0.454 -2.122 3.274
(1=yes, 0=GPS) (2.677) (3.007) (3.197)
VKB041-1 283324_B85_BW v5.indd 192 10-10-11 09:55

The two-pronged approach: Evaluation of Netherlands support to primary education in Bangladesh
| 193 |
All school types only boys only girls
The school is attached to a high Madrasah -3.735 -5.665 -1.034
(1=yes, 0=GPS) (4.066) (4.347) (4.950)
Number of students in the school 0.023*** 0.019** 0.028***
(0.007) (0.008) (0.008)
Number of students is missing 12.046** 12.130** 11.098
(5.905) (4.963) (9.391)
School facilities
The school has a toilet -4.207* -4.528 -3.794
(1=yes, 0=no) (2.410) (2.798) (2.658)
The school has safe water supply -0.880 -1.949 -0.201
(1=yes, 0=no) (1.865) (2.064) (2.328)
School has electricity -1.372 -0.701 -1.978
(1=yes, 0=no) (1.612) (1.743) (1.886)
% of classrooms with a blackboard 0.025 0.026 0.025
(0.021) (0.023) (0.023)
Teacher characteristics
% of female teachers -0.018 -0.015 -0.015
(0.031) (0.036) (0.032)
% of teachers with any professional training -0.024 0.005 -0.051
(0.031) (0.031) (0.041)
Average years of experience of teachers -0.065 -0.122 -0.018
(including head teacher) (0.105) (0.121) (0.120)
Teacher student ratio 68.455 61.036 71.992
(53.188) (56.824) (60.925)
Classroom teacher ratio 0.669 1.213 -0.008
(2.209) (2.338) (2.694)
School – community interaction
Number of SMC meetings in the past year 0.508** 0.226 0.798***
(0.205) (0.222) (0.238)
Constant term 35.151*** 42.424*** 29.980***
(6.066) (7.047) (6.750)
Number of observations 5,748 2,686 3,062
R-square 0.240 0.207 0.276
* = significant at p<0.1; ** = significant at p < 0.05 and *** = significant at p < 0.01. Source: Author’s calculations based on CAMPE assessment 2008.
VKB041-1 283324_B85_BW v5.indd 193 10-10-11 09:55

| 194 |
Annexes
Annex 6: IntervieweesMinistry / Organisation Name Designation
ActionAid Bangladesh A. Sabri Social Development and Economic Justice
S. Rana Programme officer – Education
ADB A. Inagaki Manager, PEDP-II
T. Moenjak PLU,TeamLeader
ADSL G. Kabir Managing Director
AUSAID R. Payne First Secretary, Development cooperation
J. Jennings Regional Education Advisor
A. Chowdhury Senior Programme Manager
BFTA Q.Ahmed Secretary General
BEP S. Islam Director Education
M. Khandker Programme coordinator
BBS Z. Huq Project Director of HIES
BU-IED E. Mariam Director
M. Ahmed Senior Adviser
CAMPE R. Choudhury Executive Director
K. Hoque Programme Manager
Canadian High Commission J. Sebhatu First Secretary Development
DFID B. Payne First Secretary (Education)
Dhaka Ahsania Mission K. Sheikh Project Manager
Dhaka City Corporation A. Nayeem Coordinator DCC
A. Patwary Chief Slum Development Officer
DPE S. Ghosh Director General
Md. Fashiullah Deputy Director
A. Ahanda Director Monitoring
A. Sarker Director Training
K. Islam Director, Finance
M. Chowdhury Joint Project Director, PEDP-II
M. Islam Assistant Director, Assessment
EC A. Fricke Second secretary
L.Baquee Education advisor
EKN A. Hennekens Ambassador
T. Oltheten First Secretary (Education)
VKB041-1 283324_B85_BW v5.indd 194 10-10-11 09:55

The two-pronged approach: Evaluation of Netherlands support to primary education in Bangladesh
| 195 |
Ministry / Organisation Name Designation
FIVDB Z. Ahmed Executive Director
B. Razee Associate Director
ILOBangladesh S. Mar Chief Technical Adviser
A. Chowdhury Programme Officer
K. Mia Programme Officer
S. Khan Programme Officer
IGS – BRAC university G. Thampi Chief operating officer
F. Yasmin Project Assistant
Economic Relations Division Ministry of Finance
M. Bhuiyan Secretary
M. Akter Senior Assistant Secretary
MoPME A. Ameen Minister
M. Ahmed Joint Secretary
Z. Akanda Deputy Secretary
Nari Maitree S. Dolly Executive Director
F. Fakir Project Manager
Oxfam Novib L.v.Vliet Manager (Education and Health)
P. Hans Programme Officer
M. Verhoog Programme Officer
Plan Bangladesh P. Karim Director
SDC M. Rahman Programme Officer
SURCH M. Rahman Manager
UNICEF N. Dahal Head of Education Section
M. Khan PME, Knowledge Management Unit
WFP Z. Islam Food for Education
N. Choudhury Poverty Map
World Bank Bangladesh Z. Hussain Senior Economist
H. Craig Senior Education Specialist
VKB041-1 283324_B85_BW v5.indd 195 10-10-11 09:55
| 196 |
Annexes
Annex 7: ReferencesADB. (2000). Project performance audit report on the Primary Education Sector Project in Bangladesh.
Manila. November.ADB. (2003a). Special Evaluation Study on the Government and Nongovernment Provision of primary
education in Bangladesh, Indonesia and Nepal. January.ADB. (2003b). Report and recommendation of the President to the Board of Directors on a proposed loan
to the People’s Republic of Bangladesh for the Primary Education Development Programme. ADB. (2005). Project completion report. Second primary education sector project (Loan 1521-BAN(SF)) in
Bangladesh. Manila. JulyADB. (2006). Aide Memoire on JARM 2006.ADB. (2007). letter to MoPME of December 13th.ADB. (2008). Education Sector in Bangladesh: What Worked Well and Why Under the Sector-Wide
Approach?”. Asian Development Bank, Operations Evaluation Department.ADB. (2009). Fifth Joint Annual Review Mission, 14 May -1 June 2009, Revised Final Aide
Memoire 15 July 2009.ADB/PLU. (2008, August). Second Primary Education Development Program (PEDP-II) –
Summary Annual Progress Report for FY 2007-08 (1 July 2007-30 June 2008).ADB/PLU. (2010a). Second Primary Education Development Programme. Governance Report. Progress
of the proposed action plan. April.ADB/PLU. (2010b). Second Primary Education Development Program (PEDP-II). Annual Progress
Report for FY 2009-10 (1 July 2009- 31 March 2010). April. ADB/World Bank. (2002). Bangladesh Public Expenditure Review Summary, Background paper.
Bangladesh Development Forum, Paris, March 13-15.Aga Khan Foundation team. (2007). Non-State Providers and Public-Private-Community
Partnerships in Education. Paper commissioned for the EFA Global Monitoring Report 2008, Education for All by 2015: will we make it?
Ahmad, A. (2003). Inequality in the access to education and poverty in Bangladesh. 17 April. Ahmed, A. and Sharmeen., T. (2004). Assessing the performance of conditional cash transfer
programs for girls and boys in primary and secondary schools in Bangladesh. IFPRI, Washington.Ahmed, M. et al. (2007). Access to Education in Bangladesh; Country analytical review of primary and
secondary education. CREATE, Institute of Education and Development, BRAC University. January.
Ahmed, M. and Hossain, A. (2010). Educational access in Bangladesh. Country research summary. CREATE, Institute of Education and Development, BRAC University. November.
Ahmed, M. (2011). The sector-wide approach in Bangladesh. Primary Education: A critical review. CREATE Research monograph No. 57, January.
Ahmed, M., Uddin, L. and Hossain, A. (2010). Child labour and education in Bangladesh. Bangladesh Education Journal. Vol. 9, No. 1, pp. 41-63. June
Akhter, A., Quisumbing, A.R., Nasreen, M., Hoddinott, J.F. and Bryan, E. (2009). Comparing Food and Cash Transfers to the Ultra-Poor in Bangladesh. IFPRI, Washington DC.
Al Samarrai, S. (2006). Changes in employment in Bangladesh, 2000-2005: The impacts on poverty and gender equity. Background paper for the Bangladesh poverty Assessment (2007). World Bank. South Asia region. July.
VKB041-1 283324_B85_BW v5.indd 196 10-10-11 09:55
The two-pronged approach: Evaluation of Netherlands support to primary education in Bangladesh
| 197 |
Al Samarrai, S. (2007). Financing Basic Education in Bangladesh. CREATE Pathways to Access. Research Monograph No 17. June.
Al-Samarrai, S. (2007b). Education spending and equity in Bangladesh. Background paper for the Bangladesh poverty assessment. World Bank. March.
Al Samarrai, S. (2008). Governance and education inequality in Bangladesh. UNESCO. Background paper prepared for the Education for All Global Monitoring Report 2009.
Amin, S. and Chandrasekhar, S. (2009). Looking beyond universal primary education: gender differ-ences in time use among children in rural Bangladesh. Population Council working paper no. 17.
Arends-Keunning, M. and Amin, S. (2004). School incentive programme and children’s activities: the case of Bangladesh. In: Comparative Education Review, 48 (3), pp. 295-317.
Asadullah, M.N. (2005). Returns to education in Bangladesh. University of Oxford, Department of Economics. October
Asadullah, M.N. and Rahman, S. (2006). Farm productivity and efficiency in rural Bangladesh: the role of education revisited. Contributed paper. International Association of Agricultural Economists conference, Gold Coast, Australia, 12-18 April.
Asadullah, M.N, Chaudhury, N. and Dar, A. (2006b). School choice and cognitive achievement in rural Bangladesh. Discussion paper. World Bank. South Asia Human Development Sector. June.
Asadullah, M.N., Chaudhury, N. and Dar, A. (2006c). Student Achievement Conditioned Upon School Selection: Religious and Secular Secondary School Quality in Bangladesh. QEH Working Paper Series – QEHWPS 140
Asadullah, M.N. and Chaudhury, N. (2007). Conditional Cash Transfer and Educational Gender Gaps: Insights from Bangladeshi households.
Asadullah, M.N. (2008). Returns to Private and Public Education in Bangladesh and Pakistan: A Comparative Analysis. QEH Working Paper Series – QEHWPS167. May.
Asadullah, M.N. and Chaudhury, N. (2008). Madrasas and NGOs: Complements or Substitutes? Non-state providers and Growth in Female Education in Bangladesh. World Bank Policy Research Paper No. 4511, February.
Asadullah, M.N and Chaudhury, N. (2008). Poisoning the Mind: Arsenic contamination and cogni-tive achievement of children. World Bank, South Asia Region, Human Development Unit. February.
Asadullah, M.N., Chaudhury, N. and Dar, A. (2009). Assessing the performance of madrasas in rural Bangladesh. In: World Bank, Emerging evidence on vouchers and faith-based providers in education.
Asseldonk, M. v. (2004). Mid-Term Review Quality Education for All Programme (2002-2006).
BANBEIS. (n.d.). Retrieved from http://www.banbeis.gov.bd/BANBEIS. (1987). Primary education in Bangladesh. Dhaka. January.BANBEIS. (2006). National Education Survey (Post-Primary)-2005. Final report. August.Baulch, B. (2010). The Medium-Term Impact of the Primary Education Stipend in Rural Bangladesh.
Discussion Paper 00976, IFPRI, Washington DC.BBS. (n.d.). Retrieved from http://www.bbs.gov.bd/BBS. (2009). Report on Sample Vital Registration System 2008.Boeren, A., Kassam, Y., Tasher, G. and Wirah, A. (2009). Review of BRAC Education Programme I
(2004-2009) and Appraisal of BRAC Education Programme II (2009-2014). Final report.
VKB041-1 283324_B85_BW v5.indd 197 10-10-11 09:55
| 198 |
Annexes
BOOM. ( 2008). Report on BOOM meeting, October 28th.BRAC. (1998). Education Programme NFPE Phase III (1999-2004).BRAC. (2004). BRAC Education Programme 2004-2009, Volume 1.BRAC. (2009a). Annual report 2009.BRAC. (2009b). BRAC Education Programme: Consolidating Five Years of Learning. Dhaka.Bray, M. (2007). The shadow education system: private tutoring and its implications for planners.
Second edition. IIEP/UNESCO. Paris. BU-IED. (2008). Meeting Record BU-IED Donors. March 6.BU-IED. (n.d.). proposal.Bhuyan, K.C. (1991). Social mobility and family planning practices in rural Bangladesh – a case study. Journal of Family Welfare, December 1991, 37(4), pp 46-58.CAMPE. (1999). Hope Not Complacency. Campaign for Popular Education, Education Watch.CAMPE. (2000). A question of quality: State of Primary Education in Bangladesh. Campaign
for popular education, Education Watch.CAMPE. (2006). Quality education needs quality teacher. Our education: our thoughts. Dossier for
primary level students, teachers and guardians. Dhaka. May.CAMPE. (2007). Draft Proposal for Phase IV – April 2007-March 2012. CAMPE. (2008). State of Primary Education: Progress Made, Challenges Remained. Campaign for
Popular Education, Education Watch.CAMPE. (2009). CAMPE Quality Education for All Programme Phase IV – Mid-Term Review. CEF. (2008). PEDP-II. Coherence between Micro Realities and Macro Plan, Based on Grassroots Review
and Policy Auditing. Commonwealth Education Fund, ActionAid, Bangladesh.Centre for Policy Dialogue. (2008). Addressing Regional Inequality Issues in Bangladesh Public
Expenditure. Dhaka.Chaudhury, N., Jammer, J., Kremer, M., Mularidharan, K. and Rogers, H. (2004). Roll-call:
Teacher absenteeism in Bangladesh. June.Chowdury, A.F., Delay, S., Faoz, N., Haider, I., Reed, B, Rose, P. and Sen, P.D. (2004).
Bangladesh: Study of Non-State Providers of Basic Services. Birmingham. November.Chowdhury, A., Haq, M., and Ahmed, Z. (1997). Quality of Primary Education in Bangladesh. In
Jalaluddin (ed.), Getting Started: Universalising Quality Primary Education in Bangladesh. Dhaka: University Press Ltd.
Chowdhury, A.M.R, Nath, S.R. and Choudhury, R.K. (2003). Equity gains in Bangladesh primary education. International Review of Education, 49 (6), pp. 601-619.
Chowdury, A.F., Delay, S., Faiz, N., Haider, I., Reed, B., Rose, P. and Sen, P.D. (2004). Bangladesh: Study of non-state providers of basic services. Birmingham. November
Creative Associates International Inc et al. (2002). Bangladesh Education Sector Review. USAID. June.
Creative Associates International et al. (2004). Bangladesh Educational Assessment. Pre-primary and Primary Madrasah Education in Bangladesh. Prepared for Basic Education and Policy Support (BEPS) Activity. USAID.
De Kemp, A. (2008). Analysing the Effectiveness of Sector Support: Primary Education in Uganda and Zambia. NONIE Working Paper No. 5.
DP. (2010). Minutes DP consortium of January 27th.DPE. (2002). Primary Education Statistics in Bangladesh-2001. MoPME, Directorate of Primary
Education, Dhaka.
VKB041-1 283324_B85_BW v5.indd 198 10-10-11 09:55
The two-pronged approach: Evaluation of Netherlands support to primary education in Bangladesh
| 199 |
DPE. (2007a). Report on Training Courses in the URCs. DPE. (2007b). PEDP-II Progress report.DPE. (2008). School Survey Report -2007. DPE. (2009). PROG3 Concept Paper. October.DPE. (2010). PEPD-II Progress report on status of SLIPS and UPEP’s implementation as of
20 April 2010.DPE/PINZ. (2010). Economic and Financial Analysis. Bangladesh PROG3 DPE/PINZ Team. March.Dzhumashev, Ratbek et al. (2010). Non-collusive corruption: theory and evidence from education
sector in Bangladesh. Monash University, Department of Economics discussion paper 38/10.EC. (n.d.). Retrieved from http://www.delbgd.ec.europa.eu/en/projects/education_projects.
htmELCG. (2007). Report on ELCG workgroup on NFE of February 27th.ELCG. (2009). Notes from the meeting of 10 June 2009.EKN. (2000). Activity Appraisal Document. Programme for the elimination of child labour.EKN. (2003a). Annual Report.EKN. (2003b, September). Harmonisation Pilot: Second Primary Education Development
Programme (PEDP-II) in Bangladesh.EKN. (2003c, September). Harmonisation Pilot: Second Primary Education Development
Programme (PEDP-II) in Bangladesh.EKN. (2004). Primary Education Development Project for Quality Improvement
Final Review. EKN. (2004a). Annual Plan 2004.EKN. (2005). Multi-Annual Strategic Plan 2005-2008.EKN. (2004b). Activity Appraisal Memorandum PEDP-II of February 14th.EKN. (2006a). BU-IED intake document. April.EKN. (2006b). BU-IED, Activity Appraisal document.EKN. (2006c). EKN Track record 2006.EKN. (2006d). Activity Appraisal Document, Education Programme Support Fund (EPSF).
April.EKN. (2007a). Campaign for Popular Education (CAMPE) activity appraisal document –
Quality Education for All EKN. (2007b). Intake Document CAMPE. EKN. (2008a). BU-IED, Review. January.EKN. (2008b). Education Sector Track Record Update. October.EKN. (2009a). BU-IED, Memorandum. January.EKN. (2009b). Education Sector Track Record, update light.EKN. (2009c). Update 2009 Strategy for Education in Bangladesh.EKN. (2010). Activity appraisal document UCEP Sustainable Service Delivery and Expansion 2011-2018.El Zayed, S.R., Stopnitzky, Y. and Khan, Q. (n.d.). Reaping the benefits of girls’ secondary education
in Bangladesh – impact on fertility and malnutrition.Elbers, C., Gunning, J. W. and de Hoop, K. (2009). Assessing Sector-wide Programs with
Statistical Impact Evaluation: A Methodological Proposal. World Development, 37 (2), pp. 513-520.
ELCG. (2004). Terms of Reference (revised, based on decisions made in January 2004).ELCG. (2005). Record of the Education Local Consultative Group (ELCG) meeting of
Feburary 2nd.
VKB041-1 283324_B85_BW v5.indd 199 10-10-11 09:55

| 200 |
Annexes
ELCG. (2006). Draft Minutes of the Education Local Consulative Group of November 28th.ERD. (2010). Flow of External Resources into Bangladesh. Ministry of Finance, Economic Relations
Division, Bangladesh.Ferdous, A., and Rahman, S. (2000). Classroom Performance in the Primary Schools in Bangladesh:
Study findings of the Primary School Performance Monitoring Project (PSPMP). FIVDB. (n.d.). Active Learning: Methodology, Curriculum and Training. Primary Education
Programme. FIVDB. (2008). Proposal Jonoshilon (Popular Education): An Education Program. September 2008–
August 2013.Gerwen, F., Prakke, D. and Rakels, H. (2003). Institutional and organisation analysis of BRAC
education programme (in the framework of BEP Phase IV, 2004-2009). Dhaka, September 13.Giani, L. (2006). Migration and education: child migrants in Bangladesh. Sussex migration working
paper no. 33. March.Glewwe, P., Kremer, M. and Moulin, S. (1999). Texbooks and testscores: evidence from a
prospective evaluation in Kenya.Grira, H. (2007). Retard de scolarisation au Bangladesh: une analyse économétrique. Centre
d’économie de la Sorbonne (Delayed school enrolment evidence from rural Bangladesh).GoB. (2000). Education for All: the year 2000 assessment Bangladesh Country Report. Dhaka.GoB. (2003). A National Strategy for Economic Growth, Poverty Reduction and Social Development.
Dhaka. March. GoB. (2005). Unlocking the Potential – National Strategy for Accelerated Poverty Reduction. Dhaka. 30
October.GoB. (2009). Millennium Development Goals Needs Assessment and Costing 2009-2015 Bangladesh.
Planning Commission, Government of the People’s Republic of Bangladesh.GoB. (2010). Bangladesh Primary Education Annual Sector Performance Report 2010, DPE Second
Primary Education Development Programme (PEDP-II). GoB/UNDP. (2008). Millennium Development Goals, Bangladesh Progress Report 2008. Dhaka.GoB/UNDP. (2009). A situation analysis report on Gender (MDG-3). Bangladesh. A baseline for
needs assessment and costing. Dhaka.Governance Working Group. (2008). Draft minutes GWG meeting. April 9th 2008.Greaney, V., Khandker, S., and Alam, M. (1998). Bangladesh: Aassessing Basic Learning Skills.
World Bank, Washington DC.Grenzke, E. (2007). Is the price right? A study of the impact of school fees in rural
Bangladesh. Journal of Public and International Affairs. 18, pp. 29-54.Hanushek, E., and Wößmann, L. (2007). Education Quality and Economic Growth. The
International Bank for Reconstruction and Development and World Bank, Washington, D.C. USA.
Heissler, K. (n.d.). Children’s migration for work in Bangladesh: The extra- and intra-household factors that shape ‘choice’ and ‘decision-making’.
Hojo, M. (2001). Measuring education levels of farmers: evidence from innovation adoption in Bangladesh.
Hossain, A. (2009). School exclusion as social exclusion: the practices and effects of a conditional cash transfer programme for the poor in Bangladesh. Chronic Poverty research Centre. Institute of Development Studies. Sussex. Working Paper 148. June
VKB041-1 283324_B85_BW v5.indd 200 10-10-11 09:55
The two-pronged approach: Evaluation of Netherlands support to primary education in Bangladesh
| 201 |
Hossain, A. (2010). Age in grade congruence and progression in basic education in Bangladesh. CREATE research monograph No. 48, October.
Hossain, A. and Zeitlin, B. (2010). Poverty and equity: access to education in Bangladesh. CREATE research monograph 51, December.
Hossain, N. (2004). Access to education for the poor and girls: educational achievements in Bangladesh. World Bank.
Hossain, N. (2009). Rude Accountability in the Unreformed State: Informal Pressures on Frontline Bureaucrats in Bangladesh. IDS Working Paper 319. Sussex.
Hossain, N., Subrahmanian, R., and Kabeer, N. (2002). The politics of Educational Expansion in Bangladesh. IDS Working Paper 167. Sussex.
Hughes d’Aeth, A. and Mannan, M.A. (2010). Thematic global evaluation of European Commission support to the education sector in partner countries. Country note Bangladesh. August.
Hunt, F. (2008). Dropping Out from School: A Cross-Country Review of Literature. CREATE Pathways to Access. Research Monograph No 16. May.
ILO. (2000). Programme for the elimination of child labour. Activity Appraisal Document.ILO. (2005). Final evaluation of the project: Prevention and Elimination of Selected Worst Forms of
Child Labour in the Informal Economy of Dhaka City. Dhaka.ILO. (2006). Project Document of Support to the Time Bound Programme for prevention and elimination
of the worst forms of child labour (WFCL) in the Urban Informal Economy (UIE). Dhaka.ILO. (2008a). Breaking the Cycle: Key Learning from an ILO-IPEC Project in Bangladesh.ILO. (2008b). International Programme on the Elimination of Child Labour (IPEC) Action Program
Summary Outline (APSO) on Child Labour. Dhaka.Institute of Governance Studies (IGS). (2011). Governance & Anti Corruption Plan A Draft Report
Submitted to the Embassy of the Kingdom of Netherlands. BRAC UniversityIOB. (2008). Impact Evaluation of Primary Education in Zambia. IOB/AIID, The Hague/Amsterdam.IOB. (2008b). Impact Evaluation of Primary Education in Uganda. IOB/Ministry of Education and
Sports, The Hague/Kampala.Islam, T.S, Wadud, A., Islam, Q.B.T. (2007). Relationship between education and GDP
growth : a multivariate causality analysis for Bangladesh. Economics Bulleting, 3 (35), pp 1-7.Islam, M., Islam, N., Ali, M.A. and Rahman, M. (2009). School attendance of child labor:
A pilot survey in Gaibandha district of Bangladesh. In: International NGO Journal, 4 (4), pp. 109-115.
Islam, R. and Mia, M. (2007). The role of education for rural population transformation in Bangladesh. Asia-Pacific Journal of Cooperative Education, 2007, 8 (2), pp. 1-21.
Islam, S. (2010). Access with quality in primary education. Reinventing inter-organisational synergy. Bangladesh Education Journal. Vol. 9, No. 1, pp 5-28. June
Jeddere-Fisher, K. (2010). Follow-Up review of Independent Mid-term Evaluation: Elimination of selected worst forms of child labour in the urban informal economy of Dhaka city.
Jennings. J. (2007). Planning of the Second Primary Education Programme (PEDP-II) in Bangladesh. January.
Kalam, A. (2003). Socio-economic background of the learners’ households and the issue of financial sustainability: the case of BRAC primary schools. BRAC Education Research Unit. December.
Kapsos, S. (2008). The gender wage gap in Bangladesh. ILO Asia-Pacific Working Paper Series. Bangkok. May.
Karim, S. (2004). Transparency in education. Report card in Bangladesh. IIEP/UNESCO. Paris
VKB041-1 283324_B85_BW v5.indd 201 10-10-11 09:55

| 202 |
Annexes
Kassam, Y., Raynor, J., Ryan, A., and Wirak, A. (2003). Towards Deepening Partnership with the Government of Bangladesh. Appraisal of BEP (2004-2009).
Khan, K.A. (2001), Factors affecting the discontinuation of learners in grade III in formal primary schools and ebtedayee madrasahs. BRAC Research and Evaluation Division, March.
Khanam, R. (2004). Child labour and school attendance: evidence from Bangladesh. University of Sydney.
Khanam, R. (2006). Child labour and school attendance: evidence from Bangladesh. MPRA paper No. 6990.
Khanam, R. and Nghiem, H.S. (2009). The Impact of Child Health on Schooling: Evidence from Bangladesh. September.
Khanam, R. and Ross, R. (2008). Child work and other determinants of school attendance and school attainment in Bangladesh. Proceedings of the 37th Australian Conference of Economists.
Khandker, S.R. (1996). Education achievements and school efficiency in rural Bangladesh. World Bank Discussion Paper No. 319.
Kumar, K. (2004). What is Worth Teaching? Delhi: Orient Longman.Latif, S. (2004). Improvements in the Quality of Primary Education in Bangladesh 1990-2002. Maitra, P. (2001). Schooling and Educational Attainment: Evidence from Bangladesh. Department of
Economics. Monash University. July.McLeod, Darryl. (2007). Is poverty increasing in Bangladesh? Reconciling national and global moni-
toring estimates. Final draft, UNDP. October.MICS. (2006). Bangladesh: Multiple Indicator Cluster Survey 2006. Bangladesh Bureau of
Statistics and United Nations Children’s Fund.MICS. (2009). Bangladesh: Multiple Indicator Cluster Survey 2009. Bangladesh Bureau of
Statistics and United Nations Children’s Fund.Ministry of Foreign Affairs. (2000). Education: A Basic Human Right. The Hague.MoE. (2004). Development of Education. National Report of Bangladesh. September.MoPME website: http://www.mopme.gov.bd/ (consulted 2010 and 2011)MoPME. (2002). Learning for Change: Education for All National Plan of Action II (NPA II) 2003-2015. MoPME. (2003, April). Project Concept Paper Primary Education Development Programme.Monzoor, S. and Kabir, D.M.H. (2008). Primary education in Bangladesh: Streams, disparities and
pathways for unified system. Commonwealth Education Fund. Dhaka.Mujeri, M.K. (2003) Financing education: National priorities and future directions – A right to develop-
ment perspective. July.Muqtadir, A., Haque, M., and Dewan, R. (1998). National Diagnosis on Teacher Supervision and
Support Services for Basic Education in Bangladesh. In: G. Carron, A. De Grauwe, and R. Govinda, Supervision and support services in Asia: Volume II: National diagnoses. Paris IIEP, UNESCO.
Mushtaque, A., Chodhury, R., Nath, S.R. and Choudhury, R. (2003). Equity gains in Bangladesh primary education. International Review of Education. 49 (6), pp. 601-613.
Nath, S.R., Sylva, K. and Grimes, J. (1999). Raising basic education levels in rural Bangladesh: the impact of a non-formal education programme. International review of education. Vol 45(1), pp. 5-26.
Nath, S. (2006a). Quality of BRAC Education Programme: A review of Existing Studies. Dhaka: RED BRAC.
Nath, S. and Chowdhury, A.M.R. (undated). School without a head teacher: one teacher primary schools in Bangladesh. BRAC.
VKB041-1 283324_B85_BW v5.indd 202 10-10-11 09:55
The two-pronged approach: Evaluation of Netherlands support to primary education in Bangladesh
| 203 |
Nath, S.R. (2007). Remunerated supplementary tutoring in out-of-school study in Bangladesh. BRAC Research report. November.
Nath, S.R. (2006). Private supplementary tutoring among primary students in Bangladesh. BRAC Research report. December.
Nath, S.R., Afroze, R., Dutta, N.C., Hossain, A., Kabir, M, and Roy, G. (2007a). BRAC’s Partnership with mainstream primary schools: some early findings from an evaluation study. BRAC Research Report. July.
Nath, S.R., Roy, G., Dutta, N.C. and Hossain, A. (2007b). Achievement of Primary Competencies: A Comparison between Government and BRAC Schools. BRAC Research report. Dhaka. May.
Natural Resources Partners Ltd. (2008). The Paris declaration – Evaluation of the implemen-tation of the Paris Declaration. Case study at country level Bangladesh.
OPM. (2006). Social Sector Performance Review – Primary Education. Oxford Plicy Management, Oxford and Financial Management Reform Program (FMRP), Dhaka.
Pridmore, P. (2007). Impact of Health on Education Access and Achievement: A Cross-National Review of the Research Evidence. CREATE Pathways to Access. Research Monograph No 2. June.
Poisson, M. (2010). Corruption and education. International Academy of Education. IIEP/UNESCO.
PSPMP. (2001). Improving the Quality of Primary Education in Bangladesh: a Strategic Investment Plan. AED, Washington.
Rahman, A., Kabir, M., and Alam, M. (2005). Public Expenditure in Primary Education in Bangladesh: An Analysis.
Rahman, R.I. (2006). Access to education and employment: implications for poverty. PRCPB Working Paper No. 14. February.
Rahman, H.Z. and Ali, K.S. (2004). Quest for quality primary education: where are the entry points? Bangladesh Education Journal. Vol 3, No. 2, pp 55-71. December.
Raihan, S. (2009). Impact of Food Price Rise on School Enrolment and Dropout in the Poor and Vulnerable Households in Selected Areas of Bangladesh. DFID. March.
Rashid, D.A., Smith, L. and Rahman, T. (2006). Determinants of dietary quality: evidence from Bangladesh. Paper for presentation at the American Agricultural Economics Association annual meeting, July 23-26.
Ravallion, M. and Wodon, Q. (2000). Does Child Labor Displace Schooling? Evidence on Behavioral Responses to an Enrollment Subsidy.
Riboud, M., Savchenko, Y., and Tan, H. (2007). The Knowledge Economy and Education and training in South Asia. World Bank.
Ryan, A, Jennings, J. and White, J. (2007). BRAC Education Programme – BEP 2004-2009. Mid Term Review Report. 17 March.
Sabates, R., Hossain, A. and Lewin, K.M. (2010). School Drop Out in Bangladesh: New Insights from Longitudinal Evidence. CREATE Pathways to Access. Research Monograph No. 49. October.
Sabur, Zia Us and Manzoor Ahmed. (2010). Debating diversity in provision of universal primary education in Bangladesh. CREATE Pathways to Access. Research Monograph No. 34. May.
Schuler, S.R. (2007). Rural Bangladesh: Sound policies, evolving gender norms and family strate-gies. In: World Bank/AusAid Whispers to voices – Gender and social transformation in Bangladesh. March.
Seel, A. (2007). Social inclusion: gender and equity in education SWAPS in South Asia – Synthesis Report. UNICEF Regional Office for South Asia.
VKB041-1 283324_B85_BW v5.indd 203 10-10-11 09:55

| 204 |
Annexes
Sen, A. (2010). Primary schooling in West Bengal. Bangladesh Education Journal. Vol. 9, Nr. 1, pp 29-39, June.
Shahjamal, M. (2002). Time distribution in different teaching learning activities in BRAC Schools. BRAC, Dhaka.
SIDA. (2008). Bangladesh Reality Check Annual Report 2007. Listening to Poor People´s Realities about Primary Healthcare and Primary Education. April.
SIDA. (2009). Reality Check Bangladesh 2008. Listening to Poor People’s Realities about Primary Healthcare and Primary Education.
SIDA. (2010). Reality check Bangladesh 2009 – Listening to poor people’s realities about primary health care and primary education – Year 3. January.
Social Development Direct/Oxford Policy Management. (2008). Making aid more effective through gender, rights and inclusion: evidence from implementing the Paris declaration. Bangladesh case study. June.
Sukontamarn, P. (2003). Girls’ educational outcomes in Bangladesh and the role of non-formal schools. London School of Economics. May.
Sukontamarn, Pataporn. (2005). The Entry of NGO schools and Girls’ Educational Outcomes in Bangladesh. London School of Economics. July.
Sukontamarn, Pataporn. (2006). Motivation, school inputs and educational outcomes: Evidence from NGO schools in Bangladesh. University of Adelaide, School of Economics. December.
Sulaiman, M. (2009). Assessing impact of asset transfer on children’s education: A case of BRAC’s ultra poor programme in Bangladesh. Paper commissioned for the EFA Global Monitoring Report 2010, Reaching the marginalized.
Thornton, H. (2004). Support and Supervision of Secondary School Teachers in Bangladesh. Unpublished PhD Thesis.
Transparency International. (n.d.). Retrieved from http://www.transparency.org/policy_research/ surveys_indices/cpi
Transparency International Bangladesh. (2008). National Household Survey 2007 on Corruption in Bangladesh. Substantive Summary. Dhaka. June.
Transparency International Bangladesh. (2010). Corruption in the Service Sectors: National Household Survey 2010. Dhaka. December.
UNESCO. (2000). Investing in Education. Analysis of the 1999 World Education Indicators. Montreal.UNESCO. (2006). Education counts. Benchmarking progress in 19 WEI countries. World Education
Indicators. Montreal.UNESCO. (2008). A view inside primary schools. A World Education Indicators (WEI) cross national
study. Montreal.UNESCO. (2011). EFA Global Monitoring Report 2011: The hidden crisis – Armed conflict and education.
ParisUNICEF. (2004). Quality Education in Bangladesh: The Ideal Way. UNICEF. (2009). Formative Evaluation of the School Level Improvement Plan.UNICEF. (2010). A case for geographic targeting of basic social services to accelerate poverty reduction in
Bangladesh. January.UNICEF. (2010). Understanding urban inequalities in Bangladesh: A prerequisite for achieving Vision
2021. November.Unterhalter, E., Ross, J. and Alam, M. (2003). A Fragile Dialogue? Research and primary
education policy formulation in Bangladesh, 1971-2001. Compare, 33 (1), pp 85-99.
VKB041-1 283324_B85_BW v5.indd 204 10-10-11 09:55

The two-pronged approach: Evaluation of Netherlands support to primary education in Bangladesh
| 205 |
USAID. (2002). Bangladesh Education Sector Review, Report No. 1, Overview of the Basic Education Sector.
USAID. (2010). Bangladesh Economic Growth Assessment. June.VAL. (2009). Governance Assessment: Bangladesh Country Assistance Evaluation. Prepared for
the World Bank Independent Evaluation Group, Verulam Associates Ltd.Wood, J.E. (2003). Developing a risk mitigating strategy on financial management and governance
in PEDP-II. Bangladesh. September.World Bank. (n.d.). Summary Financial Management and Disbursement Arrangements (An Early
Draft), Bangladesh: Third Primary Education Sector Reforms Program (Prog 3). World Bank. (2000). Education Sector Review Volume II. Dhaka: University Press Ltd.World Bank. (2003). Bangladesh Public Expenditure Review, Washington. May.World Bank. (2004). Implementation Completion Report PEDP. June.World Bank. (2007). The knowledge Economy and Education and Training in South Asia. World Bank. (2008a). Whispers to Voices: Gender and Social Development in Bangladesh. Bangladesh
Development Series Paper No. 22. Dhaka.World Bank. (2008b). Education for All in Bangladesh: Where Does Bangladesh Stand in Achieving the
EFA Goals by 2015. Bangladesh Development Series Paper No. 24. Dhaka.World Bank. (2008c). Poverty assessment for Bangladesh: Creating Opportunities and Bridging the
East-West Devide. Bangladesh development series paper no.26. Dhaka.World Bank. (2009). Rapid assessment and stock taking, PEDP-II. November.World Bank. (2010). JEP evaluation on Donor Harmonisation. April.World Bank. (2010). Bangladesh Public Expenditure and Institutional Review – Towards a better quality
of public expenditure, Volume I and II. Washington. June.World development indicators. (n.d.). Retrieved 2010 and 2011, from http://data.worldbank.org/
data-catalog/world-development-indicatorsWorld Food Programme and Tango International. (2006). Rural Bangladesh. Socio-economic
profiles of WFP operational areas and beneficiaries. October.
VKB041-1 283324_B85_BW v5.indd 205 10-10-11 09:55

| 206 |
Annexes
Evaluations of the Policy and Operations Evaluation Department (IOB) published between 2007-2011(Evaluation reports published before 2007 can be found on the IOB website: www.minbuza.nl/iob)
Nr. Year Title ISBN
348 2011 Schoon schip. En dan ? Evaluatie van de schuldverlichting aan de Democratische Republiek Congo 2003-2010 (Verkorte samenvatting)
978-90-5328-403-2
347 2011 Table rase – et après? Evaluation de l’Allègement de la Dette en République Démocratique du Congo 2003-2010
978-90-5328-402-5
346 2011 Vijf Jaar Top van Warschau De Nederlandse inzet voor versterking van de Raad van Europa
978-90-5328-401-8
345 2011 Wederzijdse belangen – wederzijdse voordelen Evaluatie van de Schuldverlichtingsovereenkomst van 2005 tussen de Club van Parijs en Nigeria. (Verkorte Versie)
978-90-5328-398-1
344 2011 Intérêts communs – avantages communs Evaluation de l ‘accord de 2005 relatif à l ‘allègement de la dette entre le Club de Paris et le Nigéria. (Version Abrégée)
978-90-5328-399-8
343 2011 Wederzijdse belangen – wederzijdse voordelen Evaluatie van de schuldverlichtingsovereenkomst van 2005 tussen de Club van Parijs en Nigeria. (Samenvatting)
978-90-5328-397-4
342 2011 Inérêts communs – avantages communs Evaluation de l’accord de 2005 relatif à l’allègement de la dette entre le Club de Paris et le Nigéria. (Sommaire)
978-90-5328-395-0
341 2011 Mutual Interests – mutual benefits Evaluation of the 2005 debt relief agreement between the Paris Club and Nigeria. (Summary report)
978-90-5328-394-3
340 2011 Mutual Interests – mutual benefits Evaluation of the 2005 debt relief agreement between the Paris Club and Nigeria.(Main report)
978-90-5328-393-6
339 2011 (Hergebruiken ISBN-nummer) per mail aangevenaan ISBN
978-90-5328-396-7
338 2011 Consulaire Dienstverlening Doorgelicht 2007-2010 978-90-5328-400-1
337 2011 Evaluación de las actividades de las organizaciones holandesas de cofinanciamiento activas en Nicaragua
Geen ISBN-nr.
336 2011 Facilitating Recourcefulness. Synthesis report of the Evaluation of Dutch support to Capacity Development.
978-90-5328-392-9
335 2011 Evaluation of Dutch support to Capacity Development. The case of the Netherlands Commisson for Environmental Assessment (NCEA)
978-90-5328-391-2
VKB041-1 283324_B85_BW v5.indd 206 10-10-11 09:55
The two-pronged approach: Evaluation of Netherlands support to primary education in Bangladesh
| 207 |
334 2011 Aiding the Peace. A Multi-Donor Evaluation of Support to Conflict Prevention and Peacebuilding Activities in Southern Sudan 2005 - 2010
978-90-5328-389-9
333 2011 Evaluación de la cooperación holandesa con Nicaragua 2005-2008
978-90-5328-390-5
332 2011 Evaluation of Dutch support to Capacity Development. The case of PSO
978-90-5328-388-2
331 2011 Evaluation of Dutch support to Capacity Development. The case of the Netherlands Institute for Multiparty Democracy (NIMD)
978-90-5328-387-5
330 2010 EvaluatieLandenstudieMFO’sNicaragua 978-90-5328-386-8
329 2010 Evaluation of General Budget Support to Nicaragua 2005-2008
978-90-5328-385-1
328 2010 Evaluatie van de Nederlandse hulp aan Nicaragua 2005-2008
978-90-5328-384-4
327 2010 Impact Evaluation. Drinking water supply and sanitation programme supported by the Netherlands in Fayoum Governorate, Arab Republic of Egypt, 1990-2009
978-90-5328-381-3
326 2009 Evaluatie van de Atlantische Commissie (2006-2009) 978-90-5328-380-6
325 2009 Beleidsdoorlichting van het Nederlandse exportcontrole- en wapenexportbeleid
978-90-5328-379-0
- 2009 idem (Engelse) -
- 2009 Evaluatiebeleid en richtlijnen voor evaluaties -
324 2009 Investing in Infrastructure 978-90-5328-3783
- 2009 Synthesis of impact evaluations in sexual and reproductive health and rights
978-90-5328-376-9
323 2009 Preparing the ground for a safer World 978-90-5328-377-6
322 2009 Draagvlakonderzoek. Evalueerbaarheid en resultaten 978-90-5328-375-2
321 2009 Maatgesneden Monitoring ‘Het verhaal achter de cijfers’ 978-90-5328-374-5
320 2008 Het tropisch regenwoud in het OS-beleid 1999-2005 978-90-5328-373-8
319 2008 Meer dan een dak. Evaluatie van het Nederlands beleid voor stedelijke armoedebestrijding
978-90-5328-365-3
318 2008 Samenwerking met Clingendael 978-90-5328-367-7
317 2008 Sectorsteun in milieu en water 978-90-5328-369-1
316 2008 Be our guests (sommaire) 978-90-5328-372-1
316 2008 Be our guests (summary) 978-90-5328-371-4
316 2008 Be our guests (hoofdrapport Engels) 978-90-5328-371-4
316 2008 Be our guests (samenvatting) 978-90-5328-370-7
316 2008 Be our guests (hoofdrapport) 978-90-5328-370-7
315 2008 Support to Rural Water Supply and Sanitation in Dhamar and Hodeidah Governorates, Republic of Yemen
978-90-5328-368-4
VKB041-1 283324_B85_BW v5.indd 207 10-10-11 09:55
| 208 |
Annexes
314 2008 Primus Inter Pares; een evaluatie van het Nederlandse EU-voorzitterschap 2004
978-90-5328-3646
313 2008 Explore-programma 978-90-5328-362-2
312 2008 Impact Evaluation: Primary Education Zambia 978-90-5328-360-8
311 2008 Impact Evaluation: Primary Education Uganda 978-90-5328-361-5
310 2008 Clean and Sustainable? 978-90-5328-356-1
309 2008 Het vakbondsmedefinancieringsprogramma – samenvatting Engels
978-90-5328-357-8
309 2008 Het vakbondsmedefinancieringsprogramma – Samenvatting Spaans
978-90-5328-357-8
309 2008 Het vakbondsmedefinancieringsprogramma 978-90-5328-357-8
308 2008 Het Nederlandse Afrikabeleid 1998-2006. Evaluatie van de bilaterale samenwerking
978-90-5328-359-2
308 2008 Het Nederlandse Afrikabeleid 1998-2006. Evaluatie van de bilaterale samenwerking (Samenvatting)
978-0-5328-359-2
307 2008 Beleidsdoorlichting seksuele en repoductieve gezondheid en rechten en hiv/aids 2004-2006
978-90-5328-358-5
306 2007 Chatting and Playing Chess with Policymakers 978-90-5328-355-4
305 2007 Impact Evaluation: Water Supply and Sanitation Programmes Shinyanga Region, Tanzania 1990-2006
978-90-5328-354-7
304 2007 Evaluatie van de vernieuwing van het Nederlandse onderzoeksbeleid 1992-2005
978-90-5328-353-0
304 2007 Evaluation of the Netherlands Research Policy 1992-2005 (Summary)
978-90-5328-353-0
VKB041-1 283324_B85_BW v5.indd 208 10-10-11 09:55

IOB Evaluation | no. 349
The two-pronged approach: Evaluation of N
etherlands support to prim
ary education in Bangladesh
IOB Evaluation
Evaluation of Netherlands support to primary education in Bangladesh | IOB Evaluation | no. 349 | The two-pronged approach: Evaluation of Netherlands support to formal and The two-pronged approach: Evaluation of Netherlands support to primary education in Bangladesh | IOB Evaluation | no. 349 | The two-pronged approach: Evaluat
The two-pronged approach: Evaluation of Netherlands support to primary education in Bangladesh
Published by:
Ministry of Foreign Affairs of the NetherlandsP. O. Box 20061 | 2500 eb The Hague | The Netherlandswww.minbuza.nl | www.rijksoverheid.nl © Ministry of Foreign Affairs of the Netherlands | August 2011
11Buz283327 | E
The Netherlands provided considerable support to formal and non-formal primary education in Bangladesh in the period 1999-2009. This support was channeled through both govern-mental and non-governmental channels. Rather than following the Dutch Euro, this
report aims to assess the results accomplished through these channels in terms of access to education and education quality. The evaluation in Bangladesh is one of the building blocks for IOB’s policy review of Netherlands support to basic education in developing countries.
VKB041-1 WTK Rapport IOB 349 omslag.indd 1 11-10-11 10:10