ioi corp 2008 fa new:layout 1
TRANSCRIPT

GIVING BACK
IOI Corporation Berhad 9027-W
2008annual report
Ever since formulating Vision IOI back in 1995, Corporate Social Responsibility (”CSR”) has been part and parcel of the way we do business. Fundamental to our corporate vision is a determination to care for the communities and environments in which we operate. We constantly seek to align business, social and environmental best practice, maximising the benefits to all our stakeholders.
We are wholeheartedly committed to giving back to the land on which our prosperity is based by nurturing our nation’s human and natural resources and making them the foundation on which to build a better future.
Education therefore forms an integral part of our CSR initiatives, and via Yayasan Tan Sri Lee Shin Cheng, we have become a major benefactor to many schools and underprivileged students nationwide. We have also dedicated considerable resources to community and employee welfare.
Similarly, wherever we operate, we are resolute in meeting regulatory requirements on environmental impact. We strive to achieve a sustainable long-term balance between meeting business goals and ensuring environmental protection. Our policy is to safeguard the environment, and to encourage the same standards of environmental care from our suppliers and business partners.
GIVING BACK

MARKET CAPITALISATION
SHARE PRICE
56%PROFIT BEFORE TAXATION
OUR VISION
…is to be a leading corporation in our core businesses by providing products and services of superior values
and by sustaining consistent long-term growth in volume and profitability.
We shall strive to achieve responsible commercial success by satisfying our customers’ needs, giving superior
performance to our shareholders, providing rewarding careers to our people, cultivating mutually beneficial
relationship with our business associates, caring for the society and the environment in which we operate
and contributing towards the progress of our nation.
~ plan and act with cohesive purpose towards Vision IOI
~ focus on core businesses
~ create value for all stakeholders
~ market focused and oriented
~ continuous improvement in quality, productivity and cost efficiencies
OUR KEY STRATEGIES
KEY INDICATORS 2008 2007 2006 2005 2004
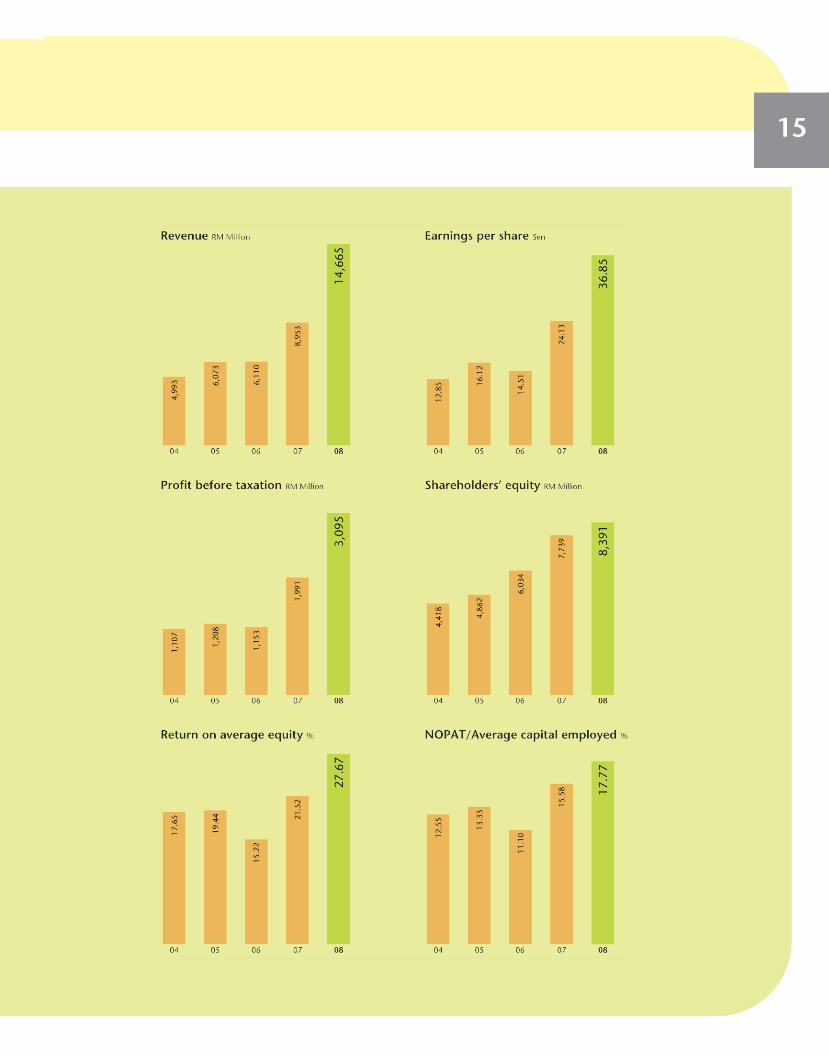
FINANCIALProfit before taxation RM’000 3,095,197 1,991,073 1,152,873 1,208,423 1,107,075Net profit attributable to shareholders RM’000 2,231,632 1,482,104 829,002 902,220 701,550 Shareholders’ equity RM’000 8,391,361 7,739,258 6,033,923 4,862,328 4,418,152 Return on average equity % 27.67 21.52 15.22 19.44 17.65 Basic earnings per share sen 36.85 24.13 14.51 16.12 12.85 Gross dividend per share % 170.0 70.0 87.0 70.0 50.0
PLANTATIONFFB production MT 3,957,281 3,694,535 3,674,483 3,657,776 2,927,194 Total oil palm area Ha 149,445 148,871 144,055 143,696 145,060
PROPERTYSales value RM’000 696,743 683,471 570,842 549,213 713,677 Sales unit 1,934 1,529 1,524 1,822 3,010
MANUFACTURINGOleochemicalPlant utilisation % 92 95 99 99 92 Sales MT 668,808 509,965 364,393 366,040 327,510
Refinery Plant utilisation % 91 85 87 97 97 Sales MT 2,996,439 2,287,190 1,283,647 1,200,214 1,055,902Specialty oils and fats Plant utilisation % 100 95 91 72 66 Sales MT 521,719 502,695 482,876 283,570 266,205
OUR RESULTS
37%
43%
53%
64%REVENUE
BASIC EARNINGS PER SHARE
2008RM44.6
BILLION
2007RM32.5
BILLION
2008RM14.67
BILLION
2007RM8.95
BILLION
2008RM7.45
2007RM5.20
2008RM3.10
BILLION
2007RM1.99
BILLION
2008
36.85SEN
200724.13
SEN

MARKET CAPITALISATION
SHARE PRICE
56%PROFIT BEFORE TAXATION
OUR VISION
OUR KEY STRATEGIES
KEY INDICATORS 2008 2007 2006 2005 2004
FINANCIAL
PLANTATION
PROPERTY
MANUFACTURINGOleochemical
Refinery
Specialty oils and fats
OUR RESULTS
37%
43%
53%
64%REVENUE
BASIC EARNINGS PER SHARE
2008RM44.6
BILLION
2007RM32.5
BILLION
2008RM14.67
BILLION
2007RM8.95
BILLION
2008RM7.45
2007RM5.20
2008RM3.10
BILLION
2007RM1.99
BILLION
2008
36.85SEN
200724.13
SEN


2
DEAR SHAREHOLDERS,
On behalf of the Board of Directors of IOI Corporation Berhad, it gives me great pleasure to present to you the Annual Reportand Financial Statements of your Company and the Group for the financial year ended 30 June 2008.
HIGHLIGHTS
Last financial year, I had reported to you that the Group had achieved new highs in our financial results. As such, I am verypleased to report to you this year that the Group has managed to surpass that with yet another set of record results,incorporating the following key highlights:
• Group revenue increased by 64% from RM8.95 billion to RM14.67 billion • Operating profit registered RM3.17 billion, a 54% increase over the RM2.06 billion achieved the previous year• Pre-tax profit grew by 55% from RM1.99 billion to RM3.10 billion for FY2008• Net earnings increased by 51% from RM1.48 billion to RM2.23 billion • Return on average equity for the year, ROE, improved from 21.5% to 27.7% for FY2008
OPERATING BACKGROUND
On the global front, year 2007 global economy was generally less buoyant than in year 2006. The effects of persistent highcrude oil prices at record levels coupled with the sluggish US economy due to the burgeoning banking credit crisis and housingmarket deterioration has weighed down on global economic growth. On another dimension, the surging tide of food prices,such as corn, wheat and palm oil, continues to add to the already worsening global inflationary pressure.
IOI CORPORATION BERHAD ANNUAL REPORT 2008
CHAIRMAN’S STATEMENT
3At the local front, Malaysian economy was somewhat resilient in facing the global slowdown in 2007, achieving a GDP growthrate of 6.3% compared to 5.3% achieved last year. Plantation sector continued to be buoyant on the back of high commodityprices. Meanwhile, in the property sector, various positive initiatives announced by the Malaysian government as well as theincrease in foreign buying interest had helped to stimulate the domestic housing and commercial property market and for thefirst time since 2002, overhang units has registered a reduction by 5% over 2006.
REVIEW OF RESULTS
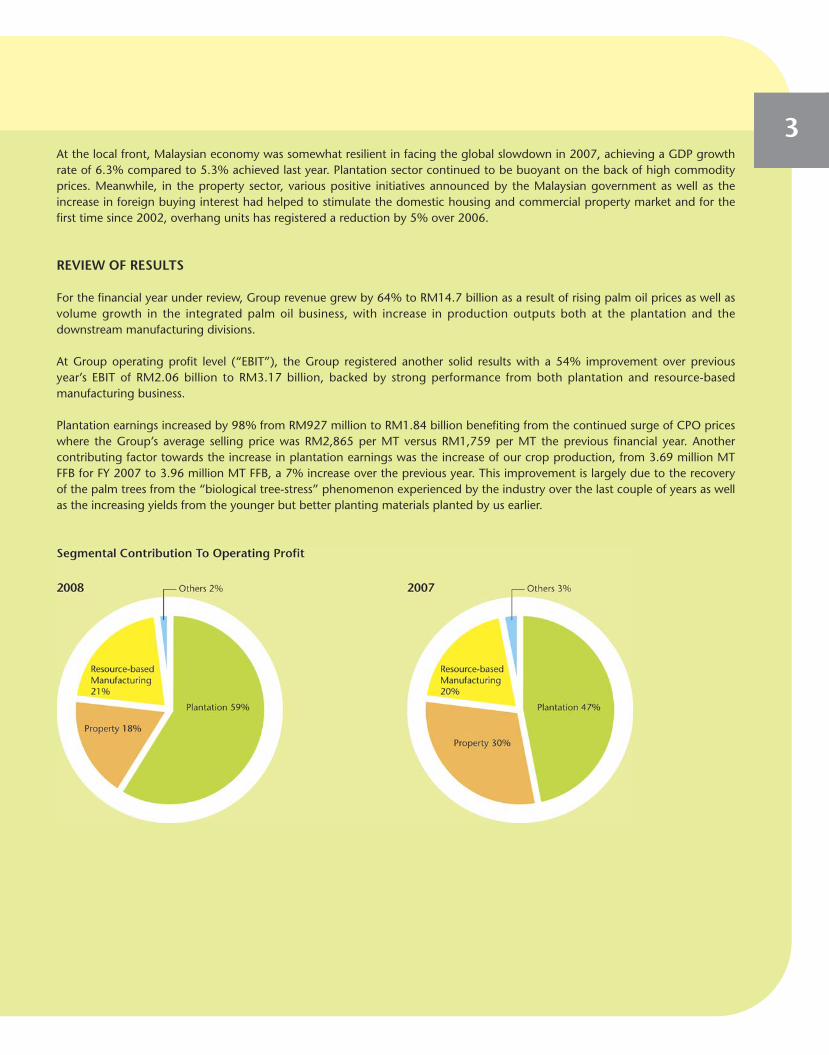
For the financial year under review, Group revenue grew by 64% to RM14.7 billion as a result of rising palm oil prices as well asvolume growth in the integrated palm oil business, with increase in production outputs both at the plantation and thedownstream manufacturing divisions.
At Group operating profit level (“EBIT”), the Group registered another solid results with a 54% improvement over previousyear’s EBIT of RM2.06 billion to RM3.17 billion, backed by strong performance from both plantation and resource-basedmanufacturing business.
Plantation earnings increased by 98% from RM927 million to RM1.84 billion benefiting from the continued surge of CPO priceswhere the Group’s average selling price was RM2,865 per MT versus RM1,759 per MT the previous financial year. Anothercontributing factor towards the increase in plantation earnings was the increase of our crop production, from 3.69 million MTFFB for FY 2007 to 3.96 million MT FFB, a 7% increase over the previous year. This improvement is largely due to the recoveryof the palm trees from the “biological tree-stress” phenomenon experienced by the industry over the last couple of years as wellas the increasing yields from the younger but better planting materials planted by us earlier.

4The downstream resource-based manufacturing division, comprising refining, oleochemicals and specialty fats, had anotheroutstanding year, with strong growth in operating profit from RM405 million to RM658 million in FY2008 despite operatingunder challenging environment of surging feedstock prices and higher operating costs. Robust demand in target marketsegments, improvement in operating efficiencies coupled with good price risk management and supply chain management allcontributed to the excellent performance.
As for the property segment, after excluding investment properties revaluation gain of RM130 million for FY2008 and RM161million for FY2007, the underlying operating profit eased by about 4% to RM422 million against previous year’s RM438 million.Escalating cost in building materials such as steel and concrete is a key challenge facing the industry and we were not able topass all the cost increase to our property buyers. On the whole, compared to other players in the industry, our performance is still considered satisfactory.
Overall, the Group posted a pre-tax profit of RM3.10 billion for FY2008, which was 55% higher than FY2007 of RM1.99 billionwhilst net earnings rose by 51% to RM2.23 billion. The percentage increase of the Group’s net earnings level is slightly lowerthan the percentage increase of the Group’s pre-tax level due mainly to higher tax expense as a result of the expiry of certaintax incentives granted by the tax authority at the end of FY2007. The strong operating performance from the Palm Oil business,which comprise of our upstream and downstream business, has further improved our Return On average Equity (“ROE”) from21.5% in FY2007 to 27.7% in FY2008, a level which is way above our average ROE target of 20%.
A more detail review of the Group’s performance is covered under the section on “Management‘s Discussion and Analysis“ in this Annual Report.
DIVIDENDS & CAPITAL REPAYMENT
For FY2008, the Group is back again to its normal dividend policy of paying two rounds of dividends as compared to last year’sof one round of dividend payout. The FY2008 dividend payout represents a 170% on par value or representing a total payout ofapproximately RM913 million, which is by far the highest dividend declaration made by your Board ever since the inception ofthe Company. The high dividend payout is not only in tandem with the solid results achieved; it is also to reward theshareholders for their continued support and confidence in the Group.
Apart from the aforementioned direct cash returns to shareholders, during the financial year, your Company also spent a total ofabout RM1.1 billion on share buy-back, which shares will be cancelled in due course.
Your Board remains committed to consistently give satisfactory cash returns and increase overall value for shareholders. In thisregard, capital management tools will continue to be applied to achieve ROE targets, sustain appropriate net gearing levels andto provide funds for growth opportunities.
IOI CORPORATION BERHAD ANNUAL REPORT 2008
CHAIRMAN’S STATEMENT CONT’D

5CORPORATE DEVELOPMENTS AND GROWTH PLANS
As a follow–up to the various initiatives for growth mentioned in my report last year, I am pleased to provide the following updates:
With reference to last year’s announcement on our acquisition of a stake in Indonesia plantation companies for oil palmcultivation in Indonesia which essentially involves IOI acquiring:
i a 33% stake in a group of companies having plantation land of approximately 100,000 hectares, of which 35,000 hectareswas planted, together with three palm oil mills; and
ii a 67% stake in a group of companies which will have plantation land of about 66,000 hectares for planting in due course.
I am pleased to report that the acquisition of the shares in the aforesaid Indonesian plantation companies was completed during thesecond quarter of FY2008. Since then, another 13,000 hectares have been planted with oil palm and a new 40 metric tones/hourmill has started construction as at the end of FY2008.
In our downstream manufacturing business, Loders Croklaan has started the expansion of its refinery in Rotterdam and also aspecialised plant to produce margarine ingredients for the growing palm oil market in Europe. In Malaysia, Loders Croklaan hasalso embarked on the expansion of its specialty fats plant in Johor together with a new plant to produce ingredients for itsnutritional food business at the same location.
On the property front, the Group has made another significant acquisition in Singapore during the year. Through a jointventure between IOI Properties Berhad and their Singapore partner, Ho Bee Investment Limited in a ratio of 65:35 respectively,the Group has successfully tendered for a parcel of land measuring 5.3 acres in Sentosa Cove at a sum of approximately SGD1.1billion. The site is the last piece of land approved for condominium development on the world-renowned resort island and thejoint venture company plans to launch the development towards the second half of year 2009 when the integrated resort onthe island is nearing completion.
A notable achievement for the Group was the successful launch of our USD600 million exchangeable bonds (“3rd EB”). The 3rd EB received an overwhelming response from investors globally and it was oversubscribed by five times within the firstone and a half hours of book-building exercise. The proceeds from the bond serves as a cash reserve for the Group’s futureexpansion plans including potential acquisition opportunities whilst the borrowing in USD serves as a natural hedge against theGroup’s revenue from palm oil, which are traded globally in USD.
6CORPORATE RESPONSIBILITY
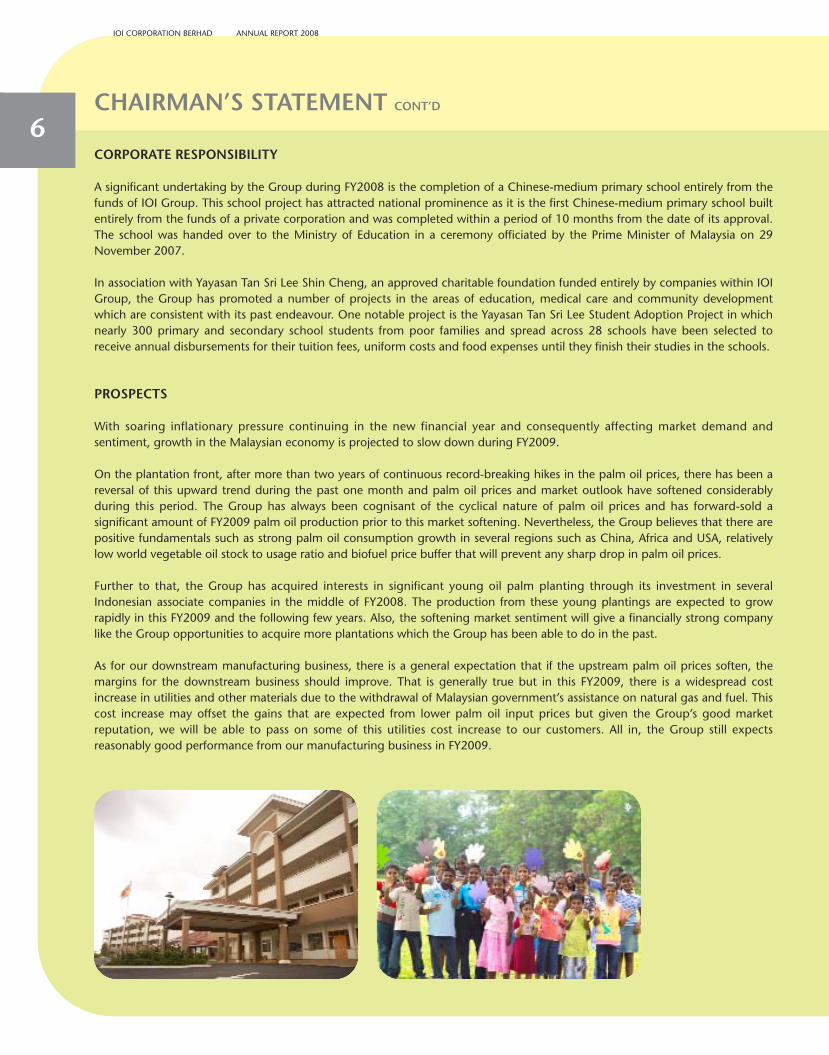
A significant undertaking by the Group during FY2008 is the completion of a Chinese-medium primary school entirely from thefunds of IOI Group. This school project has attracted national prominence as it is the first Chinese-medium primary school builtentirely from the funds of a private corporation and was completed within a period of 10 months from the date of its approval.The school was handed over to the Ministry of Education in a ceremony officiated by the Prime Minister of Malaysia on 29November 2007.
In association with Yayasan Tan Sri Lee Shin Cheng, an approved charitable foundation funded entirely by companies within IOIGroup, the Group has promoted a number of projects in the areas of education, medical care and community developmentwhich are consistent with its past endeavour. One notable project is the Yayasan Tan Sri Lee Student Adoption Project in whichnearly 300 primary and secondary school students from poor families and spread across 28 schools have been selected toreceive annual disbursements for their tuition fees, uniform costs and food expenses until they finish their studies in the schools.
PROSPECTS
With soaring inflationary pressure continuing in the new financial year and consequently affecting market demand andsentiment, growth in the Malaysian economy is projected to slow down during FY2009.
On the plantation front, after more than two years of continuous record-breaking hikes in the palm oil prices, there has been areversal of this upward trend during the past one month and palm oil prices and market outlook have softened considerablyduring this period. The Group has always been cognisant of the cyclical nature of palm oil prices and has forward-sold asignificant amount of FY2009 palm oil production prior to this market softening. Nevertheless, the Group believes that there arepositive fundamentals such as strong palm oil consumption growth in several regions such as China, Africa and USA, relativelylow world vegetable oil stock to usage ratio and biofuel price buffer that will prevent any sharp drop in palm oil prices.
Further to that, the Group has acquired interests in significant young oil palm planting through its investment in severalIndonesian associate companies in the middle of FY2008. The production from these young plantings are expected to growrapidly in this FY2009 and the following few years. Also, the softening market sentiment will give a financially strong companylike the Group opportunities to acquire more plantations which the Group has been able to do in the past.
As for our downstream manufacturing business, there is a general expectation that if the upstream palm oil prices soften, themargins for the downstream business should improve. That is generally true but in this FY2009, there is a widespread costincrease in utilities and other materials due to the withdrawal of Malaysian government’s assistance on natural gas and fuel. Thiscost increase may offset the gains that are expected from lower palm oil input prices but given the Group’s good marketreputation, we will be able to pass on some of this utilities cost increase to our customers. All in, the Group still expectsreasonably good performance from our manufacturing business in FY2009.
IOI CORPORATION BERHAD ANNUAL REPORT 2008
CHAIRMAN’S STATEMENT CONT’D
7In line with the dampening Malaysian economy outlook, we are expecting a generally subdued property market in FY2009.Despite the bearish property market, we are cautiously optimistic that we will be able to perform better than many of our peersin the industry due to the good location of our townships, our ability to manage our product mix to suit the prevailing marketdemand and the value-adding opportunities arising from our mature townships namely in the commercial property segment.
Barring unforeseen circumstances, the Group is therefore confident of achieving another set of commendable results in FY2009which will be underpinned by solid plantation earnings from the relatively high palm oil prices already secured for the Groupand the strong market position of our downstream businesses.
As we look beyond the current financial year, we must be prepared to face the rapidly changing landscape in the palm oilindustry where both new opportunities as well as new challenges surface. On our part, we have continued to invest heavily infuture growth. More importantly, we have been able to do this in a focused and disciplined manner that allows us to ride alongwith positive trends shaping the industry without taking on excessive risks. We have also been fortunate to have the opportunityto add on parts that will create substantial value to the whole business. We have businesses that are in leading positions in theirrespective segments and these businesses when combined together, give us an integrated business model that provides usunique value proposition, added competitive edge and strategic capabilities. On a daily basis, we continue to maintain ourhallmark trait of excellence in execution, focusing relentlessly on efficiency, productivity, innovation and improving customerservice. Last but certainly not the least, we have a team of experienced and committed people who still aspire to reach greaterheights. All of these give me the confidence that we are well positioned for the future.
ACKNOWLEDGEMENT
The sterling results by the Group would certainly not be possible without the untiring dedication and commitment of ourpeople at all levels. My sincere appreciation to the management team and to everyone in the IOI Group for their contribution.This year, I wish to specifically mention Dato’ Yeo How who left the Group on 30 June 2008 after twenty-five years ofdistinguished service. We wish him the best in his future undertakings.
On behalf of the Group, I wish to also express our gratitude for the continued strong support of our customers, business partners,bankers and government authorities and my personal thanks to my fellow Board members for their invaluable advice and support.
Last but not least, once again, dear shareholders, thank you for the continued trust in us and we assure you that we willcontinue to work to uphold your trust in us.
Thank you.
TAN SRI DATO’ LEE SHIN CHENGExecutive Chairman

8
IOI CORPORATION BERHAD ANNUAL REPORT 2008
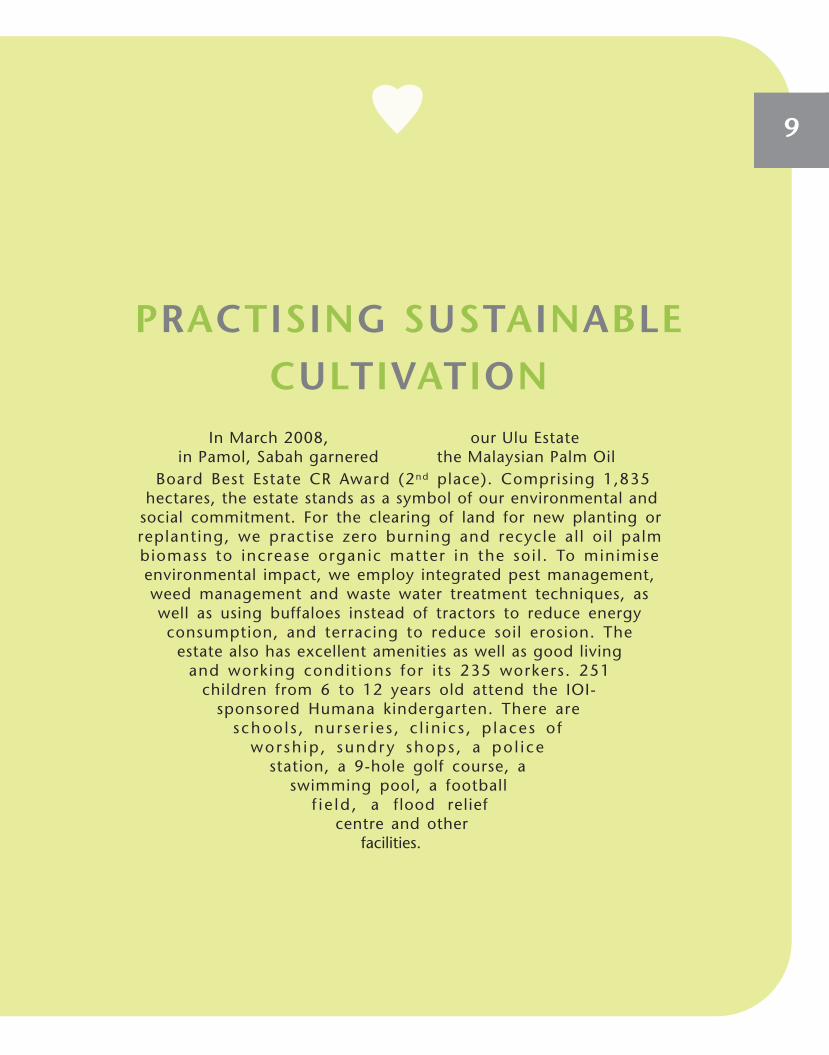
PRACTISING SUSTAINABLECULTIVATION
Board Best Estate CR Award (2nd place). Comprising 1,835hectares, the estate stands as a symbol of our environmental and
social commitment. For the clearing of land for new planting orreplanting, we practise zero burning and recycle al l oi l palmbiomass to increase organic matter in the soi l . To minimiseenvironmental impact, we employ integrated pest management,weed management and waste water treatment techniques, aswell as using buffaloes instead of tractors to reduce energyconsumption, and terracing to reduce soil erosion. The
estate also has excellent amenities as well as good livingand working condit ions for i ts 235 workers. 251
children from 6 to 12 years old attend the IOI-sponsored Humana kindergarten. There are
schoo l s , nur se r i e s , c l in i c s , p laces o fworsh ip , sundry shops , a po l i ce
station, a 9-hole golf course, aswimming pool, a football
f i e ld , a flood reliefcentre and other
facilities.
In March 2008, our Ulu Estatein Pamol, Sabah garnered the Malaysian Palm Oil
9

10
IOI CORPORATION BERHAD ANNUAL REPORT 2008
GROUP FINANCIAL OVERVIEW
CASH FLOW FOR THE FINANCIAL YEAR ENDED 30 JUNE 2008 RM million
Net operating cash flow 1,419Capital expenditure, net of disposal (230)Free cash flow from operation 1,189Proceeds from disposal of investments, net of payments for other investments 155
Proceeds from issuance of shares 61Payments made to jointly controlled entities (1,316)Capital repayments (1,314)Share repurchases- Company (1,080)- Subsidiaries (8)Dividend payments- Shareholders of the Company (315)- Shareholders of subsidiaries (74)Acquisitions of subsidiaries, net of cash and cash equivalents acquired (248)Investment in development land bank (188)Interest paid (114)Acquisitions of additional interest in subsidiaries (9)Cash outflow in net borrowings (3,261)Conversion of 2nd Exchangeable Bonds 721Recognition of equity component of exchangeable bonds upon issuance 278
Accretion of exchangeable bonds (66)Accretion of guaranteed notes (1)Net decrease in net borrowings (2,329)Net borrowings as at 30.06.07 (903)Translation difference 157Net borrowings as at 30.06.08 (3,075)
Net Borrowings = (b) - (a) = RM903 millionNet gearing = 12%
11
Net Borrowings = (b) - (a) = RM3,075 million Segment Results = RM3,106 millionNet gearing = 37%
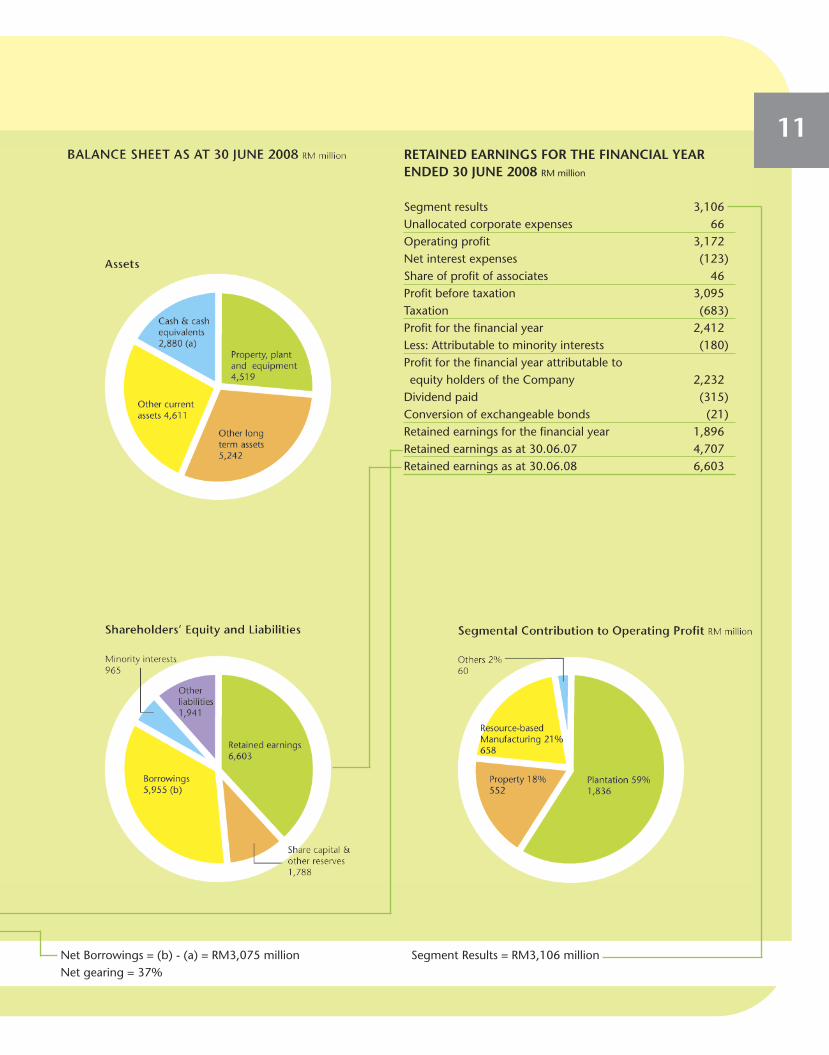
RETAINED EARNINGS FOR THE FINANCIAL YEAR ENDED 30 JUNE 2008 RM million
Segment results 3,106Unallocated corporate expenses 66Operating profit 3,172Net interest expenses (123)Share of profit of associates 46Profit before taxation 3,095Taxation (683)Profit for the financial year 2,412Less: Attributable to minority interests (180)Profit for the financial year attributable to equity holders of the Company 2,232
Dividend paid (315)Conversion of exchangeable bonds (21)Retained earnings for the financial year 1,896Retained earnings as at 30.06.07 4,707Retained earnings as at 30.06.08 6,603
IOI CORPORATION BERHAD ANNUAL REPORT 2008
GROUP PERFORMANCE HIGHLIGHTS12
2008 2007 %RM’000 RM’000 +/(-)
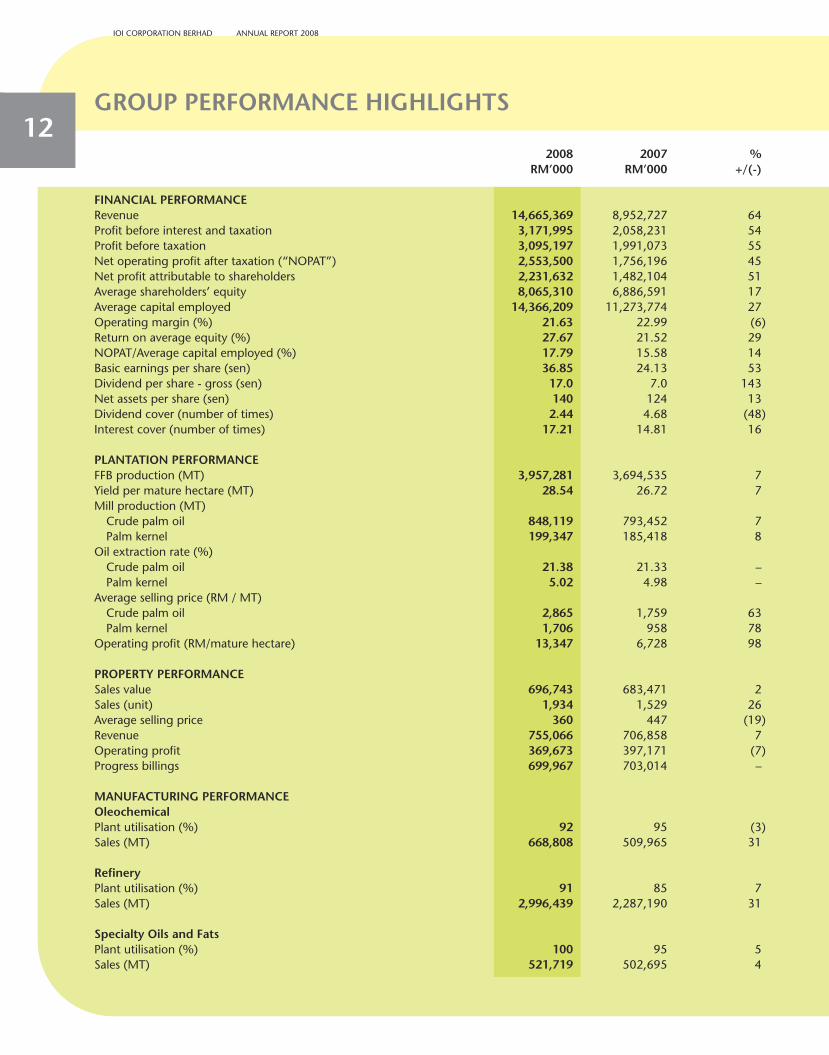
FINANCIAL PERFORMANCERevenue 14,665,369 8,952,727 64Profit before interest and taxation 3,171,995 2,058,231 54Profit before taxation 3,095,197 1,991,073 55Net operating profit after taxation (“NOPAT”) 2,553,500 1,756,196 45Net profit attributable to shareholders 2,231,632 1,482,104 51Average shareholders’ equity 8,065,310 6,886,591 17Average capital employed 14,366,209 11,273,774 27Operating margin (%) 21.63 22.99 (6)Return on average equity (%) 27.67 21.52 29NOPAT/Average capital employed (%) 17.79 15.58 14Basic earnings per share (sen) 36.85 24.13 53Dividend per share - gross (sen) 17.0 7.0 143Net assets per share (sen) 140 124 13Dividend cover (number of times) 2.44 4.68 (48)Interest cover (number of times) 17.21 14.81 16
PLANTATION PERFORMANCEFFB production (MT) 3,957,281 3,694,535 7Yield per mature hectare (MT) 28.54 26.72 7Mill production (MT)
Crude palm oil 848,119 793,452 7Palm kernel 199,347 185,418 8
Oil extraction rate (%)Crude palm oil 21.38 21.33 –Palm kernel 5.02 4.98 –
Average selling price (RM / MT)Crude palm oil 2,865 1,759 63Palm kernel 1,706 958 78
Operating profit (RM/mature hectare) 13,347 6,728 98
PROPERTY PERFORMANCESales value 696,743 683,471 2Sales (unit) 1,934 1,529 26Average selling price 360 447 (19)Revenue 755,066 706,858 7Operating profit 369,673 397,171 (7)Progress billings 699,967 703,014 –
MANUFACTURING PERFORMANCEOleochemicalPlant utilisation (%) 92 95 (3)Sales (MT) 668,808 509,965 31
RefineryPlant utilisation (%) 91 85 7Sales (MT) 2,996,439 2,287,190 31
Specialty Oils and FatsPlant utilisation (%) 100 95 5Sales (MT) 521,719 502,695 4

GROUP QUARTERLY RESULTS
FINANCIAL CALENDAR
Financial Year End 30 June 2008 Payment of DividendsInterim
Announcement of Results Declaration 14 February 20081st Quarter 15 November 2007 Book Closure 17 March 20082nd Quarter 14 February 2008 Payment 28 March 20083rd Quarter 15 May 20084th Quarter 18 August 2008 Interim
Declaration 18 August 2008Notice of Annual General Meeting 22 September 2008 Book Closure 17 September 2008
Payment 26 September 2008Annual General Meeting 22 October 2008
131st Quarter 2nd Quarter 3rd Quarter 4th Quarter FY 2008
RM’000 % RM’000 % RM’000 % RM’000 % RM’000 %
Revenue 3,122,741 21 3,457,141 24 3,525,422 24 4,560,065 31 14,665,369 100
Operating profit 651,372 21 804,860 25 823,817 26 891,946 28 3,171,995 100Interest income 8,636 13 12,734 19 25,571 37 21,094 31 68,035 100Finance cost (44,703) 23 (38,987) 20 (46,952) 25 (60,322) 32 (190,964) 100Share of results of associates 12,962 28 11,884 26 17,949 39 3,409 7 46,204 100Share of results of jointly controlled entity (16) 22 (4) 5 (26) 36 (27) 37 (73) 100
Profit before taxation 628,251 20 790,487 26 820,359 26 856,100 28 3,095,197 100Taxation (137,213) 20 (162,880) 24 (182,782) 27 (200,135) 29 (683,010) 100Profit for the financial year 491,038 20 627,607 26 637,577 27 655,965 27 2,412,187 100
Attributable to:Equity holders of the Company 451,518 20 581,191 26 601,639 27 597,284 27 2,231,632 100Minority interests 39,520 22 46,416 26 35,938 20 58,681 32 180,555 100
491,038 20 627,607 26 637,577 27 655,965 27 2,412,187 100
Earnings per share (sen)Basic 7.37 9.71 9.89 9.91 36.85Diluted 6.99 8.96 8.78 9.80 35.17
Operating profit on segmental basis
Plantations 397,537 22 481,257 26 434,779 24 522,278 28 1,835,851 100Property development 98,929 27 87,161 23 95,496 26 88,087 24 369,673 100Property investment 10,801 6 13,314 7 10,429 6 147,731 81 182,275 100Manufacturing 122,761 19 159,079 24 175,561 27 200,772 30 658,173 100Others 15,516 26 9,865 17 11,023 18 23,642 39 60,046 100Segment results 645,544 21 750,676 24 727,288 23 982,510 32 3,106,018 100Unallocated corporate expenses 5,828 9 54,184 82 96,529 146 (90,564) (137) 65,977 100Operating profit 651,372 21 804,860 25 823,817 26 891,946 28 3,171,995 100
IOI CORPORATION BERHAD ANNUAL REPORT 2008
FIVE-YEAR FINANCIAL HIGHLIGHTS14
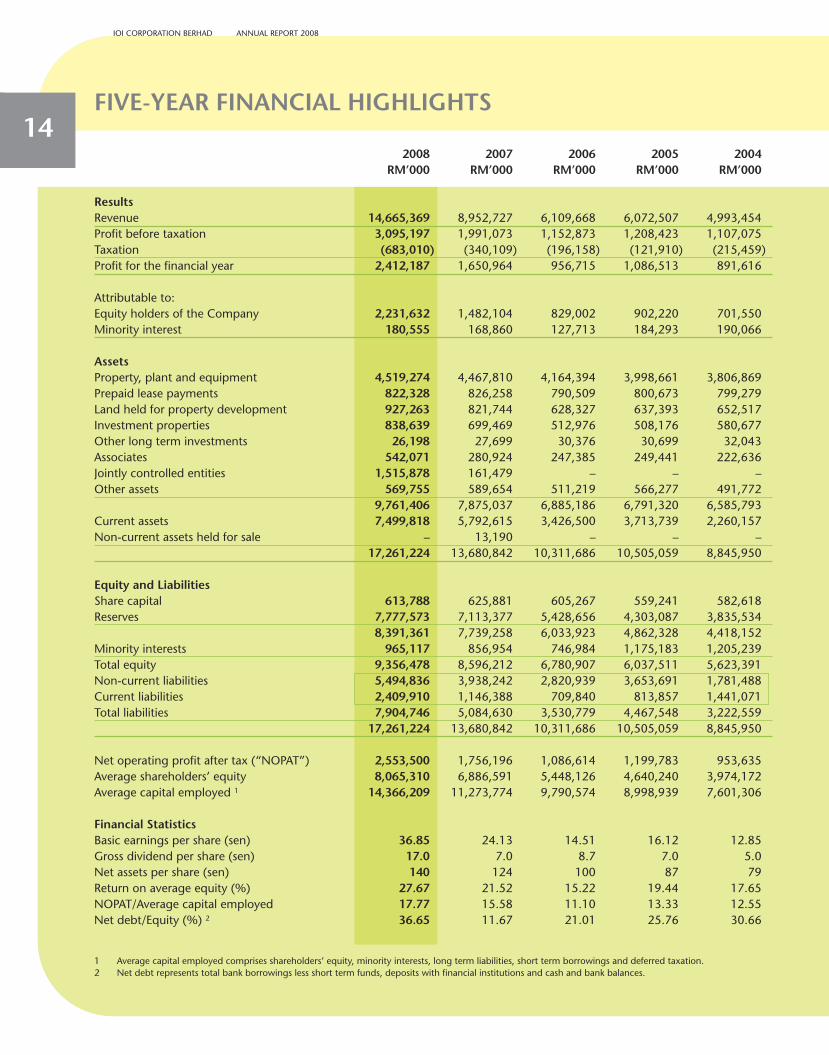
2008 2007 2006 2005 2004RM’000 RM’000 RM’000 RM’000 RM’000
ResultsRevenue 14,665,369 8,952,727 6,109,668 6,072,507 4,993,454Profit before taxation 3,095,197 1,991,073 1,152,873 1,208,423 1,107,075Taxation (683,010) (340,109) (196,158) (121,910) (215,459)Profit for the financial year 2,412,187 1,650,964 956,715 1,086,513 891,616
Attributable to:Equity holders of the Company 2,231,632 1,482,104 829,002 902,220 701,550Minority interest 180,555 168,860 127,713 184,293 190,066
AssetsProperty, plant and equipment 4,519,274 4,467,810 4,164,394 3,998,661 3,806,869Prepaid lease payments 822,328 826,258 790,509 800,673 799,279Land held for property development 927,263 821,744 628,327 637,393 652,517Investment properties 838,639 699,469 512,976 508,176 580,677Other long term investments 26,198 27,699 30,376 30,699 32,043Associates 542,071 280,924 247,385 249,441 222,636Jointly controlled entities 1,515,878 161,479 – – –Other assets 569,755 589,654 511,219 566,277 491,772
9,761,406 7,875,037 6,885,186 6,791,320 6,585,793Current assets 7,499,818 5,792,615 3,426,500 3,713,739 2,260,157Non-current assets held for sale – 13,190 – – –
17,261,224 13,680,842 10,311,686 10,505,059 8,845,950
Equity and LiabilitiesShare capital 613,788 625,881 605,267 559,241 582,618Reserves 7,777,573 7,113,377 5,428,656 4,303,087 3,835,534
8,391,361 7,739,258 6,033,923 4,862,328 4,418,152Minority interests 965,117 856,954 746,984 1,175,183 1,205,239Total equity 9,356,478 8,596,212 6,780,907 6,037,511 5,623,391Non-current liabilities 5,494,836 3,938,242 2,820,939 3,653,691 1,781,488Current liabilities 2,409,910 1,146,388 709,840 813,857 1,441,071Total liabilities 7,904,746 5,084,630 3,530,779 4,467,548 3,222,559
17,261,224 13,680,842 10,311,686 10,505,059 8,845,950
Net operating profit after tax (“NOPAT”) 2,553,500 1,756,196 1,086,614 1,199,783 953,635Average shareholders’ equity 8,065,310 6,886,591 5,448,126 4,640,240 3,974,172Average capital employed 1 14,366,209 11,273,774 9,790,574 8,998,939 7,601,306
Financial StatisticsBasic earnings per share (sen) 36.85 24.13 14.51 16.12 12.85Gross dividend per share (sen) 17.0 7.0 8.7 7.0 5.0Net assets per share (sen) 140 124 100 87 79Return on average equity (%) 27.67 21.52 15.22 19.44 17.65NOPAT/Average capital employed 17.77 15.58 11.10 13.33 12.55Net debt/Equity (%) 2 36.65 11.67 21.01 25.76 30.66
1 Average capital employed comprises shareholders’ equity, minority interests, long term liabilities, short term borrowings and deferred taxation.2 Net debt represents total bank borrowings less short term funds, deposits with financial institutions and cash and bank balances.
15
16
IOI CORPORATION BERHAD ANNUAL REPORT 2008

SUPPORTINGEXCELLENCE
2008, IO I ’s S tudentfinancial support to meet the
educational needs of underprivileged children and spur them toexcel in their studies. Some 262 students from 58 primary and 20
secondary schools in Peninsular Malaysia and Sabah have so far beenadopted to receive RM800 and a school bag every year until they
complete their primary or secondary school education. 1,789 childrenfrom HUMANA kindergartens also receive school bags and stationery.
Meanwhile, five secondary schools in or near our oil palm estates in Sabahhave been adopted under our School Adoption Programme, and now receive
financial assistance to upgrade their facilities inorder to provide a more conducive
study environment.
Launched in AprilAdoption Programme provides
17

18
INTRODUCTION
The purpose of this review is to highlight and provide brief insights on key financial and operating information at Group level.A more detail commentary on operating performance is covered under the respective business segment reports.
KEY FINANCIAL INDICATORS
FY2008 FY2007 Change %
Earnings before interest and taxation (“EBIT”) (RM million) 3,172.0 2,058.2 54Pre-tax earnings (RM million) 3,095.2 1,991.1 55Net earnings (RM million) 2,231.6 1,482.1 51Return on average equity (“ROE”) (%) 27.7 21.5 29Return on average capital employed (“ROCE”) (%) 17.8 15.6 14Net operating profit after taxation (“NOPAT”) (RM million) 2,553.5 1,756.2 45Economic profit (RM million) 955.8 842.7 13Total return to shareholders - Change in share price (RM) (per RM0.10 share) 2.25 2.34 (4)- Gross dividend (sen) (per RM0.10 share) 17.0 7.0 143Net cash flow generated from operation (RM million) 1,418.6 1,317.5 8Net Gearing (%) 37 12 208
IOI CORPORATION BERHAD ANNUAL REPORT 2008
MANAGEMENT’S DISCUSSION AND ANALYSISGROUP FINANCIAL REVIEW
19FINANCIAL HIGHLIGHTS & INSIGHTS
• At Group level, the results for FY2008 versus FY2007 is best compared and explained at three levels, mainly, EBIT, Pre-taxand Net Earnings, as different factors affected the changes between the two fiscal years at the respective levels.
• Looking at EBIT, contributions from the segments are as follows:
FY2008 Mix FY2007 Mix ChangeRM million % RM million % %
Plantation 1,835.9 58 926.9 45 98Downstream Manufacturing 658.2 21 405.4 20 62Palm Oil – Total 2,494.1 79 1,332.3 65 87Property 551.9 17 598.3 29 (8)Others (unallocated) 126.0 4 127.6 6 (1)
EBIT 3,172.0 100 2,058.2 100 54
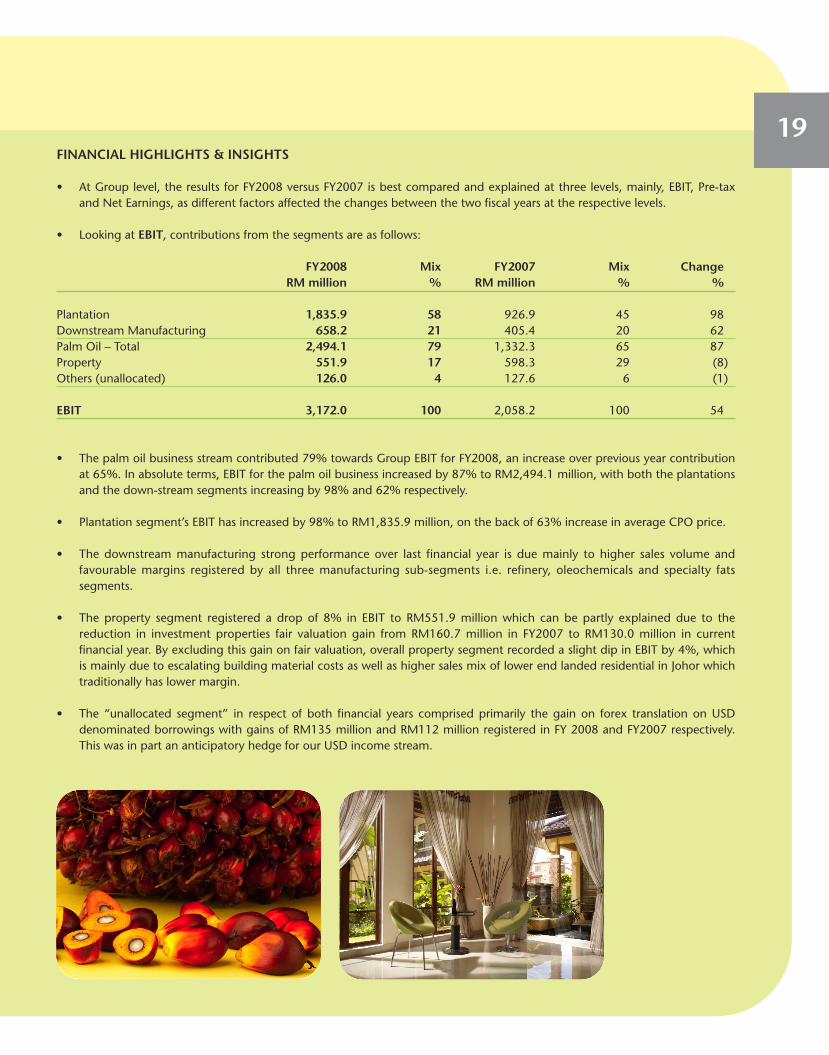
• The palm oil business stream contributed 79% towards Group EBIT for FY2008, an increase over previous year contributionat 65%. In absolute terms, EBIT for the palm oil business increased by 87% to RM2,494.1 million, with both the plantationsand the down-stream segments increasing by 98% and 62% respectively.
• Plantation segment’s EBIT has increased by 98% to RM1,835.9 million, on the back of 63% increase in average CPO price.
• The downstream manufacturing strong performance over last financial year is due mainly to higher sales volume andfavourable margins registered by all three manufacturing sub-segments i.e. refinery, oleochemicals and specialty fatssegments.
• The property segment registered a drop of 8% in EBIT to RM551.9 million which can be partly explained due to thereduction in investment properties fair valuation gain from RM160.7 million in FY2007 to RM130.0 million in currentfinancial year. By excluding this gain on fair valuation, overall property segment recorded a slight dip in EBIT by 4%, whichis mainly due to escalating building material costs as well as higher sales mix of lower end landed residential in Johor whichtraditionally has lower margin.
• The “unallocated segment” in respect of both financial years comprised primarily the gain on forex translation on USDdenominated borrowings with gains of RM135 million and RM112 million registered in FY 2008 and FY2007 respectively.This was in part an anticipatory hedge for our USD income stream.

20FINANCIAL HIGHLIGHTS & INSIGHTS CONT’D
• Pre-tax Earnings increased by 55% over last financial year. Net interest expense, has increased about 18% over previousfinancial year which is in tandem with the increase in Group gross borrowings by 64% due to the issuance of USD600million Exchangeable Bonds, a 30-year JPY6 billion term loan and SGD256 million term loan.
• At the Net Earnings level, profit attributable to shareholders increased by 51% to RM2,231.6 million.
• For FY2008, the Group recorded a Return on Equity (“ROE”) of 27.7% based on an average shareholders’ equity ofRM8.07 billion (FY2007 – RM6.89 billion), up from 21.5% for the previous financial year. The average over cycle ROE targetis 20%.
• Similarly, the Return on Average Capital Employed (“ROCE”) increased to 17.8% for FY2008, up from 15.6% for FY2007.This was due to higher net earnings although the denominator has also increased significantly because of the substantialworking capital requirement for the downstream operation.
• The Group strives to enhance ROE and ROCE by continuous improvement in operating performance and by activemanagement of its capital structure. Initiatives undertaken by the Group include increasing dividend pay-outs, share buy-back (and cancellation) program and a continuous review and adjustment of the Group’s debt gearing ratio having regardto maintaining stable credit ratings.
Equity reduction for purpose of capital management included the following:
FY2008 FY2007RM million RM million
Total dividend 913.3 319.0 Share buy-back 1,079.9 105.1
1,993.2 424.1
Capital repayment – 1,314.4
Total equity repayments 1,993.2 1,738.5
% to Net Earnings for the financial year 89% 117%
The Company targets an average equity payout of not less than 50% of net earnings.
IOI CORPORATION BERHAD ANNUAL REPORT 2008
MANAGEMENT’S DISCUSSION AND ANALYSIS CONT’DGROUP FINANCIAL REVIEW
21FINANCIAL HIGHLIGHTS & INSIGHTS CONT’D
• The Group generated an Operating Cash Flow of RM1,418.6 million for FY2008 against RM1,317.5 million for theprevious financial year. Free Cash Flow registered a marginal increase from RM1,164.2 million to RM1,188.4 million.
• Working Capital requirement for FY2008 increased by RM1.11 billion, notably, to fund increases in inventories and tradereceivables by RM1.03 billion and RM512.8 million respectively, which is in line with increase in volume of business andhigher palm oil prices.
• For FY2008, the Group spent a total of RM234.1 million (FY2007 – RM185.3 million) for Capital Expenditure (“Capex”).Cash outlay on acquisitions in FY2008 was however much higher at RM1,591.7 million (FY2007 – RM673.4 million) mainlyfor the funding of the Singapore Sentosa Development joint venture project which account for RM1.32 billion and theRM248.4 million for the acquisition of interests in plantation companies in Indonesia.
• The Group’s Shareholders’ Equity as at 30 June 2008 stood at RM8.39 billion, an increase of RM652.1 million or 8% overthe previous financial year. The increase was mainly due to net earnings for the financial year of RM2.23 billion and issue ofnew shares arose from the exchange of Exchangeable Bonds which totalled RM731.3 million. However, the increase wasoff-set by share buy-back totalling RM1.08 billion, capital repayment totalling RM1.31 billion and dividend payment inrespect of FY2008 amounting to RM314.7 million.
• The Group’s Net Interest Cover was 17.2 times (FY2007 – 14.8 times) but after adjusting differences between accountingand cash interest payment, the net interest cover was 26.4 times for FY2008 (FY2007 – 20.1 times).
• From an economic profit perspective, the Group achieved an economic profit [i.e. a surplus of Net Operating Profit AfterTax (“NOPAT”) over its Weighted Average Cost of Capital (“WACC”)] of RM955.8 million for FY2008, up 13% fromFY2007’s RM842.7 million. The significant increase is attributable to a higher NOPAT of RM2,553.5 million (FY2007 –RM1,756.2 million). The average WACC for FY2008 registered an increase over last financial year at 11.1% (FY2007 –8.1%).
• The higher WACC for the financial year just ended was due principally to a higher cost of equity as a result of higher marketrisk premium and hence a higher beta co-efficient applied in the computation of cost of equity.
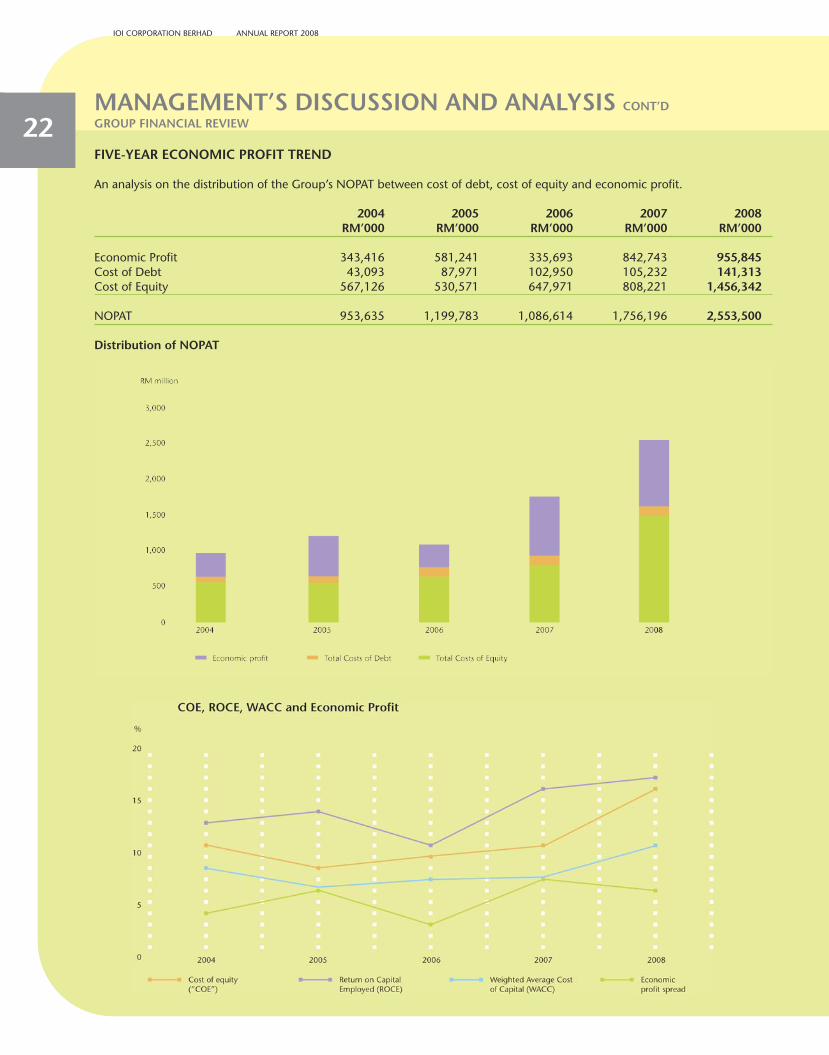
22FIVE-YEAR ECONOMIC PROFIT TREND
An analysis on the distribution of the Group’s NOPAT between cost of debt, cost of equity and economic profit.
2004 2005 2006 2007 2008RM’000 RM’000 RM’000 RM’000 RM’000
Economic Profit 343,416 581,241 335,693 842,743 955,845Cost of Debt 43,093 87,971 102,950 105,232 141,313Cost of Equity 567,126 530,571 647,971 808,221 1,456,342
NOPAT 953,635 1,199,783 1,086,614 1,756,196 2,553,500
Distribution of NOPAT
IOI CORPORATION BERHAD ANNUAL REPORT 2008
MANAGEMENT’S DISCUSSION AND ANALYSIS CONT’DGROUP FINANCIAL REVIEW

23FIVE-YEAR ECONOMIC PROFIT TREND CONT’D
The computations of COE, ROCE and Economic Profit were derived at based on the following parameters:
RISK MANAGEMENT
The Group has in place a formal risk management framework. Overall through strategic measures, consistent risk managementand continuous refinement, we are able to recognise and exclude fundamental dangers for IOI in the ordinary course of business.
Operating Risk Management
• Our participation in our core businesses, namely palm oil and properties, entails risks that arise in the ordinary course ofbusiness. Palm oil prices in particular, can be very volatile and can result in wide fluctuation in revenue and cash flow. Otherrisks include oleochemical and specialty fats products margin risk, changes in the property market and other operationalrisks. Our risk management philosophy is to exploit as fully as possible the many opportunities available in the markets weoperate in, while taking on only those risks that are necessarily associated with creating added economic value andensuring always a worthwhile risk-reward ratio. Risks that could not otherwise be managed to a satisfactory level on aproactive basis are strategically mitigated.
• In the case of palm oil, for instance, normal price fluctuations are manageable risks whilst unduly sharp fluctuations andcyclical trends are strategically mitigated by the Group’s positioning in different segments of the palm oil value chain,namely plantation, refinery, oleochemicals and specialty oils and fats. The Group’s exposure to different segments of thepalm oil chain also provides better visibility and enables better risk management execution that enhances value beyondmere balancing out the effects of price fluctuation.
• For the property segment the judicious selection of locations when acquiring land bank and the choice of product mixwhen making property sales launches during different phases of the property market cycles are the most crucial factors inmanaging market and operation risks.
• Control risks and other day-to-day operational risks are covered by the Group’s Enterprise Risk Management System. Risksof not meeting strategic objectives or performance targets are identified, evaluated and remedial action taken. The RiskManagement Committee of the respective business units formally reviews, update status and reports to the AuditCommittee on a quarterly basis.

24RISK MANAGEMENT CONT’D
Financial/Market Risk Management
• The Group’s operations which have expanded substantially in recent years expose it to a variety of financial risks, includingforeign currency risk, interest rate risk, market risk (including commodity price risk), credit risk, liquidity and cashflow risk.
• The Group’s overall financial risk management objective is to ensure that the Group creates value for its shareholders whilstminimising potential adverse effects on its financial performance and positions. Main consideration is on potential impacton risks to cash flows.
• The Group addresses the various financial risks exposure by taking pro-active measures within our established riskmanagement framework and clearly defined guidelines that are approved by the Board. In this respect, the Group entersinto forward contracts and exchange-traded agricultural commodity futures as well as commodity swap to hedge ourinventories, sale and purchase commitments. The effectiveness of hedges are periodically reviewed and limits for mandatory“cut loss” are set to limit commodity price exposures for all relevant operations.
• Besides, the Group also enters into interest rate derivative instruments with the objective of minimising overall cost ofborrowings over the tenure of the underlying borrowings. An appropriate mix of fixed and floating rates are taken aftergiving due consideration to current fixed rates level, forward scenario analysis and potential net cash flow fluctuation.
• Whenever possible, the Group favours taking a “natural hedge” approach as for instance, to have the same currency basein the risk management of its foreign currency denominated assets and liabilities and in respect of its income andexpenditure, for example, to have USD liabilities as hedge against the Group’s USD denominated palm oil income stream.
• Whenever appropriate, we also enter into forward foreign currency contracts to limit the Group’s exposure to fluctuation inforeign exchange rates with respect to our foreign currency denominated assets and liabilities as well as committed salesand purchases of commodity and other products.
• Credit risks and counter party risks are evaluated and managed at the level of the respective business units within theGroup’s prescribed framework.
The economic intent and impact of some of these risk management strategies may not be apparent from the accounts as themanner and timing in which these transactions are recognised and reflected in the accounts are in accordance with therequirements of approved accounting standards. In such instances, the Group takes the view that the underlying economicreality and objective should take precedent over reported accounting impact, when deciding if a hedge transaction is to betaken i.e. economic substance is more important than accounting form for risk management decision making.
For more disclosures on the Group’s financial risk management, refer to Note 44 of the financial statements included in thisAnnual Report.
Sensitivity Analysis
The main market risks impacting the profitability of the Group are commodity price risks and foreign currency risks. Theapproximate impact that movements in palm oil prices, downstream product margins and currency exposures could have onits operating profit for FY2008, based on its operating conditions, but excluding the impact of hedge transactions are astabulated below:
Impact (If unhedged)million
Change of RM100 per MT in CPO price ± RM70 Change of 10% in product margin over FY2008for refining, oleochemicals, speciality fats ± RM120
10% change in the USD/RM exchange rate ± RM130 10% change in the Euro/RM exchange rate ± RM70
IOI CORPORATION BERHAD ANNUAL REPORT 2008
MANAGEMENT’S DISCUSSION AND ANALYSIS CONT’DGROUP FINANCIAL REVIEW
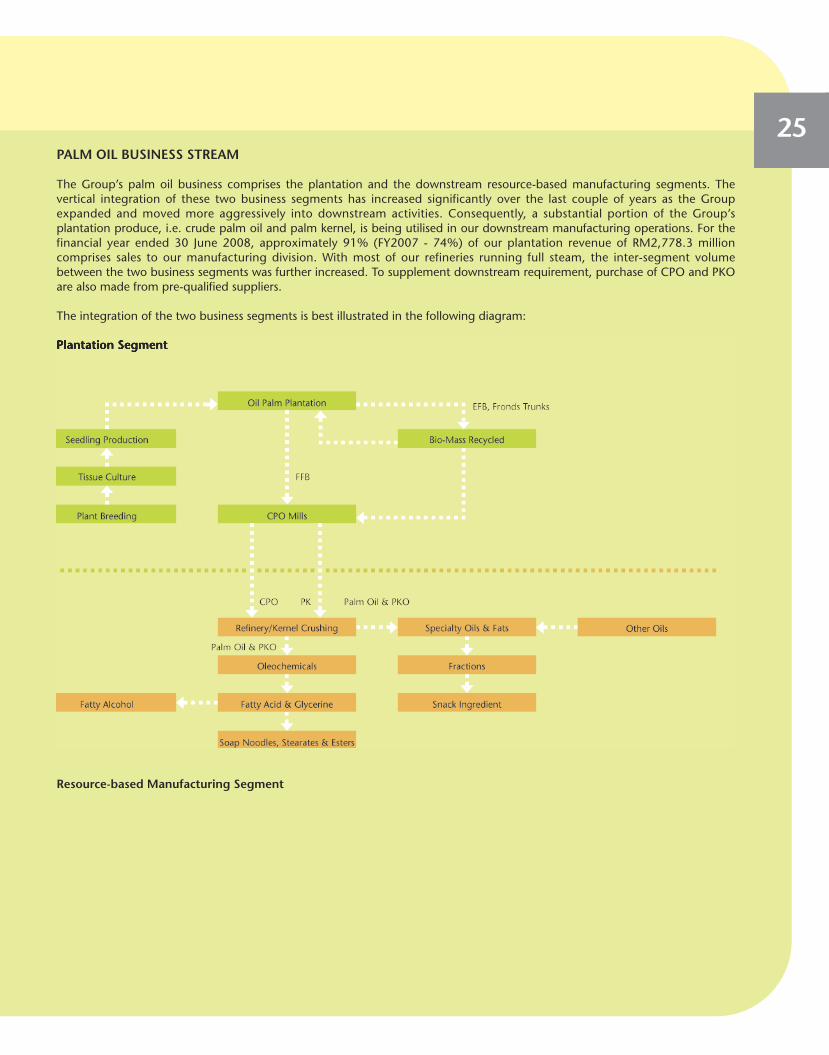
25PALM OIL BUSINESS STREAM
The Group’s palm oil business comprises the plantation and the downstream resource-based manufacturing segments. Thevertical integration of these two business segments has increased significantly over the last couple of years as the Groupexpanded and moved more aggressively into downstream activities. Consequently, a substantial portion of the Group’splantation produce, i.e. crude palm oil and palm kernel, is being utilised in our downstream manufacturing operations. For thefinancial year ended 30 June 2008, approximately 91% (FY2007 - 74%) of our plantation revenue of RM2,778.3 millioncomprises sales to our manufacturing division. With most of our refineries running full steam, the inter-segment volumebetween the two business segments was further increased. To supplement downstream requirement, purchase of CPO and PKOare also made from pre-qualified suppliers.
The integration of the two business segments is best illustrated in the following diagram:
Plantation Segment
Resource-based Manufacturing Segment
PLANTATION
26
IOI CORPORATION BERHAD ANNUAL REPORT 2008
MANAGEMENT’S DISCUSSION AND ANALYSIS GROUP BUSINESS REVIEW

27INTRODUCTION
As at 30 June 2008, the Group’s total titled plantation area, stood at 169,369 hectares (FY2007:169,450 hectares) withapproximately 99% of the estates’ planted area is being planted with oil palm. As for the Indonesian plantation land ofapproximately 66,000 hectares, the transfer of land titles to our Indonesian subsidiaries is still in progress.
The Group has 80 estates, about the same number from last financial year. The total oil palm planted area as at the end of thefinancial year under review stood at 149,445 hectares, an increase of 574 hectares from the previous financial year end.Approximately 68% of the Group’s plantation holdings are in the state of Sabah and Sarawak with the remaining 32% inPeninsular Malaysia, mainly in the central and southern parts of the Peninsular. The Group’s plantation produce are principallyprocessed by its own 12 palm oil mills with an annual milling capacity of approximately 4,000,000 tonnes of fresh fruitbunches (“FFB”).
The Group’s plantation business strong growth in a short span of 25 years since 1983 was achieved not just throughacquisitions whenever opportunities arises, but also because of its distinctive plantation management practices that emphasisegreatly on continuous improvement in yields and in cost efficiencies which enable us to be one of the most cost effectiveproducers in the industry. Our achievement on productivity is the result of years of concerted effort and commitment to goodplantation management practices.
Our quality commitment approach in the plantation sector begins with the use of superior planting materials to ensure highoil yield as well as quality of the palm oil produced. We have a dedicated research team focused on improving FFB yields, theoil and kernel extraction rates and carrying out research involving tissue culture to cultivate seedlings with superior traits. Webelieve that this helps ensure the high yield of our palm oil and helps ensure optimum sustainability of our oil palm business.
The yield from oil palm plantation also depends on other factors such as soil and climatic conditions, the quality of plantationmanagement, and harvesting and processing of the fresh palm fruit bunches at the optimum time. In this respect, hands-onmanagement, proactive attitude and attention to detail have contributed to higher productivity. In addition, we also have ateam of in-house agronomists to conduct various analysis and studies with the objective of ensuring quality palms and fruits,including studies on palm oil nutrient status, palm appearance, ground conditions, pests and diseases affecting palms, pruningmethods and etc to ensure that best practices for sustainable agriculture are practised by the Group.
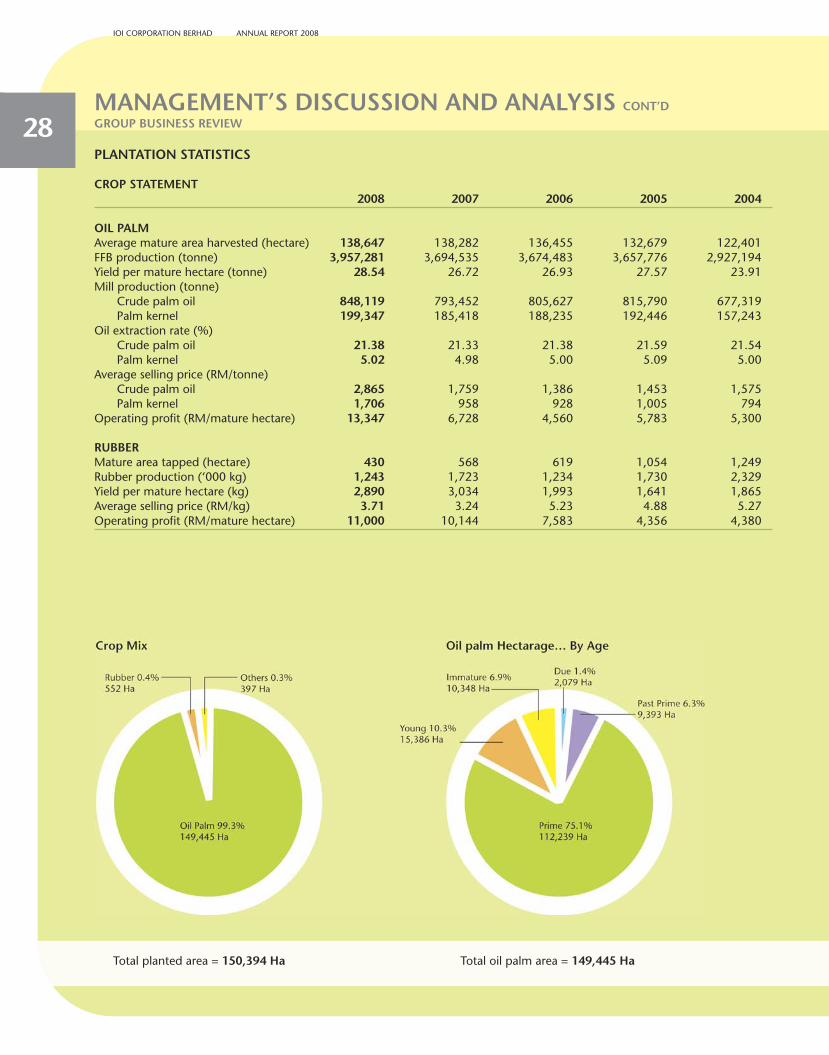
28PLANTATION STATISTICS
CROP STATEMENT2008 2007 2006 2005 2004
OIL PALMAverage mature area harvested (hectare) 138,647 138,282 136,455 132,679 122,401FFB production (tonne) 3,957,281 3,694,535 3,674,483 3,657,776 2,927,194Yield per mature hectare (tonne) 28.54 26.72 26.93 27.57 23.91Mill production (tonne)
Crude palm oil 848,119 793,452 805,627 815,790 677,319Palm kernel 199,347 185,418 188,235 192,446 157,243
Oil extraction rate (%)Crude palm oil 21.38 21.33 21.38 21.59 21.54Palm kernel 5.02 4.98 5.00 5.09 5.00
Average selling price (RM/tonne)Crude palm oil 2,865 1,759 1,386 1,453 1,575Palm kernel 1,706 958 928 1,005 794
Operating profit (RM/mature hectare) 13,347 6,728 4,560 5,783 5,300
RUBBERMature area tapped (hectare) 430 568 619 1,054 1,249Rubber production (‘000 kg) 1,243 1,723 1,234 1,730 2,329Yield per mature hectare (kg) 2,890 3,034 1,993 1,641 1,865Average selling price (RM/kg) 3.71 3.24 5.23 4.88 5.27Operating profit (RM/mature hectare) 11,000 10,144 7,583 4,356 4,380
IOI CORPORATION BERHAD ANNUAL REPORT 2008
MANAGEMENT’S DISCUSSION AND ANALYSIS CONT’DGROUP BUSINESS REVIEW
Total planted area = 150,394 Ha Total oil palm area = 149,445 Ha
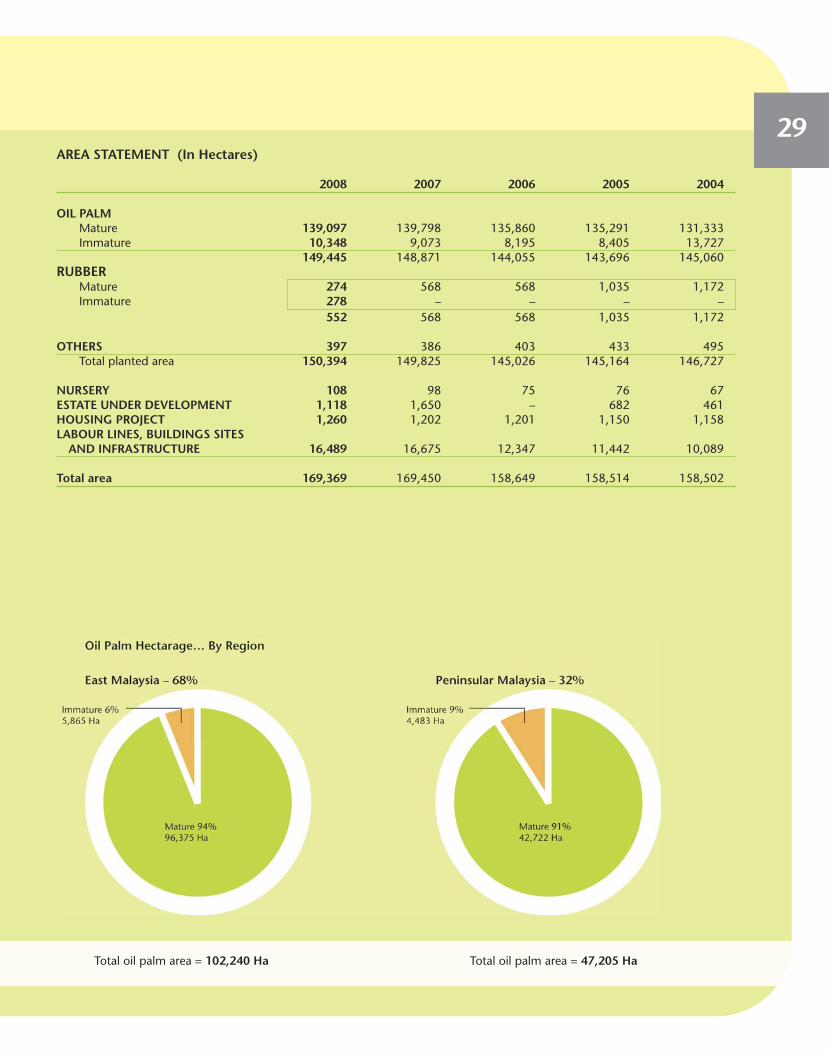
29AREA STATEMENT (In Hectares)
2008 2007 2006 2005 2004
OIL PALMMature 139,097 139,798 135,860 135,291 131,333Immature 10,348 9,073 8,195 8,405 13,727
149,445 148,871 144,055 143,696 145,060RUBBER
Mature 274 568 568 1,035 1,172Immature 278 – – – –
552 568 568 1,035 1,172
OTHERS 397 386 403 433 495Total planted area 150,394 149,825 145,026 145,164 146,727
NURSERY 108 98 75 76 67ESTATE UNDER DEVELOPMENT 1,118 1,650 – 682 461HOUSING PROJECT 1,260 1,202 1,201 1,150 1,158LABOUR LINES, BUILDINGS SITES
AND INFRASTRUCTURE 16,489 16,675 12,347 11,442 10,089
Total area 169,369 169,450 158,649 158,514 158,502
Total oil palm area = 102,240 Ha Total oil palm area = 47,205 Ha
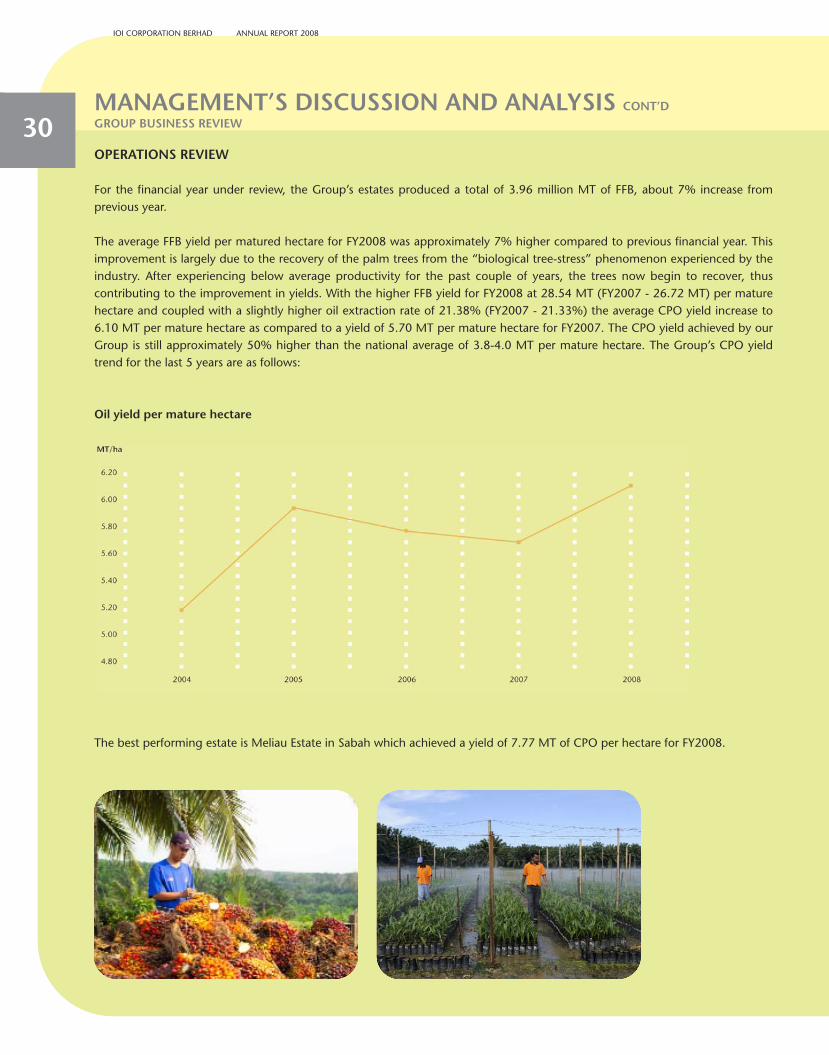
30OPERATIONS REVIEW
For the financial year under review, the Group’s estates produced a total of 3.96 million MT of FFB, about 7% increase fromprevious year.
The average FFB yield per matured hectare for FY2008 was approximately 7% higher compared to previous financial year. Thisimprovement is largely due to the recovery of the palm trees from the “biological tree-stress” phenomenon experienced by theindustry. After experiencing below average productivity for the past couple of years, the trees now begin to recover, thuscontributing to the improvement in yields. With the higher FFB yield for FY2008 at 28.54 MT (FY2007 - 26.72 MT) per maturehectare and coupled with a slightly higher oil extraction rate of 21.38% (FY2007 - 21.33%) the average CPO yield increase to6.10 MT per mature hectare as compared to a yield of 5.70 MT per mature hectare for FY2007. The CPO yield achieved by ourGroup is still approximately 50% higher than the national average of 3.8-4.0 MT per mature hectare. The Group’s CPO yieldtrend for the last 5 years are as follows:
Oil yield per mature hectare
The best performing estate is Meliau Estate in Sabah which achieved a yield of 7.77 MT of CPO per hectare for FY2008.
IOI CORPORATION BERHAD ANNUAL REPORT 2008
MANAGEMENT’S DISCUSSION AND ANALYSIS CONT’DGROUP BUSINESS REVIEW

31OPERATIONS REVIEW CONT’D
In line with the increase in Group CPO yield, the number of estates that managed to achieve oil yields of more than 6 MT permature hectare has increased from 37 estates in FY2007 to 47 estates for the financial year under review, the reasons were asexplained in the foregoing paragraph. The trend over the last five years are as follows:
Estates that achieved >6 MT of CPO per hectare
No. of Estates Area (hectares)
FY2008 47 89,021
FY2007 37 69,407
FY2006 38 72,436
FY2005 41 73,859
FY2004 12 22,410
Roll of Honour
Estates that achieved >7 MT of CPO per hectare
The following estates achieved more than 7 MT of CPO per hectare in FY2008.
MT/hectare
Meliau 7.77Sakilan Estate 7.69Baturong 3 7.54Baturong 2 7.51Laukin Estate 7.46Syarimo 3 7.46Sg. Sapi 7.44Mayvin 1 7.36Tangkulap 7.33Permodalan 2 7.32Syarimo 1 7.30Syarimo 2 7.25Syarimo 6 7.23Luangmanis 7.21Mayvin 2 7.19Sagil 7.17Jasin Lalang 7.10Moynod 7.07Permodalan 4 7.06

32OPERATIONS REVIEW CONT’D
For FY2008, the Group’s plantation business recorded an operating profit of RM1,835.9 million, an increase of 98% overFY2007’s RM926.9 million. The increase in profit is largely due to the effects of higher palm prices as well as higher yields whichmore than offset the negative impact from the newly imposed cooking oil cess on palm oil sales beginning 1 June 2007.
The cess and tax for the financial year are as follows:
FY2008 FY2007RM’000 RM’000
MPOB cess 12,721 11,901Rubber – –Cooking oil cess 125,355 6,244
138,076 18,145Sabah sales tax 137,235 80,704
275,311 98,849
Operating profit per mature hectare for oil palm increased by 98% to RM13,347 per hectare for the financial year under reviewas compared to RM6,728 per hectare for the previous financial year.
For capital expenditure, the Division spent a total of RM64.0 million for FY2008 as compared to RM62.1 million for the previousfinancial year. The capital expenditure is primarily incurred on new planting, staff quarters, road and bridges and agriculturalequipment. As for replanting expenditure, RM20.9 million was charged out to the income statement for the financial year justended compared to RM18.6 million for the previous financial year.
IOI CORPORATION BERHAD ANNUAL REPORT 2008
MANAGEMENT’S DISCUSSION AND ANALYSIS CONT’DGROUP BUSINESS REVIEW

33OPERATIONS REVIEW CONT’D
OUTLOOK & PROSPECTS
Prices of edible oils are generally expected to soften in 2008/2009 in line with the global decline in commodity prices.Production of oilseeds and palm oil are set to recover next year boosted by better inputs and higher plantings. Notwithstandingthis, palm oil prices are still expected to remain relatively attractive, especially for an efficient producer.
Meanwhile, overall market will continue to be underpinned by high crude oil prices whilst higher mandates for biodiesel willtighten the world supply and demand balances. The recent sharp decline in palm oil prices and the present big discount tosoyoil will certainly stimulate global consumption of palm oil in both the food and energy markets.
In any case, the Group is well-positioned to increase its plantation earnings in FY2009 as it has taken advantage of the bullish palmoil market during the second half of FY2008 to forward-sell a substantial portion of its FY2009 production at very good prices.

CORPORATESOCIAL RESPONSIBILITY
34
IOI CORPORATION BERHAD ANNUAL REPORT 2008
MANAGEMENT’S DISCUSSION AND ANALYSIS CONT’DGROUP BUSINESS REVIEW

35CORPORATE SOCIAL RESPONSIBILITY
The IOI Group’s Corporate Social Responsibility (“CSR”) principle is encoded in our “Vision IOI” whereby the emphasis is onachieving commercial success in a balanced, responsible manner by addressing the interests of all stakeholders.
Last year in our annual report, IOI commented on the actions taken at several of our operating units and their efforts to improvethe environmental “footprint” of these factories through the reduction in the use of gas, water, and electricity. This year wehave widened our program and will begin reporting on a number of our key environmental initiatives on consolidated basis forall of our operating groups. In addition, we will provide an update on our initiatives to enhance the social aspects of ouroperation. We will also provide an update on our activities supporting the Roundtable on Sustainable Palm Oil (“RSPO”) andthe start of certification under this important global initiative.
ENVIRONMENT
Care for the environment is a global concern and it is also certainly a key concern for IOI. After all, the very foundation of ourbusiness is based upon proper treatment of the land as well as the people and nature that falls under our care. We take thisresponsibility very seriously.
We have chosen to report on our environmental impact in 3 important areas: CO2 emissions, water consumption, and electricityconsumption. These are the 3 areas where we feel IOI can have the biggest impact as we implement our improvementprograms. In addition, we will highlight other initiatives that we believe are important to environmentally sustainabledevelopment.
CO2 emissions for IOI totalled to around 526,000 MT annually. As reflected inthe CO2 Emissions chart, the majority of these emissions come from theoperation of our milling operations within the plantation group.
Nearly 50% of IOI’s total CO2 emissions originate from the use of renewablebiomass at our mills to generate steam for oil extraction from the palm fruit.This biomass originates from the fiber and shells of the oil palm grown in ourown estates. Nearly 98% of our fuel consumption for steam generation at ourmills now comes from these renewable resources. This initiative hascontributed towards a significant reduction in fossil fuel consumption.
IOI is also actively investigating various methods to reduce methane emissionsfrom our waste water ponds. We have initiated a pilot plant project with themost promising of these methods and expect to have results from this trial inthe coming year.

36ENVIRONMENT CONT’D
Water usage totalled to around 12,600,000 m3 annually for all IOI businesses.The majority of the water used by IOI is consumed in our plantation group.Water used by this group is principally for the process of extracting oil fromthe palm fruit as well as for general purposes necessary to run the estates. Itis notable that 81% of IOI’s water use originates from non potable sources.Our oil refineries utilise water principally to cool processes for the productionof the wide variety of products produced for the food industry. After propertreatment and full compliance with all environmental regulations the watercan then be returned to the waterways.
Electricity consumption for IOI totalled to around 150,000,000 KwH annually.Electricity consumption by our palm oil refineries represents the major portionof the company’s requirements. These factories require relatively largeamounts of electricity for technical process equipment as well as for oilmovements throughout the factories. Active reduction programs are alreadyin place and are delivering impressive results for the environment and thebottom line as illustrated in the 2007 Annual Report.
IOI CORPORATION BERHAD ANNUAL REPORT 2008
MANAGEMENT’S DISCUSSION AND ANALYSIS CONT’DGROUP BUSINESS REVIEW

37ENVIRONMENT CONT’D
Environmental Initiatives
• Roundtable on Sustainable Palm Oil (RSPO)
This global initiative, conceived by World Wildlife Fund (“WWF”), operates on a multi-stakeholder format and is committedto the certification of oil palm growers who meet the strict RSPO principles and criteria covering the social andenvironmental development requirements for the production and use of sustainable palm oil.
IOI is a founding member of the RSPO and is an active contributor through our current position on the Executive Boardrepresenting the processors. In November 2007, IOI chaired the session on supply chain development at the RSPO GlobalMeeting.
The preparation and training for RSPO certification program has already been carried out within most of our 80 IOI estates.IOI is among the first 3 companies to begin certification process under the RSPO program. IOI has committed to 100%certification of all holdings with a planned timetable of 3 years.
We take our responsibility as an industry leader seriously and will encourage others in our industry to promote sustainablepractices. We have commenced scoping audits of external IOI supply base against RSPO principles and criteria. As we growour business, we are committed to only developing new holdings under RSPO principles and criteria with the intent tocertify as soon as practical. Where IOI Group has invested in other plantation groups and does not have direct control ofoperations, we will utilise our investor position to assist our partners in development under the RSPO principles and criteria.Where concerns are raised concerning our operations, we will continue to take prompt action on our own initiative as wellas following guidance given by the RSPO principles and criteria as appropriate.

38ENVIRONMENT CONT’D
• ISO Certification
- Loders Croklaan Wormerveer and Rotterdam facilities have been both ISO 14001 certified.- IOI Oleochemical Industries Berhad has been ISO 14001and OHSAS 18001 certified.
• Other IOI Environmental Initiatives
- IOI Oleochemical Industries Berhad has also received a “Responsible Care” code of practice award (Responsible CareProgram under Chemical Industries Council of Malaysia).
- Yield performance of IOI plantations is 50% more productive than the industry average. When applied to our developedestates this represents a reduction in the land area needed to supply our markets by more than 70,000 hectares.
- Working cooperatively with WWF, IOI has restored an important riparian area in Sabah planting native species purchasedfrom local growers.
Social Initiatives
At IOI, we place a very high value on education and human capital development for the nation, especially our employees andtheir children.
For example, IOI continues to support important works conducted by the Borneo Child Aid Society, Sabah (HUMANA) and theircreation of 51 schools for the children of plantation workers in Sabah. We are the main contributor which sponsors 22 of theseHUMANA schools and is very proud of our association with this worthy organisation.
Under the Yayasan Tan Sri Lee Shin Cheng (“Yayasan”), a charitable foundation fully sponsored by IOI Group of Companies,various scholarships and bursaries have been provided to outstanding students pursuing degree courses in recognised localinstitutions of higher learning in disciplines related to Agriculture and the Oil Palm Manufacturing industry. Career opportunitieswithin IOI Group are given to these students after they graduate from their studies.
IOI CORPORATION BERHAD ANNUAL REPORT 2008
MANAGEMENT’S DISCUSSION AND ANALYSIS CONT’DGROUP BUSINESS REVIEW
39ENVIRONMENT CONT’D
Yayasan also initiated the Young Achievers’ Award with the aim to invigorate and motivate young students from rural areas tostrive for excellence in their studies. These awards, totalling RM582,000 in 2007, are given out annually to outstanding studentswho excel in both academic studies and extra-curriculum activities and may become our country’s leaders of tomorrow.
The Student Adoption Programme was launched in 2008 with the aim to provide financial assistance to underprivilegedstudents in order to sustain their educational needs and spur them to excel in their studies. Under this project, IOI has“adopted” 262 students from 78 schools from both Peninsular Malaysia and Sabah. Each of the students will receive RM800plus a new school bag every year.
In our support to the local community, IOI has adopted five schools located in or near our oil palm estates in Sabah under theSchool Adoption Programme. Financial assistance was given to these schools to assist them in upgrading their infrastructuresso as to provide a more conducive study environment for their students.
IOI also undertook the construction of a new Chinese school in Bandar Puchong Jaya, Selangor at its sole cost of RM7 million.The school was officially handed over to the Minister of Education during an official opening by the Prime Minister of Malaysiain November 2007.
In our effort to help native groups, we have embarked on an educational development programme in Sarawak, called theLawas Project with the World Vision Malaysia. IOI is funding the curriculum and supporting the infrastructure development ofthe ethnic Lunbawang and Tagal community in Sarawak.
At IOI Group, we are proud of our efforts to better the environment and the lives of those in and around our company. We willendeavor to continue to improve on our performance each and every year and to build on our platform toward excellence inenvironmental and social development.

MANUFACTURING
40
IOI CORPORATION BERHAD ANNUAL REPORT 2008
MANAGEMENT’S DISCUSSION AND ANALYSIS CONT’DGROUP BUSINESS REVIEW
41INTRODUCTION
The Group’s resource-based manufacturing business is essentially the segment of our palm oil business that follows after theplantation segment and comprises mainly refining of palm oil, processing of refined palm oil into oleochemicals and specialtyoils and fats. Crude palm oil and palm kernel oil are processed into products that are used in various industries including food,personal care, households, pharmaceutical, cosmetics and chemical industries.
REFINING
As at 30 June 2008, the Group has four refineries with total refining capacity of 3,350,000 MT, i.e. one in Sabah with a refiningcapacity of 1.2 million MT and kernel crushing capacity of 300,000 MT per annum, two refineries in Johor, with a combinedannual refining capacity of 1.3 million MT and the fourth is located in Rotterdam, Netherlands, with a refining capacity ofapproximately 850,000 MT per annum.
The Rotterdam refinery, which started operating in Oct 2005 provides Loders Croklaan Europe with fresh palm oil for itsdownstream operations, and also enables the Group to channel its crude palm oil to the European market for value added sales,utilising Loders Croklaan’s established distribution network and market standing.
As for the three Malaysian based refineries, they cover the rapidly growing Asian market as well as supporting the needs ofLoders Croklaan, USA.
OLEOCHEMICALS MANUFACTURING
The principal products of the IOI Oleochemical Division (“Oleo Division”) include fatty acids, glycerine, soap noodles and fattyesters. These versatile products are used in a wide variety of applications, including manufacturing of detergents, surfactants,shampoo, soaps, cosmetics, pharmaceutical products, food additives and plastics. The products are exported to more than 60countries worldwide, particularly to Europe, Japan and China. Its customers include some of the world’s largest multi-nationalcorporations.
The oleochemicals manufacturing activities are undertaken through the Oleo Division comprising our 100% owned subsidiariesnamely the IOI Oleochemical Industries Berhad and the newly acquired Pan-Century group of companies. With a combinedtotal capacity of 710,000 MT, the IOI Oleochemical Division is now the leading vegetable-based oleochemical producer in theworld. The manufacturing sites of Oleo Division are strategically located in Penang and Johor with direct access to key ports inButterworth and Pasir Gudang.
During the period under review, the Oleo Division has successfully integrated the overall supply chain and streamlined itsproduct branding. Apart from attaining greater economies of scale, the division is able to meet and satisfy various customerneeds to a higher degree. All these certainly augur well for our business philosophy to strategically develop our customers intolong term partnership.

42OLEOCHEMICALS MANUFACTURING CONT’D
Being a world class player, our manufacturing facilities are the recipient of numerous awards and recognitions at national andinternational levels. The Oleo Division prides itself with highly renowned certifications and accreditations in various areas ofquality and international standards compliance. These achievements reinforce our commitment to quality, environmentalprotection, occupational health and safety in line with best practices.
A significant portion of Oleo Division’s production is sold to multi-national customers under long term supply contracts. Tobetter serve its wide geographical distribution of customers, this division is represented by an extensive network ofdistributors and agents all over the world. It also has bulk storage facilities in Europe, Japan and the United States to ensureavailability of supply.
SPECIALTY OILS AND FATS MANUFACTURING
The Specialty Oils and Fats business of the Group is carried out by Loders Croklaan which has manufacturing operations in theNetherlands, the United States, Malaysia, Egypt and Canada, and sales offices in eight other countries with sales to more than85 countries worldwide. It has one of the most developed specialty oils and fats technology base in the industry with acorporate history tracing back to 1891, and is a global market leader in its field.
At Loders Croklaan, we continuously strive to be at the forefront of technical developments and innovations in the field of oilsand fats. This involves developing innovative products, improving processes, researching new areas and increasing expertise inorder to create added value for our customers.
On the operating structure, Loders Croklaan is organised into two main divisions, namely Specialty Oils and Fats and LipidNutrition. A brief summary of these two divisions are as follows:
Specialty Oils and Fats
The Specialty Oils and Fats unit is the principal business of Loders Croklaan, supplying fractionated oils, mainly coating fats, fillingfats or high stability oils to the processed food industry globally, principally for confectionery and bakery application. Currently,Loders Croklaan’s most important market is North Western Europe which is the world’s biggest consumer of specialty fats wherethe majority of sales of specialty fats are to chocolate manufacturers in the form of cocoa butter equivalents (CBE), cocoa butterreplacers (CBR) and cocoa butter substitutes (CBS). Loders Croklaan’s other markets include Eastern Europe, the US, Canada,Central and Latin America, Egypt, the Middle East countries, China, Japan, Korea, India and South East Asia. Loders Croklaan Asia,provides the much needed competitive cost base, for entry into the rapidly expanding Asian specialty fats market.
As for the US operations, the advent of the trans fatty acid issue provided an excellent opportunity for the Group’s palm-basedoperations to penetrate the US market and leverages on its technical expertise on palm attributes to introduce palm-basedsolution into the non-trans fatty acid applications market in USA.
IOI CORPORATION BERHAD ANNUAL REPORT 2008
MANAGEMENT’S DISCUSSION AND ANALYSIS CONT’DGROUP BUSINESS REVIEW

43SPECIALTY OILS AND FATS MANUFACTURING CONT’D
Lipid Nutrition
Lipid Nutrition is the other business unit of Loders Croklaan, which was started in 1999. This business was developed from thelipid technology of the Specialty Oils and Fats division, by utilising Loders Croklaan’s understanding of the functionality and thenutritional properties of components to build a new business to diversify its product range and earning base. Lipid Nutritionmanufactures and sells active ingredients for use in the supplements, such as pills and capsules, focusing on three key areasnamely conjugated linoleic acid marketed under the brandname “Clarinol”, Omega-3 fatty acids marketed under the name“Marinol” and gamma linoleic acid which is marketed under the name “Gammonal”. In addition, Lipid Nutrition also producesinfant formulae products marketed under the name Betapol.
OPERATIONS REVIEW
The oleochemicals sub-segment, the business, contributed a total of RM231.3 million to Group operating profit for FY2008,about doubled over last financial year results of RM128.4 million. This was achieved through volume growth as well asimprovement in margins.
The refinery and specialty fats combined contributions increased from RM277.0 million in FY2007 to RM426.9 million inFY2008. The refinery and specialty fats business contributed higher profits in FY2008 because of higher refining margins as wellas volume growth, benefiting from increased demand for food processing needs, non “trans fats” application and higherCBE/CBS demand.
On the whole, the downstream business have benefited from an efficient supply chain management, superior price riskmanagement and the value of traceability that we can offer to customers.
OUTLOOK & PROSPECTS
The downstream operation is expected to face challenging times ahead due to the increase in utilities and other input costs.Nevertheless, given the aforesaid competitive advantage that we enjoy, we expect to see good performance from ourmanufacturing business in FY2009.
MANAGEMENT’S DISCUSSION AND ANALYSIS44
IOI CORPORATION BERHAD ANNUAL REPORT 2008
MANAGEMENT’S DISCUSSION AND ANALYSIS CONT’DGROUP BUSINESS REVIEW
PROPERTIES

45INTRODUCTION
The Group’s property business is principally carried out by the Company’s 76% owned listed property arm, IOI PropertiesBerhad. The main stream of the property business is the development activities that contributed approximately 88% of theoverall property business’s operating profit (excluding fair value gains on investment properties). Besides, the Group is alsoinvolved in property investment and most of the investment properties held by the Group are mainly in respect of retailcomplexes and office buildings developed as part of our township development.
Over the years, the Group has been reputed as a successful township developer with our mainstay being the Puchong growthcorridor and southern Johor. As at 30 June 2008, our main ongoing property development projects and the status of theirdevelopment are as follows:
EstimatedYear Of Original Gross
Development land size DevelopmentProjects Commencements (Hectares) Status Value
Bandar Puchong Jaya 1990 374 Approaching RM3.0 billioncompletion
Bandar Puteri Puchong 2000 374 Ongoing RM4.0 billionIOI Resort 1995 37 Ongoing RM0.5 billionBandar Putra Kulai 1995 2,299 Ongoing RM8.0 billionTmn Lagenda Putra, Kulai 2006 91 Ongoing RM0.5 billionDengkil Land 2008 217 Expected RM2.0 billion
lauchingin FY2009/10
The table below sets forth certain information with respect to the performance of our property development business:
2008 2007 2006 2005 2004
Units of property sold 1,934 1,529 1,524 1,822 3,010Total sales (RM’000) 696,743 683,471 570,842 549,213 713,677Revenue (RM’000) 755,066 706,858 623,778 587,848 685,189EBIT (RM’000) 369,673 397,171 331,350 295,249 315,487EBIT margin (%) 48.96 56.19 53.12 50.23 46.04
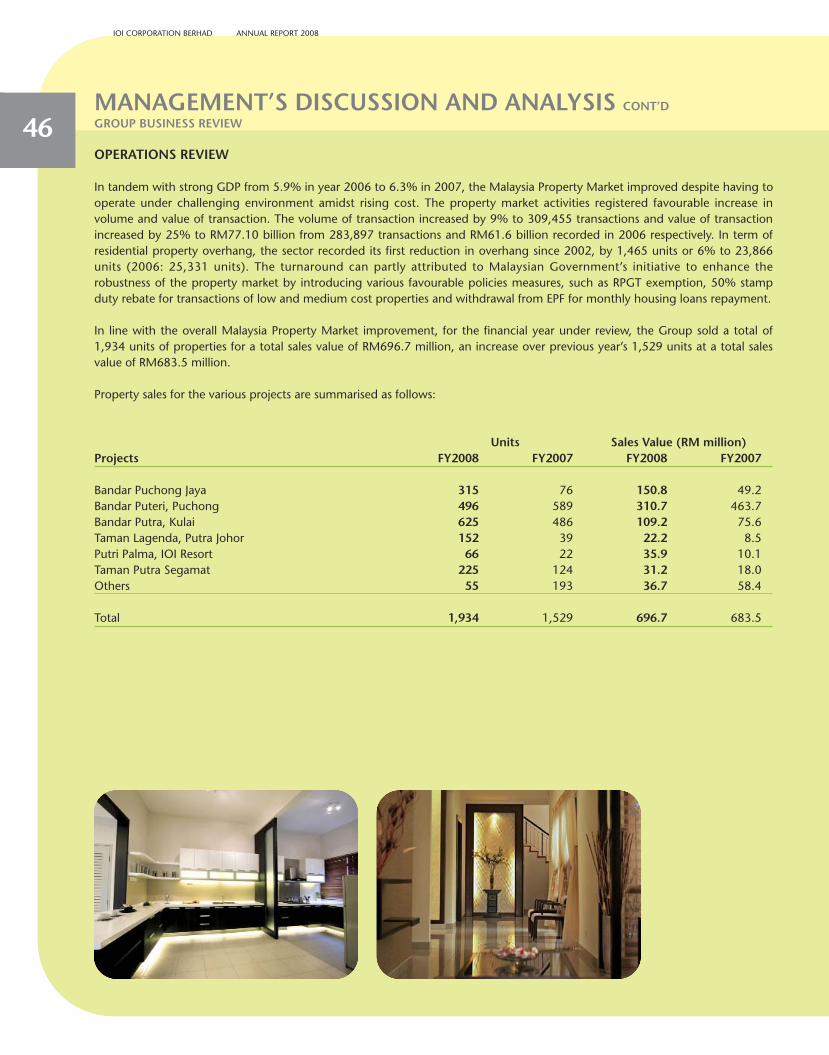
46OPERATIONS REVIEW
In tandem with strong GDP from 5.9% in year 2006 to 6.3% in 2007, the Malaysia Property Market improved despite having tooperate under challenging environment amidst rising cost. The property market activities registered favourable increase involume and value of transaction. The volume of transaction increased by 9% to 309,455 transactions and value of transactionincreased by 25% to RM77.10 billion from 283,897 transactions and RM61.6 billion recorded in 2006 respectively. In term ofresidential property overhang, the sector recorded its first reduction in overhang since 2002, by 1,465 units or 6% to 23,866units (2006: 25,331 units). The turnaround can partly attributed to Malaysian Government’s initiative to enhance therobustness of the property market by introducing various favourable policies measures, such as RPGT exemption, 50% stampduty rebate for transactions of low and medium cost properties and withdrawal from EPF for monthly housing loans repayment.
In line with the overall Malaysia Property Market improvement, for the financial year under review, the Group sold a total of1,934 units of properties for a total sales value of RM696.7 million, an increase over previous year’s 1,529 units at a total salesvalue of RM683.5 million.
Property sales for the various projects are summarised as follows:
Units Sales Value (RM million)Projects FY2008 FY2007 FY2008 FY2007
Bandar Puchong Jaya 315 76 150.8 49.2Bandar Puteri, Puchong 496 589 310.7 463.7Bandar Putra, Kulai 625 486 109.2 75.6Taman Lagenda, Putra Johor 152 39 22.2 8.5Putri Palma, IOI Resort 66 22 35.9 10.1Taman Putra Segamat 225 124 31.2 18.0Others 55 193 36.7 58.4
Total 1,934 1,529 696.7 683.5
IOI CORPORATION BERHAD ANNUAL REPORT 2008
MANAGEMENT’S DISCUSSION AND ANALYSIS CONT’DGROUP BUSINESS REVIEW

47OPERATIONS REVIEW CONT’D
The Group sold a wide range of products during the financial year. Sales mix recorded for unit prices above RM350,000 waslower at 68% of total sales value as compared to previous year of 76%. As a result, the average price per unit has decreased by19% from RM447,000 to RM360,000. The decrease in average unit price is mostly due to higher proportion sales of landedresidential properties by Johor projects, which traditionally has a lower sales value per unit compared to Klang Valley.
The property sales mix by price range are as follows:
FY2008 FY2007Projects RM million % RM million %
Below RM100,000 16.7 2 11.7 2Between RM100,000 to RM150,000 39.9 6 32.1 5Between RM150,000 to RM250,000 95.7 14 54.6 8Between RM250,000 to RM350,000 72.5 10 63.3 9Between RM350,000 to RM500,000 99.7 14 111.6 16Above RM500,000 372.2 54 410.2 60
Total 696.7 100 683.5 100
Even though property development revenue registered an increase of 7%, however, at EBIT level, the property developmentsegment decreased by RM27.5 million or down 7%, from RM397.2 million to RM369.7 million. The reason for the decrease canbe explained as a result of escalating building materials cost as well as higher sales of lower end landed residential in Johorwhich traditionally has lower margin.
The Group’s property investment portfolio comprises mainly of retail and office space totalling approximately 1.6 million sq ft ofnet lettable space (FY2007 - 1.6 million sq ft), of which about 100,000 sq ft is located in Singapore.
The overall occupancy and rental rate for our investment properties, especially the retail complexes, have also improved duringthe financial year. The higher occupancy and rental rates have increased the property investment’s contribution to Group EBITby 29%, from RM40.5 million for the previous financial year to RM52.3 million, both after excluding a investment propertiesfair value gain of RM160.7 million and RM130 million respectively.
The combined operating profit of the property development and investment activities, inclusive of the fair value gain oninvestment properties, totalled RM551.9 million for FY2008, against RM598.4 million for the previous financial year.

48OPERATIONS REVIEW CONT’D
OUTLOOK & PROSPECTS
While it is reassuring that 2007 was a good year for property sector as indicated by the Key Property indicators, they do notnecessary reflect future trends. Previously, the market was bullish due to the various policies and measures indicated in theforegoing paragraph, but sentiments has took a turn due to combination factors such a global uncertainties of rising inflationand costs, political changes and sustainability of demand. As such, the Malaysia property market is expected to experience achallenging time next year. It is imperative for property companies to continuously meet buyers demand for good locations,quality design and innovative products.
Cautionary statement regarding forward-looking statements
This Annual Report contains forward-looking statements that are based on management’s estimates, assumptions andprojections at the time of publication. These statements reflect our current views and expectations with respect tofuture events and are subject to risks and uncertainties and hence are not guarantees of future performance. Somefactors include, but are not limited to, changes in general economic and business conditions, exchange rates,exceptional climatic conditions and competitive activities that could cause actual results to differ materially from thoseexpressed or forecast in the forward-looking statements.
IOI CORPORATION BERHAD ANNUAL REPORT 2008
MANAGEMENT’S DISCUSSION AND ANALYSIS CONT’DGROUP BUSINESS REVIEW

49