ion paper - kapsarc
TRANSCRIPT

KA
PS
AR
C D
iscu
ssio
n P
aper
KS-1514-DP08A
April 2015
A global degree days database for energy-related applications
Tarek Atallah, Silvio Gualdi, Alessandro Lanza

2
A global degree days database for energy-related applications
About KAPSARC
The King Abdullah Petroleum Studies and Research Center (KAPSARC) is an independent, non-profit
research institution dedicated to researching energy economics, policy, technology, and the environment across
all types of energy. KAPSARC’s mandate is to advance the understanding of energy challenges and
opportunities facing the world today and tomorrow, through unbiased, independent, and high-caliber research
for the benefit of society. KAPSARC is located in Riyadh, Saudi Arabia.
Legal notice
© Copyright 2015 King Abdullah Petroleum Studies and Research Center (KAPSARC). No portion of this
document may be reproduced or utilized without the proper attribution to KAPSARC.

3
A global degree days database for energy-related applications
Weather can have a profound effect on energy
consumption, especially extremes of hot and cold
temperatures. These variations in particular drive
residential and commercial energy demand because
space heating and cooling is such an important
component. Traditional approaches are customized
to the specific geography of interest. Energy
regulators use a measure of divergence from normal
temperatures to estimate peaks in demand when
planning future capacity, or to strip out short-term
weather effects to identify underlying growth trends.
Energy traders marry weather forecasts to demand
data to identify potential price peaks and troughs.
What unites these analyses is that they tend to be
either local or short term in nature; or both.
However, the customization of methodology to a
particular geography renders comparisons of the
effects of weather between countries invalid.
Targets for improving energy productivity and
benchmarking of performance towards meeting such
targets between countries requires a consistent
global database, both spatially and temporally. To
date, no such database has been available to
policymakers. KAPSARC has worked with the Euro
-Mediterranean Center for Climate Change (CMCC)
to create a database covering 147 countries over a
period of several decades, based on consistent
methodologies such that the impacts of local climate
on energy consumption can be analyzed.
Differences in the energy productivity of countries
are comprised of several factors. These include the
industrial structure of the economy, efficiency of
equipment and processes, availability of water, and
differences in weather among other factors.
Differentiating between the factors that are
controllable (including economic structure and
efficiency) and uncontrollable (including weather
and access to water), allows policy to be focused in
the areas where it can achieve the most
beneficial impact. The CMCC-KAPSARC Weather
Normalization Database is one of the tools now
available to policymakers to separate the signal from
the noise in guiding policies aimed at improving the
energy productivity of their economies.
Introduction
The cooling and heating degree days methodology is
regarded as a reliable tool for appropriately
accounting for the effect of weather on energy
demand. Degree days methodologies are commonly
used to calculate seasonally adjusted energy
consumption in a variety of discrete geographies.
These include, among others, Dombayci (2009) for
Turkey, Arguez et al (2013) for the United States,
Badescu et (1999) for Romania, You (2013) for
China, Matzarakis (2004) for Greece, Al-Hadrami
(2013) for Saudi Arabia, and Eurostat (2011) for
selected European countries.
The various databases available in the literature are
generated under a variety of definitions and
methodologies and based on a range of reference
temperatures. These are useful for planning energy
systems and predicting seasonal load demands for
evening out weather related variations in energy
demand, and are also equally used by traders and
economist for analyzing competitive market-derived
prices. Furthermore, quantifying the relationship
between climatic conditions and energy consumption
can raise awareness on the effect of climate change
on future heating and cooling equipment investments
(De Cian et al, 2013; Bigano et al, 2006; Christenson
et al, 2006).
From a policymaking perspective, accounting for
weather effect on energy demand is no longer
restricted to domestic nationally-focused analysis.
Summary for policymakers

4
A global degree days database for energy-related applications
There is also an emerging international context.
Decision makers have increasingly noted the need
for benchmarking the performance of their
economies and the effect of their policies against
other countries. However, the fragmented nature of
degree days datasets, their lack of comprehensive
coverage, and the variations in definition of weather
adjustments make such comparison between
countries difficult or even invalid. Furthermore, the
majority of the calculated datasets only include the
effects of temperature. They do not always address
the potential effects of humidity and solar radiation,
both of which may drive demand for air
conditioning and heating.
There are some studies in the literature that take a
global perspective using a country-by-country data.
The World Resource Institute (Baumert K., Selman
M., (2003) for example, used ground-based station
temperature data to create a 30-year average of
cooling (CDD) and heating degree-days (HDD) for
around 90 countries. However, the dataset has not
been updated and, for many countries, excludes
large proportions of population and land area.
Wheeler (2012) developed a global population
weighed CDD and HDD database using temperature
records from 1980 to 2011, gathered from satellite
reanalysis data. The dataset, however, is limited by
the fixed reference temperature, the spatial and
temporal aggregation associated with its analysis
and the absence of other relevant climatic factors
including humidity. Eurostat (2011) provides a
monthly Heating Degree Day index for European
Union countries for the period 1980 to 2009, while
Benestad (2008) generated CDD and HDD
estimations and forecasts for 63 Europeans locations
from 1900 to 2100. Although these datasets include
various countries, they are characterized by different
spatial and temporal aggregation levels, and use
calculation methodologies that hinder reliable
comparisons between countries.
In partnership with the Euro-Mediterranean Center
for Climate Change (CMCC), KAPSARC has
created, a comprehensive dataset in both geography
and time that overcomes these limitations, allowing
policymakers to make unbiased and comparable
evaluations among countries. Its intention is to
enable policymakers to account for differences in
energy consumption that simply result from
diverging climatic conditions between their own
country and a comparator. This allows comparison
of normalized data to determine whether residual
differences are driven by other factors including
structure of economy, efficiency or consumer
behavior. Moreover, this dataset is freely available
to the public.
Building of the database
The CMCC-KAPSARC database provides data on
population-weighted degree-days for 147 countries
for the period ranging from 1948 to 2013. An
important aspect of its development was to improve
on existing degree days methodology, namely
limited geographical availability, temporal and
spatial aggregation, the lack of accounting for
various climatic factors, and the restrictive use of a
singular reference temperature.
The dataset was created through a combination of
gridded atmospheric satellite datasets developed by
the National Oceanographic Atmospheric Agency
(NOAA). Degree days have been computed using
datasets obtained from NOAA’s National Centers
for Environmental Prediction (NCEP/NCAR
reanalysis first started by Kalnay et al, 1996). The
data series employed were actual values and
reanalysis of geo-located climate parameters: air
temperature at two meters altitude, relative humidity,
solar radiation available at a four times intra-day
frequency ranging from 1948 through 2013.

5
A global degree days database for energy-related applications
These parameters were used to calculate global
thermal comfort indices within grids determined by
latitude and longitude at a spatial resolution of 1.8°
x1.8°. The value of a decimal degree (1°) of
longitude fluctuates between 40km and 112km,
depending on the location distance from the equator.
One degree of latitude remains 112 km regardless of
location. Each of the resulting indices was
represented on a Gaussian grid of 192 longitudes
and 94 latitudes, for 96,428 time values at six hour
intervals.
Computed indices were population-weighted using
Columbia University‘s Gridded Population of the
World dataset (GPW v.3) from 1990 to 2013, and
extrapolations from UNEP/GRID-Sioux Falls
regional datasets for the years ranging from 1948 to
1990. The population-weighting procedure is
important in order to avoid over-estimating energy
consumption in areas with extreme weather
conditions but without resident population. The
resulting indices were subsequently downscaled to
an enhanced resolution of 1.6° x 1.6° using
statistical regressions, and shaped into national
boundaries using GIS geocoding. All the local
values of the sub-indices were summed to create
annual national indices. Grids overlapping multiple
boundaries were split proportionally to the
respective surface of each country within the grid.
Cooling and heating degree days for each
index were calculated by taking the absolute
difference between the sub-daily index value and
thermal comfort index calculated using the reference
climatic factors. These were set to be 60°F,
65°F or 70°F equivalent to 15.6°C, 18.3°C or 21.1°
C, respectively.
Different policymakers may have different
preferences to which index to use depending on
whether their predominant loads are heating or
cooling, and whether the demand is concentrated on
the coast or inland. The CMCC-KAPSARC dataset
can be used in a variety of flexible ways. It includes
degree days based on pure temperature readings, as
well as others derived from thermal comfort indices
that are calculated based on additional climatic
parameters. The inclusion of these parameters helps
convey the actual “feels-like” temperature that is
sensed by human bodies and that triggers demand
for air conditioning.
The dataset includes degree days based on five
thermal indicators which are explained in detail in
Appendix 1. These are:
Temperature (T2m_C measured in °C)
Temperature (T2m_F measured in °F)
Heat index (HI, measured in °F)
Humidex (HUM, measured in °C)
Environmental Stress Index (ESI, measured in °C)
The first two indices are both temperature-based but
with different thermal units, Celsius and Fahrenheit.
Celsius degree days cannot be derived from
Fahrenheit days (and vice versa), as the relationship
between the two is not linear. Furthermore, having
the temperature-based indices in the two units
facilitates the ensuing comparison effort with the
existing data in the literature, and the degree days
for thermal comfort indices.
The Heat Index was developed by the US National
Oceanographic and Atmospheric Administration
(NOAA) in 1978 and adopted by the US National
Weather Service a year later. It aims at combining
the effects of air temperature and relative humidity
into a single parameter that provides a measure of
the perceived temperature in degrees Fahrenheit. It
was empirically derived by Rothfusz (1990) for
specific conditions of temperature and relative
humidity, and later expanded by NOAA’s Climate
Prediction Center to be defined at all values. Higher
values of Heat Index correspond to hotter perceived
environmental conditions.
6
A global degree days database for energy-related applications
The Humidex is an index developed and frequently
used by the Meteorological Service of Canada, first
defined by Richardson et al (1979). It is defined in
Celsius and, similar to the Heat Index, aims at
deriving a “feels-like” temperature-based on the
consideration of temperature and relative humidity.
As with the Heat Index, higher values of the
Humidex reflect hotter perceived conditions.
The last thermal comfort index that we enumerate is
the Environmental Stress Index (ESI) which adds
the effect of solar radiation on temperature and
relative humidity. It was defined by Moran et al
(2001) as an improvement and proxy for the wet-
bulb temperature based index. There are other
thermal comfort indices, such as the Thom’s Index,
the Standard Effective Temperature, the Modified
Discomfort Index and Universal Thermal Climate
Index (Epstein et al, 2006). These indices have not
been included in our current database, either because
they offer an approach too simplistic or they require
parameters for their calculations that are not
commonly available on a global scale (such as the
mean radiant temperature, clothing levels or
metabolic rates).
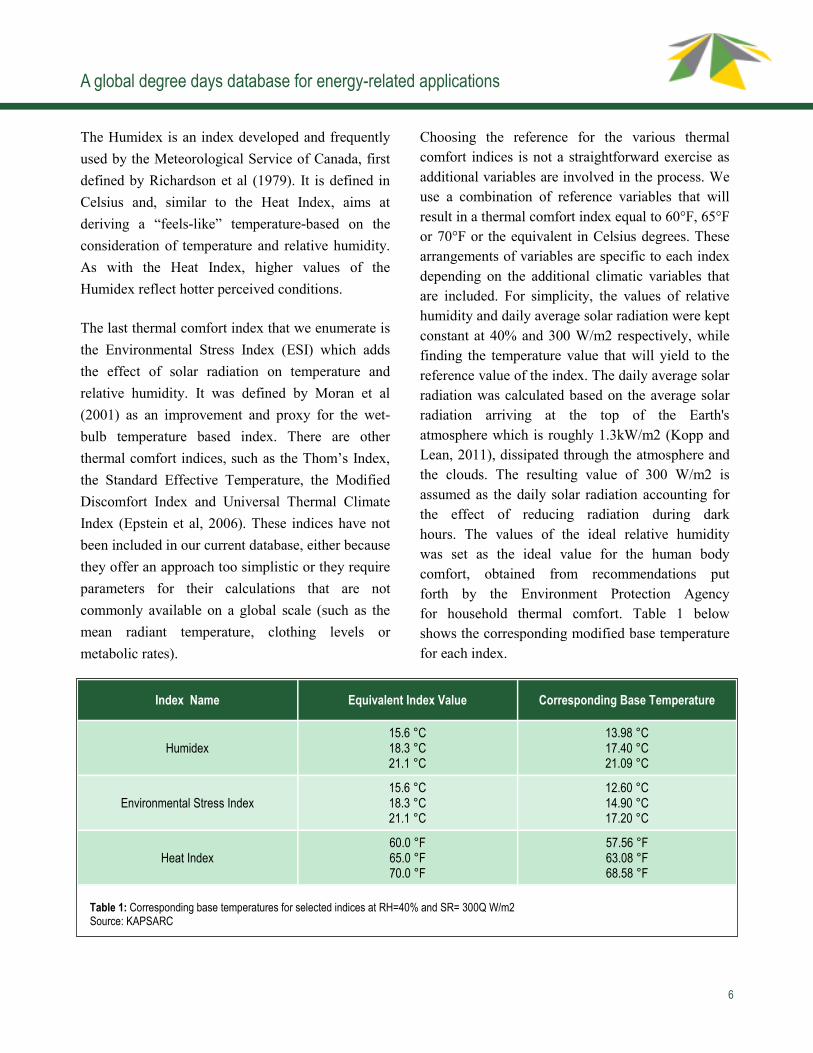
Choosing the reference for the various thermal
comfort indices is not a straightforward exercise as
additional variables are involved in the process. We
use a combination of reference variables that will
result in a thermal comfort index equal to 60°F, 65°F
or 70°F or the equivalent in Celsius degrees. These
arrangements of variables are specific to each index
depending on the additional climatic variables that
are included. For simplicity, the values of relative
humidity and daily average solar radiation were kept
constant at 40% and 300 W/m2 respectively, while
finding the temperature value that will yield to the
reference value of the index. The daily average solar
radiation was calculated based on the average solar
radiation arriving at the top of the Earth's
atmosphere which is roughly 1.3kW/m2 (Kopp and
Lean, 2011), dissipated through the atmosphere and
the clouds. The resulting value of 300 W/m2 is
assumed as the daily solar radiation accounting for
the effect of reducing radiation during dark
hours. The values of the ideal relative humidity
was set as the ideal value for the human body
comfort, obtained from recommendations put
forth by the Environment Protection Agency
for household thermal comfort. Table 1 below
shows the corresponding modified base temperature
for each index.
Index Name Equivalent Index Value Corresponding Base Temperature
Humidex 15.6 °C 18.3 °C 21.1 °C
13.98 °C 17.40 °C 21.09 °C
Environmental Stress Index 15.6 °C 18.3 °C 21.1 °C
12.60 °C 14.90 °C 17.20 °C
Heat Index 60.0 °F 65.0 °F 70.0 °F
57.56 °F 63.08 °F 68.58 °F
Table 1: Corresponding base temperatures for selected indices at RH=40% and SR= 300Q W/m2 Source: KAPSARC

7
A global degree days database for energy-related applications
Finally, although the NCEP re-analysis cover the
1948-2013 period, the earlier part of the dataset is
mostly based on the model dynamics with only little
contribution from actual observations. The
contribution of the observational data to the re-
analysis products, in the second half of the covered
time-period, especially for emerging economies, is
more reliable in our view. For the purpose of the
ensuing analysis, this paper will focus on the last
five decades of the time series (1964-2013), keeping
only the most reliable parts of the re-analysis
products. Values were calculated for 147 countries,
while nations with an area smaller than 1000 km2
were disregarded due to data granularity issues.
These include island nations like Nauru or Barbados,
or city-states such as Monaco or the Vatican.
A brief description of the database
Table 2 below reflects country rankings by the number
of HDD and CDD derived for various thermal comfort
indices at a nominal reference temperature of 18.3°C
or 65°F. For the HDD, Kyrgyzstan and Mongolia
stand out as the coldest countries across all indices.
Norway, Finland, Russia, and Kazakhstan are among
the next coldest. CDD provides more variation among
the countries. The highest CDD countries change
depending on the chosen index and reference
temperature. Mauritania, UAE and Niger are leading
the ranks for the temperature based indices while in
general East Timor, Cuba and The Philippines top the
remaining indices. More detail is available in
Appendix 2, which shows descriptive statistics for
the years 1964-2013.
Temperature-based Heat Index Humidex ESI
HDD CDD HDD CDD HDD CDD HDD CDD
Kyrgyz Rep. (7715)
Mauritania (3642)
Kyrgyz Rep. (13442)
East Timor (8017)
Kyrgyz Rep. (8544)
Philippines (7242)
Kyrgyz Rep. (7438)
Philippines (4257)
Mongolia (7346)
United Arab Emirates (3519)
Mongolia (12844)
Cuba (7811)
Mongolia (8066)
East Timor (7145)
Mongolia (7334)
East Timor (4206)
Norway (5855)
Niger (3429)
Norway (10033)
Philippines (7714)
Norway (6064)
Cuba (7057)
Norway (5569)
Cuba (4127)
Finland (5619)
Burkina Faso (3365)
Kazakhstan (9690)
Bangladesh (7155)
Kazakhstan (6022)
Costa Rica (6906)
Kazakhstan (5519)
Costa Rica (4035)
Russia (5606)
Oman (3364)
Finland (9630)
Sierra Leone (6995)
Russia (5867)
Panama (6849)
Russia (5505)
Panama (4025)
Kazakhstan (5589)
Sudan (3313)
Russia (9623)
Haiti (6966)
Finland (5851)
Indonesia (6794)
Finland (5450)
Indonesia (4006)
Canada (5357)
Kuwait (3290)
Canada (9191)
Burkina Faso (6859)
Tajikistan (5762)
Sri-Lanka (6768)
Canada (5164)
Sri-Lanka (3987)
Tajikistan (5271)
Mali (3221)
Tajikistan (9164)
Guinea-Bissau (6760)
Canada (5576)
Haiti (6700)
Tajikistan (5067)
Haiti (3949)
Switzerland (5148)
Guinea-Bissau (3176)
Switzerland (8758)
Sri-Lanka (6745)
Switzerland (5237)
Sierra Leone (6685)
Estonia (4827)
Sierra Leone (3927)
Estonia (5042)
Somalia (3169)
Estonia (8621)
Senegal (6716)
Estonia (5201)
Liberia (6567)
Switzerland (4815)
Liberia (3872)
Table 2: Country rankings using various thermal comfort indices (average 1964-2013) at Tref=65°F or Tref=18.3°C Source: KAPSARC

8
A global degree days database for energy-related applications
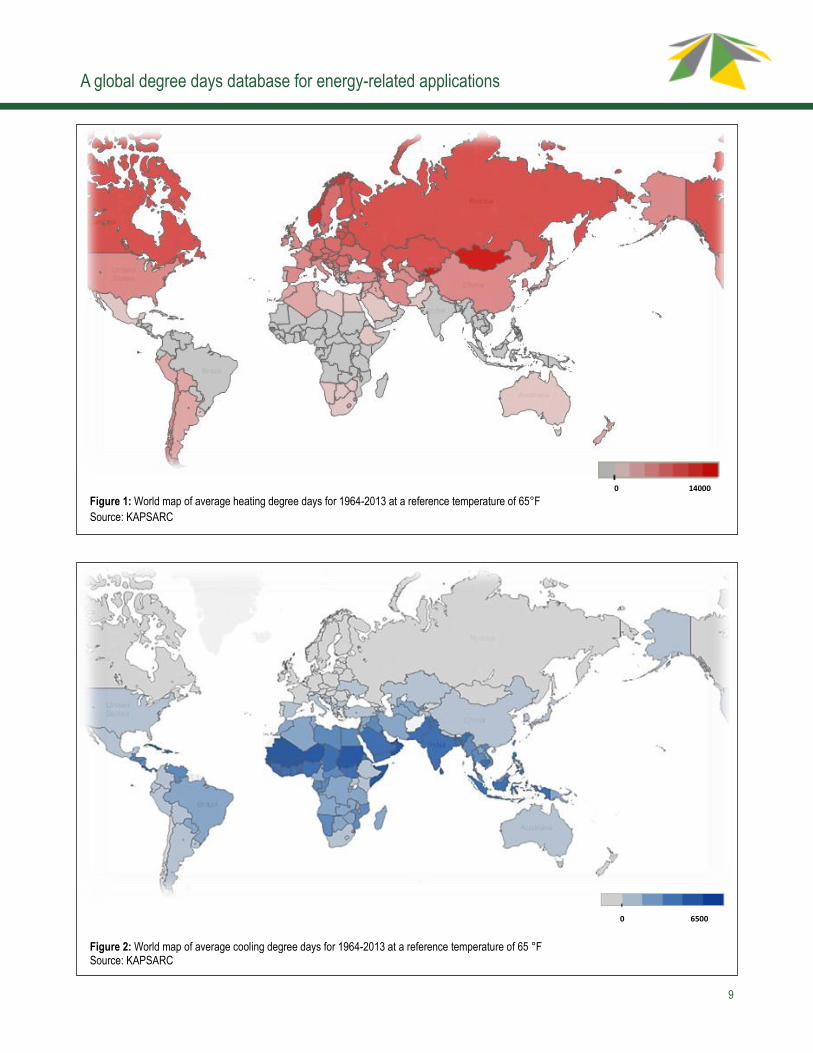
Figures 1 and 2 reflect a heat map of the world
distribution for heating and cooling degree days,
using as a reference temperature Tref = 65°F.
Additional insight is provided through a comparison
of the effects of climatic factors by studying the
percentage changes in CDD and HDD among the
temperature-based indices, and the various thermal
comfort indices in both °F and °C. Figure 3 reflects
the variation in degree days among the temperature-
based degree days and other thermal comfort
indices. The average values of the indices for the
period 1964-2013, on a global average basis are
shown. There is a noted difference between the
effects on HDDs and CDDs.
For the heating degree days, both the ESI and HUM
show fewer degree days when compared to
temperature-based indices. For the ESI, the disparity
increases with the increase in the reference
temperature ranging from -6% at 15.6°C to -15%
at 21.1°C, while HUM values are always constant
at around -19%. The difference between the
Temp_HDD and the HUM_HDD seems marginal
between 2% to 4% for all references.
For the cooling degree days, the difference between
the degree days of the various indices and the
temperature-based one is more pronounced. All the
indices seem to add more cooling degree days when
compared to those generated by the base
temperatures. In that context, the heat index displays
the lowest variability ranging between 23% to 30%,
while the Humidex reflects the highest increase
ranging between 92% and 145%.
Adding humidity and solar radiation does have an
effect on the computed value of degree days, and by
proxy the actual energy consumed for space heating
and cooling control in the residential and
commercial sectors. These combined effects seem to
vary depending on the index used and whether the
purpose is for heating or cooling.
Looking at the ESI and HI, we can assess that the
effect on CDD of adding humidity using the HI is
between 6% to 15%, and the combined effect of
humidity and solar radiation is 16% to 44%, using
the ESI for the average period 1964-2013. For the
HDD, humidity alone seems not to have an impact
(max 4%), while the combined effect of humidity
and solar radiation seems to decrease the number of
HDD by up to 15% at Tref 17.2°C (70°F).
Intuitively, on a country level, the most affected
nations seem to be the ones that include the largest
resident population with the highest humidity levels
and solar radiations. Table 3 identifies the top five
countries with the highest positive variation in
degree days for each index.
Nevertheless, this illustrative approach has its own
limitation as it cannot be firmly concluded that the
difference between the temperature-based index and
the thermal comfort indices are solely due to
climatic factors. Biases can arise from the definition
of thermal indicators or can result from the
calibration process. We encourage potential users to
propose other indices that may be complementary to
our methodology and would enrich the dataset.
Benchmarking against existing datasets
The database has been compared with other
available databases that were calculated either
on a regional or global level using a similar
computation method for degree days, as outlined in
Appendix 1 but with varying metadata sources and
spatial or temporal aggregations. Comparisons for
selected countries were based on national (EIA,
2012 and Vesma, 2014), regional (Eurostat, 2011)
and global databases (World Resource Institute,
2003 and Wheeler, 2012). These comparisons were
only for the temperature-based degree days, as there
is a limited source identified for reviewing degree
days generated from other thermal comfort indices.
9
A global degree days database for energy-related applications
Figure 1: World map of average heating degree days for 1964-2013 at a reference temperature of 65°F
Source: KAPSARC
0 14000
0 6500
Figure 2: World map of average cooling degree days for 1964-2013 at a reference temperature of 65 °F Source: KAPSARC

10
A global degree days database for energy-related applications
Figure 3: Global average of degree days variation between temperature-based and thermal comfort indices for HDD and CDD at various reference temperatures. Source: KAPSARC
Heat Index Humidex ESI
HDD CDD HDD CDD HDD CDD
Niger (58) Cuba (2445) Kyrgyz Rep. (829) Philippines (4552) Niger (74) Malaysia (1570)
Mali (35) East Timor (2428) Mongolia (720) Indonesia (4530) Burkina Faso (57) Indonesia (1479)
Burkina Faso (29) Philippines (2421) Tajikistan (492) Panama (4510) Mali (52) Equatorial Guinea
(1437)
Mauritania (27) Bangladesh (2352) Kazakhstan (433) Costa Rica (4502) Mauritania (43) Panama (1423)
Chad (24) Indonesia (2066) Russia (261) Malaysia (4474) Chad (30) Liberia (1405)
Table 3: Top 5 countries with the highest positive change in degree days between various thermal temperature based and thermal comfort
indices for the average of 1964-2013 at 18.3 °C or equivalent.
Source: KAPSARC
11
A global degree days database for energy-related applications
Country Source Period Tref HDD (%) CDD (%) Note
USA EIA 1949-2011 65°F 803 (15%) 70 (4%)
Alaska and Hawaii values were added to EIA’s value, ground based data from 200 stations
WRI 1977-1991 18°C 758 (26%) -117 (-16%) WRI data accounts for 99.7 % of the country, station based data.
UK
Vesma 1993-2013 15.5°C -71 (-3.2%) 35 (18%) Data was adjusted for 0.1°C, ground based, regional level aggregation
Vesma 1993-2013 18.5°C -207 (-6.8%) - Data was adjusted for 0.3°C, ground regional level
Eurostat 1980-2009 18°C 8 (0.3%) - Data was adjusted for heating threshold, ground based NTUS 2 regional level
WRI 1977-1991 18°C 289 (9%) 9 (13%) WRI data accounts for 92.2 % of the country, station based data.
Wheeler (2012) 1980-2011 65°F 134 (2%) 91 (70%) 2.5°*2.5° grid, various pop weighting and daily average
Turkey
Eurostat 1980-2009 18°C 834 (24%) - Adjusted for heating threshold, ground based NTUS 2 regional level
WRI 1977-1991 18°C 1148 (36%) 21 (3%) WRI data accounts for 64.6 % of the country area, station based data..
Wheeler (2012) 1980-2011 65°F 67 (1%) 741 (62%) N/A
Argentina WRI 1977-1991 18°C 449 (30%) 82 (8%) WRI data accounts for 99.7 % of the country’s area, station based data.
Wheeler (2012) 1980-2011 65°F 1045 (34%) -10 (-1%) N/A
Brazil WRI 1977-1991 18°C 74 (39%) -372 (-23%) WRI data accounts for 89.8% of the country’s area, station based data.
Wheeler (2012) 1980-2011 65°F 166 (43%) -53 (-2%) N/A
China WRI 1977-1991 18°C 523 (19%) -2387 (-29%) WRI data accounts for 97.50% of the country’s area, station based data.
Wheeler (2012) 1980-2011 65°F -191 (-4%) 367 (26%) N/A
France
WRI 1977-1991 18°C 667 (21%) -2.3 (-1%) WRI data accounts for 68.5% of the country, station based data.
Eurostat 1980-2009 18°C 802 (25%) - Data was adjusted for heating threshold, ground based NTUS 2 regional level
Wheeler (2012) 1980-2011 65°F 48 (1%) 255 (55%) N/A
Germany
WRI 1977-1991 18°C 671 (17%) 23 (16%) WRI data accounts for 100 % of the country, station based data.
Eurostat 1980-2009 18°C 801 (20%) - Adjusted for heating threshold, ground based NTUS 2 regional level
Wheeler (2012) 1980-2011 65°F -568 (-8%) 260 (84%) N/A
Kazakhstan WRI 1977-1991 18°C 875 (16%) 49 (9%) WRI data accounts for 98.10% of the country’s area, station based data.
Wheeler (2012) 1980-2011 65°F -1068 (-11%) 730 (82%) N/A
Russia WRI 1977-1991 18°C 287 (5%) 36 (16%) WRI data accounts for 84.40% of the country’s area, station based data.
Wheeler (2012) 1980-2011 65°F -577 (-6%) 328 (75%) N/A
Saudi Arabia
WRI 1977-1991 18°C 255 (45%) -159 (-5%) WRI data accounts for 56.90% of the country’s area, station based data.
Wheeler (2012) 1980-2011 65°F 51 (5%) 2159 (40%) N/A
Spain
WRI 1977-1991 18°C 1054 (42%) -91 (-15%) WRI data accounts for 91.10% of the country’s area, station based data.
Eurostat 1980-2009 18°C 947 (34%) - Data was adjusted fo heating threshold, ground based NTUS 2 regional level
Wheeler (2012) 1980-2011 65°F 1456 (31%) 337 (30%) N/A
Sweden
WRI 1977-1991 18°C 153 (3%) 29 (39%) WRI data accounts for 87.90% of the country’s area, station based data.
Eurostat 1980-2009 18°C -926 (-21%) - Data was adjusted fo heating threshold, ground based NTUS 2 regional level
Wheeler (2012) 1980-2011 65°F 347 (4%) 115 (79%) N/A
United Arab Emirates
WRI 1977-1991 18°C 296 (99%) 303 (8%) WRI data accounts for 90.30% of the country’s area, station based data.
Wheeler (2012) 1980-2011 65°F 273 (47%) 2146 (34%) N/A
Japan WRI 1977-1991 18°C 260 (12%) -263 (-42%) WRI data accounts for 100% of the country’s area, station based data.
Wheeler (2012) 1980-2011 65°F 1107 (28%) -233 (-22%) N/A
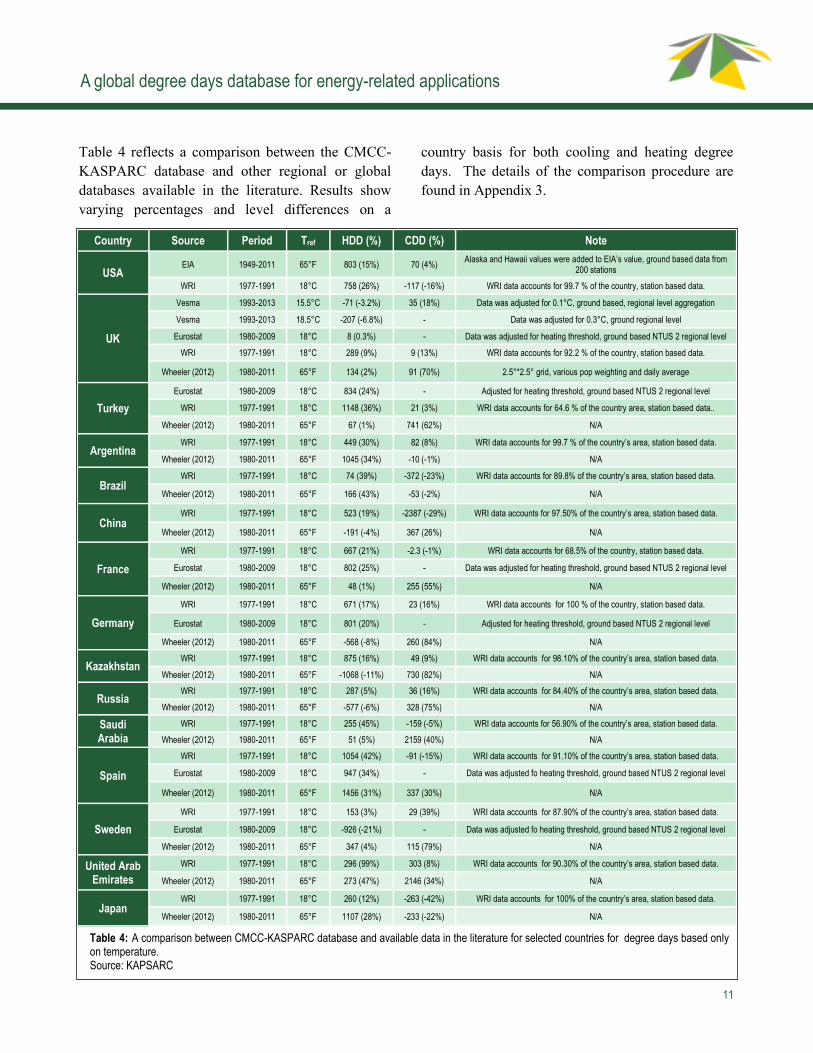
Table 4: A comparison between CMCC-KASPARC database and available data in the literature for selected countries for degree days based only on temperature. Source: KAPSARC
Table 4 reflects a comparison between the CMCC-
KASPARC database and other regional or global
databases available in the literature. Results show
varying percentages and level differences on a
country basis for both cooling and heating degree
days. The details of the comparison procedure are
found in Appendix 3.
12
A global degree days database for energy-related applications
Conclusion
Despite the widespread usage of degree days, there
is limited access to global databases that enable
comparisons between countries. The newly created
CMCC-KAPSARC database provides a reliable tool
for the purpose of seasonal adjustments of energy
demand on both regional and national levels.
Paralleled to existing available databases, it offers
an important contribution by increasing the
geographical coverage, the number of reference
temperatures, the timespan, and the temporal
granularity. Furthermore, the availability of degree
days that include additional climatic factors such
as humidity and solar radiation allows finer
judgment of the policy impacts of energy
productivity and intensity targets. However, in a
world of energy productivity/intensity targets for
addressing climate change, KAPSARC’s new
dataset assists in providing unbiased comparisons
between countries at a level of granularity not seen
before. Furthermore, the time series data allows
inter-temporal comparisons of the performance for
individual countries to judge the impacts of policies
designed to improve productivity over time.

13
A global degree days database for energy-related applications
Appendix 1: Defining the thermal comfort indices
When used for energy-related applications, the degree days methodology is defined in terms of Cooling Degree
Days (CDD) and Heating Degree Days (HDD). A degree day is calculated as the difference between a
reference temperature (Tref) and the average of the maximum and minimum temperature (Tmean). If the
difference is positive it is counted as HDD, if it is negative it is represented as CDD. CDD and HDD can be
computed for various periods (i) by summing up the daily values in the form of:
Values for CDD and HDD are typically summed on a monthly or yearly basis, with the most commonly used
reference temperature being 65°F (18°C). Power generation and utility companies tend to implement the
methodology on a higher frequency, to the scale of hours or minutes to monitor or forecast potential load
fluctuations.
Heat index (HI):
We used the heat index as defined by Rothfusz et al (1990) and modified by the US-based Climate Protection
Center (CPC) of the National Oceanographic and Atmospheric Administration (NOAA). It is defined as a
function of air temperature and relative humidity as follows:
HI = 42.38+2.05.T+10.14.RH 0.22.T.RH 6.84x10-3.T2 .48x10-2 .RH2+1.23x10-3.T2.RH +8.53x10-4.T.RH2
1.99x10-6.T2.RH2
Eq.(3)
Where T equals the ambient dry bulb temperature in °F and RH is equivalent to the relative humidity in
percentage terms with a stated error of ±1.3°F the heat index is to be considered within some boundaries. In
particular, it can be thought as optimal for temperatures above 80F and relative humidity above 40%. The
Climate Prediction Center (CPC) at the National Oceanic and Atmospheric Administration (NOAA) made
some conditional adjustments to the original equation to refine and extend the range of the index outside the
above stated boundaries, these include:
For RH < 13 % and 80 °F <T <112 °F
Eq. (4)
For RH > 85 % and 80 °F <T < 87 °F
Eq. (5)
HDDi = Ʃ (Tref Tdaily mean) i days o days
CDDi = Ʃ (Tdialy mean Tref) i days
o days
Eq.(1)
Eq.(2)

14
A global degree days database for energy-related applications
More generally if, when using equation (3) above, the resulting HI for any combination of T and RH is below
80 °F, the Rothfusz regression is replaced by Steadman’s (1979) formula expressed in the form of:
HI=0.5x[T+61+1.2x(T 68)+0.094xRH Eq. (6)
The above mentioned Heat Index (HI) has been calculated using NOAA’s source code and has Fahrenheit as a unit.
Humidex (HUM):
The Meteorological Agency of Canada developed the Humidex, a thermal comfort index which was also
considered in this paper. It aims at reflecting the human perceived temperature by incorporating the effect of
humidity into the thermal comfort index by looking at the dew point temperature. The index was first defined
by Richardson et al, (1979) and is calculated using the following equation:
Eq. (7)
With T being the air temperature in °C and Tdew the dew point temperature in Kelvin as defined below, that
can be derived from the relative humidity using equation 8 below.
Eq. (8)
where RH is the relative humidity in percentage terms. When compared to the Heat Index, the Humidex
typically yields higher values at equal temperatures and relative humidity values, something that will be
noticed in the ensuing comparison of degree-days generated by indices. The Humidex is most commonly
expressed in Celsius.
Environmental Stress Index (ESI):
The Environmental Stress Index (ESI) was developed by Moran et al (2001) as a substitute and proxy for the
wet-bulb temperature-based index. It is an experimental index and adds solar radiation as an additional
parameter to temperature and relative humidity:
ESI=0.63xT 0.03xRH+0.002xSR+0.0054x(TxRH) 0.073x(0.1+SR)-1 (Eq.9)
With T being the ambient temperature in °C and RH the relative humidity in percentage terms and SR the solar
radiation in W/m2 touching the surface at a vertical angle of 90°. This index has been validated for various
climatic conditions such as hot/dry and hot/wet (Moran, 2006) and forms an interesting approach for
incorporating the three climatic variables into a thermal comfort index.
This section represents the descriptive statistics of various indices. Table 5 below represents the correlation
coefficient, mean, median, standard deviation, kurtosis, skewness and coefficient of variation for the heating
and cooling degree days’ time series derived from the various thermal comfort indices at three different
reference temperatures for the mean of the period 1964-2013.

15
A global degree days database for energy-related applications
Appendix 2: Descriptive statistics of various indices
This section represents the descriptive statistics of various indices. Table 5 below represents the correlation
coefficient, mean, median, standard deviation, kurtosis, skewness and coefficient of variation for the heating
and cooling degree days’ time series derived from the various thermal comfort indices at three different
reference temperatures for the mean of the period 1964-2013.
Appendix 3: Methodology for the comparison of databases
Table 4 summarizes the results by country, reference temperature, time-span and the average CDD and HDD
variations calculated as the mean of the annual variations for the comparative periods.
The reference temperature for the World Resource Institute’s database is slightly different than the ones used
in this paper, so the CDD and HDD degrees days were recalculated at a reference temperature of 18°C and the
benchmarking was performed accordingly.
In the case of Vesma, the provided degree days for the United Kingdom used a slightly higher reference
temperature (by up to 0.1°C). We adjusted their respective reference temperature by adding or subtracting to
their yearly/periodic averages the differences between the reference temperatures multiplied by the number of
days in the year. This adjustment had minimal effect on the variation (+/-2%) except for the cases where the
annual degree days were very minimal <100, which can be ignored.
HDD CDD
Index Tref Correlation Mean Median Standard Deviation
Kurtosis Skewness Coef of
Variation Mean Median
Standard Deviation
Kurtosis Skewness Coef of
Variation
Temp_C
15.6°C 0.79 1,316 531 1,585 0.56 1.15 1.20 1,962 1,801 1,367 (1.37) 0.23 0.70
18.3°C 0.77 1,714 855 1,882 (0.08) 0.95 1.10 1,374 1,222 1,074 (1.18) 0.42 0.78
21.1°C 0.72 2,229 1,337 2,184 (0.50) 0.77 0.98 867 683 770 (0.60) 0.74 0.89
Temp_F
60°F 0.79 2,358 948 2,845 0.58 1.15 1.21 3,551 3,267 2,470 (1.37) 0.22 0.70
65°F 0.77 3,095 1,548 3,394 (0.08) 0.94 1.10 2,462 2,190 1,927 (1.18) 0.42 0.78
70°F 0.72 4,016 2,410 3,932 (0.50) 0.77 0.98 1,557 1,226 1,384 (0.60) 0.74 0.89
Heat
Index
57.56°F 0.79 2,145 835 2,636 0.86 1.22 1.23 4,356 3,791 3,006 (1.41) 0.22 0.69
63.08 ° 0.79 2,899 1,468 3,237 0.05 0.98 1.12 3,093 2,382 2,410 (1.31) 0.38 0.78
68.58 ° 0.77 3,839 2,332 3,851 (0.47) 0.78 1.00 2,024 1,457 1,782 (1.10) 0.58 0.88
Humidex
13.98°C 0.78 1,253 382 1,615 1.45 1.37 1.29 3,770 3,308 2,548 (1.36) 0.25 0.68
17.40°C 0.79 1,657 750 1,963 0.58 1.14 1.18 2,925 2,397 2,202 (1.27) 0.37 0.75
21.09°C 0.79 2,192 1,277 2,372 (0.09) 0.92 1.08 2,113 1,535 1,790 (1.11) 0.53 0.85
ESI
12.60°C 0.80 1,237 445 1,554 0.96 1.28 1.26 2,274 2,039 1,528 (1.36) 0.24 0.67
14.90°C 0.80 1,532 705 1,791 0.38 1.10 1.17 1,730 1,446 1,286 (1.27) 0.36 0.74
17.20°C 0.80 1,887 1,041 2,040 (0.06) 0.95 1.09 1,244 935 1,026 (1.11) 0.51 0.82
Table 5: Descriptive statistics of time series of degree days generated using various thermal comfort indices for 1964-2013 Source: KAPSARC

16
A global degree days database for energy-related applications
Eurostat’s HDD were calculated using a Tref of 18°C, but also accounted for a heating threshold equal to 15°C.
This means that HDDs are not accrued for some of the daily mean temperature values that range between 15°C
and 18°C. For the purpose of comparison, the relevant time series of the CMCC-KAPSAC dataset were
adjusted to Eurostat’s by taking the generated degree days at Tref 15.6°C and adding a difference of 2.4°C over
a year. No adjustments were made for the comparisons with the EIA’s and Wheeler’s datasets.
In order to fully disentangle the effect of spatial and temporal aggregation, a comparison between the CMCC/
KAPSARC dataset and Wheeler (2012) eliminated most of the other effects, The two were similarly computed
from re-analysis of satellite data. Furthermore, there was no need to perform any adjustments in the reference
temperature, thus limiting potential approximation effects. The difference in the generated degree days was
found to be about 29.6% for HDD and 43.9% for CDD, when comparing both global averages for 147
countries for 1980-2011. The comparison was done by calculating the difference in net degree days for all
countries at 65°F as Wheeler (2012) only provides a single reference temperature for his dataset. Detailed
country level is provided in Table 4, in the main body of the paper.
The comparison with EIA’s US degree days for 1949-2011 for Tref 65°F reflects a minimal deviation for the
CDD (+4%) and a moderated one for the HDD (+15%). Yearly averages also reflect similar trends. The EIA
figures are based on data from some 200 ground-based stations sparsely located around the contiguous US
(EIA, 2012). As CMCC-KAPSARC’s data includes the whole of the country, it was necessary to add to the
EIA’s additional degree days from Alaska and Hawaii. Alaska’s HDD accounted for around 30 HDD°F,
depending on the year, while Hawaii’s was around 0.5 HDD°F, once population was weighted. Hawaii
accounted for an additional 15 CDD°F while Alaska’s impact was negligible (data obtained through the
Western Regional Climate Center database, 2014)
Similar results were noticed in comparison with the World Resource Institute (WRI) dataset where HDD’s
variation was about +26% and CDD’s equal to –16%. The difference can be apportioned to the effect of
temporal aggregation as the EIA’s calculations are based on mean daily temperatures, while our data are based
on 4-intraday values. As mentioned before, higher data frequency enables better representation of the actual
heating and cooling energy needs. Spatial aggregation may have had an effect, albeit to a lesser extent. This
could be the case in the comparison with the WRI, as their dataset is based on a higher number of land-based
stations (384).
For the UK, the effect of temporal and spatial aggregation seems to be further mitigated due to smaller areas
involved and less temperature variations. Comparing the dataset with WRI’s, Vesma (2014) and Eurostat show
variations ranging between -6.8% to 9% (-207 to +281 HDD°C) for the HDD and +35 to +111 CDD°C.
Another comparison with Eurostat’s pool of 25 countries reflects that the CMCC/KAPSARC dataset values are
on average 16% higher. We removed Cyprus, Luxembourg and Malta from the comparison as the CMCC/
KAPSARC database does not include them. The disparity may be due to the fact that Eurostat uses land-based
daily mean data at NUTS2 level - a classification of nomenclature of territorial units for statistics into a
hierarchical system for dividing up the economic territory of the EU into basic regions-which was interpolated
on a grid of 50 km x 50km. This approach uses a higher spatial resolution but a lower temporal resolution.
Another explanation of the difference may be due to the approximation associated with the adjustment of the
reference temperatures of the two datasets which can amount to as much as 2.4°C. Furthermore, it is unclear
what population weighting approach Eurostat used.

17
A global degree days database for energy-related applications
References
Al-Hadhrami, L. M. "Comprehensive review of
cooling and heating degree days characteristics over
Kingdom of Saudi Arabia." Renewable and
Sustainable Energy Reviews 27 (2013): 305-314.
Badescu, Viorel, and Elena Zamfir. "Degree-days,
degree-hours and ambient temperature bin data from
monthly-average temperatures (Romania)." Energy
conversion and management 40.8 (1999): 885-900.
Baumert, Kevin, and Mindy Selman. "Heating and
cooling degree days." World resources institute
(2003).
Benestad R.E., 2008. Heating degree days, cooling
degree days and precipitation in Europe.Norwegian
Meteorological Institute report no. 4/2008.
Bigano, Andrea, Francesco Bosello, and Giuseppe
Marano. "Energy demand and temperature: a
dynamic panel analysis." (2006).
Brode et al, “The Universal Thermal Climate Index
UTCI Compared to Ergonomics Standards for
Assessing the Thermal Environment”, Industrial
Health (2013), 51, 16–24.
Center for International Earth Science Information
Network (CIESIN), International Food Policy
Research Institute (IFPRI) and World Resources
Institute (WRI). 2000. Gridded Population of the
World (GPW), Version 3 [online data]. Palisades,
NY: CIESIN, Columbia University. Available at
http://sedac.ciesin.columbia.edu/plue/gpw, retrieved
March, 2014
De Cian, Enrica, Elisa Lanzi, and Roberto Roson.
"Seasonal temperature variations and energy
demand." Climatic change 116.3-4 (2013): 805-825.
Dombaycı, Ö. Altan. "Degree-days maps of Turkey
for various base temperatures." Energy 34.11 (2009):
1807-1812.
EIA, US. "Annual energy review." Energy
Information Administration, US Department of
Energy: Washington, DC www. eia. doe. gov/emeu/
aer (2012).
Environment Protection Agency, “ Home Helps.
Strategies for Personal Comfort, Staying
Healthy,Saving Money,The Environment” Accessed
through http://www.epa.gov/region7/citizens/pdf/
EPA_HomeHelps.pdf.
Epstein, Yoram, and Daniel S. Moran. "Thermal
comfort and the heat stress indices." Industrial health
44.3 (2006): 388-398.
Eurostat (2011), Energy statistics - heating degree-
days, available on http://epp.eurostat.ec.europa.eu/
cache/ITY_SDDS/EN/nrg_esdgr_esms.htm accessed
October 2014
Fels, Margaret F. "PRISM: an introduction." Energy
and Buildings 9.1 (1986): 5-18.
G. Kopp, Greg; J. Lean (2011). "A new, lower value
of total solar irradiance: Evidence and climate
significance". Geophys. Res. Lett. 38: L01706
Kalnay et al.,The NCEP/NCAR 40-year reanalysis
project, Bull. Amer. Meteor. Soc., 77, 437-470,
1996. Accessed through http://www.esrl.noaa.gov/
psd/data/gridded/data.ncep.reanalysis.html on March
15th, 2014.
Matzarakis, Andreas, and Christos Balafoutis.
"Heating degree‐days over Greece as an index of
energy consumption." International Journal of
Climatology 24.14 (2004): 1817-1828
Moran, Daniel S., et al. "An environmental stress
index (ESI) as a substitute for the wet bulb globe
temperature (WBGT)." Journal of thermal biology
26.4 (2001): 427-431.

18
A global degree days database for energy-related applications
Olonscheck, Mady, Anne Holsten, and Jürgen P.
Kropp. "Heating and cooling energy demand and
related emissions of the German residential building
stock under climate change." Energy Policy 39.9
(2011): 4795-4806.
Richardson, F.A. and Canada-Service de
l'environnement atmosphérique, Humidex: a method
of quantifying human discomfort due to excessive
heat and humidity. Downsview, Ont.: Atmospheric
Environment, 1979.
Rothfusz, Lans P., and NWS Southern Region
Headquarters. "The heat index equation (or, more
than you ever wanted to know about heat index)."
Fort Worth, Texas: National Oceanic and
Atmospheric Administration, National Weather
Service, Office of Meteorology (1990): 90-23.
UNEP and Center for International Earth Science
Information Network (CIESIN), Africa-Asia-Latin
America - Global Population Distribution Databases
(UNEP/GRID–Sioux Falls, Sioux Falls, SD, 2004);
available at www.na.unep.net/datasets/datalist.php ,
retrieved March 2014.
Vesma.com, database of Twenty-year average
heating and cooling degree days for UK regions,
available at http://www.vesma.com/downloads/
uk_20year.xls , accessed October 2014.
Wheeler, David. "Energy+ Country Performance
Ratings, 2001-2010." Available at SSRN 2226485
(2012).
Western Regional Climate Center, Alaska and
Hawaii historical heating degree days, Desert
Research Institute (DRI), available http://
www.wrcc.dri.edu/ accessed October 2014.
You, Qinglong, et al. "Present and projected degree
days in China from observation, reanalysis and
simulations." Climate Dynamics (2013): 1-14.

19
A global degree days database for energy-related applications
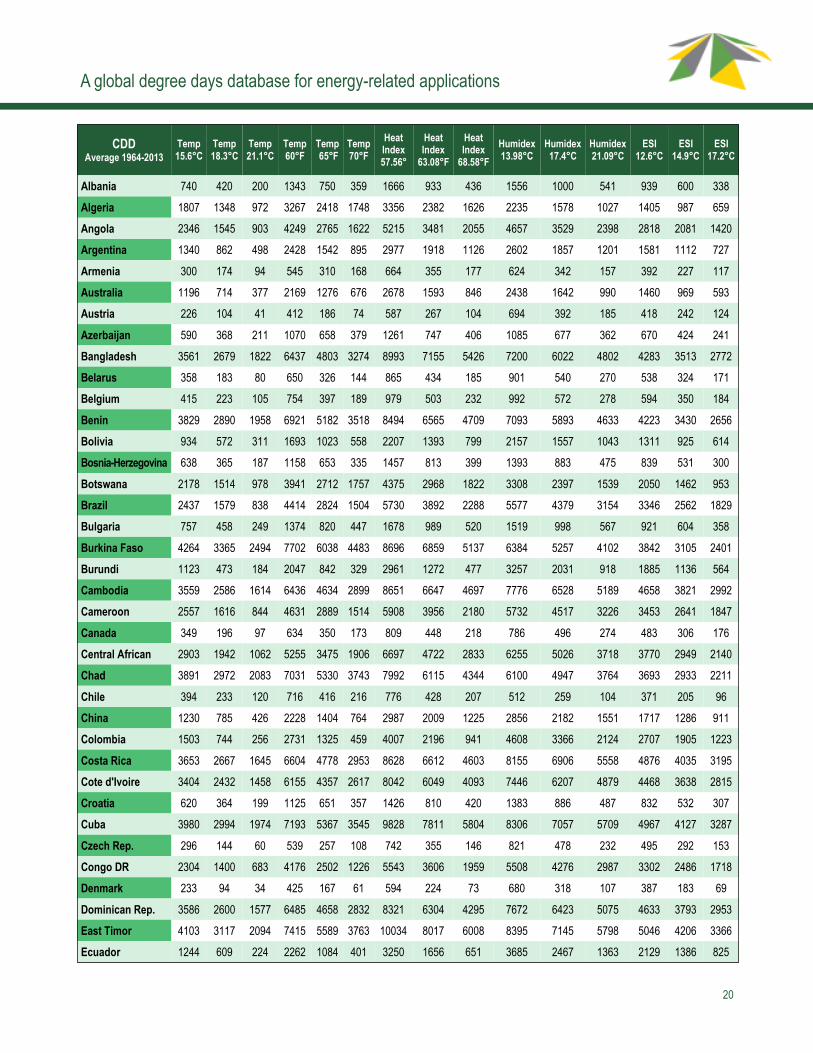
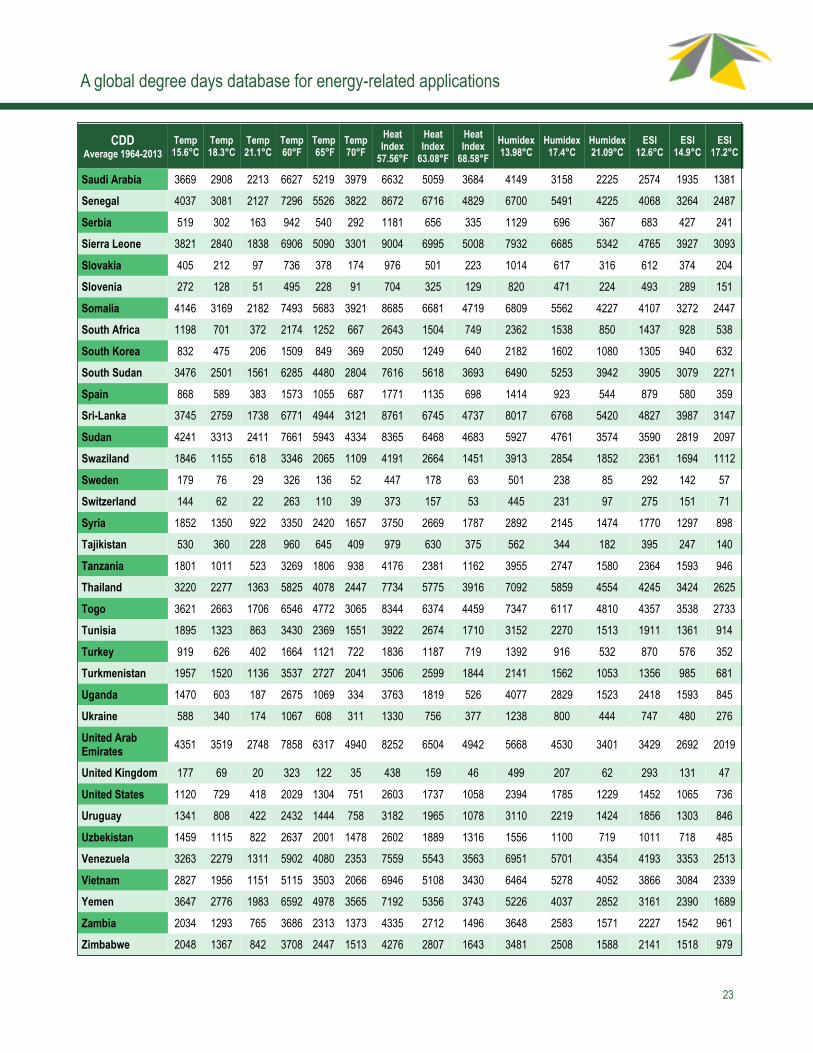
Database extracts
A sample of tables that include degree days averages
for 1964-2013, generated from multiple thermal indices
at various temperatures.
The complete CMCC-KAPSARC database can be
accessed at:
http://www.kapsarc.org/en/Documents/KAPSARC-CMCC%
20Enhanced%20Degree%20Days%20%20Database%
20March%202015.xlsx
20
A global degree days database for energy-related applications
CDD Average 1964-2013
Temp 15.6°C
Temp 18.3°C
Temp 21.1°C
Temp 60°F
Temp 65°F
Temp 70°F
Heat Index 57.56°
Heat Index
63.08°F
Heat Index
68.58°F
Humidex 13.98°C
Humidex 17.4°C
Humidex 21.09°C
ESI 12.6°C
ESI 14.9°C
ESI 17.2°C
Albania 740 420 200 1343 750 359 1666 933 436 1556 1000 541 939 600 338
Algeria 1807 1348 972 3267 2418 1748 3356 2382 1626 2235 1578 1027 1405 987 659
Angola 2346 1545 903 4249 2765 1622 5215 3481 2055 4657 3529 2398 2818 2081 1420
Argentina 1340 862 498 2428 1542 895 2977 1918 1126 2602 1857 1201 1581 1112 727
Armenia 300 174 94 545 310 168 664 355 177 624 342 157 392 227 117
Australia 1196 714 377 2169 1276 676 2678 1593 846 2438 1642 990 1460 969 593
Austria 226 104 41 412 186 74 587 267 104 694 392 185 418 242 124
Azerbaijan 590 368 211 1070 658 379 1261 747 406 1085 677 362 670 424 241
Bangladesh 3561 2679 1822 6437 4803 3274 8993 7155 5426 7200 6022 4802 4283 3513 2772
Belarus 358 183 80 650 326 144 865 434 185 901 540 270 538 324 171
Belgium 415 223 105 754 397 189 979 503 232 992 572 278 594 350 184
Benin 3829 2890 1958 6921 5182 3518 8494 6565 4709 7093 5893 4633 4223 3430 2656
Bolivia 934 572 311 1693 1023 558 2207 1393 799 2157 1557 1043 1311 925 614
Bosnia-Herzegovina 638 365 187 1158 653 335 1457 813 399 1393 883 475 839 531 300
Botswana 2178 1514 978 3941 2712 1757 4375 2968 1822 3308 2397 1539 2050 1462 953
Brazil 2437 1579 838 4414 2824 1504 5730 3892 2288 5577 4379 3154 3346 2562 1829
Bulgaria 757 458 249 1374 820 447 1678 989 520 1519 998 567 921 604 358
Burkina Faso 4264 3365 2494 7702 6038 4483 8696 6859 5137 6384 5257 4102 3842 3105 2401
Burundi 1123 473 184 2047 842 329 2961 1272 477 3257 2031 918 1885 1136 564
Cambodia 3559 2586 1614 6436 4634 2899 8651 6647 4697 7776 6528 5189 4658 3821 2992
Cameroon 2557 1616 844 4631 2889 1514 5908 3956 2180 5732 4517 3226 3453 2641 1847
Canada 349 196 97 634 350 173 809 448 218 786 496 274 483 306 176
Central African 2903 1942 1062 5255 3475 1906 6697 4722 2833 6255 5026 3718 3770 2949 2140
Chad 3891 2972 2083 7031 5330 3743 7992 6115 4344 6100 4947 3764 3693 2933 2211
Chile 394 233 120 716 416 216 776 428 207 512 259 104 371 205 96
China 1230 785 426 2228 1404 764 2987 2009 1225 2856 2182 1551 1717 1286 911
Colombia 1503 744 256 2731 1325 459 4007 2196 941 4608 3366 2124 2707 1905 1223
Costa Rica 3653 2667 1645 6604 4778 2953 8628 6612 4603 8155 6906 5558 4876 4035 3195
Cote d'Ivoire 3404 2432 1458 6155 4357 2617 8042 6049 4093 7446 6207 4879 4468 3638 2815
Croatia 620 364 199 1125 651 357 1426 810 420 1383 886 487 832 532 307
Cuba 3980 2994 1974 7193 5367 3545 9828 7811 5804 8306 7057 5709 4967 4127 3287
Czech Rep. 296 144 60 539 257 108 742 355 146 821 478 232 495 292 153
Congo DR 2304 1400 683 4176 2502 1226 5543 3606 1959 5508 4276 2987 3302 2486 1718
Denmark 233 94 34 425 167 61 594 224 73 680 318 107 387 183 69
Dominican Rep. 3586 2600 1577 6485 4658 2832 8321 6304 4295 7672 6423 5075 4633 3793 2953
East Timor 4103 3117 2094 7415 5589 3763 10034 8017 6008 8395 7145 5798 5046 4206 3366
Ecuador 1244 609 224 2262 1084 401 3250 1656 651 3685 2467 1363 2129 1386 825

21
A global degree days database for energy-related applications
CDD
Average 1964-2013
Temp 15.6°C
Temp 18.3°C
Temp 21.1°C
Temp 60°F
Temp 65°F
Temp 70°F
Heat Index
57.56°F
Heat Index
63.08°F
Heat Index
68.58°F
Humidex 13.98°C
Humidex 17.4°C
Humidex 21.09°C
ESI 12.6°C
ESI 14.9°C
ESI 17.2°C
Egypt 2387 1725 1166 4318 3092 2095 4683 3274 2129 3449 2514 1670 2134 1534 1030
El Salvador 2638 1662 788 4778 2971 1413 6107 4097 2183 5961 4712 3368 3583 2744 1915
Equatorial Guinea 2479 1496 623 4491 2672 1117 6004 3988 2038 6263 5014 3667 3774 2934 2094
Eritrea 3622 2688 1820 6549 4818 3270 7834 5887 4118 5989 4758 3492 3610 2799 2041
Estonia 268 134 57 488 239 103 625 298 122 613 332 144 371 203 96
Ethiopia 1562 961 551 2832 1718 989 3450 2049 1102 3130 2059 1163 1868 1225 735
Finland 190 88 35 345 157 62 456 200 75 473 241 96 283 146 64
France 427 232 115 775 415 206 1002 523 248 1011 594 296 610 365 196
Gabon 3000 2017 1081 5429 3608 1940 7120 5105 3134 6860 5611 4263 4130 3290 2451
Gambia 3759 2783 1801 6795 4988 3235 8365 6367 4418 6736 5497 4182 4090 3262 2452
Georgia 216 104 47 394 186 84 554 254 106 648 357 163 392 226 115
Germany 304 155 70 553 277 126 737 363 159 784 447 215 473 276 143
Ghana 3656 2687 1707 6609 4816 3065 8603 6616 4667 7668 6432 5112 4578 3752 2935
Greece 1116 753 476 2021 1348 856 2301 1489 896 1860 1261 758 1130 763 474
Guatemala 2755 1788 888 4988 3197 1593 6330 4329 2425 6163 4915 3576 3710 2874 2051
Guinea 3577 2643 1744 6468 4737 3133 7723 5797 3963 6532 5326 4064 3944 3145 2372
Guinea-Bissau 4141 3176 2222 7483 5696 3993 8745 6760 4864 6812 5572 4274 4116 3293 2506
Haiti 3806 2820 1798 6881 5055 3228 8983 6966 4957 7949 6700 5352 4790 3949 3109
Honduras 2687 1709 816 4866 3055 1463 6244 4232 2299 6134 4884 3538 3689 2849 2017
Hungary 507 274 132 920 490 237 1241 670 319 1315 846 470 787 506 295
India 3519 2700 1919 6359 4842 3450 7622 5917 4342 5874 4787 3685 3540 2829 2160
Indonesia 3513 2527 1509 6353 4527 2709 8609 6593 4585 8043 6794 5446 4846 4006 3166
Iran 1628 1231 894 2943 2208 1607 2944 2120 1457 1791 1261 813 1152 812 539
Iraq 2870 2310 1803 5184 4147 3241 5123 3954 2946 3237 2477 1777 2004 1515 1097
Ireland 57 11 2 105 19 4 206 33 5 385 109 15 193 57 11
Italy 617 352 172 1120 629 309 1475 839 421 1525 997 583 907 594 358
Japan 994 588 276 1804 1050 495 2475 1555 851 2609 1942 1334 1548 1130 775
Jordan 1757 1249 833 3179 2239 1497 3472 2376 1522 2561 1817 1164 1600 1128 744
Kazakhstan 710 481 303 1285 861 545 1395 902 539 991 651 375 628 412 247
Kenya 1680 951 519 3050 1699 932 3928 2231 1149 3732 2529 1423 2211 1465 854
Kuwait 4021 3290 2614 7261 5907 4701 7183 5657 4308 4649 3662 2715 2847 2207 1636
Kyrgyz Rep. 167 95 46 303 171 83 312 167 76 164 78 27 128 64 25
Lao PDR 2454 1592 834 4444 2847 1496 5906 4069 2440 5817 4625 3401 3482 2701 1964
Latvia 276 135 57 502 241 102 663 313 127 687 379 170 410 230 111
Lebanon 1759 1197 733 3184 2144 1316 3791 2574 1591 3209 2359 1597 1953 1417 963
Lesotho 797 473 263 1446 846 473 1665 917 470 1350 778 373 853 510 278
Liberia 3451 2466 1456 6241 4418 2614 8205 6191 4190 7816 6567 5220 4712 3872 3033

22
A global degree days database for energy-related applications
CDD
Average 1964-2013
Temp 15.6°C
Temp 18.3°C
Temp 21.1°C
Temp 60°F
Temp 65°F
Temp 70°F
Heat Index
57.56°F
Heat Index
63.08°F
Heat Index
68.58°F
Humidex 13.98°C
Humidex 17.4°C
Humidex 21.09°C
ESI 12.6°C
ESI 14.9°C
ESI 17.2°C
Libya 2330 1718 1208 4214 3080 2171 4445 3155 2115 3068 2226 1478 1901 1360 914
Lithuania 290 142 60 527 253 108 701 333 136 735 413 190 439 250 123
Macedonia 763 488 292 1384 873 525 1596 965 543 1309 825 445 802 511 296
Madagascar 2024 1195 553 3669 2135 991 4735 2920 1454 4696 3481 2277 2824 2042 1341
Malawi 2372 1564 927 4295 2799 1664 5101 3364 1950 4380 3232 2122 2658 1921 1272
Malaysia 3206 2220 1212 5800 3973 2175 7826 5810 3804 7680 6431 5083 4630 3789 2949
Mali 4104 3221 2370 7414 5778 4261 8226 6420 4735 5937 4830 3707 3602 2878 2195
Mauritania 4520 3642 2807 8162 6537 5048 8409 6612 4975 5405 4299 3214 3304 2586 1935
Mexico 1607 986 529 2913 1763 950 3721 2296 1252 3565 2539 1606 2141 1509 982
Moldova 586 325 157 1065 580 282 1371 754 359 1343 868 477 805 517 296
Mongolia 443 284 167 803 509 301 847 513 282 532 309 148 357 212 110
Montenegro 608 365 203 1103 653 364 1319 748 389 1154 698 352 705 431 235
Morocco 1688 1222 847 3055 2190 1522 3204 2200 1442 2209 1511 942 1389 952 614
Mozambique 2754 1888 1129 4984 3381 2028 6110 4276 2660 5385 4196 2989 3257 2481 1757
Myanmar 2884 2046 1272 5217 3665 2285 6586 4825 3219 5855 4724 3565 3513 2772 2071
Namibia 2653 1978 1402 4797 3547 2520 4950 3540 2371 3257 2364 1535 2039 1462 973
Nepal 1299 844 494 2354 1510 887 3023 2000 1232 2737 2014 1370 1667 1212 832
Netherlands 195 74 27 357 132 48 524 184 60 642 291 95 367 170 64
New Zealand 263 83 20 482 147 36 743 228 50 966 430 126 528 238 81
Nicaragua 2747 1767 861 4975 3159 1545 6439 4425 2479 6354 5105 3758 3812 2973 2137
Niger 4278 3429 2616 7727 6154 4703 8424 6691 5093 5725 4671 3614 3478 2792 2150
Nigeria 3496 2577 1685 6320 4619 3028 7787 5900 4093 6628 5455 4225 3989 3213 2456
Norway 30 9 2 54 16 4 84 24 5 124 43 11 71 27 8
Oman 4212 3364 2570 7607 6036 4621 8210 6429 4823 5797 4641 3483 3499 2750 2057
Pakistan 3013 2368 1781 5444 4248 3201 6385 5026 3838 4567 3676 2822 2742 2167 1652
Palestine 1469 846 372 2666 1511 667 3475 2092 1052 3433 2432 1567 2069 1446 935
Panama 3588 2602 1580 6488 4662 2836 8500 6484 4475 8098 6849 5501 4865 4025 3185
Papua New 2480 1511 677 4494 2698 1213 5979 3967 2097 6138 4889 3543 3711 2871 2042
Paraguay 2359 1563 877 4271 2798 1574 5727 4015 2534 5438 4306 3165 3253 2517 1835
Peru 757 410 178 1375 732 320 1886 1063 511 2023 1335 791 1204 800 492
Philippines 3939 2953 1930 7120 5294 3468 9731 7714 5705 8491 7242 5894 5097 4257 3417
Poland 383 200 91 695 357 164 909 462 205 921 546 271 555 331 175
Portugal 615 275 111 1119 490 199 1556 694 247 1762 998 444 1003 569 270
Congo 2792 1810 874 5054 3236 1568 6736 4723 2752 6645 5396 4050 4005 3165 2328
Romania 460 242 112 835 432 202 1112 577 260 1157 719 377 691 430 239
Russia 410 233 120 745 417 215 940 520 256 902 568 305 543 341 192
Rwanda 1117 447 159 2036 795 284 3010 1282 448 3409 2175 1016 1975 1210 611
23
A global degree days database for energy-related applications
CDD Average 1964-2013
Temp 15.6°C
Temp 18.3°C
Temp 21.1°C
Temp 60°F
Temp 65°F
Temp 70°F
Heat Index
57.56°F
Heat Index
63.08°F
Heat Index
68.58°F
Humidex 13.98°C
Humidex 17.4°C
Humidex 21.09°C
ESI 12.6°C
ESI 14.9°C
ESI 17.2°C
Saudi Arabia 3669 2908 2213 6627 5219 3979 6632 5059 3684 4149 3158 2225 2574 1935 1381
Senegal 4037 3081 2127 7296 5526 3822 8672 6716 4829 6700 5491 4225 4068 3264 2487
Serbia 519 302 163 942 540 292 1181 656 335 1129 696 367 683 427 241
Sierra Leone 3821 2840 1838 6906 5090 3301 9004 6995 5008 7932 6685 5342 4765 3927 3093
Slovakia 405 212 97 736 378 174 976 501 223 1014 617 316 612 374 204
Slovenia 272 128 51 495 228 91 704 325 129 820 471 224 493 289 151
Somalia 4146 3169 2182 7493 5683 3921 8685 6681 4719 6809 5562 4227 4107 3272 2447
South Africa 1198 701 372 2174 1252 667 2643 1504 749 2362 1538 850 1437 928 538
South Korea 832 475 206 1509 849 369 2050 1249 640 2182 1602 1080 1305 940 632
South Sudan 3476 2501 1561 6285 4480 2804 7616 5618 3693 6490 5253 3942 3905 3079 2271
Spain 868 589 383 1573 1055 687 1771 1135 698 1414 923 544 879 580 359
Sri-Lanka 3745 2759 1738 6771 4944 3121 8761 6745 4737 8017 6768 5420 4827 3987 3147
Sudan 4241 3313 2411 7661 5943 4334 8365 6468 4683 5927 4761 3574 3590 2819 2097
Swaziland 1846 1155 618 3346 2065 1109 4191 2664 1451 3913 2854 1852 2361 1694 1112
Sweden 179 76 29 326 136 52 447 178 63 501 238 85 292 142 57
Switzerland 144 62 22 263 110 39 373 157 53 445 231 97 275 151 71
Syria 1852 1350 922 3350 2420 1657 3750 2669 1787 2892 2145 1474 1770 1297 898
Tajikistan 530 360 228 960 645 409 979 630 375 562 344 182 395 247 140
Tanzania 1801 1011 523 3269 1806 938 4176 2381 1162 3955 2747 1580 2364 1593 946
Thailand 3220 2277 1363 5825 4078 2447 7734 5775 3916 7092 5859 4554 4245 3424 2625
Togo 3621 2663 1706 6546 4772 3065 8344 6374 4459 7347 6117 4810 4357 3538 2733
Tunisia 1895 1323 863 3430 2369 1551 3922 2674 1710 3152 2270 1513 1911 1361 914
Turkey 919 626 402 1664 1121 722 1836 1187 719 1392 916 532 870 576 352
Turkmenistan 1957 1520 1136 3537 2727 2041 3506 2599 1844 2141 1562 1053 1356 985 681
Uganda 1470 603 187 2675 1069 334 3763 1819 526 4077 2829 1523 2418 1593 845
Ukraine 588 340 174 1067 608 311 1330 756 377 1238 800 444 747 480 276
United Arab Emirates
4351 3519 2748 7858 6317 4940 8252 6504 4942 5668 4530 3401 3429 2692 2019
United Kingdom 177 69 20 323 122 35 438 159 46 499 207 62 293 131 47
United States 1120 729 418 2029 1304 751 2603 1737 1058 2394 1785 1229 1452 1065 736
Uruguay 1341 808 422 2432 1444 758 3182 1965 1078 3110 2219 1424 1856 1303 846
Uzbekistan 1459 1115 822 2637 2001 1478 2602 1889 1316 1556 1100 719 1011 718 485
Venezuela 3263 2279 1311 5902 4080 2353 7559 5543 3563 6951 5701 4354 4193 3353 2513
Vietnam 2827 1956 1151 5115 3503 2066 6946 5108 3430 6464 5278 4052 3866 3084 2339
Yemen 3647 2776 1983 6592 4978 3565 7192 5356 3743 5226 4037 2852 3161 2390 1689
Zambia 2034 1293 765 3686 2313 1373 4335 2712 1496 3648 2583 1571 2227 1542 961
Zimbabwe 2048 1367 842 3708 2447 1513 4276 2807 1643 3481 2508 1588 2141 1518 979

24
A global degree days database for energy-related applications
HDD Average 1964-2013
Temp 15.6°C
Temp 18.3°C
Temp 21.1°C
Temp 60°F
Temp 65°F
Temp 70°F
Heat Index
57.56°F
Heat Index
63.08°F
Heat Index
68.58°F
Humidex 13.98°C
Humidex 17.4°C
Humidex 21.09°C
ESI 12.6°C
ESI 14.9°C
ESI 17.2°C
Albania 1747 2413 3216 3127 4359 5796 2787 4069 5582 1479 2171 3061 1517 2018 2596
Algeria 1186 1714 2360 2120 3097 4254 1937 2979 4232 1036 1629 2425 1061 1483 1995
Angola 184 369 750 328 670 1354 293 575 1158 151 272 488 154 257 436
Argentina 1162 1670 2329 2078 3018 4198 1870 2828 4044 1025 1529 2222 1010 1381 1837
Armenia 4068 4928 5871 7298 8890 10574 6689 8396 10227 4033 5000 6163 3941 4615 5346
Australia 650 1154 1839 1157 2090 3317 976 1907 3169 413 866 1562 480 829 1293
Austria 3775 4640 5600 6771 8371 10086 6169 7865 9710 3694 4641 5782 3631 4295 5018
Azerbaijan 3206 3970 4836 5749 7163 8711 5240 6742 8410 3117 3958 4991 3066 3660 4318
Bangladesh 113 217 383 202 394 691 154 331 611 55 126 255 87 157 257
Belarus 3937 4748 5668 7064 8565 10210 6498 8083 9844 3951 4840 5918 3904 4529 5217
Belgium 2346 3140 4045 4201 5671 7288 3734 5274 7013 2037 2866 3920 2104 2700 3373
Benin 25 72 163 45 132 294 42 128 281 27 76 164 36 83 150
Bolivia 1716 2340 3102 3071 4228 5589 2736 3937 5353 1515 2164 2998 1463 1916 2446
Bosnia-Herzegovina 2189 2903 3747 3921 5243 6751 3510 4882 6478 1960 2699 3639 1986 2518 3127
Botswana 626 948 1435 1118 1716 2587 1037 1647 2509 577 915 1405 564 816 1147
Brazil 88 216 497 156 392 898 108 287 691 38 88 211 54 110 217
Bulgaria 2400 3088 3901 4302 5574 7028 3889 5217 6756 2252 2981 3897 2243 2766 3360
Burkina Faso 53 140 292 93 255 527 105 284 572 84 206 399 94 198 334
Burundi 38 374 1108 65 686 2000 15 343 1556 2 25 260 10 100 369
Cambodia 3 16 66 5 29 120 2 15 74 0 2 10 1 4 15
Cameroon 25 71 321 45 129 581 44 108 341 27 60 117 27 56 101
Canada 4524 5357 6281 8120 9663 11312 7537 9191 10971 4616 5576 6701 4501 5164 5874
Central African Rep. 12 37 179 20 67 324 19 60 180 11 31 71 13 31 63
Chad 50 118 251 89 214 453 99 238 477 72 168 334 68 148 266
Chile 2588 3412 4322 4634 6161 7787 4236 5904 7692 2375 3371 4563 2340 3014 3745
China 2183 2724 3387 3914 4916 6102 3619 4657 5882 2199 2774 3491 2065 2474 2939
Colombia 35 262 797 60 480 1440 11 215 969 0 8 113 3 41 198
Costa Rica 0 0 1 0 0 1 0 0 0 0 0 0 0 0 0
Cote d'Ivoire 6 21 69 11 38 125 9 32 85 5 14 34 7 17 34
Croatia 2365 3095 3952 4236 5589 7121 3787 5187 6807 2140 2892 3841 2171 2712 3327
Cuba 0 0 3 0 0 5 0 0 2 0 0 0 0 0 0
Czech Rep. 3503 4337 5276 6281 7826 9503 5723 7352 9152 3416 4322 5424 3363 4001 4701
Congo DR 17 99 404 29 181 731 19 98 459 7 24 83 10 35 107
Denmark 2435 3282 4245 4360 5928 7648 3910 5555 7414 2170 3057 4193 2180 2816 3542
Dominican Rep. 0 0 0 0 0 0 0 0 0 0 0 0 0 0 0
East Timor 0 0 0 0 0 0 0 0 0 0 0 0 0 0 0
Ecuador 94 445 1083 163 811 1955 44 466 1471 2 34 277 13 111 389

25
A global degree days database for energy-related applications
HDD Average 1964-2013
Temp 15.6°C
Temp 18.3°C
Temp 21.1°C
Temp 60°F
Temp 65°F
Temp 70°F
Heat Index
57.56°F
Heat Index
63.08°F
Heat Index
68.58°F
Humidex 13.98°C
Humidex 17.4°C
Humidex 21.09°C
ESI 12.6°C
ESI 14.9°C
ESI 17.2°C
Egypt 531 855 1318 948 1548 2377 861 1468 2332 459 773 1277 465 705 1041
El Salvador 1 11 159 1 21 289 0 6 101 0 0 4 0 1 12
Equatorial Guinea 0 4 153 0 7 279 0 1 60 0 0 0 0 0 1
Eritrea 12 64 219 22 117 396 13 82 322 3 22 104 9 38 120
Estonia 4191 5042 5988 7519 9096 10786 6932 8621 10454 4234 5201 6362 4155 4827 5560
Ethiopia 239 624 1236 421 1134 2230 266 880 1943 77 256 707 136 333 683
Finland 4735 5619 6588 8497 10135 11866 7869 9630 11514 4833 5851 7054 4746 5450 6207
France 2407 3199 4104 4311 5777 7394 3841 5378 7112 2110 2943 3992 2165 2761 3431
Gabon 0 3 90 0 6 164 0 1 40 0 0 0 0 0 1
Gambia 3 14 55 6 26 99 5 23 83 2 12 45 4 17 46
Georgia 4078 4953 5918 7316 8935 10659 6682 8399 10259 4030 4988 6142 3955 4628 5358
Germany 3156 3994 4931 5658 7209 8883 5113 6755 8560 2974 3886 5002 2970 3612 4320
Ghana 8 26 68 14 47 122 11 40 100 6 19 47 9 23 46
Greece 1729 2352 3099 3095 4249 5583 2757 3961 5378 1498 2147 2992 1535 2007 2559
Guatemala 3 22 145 6 40 263 2 17 123 0 2 11 1 5 22
Guinea 31 83 206 55 150 372 48 137 312 25 68 154 32 73 140
Guinea-Bissau 6 27 95 10 49 172 6 36 150 1 10 59 4 21 74
Haiti 0 0 0 0 0 0 0 0 0 0 0 0 0 0 0
Honduras 0 8 138 0 16 250 0 4 80 0 0 2 0 1 8
Hungary 2918 3672 4552 5231 6627 8200 4729 6174 7833 2785 3565 4537 2789 3348 3977
India 304 471 713 543 852 1286 492 804 1237 263 425 671 281 410 581
Indonesia 0 0 5 0 0 8 0 0 1 0 0 0 0 0 0
Iran 2288 2878 3563 4102 5194 6419 3833 5025 6370 2362 3081 3981 2194 2694 3261
Iraq 1230 1656 2171 2203 2992 3913 2024 2870 3872 1160 1649 2297 1132 1483 1905
Ireland 2042 2982 3996 3649 5389 7200 3191 5033 7015 1510 2483 3737 1627 2331 3125
Italy 2101 2822 3665 3762 5098 6604 3333 4713 6304 1838 2560 3493 1877 2404 3008
Japan 1653 2233 2944 2960 4033 5305 2655 3751 5056 1499 2081 2821 1451 1873 2358
Jordan 999 1478 2085 1786 2673 3757 1620 2540 3695 854 1359 2054 871 1238 1695
Kazakhstan 4832 5589 6434 8675 10078 11588 8167 9690 11336 5113 6022 7094 4894 5519 6193
Kenya 68 325 916 119 594 1654 45 364 1291 3 49 291 24 118 347
Kuwait 434 690 1037 776 1248 1869 698 1189 1849 350 611 1012 371 571 840
Kyrgyz Rep. 6801 7715 8689 12214 13908 15647 11571 13442 15360 7381 8544 9841 6662 7438 8239
Lao PDR 94 218 483 167 396 872 120 300 680 44 100 224 63 121 225
Latvia 3960 4806 5750 7105 8670 10358 6524 8190 10014 3956 4898 6036 3898 4558 5279
Lebanon 659 1083 1641 1175 1960 2959 985 1784 2809 408 808 1393 495 799 1185
Lesotho 1743 2406 3219 3120 4346 5800 2843 4111 5673 1684 2361 3304 1570 2067 2674
Liberia 0 2 15 1 4 27 0 2 10 0 0 1 0 1 2

26
A global degree days database for energy-related applications
HDD Average 1964-2013
Temp 15.6°C
Temp 18.3°C
Temp 21.1°C
Temp 60°F
Temp 65°F
Temp 70°F
Heat Index
57.56°F
Heat Index
63.08°F
Heat Index
68.58°F
Humidex 13.98°C
Humidex 17.4°C
Humidex 21.09°C
ESI 12.6°C
ESI 14.9°C
ESI 17.2°C
Libya 690 1064 1577 1233 1925 2843 1129 1855 2825 605 1012 1612 620 920 1314
Lithuania 3805 4644 5584 6825 8378 10059 6254 7902 9714 3775 4702 5827 3726 4376 5090
Macedonia 2336 3046 3873 4184 5500 6978 3767 5153 6740 2140 2905 3873 2147 2697 3322
Madagascar 55 213 593 96 388 1071 44 246 788 5 39 183 21 79 219
Malawi 106 284 669 186 517 1208 133 412 1007 40 140 378 69 172 362
Malaysia 0 0 15 0 0 28 0 0 4 0 0 0 0 0 0
Mali 81 184 356 143 333 642 158 369 693 114 256 480 120 236 393
Mauritania 88 196 385 156 357 694 163 383 755 108 252 514 117 240 428
Mexico 405 771 1337 721 1397 2410 572 1163 2128 256 480 895 309 518 831
Moldova 2989 3714 4569 5361 6702 8231 4895 6294 7908 2934 3708 4665 2887 3438 4058
Mongolia 6519 7346 8252 11710 13242 14860 11162 12844 14622 7040 8066 9254 6639 7334 8072
Montenegro 2409 3152 4013 4316 5692 7229 3878 5323 6974 2198 2991 3993 2202 2769 3413
Morocco 1088 1607 2255 1944 2906 4064 1735 2748 3998 901 1452 2231 959 1363 1865
Mozambique 82 202 466 145 368 842 103 285 678 33 94 234 53 116 233
Myanmar 229 377 626 409 683 1129 353 608 1011 177 294 483 202 302 441
Namibia 603 914 1360 1077 1653 2453 1046 1652 2492 624 980 1500 569 833 1183
Nepal 1374 1905 2578 2460 3442 4645 2230 3224 4464 1281 1807 2511 1250 1635 2095
Netherlands 2351 3216 4191 4208 5809 7551 3767 5443 7328 2039 2937 4089 2058 2701 3434
New Zealand 1130 1936 2896 2013 3504 5219 1640 3142 4973 628 1342 2385 784 1335 2017
Nicaragua 0 6 123 0 10 223 0 2 65 0 0 1 0 0 5
Niger 124 261 470 220 473 848 247 531 942 179 375 665 180 335 533
Nigeria 52 119 251 91 217 452 91 221 423 58 134 252 64 127 210
Norway 4890 5855 6871 8773 10561 12375 8077 10033 12023 4895 6064 7380 4773 5569 6390
Oman 123 261 490 217 473 884 169 405 807 62 156 345 90 181 328
Pakistan 900 1241 1676 1611 2242 3021 1465 2122 2943 827 1185 1679 826 1090 1415
Palestine 263 626 1175 465 1137 2119 330 964 1933 84 333 815 147 364 693
Panama 0 0 0 0 0 0 0 0 0 0 0 0 0 0 0
Papua New Guinea 0 16 205 0 31 372 0 5 143 0 0 2 0 1 12
Paraguay 222 413 749 396 749 1351 311 615 1143 128 245 451 158 262 421
Peru 1250 1889 2680 2233 3416 4831 1874 3066 4524 904 1464 2268 966 1401 1934
Philippines 0 0 0 0 0 0 0 0 0 0 0 0 0 0 0
Poland 3362 4166 5080 6030 7518 9151 5500 7070 8821 3287 4161 5234 3258 3875 4558
Portugal 787 1434 2293 1401 2598 4133 1079 2234 3795 395 880 1675 519 925 1466
Congo 0 5 92 1 9 167 0 3 41 0 0 2 0 1 4
Romania 3198 3967 4860 5736 7158 8755 5233 6714 8406 3131 3943 4948 3088 3667 4316
Russia 4797 5606 6515 8611 10110 11733 8026 9623 11367 4952 5867 6952 4866 5505 6195
Rwanda 33 350 1084 57 642 1957 11 299 1474 1 16 205 7 82 322

27
A global degree days database for energy-related applications
HDD Average 1964-2013
Temp 15.6°C
Temp 18.3°C
Temp 21.1°C
Temp 60°F
Temp 65°F
Temp 70°F
Heat Index
57.56°F
Heat Index
63.08°F
Heat Index
68.58°F
Humidex 13.98°C
Humidex 17.4°C
Humidex 21.09°C
ESI 12.6°C
ESI 14.9°C
ESI 17.2°C
Saudi Arabia 357 583 911 638 1056 1642 615 1058 1692 360 618 1033 341 542 828
Senegal 17 47 115 30 86 208 32 92 215 23 63 145 26 63 125
Serbia 2934 3703 4586 5259 6683 8262 4765 6256 7944 2796 3612 4631 2782 3366 4020
Sierra Leone 2 7 28 3 14 51 2 9 31 0 2 7 1 3 9
Slovakia 3355 4148 5056 6017 7485 9107 5490 7030 8762 3290 4142 5189 3248 3851 4520
Slovenia 3403 4245 5190 6101 7660 9349 5534 7172 8984 3278 4178 5280 3241 3878 4580
Somalia 2 11 47 4 21 85 2 13 61 0 3 16 2 6 21
South Africa 969 1458 2152 1733 2637 3879 1554 2430 3684 885 1311 1970 840 1171 1621
South Korea 2094 2724 3477 3753 4919 6265 3411 4626 6026 1999 2668 3494 1884 2359 2891
South Sudan 2 14 97 4 25 176 4 22 106 4 16 52 5 18 51
Spain 1920 2627 3443 3436 4745 6204 3084 4464 6037 1679 2437 3406 1693 2234 2853
Sri-Lanka 0 0 2 0 0 3 0 0 1 0 0 0 0 0 0
Sudan 47 105 227 84 191 409 91 210 434 64 147 308 61 130 248
Swaziland 305 600 1086 543 1088 1959 412 902 1697 147 337 682 207 380 638
Sweden 3633 4517 5492 6514 8151 9893 5935 7682 9575 3539 4526 5720 3483 4173 4928
Switzerland 4243 5148 6130 7612 9286 11042 6957 8758 10664 4202 5237 6451 4100 4815 5576
Syria 1201 1685 2279 2149 3045 4108 1923 2858 3984 1039 1542 2218 1051 1418 1859
Tajikistan 4454 5271 6161 7995 9506 11096 7497 9164 10918 4731 5762 6948 4374 5067 5799
Tanzania 45 241 775 78 441 1399 39 260 1051 7 48 229 21 89 282
Thailand 22 64 173 38 117 312 26 83 233 8 24 67 14 34 75
Togo 13 41 108 23 76 195 18 64 157 8 28 69 14 36 71
Tunisia 550 964 1527 979 1745 2753 835 1603 2648 382 750 1341 445 736 1129
Turkey 2586 3280 4078 4636 5919 7347 4232 5600 7140 2482 3255 4219 2426 2973 3588
Turkmenistan 2140 2689 3327 3837 4853 5994 3588 4698 5952 2201 2871 3710 2061 2531 3067
Uganda 7 126 732 12 233 1324 2 74 791 0 2 43 1 16 109
Ukraine 3298 4037 4893 5916 7284 8813 5439 6882 8512 3293 4104 5096 3220 3793 4430
United Arab Emirates
154 308 559 274 559 1009 219 486 934 84 194 413 116 220 387
United Kingdom 2256 3134 4108 4037 5662 7402 3584 5321 7216 1850 2806 4010 1922 2600 3356
United States 2347 2942 3654 4209 5310 6583 3859 5010 6339 2310 2950 3741 2241 2695 3205
Uruguay 681 1134 1771 1214 2053 3193 1008 1808 2929 449 807 1359 513 800 1183
Uzbekistan 2649 3292 4021 4751 5940 7244 4442 5746 7182 2739 3532 4499 2566 3113 3720
Venezuela 0 2 57 0 4 104 0 0 29 0 0 0 0 0 1
Vietnam 111 227 444 198 412 801 150 329 659 58 122 243 75 134 229
Yemen 70 185 415 124 336 749 94 275 671 39 100 263 52 121 260
Zambia 207 452 946 367 821 1707 320 712 1506 142 326 661 170 326 585
Zimbabwe 428 734 1232 764 1329 2221 676 1223 2068 325 600 1028 356 574 875

KA
PS
AR
C D
iscussio
n P
aper
About the research team
Tarek Atallah is a Senior
Research Analyst evaluating
energy productivity investments,
economics of energy
vulnerability, and the effect of
climate on energy consumption
patterns.
Alessandro Lanza is a Senior
Visiting Fellow and an expert in
the fields of energy
and environmental markets,
economics and climate change
policy. He has written more
than 50 papers and books on
energy policy, climate change,
sustainable development.
Silvio Gualdi is head of
the Climate Simulations and
Predictions Division at the Euro-
Mediterranean Centre on Climate
Change. His research focuses
primarily on investigating the
mechanisms of climate variability
and climate change.
About the project
The CMCC-KAPSARC Database is a comprehensive open source database that includes heating
and cooling degree days for 147 countries spanning 60 years. In addition to being a source for
traditional temperature-based degree days, the team has presented a novel approach that
incorporates the effect of humidity and solar radiation by deriving degree days from thermal
comfort indices. Its intent is to provide a quantitative means for assessing climatic effects when
performing energy-related analyses.
Please see the link below for the CMCC-KAPSARC Database:
http://www.kapsarc.org/en/Documents/KAPSARC-CMCC%20Enhanced%20Degree%20Days%
20%20Database%20March%202015.xlsx