iowa agriscope 2030 - home | iowa soybean association · charged with developing a comprehensive,...
TRANSCRIPT

Iowa AgriScope 2030

The report is organized in a chapter format
Chapter 6: Appendix
A | Summary of Steering Committee Meetings 365-369
B | Final Steering Committee Meeting Prioritization Exercise
Results 370-434
C | Responsibilities 435-555
Priority Strategies, Recommendations & Actions organized by
Who is Responsible
Secondary Strategies, Recommendations & Actions organized by
Who is Responsible
D | Resources 556-559
Chapter 1: Introduction 3-11
Background | Process
Economic Importance of Iowa Agriculture
Chapter 2: Executive Summary 12-37
Goal & Strategic Framework
Priority Strategies including Recommendations
Secondary Strategies including Recommendations
Chapter 3: Full Report 38-161
Goal & Strategic Framework
Priority Strategies including Recommendations, Actions,
Rationale & Responsibilities
Secondary Strategies including Recommendations, Actions,
Rationale & Responsibilities
Chapter 4: Situational Analysis 162-184
Chapter 5: Value Chains/Competitiveness Assessments 185-363
Corn | Soybeans | Pork | Beef | Dairy
Eggs | Turkeys | Biofuels
Report Contents1
2
Report
Appendices
Slide Navigation Icons:
Return to Table of Contents slide
Return to previous slide
2 | Context | Iowa AgriScope 2030

Chapter 1: Introduction
3 | Context | Iowa AgriScope 2030

Charged with developing a comprehensive, credible and practical plan
to strengthen and grow Iowa agriculture
Background– “Iowa will lead the world in agriculture, doubling production of our crops and value-added products while increasing
personal income, creating value and creating jobs. This plan will address systems to better handle, store, transport and transfer the increased production of agricultural crops, renewables, energy and added products,” according to Iowa Governor Terry Branstad in September 2010.
Project Objective– A comprehensive, credible, practical plan that Iowa leaders may use to strengthen and build Iowa’s agriculture, food,
fiber, alternative energy and supporting services sectors.
Project Sanctioned by Governor Terry Branstad and Secretary of Agriculture Bill Northey– Both the Governor and the Secretary endorsed and participated in the project. However, this did not indicate an
automatic endorsement of the final product.
Components– Five Context team members conducted extensive research and interviews.
– Twenty Iowa leaders provided feedback and direction through Steering Committee participation.
– One hundred interviewees provided insights into specific aspects of Iowa’s agriculture, food, fiber, alternative energy and supporting services sectors.
Timeline– February to November 2011
Conceived of and Funded by– Iowa Soybean Association, Iowa Pork Producers Association, and Iowa Corn Growers Association
4 | Context | Iowa AgriScope 2030

The Steering Committee chosen represented a diverse cross-section of
thought leaders throughout Iowa agriculture
5 | Context | Iowa AgriScope 2030
James Borel, DuPont/Pioneer
Don Borgman, farmer and John Deere
Bill Couser, cattleman and ethanol
entrepreneur
Rich Degner, Iowa Pork Producers
Association
Kaye DeLange, Cargill Eddyville Plant
Debi Durham, Iowa Department of Economic
Development
Dermot Hayes, Iowa State University (ISU)
professor and Pioneer Chair in
Agribusiness
Dakota Hoben, ISU student and former Iowa
FFA officer
Kirk Leeds, Iowa Soybean Association
Ron Litterer, farmer and Iowa Corn Growers
Association representative
Jim Knuth, Farm Credit Services of Iowa
David Miller, Iowa Farm Bureau
Bill Northey, Iowa Secretary of Agriculture
Craig Rowles, DVM, pork producer and
entrepreneur
Jeff Strohburg, West Central Cooperative
Roger Underwood, Becker Underwood co-
founder and venture investor
Kevin Vinchattle, Iowa Poultry Association
Paul Willis, pork producer and Niman Ranch
Wendy Wintersteen, dean, ISU College of
Agriculture and Life Sciences
Noel White, Tyson
The Steering Committee met three times for facilitated, productive feedback and guidance and
were interviewed individually.

Comprehensive and methodical process was designed and executed to
capture high-level strategy as well as detailed actions
6 | Context | Iowa AgriScope 2030
Feb thru Apr May thru July Aug thru Oct November
• Steering
Committee (SC)
Selection
• Situation analysis
• SC meeting to define
opportunities and
obstacles
• Research and
analysis
• Clarification interviews
• Secondary research
• Priority analysis and
report completion
• Governor
• Sponsors
Preparation Data Collection Analysis Presentation
• SC interviews
• Key opinion leader
interviews
• Secondary research
• SC meeting to review,
recommend, and
prioritize growth
opportunities
• SC meeting to prioritize
recommendations

Engaged nearly 100 key opinion leaders on discussions regarding
Iowa’s opportunities in agricultural economic development
7 | Context | Iowa AgriScope 2030
Expertise of respondents reflect a diverse cross section of Iowa agriculture
Approach
Key Opinion
Leaders
96 executive-style interviews completed
–Performed with open-ended questions that were
administered in a conversational style
– In-depth, duration between 45-90 minutes
– ‘Face-to-face’ with all Steering Committee members
Crop Producers (Row crop, Fruit/Vegetable)
Livestock Producers (Pork, Beef, Poultry/Eggs, Dairy)
Organic/Local/Fresh Producer & Processor
Cooperatives/Retailers
Organizations/Associations
Co-Products/Specialty Crops
Grain Handling/Processing
Ag. Research/Innovation
Seed
Ag. Chemicals
Ag. Equipment
Energy (Ethanol, Electric)
Food Manufacturing/Meat Processing
Grocery/Downstream Consumer
Transportation (Railway, Roads, Rivers)
Information Technology
Education
Legal
Entrepreneurial Investment Community
Natural Resources
Next Generation of Agriculture
Sustainability
Support Services – Banking/Financing, Economic Development
State Government
Interviews distributed throughout Iowa

Economic Importance of Iowa Agriculture
8 | Context | Iowa AgriScope 2030

The agriculture industry is and will continue to be a driving force in the
global marketplace
9 | Context | Iowa AgriScope 2030
Source: FAO data and projections
World demand for cereals, 1965 to 2030
“Iowa has a rich tradition of exporting its agricultural know-how to the world, best illustrated by Roswell Garst and John Chrystal . . . . The World Food Prize presents a fresh opportunity for Iowa to continue that tradition in bigger and better ways of being an international leader in agriculture and food security.”
World average meat consumption,
per person, 1964 to 2030
Source: The Des Moines Register, Editorial, October 15, 2011

Iowa is an important and large contributor to the US agricultural
economy
10 | Context | Iowa AgriScope 2030
Zoom
In 2009, Iowa was second only to California
in supplying agriculture commodities for US
utilization, consumption and for global trade.
“You are the Silicon Valley of ag biosciences. Youhave assets here that exist nowhere else in the world.You have a perfect storm of opportunities coming together, in terms of . . . . the powerhouse global multinationals in ag biosciences, some of the best research universities in the world, with tremendous resource assets, and of course the land.” - Simon Tripp, BMI, Ohio
Commodity (2009, % of US) Rank
Corn (18%) #1
Soybeans (15%) #1
Hogs (28%) #1
Eggs (16%) #1
Cattle #4 to 6
Source: USDA-ERS and NAS
Source: USDA

The agriculture industry is a critical factor to Iowa’s GSP and
employment as well as individual household income
11 | Context | Iowa AgriScope 2030
Agriculture employment = 332,000
Or more than 16% of Iowa’s total 1.946M
“In 2008, this engine of economic growth created $26.3 billion in agriculture production value in the
state. Currently, increased federal and state regulatory actions have created an environment non-supportive of increased productivity, innovation and
job creation. The lack of regulatory stability is driving business out of the state and causing those
who remain to limit or eliminate additional investment in their businesses and employees.”
Governor Terry BranstadIowa’s farm households are 2½ times more
dependent on farm income than the average
US farmer
Zoom

Chapter 2: Executive Summary
12 | Context | Iowa AgriScope 2030

Goal & Strategic Framework
13 | Context | Iowa AgriScope 2030

Early in the process, a simple yet powerful goal was articulated
14 | Context | Iowa AgriScope 2030
Increase the Size and Scope
of Iowa Agriculture

15 | Context | Iowa AgriScope 2030
Increase the Size and Scope of Iowa Agriculture
Expansion of Iowa agriculture’s
economic activity requires a rock-
solid foundation, so this project
began with an exploration of what
can be done to protect and improve
Iowa’s existing strengths.
With a strong foundation, Iowa
agriculture can expand in several
directions, depicted as four
opportunities in the top half of the
graphic.
Using analysis and Steering Committee input, a vision was developed to
depict the areas of focus most essential to achieve the goal

Objectives
Strategies
Leadership
This strategic framework was built on nearly 100 interviews and
Steering Committee discussion
16 | Context | Iowa AgriScope 2030
GoalIncrease the size
and scope of Iowa agriculture
Protect Comparative Advantages
Strong Soil, Safe Water
Qualified, Adequate Workforce
Improved Transportation Infrastructure
Improve Business Climate
Reasonable Regulations &
Taxes
Business Environment
Encourage Innovation
World Class Research & Education
Innovation Reputation
Expand Economic Activity
Build the Base
Add Value
Expand Exports
Nurture the New

Objectives
Strategies
Leadership
Priorities within the Strategic Framework were identified with support
from the Steering Committee
17 | Context | Iowa AgriScope 2030
GoalIncrease the size
and scope of Iowa agriculture
Protect Comparative Advantages
Strong Soil, Safe Water
Qualified, Adequate Workforce
Improved Transportation Infrastructure
Improve Business Climate
Reasonable Regulations &
Taxes
Business Environment
Encourage Innovation
World Class Research & Education
Innovation Reputation
Expand Economic Activity
Build the Base
Add Value
Expand Exports
Nurture the NewPriority Strategies Secondary Strategies

Recommendations were developed for all Strategies and prioritized with
support from the Steering Committee
18 | Context | Iowa AgriScope 2030
Objectives
Strategies
Recommendations
Protect Comparative Advantages
Strong Soil, Safe Water
Re-energize Iowa’s commitment to soil
stewardship, addressing both retention and quality
concerns.
Protect Iowa’s ground water and surface water while
optimizing efficient utilization for both production &
processing.
Prioritize vulnerable landscapes and soils for
federal and state incentive programs.
Priority Recommendations Secondary Recommendations
EXAMPLE

Actions, rationales and responsibilities were designated for each
recommendation (an example can be found in the next three slides)
19 | Context | Iowa AgriScope 2030
Strategies
Recommendations
Actions
EXAMPLEStrong Soil, Safe Water
Re-energize Iowa’s commitment to soil
stewardship, addressing both retention
and quality concerns.
Work toward and maintain a limit of soil loss tolerance (T) or
less.
Protect and retain current soil saving structures/practices
and resist incentives to farm through or over them.
Research use of cover crops as a potential mitigation for
soil loss created by the increasing number of heavy rain
events in Iowa.
Encourage landlords to use leases that include incentives
for improving the quality of their soil and conservation
practices.
Promote the value of adding organic matter to Iowa soils by
proving long-term enhancement of productive capacity and
retention of top soil.
Employ practices recommended to increase organic carbon
levels in soil such as no-till, cover crops, crop rotation and
use of livestock manure for fertilizer.
Educate landlords about the value of their asset and the
potential to lose that value through tillage practices that do
not protect the soil from eroding and losing organic matter.

20 | Context | Iowa AgriScope 2030
Protect Comparative Advantage
Re-energize Iowa’s commitment to soil stewardship, addressing
both retention and quality concerns.
Reco
m.
Strong Soil, Safe Water
Strateg
y
Workforce
Soil &
Water
Transportation
Infrastructure
• Work toward and maintain a limit of soil loss tolerance (T) or less.
• Protect and retain current soil saving structures/practices and resist incentives
to farm through or over them.
• Research use of cover crops as a potential mitigation for soil loss created by
the increasing number of heavy rain events in Iowa.
• Educate landlords about the value of their asset and the potential to lose that
value through tillage practices that do not protect the soil from eroding and
losing organic matter.
• Encourage landlords to use leases that include incentives for improving the
quality of their soil and conservation practices.
• Promote the value of adding organic matter to Iowa soils by proving long-term
enhancement of productive capacity and retention of top soil.
• Employ practices recommended to increase organic carbon levels in soil such
as no-till, cover crops, crop rotation and use of livestock manure for fertilizer.
Actio
ns
EXAMPLE

21 | Context | Iowa AgriScope 2030
Iowa is blessed with some of the most productive soil on earth, and
Iowa producers have long recognized the value of protecting those
soils. As costs of production increase, though, many find it tempting to
till vulnerable land or employ tillage systems that are less than
protective. Both farmers and landowners are encouraged to recommit to
saving soil and, in fact, improving its quality when possible. Leadership
levels of production and soil stewardship can be achieved through a
continuing quest for reduced tillage practices, appropriate balances of
livestock manure and other nutrient sources, and emerging production
technologies.
According to an ISU study, compaction, erosion and loss of organic
matter have led to a decline in the quality of Iowa’s soils over the past
50 years. Organic matter content in Iowa soils has dropped from an
average of 10% to two percent. However, regaining soil quality can be
achieved by adding organic matter and employing tillage methods that
reverse compaction and reduce erosion
Strong Soil, Safe Water - Rationale
Re-energize Iowa’s commitment to soil stewardship, addressing both retention and quality
concerns.
Sources: Soil Quality, Better Lawns Made Easy, Polk Soil & Water Conservation District and Iowa Storm
Water Education Program; ISU Research: Iowa has lower-quality topsoil than 50 years ago,
EXAMPLE
Photo Source: ISU Extension – Agronomy

22 | Context | Iowa AgriScope 2030
Strong Soil, Safe Water - Responsibilities
Re-energize Iowa’s commitment to soil stewardship, addressing both retention and quality
concerns.
Actions Team Leader(s) Team Member(s)
Work toward and maintain a limit of soil loss tolerance
(T) or less.IDALS Ag Producers, SWCDs
Protect and retain current soil saving
structures/practices and resist incentives to farm
through or over them.
Ag Producers
Research use of cover crops as a potential mitigation
for soil loss created by the increasing number of heavy
rain events in Iowa.
ISU
Educate landlords about the value of their asset and
the potential to lose that value through tillage practices
that do not protect the soil from eroding and losing
organic matter.
SWCDs USDA NRCS, ISU, Ag Producers
Encourage landlords to use leases that include
incentives for improving the quality of their soil and
conservation practices.
IDALS, Ag Producers, SWCDs ISU
Promote the value of adding organic matter to Iowa
soils by proving long-term enhancement of productive
capacity and retention of top soil.
SWCDs USDA NRCS, IDALS, Ag Producers
Employ practices recommended to increase organic
carbon levels in soil such as no-till, cover crops, crop
rotation and use of livestock manure for fertilizer.
Ag Producers
EXAMPLE

23 | Context | Iowa AgriScope 2030
Priority StrategiesIncluding Recommendations

24 | Context | Iowa AgriScope 2030
Protect Comparative Advantage
• Re-energize Iowa’s commitment to soil stewardship, addressing both retention
and quality concerns.
• Protect Iowa’s ground and surface water while optimizing efficient utilization for
both production and processing.
• Prioritize vulnerable landscapes and soils for federal and state incentive
programs.
Reco
mm
end
ation
s
Strong Soil, Safe Water
Through producers’ adoption of innovative tillage methods and
technologies, achieve optimum quality levels for Iowa soils and
limit soil loss to replacement levels. Eliminate water quality
concerns, and assure abundant, clean water supplies that provide
an advantage when attracting and growing agriculture-related
manufacturing and processing.
Strateg
y
Workforce
Soil &
Water
Transportation
Infrastructure
Black = Priority Recommendation Gray = Secondary Recommendation

25 | Context | Iowa AgriScope 2030
• Effect lasting improvement to the state regulatory and permitting processes.
• Administer reasonable, fair and relevant regulatory enforcement.
• Determine the effect that Iowa’s business tax ranking is having on the retention
and attraction of bio based businesses to Iowa.
Reco
mm
end
ation
s
Reasonable Regulations and Taxes
Adopt only regulations that are effective and sufficient to protect
Iowans and Iowa’s resources and that are based on science:
reasonable, consistent and practical. Assure a competitive
business tax structure and economic development incentives.
Strateg
y
Improve
Business Climate
Black = Priority Recommendation Gray = Secondary Recommendation
Business Environment
Regulations & Taxes

26 | Context | Iowa AgriScope 2030
• Support, to the greatest extent possible, research and innovation that builds
Iowa's agriculture production and value added endeavors.
• Recognize the value of research as both a basis and a catalyst for innovation
and provide Iowa's public research institutions with the resources needed to
effectively foster innovation.
• Establish and foster an innovative and entrepreneurial climate throughout
Iowa’s education systems.
• Strengthen the exchange of knowledge between science and
business/industry.
Reco
mm
end
ation
s
World Class Research and Education
Assure that Iowa State University is second to none in its
agriculture and related sectors’ research, development and
education, due to leadership levels of funding and focused
administration. Gain global respect for Iowa’s public and private
research communities. Develop education systems that provide
knowledge and training for the many jobs to be created in
agriculture production and related processing and support sectors.
Strateg
y
Encourage
Innovation
Innovation Reputation
Research & Education
Black = Priority Recommendation Gray = Secondary Recommendation

27 | Context | Iowa AgriScope 2030
• Increase the production of established Iowa commodities, both crop and
livestock.
Reco
mm
end
ation
s
Build the Base
Meet both local and world demand by increasing production of
Iowa’s leading agriculture crops, livestock and products. Lead the
world in quality and reliability with Iowa’s diverse spectrum of
commodities that are raised via innovative and sustainable
production methods.
Strateg
y
Build
the Base
Black = Priority Recommendation Gray = Secondary Recommendation

28 | Context | Iowa AgriScope 2030
• Lead efforts to open markets for Iowa commodities and value-added products.
• Include Iowa-based animal health products and production systems in
promotion efforts, as livestock production continues to increase globally.
• Promote and market Iowa agriculture and processing knowledge, expertise and
management skills: Knowledge based consulting for bio fuels processing, food
safety, food processing, livestock production, etc.
Reco
mm
end
ation
s
Expand Exports
Lead the US in export of basic commodities and processed bio
products due to Iowa’s great productivity and even greater
reputation for high quality production and processing.
Strateg
y
Expand Exports
Black = Priority Recommendation Gray = Secondary Recommendation

29 | Context | Iowa AgriScope 2030
• Build on global leadership in value-added products (i.e. bio-fuels, meat and
other food processing).
• Add value to the value-added and build on the success of Iowa businesses.
• Recruit further processing businesses to locate and grow in Iowa, especially in
rural communities.
• Develop infrastructure and systems that support segregation, storage,
movement and marketing of value-added crops and products, specialty crops,
livestock, etc.
Reco
mm
end
ation
s
Add Value
Utilize cutting edge technologies and Iowa’s quality workforce to
convert an abundance of basic commodities and cutting edge
technologies, systems into value-added products.
Strateg
y
Add Value
Black = Priority Recommendation Gray = Secondary Recommendation

30 | Context | Iowa AgriScope 2030
Secondary StrategiesIncluding Recommendations

31 | Context | Iowa AgriScope 2030
Protect Comparative Advantage
• Influence Congress to appropriate funding for lock expansion projects on the
Upper Mississippi and Illinois rivers authorized in the 2007 Water Resources
Development Act.
• Assure that the Missouri River is maintained as a viable option for commercial
movement of western Iowa commodities and related products into the
extensive US inland waterway system and global markets.
• Plan for projected increases in Iowa crop and livestock production, food and
fuel processing and manufacturing, and resultant truck traffic increases.
• Assure adequate freight rail line capacity, access and provider options to serve
agricultural production and processed product rail needs.
Reco
mm
end
ation
s
Improved Transportation Infrastructure
Build a healthy mix of transportation systems that give producers,
processors, manufacturers and input providers the options they
need for competitive pricing and market access flexibility. Costs to
move Iowa’s products to national and world markets are as low as
any competing state or country.
Strateg
y
Workforce
Soil &
Water
Transportation
Infrastructure
Black = Priority Recommendation Gray = Secondary Recommendation

32 | Context | Iowa AgriScope 2030
Protect Comparative Advantage
• Educate, recruit, attract and retain a workforce with knowledge of and passion
about production agriculture, processing and the businesses that serve
agriculture and processing.
Reco
mm
end
ation
s
Qualified, Adequate Workforce
Create opportunities in the bio economy that encourage the best
and brightest to remain in Iowa and become involved in aspects of
the broad agriculture field. Educate and prepare Iowans to take
leadership roles, advancing technology and developing
innovations that improve Iowa’s agriculture production and
processing sectors. Assure that there is enough available labor to
meet needs.
Strateg
y
Workforce
Soil &
Water
Transportation
Infrastructure
Black = Priority Recommendation Gray = Secondary Recommendation

33 | Context | Iowa AgriScope 2030
• Convince Iowa businesses and those considering locating or investing here
that Iowa is “Open for Business” and is ready to help resolve problems or
share opportunities.
• Support the new Iowa Partnership for Economic Progress (I-PEP) and its
public-private approach to economic development. Assure the new system is
supportive of a bio based economy and that its needs are prioritized.
• Assure broadband transmission is available to Iowa communities for use by
agriculture businesses, processing businesses, input providers and assure the
integrity of satellite transmissions to GPS receivers.
Reco
mm
end
ation
s
Supportive Business Environment
Develop a reputation for a progressive and supportive form of
government economic development that helps established
businesses resolve problems and new businesses more easily
establish, grow, and prosper. Create a business climate that
encourages commodity processing and further processing
businesses to start in Iowa, come to Iowa and create Iowa jobs.
Strateg
y
Improve
Business Climate
Black = Priority Recommendation Gray = Secondary Recommendation
Business Environment
Regulations & Taxes

34 | Context | Iowa AgriScope 2030
• Create a climate for innovation in agriculture, food, fiber, f(ph)armaceutical and
renewable fuel businesses, and in the supporting sciences.
• Encourage and support entrepreneurism.
Reco
mm
end
ation
s
Innovation Reputation
Strive to make Iowa known for its culture of innovation and
technology development, and develop valuable support systems
for both. Once those systems are firmly in place, protect them for
use by Iowa’s business, academia and government leaders.
Support entrepreneurism with actions that help translate
innovation into increased economic activity.
Strateg
y
Encourage
Innovation
Innovation Reputation
Research & Education
Black = Priority Recommendation Gray = Secondary Recommendation

35 | Context | Iowa AgriScope 2030
• Provide an environment in which non-traditional ideas, farming operations and
businesses may establish a foothold and grow.
• Review the needs of new, innovative agriculture production and processing and
prioritize efforts to help with those needs.
• Assist ‘new to Iowa’ production and processing in their efforts to access
investment capital.
Reco
mm
end
ation
s
Nurture the New
Embrace diversity in agriculture production to provide food and
other agriculture products for a variety of markets, especially
Iowans who prefer locally-sourced and/or organic foodstuffs.
Strateg
y
Nurture
the New
Black = Priority Recommendation Gray = Secondary Recommendation

36 | Context | Iowa AgriScope 2030
• Lead campaign to increase the size and scope of Iowa agriculture.
• Achieve effective collaboration between agriculture and related sectors by
encouraging formation of an organization or system that becomes a foundation
for cooperation and issue prioritization across Iowa’s diverse agriculture sector.
Reco
mm
end
ation
s
Leadership
Black = Priority Recommendation Gray = Secondary Recommendation
Leadership
Iowa’s government, business and association leaders believe in
the importance of agriculture and associated sectors to Iowa’s
economy and align their efforts to maintain growth. They are
supported in their efforts by a cohesive industry that sets priorities
and proves itself worthy of leadership’s efforts.
Strateg
y

Questions
For Further Information,
Please Contact:
THE CONTEXT NETWORK4401 Westown Parkway, Suite 214
West Des Moines, IA 50266
Phone: 515/225-2204
Fax: 515/225-0039
www.contextnet.com
37 | Context | Iowa AgriScope 2030

Chapter 3: Full Report
38 | Context | Iowa AgriScope 2030

Goal & Strategic Framework
39 | Context | Iowa AgriScope 2030

Early in the process, a simple yet powerful goal was articulated
40 | Context | Iowa AgriScope 2030
Increase the Size and Scope
of Iowa Agriculture

41 | Context | Iowa AgriScope 2030
Increase the Size and Scope of Iowa Agriculture
Expansion of Iowa agriculture’s
economic activity requires a rock-
solid foundation, so this project
began with an exploration of what
can be done to protect and improve
Iowa’s existing strengths.
With a strong foundation, Iowa
agriculture can expand in several
directions, depicted as four
opportunities in the top half of the
graphic.
Using analysis and Steering Committee input, a vision was developed to
depict the areas of focus most essential to achieve the goal

Objectives
Strategies
Leadership
This strategic framework was built on nearly 100 interviews and
Steering Committee discussion
42 | Context | Iowa AgriScope 2030
GoalIncrease the size
and scope of Iowa agriculture
Protect Comparative Advantages
Strong Soil, Safe Water
Qualified, Adequate Workforce
Improved Transportation Infrastructure
Improve Business Climate
Reasonable Regulations &
Taxes
Business Environment
Encourage Innovation
World Class Research & Education
Innovation Reputation
Expand Economic Activity
Build the Base
Add Value
Expand Exports
Nurture the New

Objectives
Strategies
Leadership
Priorities within the Strategic Framework were identified with support
from the Steering Committee
43 | Context | Iowa AgriScope 2030
GoalIncrease the size
and scope of Iowa agriculture
Protect Comparative Advantages
Strong Soil, Safe Water
Qualified, Adequate Workforce
Improved Transportation Infrastructure
Improve Business Climate
Reasonable Regulations &
Taxes
Business Environment
Encourage Innovation
World Class Research & Education
Innovation Reputation
Expand Economic Activity
Build the Base
Add Value
Expand Exports
Nurture the NewPriority Strategies Secondary Strategies

Recommendations were developed for all Strategies and prioritized with
support from the Steering Committee
44 | Context | Iowa AgriScope 2030
Objectives
Strategies
Recommendations
Protect Comparative Advantages
Strong Soil, Safe Water
Re-energize Iowa’s commitment to soil
stewardship, addressing both retention and quality
concerns.
Protect Iowa’s ground water and surface water while
optimizing efficient utilization for both production &
processing.
Prioritize vulnerable landscapes and soils for
federal and state incentive programs.
Priority Recommendations Secondary Recommendations
EXAMPLE

Actions were identified for all Recommendations as were Rationale and
Responsibilities
45 | Context | Iowa AgriScope 2030
Strategies
Recommendations
Actions
EXAMPLEStrong Soil, Safe Water
Re-energize Iowa’s commitment to soil
stewardship, addressing both retention
and quality concerns.
Work toward and maintain a limit of soil loss tolerance (T) or
less.
Protect and retain current soil saving structures/practices
and resist incentives to farm through or over them.
Research use of cover crops as a potential mitigation for
soil loss created by the increasing number of heavy rain
events in Iowa.
Encourage landlords to use leases that include incentives
for improving the quality of their soil and conservation
practices.
Promote the value of adding organic matter to Iowa soils by
proving long-term enhancement of productive capacity and
retention of top soil.
Employ practices recommended to increase organic carbon
levels in soil such as no-till, cover crops, crop rotation and
use of livestock manure for fertilizer.
Educate landlords about the value of their asset and the
potential to lose that value through tillage practices that do
not protect the soil from eroding and losing organic matter.

46 | Context | Iowa AgriScope 2030
Protect Comparative Advantage
Re-energize Iowa’s commitment to soil stewardship, addressing
both retention and quality concerns.
Reco
m.
Strong Soil, Safe Water
Strateg
y
Workforce
Soil &
Water
Transportation
Infrastructure
• Work toward and maintain a limit of soil loss tolerance (T) or less.
• Protect and retain current soil saving structures/practices and resist incentives
to farm through or over them.
• Research use of cover crops as a potential mitigation for soil loss created by
the increasing number of heavy rain events in Iowa.
• Educate landlords about the value of their asset and the potential to lose that
value through tillage practices that do not protect the soil from eroding and
losing organic matter.
• Encourage landlords to use leases that include incentives for improving the
quality of their soil and conservation practices.
• Promote the value of adding organic matter to Iowa soils by proving long-term
enhancement of productive capacity and retention of top soil.
• Employ practices recommended to increase organic carbon levels in soil such
as no-till, cover crops, crop rotation and use of livestock manure for fertilizer.
Actio
ns
EXAMPLE

47 | Context | Iowa AgriScope 2030
Iowa is blessed with some of the most productive soil on earth, and
Iowa producers have long recognized the value of protecting those
soils. As costs of production increase, though, many find it tempting to
till vulnerable land or employ tillage systems that are less than
protective. Both farmers and landowners are encouraged to recommit to
saving soil and, in fact, improving its quality when possible. Leadership
levels of production and soil stewardship can be achieved through a
continuing quest for reduced tillage practices, appropriate balances of
livestock manure and other nutrient sources, and emerging production
technologies.
According to an ISU study, compaction, erosion and loss of organic
matter have led to a decline in the quality of Iowa’s soils over the past
50 years. Organic matter content in Iowa soils has dropped from an
average of 10% to two percent. However, regaining soil quality can be
achieved by adding organic matter and employing tillage methods that
reverse compaction and reduce erosion
Strong Soil, Safe Water - Rationale
Re-energize Iowa’s commitment to soil stewardship, addressing both retention and quality
concerns.
Sources: Soil Quality, Better Lawns Made Easy, Polk Soil & Water Conservation District and Iowa Storm
Water Education Program; ISU Research: Iowa has lower-quality topsoil than 50 years ago,
EXAMPLE
Photo Source: ISU Extension – Agronomy

48 | Context | Iowa AgriScope 2030
Strong Soil, Safe Water - Responsibilities
Re-energize Iowa’s commitment to soil stewardship, addressing both retention and quality
concerns.
Actions Team Leader(s) Team Member(s)
Work toward and maintain a limit of soil loss tolerance
(T) or less.IDALS Ag Producers, SWCDs
Protect and retain current soil saving
structures/practices and resist incentives to farm
through or over them.
Ag Producers
Research use of cover crops as a potential mitigation
for soil loss created by the increasing number of heavy
rain events in Iowa.
ISU
Educate landlords about the value of their asset and
the potential to lose that value through tillage practices
that do not protect the soil from eroding and losing
organic matter.
SWCDs USDA NRCS, ISU, Ag Producers
Encourage landlords to use leases that include
incentives for improving the quality of their soil and
conservation practices.
IDALS, Ag Producers, SWCDs ISU
Promote the value of adding organic matter to Iowa
soils by proving long-term enhancement of productive
capacity and retention of top soil.
SWCDs USDA NRCS, IDALS, Ag Producers
Employ practices recommended to increase organic
carbon levels in soil such as no-till, cover crops, crop
rotation and use of livestock manure for fertilizer.
Ag Producers
EXAMPLE

Priority StrategiesIncluding Recommendations, Actions, Rationales and Responsibilities
49 | Context | Iowa AgriScope 2030

50 | Context | Iowa AgriScope 2030
Protect Comparative Advantage
• Re-energize Iowa’s commitment to soil stewardship, addressing both retention
and quality concerns.
• Protect Iowa’s ground and surface water while optimizing efficient utilization for
both production and processing.
• Prioritize vulnerable landscapes and soils for federal and state incentive
programs.
Reco
mm
end
ation
s
Strong Soil, Safe Water
Through producers’ adoption of innovative tillage methods and
technologies, achieve optimum quality levels for Iowa soils and
limit soil loss to replacement levels. Eliminate water quality
concerns, and assure abundant, clean water supplies that provide
an advantage when attracting and growing agriculture-related
manufacturing and processing.
Strateg
y
Workforce
Soil &
Water
Transportation
Infrastructure
Black = Priority Recommendation Gray = Secondary Recommendation

51 | Context | Iowa AgriScope 2030
Protect Comparative Advantage
Re-energize Iowa’s commitment to soil stewardship, addressing
both retention and quality concerns.
Reco
m.
Strong Soil, Safe Water
Strateg
y
Workforce
Soil &
Water
Transportation
Infrastructure
• Work toward and maintain a limit of soil loss tolerance (T) or less.
• Protect and retain current soil saving structures/practices and resist incentives
to farm through or over them.
• Research use of cover crops as a potential mitigation for soil loss created by
the increasing number of heavy rain events in Iowa.
• Educate landlords about the value of their asset and the potential to lose that
value through tillage practices that do not protect the soil from eroding and
losing organic matter.
• Encourage landlords to use leases that include incentives for improving the
quality of their soil and conservation practices.
• Promote the value of adding organic matter to Iowa soils by proving long-term
enhancement of productive capacity and retention of top soil.
• Employ practices recommended to increase organic carbon levels in soil such
as no-till, cover crops, crop rotation and use of livestock manure for fertilizer.
Actio
ns

52 | Context | Iowa AgriScope 2030
Iowa is blessed with some of the most productive soil on earth, and
Iowa producers have long recognized the value of protecting those
soils. As costs of production increase, though, many find it tempting to
till vulnerable land or employ tillage systems that are less than
protective. Both farmers and landowners are encouraged to recommit to
saving soil and, in fact, improving its quality when possible. Leadership
levels of production and soil stewardship can be achieved through a
continuing quest for reduced tillage practices, appropriate balances of
livestock manure and other nutrient sources, and emerging production
technologies.
According to an ISU study, compaction, erosion and loss of organic
matter have led to a decline in the quality of Iowa’s soils over the past
50 years. Organic matter content in Iowa soils has dropped from an
average of 10% to two percent. However, regaining soil quality can be
achieved by adding organic matter and employing tillage methods that
reverse compaction and reduce erosion.
Strong Soil, Safe Water - Rationale
Re-energize Iowa’s commitment to soil stewardship, addressing both retention and quality
concerns.
Sources: Soil Quality, Better Lawns Made Easy, Polk Soil & Water Conservation District and Iowa Storm
Water Education Program; ISU Research: Iowa has lower-quality topsoil than 50 years ago,
Photo Source: ISU Extension – Agronomy

53 | Context | Iowa AgriScope 2030
Strong Soil, Safe Water - Responsibilities
Re-energize Iowa’s commitment to soil stewardship, addressing both retention and quality
concerns.
Actions Team Leader(s) Team Member(s)
Work toward and maintain a limit of soil loss tolerance
(T) or less.IDALS Ag Producers, SWCDs
Protect and retain current soil saving
structures/practices and resist incentives to farm
through or over them.
Ag Producers
Research use of cover crops as a potential mitigation
for soil loss created by the increasing number of heavy
rain events in Iowa.
ISU
Educate landlords about the value of their asset and
the potential to lose that value through tillage practices
that do not protect the soil from eroding and losing
organic matter.
SWCDs USDA NRCS, ISU, Ag Producers
Encourage landlords to use leases that include
incentives for improving the quality of their soil and
conservation practices.
IDALS, Ag Producers, SWCDs ISU
Promote the value of adding organic matter to Iowa
soils by proving long-term enhancement of productive
capacity and retention of top soil.
SWCDs USDA NRCS, IDALS, Ag Producers
Employ practices recommended to increase organic
carbon levels in soil such as no-till, cover crops, crop
rotation and use of livestock manure for fertilizer.
Ag Producers

54 | Context | Iowa AgriScope 2030
Protect Comparative Advantage
Protect Iowa’s ground and surface water while optimizing
efficient utilization for both production and processing.
Reco
m.
Strong Soil, Safe Water
Strateg
y
Workforce
Soil &
Water
Transportation
Infrastructure
• Take a national leadership role, through a Nutrient Management Strategy, in
developing approaches to water quality protection that do not unnecessarily
compromise production practices or processing needs.
• Continue to administer fair and reasonable regulations that prevent run-off from
production agriculture and processing businesses into surface water supplies.
Actio
ns

55 | Context | Iowa AgriScope 2030
Strong Soil, Safe Water - Rationale
Protect Iowa’s ground and surface water while optimizing efficient utilization for both
production and processing.
Suggestions for the Iowa NMS:
Adoption of innovative, cost effective technologies that prevent the
tools and methods of production agriculture from compromising the
water resources of Iowa.
Prioritization of voluntary compliance over mandated regulation.
Organization of recommended actions on a watershed basis.
Inclusion of all vested interests in formulating watershed goals.
Source: Iowa Geology 1995, Iowa Department of Natural Resources
The Mississippi River flows through a narrow valley between
Davenport and Rock Island-Moline.
Globally, water is becoming an ever more precious
resource, so Iowa’s abundant water supply is a distinct
competitive advantage for economic growth built on
agriculture production and processing. Iowans are well
aware of the need to protect the quality of Iowa’s water
supplies both for its productive capacity and for the many
other benefits it affords Iowa’s citizens.
IDALS, IDNR, ISU and several ag organizations have
begun a comprehensive, thoughtful and proactive
process to build a Nutrient Management Strategy (NMS)
for the state. The goal of the strategy is to protect the
state’s waters but will also lead to more efficient use of
applied production inputs, further reduction in soil loss
and possible mitigation of the hypoxia situation in the
Gulf of Mexico

56 | Context | Iowa AgriScope 2030
Strong Soil, Safe Water - Actions and Responsibilities
Protect Iowa’s ground and surface water while optimizing efficient utilization for both
production and processing.
Actions Team Leader(s) Team Member(s)
Take a national leadership role, through a Nutrient
Management Strategy, in developing approaches to
water quality protection that do not unnecessarily
compromise production practices or processing
needs.
Iowa Secretary of AgIDALS, Ag & Commodity Organizations,
Ag Producers, SWCDs
Continue to administer fair and reasonable regulations
that prevent run-off from production agriculture and
processing businesses into surface water supplies.
IDNR

57 | Context | Iowa AgriScope 2030
Protect Comparative Advantage
Prioritize vulnerable landscapes and soils for federal and state
incentive programs.
Reco
m.
Strong Soil, Safe Water
Strateg
y
Workforce
Soil &
Water
Transportation
Infrastructure
• Target vulnerable landscapes that need more protective measures and,
possibly, more incentive for set-aside.
• Release non-vulnerable land from protection, or set-aside, in order to meet
growing production needs.
Actio
ns

58 | Context | Iowa AgriScope 2030
Strong Soil, Safe Water - Rationale
Prioritize vulnerable landscapes and soils for federal and state incentive programs.
The original purposes of federal land diversion
programs, to protect vulnerable soils and to reduce
chronic production surpluses, have become
overshadowed in the past couple decades by their
popularity as a means to provide wildlife habitat
and recreational opportunities.
This trend has pulled current policies and programs
away from adequately protecting vulnerable
landscapes. According to ISU economist Chad
Hart, “Given the strength of crop prices, both in
recent years and projected into the future, land
diversion subsidies are no longer needed by U.S.
agriculture. Biofuel and international markets have
grown tremendously, removing excess
supplies. High prices indicate the need for more
crop production to meet demands, requiring that
land be brought back into production.
In order to meet this challenge, those crafting
federal farm policy should explore innovative,
strategic, and selective approaches to land
retirement and conservation programs that protect
the most environmentally sensitive lands, while
maintaining the environmental benefits from
previous programs and allowing other land to
reenter production in order to meet various food,
feed, fuel, and fiber demands.”
Source: Chad Hart, ISU, Assistant Professor Economics, Extension Economist, Grain Market Specialist

59 | Context | Iowa AgriScope 2030
Strong Soil, Safe Water - Responsibilities
Prioritize vulnerable landscapes and soils for federal and state incentive programs.
Actions Team Leader(s) Team Member(s)
Target vulnerable landscapes that need more
protective measures and, possibly, more incentive for
set-aside.
USDA NRCS Congress
Release non-vulnerable land from protection, or set-
aside, in order to meet growing production needs.USDA NRCS

60 | Context | Iowa AgriScope 2030
• Effect lasting improvement to the state regulatory and permitting processes.
• Administer reasonable, fair and relevant regulatory enforcement.
• Determine the effect that Iowa’s business tax ranking is having on the retention
and attraction of bio based businesses to Iowa.
Reco
mm
end
ation
s
Reasonable Regulations and Taxes
Adopt only regulations that are effective and sufficient to protect
Iowans and Iowa’s resources and that are based on science:
reasonable, consistent and practical. Assure a competitive
business tax structure and economic development incentives.
Strateg
y
Improve
Business Climate
Black = Priority Recommendation Gray = Secondary Recommendation
Business Environment
Regulations & Taxes

61 | Context | Iowa AgriScope 2030
Effect lasting improvement to the state regulatory and permitting
processes.
Reco
m.
Reasonable Regulations and Taxes
Strateg
y
• Pass only laws/regulations with sunset dates so that they must be revisited within a few
years and determined to be still valid, or not.
• Perform an in-depth scan of regulatory and permitting programs to identify those that are
not delivering the legislated intent.
• Evaluate systems proven to bring about improvement and choose one best suited to
Iowa’s government (i.e. Six Sigma, Good to Great, Lean Manufacturing, etc.).
• Provide funding and lead application of the chosen system to government agencies and
systems, beginning with regulatory and permitting programs that affect agriculture and
related businesses.
• Process applications and permits in a timely, professional manner. Notify applicants
immediately if there is a problem with the application and/or notify of delays in the
process.
• Reform the permit system to allow applications and permits to cover the entire state, not
just a particular jurisdiction.
• Reform the permit system to allow amendment of permits, so that reapplication is not
necessary each time regulations change or when businesses change only one aspect of
their operation.
Actio
ns
Business Environment
Regulations & Taxes
Improve
Business Climate

62 | Context | Iowa AgriScope 2030
Reasonable Regulations and Taxes - Rationale
Effect lasting improvement to the state regulatory and permitting processes.
Concerns and criticisms about Iowa’s regulatory and permitting systems have been an
overarching theme of this project. Interviewees feel strongly that the systems are not
administered consistently and that rules, regulations and permitting processes change too
often. Conflicts arise when systems and processes are not applied with an understanding of
business pressures, causing costly delays or unnecessary adaptations.
Costs of regulation are often regarded as ‘hidden taxes’ that provide revenue for the state in
lieu of raising taxes. If regulations and the permitting process are also inefficient, the cost is
increased, but without benefit to either the state or the business being regulated. Studies show
that small businesses bear a disproportionate burden for most regulations, and the vast
majority of Iowa’s businesses employ fewer than 100 people.
“Environmental and tax compliance regulations appear to be the main cost drivers in determining the severity of the disproportionate impact on small firms.Compliance with environmental regulations costs 364 percent more in small firms than in large firms.The cost of tax compliance is 206 percent higher in small firms than the cost in large firms.”
Source: The impact of regulatory costs on small firms, Nicole V. Crain and W. Mark Crain, Lafayette College, 2010

63 | Context | Iowa AgriScope 2030
Reasonable Regulations and Taxes - Responsibilities
Effect lasting improvement to the state regulatory and permitting processes.
Actions Team Leader(s) Team Member(s)
Pass only laws/regulations with sunset dates so that
they must be revisited within a few years and
determined to be still valid, or not.
Iowa Legislature Iowa Governor
Perform an in-depth scan of regulatory and permitting
programs to identify those that are not delivering the
legislated intent.
Iowa Governor IDNR and Other Regulatory Agencies
Evaluate systems proven to bring about improvement
and choose one best suited to Iowa’s government (i.e.
Six Sigma, Good to Great, Lean Manufacturing, etc.).
Iowa Governor
Provide funding and lead application of the chosen
system to government agencies and systems,
beginning with regulatory and permitting programs that
affect agriculture and related businesses.
Iowa Governor Iowa Legislature
Process applications and permits in a timely,
professional manner. Notify applicants immediately if
there is a problem with the application and/or notify of
delays in the process.
IDNR and Other Regulatory Agencies
Reform the permit system to allow applications and
permits to cover the entire state, not just a particular
jurisdiction.
IDNR and Other Regulatory AgenciesIowa Governor, Iowa Legislature, Rural
Counties/Communities
Reform the permit system to allow amendment of
permits, so that reapplication is not necessary each
time regulations change or when businesses change
only one aspect of their operation.
IDNR and Other Regulatory AgenciesIowa Governor, Iowa Legislature, Rural
Counties/Communities

64 | Context | Iowa AgriScope 2030
Administer reasonable, fair and relevant regulatory enforcement.
Reco
m.
Reasonable Regulations and Taxes
Strateg
y
• Punish habitual offenders and scofflaws, but bring reason to bear on apparent
mistakes, misunderstandings or alternative interpretation of the regulation,
especially for first-time offenders.
• Create a culture of goal-directed enforcement within state regulatory agencies
(enforcement should be directed by the goal of the regulation) and discourage
a ‘gotcha’ approach.
Actio
ns
Business Environment
Regulations & Taxes
Improve
Business Climate

65 | Context | Iowa AgriScope 2030
Reasonable Regulations and Taxes - Rationale
Administer reasonable, fair and relevant regulatory enforcement.
There is general agreement among those interviewed for this project that habitual offenders of
state and federal regulations should be dealt with harshly and, when appropriate, made to
leave the state and/or give up their business or enterprise in Iowa. They also acknowledge a
need for certain regulations and permits.
However, they expressed concerns about unreasonable enforcement of the regulations,
especially when a “gotcha” approach is used. Most agree that the goal of the regulation will be
achieved more readily if the enforcement effort leads to greater understanding and compliance
than if the enforcement is arbitrary and unevenly administered.
Environmental and tax compliance regulations
appear to be the main cost drivers in determining
the severity of the disproportionate impact on
small firms. Compliance with environmental
regulations costs 364% more in small firms than
in large firms. The cost of tax compliance is 206%
higher in small firms than the cost in large firms.
Source: The Impact of Regulatory Costs on Small Firms, US Commerce Department
Photo Source: Iowa Pork Producer Association, Vol 47, No. 6-7, July 2010

66 | Context | Iowa AgriScope 2030
Reasonable Regulations and Taxes - Responsibilities
Administer reasonable, fair and relevant regulatory enforcement.
Actions Team Leader(s) Team Member(s)
Punish habitual offenders and scofflaws, but bring
reason to bear on apparent mistakes,
misunderstandings or alternative interpretation of the
regulation, especially for first-time offenders.
IDNR and Other Regulatory Agencies
Create a culture of goal-directed enforcement within
state regulatory agencies (enforcement should be
directed by the goal of the regulation) and discourage
a ‘gotcha’ approach.
IDNR and Other Regulatory Agencies Iowa Governor

67 | Context | Iowa AgriScope 2030
Determine the effect that Iowa’s business tax ranking is having
on the retention and attraction of bio based businesses to Iowa.
Reco
m.
Reasonable Regulations and Taxes
Strateg
y
• If analysis proves advisable, take measures to improve Iowa’s business tax
ranking over the next five years, then continue to strive for an ever more
business-friendly tax structure.
• Lower corporate income tax or provide a tax credit for investment to offset
inhibiting effect of business tax.
Actio
ns
Business Environment
Regulations & Taxes
Improve
Business Climate

68 | Context | Iowa AgriScope 2030
Reasonable Regulations and Taxes - Rationale
Iowa ranks 45th in the Tax Foundation‘s 2011 State Business Tax Climate Index.
The Index compares the states in five areas of taxation that impact business: corporate
taxes; individual income taxes; sales taxes; unemployment insurance taxes; and taxes on
property, including residential and commercial property.
2009 State Business Tax Ranks
Iowa (45th)
Minnesota (43rd)
Wisconsin (40th)
Illinois (23rd)
Missouri (16th)
Nebraska (29th)South Dakota (1st)
State leaders and those intent on adding value to
Iowa commodities are concerned that business
taxes are a factor in businesses’ decisions to locate
or grow in another state. A focused study would
determine the actual effect that taxes are having on
businesses considering locating in Iowa and
determine the changes that would have the most impact.
Determine the effect that Iowa’s business tax ranking is having on the retention and attraction
of bio based businesses to Iowa.
Source: Tax Foundation website

69 | Context | Iowa AgriScope 2030
Reasonable Regulations and Taxes - Responsibilities
Determine the effect that Iowa’s business tax ranking is having on the retention and attraction of bio
based businesses to Iowa.
Actions Team Leader(s) Team Member(s)
If analysis proves advisable, take measures to improve
Iowa’s business tax ranking over the next five years,
then continue to strive for an ever more business-
friendly tax structure.
Iowa Governor Iowa Legislature
Lower corporate income tax or provide a tax credit for
investment to offset inhibiting effect of business tax.Iowa Legislature Iowa Governor

70 | Context | Iowa AgriScope 2030
• Support, to the greatest extent possible, research and innovation that builds
Iowa's agriculture production and value added endeavors.
• Recognize the value of research as both a basis and a catalyst for innovation
and provide Iowa's public research institutions with the resources needed to
effectively foster innovation.
• Establish and foster an innovative and entrepreneurial climate throughout
Iowa’s education systems.
• Strengthen the exchange of knowledge between science and
business/industry.
Reco
mm
end
ation
s
World Class Research and Education
Assure that Iowa State University is second to none in its
agriculture and related sectors’ research, development and
education, due to leadership levels of funding and focused
administration. Gain global respect for Iowa’s public and private
research communities. Develop education systems that provide
knowledge and training for the many jobs to be created in
agriculture production and related processing and support sectors.
Strateg
y
Encourage
Innovation
Innovation Reputation
Research & Education
Black = Priority Recommendation Gray = Secondary Recommendation

71 | Context | Iowa AgriScope 2030
Support, to the greatest extent possible, research and innovation
that builds Iowa's agriculture production and value added
endeavors.
Reco
m.
World Class Research and Education
Strateg
y
• Increase funding levels for public research that develops pathways for
sustainable production increases and profitability: solving problems of
commercial crop and livestock production.
• Support research and development of processes that turn bi-products and
waste materials into usable products.
• Support biofuels research and development to stay on the cutting edge of new
efficiencies and technologies.
Actio
ns
Innovation Reputation
Research & Education
Encourage
Innovation

72 | Context | Iowa AgriScope 2030
World Class Research and Education - Rationale
Support, to the greatest extent possible, research and innovation that builds Iowa's
agriculture production and value added endeavors.
It is widely accepted that there have been four key factors in the success of Midwest
agriculture: natural resources, transportation infrastructure, people . . . .and research.
More than a century of basic agriculture research, supported by the federal and state
governments and conducted at public universities, has brought Iowa and neighboring states
from subsistence farming to global powerhouse.
That productivity and competitive advantage is in jeopardy, as government funding for basic
research dissipates and institutions struggle to find replacement funding.
The National Agricultural Research, Extension,
Education and Economics Advisory Board has
recommended “ at least a 25% increase in the
annual growth rate of funding of agricultural
productivity enhancing research and extension” to
counter “a number of adverse consequences, both
nationally and internationally” resulting from two
decades of stagnate funding.
Source: A Report on Agricultural Productivity and Agricultural Research,
National Agricultural Research, Extension, Education and Economics
Advisory Board, 2011
Photo Source: West Liberty Foods

73 | Context | Iowa AgriScope 2030
World Class Research and Education – Responsibilities
Support, to the greatest extent possible, research and innovation that builds Iowa's
agriculture production and value added endeavors.
Actions Team Leader(s) Team Member(s)
Increase funding levels for public research that
develops pathways for sustainable production
increases and profitability: solving problems of
commercial crop and livestock production.
Congress, Iowa Legislature
USDA, Iowa Governor, Iowa Secretary of
Ag, ISU, Ag & Commodity Organizations,
Ag Producers
Support research and development of processes that
turn bi-products and waste materials into usable
products.
Businesses
USDA, Iowa Governor, Iowa Legislature,
ISU, Ag & Commodity Organizations, Ag
Producers
Support biofuels research and development to stay on
the cutting edge of new efficiencies and technologies.Businesses
USDA, Iowa Governor, Iowa Legislature,
ISU, Ag & Commodity Organizations

74 | Context | Iowa AgriScope 2030
Recognize the value of research as both a basis and a catalyst
for innovation and provide Iowa's public research institutions with
the resources needed to effectively foster innovation.
Reco
m.
World Class Research and Education
Strateg
y
• Focus currently available state funding on research and development programs
that foster innovation and lead to economic activity.
• Reward those institutions or individuals who focus their research on innovative,
cutting edge solutions to current and emerging challenges in Iowa’s agriculture
industry.
• Increase state support of research and development that improves Iowa’s
position as an agriculture, food and renewable fuel innovator.
• Maximize resources and achieve better, quicker research results by providing
leadership for collaboration with other states’ and countries’ research
institutions.
• Provide an information infrastructure that makes it possible for Iowa
researchers to monitor and manage research and development around the
world.
• Tie state research funding to an incentive to develop and commercialize in
Iowa.
Actio
ns
Innovation Reputation
Research & Education
Encourage
Innovation

75 | Context | Iowa AgriScope 2030
World Class Research and Education - Rationale
Recognize the value of research as both a basis and a catalyst for innovation and provide
Iowa's public research institutions with the resources needed to effectively foster innovation.
Iowa’s research institutions, businesses,
producers and associations are actually quite
innovative and entrepreneurial. However,
Iowa is not yet known for this asset, so greater
efforts are needed to raise its profile while
further improving its innovation base and
entrepreneurial support.
While increased funding for innovative
research is an important first step, other
incentives and encouragements can be
employed to attract and keep the most
innovative, problem-solving researcher teams
in Iowa.
The chain linked model of innovation, portraying the interplay of research
and innovation. Source: The Role of Basic Research in Innovation, Magnus Gulbrandsen

76 | Context | Iowa AgriScope 2030
World Class Research and Education – Responsibilities
Recognize the value of research as both a basis and a catalyst for innovation and provide
Iowa's public research institutions with the resources needed to effectively foster innovation.
Actions Team Leader(s) Team Member(s)
Focus currently available state funding on research
and development programs that foster innovation and
lead to economic activity.
ISUIowa Governor, Iowa Legislature, Other
Universities
Reward those institutions or individuals who focus their
research on innovative, cutting edge solutions to
current and emerging challenges in Iowa’s agriculture
industry.
Board of RegentsIowa Governor, Iowa Legislature, IDALS, I-
PEP
Increase state support of research and development
that improves Iowa’s position as an agriculture, food
and renewable fuel innovator.
Iowa Governor, Iowa Legislature
Maximize resources and achieve better, quicker
research results by providing leadership for
collaboration with other states’ and countries’ research
institutions.
ISU Other Universities
Provide an information infrastructure that makes it
possible for Iowa researchers to monitor and manage
research and development around the world.
BusinessesIowa Governor, Iowa Legislature, ISU,
Other Universities
Tie state research funding to an incentive to develop
and commercialize in Iowa.ISU Iowa Governor, Iowa Legislature

77 | Context | Iowa AgriScope 2030
Establish and foster an innovative and entrepreneurial climate
throughout Iowa’s education systems.
Reco
m.
World Class Research and Education
Strateg
y
• Develop and encourage K-12 and post-secondary education programs that
support entrepreneurial activities and innovation.
• Encourage an innovation and entrepreneurship component for STEM.
• Support, encourage and raise the profile of community college and university
education programs that foster innovation.
Actio
ns
Innovation Reputation
Research & Education
Encourage
Innovation

78 | Context | Iowa AgriScope 2030
World Class Research and Education - Rationale
Establish and foster an innovative and entrepreneurial climate throughout Iowa’s education
systems.
Important steps have been taken to foster bio economy innovation
and entrepreneurship in Iowa’s school children through Iowa’s
STEM program.
By giving Iowa’s students, from kindergarten
through post-secondary, the tools and
encouragement they need to excel in science,
technology, engineering and math, Iowa is also
creating a workforce ideally prepared for 21st
century agriculture innovation. Providing industry-
specific information and learning opportunities will
enhance Iowa youth’s understanding of agriculture,
food, fuel and f(ph)arma opportunities.

79 | Context | Iowa AgriScope 2030
World Class Research and Education – Responsibilities
Establish and foster an innovative and entrepreneurial climate throughout Iowa’s education
systems.
Actions Team Leader(s) Team Member(s)
Develop and encourage K-12 and post-secondary
education programs that support entrepreneurial
activities and innovation.
IDE local school boards
Encourage an innovation and entrepreneurship
component for STEM.IDE
Ag & Commodity Organizations,
Businesses
Support, encourage and raise the profile of community
college and university education programs that foster
innovation.
IDEISU, Other Universities, Community
Colleges, Board of Regents

80 | Context | Iowa AgriScope 2030
Strengthen the exchange of knowledge between science and
business/industry.
Reco
m.
World Class Research and Education
Strateg
y
• Fully utilize viable results of Iowa-based research to add value to Iowa
products.
Actio
ns
Innovation Reputation
Research & Education
Encourage
Innovation

81 | Context | Iowa AgriScope 2030
World Class Research and Education - Rationale
Strengthen the exchange of knowledge between science and business/industry.
Those interviewed for this project saw this recommendation as an
important component of expanding the scope of Iowa’s agriculture.
Universities are seen as economic drivers in developing and
transferring knowledge to the commercial marketplace.
They also provide fertile ground for creating a more innovative society
by imbuing students with entrepreneurial attitudes and approaches to
problem-solving.
This ‘third mission’, extension and outreach, is not universally
embraced, but if embraced in Iowa’s agriculture sector, would support
many of the recommendations developed during this project. Through
research and extension programs, ISU partners with businesses to
make fundamental and applied discoveries and then assure their
applicability to the marketplace.

82 | Context | Iowa AgriScope 2030
World Class Research and Education – Responsibilities
Strengthen the exchange of knowledge between science and business/industry.
Actions Team Leader(s) Team Member(s)
Fully utilize viable results of Iowa-based research to
add value to Iowa products.Businesses
ISU, Ag & Commodity Organizations, Ag
Producers

83 | Context | Iowa AgriScope 2030
• Increase the production of established Iowa commodities, both crop and
livestock.
Reco
mm
end
ation
s
Build the Base
Meet both local and world demand by increasing production of
Iowa’s leading agriculture crops, livestock and products. Lead the
world in quality and reliability with Iowa’s diverse spectrum of
commodities that are raised via innovative and sustainable
production methods.
Strateg
y
Build
the Base
Black = Priority Recommendation Gray = Secondary Recommendation

84 | Context | Iowa AgriScope 2030
Increase the production of established Iowa commodities, both
crop and livestock.
Reco
m.
Build the Base
Strateg
y
• Facilitate approval and adoption of technologies that will increase yields without
depleting or compromising resources.
• Promote and utilize livestock manure as a valuable, natural, locally-produced
source of nitrogen and organic matter.
• Capitalize on Iowa’s competitive advantage for livestock production and establish a
‘Protein Pro Team’ approach to promoting responsible growth in the sector.
• Adopt a pro-active, self-regulating attitude in order to prevent problems.
• Encourage and assist local communities that want to attract and support local
livestock production and food processing.
• Mitigate concerns/conflicts that arise from erroneous perceptions or cavalier
attitudes.
• Prevent the need for subsidy programs by providing access to revenue insurance,
loan guarantees, etc.
• Recognize the debt and equity capital needs of commodity producers, and
processors that source commodities, caused by increasingly volatile market cycles.
Actio
ns
Build
the Base
85 | Context | Iowa AgriScope 2030
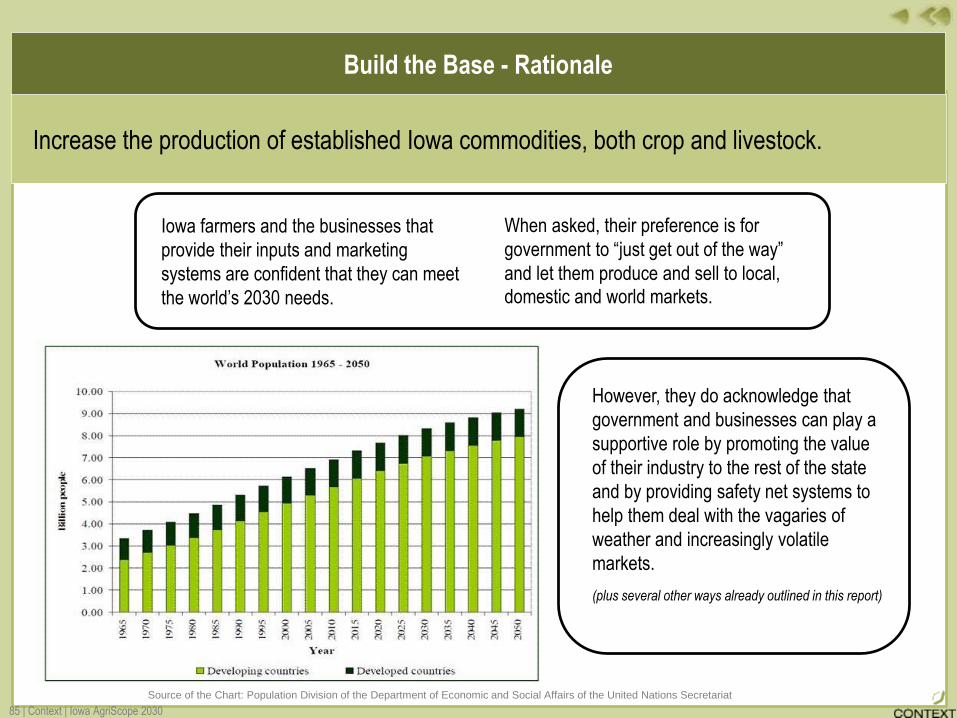
Build the Base - Rationale
Increase the production of established Iowa commodities, both crop and livestock.
Iowa farmers and the businesses that
provide their inputs and marketing
systems are confident that they can meet
the world’s 2030 needs.
Source of the Chart: Population Division of the Department of Economic and Social Affairs of the United Nations Secretariat
However, they do acknowledge that
government and businesses can play a
supportive role by promoting the value
of their industry to the rest of the state
and by providing safety net systems to
help them deal with the vagaries of
weather and increasingly volatile
markets.
(plus several other ways already outlined in this report)
When asked, their preference is for
government to “just get out of the way”
and let them produce and sell to local, domestic and world markets.

86 | Context | Iowa AgriScope 2030
Build the Base – Responsibilities
Increase the production of established Iowa commodities, both crop and livestock.
Actions Team Leader(s) Team Member(s)
Facilitate approval and adoption of technologies that
will increase yields without depleting or compromising
resources.
USDA
Congress, Iowa Secretary of Ag, ISU, Ag
& Commodity Organizations, Ag
Producers
Promote and utilize livestock manure as a valuable,
natural, locally-produced source of nitrogen and
organic matter.
Iowa Secretary of Ag
USDA, Iowa Legislature, IDALS, ISU, Ag
& Commodity Organizations, Ag
Producers, SWCDs, Coalition to Support
Farmers
Capitalize on Iowa’s competitive advantage for
livestock production and establish a ‘Protein Pro
Team’ approach to promoting responsible growth in
the sector.
Ag & Commodity Organizations Ag Producers
Adopt a pro-active, self-regulating attitude in order to
prevent problems.Ag Producers Ag & Commodity Organizations
Encourage and assist local communities that want to
attract and support local livestock production and food
processing.
I-PEP IDALS
Mitigate concerns/conflicts that arise from erroneous
perceptions or cavalier attitudes.Coalition to Support Farmers Other Organizations, SWCDs
Prevent the need for subsidy programs by providing
access to revenue insurance, loan guarantees, etc.Congress USDA, Iowa Governor
Recognize the debt and equity capital needs of
commodity producers, and processors that source
commodities, caused by increasingly volatile market
cycles.
LendersUSDA, Congress, Iowa Governor, Iowa
Secretary of Ag, Businesses

87 | Context | Iowa AgriScope 2030
• Lead efforts to open markets for Iowa commodities and value-added products.
• Include Iowa-based animal health products and production systems in
promotion efforts, as livestock production continues to increase globally.
• Promote and market Iowa agriculture and processing knowledge, expertise and
management skills: Knowledge based consulting for bio fuels processing, food
safety, food processing, livestock production, etc.
Reco
mm
end
ation
s
Expand Exports
Lead the US in export of basic commodities and processed bio
products due to Iowa’s great productivity and even greater
reputation for high quality production and processing.
Strateg
y
Expand Exports
Black = Priority Recommendation Gray = Secondary Recommendation

88 | Context | Iowa AgriScope 2030
Lead efforts to open markets for Iowa commodities and value-
added products.
Reco
m.
Expand Exports
Strateg
y
• Influence US Administration to swiftly negotiate pending and future Free Trade
Agreements.
• Explore opportunities to pursue direct market arrangements between Iowa
producers and processors with potential foreign customers .
• Capitalize on Iowa’s ‘brand’ for quality and dependability: promote Iowa
products as high quality, safe and beneficial.
• Support crop and livestock health protection systems and tools that prevent
contracting and spreading diseases that will close markets.
Actio
ns
Expand Exports

89 | Context | Iowa AgriScope 2030
Expand Export - Rationale
Lead efforts to open markets for Iowa commodities and value-added products.
Because Iowa agriculture produces so much more than it
consumes, export markets are crucial. Iowa commodities
carry a reputation of quality and dependable, sustainable
production, so they are sought from around the world. Value
added products are increasingly a part of the export mix, and
many of those interviewed indicated that they should be an
even higher proportion of the mix.
.To illustrate the importance of
opening markets, the three
countries for which the US
Congress just passed trade
agreements represent nearly $3
billion of additional agricultural
exports. Soybeans, soybean
products and livestock products will benefit greatly, as will Iowa.
Sources: USDA, Economic Research Service using in the World Trade Organization Regional Trade Agreements;
Agriculture in Pending U.S. Free Trade Agreements with South Korea, Columbia, and Panama

90 | Context | Iowa AgriScope 2030
Expand Exports – Responsibilities
Lead efforts to open markets for Iowa commodities and value-added products.
Actions Team Leader(s) Team Member(s)
Influence US Administration to swiftly negotiate
pending and future Free Trade Agreements.Iowa Governor
Congress, Iowa Legislature, Iowa
Secretary of Ag
Explore opportunities to pursue direct market
arrangements between Iowa producers and processors
with potential foreign customers.
Iowa Governor Iowa Secretary of Ag
Capitalize on Iowa’s ‘brand’ for quality and
dependability: promote Iowa products as high quality,
safe and beneficial .
Iowa GovernorIowa Secretary of Ag, I-PEP, Ag &
Commodity Organizations, Businesses
Support crop and livestock health protection systems
and tools that prevent contracting and spreading
diseases that will close markets.
Iowa Secretary of Ag
Iowa Legislature, IDALS, ISU, Ag &
Commodity Organizations, Businesses,
Ag Producers

91 | Context | Iowa AgriScope 2030
Include Iowa-based animal health products and production
systems in promotion efforts, as livestock production continues to
increase globally.
Reco
m.
Expand Exports
Strateg
yA
ction
s
Expand Exports
No specific actions were
developed for this
recommendation.

92 | Context | Iowa AgriScope 2030
Expand Exports - Rationale
Include Iowa-based animal health products and production systems in promotion efforts, as
livestock production continues to increase globally.
As developing countries create more of a middle class, they also create a middle class
diet that incorporates more meat protein. Those countries respond by striving to
develop their livestock sector.
Iowa is a leader in the production of animal health knowledge, production systems and
health products. This market will be exploitable for the near future and provide
opportunities for an Iowa niche industry.
Source : Ag Web, Powered by Farm Journal
According to the UN Food and Agriculture Organization,
“Since 1960, global meat production has more than
trebled, milk production has nearly doubled and egg
production has increased by nearly four times”, due
primarily to growth in population and increasing
affluence among growth populations.

93 | Context | Iowa AgriScope 2030
Expand Exports – Responsibilities
Include Iowa-based animal health products and production systems in promotion efforts, as
livestock production continues to increase globally.
Actions Team Leader(s) Team Member(s)
Iowa Secretary of Ag I-PEP, Ag & Commodity OrganizationsNo specific actions were developed
for this recommendation.

94 | Context | Iowa AgriScope 2030
Promote and market Iowa agriculture and processing knowledge,
expertise and management skills: Knowledge based consulting
for bio fuels processing, food safety, food processing, livestock
production, etc.
Reco
m.
Expand Exports
Strateg
yA
ction
s
Expand Exports
No specific actions were
developed for this
recommendation.

95 | Context | Iowa AgriScope 2030
Expand Exports - Rationale
Promote and market Iowa agriculture and processing knowledge, expertise and management skills: Knowledge based consulting for bio fuels processing, food safety, food processing, livestock production, etc.
Agriculture leaders and trade negotiators generally focus on creating markets for
commodities and products. However, Iowa has invested a great deal in production
and processing information and expertise. In the 21st century, knowledge based
trade is also of value and Iowa’s assets can be traded successfully in this arena.
Source: Exporter Data Base, ITA, Bureau of Census
Export of Iowa’s non-commodity products and services
Iowa’s products and services were exported to 187
countries in 2006
2,248 companies exported goods from Iowa locations
Of those companies, 81% (1,813) have fewer than 500
employees

96 | Context | Iowa AgriScope 2030
Expand Exports – Responsibilities
Promote and market Iowa agriculture and processing knowledge, expertise and management skills: Knowledge based consulting for bio fuels processing, food safety, food processing, livestock production, etc.
Actions Team Leader(s) Team Member(s)
Iowa Secretary of Ag I-PEPNo specific actions were developed
for this recommendation.

97 | Context | Iowa AgriScope 2030
• Build on global leadership in value-added products (i.e. bio-fuels, meat and
other food processing).
• Add value to the value-added and build on the success of Iowa businesses.
• Recruit further processing businesses to locate and grow in Iowa, especially in
rural communities.
• Develop infrastructure and systems that support segregation, storage,
movement and marketing of value-added crops and products, specialty crops,
livestock, etc.
Reco
mm
end
ation
s
Add Value
Utilize cutting edge technologies and Iowa’s quality workforce to
convert an abundance of basic commodities and cutting edge
technologies, systems into value-added products.
Strateg
y
Add Value
Black = Priority Recommendation Gray = Secondary Recommendation

98 | Context | Iowa AgriScope 2030
Build on global leadership in value-added products (i.e. bio-fuels,
meat and other food processing).
Reco
m.
Add Value
Strateg
y
• Support development of biofuels bi-product markets.
• Assure a plentiful supply of base commodities by encouraging the livestock
sector in Iowa.
• Commit to discovery and adoption of food safety technologies and processes
that assure consumer confidence.
• Recruit new food processing businesses to the state.
• Encourage branded products built on quality and unique, value-added
attributes.
Actio
ns
Add Value

99 | Context | Iowa AgriScope 2030
Add Value - Rationale
Build on global leadership in value-added products (i.e. bio-fuels, meat and other food
processing).
By providing 26 percent of US ethanol production, Iowa is producing more ethanol than any other
country besides Brazil (chart below). Also, food processing is the largest component of Iowa’s
manufacturing base. So, adding value to Iowa’s base commodities is a proven model, and building
on that success will meet projected global demand while adding jobs and tax base at the source.
Sources: Ethanol 2020 – Global Market Survey, Next Generation Trends, and Forecast, Multi-Client Study,
Emerging Markets Online, 2008; U.S. Bureau of Economic Analysis, 2009 and Iowa Workforce Development, 2010
Iowa is home to 27 of the largest 100 food
manufacturers/processors. (Food Processing
Magazine, 2010)
The food industry is a major component of
Iowa’s overall economy contributing almost six
billion to the state’s Gross Domestic Product
(GDP), representing approximately 24 percent
of Iowa’s manufacturing GDP and employing
more than 50,000 Iowans.

100 | Context | Iowa AgriScope 2030
Add Value – Responsibilities
Build on global leadership in value-added products (i.e. bio-fuels, meat and other food
processing).
Actions Team Leader(s) Team Member(s)
Support development of biofuels bi-product markets. I-PEPIowa Secretary of Ag, IDALS, ISU, Ag &
Commodity Organizations, Businesses
Assure a plentiful supply of base commodities by
encouraging the livestock sector in Iowa.Iowa Secretary of Ag
IDALS, I-PEP, Ag & Commodity
Organizations, Ag Producers, Coalition to
Support Farmers
Commit to discovery and adoption of food safety
technologies and processes that assure consumer
confidence.
ISU Businesses
Recruit new food processing businesses to the state. I-PEP
Iowa Governor, Iowa Secretary of Ag,
IDALS, Ag & Commodity Organizations,
Businesses
Encourage branded products built on quality and
unique, value-added attributes.IDALS Businesses, I-PEP, ISU

101 | Context | Iowa AgriScope 2030
Add value to the value-added and build on the success of Iowa
businesses.
Reco
m.
Add Value
Strateg
y
• Identify opportunities for adding value to products and bi-products and target
those opportunities in promotional efforts.
• Recruit businesses that can locate near Iowa’s ethanol plants and process co-
products.
• Encourage Iowans to invest in businesses that are adding value to local
commodities and providing economic activity in their communities through
investment income tax policy.
Actio
ns
Add Value

102 | Context | Iowa AgriScope 2030
Add Value - Rationale
Add value to the value-added and build on the success of Iowa businesses.
Throughout agriculture processing, there are captivating examples of bi-products or waste
products being transformed into needed, beneficial products that are sometimes more
valuable on the market than the product from which it was ‘cast off’.
In ideal instances, Iowa manufacturers and processors attract “over the fence” co-processors .
. . . businesses that tap into a stream of bi-products from the original plant and establish a
viable business ‘right next door’. With aggressive recruitment and innovative processes, Iowa
will be able to build ‘clusters’ of value-generators in rural locations.
Source: Cluster Manufacturing: A Supply Chain Perspective, Cognizant

103 | Context | Iowa AgriScope 2030
Add Value – Responsibilities
Add value to the value-added and build on the success of Iowa businesses.
Actions Team Leader(s) Team Member(s)
Identify opportunities for adding value to products and
bi-products and target those opportunities in
promotional efforts.
I-PEP ISU, Businesses, Innovation Council
Recruit businesses that can locate near Iowa’s
ethanol plants and process co-products.I-PEP
Ag & Commodity Organizations, Rural
Counties/Communities, Ag Producers
Encourage Iowans to invest in businesses that are
adding value to local commodities and providing
economic activity in their communities through
investment income tax policy.
Iowa Legislature Iowa Governor, Iowa Secretary of Ag

104 | Context | Iowa AgriScope 2030
Recruit further processing businesses to locate and grow in
Iowa, especially in rural communities.
Reco
m.
Add Value
Strateg
y
• Continually observe trends and keep Iowa in the forefront of capitalizing on
those trends.
• Identify potential for ‘clusters’ and pursue businesses in those sectors.
• Identify and promote communities that have plentiful water supply and
treatment capability for ag and food processing plants.
Actio
ns
Add Value

105 | Context | Iowa AgriScope 2030
Add Value - Rationale
Recruit further processing businesses to locate and grow in Iowa, especially in rural
communities.
2010 census data indicates that much of rural Iowa continues to
lose population while the state’s population grew by over four
percent.
In a recent response to the census, Keokuk, IA Mayor Tom Marion
reflected a belief held by many rural community leaders:
“The key to getting people back to rural areas, including Keokuk, is
jobs . . . .that's what it's all about with any community, whether it's
small or large, if you don't have the jobs people aren't going to
stay there.”
Processing, and further processing, of Iowa’s basic commodities
seems to be a logical fit for creating rural Iowa jobs, but nothing
happens without leadership, recruitment and hard work. For
agriculture production and support businesses, having further
processing businesses in rural areas means additional part or full
time jobs for farmers and family members.

106 | Context | Iowa AgriScope 2030
Add Value – Responsibilities
Recruit further processing businesses to locate and grow in Iowa, especially in rural
communities.
Actions Team Leader(s) Team Member(s)
Continually observe trends and keep Iowa in the
forefront of capitalizing on those trends.I-PEP
ISU, Ag & Commodity Organizations,
Businesses, Ag Producers
Identify potential for ‘clusters’ and pursue businesses
in those sectors.Businesses
Iowa Secretary of Ag, I-PEP, Rural
Counties/Communities
Identify and promote communities that have plentiful
water supply and treatment capability for ag and food
processing plants.
Regional Economic Development
Organizations
I-PEP, IDALS, Rural
Counties/Communities

107 | Context | Iowa AgriScope 2030
Develop infrastructure and systems that support segregation,
storage, movement and marketing of value-added crops and
products, specialty crops, livestock, etc.
Reco
m.
Add Value
Strateg
y
• Assess the cost vs. benefit of affecting change in the system and determine
advisability.
• Encourage use of technologies that facilitate crop to market systems in order to
avoid costly changes.
• Facilitate changes in the current system that have the potential to benefit
consumers and a full spectrum of production.
Actio
ns
Add Value

108 | Context | Iowa AgriScope 2030
Add Value - Rationale
Develop infrastructure and systems that support segregation, storage, movement and
marketing of value-added crops and products, specialty crops, livestock, etc.
The current crop movement and storage system, prevalent throughout the Midwest, accommodates #2
yellow corn and #2 yellow soybeans plus a few other bulk commodities. While the system is very
efficient, it has become, essentially, an obstacle to efficiently marketing large quantities of other crops
and products.
For example, international marketers find that there is a market for Iowa grown #1 yellow corn.
However, the current system does not allow efficient delivery of #1, and available alternatives add too
much cost for producers to capture the customers’ extra payment for the quality they want. Also,
identity preserved crops that may be used to produce more beneficial foods and consumer products
cannot be segregated and delivered efficiently enough to meet a price point where consumers are
willing to pay and farmers can benefit. And the current system makes it more difficult for new and/or
locally grown products to grow a meaningful market.
A comprehensive study of the costs/benefits of changing, or
adapting, the current system would help guide policy makers,
businesses and producers as they identify opportunities for
cost-effective, technology driven changes that will create a
system that’s more consumer-responsive and helps Iowa
farmers profit from emerging opportunities.

109 | Context | Iowa AgriScope 2030
Add Value – Responsibilities
Develop infrastructure and systems that support segregation, storage, movement and
marketing of value-added crops and products, specialty crops, livestock, etc.
Actions Team Leader(s) Team Member(s)
Assess the costs vs. benefit of affecting change in the
system and determine advisability.ISU
Iowa Secretary of Ag, IDALS, Ag &
Commodity Organizations, Businesses,
Ag Producers
Encourage use of technologies that facilitate crop to
market systems in order to avoid costly changes.ISU Businesses, Ag Producers
Facilitate changes in the current system that have the
potential to benefit consumers and a full spectrum of
production.
BusinessesIowa Secretary of Ag, Ag & Commodity
Organizations, Ag Producers

Secondary StrategiesIncluding Recommendations, Actions, Rationales and Responsibilities
110 | Context | Iowa AgriScope 2030

111 | Context | Iowa AgriScope 2030
Protect Comparative Advantage
• Influence Congress to appropriate funding for lock expansion projects on the
Upper Mississippi and Illinois rivers authorized in the 2007 Water Resources
Development Act.
• Assure that the Missouri River is maintained as a viable option for commercial
movement of western Iowa commodities and related products into the
extensive US inland waterway system and global markets.
• Plan for projected increases in Iowa crop and livestock production, food and
fuel processing and manufacturing, and resultant truck traffic increases.
• Assure adequate freight rail line capacity, access and provider options to serve
agricultural production and processed product rail needs.
Reco
mm
end
ation
s
Improved Transportation Infrastructure
Build a healthy mix of transportation systems that give producers,
processors, manufacturers and input providers the options they
need for competitive pricing and market access flexibility. Costs to
move Iowa’s products to national and world markets are as low as
any competing state or country.
Strateg
y
Workforce
Soil &
Water
Transportation
Infrastructure
Black = Priority Recommendation Gray = Secondary Recommendation

112 | Context | Iowa AgriScope 2030
Protect Comparative Advantage
Influence Congress to appropriate funding for lock expansion
projects on the Upper Mississippi and Illinois rivers authorized in
the 2007 Water Resources Development Act.
Reco
m.
Improved Transportation Infrastructure
Strateg
y
• Establish this project as a top priority for Iowa’s (bipartisan) state leadership
and Congressional delegation.
• Provide leadership, through Governor Branstad, to Midwest governors and US
Senators to derive adequate funding.
• Support the increase of the lock and dam system on the Upper Mississippi
River Basin, the improvement/replacement of locks and dams, and the
modification and expansion of other structures and facilities that increase
transportation efficiency.
Actio
ns
Workforce
Soil &
Water
Transportation
Infrastructure

113 | Context | Iowa AgriScope 2030
Mississippi River locks and dams, mostly built in the 1930s, allowed the Midwest to
become the global agriculture powerhouse that it is today. However, the aging
system is now dangerously close to causing a mid-planting season or mid-harvest
emergency due to deterioration. A US Army Corps of Engineers proposal to upgrade
the systems was approved by Congress (2007) but has not been funded.
Iowa and other Midwestern states have a great deal to gain from this project, and
the entire country will benefit from the improvement of this major artery of commerce.
Bringing this system into the 21st century will assure Midwest leadership in global
food provision. Also, funding this already-approved project would create both short
term construction and long-term transportation jobs in Iowa.
Improved Transportation Infrastructure - Rationale
Influence Congress to appropriate funding for lock expansion projects on the Upper
Mississippi and Illinois rivers authorized in the 2007 Water Resources Development Act.
Source: Rivers Project, US Army Corps of Engineers

114 | Context | Iowa AgriScope 2030
Improved Transportation Infrastructure - Responsibilities
Influence Congress to appropriate funding for lock expansion projects on the Upper
Mississippi and Illinois rivers authorized in the 2007 Water Resources Development Act.
Actions Team Leader(s) Team Member(s)
Establish this project as a top priority for Iowa’s
(bipartisan) state leadership and Congressional
delegation.
Iowa Governor
Congress, Iowa Legislature, Iowa
Secretary of Ag, IDOT, Ag & Commodity
Organizations, Ag Producers
Provide leadership, through Governor Branstad, to
Midwest governors and US Senators to derive
adequate funding.
Iowa Governor
Support the increase of the lock and dam system on
the Upper Mississippi River Basin, the
improvement/replacement of locks and dams, and the
modification and expansion of other structures and
facilities that increase transportation efficiency.
Iowa Governor
Congress, Iowa Legislature, Iowa
Secretary of Ag, IDOT, Ag & Commodity
Organizations, Ag Producers

115 | Context | Iowa AgriScope 2030
Protect Comparative Advantage
Assure that the Missouri River is maintained as a viable option
for commercial movement of western Iowa commodities and
related products into the extensive US inland waterway system
and global markets.
Reco
m.
Improved Transportation Infrastructure
Strateg
y
• Join other affected states to bring pressure to bear on policy makers and the
US Army Corps of Engineers to prioritize flood control and commercial use of
the river.
• Oppose changes to Army Corps of Engineers river operations that lead to
reduced navigation, reduced flood control measures or spring rises.
Actio
ns
Workforce
Soil &
Water
Transportation
Infrastructure

116 | Context | Iowa AgriScope 2030
Improved Transportation Infrastructure - Rationale
Assure that the Missouri River is maintained as a viable option for commercial movement of western Iowa commodities and related products into the extensive US inland waterway system and global markets.
As the number of intense rain events in the Midwest and Plains states trends higher, flood
control along the Missouri River becomes an ever greater priority. This summer, governors of
seven Missouri River states, including Governor Branstad, requested the US Army Corps of
Engineers to provide recommendations for greater flood protection in the Missouri River basin.
Also, commercial use of the Missouri River is an important transportation option. It will help
move the projected increase in production and processing, especially from western Iowa, to the
Mississippi River export conduit more efficiently. And it will relieve some of the stress the
projected increases will put on other transport options.
Source of the picture: USDA

117 | Context | Iowa AgriScope 2030
Improved Transportation Infrastructure - Responsibilities
Assure that the Missouri River is maintained as a viable option for commercial movement of western Iowa commodities and related products into the extensive US inland waterway system and global markets.
Actions Team Leader(s) Team Member(s)
Join other affected states to bring pressure to bear on
policy makers and the US Army Corps of Engineers to
prioritize flood control and commercial use of the river.
Iowa Governor
Oppose changes to Army Corps of Engineers river
operations that lead to reduced navigation, reduced
flood control measures or spring rises.
Iowa Governor
Iowa Legislature, Iowa Secretary of Ag,
IDOT, Ag & Commodity Organizations, Ag
Producers

118 | Context | Iowa AgriScope 2030
Protect Comparative Advantage
Plan for projected increases in Iowa crop and livestock
production, food and fuel processing and manufacturing, and
resultant truck traffic increases.
Reco
m.
Improved Transportation Infrastructure
Strateg
y
• Encourage each Iowa county to maintain necessary farm-to-market roads and
to close roads and bridges that are no longer essential.
• Increase funding for rural roads and bridges via an agreed revenue stream.
• Assure adequate maintenance and rebuilding, when necessary, of interstate
highways.
• Develop a state highway plan that provides the necessary capacity, and assure
its implementation before it is needed.
Actio
ns
Workforce
Soil &
Water
Transportation
Infrastructure

119 | Context | Iowa AgriScope 2030
Improved Transportation Infrastructure - Rationale
Plan for projected increases in Iowa crop and livestock production, food and fuel processing
and manufacturing, and resultant truck traffic increases.
While Iowa ranks 30th in population among the 50 states, it ranks fifth in the
number of bridges and 13th in the number of miles of road, and the rural
population continues to shift to metropolitan areas. As rural Iowa population
and home sites decline, fewer miles of rural roads and fewer bridges may be
necessary.
However, rural roads and bridges are key to efficient production and marketing
of agriculture commodities and processed products. So, farmers and
agriculture businesses will seek proactive involvement in county-level
comprehensive planning processes that include all vested interests, including
neighboring counties.
Also, Iowa’s interstate highways create a comparative advantage for moving
agriculture commodities and processed products to further processing and
consumer markets, so they are a critical asset that producers, processors and
businesses indicate must be maintained and protected.
Source: Iowa population shift from rural to urban, USA Today | Census, 2011

120 | Context | Iowa AgriScope 2030
Improved Transportation Infrastructure - Responsibilities
Plan for projected increases in Iowa crop and livestock production, food and fuel processing
and manufacturing, and resultant truck traffic increases.
Actions Team Leader(s) Team Member(s)
Encourage each Iowa county to maintain necessary
farm-to-market roads and to close roads and bridges
that are no longer essential.
Ag ProducersAg & Commodity Organizations, Rural
Counties/Communities
Increase funding for rural roads and bridges via an
agreed revenue stream.
Iowa Legislature, Ag & Commodity
Organizations
Ag Producers, Rural
Counties/Communities
Assure adequate maintenance and rebuilding, when
necessary, of interstate highways.Congress
Iowa Legislature, IDOT, Ag & Commodity
Organizations
Develop a state highway plan that provides the
necessary capacity, and assure its implementation
before it is needed.
IDOT Iowa Legislature

121 | Context | Iowa AgriScope 2030
Protect Comparative Advantage
Assure adequate freight rail line capacity, access and provider
options to serve agricultural production and processed product
rail needs.
Reco
m.
Improved Transportation Infrastructure
Strateg
y
• Encourage adequate financial resources be employed, when necessary, for the
development of viable inter and intra-state railroads.
• Identify strategic agricultural rail routes and collaborate with inter-state rail
companies to maintain and develop lines to support value-added agricultural
business opportunities.
• Collaborate with regional rail companies to ensure cost-effective connections to
access export growth markets via Pacific Northwest ports. Sustain already
established rail routes to national and export markets.
Actio
ns
Workforce
Soil &
Water
Transportation
Infrastructure

122 | Context | Iowa AgriScope 2030
Improved Transportation Infrastructure - Rationale
Assure adequate freight rail line capacity, access and provider options to serve agricultural
production and processed product rail needs.
According to many interviewees, loss of rail service creates severe economic hardship in
strategic areas of Iowa, so they stress the crucial nature of rail service for Iowa’s rural economy
and agriculture related businesses.
Freight rail access will become even more important as global customer demand increases and
Iowa production and processing responds by increasing to meet demand. And since the
source of greatest global demand is shifting to Asia, the state’s rail system may be incentivized
to shift to or add service to the West coast, possibly impacting current service to established
foreign and domestic markets.
Photo Source: The Infrastructurist: America Under Construction

123 | Context | Iowa AgriScope 2030
Improved Transportation Infrastructure - Responsibilities
Assure adequate freight rail line capacity, access and provider options to serve agricultural
production and processed product rail needs.
Actions Team Leader(s) Team Member(s)
Encourage adequate financial resources be employed,
when necessary, for the development of viable inter
and intra-state railroads.
IDOT
Iowa Governor, Iowa Secretary of Ag, Ag
& Commodity Organizations, Businesses,
Congress
Identify strategic agricultural rail routes and collaborate
with inter-state rail companies to maintain and develop
lines to support value-added agricultural business
opportunities.
IDOT, Businesses Ag & Commodity Organizations
Collaborate with regional rail companies to ensure
cost-effective connections to access export growth
markets via Pacific Northwest ports. Sustain already
established rail routes to national and export markets.
Ag & Commodity Organizations,
BusinessesIDOT

124 | Context | Iowa AgriScope 2030
Protect Comparative Advantage
• Educate, recruit, attract and retain a workforce with knowledge of and passion
about production agriculture, processing and the businesses that serve
agriculture and processing.
Reco
mm
end
ation
s
Qualified, Adequate Workforce
Create opportunities in the bio economy that encourage the best
and brightest to remain in Iowa and become involved in aspects of
the broad agriculture field. Educate and prepare Iowans to take
leadership roles, advancing technology and developing
innovations that improve Iowa’s agriculture production and
processing sectors. Assure that there is enough available labor to
meet needs.
Strateg
y
Workforce
Soil &
Water
Transportation
Infrastructure
Black = Priority Recommendation Gray = Secondary Recommendation

125 | Context | Iowa AgriScope 2030
Protect Comparative Advantage
Educate, recruit, attract and retain a workforce with knowledge of
and passion about production agriculture, processing and the
businesses that serve agriculture and processing.
Reco
m
Qualified, Adequate Workforce
Strateg
y
• Build and provide education and training programs that are relevant, efficiently
managed and focused on future needs, such as food safety tech, food
processing, biofuel engineering and fermentation manufacturing, etc.
• Support Iowa STEM initiative and provide biosciences expertise for program
development.
• Coordinate community colleges’ training, statewide, for both agriculture
production and processing.
• Provide extension programming, applied research and undergraduate
curriculum to support new opportunities in agriculture, such as production for
niche markets and bio-energy production.
• Achieve adequate levels of applicants for ag production and processing jobs by
developing a program to recruit legal immigrants who want to work in ag
production and ag/food processing sectors – attract the ’cream of the crop’ to
Iowa.
Actio
ns
Workforce
Soil &
Water
Transportation
Infrastructure

126 | Context | Iowa AgriScope 2030
Most Iowans are educated for and seek higher-
paid, ‘cleaner’ jobs than those found in production
agriculture and processing. Iowa has the third
highest graduation rate – 87.2% in 2009 - in the
nation and continually ranks in the top three for
ACT and SAT scores. These graduates are
qualified to provide management, research and
information tech jobs in the new bio economy.
However, for Iowa to maintain its leadership in
production and processing, a plentiful supply of
people wanting to work on farms and in plants will
be essential.
Qualified, Adequate Workforce - Rationale
Educate, recruit, attract and retain a workforce with knowledge of and passion about
production agriculture, processing and the businesses that serve agriculture and processing.
Source: Wells
As Iowa focuses its efforts and policies on increasing its global role and
influence in agriculture, education in science, technology, engineering and
math - and specific agriculture fields, at all levels - become even more
important. Initiatives should be targeted, relevant, efficiently managed and
focused on future needs, such as food safety tech, food processing, biofuel
engineering and fermentation manufacturing, etc.

127 | Context | Iowa AgriScope 2030
Qualified, Adequate Workforce - Responsibilities
Educate, recruit, attract and retain a workforce with knowledge of and passion about
production agriculture, processing and the businesses that serve agriculture and processing.
Actions Team Leader(s) Team Member(s)
Build and provide education and training programs that
are relevant, efficiently managed and focused on future
needs, such as food safety tech, food processing,
biofuel engineering and fermentation manufacturing,
etc.
ISU Other Universities, Community Colleges
Support Iowa STEM initiative and provide biosciences
expertise for program development.Businesses Ag & Commodity Organizations
Coordinate community colleges’ training, statewide,
for both agriculture production and processing.Community Colleges IDE
Provide extension programming, applied research and
undergraduate curriculum to support new opportunities
in agriculture, such as production for niche markets
and bio-energy production.
ISU
Achieve adequate levels of applicants for ag production
and processing jobs by developing a program to recruit
legal immigrants who want to work in ag production
and ag/food processing sectors – attract the ’cream of
the crop’ to Iowa.
Ag & Commodity Organizations,
BusinessesI-PEP, Ag Producers, Businesses
Develop and implement professional production and
processing certificate programs.ISU
Community Colleges, Ag & Commodity
Organizations, Businesses, Ag Producers
Provide professional development programs that keep
Iowa farmers and businesses ahead of their
competition.
ISUCommunity Colleges, Ag & Commodity
Organizations, Businesses, Ag Producers

128 | Context | Iowa AgriScope 2030
• Convince Iowa businesses and those considering locating or investing here
that Iowa is “Open for Business” and is ready to help resolve problems or
share opportunities.
• Support the new Iowa Partnership for Economic Progress (I-PEP) and its
public-private approach to economic development. Assure the new system is
supportive of a bio based economy and that its needs are prioritized.
• Assure broadband transmission is available to Iowa communities for use by
agriculture businesses, processing businesses, input providers and assure the
integrity of satellite transmissions to GPS receivers.
Reco
mm
end
ation
s
Supportive Business Environment
Develop a reputation for a progressive and supportive form of
government economic development that helps established
businesses resolve problems and new businesses more easily
establish, grow, and prosper. Create a business climate that
encourages commodity processing and further processing
businesses to start in Iowa, come to Iowa and create Iowa jobs.
Strateg
y
Improve
Business Climate
Business Environment
Regulations & Taxes
Black = Priority Recommendation Gray = Secondary Recommendation

129 | Context | Iowa AgriScope 2030
Convince Iowa businesses and those considering locating or
investing here that Iowa is “Open for Business” and is ready to
help resolve problems or share opportunities.
Reco
m.
Supportive Business Environment
Strateg
y
Improve
Business Climate
• Create a “business concierge” service, either government-based or private
sector, that provides one-on-one specific assistance to both established Iowa
businesses and those considering locating in Iowa as they navigate
government requirements and incentives.
• Provide a flexible, responsive business, government and social environment
where currently unimagined value-added businesses may establish and
flourish.
• Encourage foreign investment in Iowa-based agricultural research, production,
and processing.
Actio
ns
Business Environment
Regulations & Taxes

130 | Context | Iowa AgriScope 2030
Supportive Business Environment - Rationale
Convince Iowa businesses and those considering locating or investing here that Iowa is
“Open for Business” and is ready to help resolve problems or share opportunities.
Many of the frustrations experienced by producers, processors and agriculture supply businesses in Iowa
could be avoided or reduced through focused, direct contact with people whose job it is to understand
and ‘translate’ government’s requirements, rules and regulations.
An “Easy Button” or a business concierge service was suggested to help them cut through “red tape” - a
one-stop shop that would, among other tasks:
facilitate timely permitting,
arbitrate regulatory compliance disputes,
provide full government information assistance,
schedule tailor-made visits for businesses interested in locating in Iowa,
compile and share information about investment incentives,
provide access to Iowa structural funds,
identify possible business properties,
assist search for potential suppliers/JV/acquisition partners
This one stop shop, or business concierge service, could support government leader efforts to bring
businesses and investors to Iowa. Perhaps most importantly, those providing the service can also provide
timely, relevant feedback to state agencies that can use the input to improve services and programs.
Foreign investment can be encouraged through direct, interpersonal promotions but also through state
incentive programs, such as a revamped, broadened EB-5 program.
®

131 | Context | Iowa AgriScope 2030
Supportive Business Environment – Responsibilities
Convince Iowa businesses and those considering locating or investing here that Iowa is
“Open for Business” and is ready to help resolve problems or share opportunities.
Actions Team Leader(s) Team Member(s)
Create “business concierge” service, either
government-based or private sector, that provides one-
on-one specific assistance to both established Iowa
businesses and those considering locating in Iowa as
they navigate government requirements and incentives.
I-PEP Iowa Governor, Businesses
Provide a flexible, responsive business, government
and social environment where currently unimagined
value-added businesses may establish and flourish.
I-PEP
Iowa Governor, Iowa Legislature, IDALS,
IDNR, Rural Counties/Communities,
Businesses
Encourage foreign investment in Iowa-based
agricultural research, production, and processing.Iowa Governor I-PEP, Iowa Secretary of Ag, IDALS

132 | Context | Iowa AgriScope 2030
Support the new Iowa Partnership for Economic Progress (I-
PEP) and its public-private approach to economic development.
Assure the new system is supportive of a bio based economy
and that its needs are prioritized.
Reco
m.
Supportive Business Environment
Strateg
y
Improve
Business Climate
Actio
ns
Business Environment
Regulations & Taxes
No specific actions were
developed for this
recommendation.

133 | Context | Iowa AgriScope 2030
Supportive Business Environment - Rationale
Support the new Iowa Partnership for Economic Progress (I-PEP) and its public-private approach to economic development. Assure the new system is supportive of a bio based economy and that its needs are prioritized.
Governor Branstad and state legislators worked together this past legislative session to
create a new approach to economic development delivery in the state of Iowa. That led to
the creation of the Iowa Partnership for Economic Progress -- a public-private partnership
that will update and improve Iowa’s economic development services delivery.
The public arm of the new organization is the Iowa Economic Development Authority. It
replaces the former Iowa Department of Economic Development and oversees the
traditional economic development programs. On the private side, the Iowa Innovation
Corporation was created to operate as Iowa's innovation intermediary, assisting existing
Iowa companies in their quest to develop innovative ideas,
products and processes, as well as helping to grow and
develop new products and companies that emanate from
Iowa ideas and research.
Source: Text courtesy of IDED; Image of Proposed Organizational Structure of Iowa Partnership for Economic Progress

134 | Context | Iowa AgriScope 2030
Supportive Business Environment – Responsibilities
Support the new Iowa Partnership for Economic Progress (I-PEP) and its public-private approach to economic development. Assure the new system is supportive of a bio based economy and that its needs are prioritized.
Actions Team Leader(s) Team Member(s)
Ag & Commodity Organizations
Other Organizations, Rural
Counties/Communities, Businesses, Ag
Producers
No specific actions were developed
for this recommendation

135 | Context | Iowa AgriScope 2030
Assure broadband transmission is available to Iowa communities
for use by agriculture businesses, processing businesses, input
providers and assure the integrity of satellite transmissions to
GPS receivers.
Reco
m.
Supportive Business Environment
Strateg
y
Improve
Business Climate • Change Iowa’s property tax structure to create equity among broadband
providers and encourage investment in broadband to all of Iowa, emphasizing
rural areas.
• Influence and support federal (FCC) reform of the Universal Services Fund
(USF) by shifting funds away from landlines to broadband services,
encouraging investment in broadband to all of Iowa and emphasizing rural
areas. Continually monitor information technology needs and early access to
keep Iowa ‘ahead of the pack’.
• Monitor and oppose, if necessary, efforts to utilize mobile satellite spectrum for
wireless communications that would compromise the current use of the
spectrum or limit increased use for ag production and business.
• Influence Congress to provide adequate spectrum access necessary for
growth in the use of remote sensors and GPS positioning for production
agriculture and commodity processing systems.
Actio
ns
Business Environment
Regulations & Taxes

136 | Context | Iowa AgriScope 2030
Supportive Business Environment - Rationale
Assure broadband transmission is available to Iowa communities for use by agriculture businesses, processing businesses, input providers and assure the integrity of satellite transmissions to GPS receivers.
The ability to transmit large quantities of data and to use Global
Positioning Systems (GPS) without interruption is growing in
importance for modern agriculture production and support
businesses, as well as many processing entities.
Because Iowa is a relatively low population state, commercially
provided support is not always readily available but can be
encouraged through tax policy and FCC policy changes.
As producers continue to adopt remote sensor and GPS
technology, they and their input suppliers will have an increasing
need for access to the satellite spectrum that is currently limited by
the federal government and under increasing pressure from
mobile phone communications.

137 | Context | Iowa AgriScope 2030
Supportive Business Environment – Responsibilities
Assure broadband transmission is available to Iowa communities for use by agriculture businesses, processing businesses, input providers and assure the integrity of satellite transmissions to GPS receivers.
Actions Team Leader(s) Team Member(s)
Change Iowa’s property tax structure to create equity
among broadband providers and encourage investment
in broadband to all of Iowa, emphasizing rural areas.
Iowa Legislature Iowa Governor, I-PEP, Innovation Council
Influence and support federal (FCC) reform of the
Universal Services Fund (USF) by shifting funds away
from landlines to broadband services, encouraging
investment in broadband to all of Iowa and
emphasizing rural areas. Continually monitor
information technology needs and early access to
Congress Iowa Governor, Innovation Council
Monitor and oppose, if necessary, efforts to utilize
mobile satellite spectrum for wireless communications
that would compromise the current use of the
spectrum or limit increased use for ag production and
business.
Ag & Commodity OrganizationsCongress, Iowa Secretary of Ag,
Businesses, Ag Producers
Influence Congress to provide adequate spectrum
access necessary for growth in the use of remote
sensors and GPS positioning for production agriculture
and commodity processing systems.
Ag & Commodity OrganizationsIowa Secretary of Ag, Businesses, Ag
Producers

138 | Context | Iowa AgriScope 2030
• Create a climate for innovation in agriculture, food, fiber, f(ph)armaceutical and
renewable fuel businesses, and in the supporting sciences.
• Encourage and support entrepreneurism.
Reco
mm
end
ation
s
Innovation Reputation
Strive to make Iowa known for its culture of innovation and
technology development, and develop valuable support systems
for both. Once those systems are firmly in place, protect them for
use by Iowa’s business, academia and government leaders.
Support entrepreneurism with actions that help translate
innovation into increased economic activity.
Strateg
y
Encourage
Innovation
Innovation Reputation
Research & Education
Black = Priority Recommendation Gray = Secondary Recommendation

139 | Context | Iowa AgriScope 2030
Create a climate for innovation in agriculture, food, fiber,
f(ph)armaceutical and renewable fuel businesses, and in the
supporting sciences.
Reco
m.
Innovation Reputation
Strateg
y
• Build Iowa’s reputation as a hotbed of innovation.
• Support growth of innovative businesses and activities already rooted in Iowa.
• Recruit innovative businesses, particularly those in the agriculture sector.
• Identify and eliminate any unnecessary laws and regulations that stifle or slow
adoption and utilization of technologies. Avoid passage of such
laws/regulations in the future.
• Sponsor a competition and significant award for best annual innovation that
benefits Iowa’s agriculture, agri-business, food processing, bio fuel sectors or
other, related sectors.
• Sponsor agriculture, renewable energy and food processing conferences that
bring the most innovative businesses to the state.
• Actively support and encourage the new Iowa Innovation Council and assure
bio economy based input for its strategy and resultant programs.
• Establish Iowa as a leader in the development of food safety technologies,
systems and businesses that will serve the growing global demand for safe
food supplies.
Actio
ns
Encourage
Innovation
Innovation Reputation
Research & Education

140 | Context | Iowa AgriScope 2030
Innovation Reputation - Rationale
Create a climate for innovation in agriculture, food, fiber, f(ph)armaceutical and renewable
fuel businesses, and in the supporting sciences.
Innovation in agriculture production drives the
increases in efficiencies and production levels that
allow US consumers to enjoy relatively low food
costs and a wide variety of food products.
Innovation also provides consumers with
renewable fuel options, improved natural fibers
and pharmaceuticals developed from plants.
However, those interviewed for this project
expressed concern about a lack of public support
for research and development of innovations and
a growing resistance to adoption of innovations in
the food and agriculture sectors.

141 | Context | Iowa AgriScope 2030
Innovation Reputation – Responsibilities
Create a climate for innovation in agriculture, food, fiber, f(ph)armaceutical and renewable
fuel businesses, and in the supporting sciences.
Actions Team Leader(s) Team Member(s)
Build Iowa’s reputation as a hotbed of innovation. Innovation Council Iowa Governor, I-PEP, Businesses, Media
Support growth of innovative businesses and activities
already rooted in Iowa.I-PEP Iowa Governor
Recruit innovative businesses, particularly those in the
agriculture sector.I-PEP
Iowa Governor, Ag & Commodity
Organizations, Iowa Secretary of Ag
Identify and eliminate any unnecessary laws and
regulations that stifle or slow adoption and utilization
of technologies. Avoid passage of such
laws/regulations in the future.
Iowa Legislature Iowa Governor, IDALS, I-PEP, IDNR
Sponsor a competition and significant award for best
annual innovation that benefits Iowa’s agriculture, agri
business, food processing, bio fuel sectors or other,
related sectors.
Innovation Council Iowa Governor, Iowa Secretary of Ag
Sponsor agriculture, renewable energy and food
processing conferences that bring the most innovative
businesses to the state.
Iowa Secretary of Ag
Iowa Governor, Ag & Commodity
Organizations, Businesses, Innovation
Council
Actively support and encourage the new Iowa
Innovation Council and assure bio economy based
input for its strategy and resultant programs.
Ag & Commodity OrganizationsIowa Secretary of Ag, Businesses, Ag
Producers
Establish Iowa as a leader in the development of food
safety technologies, systems and businesses that will
serve the growing global demand for safe food supplies
.
ISUIowa Governor, Iowa Legislature, Iowa
Secretary of Ag, Businesses

142 | Context | Iowa AgriScope 2030
Encourage and support entrepreneurism.
Reco
m.
Innovation Reputation
Strateg
y
• Identify, develop and create an entrepreneurial talent pool that is coordinated
across the state, interacts with various regional organizations and is committed
to entrepreneurial development within the state of Iowa.
• Attract investment capital by positioning Iowa as the “Bio-Capital” of North
America through progressive state-backed programs, developed in conjunction
with private industry.
• Link mentorship to investment.
• Identify and recruit management with entrepreneurial or start-up experience
and match business organizational needs with commercial management
expertise.
• Develop business talent by working with experienced entrepreneurial groups
and universities, develop entrepreneurial programs and reality based
curriculums utilizing a synergistic pool of academia, entrepreneurs and
entrepreneurial development groups.
Actio
ns
Encourage
Innovation
Innovation Reputation
Research & Education

143 | Context | Iowa AgriScope 2030
Innovation Reputation - Rationale
Encourage and support entrepreneurism.
Entrepreneurism is a bedrock element in the success of Iowa’s agriculture and related sectors. Encouraging and supporting entrepreneurism in 21st century initiatives should lead to increased economic activity. The challenge is discovering and applying the most effective support to entrepreneurism, but the chosen methods should include:
Stimulating economic thinking skills
Encouraging creative, intelligent risk-taking
Providing practical business experience
Rewarding independence and personal responsibility
Photo Source: Courtesy of Becker Underwood

144 | Context | Iowa AgriScope 2030
Innovation Reputation – Responsibilities
Encourage and support entrepreneurism.
Actions Team Leader(s) Team Member(s)
Identify, develop and create an entrepreneurial talent
pool that is coordinated across the state, interacts
with various regional organizations and is committed
to entrepreneurial development within the state of
Iowa.
I-PEPAg & Commodity Organizations,
Businesses
Attract investment capital by positioning Iowa as the
“Bio-Capital” of North America through progressive
state-backed programs, developed in conjunction with
private industry.
Iowa Governor, I-PEPAg & Commodity Organizations,
Businesses
Link mentorship to investment. Businesses
Identify and recruit management with entrepreneurial
or start-up experience and match business
organizational needs with commercial management
expertise.
Businesses
Develop business talent by working with experienced
entrepreneurial groups and universities, develop
entrepreneurial programs and reality based
curriculums utilizing a synergistic pool of academia,
entrepreneurs and entrepreneurial development
groups.
Businesses ISU, Other Universities

145 | Context | Iowa AgriScope 2030
• Provide an environment in which non-traditional ideas, farming operations and
businesses may establish a foothold and grow.
• Review the needs of new, innovative agriculture production and processing and
prioritize efforts to help with those needs.
• Assist ‘new to Iowa’ production and processing in their efforts to access
investment capital.
Reco
mm
end
ation
s
Nurture the New
Embrace diversity in agriculture production to provide food and
other agriculture products for a variety of markets, especially
Iowans who prefer locally-sourced and/or organic foodstuffs.
Strateg
y
Nurture
the New
Black = Priority Recommendation Gray = Secondary Recommendation

146 | Context | Iowa AgriScope 2030
Provide an environment in which non-traditional ideas, farming
operations and businesses may establish a foothold and grow.
Reco
m.
Nurture the New
Strateg
y
• Include the full diversity of Iowa production and processing in government,
university and organization programs.
• Provide arbitration for controversial situations or circumstances that arise
between existing and non-traditional production methods.
• Facilitate transfer of beneficial techniques, information and systems that are
developed by non-traditional producers and processors that can be adapted
and adopted by traditional producers and processors.
• Encourage institutions to incorporate local production into their food service
menus.
• Encourage producers to raise differentiated crops that are grown for specific
traits and contracted directly by the customer to limit risk.
Actio
ns
Nurture
the New

147 | Context | Iowa AgriScope 2030
Nurture the New - Rationale
Provide an environment in which non-traditional ideas, farming operations and businesses
may establish a foothold and grow.
Diversity is a concept that surfaced early in this project and maintained
consistent importance.
Most interviewed believe that there is room for a wide variety of production types
and processes in Iowa and that they should be encouraged. It was stressed
that the keys to successful diversification are:
acceptance of other systems
working with neighbors and other
producers to resolve problems
sharing knowledge and best practices to
benefit all products and systems
Photo Source: Courtesy of Niman Ranch

148 | Context | Iowa AgriScope 2030
Nurture the New – Responsibilities
Provide an environment in which non-traditional ideas, farming operations and businesses
may establish a foothold and grow.
Actions Team Leader(s) Team Member(s)
Include the full diversity of Iowa production and
processing in government, university and organization
programs.
IDALS, ISU
Iowa Legislature, Iowa Secretary of Ag, I-
PEP, Other Universities, Community
Colleges
Provide arbitration for controversial situations or
circumstances that arise between existing and non-
traditional production methods.
new organization or system IDALS, Coalition to Support Farmers
Facilitate transfer of beneficial techniques, information
and systems that are developed by non-traditional
producers and processors that can be adapted and
adopted by traditional producers and processors.
ISUIDALS, Ag & Commodity Organizations,
Ag Producers
Encourage institutions to incorporate local production
into their food service menus.Local production advocacy groups
Encourage producers to raise differentiated crops that
are grown for specific traits and contracted directly by
the customer to limit risk.
Businesses

149 | Context | Iowa AgriScope 2030
Review the needs of new, innovative agriculture production and
processing and prioritize efforts to help with those needs.
Reco
m.
Nurture the New
Strateg
y
• Host web-based forums and an annual attendance forum where non-traditional
producers and processors may network and share concerns, seek solutions.
• Focus ISU extension service work on helping start-ups, especially those
growing non-traditional crops or accessing their market in new ways.
Actio
ns
Nurture
the New

150 | Context | Iowa AgriScope 2030
Nurture the New - Rationale
Review the needs of new, innovative agriculture production and processing and prioritize
efforts to help with those needs.
Many producers of ‘new to Iowa’ products, commodities or systems benefit from
advice and guidance. However, because they are often on the ‘cutting edge’ of their
particular business, they often find themselves spending a great deal of their limited
time searching for sources of business and production information.
Quite a bit of that information is directly available
on the internet, but more tailored guidance can be
derived through Iowa’s Cooperative Extension
Service and local economic development
channels.
Networks and forums are especially valuable.
Producers and processors often learn best from
each other, both new ideas and the ‘nuts and
bolts’ of their particular business.

151 | Context | Iowa AgriScope 2030
Nurture the New – Responsibilities
Review the needs of new, innovative agriculture production and processing and prioritize
efforts to help with those needs.
Actions Team Leader(s) Team Member(s)
Host web-based forums and an annual attendance
forum where non-traditional producers and processors
may network and share concerns, seek solutions.
ISUIowa Secretary of Ag, IDALS, Ag &
Commodity Organizations
Focus ISU extension service work on helping start-
ups, especially those growing non-traditional crops or
accessing their market in new ways.
ISU

152 | Context | Iowa AgriScope 2030
Assist ‘new to Iowa’ production and processing in their efforts to
access investment capital.
Reco
m.
Nurture the New
Strateg
y
• Define parameters for successful solicitation of investment capital.
• Help those interested develop approved business plans, etc.
• Open doors with investment funds and individual investors.
Actio
ns
Nurture
the New

153 | Context | Iowa AgriScope 2030
Nurture the New - Rationale
Assist ‘new to Iowa’ production and processing in their efforts to access investment capital.
While there is general agreement that funding is available for good ideas with good
business plans, there is also general agreement that those who would like to pursue
different production, processing or food-to-market systems do not have the
background they need in business management and marketing.
Assistance in those areas will help ‘new to Iowa’ producers and food, fuel and
f(ph)arma achieve success levels that give them a better chance of growing a viable
business in Iowa.
Examples of ISU’s Leopold Center support for alternative production methods
and markets:
Iowa Local Food & Farm Plan
Life Cycle Assessment of Commodity and Niche Swine Production Systems

154 | Context | Iowa AgriScope 2030
Nurture the New – Responsibilities
Assist ‘new to Iowa’ production and processing in their efforts to access investment capital.
Actions Team Leader(s) Team Member(s)
Define parameters for successful solicitation of
investment capital.I-PEP Businesses
Help those interested develop approved business
plans, etc.I-PEP Community Colleges
Open doors with investment funds and individual
investors.Iowa Secretary of Ag I-PEP, Businesses

155 | Context | Iowa AgriScope 2030
• Lead campaign to increase the size and scope of Iowa agriculture.
• Achieve effective collaboration between agriculture and related sectors by
encouraging formation of an organization or system that becomes a foundation
for cooperation and issue prioritization across Iowa’s diverse agriculture sector.
Reco
mm
end
ation
s
Leadership
Black = Priority Recommendation Gray = Secondary Recommendation
Leadership
Iowa’s government, business and association leaders believe in
the importance of agriculture and associated sectors to Iowa’s
economy and align their efforts to maintain growth. They are
supported in their efforts by a cohesive industry that sets priorities
and proves itself worthy of leadership’s efforts.
Strateg
y

156 | Context | Iowa AgriScope 2030
Lead campaign to increase the size and scope of Iowa
agriculture.
Reco
m.
Leadership
Strateg
y
• Embrace production agriculture as an Iowa tradition, strength and base for
future growth.
• Use Iowa’s productive resources and 21st century innovative technologies to
create clean sought-after jobs and economic activity.
• Use campaign as a method of drawing attention to Iowa’s assets.
• Actively recruit bio processing and bio businesses to the state.
• Promote the research and development assets in which Iowa has already
invested and that are poised to support the development of bio-based
innovation and technologies.
• Lead the transition to a bio knowledge economy: one that replaces low profit
manufacturing with science-based, higher profit, innovation-based businesses.
• Invite business leaders for ‘reverse trade missions’ to Iowa communities that
are ready for and eager to site bio based businesses.
Actio
ns
Leadership

157 | Context | Iowa AgriScope 2030
Leadership - Rationale
Lead campaign to increase the size and scope of Iowa agriculture.
Governor Branstad has often demonstrated his support for Iowa’s agriculture sector, and those
we interviewed were enthused, even excited, about the prospect of growing their industry
under his leadership.
Strongest support is for the role he can play as “Cheerleader in Chief”: to reverse the trend of
negative messages and perceptions that portrayed agriculture over the past decade. There
are also great expectations that the Governor will bring reason and consistency to state
regulatory programs and new energy and focus to the state’s economic development efforts.
In short, Governor Branstad is expected to add power to the powerhouse of Iowa agriculture.

158 | Context | Iowa AgriScope 2030
Leadership – Responsibilities
Lead campaign to increase the size and scope of Iowa agriculture.
Actions Team Leader(s) Team Member(s)
Embrace production agriculture as an Iowa tradition,
strength and base for future growth.Iowa Governor
Iowa Legislature, Iowa Secretary of Ag,
IDALS, I-PEP, IDNR, IDOT, ISU, Other
Universities, Community Colleges, Ag &
Commodity Organizations, Other
Organizations, Rural
Counties/Communities, Businesses, Ag
Producers, Media, Innovation Council,
Lenders, Coalition to Support Farmers
Use Iowa’s productive resources and 21st century
innovative technologies to create clean sought-after
jobs and economic activity.
Businesses
Iowa Governor, Iowa Legislature, Iowa
Secretary of Ag, I-PEP, ISU, Ag &
Commodity Organizations, Ag Producers
Use campaign as a method of drawing attention to
Iowa’s assets.Iowa Governor Iowa Secretary of Ag, I-PEP
Actively recruit bio processing and bio businesses to
the state.Iowa Governor Iowa Secretary of Ag, I-PEP
Promote the research and development assets in
which Iowa has already invested and that are poised
to support the development of bio-based innovation
and technologies.
Iowa GovernorIowa Secretary of Ag, I-PEP, ISU, Other
Universities, Board of Regents
Lead the transition to a bio knowledge economy: one
that replaces low profit manufacturing with science-
based, higher profit, innovation-based businesses.
Iowa GovernorIowa Secretary of Ag, I-PEP, Innovation
Council
Invite business leaders for ‘reverse trade missions’ to
Iowa communities that are ready for and eager to site
bio based businesses.
Iowa GovernorIowa Secretary of Ag, I-PEP, Rural
Counties/Communities, Businesses

159 | Context | Iowa AgriScope 2030
Achieve effective collaboration between agriculture and related
sectors by encouraging formation of an organization or system
that becomes a foundation for cooperation and issue
prioritization across Iowa’s diverse agriculture sector.
Reco
m.
Leadership
Strateg
y
• Investigate other effective models, such as the Minnesota Agri Growth Council,
and gain consensus on the best way to provide unified support for the factors
that will “Increase the Size and Scope of Iowa Agriculture”.
• Use selected organization or system to develop consistent, prioritized advice
for government and other public sector institutions as they work to “Increase
the Size and Scope of Iowa Agriculture”.
• Host an annual seminar for Iowa government administration, legislature and
Congressional delegation to learn about the many aspects of agriculture in
Iowa, its impact on the state’s economy and crucial, current issues affecting the
broad spectrum of ‘seed to table or tank’.
Actio
ns
Leadership

160 | Context | Iowa AgriScope 2030
Leadership - Rationale
Achieve effective collaboration between agriculture and related sectors by encouraging formation of an organization or system that becomes a foundation for cooperation and issue prioritization across Iowa’s diverse agriculture sector.
Source: Hoksbergen & De Stigter Construction, Inc., Hog Buildings,
Terry Schuiteman, Sioux City, IA
Governor Branstad has embraced great challenges for his new administration, including his goal for agriculture and
its related sectors. Meeting that goal will require support – clear, consistent and consensus – from producers,
organizations and businesses. Several interviewed for this project indicated that consistent, prioritized messages for
the Governor and the Legislature could be achieved through an organization or system that will:
Assure membership is open to anyone interested, from individual farmers
to large corporations and including academia, associations, service
providers, small and large businesses, ag and business media, etc.
Provide a continuing forum for the diverse sectors of Iowa’s agriculture,
food, fuel and services spectrum to identify, discuss, prioritize and
advocate for important issues and projects
Advocate for those issues that have gained consensus from its
membership
Provide arbitration for issues that pit members against members
Sponsor an annual seminar for Iowa government administration,
legislature and Congressional delegation to learn more about the many
aspects of Iowa agriculture, its impact on the state’s economy and
crucial, current issues affecting the broad spectrum of ‘seed to table or tank’

161 | Context | Iowa AgriScope 2030
Leadership – Responsibilities
Achieve effective collaboration between agriculture and related sectors by encouraging formation of an organization or system that becomes a foundation for cooperation and issue prioritization across Iowa’s diverse agriculture sector.
Actions Team Leader(s) Team Member(s)
Investigate other effective models, such as the
Minnesota Agri Growth Council, and gain consensus
on the best way to provide unified support for the
factors that will "Increase the Size and Scope of Iowa
Agriculture".
Iowa Secretary of Ag
IDALS, ISU, Ag & Commodity
Organizations, Businesses, Ag
Producers, Coalition to Support Farmers
Use selected organization or system to develop
consistent, prioritized advice for government and other
public sector institutions as they work to "Increase the
Size and Scope of Iowa Agriculture".
new organization or systemAg & Commodity Organizations,
Businesses, Ag Producers
Host an annual seminar for Iowa government
administration, legislature and Congressional
delegation to learn about the many aspects of
agriculture in Iowa, its impact on the state’s economy
and crucial, current issues affecting the broad
spectrum of ‘seed to table or tank’.
Iowa Governor, new organization or
system
Iowa Secretary of Ag, IDALS, I-PEP, Ag &
Commodity Organizations, Businesses,
Ag Producers, Innovation Council

Chapter 4: Situational Analysis
162 | Context | Iowa AgriScope 2030

Situational Analysis Contents
• Summary assumptions about the future
• Demand for agricultural products
• Social trends & developments
• Technological trends & developments
• Economic trends & developments
• Environmental trends & developments
• Political/regulatory trends & developments
163 | Context | Iowa AgriScope 2030

A STEEP analysis was completed to evaluate the future demand for agricultural products as well as the social, technological, economic, environmental and political trends shaping the future, external environment for Iowa agriculture.
Consumer Demand
Econ
om
ic
164 | Context | Iowa AgriScope 2030

Demand for Agricultural Products
• Aggregate growth in the demand for food
increases by 40-50% by 2030 as per capita
income grows and hundreds of millions of
consumers enter the middle class.
• Ninety percent of the growth in the demand for
food over the next 20 years is from developing
countries. China continues to strive for 95% food
self-sufficiency but relaxes this goal for selected
commodities.
• Average daily caloric intake increases 6-8%
globally. Consumption of dairy products,
vegetable oils and meat increases the most.
Social Trends & Developments
• Consumer concern about health & wellness
and the environment continues to grow
globally.
• Food safety remains a priority issue for
consumers and the food value chain.
• Consumers gradually accept biotechnology
as new traits with environmental and health
benefits are introduced.
Agriculture Situational Analysis Summary: Assumptions/Forecasts About the Future (to 2030)
165 | Context | Iowa AgriScope 2030

Technological Trends & Developments Economic Trends & Developments
• Agriculture intensifies to meet the increase in
demand for food, but higher input costs and
consumer pressure lead to a major emphasis on
minimizing the use of inputs. Major
improvements in agricultural productivity in
developing countries allows farmers to meet the
global demand for food. Education is critical.
• New technology/services are developed to
optimize input use.
• Use of agricultural materials to produce fibers,
fuels and feedstocks increases after new
processing technology is developed. Non-food
and non-feed products are utilized.
• Rapid adoption of new technology becomes the
norm as information spreads faster, costs decline
quicker and competitive pressures intensify.
• The economic center of gravity shifts eastward
as Asian countries maintain their rapid growth
while western countries struggle to manage
their debt.
• U.S. interest rates climb and retard U.S.
economic growth. U.S. unemployment
averages 6.5-7.5% over the next ten years.
• Energy prices soar due to insufficient
investment in oil production and shortfalls in
capacity to generate electricity (in selected
countries). Oil prices exceed $130/bbl by 2030
and spikes of $175/bbl are conceivable.
• The value of the dollar continues to decline on a
trade-weighted basis assisting U.S. export
performance.
• U.S. labor competitiveness improves as
productivity increases far outstrip wage
increases. Automation and robotics decrease
the importance of labor in many food
processing and manufacturing industries.
166 | Context | Iowa AgriScope 2030
Agriculture Situational Analysis Summary: Assumptions/Forecasts About the Future (to 2030)

Environmental Trends & Developments
Political Trends & Developments
• Weather becomes more variable worldwide
leading to periodic shortages of some
commodities. Food prices continue to be
volatile.
• The growing season becomes longer in Iowa.
New pest pressures begin to appear.
• More variable precipitation, declining water
tables and poor water quality become chronic
issues for countries like China & India.
• Declining soil fertility, water quality and water
availability drive changes towards more
sustainable farming practices (China makes
some of the largest changes).
• Federal support for agriculture declines.
Biofuels incentives are removed except for
fuels produced from non-food and non-feed
commodities.
• New environmental regulations affecting
animal waste, phosphorus, nitrogen and
pesticides are issued.
• Pressure on agriculture from NGO’s
continues.
167 | Context | Iowa AgriScope 2030
Agriculture Situational Analysis Summary: Assumptions/Forecasts About the Future (to 2030)

Long-term Demand for Agricultural Products: Global population grows by 1.4 billion people by 2030 with most of the growth in developing countries. Per capita income surges and the world’s middle class expands by 800 million by 2020.
Global population reaches 8.3 billion in 2030 Sixty-five percent will live in an urban area
Per capita income surges in NIC’s
108%
96%
79%
206%
349%
107%
% Increase
800 million new, middle-class consumers by 2020
Urban Rural
43%
Urban
Source: FAO, How to feed the world in 2050 Source: United Nations
Source: Goldman Sachs
168 | Context | Iowa AgriScope 2030

kg/person/year 2000 2030 Change 2000 2030 Change
Cereals, food 165.7 166 0.3 162.4 159 (3.4)
Cereals, all uses 238.0 268 30.0 591.8 641 49.2
Roots & Tubers 67.0 75 8.0 66.7 61 (5.7)
(Developing minus China) 62.8 76 13.2 n.a. n.a. n.a.
Sugar (raw sugar eg.) 20.7 25 4.3 33.1 32 (1.1)
Pulses, dry 6.7 7 0.3 3.6 4 0.4
Veg. oils, oilseeds & products (oil eq.) 10.4 14 3.6 21.5 24 2.5
Meat (carcass weight) 26.7 38 11.3 90.2 99 8.8
(Developing minus China & Brazil) 15.9 25 9.1 n.a. n.a. n.a.
Milk & dairy, excl. butter (fresh milk eq.) 45.2 67 21.8 214.0 223 9.0
Other food (kcal/person/day) 242.0 285 43.0 525.0 565 40.0
Developing Countries Industrial Countries
Average Kcal/person/day increases:
The largest increases are in developing countries:
• Cereals consumption remains about the same per
person with some switching between rice and
wheat.
• Sugar consumption rises modestly.
• The most significant increases are in vegetable oils
followed by meat.
• The % change in food consumption per person will
be about the same in developing & industrial
countries.
• Average food consumption per person in
developing countries is still only 50% of that in
industrialized countries by 2030.
• Increases in cereal consumption will be in non-food
applications.
Observations:
Long-term Demand for Agricultural Products: Average caloric intake increases 7.6% by 2030 globally. Increased consumption of dairy products, meat and vegetable oils provide most of the added calories.
Source: FAO, World agriculture: towards 2015/2030 Summary Report
Source: FAO, World agriculture: towards 2030/2050 Interim Report
169 | Context | Iowa AgriScope 2030

STEEP Analysis - Social: Health and wellness and eco-consciousness are greatly influencing consumer lifestyles. Marketers now segment consumers in industrial countries by their attitudes toward their own health and that of the planet.
LOHAS NATURALITES
Grown without pesticides 66% Low cholesterol 57%
Environmentally-friendly packaging 59% Grown without pesticides 55%
Recyclable packaging 57% No trans-fats 54%
Natural 56% Natural 50%
No GM ingredients 56% Low fat 49%
New customer segments in industrial countries:
Food factors important to these segments:
Observations:
• The consumers who are most concerned about the
health of the environment, sustainability, social
responsibility and their own heath are termed LOHAS
consumers (Lifestyles of Health and Sustainability).
• A second segment is called NATURALITES. These
consumers value natural and organic products but
aren’t politically committed to the environmental
movement.
• Marketers estimate these two segments account for
41% of U.S. consumers with a disproportionate
amount of purchasing power and the ability to
influence the overall market.
• Grown without pesticides and natural food are
important factors to both segments.
• LOHAS consumers worry about environmental
issues.
• NATURALITES are very concerned about dietary
fat.
Source: The Natural Marketing Institute Survey, 2005
Source: The Natural Marketing Institute Survey, 2005
Segment Description
LOHAS 16%
LOHAS consumers are dedicated to personal and planetary health.
Not only do they make environmentally friendly purchases, they also
take action – they buy green products, support advocacy programs,
and are active stewards of the environment.
NATURALITES 25%
Focused on natural and organic consumer packaged goods. They
are not politically committed to the environmental movement, nor are
they driven to green and eco-friendly durable goods.
DRIFTERS 23%
This segment has good intentions, but when it comes to behavior,
other factors influence their decision more than the environment.
Somewhat price sensitive (and trendy), they are full of reasons why
they do not make environmentally friendly choices.
CONVENTIONALS 23%
This practical segment does not have “green attitudes”, but they do
have some “municipal” environmental behaviors such as recycling
and energy conservation.
UNCONCERNED 14%
The environment and society are not priorities to this segment. They
are not concerned, and show no environmentally-responsible
behavior.
170 | Context | Iowa AgriScope 2030

STEEP Analysis - Social: Consumer attitudes have changed towards agriculture and the entire food value chain. Confidence and trust in the food supply has dropped. Far fewer people have lived on a farm or understand farming.
Confidence in the U.S. food supply:
Food Safety Issue 2010 2008
Disease/contamination 38% 50%
Handling/preparation 33% 29%
Food source 11% 13%
Preservatives/chemicals 10% 6%
Health/nutrition 9% 8%
Agricultural production 9% 7%
Packaging/labeling 5% 3%
Biotech 2% 1%
Processed foods 1% 1%
Other 4% 2%
Most important U.S. food safety concerns:
• Food scares around the world have had a large
impact on consumer attitudes.
• Surveys show this is a common concern in
industrial and industrial-izing countries.
• The largest problems are with fresh foods,
especially animal products.
• Only 18% of the U.S. population is very confident
in the safety of the U.S. food supply.
• Disease/contamination and handling/preparation
were mentioned by a third of consumers as areas
of concern.
• Ten percent were concerned about preservatives/
chemicals and agricultural production.
• Only 2% in this survey mentioned biotech as a
food safety concern.
-10 -10
50 51
18 18
-2-3-20
-10
0
10
20
30
40
50
60
70
80
% o
f R
es
po
nd
en
ts
Very confident
Somewhat confident
Not at all confident
Not very confident
2008 2010
Source: International Food Information Council, Understanding Consumer Perceptions of Food Technology & Sustainability
No Opinion: 19 19
Source: International Food Information Council, Understanding Consumer Perceptions of Food Technology & Sustainability
171 | Context | Iowa AgriScope 2030

STEEP Analysis - Social: Consumer awareness/knowledge of sustainability is growing globally. Food security is most important but efficient resource utilization isn’t far behind.
U.S. Consumer Awareness of the Sustainable Food Production Concept :
Most important aspects of sustainability to U.S. consumers:
0 10 20 30 40 50 60 70 80
Nothing at all
A little
Some
A lot
% of Respondents
2010
2008
0 10 20 30 40 50 60 70 80 90
Fewer food miles
Lower carbon footprint
Recyclable packaging
Less waste
Maximum output with minimal use of
natural resources
Land and water use and efficiency
Ensuring a sufficient food supply for the
growing global population
Selected f irst
Selected second
• The percentage of the U.S. population that has heard at
least something about sustainable food production
increased from 30% to 50% in the past two years.
• Long-established attitudes towards conservation are
apparent in the aspects of sustainability that are
most important to U.S. consumers.
• Largest concerns are about land, water and natural
resources in general. Concern about climate change
not significant in this survey.
Source: International Food Information Council, Understanding Consumer Perceptions of Food Technology & Sustainability
Source: International Food Information Council, Understanding Consumer Perceptions of Food Technology & Sustainability
172 | Context | Iowa AgriScope 2030

STEEP Analysis - Social: Consumers’ attitudes towards agricultural biotechnology are split. Forty percent or more either don’t know enough about it to offer an opinion or are neutral towards it.
Impressions of Plant Biotechnology: Impressions of Animal Biotechnology:
• U.S. consumers with an unfavorable impression of plant
biotechnology outnumber those with a favorable
impression by a ratio of 3:2.
• In the EU the ratio of unfavorable to favorable would be
2:1.
• Impressions change when environmental (lower water
use) or health benefits (lowered saturated fat) are
mentioned.
• Consumer impressions of animal biotechnology are
more balanced than those towards plant
biotechnology.
• A high percentage can still be influenced one way or
another.
Very
Favorable
10%
Not very
favorable
13%
Favorable
19%
Neutral
24%
Don't know
enough to
form an
opinion
20%
Not at all
favorable
14%
Don't know
enough to
form an
opinion
20%Not favorable
32%
Favorable
19%
Neutral
29%
Source: International Food Information Council, Understanding Consumer Perceptions of Food Technology & Sustainability
173 | Context | Iowa AgriScope 2030

STEEP Analysis - Social: Consumers in Argentina, China, Germany, the U.S. and the U.K. expect to have a greater say about food ingredients by 2020 in one survey done by a New York-based marketing communications firm.
• Today’s consumers want to have a greater say about food ingredients, safety and quality, and by the year 2020, consumers
around the globe expect the way they choose and shop for food to be different.
• Taste, quality and price are the top considerations in choosing foods – except in China, where health benefits are most
important.
• 65% of consumers want good taste, but they also want to know more about the ingredients in their food.
• 45% of consumers want food companies to take away the temptations that lead to obesity . . . but they don’t want to eat less.
• 44% of consumers say that knowledge, taste and availability are key barriers to healthier eating.
• 43% of consumers expect how they choose and shop for food to be different by 2020 . . . but they still expect food companies
to be responsible for their health and well-being.
• 40% of consumers want food companies to help solve societal issues related to food and nutrition, and they are willing to pay
for it – within reason.
• Only one-third of consumers cited “brand name” as among the factors they consider when buying food – except in Argentina
and China.
• Consumers want local food, but they’re not willing to pay for it – in terms of either cost or taste.
Future Consumer Needs & Attitudes:
Source: Ketchum (a public relations and marketing communications firm), Food 2020 Survey
174 | Context | Iowa AgriScope 2030

STEEP Analysis - Technological: Many are counting on new technology to increase agricultural production while conserving resources, improving the environment and improving human health and nutrition.
New Market Opportunities
• New technology may open new market opportunities for Iowa Agriculture to supply raw materials
and products for biobased chemicals, fibers and fuels. Success in these fields will be highly
dependent on the relative cost of biobased feedstocks versus petroleum based feedstocks and the
capital cost to build world scale facilities. Sugar is the feedstock of choice at present but many are
exploring other non-food and non-feed raw materials
Intensification vs.
Extensification
• Concerns about loss of wilderness and the role that forests, wetlands and other natural areas play
in the earth’s ecosystem have led to most countries choosing to intensify agriculture to meet future
demand. But consumers are increasingly concerned about the effects of agriculture on the land,
water and air. New technology is seen as being vital to increase production, sustainably.
Areas of Application
• The largest opportunity for new technology is to improve the utilization of scarce resources.
Historically the focus has been on land and labor but it is switching to water, fertilizer, feed and
energy.
Food Safety
• Food safety is a major market opportunity for new products. Management systems that ensure
food safety are becoming mandatory, opening up the opportunity for new software. Other food
safety related technology includes sensor technology, preservation technology and packaging
technology.
175 | Context | Iowa AgriScope 2030

STEEP Analysis - Technological: Enabling technology like bioinformatics and service offerings such as various crop consulting services will speed the rate of technology development and the availability of information.
• Advances in animal biotechnology are mostly directed at improving feed conversion. The
success and acceptance of animal biotechnology varies by species and this could influence the
consumption of one type of protein in place of another. A key test case is the tentatively approved
GM salmon that continues to grow year-round.
Animal Biotechnology
Waste Utilization
• New waste conversion technology will allow crop and animal wastes to be converted to fuels
and fertilizers. One technology with a lot of potential is pyrolysis, which would allow the use of
cellulosic feedstocks, such as crop residues, to produce a liquid fuel and a soil amendment. It
hasn’t reached commercial scale yet.
• Water utilization is a key challenge for agriculture. Major opportunities are to optimize the use of
water in irrigation and to reuse gray water. Technologies that could be important include new
sensor technology and emitter designs to further improve drip irrigation and various technologies
such as high intensity light, new microbial and chemical treatments to eliminate pathogens and
heavy metals from gray water.
Water Utilization
• Advances in bioinformatics, genomics and marker assisted breeding are allowing faster
improvements in both conventional breeding and transgenic breeding. New mutagenesis
techniques that allow for more precise modification of a plant’s traits are beginning to appear and
may offer an alternative to transgenic plants. Many of the same techniques used to improve
plant varieties are/will be applied to improving the genetics of various animal species. Large
opportunities will continue for these types of enabling technologies.
Biotechnology
176 | Context | Iowa AgriScope 2030

STEEP Analysis - Technological: Agriculture will be influenced by technology developed specifically for agriculture and technologies developed for unrelated fields. Sensor technology and RFID tags could be extremely important.
• Important over-arching or cross-cutting technologies are information technology, sensor
technology, nanotechnology, robotics and radio frequency identification. All could find application
at multiple points along the food value chain.
Over-Arching Technologies
Information & Industrial
Technologies
• Advances in information technology, process control technology, automation and robotics will find
broad application in the production, processing and manufacturing of food. The food processing
and manufacturing industries will adopt these technologies to improve efficiency and reduce
labor.
Precision Farming
• Optimizing the application of inputs will become increasingly important as resources become
scarce and prices increase. New sensor technology, better data mapping and decision support
software could allow on-the-fly adjustment of the amount of fertilizer, pesticides and water that are
applied to a field. The challenge is making the technology broadly available and inexpensive.
Services/technology such as these could become as common as cell phone service in the future.
177 | Context | Iowa AgriScope 2030

STEEP Analysis - Technological: Forecasting what the most important new technologies will be is a roll of the dice, but we feel confident they will be both beneficial and disruptive, if the last 20 years is any indication.
A few cautionary notes…
• New technology development is a double edged sword. It can help Iowa Agriculture to maintain a
completive advantage or allow a competitor (Brazil) to rapidly reach parity or advance beyond Iowa
Agriculture.
• New technologies could eventually allow greater (developing country) self-sufficiency, decreasing size
of some export markets.
• All technology becomes less expensive over time, providing access to countries/organizations that
couldn’t previously afford it.
• Information/knowledge is spreading faster than ever, compressing technology and product lifecycles.
• Any new facility that is built in the BRIC countries will incorporate the latest technology putting older
plants at a competitive disadvantage. This has happened to numerous American industries (especially
steel).
• The adoption of various technologies could easily induce switching between various commodities.
178 | Context | Iowa AgriScope 2030

STEEP Analysis - Economic: USDA Long-term Projections (issued Feb. 2011)
Annual GDP Growth (2011-2020):
0
1
2
3
4
5
6
7
8
9
World
China
India
Bra
zil
Rus
sia
Indo
nesia
Mex
ico
EU
U.S
.
An
nu
al G
DP
Gro
wth
(%
)
0
2
4
6
8
10
12
14
16
18
20
China
India
Bra
zil
Rus
sia
Indo
nesia
Mex
ico
EU
U.S
.
GD
P (
Billio
n $
's)
2009
2020
GDP by Country (2011 vs. 2020):
Note: Base year is in 2005 $’s
Macroeconomic Risks:
• Prolonged weakness in developed countries’ labor markets.
• Financial market risk (Eurozone internal debt & consumers’ retrenchment).
• U.S. business confidence remains low.
• Weakening of the dollar.
• Accelerating inflation in China.
Source: USDA, Long term Projections, February, 2011 Source: USDA, Long term Projections, February, 2011
179 | Context | Iowa AgriScope 2030

Other Long-term Economic Projections (2011-2020):
Population Growth:
(slows markedly)
• Global growth averages 1.0% per year
• China’s growth averages 0.4% per year
• India’s growth averages 1.2% per year
• Brazil’s growth averages 1.0% per year
Oil Prices: • Reaches $111/bbl. in 2020
U.S. Inflation Rate (CPI): • Averages 2.5% per year
U.S. 3-month T-Bill: • Averages 4.8% over the period
Value of U.S. $: • Trade-weighted value declines ~6% by 2020
U.S. Unemployment Rate: • Declines to 6.2% by 2017 and remains there
Real Personal Income Growth: • Averages 2.8% over the period
STEEP Analysis - Economic: USDA Long-term Projections (issued Feb. 2011)
Source: USDA, Long term Projections, February, 2011
180 | Context | Iowa AgriScope 2030

• Frost free days will increase by 10-15 days, lengthening the
growing season by a similar amount.
Average Temperatures
• Temperatures are projected to increase 1.5-2oC from
1990 to 2030. The average U.S. temperature has
already increased 0.5-1oC.
Heat Waves • The grain belt will experience 14-21 more days of high heat.
• Precipitation is expected to increase by 1-5%.Precipitation
Warm Nights • The number of warm nights are projected to increase 20-30%.
Frost Free Days
Note: Projections based on IPCC Scenario A1B which calls for very rapid economic growth that peaks in mid-century and declines thereafter. All of the projections are relative to 1980-1990 averages.
STEEP Analysis - Environmental: Weather in the grain belt is forecasted to become warmer and wetter. The growing season is forecasted to be longer.
Source: Intergovernmental Panel on Climate Change, Climate Change 2007
181 | Context | Iowa AgriScope 2030

Note: 1990 hardiness map by USDA. 2006 hardiness map by the Arbor Day Foundation.
1990
2006
STEEP Analysis - Environmental: The most recognizable sign of climate change may be the change in plant hardiness zones from 1990 to 2006.
182 | Context | Iowa AgriScope 2030

Environmental Changes:
Follow-on Effects:
Changes in Growing Conditions
Temperature:
• Ground & Air
• Day/night
• Extremes
Precipitation:
• Annual Amount
• Frequency
• Extremes
Growing Season:
Length
Pests/Weeds:
Northern migration & over-wintering of new pests (insects and diseases)
Atmospheric CO2:
Higher levels generally conducive to plant growth
Arable Land:
Loss of prime land due to more frequent flooding
Regional Differences:
National/Regional:
Shifts in growing conditions by latitude and longitude
Continental:
Growing market opportunity in Canada
Global:
Uneven effects. U.S. will be affected more than Latin American countries
STEEP Analysis - Environmental: Environmental changes will have a cascading effect on many other parameters.
183 | Context | Iowa AgriScope 2030

STEEP Analysis – Political/Regulatory: Expect increasing regulation on food safety and environmental issues. Farm bill payments likely to decline. New industry standards likely over time as food retailers & manufacturers grow stronger.
Area Trends & Possible Developments
Farm Bill • Decreasing support over time.
Industry Standards • Food retailer and processor requirements likely to grow (e.g. GFSI,
GlobalG.A.P. and GSCP).
Pressure from NGO’s • Some will be cooperative but others will be confrontational. Animal
agriculture will face the most pressure. Agriculture is vulnerable from
a public relations point of view.
International Agreements • GATT will be updated at some point. Until then expect more bilateral
agreements.
• Brazil likely to file an unfair trading practice complaint against the U.S.
• A climate change treaty of some sort is likely in the next ten years.
Will drive up the cost of energy.
EU Trade Restrictions • Restrictions on GMO crops for animal feed will be relaxed over time
by some EU countries.
Immigration • Legislation providing a path to citizenship for illegal immigrants will be
enacted in the next ten years as the U.S. Hispanic population grows.
Environmental
Regulations
• New federal regulations are almost inevitable. Potential areas include
animal welfare, further restrictions on the selection of pesticides,
phosphorus and nitrogen.
Renewable Fuels • Incentives will be phased out but not the RFS.
184 | Context | Iowa AgriScope 2030

Chapter 5: Value Chains and Competitiveness
Assessments
185 | Context | Iowa AgriScope 2030

Methodology: Value Chains & Competitiveness Assessments
• All of the information captured in the value chains/competitiveness assessments was gathered
through secondary research.
• The corresponding Associations reviewed their value chain/competitiveness assessment prior to
the report being finalized.
• The value chains/competitiveness assessments only provided support for the development of the
strategies and recommendations and their prioritization.
186 | Context | Iowa AgriScope 2030

187 | Context | Iowa AgriScope 2030
Corn
Value Chain & Competitive Assessment
Economic Importance
Value Chain Summary
OpportunityOutlook
IndustryStatistics

Corn Industry Statistics – World Corn Consumption
• Total corn consumed in the world was 810,165 thousand
metric tons (2009-2010)
• The United States and China consumed over half of the
annual world corn supply.
– The United States is the #1 consumer of corn in the
world. They consumed 35% of the world corn supply
at 281,590 thousand metric tons per year. (2009-2010)
– China is a distant #2, consuming 20% of the corn at
159,000 thousand metric tons per year (2010-2011)
– The rest of the top 10 corn consuming
countries/regions are: the European Union, Brazil,
Mexico, Japan, India, Egypt, Canada, and South
Africa.
1
World Corn Consumption by Country, 2009/10 Crop Year
35%
20%7%
6%
4%
2%2%1%1%1%
21%United States
China
EU-27
Brazil
Mexico
Japan
India
Egypt
Canada
South Africa
Rest of the World
Source: USDA, PSD database, for 2009/10 crop year, accessed 10/7/11
188 | Context | Iowa AgriScope 2030

Corn Industry Statistics – US Corn Consumption/Utilization
• Although used primarily to feed livestock, corn is a versatile
grain with a wealth of uses.
• The US is the world’s top corn producer and exporter of
corn.
• Approximately 90% of all fuel contains a 10% ethanol
blend.
• Corn is also processed into a multitude of food and
industrial products, including starches, sweeteners, corn
oil, and beverage and industrial alcohol.
189 | Context | Iowa AgriScope 2030
US Corn Utilization, Marketing Year Ending Aug 2010
1
40%
35%
10%
15%
Feed and Residual
Ethanol
Food, Seed, andIndustrial
Exports
Sources: WASDE, Sept. 2011, for 2009/10 crop year;
US Grains Council; The Endless Uses for Corn, Corn Marketing Program of Michigan,
Winter 2008

Corn Industry Statistics – US Corn Consumption/Utilization
2011-2012 US Corn Crop12,433 mbu
1,400 mbuprocessed into
4,939 mbufor ethanol ***
1,650 mbuto exports
4,505 mbuto feed livestock
Starch
Corn oil
Sweeteners
Beverage alcohol
Corn meal
Grits
Corn flour
36%
40%
13%
12%
2011-2012 US Corn Crop Projected Utilization
% Percent of Total Corn Crop
1
*** Corn displaced by DDG use for 2011-2012 is 1168 mbu
Source: ProExporter, October 12, 2011
320 mbuResidual
3%
190 | Context | Iowa AgriScope 2030

Corn Industry Statistics – Iowa Corn Consumption/Utilization
2011-2012 IA Corn Crop2,497 mbu *
387 mbuprocessed into
1,281 mbufor ethanol ***
407 mbuto exports
325 mbuto feed livestock
Starch
Corn oil
Sweeteners
Beverage alcohol
Corn meal
Grits
Corn flour
13%
45%
16%
22%
1
2011-2012 Iowa Corn Crop Projected Utilization
Source: ProExporter, August 2011
95 mbuResidual
4%
% Percent of Total Corn Crop
* 2011-2012 Iowa Crop Production is projected at 2,290 mbu*** Corn displaced by DDG use for 2011-2012 is 139 mbu
191 | Context | Iowa AgriScope 2030

Corn Industry Statistics – Demand Considerations
• As economies expand and personal incomes grow,
consumers shift to more meat in their diets and this requires
more feed grains for meat production.
– Diets in the U.S. already have adequate quantities of
meat, but an expanding economy will keep meat
consumption brisk.
– Internationally, expanding economies are likely to
change diets, especially in developing countries.
• As a result, the long-term projections are expected to
expand world trade in feed grains and increase exports from
the United States.
Estimated Global Meat Production
1
Sources: USDA Feed Grain Baseline, 2009-18;
USDA Ag Projections to 2018, February 2009; USDA, Economic Research Service
192 | Context | Iowa AgriScope 2030

Corn Industry Statistics – Demand Considerations
• Projections for the livestock sector include production
adjustments to high grain and soybean meal prices in 2011.
Production of meats declines next year, as a result. Once
the sector adjusts, lower overall production combined with
strong domestic demand and some strengthening in meat
exports result in higher prices and higher returns, providing
economic incentives for expansion in the livestock sector
and resumption in meat production gains.
• Distillers' grains, a co-product of dry-mill ethanol production,
can be used in livestock rations, partially substituting for
corn and soybean meal. However, the primary users of
distillers' grains are ruminants (such as cattle) because they
are better able to accept the higher fiber levels compared to
mono-gastric animals (such as hogs and chickens). Beef
cattle feedlots and dairies located close to ethanol plants
are best situated to benefit from a steady supply of distillers'
grains, also reflecting the ability of those animals to use the
wet form of distillers' grains.
– Research is being conducted by Monsanto that is evaluating
feeding DDGs and corn stalks as feed for cattle.
• Higher grain prices and drought in recent years hold down
cattle inventories, pushing U.S. beef production down in
2009-12. Production then rises in the remainder of the
projection period as returns improve and herds are rebuilt.
Domestic Livestock & Poultry Production
1
0
20000
40000
60000
80000
100000
120000
20092010
20112012
20132014
20152016
20172018
20192020
Mil
. p
ou
nd
s
7300
7400
7500
7600
7700
7800
7900
8000
8100
Mil
. d
oze
n
Beef Pork Broiler Turkey Egg
• The total cattle inventory drops to under 93 million head
before expanding to about 97 million at the end of the
decade. Rising slaughter weights also contribute to the
moderate expansion of beef production beyond 2012.
• The relative cost of feeding cattle in feedlots versus on
pasture will result in stocker cattle remaining on pasture to
heavier weights before entering feedlots. As increased
numbers of cattle go on feed in feedlots, more feed grains
will be needed.
Sources: USDA Ag. Baseline Projections 2011;
Shane Ellis, ISU; Iowa Corn Growers Association
193 | Context | Iowa AgriScope 2030

Corn Industry Statistics – Demand Considerations 1
• Pork production in 2012 is expected to be up minimally
(.6%) from 2011 in response to high feed prices. Moderate
growth is expected throughout the remainder of the
projections period as higher hog prices improve returns. The
greatest gains are forecast for 2014 and 2015 at 1.8% per
year. The eventual increase in hog numbers will necessitate
more feed grains, primarily corn.
• Broiler production had a setback with the feed price
increases in 2008 and 2011, but longer term projections are
for significant production increases over the next decade.
Poultry is the most efficient feed converter, and thus, will
have the greatest increase in production across the
livestock sector. As broiler production expands, feed needs
of the broiler industry are expected to grow over the period.
• Feed needs for turkey production have decreased during
the last 2 years, but projections going forward show
moderate increases after 2011. Growth in demand for turkey
products is supported by rising per capita consumption of all
meat products over the longer term.
• After slowing in 2008 and 2012, egg production is projected
to grow slightly each year with increases beginning in 2014
and later maintained at a 1%-per-year rate.
0
20000
40000
60000
80000
100000
120000
20092010
20112012
20132014
20152016
20172018
20192020
Mil
. p
ou
nd
s
7300
7400
7500
7600
7700
7800
7900
8000
8100
Mil
. d
oze
n
Beef Pork Broiler Turkey Egg
• Milk production is projected to increase slowly throughout
the projection period. Dairy cow numbers are expected to
continue their long-term decline during the next 10 years,
but annual herd reductions are more moderate compared
with past decades. Production gains are the result of
increased production per cow, although some slowing in
these gains occurs in 2008-10 in response to higher feed
cost. Over the long run, feed needs are likely to increase.
Domestic Livestock & Poultry Production
Sources: USDA Ag. Baseline Projections 2011;
Shane Ellis, ISU; Iowa Corn Growers Association
194 | Context | Iowa AgriScope 2030

Corn Industry Statistics – Demand Considerations
• Corn used for producing fuel alcohol (i.e., ethanol) has grown
sharply since the early 1980s. Production of corn-based ethanol
has grown from less than 3 billion gallons in 2003 to over 13
billion gallons in 2010. As a result, fuel alcohol has become the
largest component of the food, seed, and industrial (FSI) use
category. Fuel alcohol production has overtaken exports in recent
years as the second- largest use category for corn.
• Corn's use in fuel-alcohol production depends on the interaction of
government incentives and policies, technology development,
corn prices, prices of co-products from ethanol production, and
prices of energy substitutes. Approximately ninety percent of all
fuel contains a 10% ethanol blend. Ethanol is also used in
reformulated gasoline blends required in designated regions under
the Clean Air Act. Ethanol serves as an oxygenate replacing
methyl tertiary-butyl ether in these reformulated blends. Prices of
ethanol relative to gasoline remain a key factor in determining how
much ethanol is blended.
• Policy incentives underlie the interest in, and greatly impact the
expansion of, ethanol production. The Energy Policy Act of 2005
established a renewable fuel standard which mandated the use of
renewable fuels in gasoline. The U.S. Government blender tax
credit, various state production subsidies, and some states'
required use of fuel alcohol, as well as the cost and availability of
substitute fuel additives, affect the amount of ethanol used.
• The Energy Independence and Security Act of 2007 (P.L. 110-140)
required the use of 9.0 billion gallons of renewable fuels in 2008,
increasing each year to 36 billion gallons in 2022. In addition, the
Act requires that an increasing share of the mandate be met with
advanced bio-fuels, which are bio-fuels produced from feed stocks
other than cornstarch (and with 50% lower lifecycle greenhouse gas
emissions than petroleum fuels). Potential advanced bio-fuels
include ethanol from cellulosic material (such as perennial grasses
and municipal solid waste), ethanol from sugarcane, and diesel fuel
substitutes produced from a variety of feed stocks.
• The continued presence of ethanol demand in the corn sector, in
combination with other long-term factors, holds prices for corn and
many other crops well above their historical levels.
1
Sources: USDA Feed Grain Baseline, 2010-19
Million Gallons of Corn Based Ethanol Production and Million
Bushels of Corn Used In Ethanol Production
195 | Context | Iowa AgriScope 2030

Corn Industry Statistics - US Feed Grain Supply & Use
• Feed grain production increases throughout the projection
period, as yield growth accounts for most of the expanded
output.
– Corn is expected to gain in share of total feed grain production
and use.
– Corn area is projected to remain above 90 million acres over the
rest of the decade.
– US DDGs production is the 4th largest feed crop available.
Approximately one third of all corn that goes into an ethanol plant
comes back out as a valuable livestock feed.
• After the first year of the projections, total feed grain use is
projected to set new records.
– By 2020/21, exports are expected to grow about 19% from 55
million metric tons in 2009/10, supporting growth in global meat
production.
– Improved growth in global imports is expected, and U.S. feed
grain exports are expected to encounter only moderately higher
competition throughout the period.
• U.S. ending stocks of feed grains are projected to remain
tight and slowly decrease for the rest of the projection
period (versus historical levels of 40-50 mmt)
– Productivity is projected to account for most of production growth
throughout the decade.
1
0
50
100
150
200
250
300
350
400
450
500
2009/10
2010/11
2011/12
2012/13
2013/14
2014/15
2015/16
2016/17
2017/18
2018/19
2019/20
2020/21
Mil.
metr
ic tons
Beginning stocks Production Imports
0
50
100
150
200
250
300
350
400
450
500
2009/10
2010/11
2011/12
2012/13
2013/14
2014/15
2015/16
2016/17
2017/18
2018/19
2019/20
2020/21
Mil.
metr
ic tons
Feed & residual Food, seed, & industrial Exports Ending stocks
US Feed Grain Supply
US Feed Grain Utilization
Source: USDA Ag. Baseline Projections 2011; Iowa Corn Growers Association, October 2011; FAPRI-ISU
2011 World Agricultural Outlook196 | Context | Iowa AgriScope 2030

Corn Industry Statistics – Corn Supply & Use to Grow
• Corn yields are expected to increase, resulting in record
corn production in 2012/13 and beyond. Use is projected to
set records throughout the projection period driven by
expanding livestock herds (raising feed needs) and
industrial corn use.
• In 2011, corn acreage increased above 90 million acres and
is expected to remain at or above that level over the
remainder of the projection period.
– A gradual shift to corn away from other crops reflects the
high levels of domestic corn-based ethanol production and
gains in feed use and exports that keep corn demand and
producer returns strong.
– In the projections, corn area grows relative to soybean area,
as relative net returns are expected to favor corn throughout
most of the decade.
– Gains in corn yields are expected to continue over the entire
projections period, facilitated by genetic improvements.
US Corn Area & Yield
1
0
10
20
30
40
50
60
70
80
90
100
19801983
19861989
19921995
19982001
20042007
20102013
20162019
Mill
ion a
cres
0
20
40
60
80
100
120
140
160
180
200
Bu/a
cre
Planted Harvested Yield
0
2
4
6
8
10
12
14
16
18
1980/81
1983/84
1986/87
1989/90
1992/93
1995/96
1998/99
2001/02
2004/05
2007/08
2010/11
2013/14
2016/17
2019/20
Bill
ion b
ush
els
Beginning stocks Production Imports
US Corn Supply
Sources: USDA-NASS; USDA-ERS, Feed Outlook197 | Context | Iowa AgriScope 2030

Corn Industry Statistics – US Corn Utilization
• Feed and residual use of corn bottoms out in the initial
years of the projections due to reduced meat production and
increased feeding of distillers' grains. Increases in feed use
rise somewhat faster later in the period as meat production
picks up and growth in availability of distillers' grains slows
with the reduced pace of corn-based ethanol expansion.
• Despite its growth, direct feed use of corn is not as strong
as it would be without co-products from ethanol production.
Ethanol wet mills produce corn gluten feed, corn gluten
meal, and corn oil as co-products, while dry mills produce
distillers’ dried grains (DDG). The projections assume that
each 56-pound bushel of corn that goes into dry-mill ethanol
production results in 17 pounds of DDG as a co-product.
• Food, seed, and industrial use of corn is anticipated to
remain fairly flat.
– Corn-to-ethanol use is expected to remain fairly flat based
on the 15 bg gap on corn-based ethanol.
– Consumer dietary concerns and other changes in tastes
and preferences limit increases in the combined use of
corn for high fructose corn syrup, glucose, and dextrose to
half the rate of population gain.
– Growth in starch production is expected to be limited in the
first part of the projection period by weaker demand for
paper and building materials due to poor economic
conditions.
US Corn Utilization
• U.S. corn exports rise in response to stronger global
demand for feed grains to support growth in meat
production, but the U.S. share of global corn trade falls
slightly in the projections.
1
0
2
4
6
8
10
12
14
16
18
1980/81
1983/84
1986/87
1989/90
1992/93
1995/96
1998/99
2001/02
2004/05
2007/08
2010/11
2013/14
2016/17
2019/20
Bill
ion b
ush
els
Food, seed, and industrial Feed and residual Exports Ending stocks
Source: USDA-ERS, Feed Outlook; Iowa Corn Growers Association198 | Context | Iowa AgriScope 2030

Corn Industry Statistics – US Corn Utilization
• Ending stocks of corn are expected to remain lower over the
course of the projection period. However, corn prices fall
from the high level of 2010/11 as increases in ethanol
production slow and corn stocks build somewhat. In the
longer run, corn prices remain higher than their pre-2006
levels due to continued demand for corn to produce ethanol
as well as growth in feed use and exports.
US Corn Price and Stock-to-Use Ratio
1
0%
10%
20%
30%
40%
50%
60%
70%
1980/81
1983/84
1986/87
1989/90
1992/93
1995/96
1998/99
2001/02
2004/05
2007/08
2010/11
2013/14
2016/17
2019/20
0
1
2
3
4
5
6
7
$ p
er
bush
el
Stocks-to-use Price
Source: USDA-ERS, Feed Outlook
199 | Context | Iowa AgriScope 2030

Corn Industry Statistics – World & US Corn Trade
• Increased global demand for meat is expected to boost world
consumption of feed grains. However, production constraints,
especially limited area, will keep many traditional importing
countries from expanding production as rapidly as use,
boosting global trade from 89 million metric tons in 2010/11
to 113 million in 2020/21. The U.S. share of corn trade is
expected to hold steady at 52% by the end of the projection
period.
• China is important for the future of global corn trade. As
recently as 2002/03, China was the second-largest corn
exporter. However, the country is expected to limit exports
and gradually increase imports of corn, becoming a small net
importer by the end of the projection period. Meat demand in
China is expected to rise because of strong income growth.
Rapid gains in meat production are expected to increase
corn feed use. While corn yield growth is projected to rise
less than 1% per year, area increases will be limited by
higher returns from other land uses. Nonetheless, northeast
China is expected to remain a surplus corn producing region
and, because it is so close to South Korea—one of the
world's largest corn importers—China is expected to
continue exporting corn. However, southern China is
expected to be an increasingly corn-deficient region,
boosting imports during the next decade.
World and US Corn Trade
1
0
20
40
60
80
100
120
1980/1981
1983/1984
1986/1987
1989/1990
1992/1993
1995/1996
1998/1999
2001/2002
2004/2005
2007/2008
2010/2011
2013/2014
2016/2017
2019/2020
Mil.
metr
ic tons
0%
10%
20%
30%
40%
50%
60%
70%
80%
90%
World United States Share
Sources: USDA, PSD database, accessed 10/7/11;
USDA-ERS Market Outlook
200 | Context | Iowa AgriScope 2030

Corn Industry Statistics – World & US Corn Trade
• Growth in global corn imports over the projections period is
not limited to China. Most corn-importing countries are
expected to increase imports as meat production rises and
as corn production growth is limited by several factors.
Mexico's corn imports are projected to rise from about 9
million metric tons to 14 million metric tons in 2020/21. With
the liberalization of U.S.-Mexico corn trade complete—as
part of the North American Free Trade Agreement (NAFTA),
future growth in Mexican corn imports will be influenced by
factors other than NAFTA, such as rising feed demand from
Mexico's poultry sector.
• Corn area expansion in Argentina is expected to be limited
by profitable returns for soybeans and higher export taxes
on grains.
• The European Union (EU) becomes a more competitive
corn exporter due to increases in area and yields, which
enable it to more than double shipments during the
projections.
• Exports from non-EU countries are also projected to climb
steadily.
• Brazil is expected to remain a significant net exporter of
corn because of attractive world prices and niche market
demand in the EU for grain that is not genetically modified.
In the last several years, Brazil has targeted the EU market
for non-genetically modified grain. This ability is assumed
to diminish as Brazil legalizes planting of genetically
modified corn varieties and the EU reduces imports. Also,
strong growth in domestic demand from its livestock and
poultry sectors and the profitability of growing soybeans
limits corn exports.
1
0
20
40
60
80
100
120
1980/1981
1983/1984
1986/1987
1989/1990
1992/1993
1995/1996
1998/1999
2001/2002
2004/2005
2007/2008
2010/2011
2013/2014
2016/2017
2019/2020
Mil.
metr
ic tons
0%
10%
20%
30%
40%
50%
60%
70%
80%
90%
World United States Share
World and US Corn Trade
Sources: USDA, PSD database, accessed 10/7/11;
USDA-ERS Market Outlook
201 | Context | Iowa AgriScope 2030

Corn Industry Statistics – World & US Corn Trade
• Steady long run growth in the livestock sectors of
developing countries in Latin America, Asia, North Africa,
and the Middle East is projected to account for much of the
growth in world coarse-grain imports during the next
decade. Canada is expected to increase corn imports to
support a rise in domestic meat production.
• Russia and other former Soviet Union countries increase
corn imports faster than Ukraine increases exports, making
the region a growing net importer of corn.
• However, some markets, like Japan, South Korea, and
Taiwan, are expected to have no growth in corn imports due
to slow growth in meat consumption combined with higher
meat imports.
1
0
20
40
60
80
100
120
1980/1981
1983/1984
1986/1987
1989/1990
1992/1993
1995/1996
1998/1999
2001/2002
2004/2005
2007/2008
2010/2011
2013/2014
2016/2017
2019/2020
Mil.
metr
ic tons
0%
10%
20%
30%
40%
50%
60%
70%
80%
90%
World United States Share
World and US Corn Trade
Sources: USDA, PSD database, accessed 10/7/11;
USDA-ERS Market Outlook
202 | Context | Iowa AgriScope 2030

Corn Industry Statistics – World Corn Production
• Corn is the largest US crop, in terms of both volume and
value. The states of Iowa, Illinois, Nebraska and Minnesota
account for more than 50% of U.S. corn production. Other
major corn-producing states include Indiana, Wisconsin,
South Dakota, Michigan, Missouri, Kansas, Ohio and
Kentucky.
• The United States grew 41% of the world's corn in 2009/10
crop year, producing 332 million metric tons (12.1 billion
bushels).
• Other major corn producing countries in 2009/2010
included:
– China -158 million metric tons (6.2 billion bushels)
– European Union - 57 million metric tons (2.25 billion
bushels)
– Brazil- 56.1 million metric tons (2.2 billion bushels)
– Argentina – 23.3 million metric tons (886 million
bushels)
– Mexico - 20.4 million metric tons (799 million bushels)
– India - 16.7 million metric tons (657 million bushels)
World Corn Production, 2009/10
1
41%
19%
7%
7%
3%
3%
2%2%1%1%
14%
United States
China
EU-27
Brazil
Argentina
Mexico
India
South Africa
Ukraine
Canada
Rest of the World
Sources: USDA, PSD database, for 2009/10 crop year, accessed 10/7/11;
US Grains Council
203 | Context | Iowa AgriScope 2030

53%
17%
12%
5%
2%2%
2%1%1%1% 4%
United States
Argentina
Brazil
Ukraine
South Africa
India
EU-27
Paraguay
Serbia
Thailand
Rest of the World
29%
17%
14%
6%
6%
4%
3%
2%2%
2%
15%
Japan
Mexico
Korea, South
Taiwan
Egypt
Canada
China
Venezuela
Syria
Dominican Republic
Rest of the World
Corn Industry Statistics – World Corn Exports
• The United States is not only the world's top corn producer,
but also the top exporter.
• On average, about 20% of U.S. corn is exported.
• During the 2009/10 crop year (September 2009 to August
2010), the U.S. exported 50.3 million metric tons (1.98
billion bushels) - accounting for 53% of world corn exports.
• During the same period, other major corn exporters included
– Argentina (16.5 million metric tons, or 646 million
bushels)
– Brazil (11.6 million metric tons, or 454 million bushels)
• Japan is the largest and most consistent importer of corn in
the world.
• The United States satisfies nearly all of Japan's demand.
During the 2009/10 crop year, Japan imported 14.6 million
metric tons (573 billion bushels) of U.S. corn.
• Mexico, Korea, Taiwan, Egypt, Canada and (recently) China
are also major corn importers and important markets for the
United States.
World Exporters of Corn, 2009-10
World Exporters: Top US Corn Customers, 2009-10
1
Sources: USDA, PSD database, for 2009/10 crop year, accessed 10/7/11;
US Grains Council
204 | Context | Iowa AgriScope 2030

Corn Industry Statistics – US Supply Considerations
• Among the feed grains, corn has the highest return above
variable cost. Soybeans, while being an excellent rotation
crop with corn, are also the major competitor with corn for
acreage. Realized net returns for soybeans were above
those for corn in marketing years 1996/97 through 2001/02
and also in 2006/07. Soybean planted area expanded
during these years. Net returns for soybeans are expected
to be below those for corn throughout the projection period,
due to lower relative prices caused by increased corn
demand by the ethanol industry.
• There are benefits to growing crops that may not be
reflected in a single year's cost and returns analysis. Thus,
expected net returns do not explain all planting decisions.
Maintaining rotations is an important objective for most
farmers. This provides numerous agronomic benefits and
may outweigh decisions based only on price signals.
Net returns for various crops
• Soybeans and corn work well in rotation because many of the
insects that attack one crop do not bother the other crop. Many
corn farmers alternate annually between corn and soybeans.
Corn benefits from increased fertilizer use and carryover
fertilizer benefits soybeans in the following year. Likewise,
soybeans roots host bacteria that convert nitrogen from the air
into a form usable by plants. Carryover nitrogen from this
process benefits the following corn crop. Before genetically
modified, herbicide-tolerant soybeans became available, corn in
the rotation was preferable for greater weed control. Corn
remains an important rotation crop as soybeans planted
following soybeans typically suffer disease-related yield losses.
1
0
100
200
300
400
500
600
700
800
99/00
01/02
03/04
05/06
07/08
09/10
11/12
13/14
15/16
17/18
19/20
$ p
er
acr
e
Wheat Corn Sorghum Barley Oats Soybean
Source: FAPRI 2010 and 2011 Outlooks; USDA-
ERS Outlook
205 | Context | Iowa AgriScope 2030

Corn Industry Statistics – Iowa Cooperatives(Note: These cooperatives handle other crops beyond corn)
Consolidation with the grain and farm supply cooperatives has been vast over the past 20+ years (1990 = 256; 2011 = 58). However the impact on the local communities of Iowa has not dwindled.
1
206 | Context | Iowa AgriScope 2030

Corn Industry Statistics – Iowa Rail Lines
Iowa Railroad Service Map - 2010
1
207 | Context | Iowa AgriScope 2030

Corn Industry Statistics – Iowa Rail Lines
Iowa Grain Loading & Processing Facilities - 2010
In most cases, the larger the rail loading facility, the more competitive they become.
1
208 | Context | Iowa AgriScope 2030

Corn Industry Statistics – Iowa Rail Lines
Iowa Biodiesel and Ethanol Processing Plants - 2010
1
209 | Context | Iowa AgriScope 2030

Iowa Corn Industry Economic Impact
Corn Production
• Iowa has produced the largest corn crop of any state for each of the past 14 years. In an average year, Iowa produces more
corn than most whole countries. For example, Iowa grows three times as much corn as a country like Argentina.
• In 2010, 42% of Iowa’s farmland (13.05 million acres harvested) was corn. The average yield across those acres was 165
bushels/acre. Iowa farmers produced 2.15 billion bushels of corn. With corn prices at $5.45, this crop contributed $11.74 billion
(value of production) to the state’s economy.
• Additional value, income and jobs are created up and down the corn value chain
– Rail & truck transportation
– Crop insurance
– Equipment
– Seed
– Chemicals
– Fertilizer
– Corn processing
– Livestock consumption
2
Sources: USDA – NASS; Iowa Renewable Fuels Association; Ethanol Facts online;
Iowa Corn Growers Association; Iowa Agriculture Quick Facts 2010
210 | Context | Iowa AgriScope 2030

Iowa Corn Industry Economic Impact
Economic importance of Iowa biofuels industry, 2009
Purchases
(million $’s)
GDP
(million $’s)
Household
Earnings
(million $’s)
Employment
(Jobs)
State Tax
Revenues
(million $’s)
Operations
Ethanol 4,999.6 10,473.6 1,887.8 59,010 476.0
Biodiesel 224.3 471.2 103.0 2,911 22.3
Subtotal 5,224.0 10,944.8 1,990.8 61,921 498.3
New
Construction
Ethanol 520.7 547.4 295.5 8,260 34.1
Biodiesel 0.0 0.0 0.0 0 0.0
Subtotal 520.7 547.4 295.5 8,260 34.1
Total 5744.7 11,492.2 2,286.3 70,181 532.4
Source: John H. Urbanchuk, LEGC LLC, Contribution of the Biofuels Industry to the Economy of Iowa
Corn Processing Ethanol
• Biofuels production is part of the manufacturing sector that
adds value to agricultural commodities produced in Iowa and
makes a significant contribution to the Iowa economy.
• Iowa produced 3.2 billion gallons of ethanol from 39 operating
plants in 2009.
• In 2009 biofuels production contributed $11.5 billion to the
Iowa economy or 8% of total state GDP. Half of industry GDP
was generated through purchases and the other half through
value-added operations. Approximately 95% of the industry’s
contribution to state GDP came from operations and the rest
from new construction.
• Ethanol contributed $11,021 million or 96% of the total.
• It generated $2.2 billion in household earnings, 67,270 full and
part time jobs and state tax revenues of $510 million.
• The industry also consumed billions of dollars of raw materials,
other inputs, goods and services. Just over half of purchases
were for feedstocks (grains, vegetable oil and animal fats).
• The Iowa ethanol industry consumed 1.14 billion bushels of
corn (46% of the state’s production) providing $2.9 billion in
revenues to Iowa farmers. The Iowa biodiesel industry
consumed 353 million pounds of soybean oil, 218 million
pounds of other fats and oils and 71 million pounds of corn oil.
The total value of these feedstocks was $194.5 million.
• Half of Iowa’s ethanol plants, representing a third of the state’s
production capacity are locally owned.
• DDGS, a co-product generated in the production of ethanol
has become an important input to the animal feed industry
globally.
2
211 | Context | Iowa AgriScope 2030

Iowa Corn Industry Economic Impact
Corn Processing - Bioprocessing Center in Eddyville
• Direct Economic Impact: The center produces an estimated $718 million in industrial output among the three firms, Cargill,
Ajinomoto Heartland LLC, and Wacker Chemical Corporation. There are 702 jobs at the Center with a combined payroll of
$41.86 million – an average earnings level per job of $59,635 across the three firms. The center requires 85 million bushels of
corn annually.
• Indirect Economic Impact: In producing those inputs, the Center required $153.85 million in non-corn inputs from regional
suppliers, which in turn stimulated 1,107 more jobs receiving $54.2 million in labor incomes.
• Induced Economic Impact: The direct and indirect workers convert labor incomes into household spending. That spurs $43.9
million in induced output in the region, which required 551 more jobs making $13.3 million in labor income.
• Total Economic Impact: The Center links to $915.7 million in total industrial output, $190.2 million in value-added of which
$109.35 million is labor income to the area’s 2,360 benefitted workers.
2
Source: An Analysis of the Economic Impacts of the Iowa Bioprocessing Center in Eddyville, Iowa, 2007
212 | Context | Iowa AgriScope 2030

Inputs *
* Seeds
* Agrochemical
* Fertilizer
* Farm Equipment
* Land
* Labor
$8.21 billion
Farm Production
$11.7 billion
Exports
Processing
Livestock Feed
Ethanol Refining
Food & Industrial
Uses
3
Sources: USDA-NASS; Estimated Costs of Crop Production in Iowa, 2011
* Estimate based on 13,400 thousand acres planted to corn in 2010 (USDA-NASS) & ISU Estimated Costs of Crop Production in Iowa for Corn following Soybeans in 2010 of $612.50
Growth in the corn value chain can continue as
long as Iowa continues to have opportunities for
export and new uses are identified.
213 | Context | Iowa AgriScope 2030
Corn Industry Value Chain Summary – Iowa (2010)

Iowa Corn Industry Value Chain Summary –
Production Costs, Corn following Corn
• Continued sustainability and growth of Iowa’s corn sector will
depend upon the state’s competitiveness compared to other
Midwestern states, other countries and continued growth in the
demand for corn.
• Total production costs have increased and are expected to
continue to do so. They peaked in 2009 at $739/acre but that
number is expected to be surpassed in 2012.
– Machinery costs have averaged around 21% of total production
costs yet dipped to 16% in 2009 at almost $116/acre
– Seed, Chemicals, etc. costs have gradually increased, peaking in
2009 at 52% ($387/acre) of total production costs. They are
expected to exceed 2009 levels in 2012.
– Labor costs have decreased as a percent of total production
costs (7% to 4%, although they are a very small portion of total
production costs).
– Land prices per acre as a percent of total production costs have
also decreased from 35% to 28%. However, on a dollar for dollar
comparative basis, they peaked in 2009 at $205/acre.
– An August report from a private survey of professional farm
managers in Iowa, Minnesota, and Illinois found that $400 cash
rents will be commonplace in 2012 on highly productive land.
Increases of 10-20% were thought to be common, depending on
when the lease terms were established.
3
$-
$100.00
$200.00
$300.00
$400.00
$500.00
$600.00
$700.00
$800.00
2003 2004 2005 2006 2007 2008 2009 2010 2011
Land
Labor
Seed,Chemicals,etc.
Machinery
Machinery
Seed,Chemicals,etc.
Labor
Land
Distribution of Iowa corn production costs –
Corn following Corn
Distribution of Iowa corn production costs, 2009 –
Corn following Corn
Source: Estimated Costs of Crop Production in Iowa, 2011 ; 2012 Crop Input Costs Increase, Along with Profit
Margin Opportunities, 2011; Iowa Corn Growers Association; Costs Increasing for 2012 Crop Production, Sept 2011
214 | Context | Iowa AgriScope 2030

Iowa Corn Industry Value Chain Summary –
Production Costs, Corn following Soybeans
• Continued sustainability and growth of Iowa’s corn sector
will depend upon the state’s competitiveness compared to
other Midwestern states, other countries and continued
growth in the demand for corn.
• Total production costs have increased and are expected to
continue to do so. They peaked in 2009 at $691/acre but
that number is expected to be surpassed in 2012.
– Machinery costs have averaged around 21% of total production costs yet dipped to 16% in 2009 at almost $114/acre.
– Seed, Chemicals, etc. costs have gradually increased, peaking in 2009 at 50% of total production costs.
– Labor costs have decreased as a percent of total production costs (6% to 4% although they are a very small portion of total production costs).
– Land prices per acre as a percent of total production costs have also decreased from 37% to 30%. However, on a dollar for dollar comparative basis, they peaked in 2009 at $205/acre.
– An August report from a private survey of professional farm managers in Iowa, Minnesota, and Illinois found that $400 cash rents will be commonplace in 2012 on highly productive land. Increases of 10-20% were thought to be common, depending on when the lease terms were established.
3
Machinery
Seed,Chemicals,etc.
Labor
Land
Distribution of Iowa corn production costs,
2009 – Corn following Soybeans
$-
$100.00
$200.00
$300.00
$400.00
$500.00
$600.00
$700.00
$800.00
2003 2004 2005 2006 2007 2008 2009 2010 2011
Land
Labor
Seed,Chemicals,etc.
Machinery
Distribution of Iowa corn production costs –
Corn following Soybeans
Source: Estimated Costs of Crop Production in Iowa, 2011 ; 2012 Crop Input Costs Increase, Along with Profit
Margin Opportunities, 2011; Iowa Corn Growers Association; Costs Increasing for 2012 Crop Production, Sept 2011
215 | Context | Iowa AgriScope 2030

Corn Industry Outlook – Future Opportunity
Corn Production
• Yields per acre for U.S. feed grains will continue to increase, and corn yields will grow at the fastest rate. Rising corn yields
help boost net returns, keeping planted area up. Corn production is projected up 15% over the next decade.
• In 2010, Iowa farmers produced 2.15 billion bushels of corn. With corn prices at $5.45, this crop contributed $11.74 billion
(value of production) to the state’s economy.
– A 50¢ per bushel increase in corn prices would add $1.08 billion to the state’s economy.
– A 10% increase in yield at $5.45/bushel, would add $1.17 billion to the state’s economy.
• In 2011, Iowa farmers are expected to produce 2.31 billion bushels of corn. With corn prices at $6.20/$7.20, this crop would
contribute $14.3/$16.6 billion (value of production) to the state’s economy.
– A 50¢ per bushel increase in corn prices would add $1.15 billion to the state’s economy.
– A 10% increase in yield at $6.20/bushel and $7.20/bushel, would add $1.43/$1.66 billion to the state’s economy.
4
Sources: USDA – NASS; USDA-ERS Market Outlook;
Interior Iowa Daily Grain Prices, October 28, 2011; WASDE Report, 2011
216 | Context | Iowa AgriScope 2030

Corn Industry Outlook – Future Opportunity
Corn Exports
• China may double its corn imports from the U.S. this season, adding to a burgeoning year for American exporters and giving
railroads and ocean carriers a boost in grain shipments until about August 2012.
– US corn exports to China so far this year have already exceeded total exports from last year, thanks to the recent sale of 900,000
metric tons of American corn, one of the largest sales ever to the country, the Department of Agriculture recently announced.
– China imported about 1 million metric tons last fiscal year, according to the US Grains Council.
– Although China is already on track to become a net importer of U.S. corn for the second straight year, estimates of how much corn
the country will import vary widely.
– The US Grains Council expects the country to import 5 to 10 million metric tons of corn, while the USDA places imports at closer to
2 million metric tons.
– Analyst Hanver Li expects China to import 7 - 10 million metric tons of U.S. corn over the next 12 months, according to the
Associated Press. China’s annual imports of U.S. corn could reach 15 million metric tons by 2015, said Li, Chairman of the market
research firm, Shanghai JC Intelligence.
• Most corn-importing countries are expected to increase imports as meat production rises and as corn production growth is
limited by several factors.
• Mexico's corn imports are projected to rise from about 9 million metric tons to 14 million metric tons in 2020/21. With the
liberalization of U.S.-Mexico corn trade complete—as part of the North American Free Trade Agreement (NAFTA), future
growth in Mexican corn imports will be influenced by factors other than NAFTA, such as rising feed demand from Mexico's
poultry sector.
• Canada is expected to increase corn imports to support a rise in domestic meat production.
• After the trio of Free Trade Agreement deals (Columbia, Korea and Panama) recently passed, the National Corn Growers
Association said “statistics show passage of the three FTAs could create 250,000 American jobs and add an additional $13
billion annually in exports. The United States continues to be the largest producer and exporter of corn in the world, exporting
50.4 million metric tons last year.”
4
Sources: USDA – NASS; Iowa Renewable Fuels Association; Checkoff Connection, Iowa Corn Promotion Board, 2010; USDA-ERS Market
Outlook; US Grains Council; Trio of Trade Agreements Pass Congress, Oct 2011; US Corn Exporters Double Up on China Sales, October 2011217 | Context | Iowa AgriScope 2030

Corn Industry Outlook – Future Opportunity
Corn Processing – Feed Grain
• Demand for feed and livestock production is growing 3% to 6% annually, according to US Grains Council officials.
• As economies expand and personal incomes grow, consumers shift to more meat in their diets and this requires more feed
grains for meat production.
• After rebounding from the current recession, increased global demand for meat is expected to boost world consumption of feed
grains.
– Global trade in feed grains is expected to rise because many traditional importing countries will not be able to increase
production as much as the gains in consumption. (Reference “Estimated Global Meat Production” - Slide 6 of this section)
– Most of the growth in trade is in corn.
• Strong use both domestically and worldwide keeps feed grain prices at historically high levels, but down from record highs
attained in 2007/08.
• China is on pace to become the largest buyer of U.S. dried distillers grain (DDGS), a corn-based byproduct of ethanol
production used as animal feed, this year buying some 1.5 million tons. China’s imports of dried distillers grain may rise to 2.5
million to 3 million tons.
4
Sources: USDA – NASS; Iowa Renewable Fuels Association;
Checkoff Connection, Iowa Corn Promotion Board, 2010; USDA-ERS Market Outlook; US Grains Council
218 | Context | Iowa AgriScope 2030

Corn Industry Outlook – Future Opportunity
Corn Processing – Ethanol
• FAPRI is forecasting corn-based ethanol to continue to grow,
exceeding the RFS2 mandate of 15 billion gallons by the
15/16 marketing year, despite the loss of blenders credit and
the import tariff. The major drivers of continued growth are
the RFS2 mandate, the rising value of RIN’s, ethanol’s price
competitiveness with gasoline and the marketing of E15. The
January forecast projects corn-based ethanol volumes will
reach 16 billion gallons by 20/21. Adoption of 15% ethanol
blends opens up a new 7 billion-gallon-per-year market,
which is twice the size of Iowa’s 2010 ethanol production.
• Cellulosic ethanol only reaches 242 million gallons in 16/17.
• Ethanol imports (sugarcane-based) rise to fulfill a portion of
the advanced biofuels requirement from RFS2. They reach
3.7 billion gallons by the 16/17 marketing year.
• E85 also paints a bright future for ethanol. With the
commitment by the three major U.S. automakers to make
50% of their 2012 production as flex-fuel vehicles, more
motorists will have the option to purchase renewable fuels.
4
Ethanol
0
5,000
10,000
15,000
20,000
25,000
10/11 11/12 12/13 13/14 14/15 15/16 16/17
Eth
an
ol S
up
ply
(m
illio
n g
allo
ns)
EtOH-corn Cellulosic EtOH-imports
Sources: FAPRI, August 2011 Baseline Update for U.S. Agricultural Markets, USDA – NASS;
Iowa Renewable Fuels Association; Checkoff Connection, Iowa Corn Promotion Board, 2010;
USDA-ERS Market Outlook; Iowa Does its Part in Encouraging Adoption of E15, Ethanol
Producer Magazine, May 2011; US ; USDA-NASS; Grains Council; USDA-ERS Market
Outlook
219 | Context | Iowa AgriScope 2030

Corn Production
• ISU Extension economist Mike Duffy expects that non-land costs for 2012 will increase approximately 15% over those realized in
2011; led by higher fertilizer, fuel, seed and crop protection costs.
• An August 2011 report from a private survey of professional farm managers in Iowa, Minnesota and Illinois found that $400 cash
rents will be commonplace in 2012 on highly productive land. Increases of 10-20% were thought to be common, depending on
when the lease terms were established.
• Managing margins is nothing new to row crop farmers, but the increased risk of these high crop prices is that they might lead to
a decrease in demand; a very real concern for 2012. While nearby 2011 corn futures prices approach $8 per bushel, you can
expect demand to decline, especially the demand for corn fed by U.S. livestock producers. This demand could be slow to return
in the short run and have a negative impact on 2012 price prospects.
Corn Processing – Food & Industrial
• Growth in starch production is expected to be limited in the first part of the projection period by weaker demand for paper and
building materials due to poor economic conditions.
• Consumer dietary concerns and other changes in the tastes and preferences limit increases in the combined use of corn for high
fructose corn syrup, glucose, and dextrose to half the rate of population gain.
Corn Processing – Feed Grain
• While nearby 2011 corn futures prices approach $8 per bushel, you can expect demand to decline, especially the demand for
corn fed by U.S. livestock producers. This demand could be slow to return in the short run and have a negative impact on 2012
price prospects.
4
Sources: ISU Ag Decision Maker - 2012 crop input costs increase, along with profit margin opportunities, 2011;
USDA-ERS Market Outlook; USDA-ERS Outlook
220 | Context | Iowa AgriScope 2030
Corn Industry Outlook – Risks to Growth

Corn Processing - Ethanol
• Current installed capacity is approximately 14.7 billion gallons, with no
new corn-based plants under construction. It is difficult to see why
investors would commit $150 million to build a new plant when returns
have been so marginal.
• A prior FAPRI analysis of the loss of the blenders credit estimated that
production capacity could drop by ~1 billion gallons, yet their most recent
analysis shows no real effect from the imminent loss of the credit.
• The FAPRI forecast is based on minimal year-to-year volatility in corn or
ethanol prices which seems questionable. Plant margins may face
additional pressure in the years ahead and some older capacity could be
retired rather than face periods of negative returns and the costs of
replacing equipment.
• Water is going to become an increasing problem in the plains states and
ethanol plants could see water allocations reduced in favor of municipal
use.
• The ethanol industry is approaching the maximum blending requirements
of RFS2 which will inhibit future growth.
• Market acceptance of higher ethanol blends is weak and some states are
removing incentives for corn-based ethanol or resisting the introduction of
E15 on non-flex fuels vehicles.
4
Political support for biofuels in
the U.S. is eroding.
The new fleet mileage standards
may accelerate the decline in
liquid fuels use in the U.S. and
the opportunity to blend biofuels.
221 | Context | Iowa AgriScope 2030
Corn Industry Outlook – Risks to Growth

Corn Industry - References
• Agriculture and the State of Iowa http://www.iowacorn.org/documents/filelibrary/education/State_of_Iowa_and_County_Agricultur_A18D1C040E3D5.pdf
• Bureau of Economic Analysis
• The Economic Impact of Ethanol Production in Iowa http://www2.econ.iastate.edu/research/webpapers/paper_12865.pdf
• U.S. Department of Labor – Quarterly Census of Employment and Wages (QCEW)
• Importance of the Renewable Fuels Industry to the Economy of Iowa, January 24, 2011 http://www.iowarfa.org/documents/2011IowaBiofuelsEconomicImpactFinal.pdf
• The Economic Importance of Agri-Food Industries in Iowa, Sept 2005
• US Grains Council http://www.grains.org/corn
• Estimated Costs of Crop Production in Iowa, 2011 http://www.extension.iastate.edu/agdm/crops/pdf/a1-20.pdf
• WASDE, Sept. 2011, for 2009/10 crop year
• USDA Feed Grain Baseline, 2009-18 http://www.ers.usda.gov/briefing/corn/2009baseline.htm#US
• USDA-NASS
• USDA-ERS, Feed Outlook
• USDA Agriculture Baseline Projections 2011
• USDA, PSD database, accessed 10/7/11
• USDA Feed Grain Baseline, 2010-19 http://www.ers.usda.gov/briefing/corn/2010baseline.htm
• Ethanol data from DOE-EIA, corn data by formula
• FAPRI 2010 and 2011 Outlooks
• FAPRI, August 2011 Baseline Update for U.S. Agricultural Markets
222 | Context | Iowa AgriScope 2030

Corn Industry - References
• Checkoff Connection, Iowa Corn Promotion Board, November 2010
http://www.iowacorn.org/documents/filelibrary/checkoff/IowaCorn_B74E478E1F1E0.pdf
• Iowa Renewable Fuels Association http://www.iowarfa.org/PDF/freedom.pdf
• An Analysis of the Economic Impacts of the Iowa Bioprocessing Center in Eddyville, Iowa, October 2007
• ISU Ag Decision Maker - 2012 crop input costs increase, along with profit margin opportunities, September 2011
• Iowa Does Its Part in Encouraging Adoption of E15, Ethanol Producer Magazine, May 2011
• The Endless Uses for Corn, Corn Marketing Program of Michigan, Winter 2008
http://www.micorn.org/downloads/PLA_newsletter.pdf
• Ethanol Quick Facts www.ethanolfacts.com
• Iowa Corn Growers Association – Brian Jones, Rod Williamson, www.iowacorn.org
• 2012 Crop Input Costs Increase, Along with Profit Margin Opportunities, ISU, August 2011
• Costs Increasing for 2012 Crop Production, Wallace’s Farmer, Sept 2011
http://wallacesfarmer.com/story.aspx?s=52757&c=0&pv=1
• Interior Iowa Daily Grain Prices, October 28, 2011 http://www.ams.usda.gov/mnreports/nw_gr110.txt
• US Corn Exporters Double Up on China Sales, The Journal of Commerce Online, October 21, 2011
http://www.joc.com/importexport/us-corn-exporters-double-china-sales
• Trio of Trade Agreements Pass Congress, Delta Farm Press, October 12, 2011 http://deltafarmpress.com/markets/trio-trade-
agreements-pass-congress
• NationalMaster.com http://www.nationmaster.com/graph/agr_gra_cor_con-agriculture-grains-corn-consumption
223 | Context | Iowa AgriScope 2030

Value Chain & Competitiveness Assessment
224 | Context | Iowa AgriScope 2030
Soybean
Economic Importance
Value Chain Summary
OpportunityOutlook
IndustryStatistics

Soybean Industry Statistics – World Consumption
• Total soybean consumed in the world was 238,203
thousand metric tons (2009/10)
• The United States, Brazil, China, and Argentina consumed
over 70% of the annual world soybean supply.
– China is the #1 consumer of soybeans in the world. They
consumed 24% of the world soybean supply at 59,430
thousand metric tons per year (2009/10).
– The U.S. is #2, consuming 21% of the soybeans at 50,671
thousand metric tons per year (2009/10).
– Brazil is #3, consuming 15% of the soybeans at 36,797
thousand metric tons per year (2009/10).
– Argentina is #4, consuming 15% of the soybeans at 35,723
thousand metric tons per year (2009/10).
– The rest of the top 10 soybean consuming countries/regions
are: the EU-27, India, Mexico, Japan, Taiwan and Indonesia.
1
World soybean consumption, by country – 2009/10
24%
21%
15%
15%
6%
4%
2%2%
1%1%
9%
China
United States
Brazil
Argentina
EU-27
India
Mexico
Japan
Taiwan
Indonesia
Rest of the World
Source: USDA, PSD database, for 2009/10 crop year, accessed 10/25/11
225 | Context | Iowa AgriScope 2030

Soybean Industry Statistics – US Consumption/Utilization
US Soybean Crop3,329 mbu
132 mbuDirect Use
4%
2010/11 US Soybean Crop Utilization
% Percent of Total US Soybean Crop
1
Meal Processed into Oil Processed into
1,648 mbuCrush
Feed(poultry, swine, beef, dairy, eggs,
petfood, aquaculture, other)
Food (flour, concentrate, isolate, fiber)
Industrial (adhesives, other)
1,500 mbuto Exports
Edible, refined(salad oil, bake/fry fat, margarine,
other)
Inedible Industrial(coatings-paint & resin, ink, lubricants,
soap & fatty acids, feed, solvents & cleaners, biodiesel, polyols, other)
Refining Loss
45%
50%
Seed
Feed (as whole beans)
Food Products
Other
Source: USDA – Foreign Agriculture Service,, Supply, Demand & Distribution Online, pulled 11/2/11
226 | Context | Iowa AgriScope 2030

Soybean Industry Statistics – US Consumption/Utilization
US Soybean Crop3,060 mbu
120 mbuDirect Use
4%
2011/12 US Soybean Crop Utilization
% Percent of Total US Soybean Crop
1
Meal Processed into Oil Processed into
1,635 mbuCrush
Feed(poultry, swine, beef, dairy, eggs,
petfood, aquaculture, other)
Food (flour, concentrate, isolate, fiber)
Industrial (adhesives, other)
1,375 mbuto Exports
Edible, refined(salad oil, bake/fry fat, margarine,
other)
Inedible Industrial(coatings-paint & resin, ink, lubricants,
soap & fatty acids, feed, solvents & cleaners, biodiesel, polyols, other)
Refining Loss
45%
53%
Seed
Feed (as whole beans)
Food Products
Other
Source: USDA – Foreign Agriculture Service,, Supply, Demand & Distribution Online, pulled 11/2/11
227 | Context | Iowa AgriScope 2030

Soybean Industry Statistics – Iowa Consumption/Utilization
Iowa Soybean Crop496 mbu
14 mbuDirect Use
3%
2010/11 Iowa Soybean Crop Utilization
% Percent of Total US Soybean Crop
1
Meal Processed into Oil Processed into
364 mbuCrush
Feed(poultry, swine, beef, dairy, eggs,
petfood, aquaculture, other)
Food (flour, concentrate, isolate, fiber)
Industrial (adhesives, other)
128 mbuto Exports
Edible, refined(salad oil, bake/fry fat, margarine,
other)
Inedible Industrial(coatings-paint & resin, ink, lubricants,
soap & fatty acids, feed, solvents & cleaners, biodiesel, polyols, other)
Refining Loss
26%
73%
Seed
Feed (as whole beans)
Food Products
Other
Source: ProExporter 1/14/11
228 | Context | Iowa AgriScope 2030

Soybean Industry Statistics – World Trade
• Global trade in soybeans and soybean products has risen
rapidly since the early 1990s, and has surpassed not only
wheat—the traditional leader in agricultural commodity
trade—but also total coarse grains (corn, barley, sorghum,
rye, oats, millet, and mixed grains). Continued strong growth
in global demand for vegetable oil and protein meal,
particularly in China and other Asian countries, is expected
to maintain soybean and soybean-product trade well above
wheat and coarse grains trade throughout the next decade.
• Production of wheat, coarse grains, and oilseeds compete
with each other and with other crops for limited cropland.
Higher prices for vegetable oils, as a result of increased
demand for food use as well as for biodiesel production and
other industrial uses, are bringing previously un-cropped
land in Brazil, Indonesia, and Malaysia into soybean and
palm oil production.
• In most countries, the projected growth in total area planted
to all crops rises less than a half-percent per year. Area
expands more rapidly in countries with a reserve of
available land and policies that enable farmers to respond to
higher prices. Such countries include Brazil, Russia,
Ukraine, and some other countries in South America and
Eastern Europe. About two-thirds of the projected growth in
global production is derived from rising yields. However,
growth in crop yields has slowed during the last several
decades and is projected to continue doing so.
Global Trade: Wheat, Course Grains, Soybeans & Soybean Products
• The market impact of slower crop yield growth is partially offset
by slower growth in world population. Nonetheless, increasing
population is a significant factor driving overall growth in
demand for agricultural products. Additionally, rising per capita
income in many countries supplements population gains in the
demand for vegetable oils, meats, horticultural products, and
coarse grains. During the projection period, world per capita
use of vegetable oils is projected to rise 12%, compared with
5% for total coarse grains and 3% for meat. Per capita use is
projected to decline nearly 3% for wheat and 2% for rice.
• In the coming decade, overall gains in global grain trade come
from a broad range of countries, but particularly from countries
in Africa and the Middle East.
1
Source: USDA, Agricultural Projections to 2020, Feb 2011
229 | Context | Iowa AgriScope 2030

• Economic growth and population increases in developing countries
are projected to boost demand for vegetable oils for food
consumption and for protein meals used in livestock production.
Vegetable oil used for biodiesel production is also projected to
increase. As demand for vegetable oils increases faster than for
protein meals, vegetable oil prices rise more rapidly than for
oilseeds and protein meals, particularly for rapeseed oil compared
with rapeseed meal.
• Many countries with limited opportunity to expand oilseed
production, such as China and some countries in North Africa, the
Middle East, and South Asia, have invested heavily in crushing
capacity in recent years. As a result, import demand for oilseeds
has grown rapidly and should continue. Global trade in soybeans is
projected to increase 30%, soymeal by 21%, and soy oil by 19%.
• In China, increasing per capita income is projected to continue a
rapid expansion of consumer demand for livestock products and
vegetable oils. Feed rations are expected to include an increasing
percentage of protein meal to improve rates of weight gain for
meat-producing animals. China will mostly import oilseeds for
crushing rather than large amounts of oilseed meals and oils. This
changes the composition of world trade by raising global import
demand for soybeans and other oilseeds rather than for oilseed
products.
• The EU is expected to expand biodiesel production using rapeseed
oil as the primary feedstock. Rapeseed area increases early in the
projections. Although EU imports of soybeans are projected to
decline, imports of soybean meal and soybean oil increase.
Global Exports: Soybeans, Soybean Meal, and Soybean Oil
• Argentina, Brazil, and the United States continue to account for
about 89% of the world’s aggregate exports of soybeans,
soybean meal, and soybean oil during the coming decade. In
Argentina, uncertainties about grain policies cause farmers to
shift some land to soybean production. Also, some pasture land
is converted to crops, especially to soybean production. This
enables Argentina to increase its soybean production, and its
share of world exports of soybeans and products remains above
30%. Brazil’s soybean area continues to increase, but an
increasing share of soybean production is crushed for domestic
feed and food use and its share of exports remains in the 25-31%
range. The U.S. share of world soybean and soybean meal trade
declines from 29% to less than 26% by 2020.
1
Source: USDA, Agricultural Projections to 2020, Feb 2011
230 | Context | Iowa AgriScope 2030
Soybean Industry Statistics – World Trade

Soybean Industry Statistics – World Imports
• World soybean trade is projected to rise rapidly, but
at a slower pace than in recent years, climbing nearly
30 million tons (~30%) during the next decade.
• The EU was the world’s leading importer of soybeans until 2002.
However, increases in grain and rapeseed meal feeding and
rising imports of soybean meal have resulted in declining
soybean imports since then. These trends are projected to
continue.
• Imports of soybeans and meal by East Asia (Japan, South Korea,
and Taiwan) are dominated by a continuing shift from importing
feedstuffs to importing meat and other livestock products. As a
result, this region’s imports of soybeans do not change much
during the coming decade. Small increases in soymeal imports
support slowly rising meat production.
• Mexico’s soybean imports are projected to increase by more than
20% during the projection period. These imports will support the
production of soybean meal for the Mexican poultry and pork
industries and soybean oil for domestic food consumption.
• In recent years, Argentina has imported more than a million tons
of soybeans to enable its crushing plants to operate at full
capacity. However, changes in Argentine policy provide
disincentives to import in the future. The policy impediment to
importing soybeans supports more rapid expansion in Argentine
soybean area in order to supply the needs of the country’s
crushers.
1
Global Soybean Imports
59%
41%China
Rest of World
Global Soybean Imports – 2010/11
Source: USDA, Agricultural Projections to 2020, Feb 2011; USDA – Foreign Agriculture Service,
Supply, Demand & Distribution Online
231 | Context | Iowa AgriScope 2030

Soybean Industry Statistics – World Imports
• China’s soybean imports have risen sharply and now
account for more than 50% of world trade. China will face
policy decisions regarding tradeoffs in producing or
importing corn and soybeans. The projections assume that
Chinese policies will pursue self sufficiency for domestic
corn production and let soybean imports increase. Thus,
China accounts for more than 90% of the projected 30-
million-ton growth in global soybean imports over the next
10 years. China’s underutilized oilseed crushing capacity
drives strong gains in soybean imports as China seeks to
capture the value added from processing oilseeds into
protein meal and vegetable oil. The use of vegetable oils for
biodiesel production is assumed to have a negligible impact
on China’s total vegetable oil use.
1
Global Soybean Imports
Source: USDA, Agricultural Projections to 2020, Feb 2011; USDA – Foreign Agriculture Service,
Supply, Demand & Distribution Online
59%
41%China
Rest of World
Global Soybean Imports – 2010/11
232 | Context | Iowa AgriScope 2030

Soybean Industry Statistics – World Exports
• The three leading soybean exporters—the United States,
Brazil, and Argentina—have accounted for nearly 90% of
world trade in recent years. Although exports from other
countries, such as Uruguay, Paraguay, and Bolivia increase
during the projections, the share held by the traditional
exports remains near 90%.
• With continuing area gains, Brazil strengthens its position as
a leading exporter of soybeans and soybean products.
Combating soybean rust disease increases production
costs. However, as world oilseed prices rise relative to the
price of grains, soybeans remain more profitable than other
crops in most areas of Brazil. With increasing soybean
plantings in the Cerrados region and expansion extending
into the Legal Amazon region, the growth rate for Brazil’s
soybean planted area is projected to average nearly 2.5%
per year during the coming decade. During the next 10
years, soybean exports are projected to rise about 47%.
• Argentina’s export tax rates are higher for soybeans than for
soybean products, which favors domestic crushing of whole
seeds and exporting the products. However, in response to
world demand for soybeans for crushing, Argentina’s
soybean exports have risen sharply and are projected to
continue doing so, rising about 30% to nearly 18 million tons
by 2020. Most of the soybeans exported by Argentina go to
China.
Global Soybean Exports
• Other South American countries, principally Uruguay,
Paraguay, and Bolivia, respond to higher oilseed prices by
expanding the area planted to soybeans. Exports rise more
than 50% to nearly 11 million tons.
• Canada is the next largest soybean exporter, although its
export volume and growth are well below those of the
above-mentioned exporters.
• Ukraine responds to higher international market prices for
oilseeds by increasing production of rapeseed and
soybeans. Soybean exports from Ukraine are projected to
rise rapidly (32%), but from a small base.
1
Source: USDA, Agricultural Projections to 2020, Feb 2011 233 | Context | Iowa AgriScope 2030

Soybean Industry Statistics – U.S. Exports
• U.S. soybean and product exports exceeded $23 billion in
2010.
– China was the largest customer for U.S. soybeans with
purchases exceeding $10.8 billion.
– Mexico was the second largest market for U.S. soybeans
with purchases of nearly $1.5 billion.
– Other significant buyers included Japan with purchases of
$1.1 billion and Indonesia with purchases of $806 million.
– Canada was the largest customer for U.S. soybean meal at
$300 million, with the Philippines and Mexico each
purchasing $285 million.
– China was the largest customer for U.S. soybean oil with
purchases of $420 million, and Mexico was second with
purchases of $200 million.
Top 10 U.S. Export Customers $ Million - 2010
1
234 | Context | Iowa AgriScope 2030

Soybean Industry Statistics – World Imports
• World trade in soybean meal climbs by more than 12
million tons (about 21%) in the projections to 2020.
Continued growth in the demand for livestock products,
limited capability to increase oilseed production, and
relatively lower world prices for protein meals boost
demand for soybean meal in a number of countries with
rising middle-income populations. Lower import prices for
soybean meal relative to soybeans and grains provide
incentives for countries to use imported soybean meal at a
higher rate in livestock feed rations.
• The EU remains the world’s largest destination for soybean
meal throughout the projection period, despite increased
domestic feeding of grains and rapeseed meal. Although
there will be abundant supplies of low-cost rapeseed meal
available for feed as a result of the EU biofuels expansion,
there are technical limits on the amount of rapeseed meal
that can be incorporated in livestock rations. As a result,
growth in EU soybean meal imports is expected to continue
to increase and to account for more than one-fourth of the
increase in world soybean meal trade.
• The regions of Southeast Asia, Latin America, and North
Africa and the Middle East all become larger importers of
soybean meal due to increasing demand for livestock feed
and low oilseed meal prices.
• Russia is projected to experience rapid growth in soybean
meal imports, although from a small base. Increased
livestock production, especially from larger, more modern
Russian facilities, will boost the demand for soybean meal.
• Mexico’s strong growth in demand for protein feed and
vegetable oils is projected to continue.
• Although the projected growth rate for China’s use of
soybean meal is one of the highest in the world, most of the
meal will be supplied by domestic crush, either using
domestically produced or imported soybeans.
1
Global Soybean Meal Imports
Source: USDA, Agricultural Projections to 2020, Feb 2011 235 | Context | Iowa AgriScope 2030

Soybean Industry Statistics – World Exports
• Argentina, Brazil, and the United States remain the three
major exporters in international soybean meal markets.
Together, their share of world exports rises slightly to 90%
during the next 10 years. Argentina, the world’s largest
soybean meal exporter, increases its share of the world
market from less than 50% in recent years to about 57%.
Trade shares held by all other major exporters decline.
• Argentina imposes higher export taxes on soybeans than
on soybean products. This has provided an incentive for
the country to develop a large oilseed crushing capacity.
With Argentina’s low cost of soybean production and the
trade policy incentives to export soy products, soybean
meal exports are projected to continue their robust growth.
• In Brazil, strong growth in domestic meal consumption due
to rapid expansion of the poultry and pork sectors limits
increases in soybean meal exports. Also, domestic
soybean crushing capacity is not expected to grow as fast
due to heavy competition from Argentina. Brazil’s share of
world exports declines from about 25% in recent years to
less than 19% by 2020.
• U.S. soybean meal exports remain at about 8 million tons
during the next 10 years. The U.S. share of world exports
declines steadily from about 15% in most recent years to
less than 12% by 2020.
• The volume of India’s soybean meal exports declines from
more than 3.5 million tons in most recent years to 1.5
million by 2020 as rapidly increasing poultry, egg, and milk
production absorbs more of India’s soybean meal
supplies.
• The EU continues to be a small but steady exporter of
soybean meal to Russia and other East European
countries where livestock production is expected to
increase significantly.
1
Global Soybean Meal Exports
Source: USDA, Agricultural Projections to 2020, Feb 2011
236 | Context | Iowa AgriScope 2030

Soybean Industry Statistics – World Imports
• World soybean oil imports climb 1.8 million tons (19%) in the
projection years, bolstered by rising food use and increased
demand for use in biofuel production. China and India are the
world’s two largest soybean oil importers, primarily for food use.
In recent years, their combined imports have been more than a
third of total world trade. The growth in soybean oil trade will be
constrained by competition with palm oil, which claims the top
ranking in world vegetable oil trade.
• Income and population growth in Latin America, North Africa,
and the Middle East contribute to gains in soybean oil demand
and imports. Although rising international prices for soybean oil
will temper consumption, especially in developing countries,
imports by the North Africa and the Middle East region are
projected to be exceeded only by those of Latin America.
• India remains the world’s largest soybean oil importing country.
Factors that contribute to continued growth in imports include
burgeoning domestic demand for vegetable oils and limited
capacity to expand domestic production of oilseeds. Low yields,
associated with erratic rainfed growing conditions and low input
use, inhibit growth of oilseed production. India sharply reduced
its edible oil import tariffs to zero in 2008 in response to high
world prices. It is assumed that during the next decade, the
soybean oil tariff gradually rises toward the prior rate of 45%,
but that tariffs for the other major imported oils—palm and
sunflower—remain below their historical highs of 75-85%.
• China experiences a growing demand for vegetable oils,
and land-use competition from other crops constrains the
expansion of area planted to oilseed crops. However, with
the rapid increase in soybean imports for crush, China is
able to slowly decrease its imports of soybean oil during
the coming decade.
1
Source: USDA, Agricultural Projections to 2020, Feb 2011
Global Soybean Oil Imports
237 | Context | Iowa AgriScope 2030

Soybean Industry Statistics – World Exports
• Argentina’s and Brazil’s combined share of world soybean oil
exports dropped from 84% in 2005/06 to 65% in 2009/10 due
to poor harvests. However, these countries are projected to
recover partially during the next 5 years to about 75% of world
trade.
• Argentina is the leading exporter of soybean oil, reflecting the
country’s large crushing capacity, its small domestic market for
soybean oil, and an export tax structure that favors exports of
soybean products rather than soybeans. Gains in Argentine
soybean production due to extensive double cropping, further
adjustments in crop-pasture rotations, and the addition of
marginal lands in the northwest part of the country, contribute
to increased soybean production and crush. Argentina’s soy oil
exports are projected to continue increasing even though more
soybean oil is expected to be used as a feedstock for biodiesel
production—with most of the biodiesel destined for export. The
projected 2011-2020 growth in soybean oil exports account for
60% of the increase in world soy oil trade.
• Brazil’s projected increase in soybean oil exports accounts for
most of the rest of global increases in soybean oil trade.
Although Brazil is also projected to use more soy oil for
biodiesel production, expansion of soybean production into
new areas of cultivation enables it to increase its volume of
soybean oil exports from its 2009/2010 reduced level. It does
not however, recover to the large volumes exported between
2002 and 2007.
• The United States remains the world’s third-largest
soybean oil exporter. U.S. soybean oil exports will be
constrained by increased use of soybean oil for biodiesel
production. U.S. canola oil imports from Canada and
palm oil imports from Southeast Asia are projected to
continue to grow strongly, and augment the U.S. edible
oil supply.
• In the EU, exportable supplies of vegetable oils are
limited by the growth in biodiesel production.
1
Source: USDA, Agricultural Projections to 2020, Feb 2011
Global Soybean Oil Exports
238 | Context | Iowa AgriScope 2030

Soybean Industry Statistics – World Supply Considerations
• The world annually produced 39.3 million metric tons of
soybeans in 1966-70, and reached 238.7 million metric tons
in 2006-10. The quantity increased 6.1 times during the half
century. – The US produced more than 50% of the world soybean
production until the 1980s but that share declined to 35% in
2006-10.
– Brazil and Argentina, though, have significantly increased
their shares steadily over the same period.
• Brazil is the second largest producer with 64.5 million
tons, or 27% of world production.
• Argentina ranks third producing 46.1 million tons and
19% of world output.
– The top four countries - United States, Brazil, Argentina, &
China - produce 88% of the world’s soybeans.
• The world soybean production is projected at 311.1 million
metric tons in 2020 and 371.3 million metric tons in 2030.
The annual growth rates are 2.5% from 2010 to 2020, and
1.8% from 2020 to 2030. The estimated quantity level in
2030 is approximately 1.7 times greater than that in 2005-
07.
• During the forecast period, Argentina’s production rises
rapidly by 4.5% annually from 2010 to 2020 and 2.8% from
2020 to 2030, when it reaches 108.4 million metric tons in
2030. At that time, Argentina is projected to become the top
soybean grower, producing 29.2% of the world’s output.
Shifts of Soybean Production
Shares of Top 7 Countries plus Continents
1
Source: World Soybean Production: Area Harvested, Yield & Long Term Projections, International
Food & Agribusiness Management Review, 2009;
USDA – Foreign Ag Service – Production, Supply and Distribution Online & Author’s Calculations
World Soybean Production Projection Summary
Production & Share
73% 77%
66%59%
50% 48% 46%39% 35%
0%0%
14%
17%
19% 19% 21%
26%27%
0%0%
4%6%
9% 10% 13% 18% 19%
21% 16%10% 11%
11% 11% 9% 8% 6%
1% 1% 1% 1%1% 2% 2% 1% 1%
0%
10%
20%
30%
40%
50%
60%
70%
80%
90%
100%
Rest of America
Rest of EUAS
Oceania
Africa
Canada
Paraguay
India
China
Argentina
Brazil
USA
239 | Context | Iowa AgriScope 2030

Soybean Industry Statistics – U.S. Supply Considerations
• Among the feed grains, corn has the highest return above
variable cost. Soybeans, while being an excellent rotation
crop with corn, are also the major competitor with corn for
acreage. Realized net returns for soybeans were above
those for corn in marketing years 1996/97 through 2001/02
and also in 2006/07. Soybean planted area expanded
during these years. Net returns for soybeans are expected
to be below those for corn throughout the projection period,
due to lower relative prices caused by increased corn
demand by the ethanol industry.
• There are benefits to growing crops that may not be
reflected in a single year's cost and returns analysis. Thus,
expected net returns do not explain all planting decisions.
Maintaining rotations is an important objective for most
farmers. This provides numerous agronomic benefits and
may outweigh decisions based only on price signals.
Net returns for various crops
• Soybeans and corn work well in rotation because many of
the insects that attack one crop do not bother the other
crop. Many corn farmers alternate annually between corn
and soybeans. Corn benefits from increased fertilizer use
and carryover fertilizer benefits soybeans in the following
year. Likewise, soybeans roots host bacteria that convert
nitrogen from the air into a form usable by plants.
Carryover nitrogen from this process benefits the following
corn crop. Before genetically modified, herbicide-tolerant
soybeans became available, corn in the rotation was
preferable for greater weed control. Corn remains an
important rotation crop as soybeans planted following
soybeans typically suffer disease-related yield losses.
1
* It is not clear whether or not this includes land costs.
Source: ERS-USDA Briefing Room: Market Outlook
240 | Context | Iowa AgriScope 2030

Soybean Industry Statistics – Iowa Cooperatives(Note: These cooperatives handle other crops beyond soybeans)
Consolidation with the grain and farm supply cooperatives has been vast over the past 20+ years (1990 = 256; 2011 = 58). However the impact on the local communities of Iowa has not dwindled.
1
241 | Context | Iowa AgriScope 2030

Iowa Railroad Service Map - 2010
1
242 | Context | Iowa AgriScope 2030
Soybean Industry Statistics – Iowa Rail Lines

Iowa Grain Loading & Processing Facilities - 2010
In most cases, the larger the rail loading facility, the more competitive they become.
1
243 | Context | Iowa AgriScope 2030
Soybean Industry Statistics – Iowa Rail Lines

Iowa Biodiesel and Ethanol Processing Plants - 2010
1
244 | Context | Iowa AgriScope 2030
Soybean Industry Statistics – Iowa Rail Lines

Iowa Soybean Industry Economic Impact
Soybean Production
• Iowa is the #1 producer of soybeans in the U.S.
• In 2010, 32% of Iowa’s farmland (9.73 million acres harvested) was soybean. The average yield across those acres was 51
bushels/acre. Iowa farmers produced 496 million bushels of soybeans. With soybean prices at $11.70, this crop contributed
$5.8 billion (value of production) to the state’s economy.
• Additional value, income, and jobs are created up and down the soybean value chain
– Rail & truck transportation
– Crop Insurance
– Equipment
– Seed
– Chemicals
– Fertilizer
– Soy processing
– Livestock consumption
2
Sources: USDA NASS, Iowa Soybean Association;
Iowa Agriculture Quick Facts 2010
245 | Context | Iowa AgriScope 2030

Iowa Soybean Industry Economic Impact
Economic importance of Iowa biofuels industry, 2009
Purchases
(million $’s)
GDP
(million $’s)
Household
Earnings
(million $’s)
Employment
(Jobs)
State Tax
Revenues
(million $’s)
Operations
Ethanol 4,999.6 10,473.6 1,887.8 59,010 476.0
Biodiesel 224.3 471.2 103.0 2,911 22.3
Subtotal 5,224.0 10,944.8 1,990.8 61,921 498.3
New
Construction
Ethanol 520.7 547.4 295.5 8,260 34.1
Biodiesel 0.0 0.0 0.0 0 0.0
Subtotal 520.7 547.4 295.5 8,260 34.1
Total 5744.7 11,492.2 2,286.3 70,181 532.4
Sources: John H. Urbanchuk, LEGC LLC, Contribution of the Biofuels Industry to the Economy of Iowa; Biodiesel Returns
US Soybean Farmers ‘ Investment by the Billions, National Biodiesel Board
Soybean Processing - Biodiesel
• Biofuels production is part of the manufacturing sector that
adds value to agricultural commodities produced in Iowa
and makes a significant contribution to the Iowa economy.
• Iowa produced 85 million gallons of biodiesel from nine
operating plants in 2009.
• In 2009, biofuels production contributed $11.5 billion to the
Iowa economy or 8% of total state GDP. Half of industry
GDP was generated through purchases and the other half
through value-added operations. Approximately 95% of the
industry’s contribution to state GDP came from operations
and the rest from new construction.
– Biodiesel contributed $471.2 million or 4% of the total
• It generated $103 million in household earnings, 2,911 full
and part time jobs and state tax revenues of $22.3 million.
• The industry also consumed $5.75 billion of raw materials,
other inputs, goods and services. Just over half of
purchases were for feedstocks (grains, vegetable oil and
animal fats).
• The Iowa biodiesel industry consumed 353 million pounds of
soybean oil, 218 million pounds of other fats and oils and 71
million pounds of corn oil.
2
• An updated 2011 independent study funded by the United
Soybean Board (USB) and soybean check-off found that:
– The biodiesel industry’s demand for U.S. soybean oil
supported U.S. soybean prices by as much as $.27 per
bushel over the past five years, bringing U.S. soybean
farmers an additional $2.7 billion in net returns.
– The increased demand for soybean oil resulted in a larger
supply of U.S. soybean meal, decreasing feed prices paid by
U.S. poultry, livestock and fish farmers by between $16 and
$48 per ton in marketing years 2005-2009.
246 | Context | Iowa AgriScope 2030

Inputs *
* Seeds
* Agrochemical
* Fertilizer
* Farm Equipment
* Land
* Labor
$4.3 billion
Farm Production
$5.8 billion
Exports
Crushing
Oil
Food
Industrial
Hulls/Other
Food/Feed
Industrial
Protein
Feed
Food
Industrial
3
Sources: USDA-NASS; Canada’s Soybean Value Chain; Estimated Costs of Crop
Production in Iowa, 2011
* Estimate based on 9,800 thousand acres planted to soybeans in 2010 & ISU Estimated Costs of Crop Production in Iowa for Soybeans in 2010 of $433.65/acre
Growth in the soybean value chain can continue as long as Iowa continues to have a strong livestock sector and
opportunities for export.
247 | Context | Iowa AgriScope 2030
Soybean Industry Value Chain Summary – Iowa (2010)

Iowa Soybean Industry Value Chain Summary –
Production Costs, Soybeans following Corn
• Continued sustainability and growth of Iowa’s soybean
sector will depend upon the state’s competitiveness
compared to other Midwestern states.
• Total production costs have increased and are expected to
continue to do so. They peaked in 2009 at $491 per acre.
In 2012, they are expected to be even higher than 2009.
– Machinery costs have averaged around 14% of total
production costs yet dipped to 11% in 2009 at almost $56
per acre.
– Seed, Chemicals, etc. costs have gradually increased,
peaking in 2009 at 41% ($203/acre) of total production
costs. They are expected to exceed 2009 levels in 2012.
– Labor costs have decreased (8% to 5% although they are a
very small portion of total production costs).
– Land prices per acre as a percent of total production costs
have also decreased from 47% to 42%. However, on a
dollar for dollar comparative basis, they peaked in 2009 at
$491/acre.
– An August report from a private survey of professional farm
managers in Iowa, Minnesota and Illinois found that $400
cash rents will be commonplace in 2012 on highly
productive land. Increases of 10-20% were thought to be
common, depending on when the lease terms were
established.
3
Sources: Estimated Costs of Crop Production in Iowa, 2011; Iowa Soybean Association;
2012 Crop Input Costs Increase, Along with Profit Margin Opportunities, 2011
$-
$100.00
$200.00
$300.00
$400.00
$500.00
$600.00
2003 2004 2005 2006 2007 2008 2009 2010 2011
Land
Labor
Seed,Chemicals,etc.
Machinery
Distribution of Iowa Soybean Production Costs –
Soybeans following Corn
13%
36%
6%
45%Machinery
Seed,Chemicals,etc.
Labor
Land
Distribution of Iowa Soybean Production Costs, 2010 –
Soybeans following Corn
$433.65 per acre$8.67 per bushel
248 | Context | Iowa AgriScope 2030

Soybean Production
• Yields have continued to increase at ~0.5 bushels/acre/year. Yields are expected to continue to increase. However, they will
need to increase at a more rapid pace (1.6 bushels/acre annually) to meet growing demand.
• In 2010, Iowa farmers produced 496 million bushels of soybeans. With soybean prices at $11.70, this crop contributed $5.8
billion (value of production) to the state’s economy
– A $.50 per bushel increase in soybean prices would add $248 million to the state’s economy.
– A 10% increase in yield at $11.70/bushel would add $581 million to the state’s economy.
• In 2011, Iowa farmers are estimated to produce 468 million bushels of soybeans. With soybean prices at $13.15, this crop will
contribute ~$6.15 billion (value of production) to the state’s economy
– A $.50 per bushel increase in soybean prices would add $234 million to the state’s economy.
– A 10% increase in yield at $11.70/bushel would add $615 million to the state’s economy.
4
Sources: USDA-NASS; World Agriculture & Supply Estimates, USDA,
October 2011
249 | Context | Iowa AgriScope 2030
Soybean Industry Outlook – Future Opportunity

Soybean Industry Outlook – Future Opportunity
Soybean Processing – Biodiesel
• The biodiesel industry is forecast to continue to grow on the
strength of the biodiesel mandate within RFS2, despite the
loss of the blender’s credit by the end of 2011. RIN values
surged at the beginning of the year to draw more capacity into
production.
• SBO and animal fats are expected to provide the bulk of the
feedstocks needed in the 10/11 marketing year.
• Use of SBO for biodiesel production peaks in 11/12 and
declines gradually thereafter. Corn oil extracted from DDGS
at ethanol plants accounts for 20% of biodiesel feedstocks by
16/17, gaining share at the expense of animal fats.
4
Biodiesel
Sources: FAPRI, U.S. Baseline Briefing Book Projections for agricultural and biofuels markets;
Iowa Renewable Fuels Association
0
200
400
600
800
1,000
1,200
10/11 11/12 12/13 13/14 14/15 15/16 16/17
Eth
an
ol S
up
ply
(m
illio
n g
allo
ns)
Soy-based Corn Oil-based Other
• According to a recent economic impact analysis released
by IRFA, economist John Urbanchuk found that increasing
Iowa biodiesel production from 2010 levels to near its
capacity of 315 million gallons per year would:
– Boost Iowa’s GDP by $1.7 billion
– Add almost $375 million to Iowa household earnings
– Support more than 6,300 new jobs in all sectors of the Iowa
economy
– Grow state tax revenue by nearly $80 million per year
250 | Context | Iowa AgriScope 2030

Soybean Industry Outlook – Future Opportunity 4
Recent Developments Affecting Soybean Production, Consumption and Trade include:
• Rapid growth of economies in the developing world, especially in Asia, where increased per capita income is leading to increased
demand for animal protein and cooking oil
• Depreciation of the dollar
• Increase in Chinese processing capacity
• Rise in global biodiesel production
• Potential for high oleic soybean oil to gain market share that was lost because of trans fats
• Higher demand for specialty oils
• Growth in the global aquaculture sector
• Potential growth for India to move from being a soybean exporter to a soy importer relatively soon
• Poultry will be the biggest growth engine among the livestock sector because the Middle East prefers poultry. Pork will also grow
due in part to countries such as China, Thailand, South America and Russia.
Source: How the Global Oilseed and Grain Trade Works
251 | Context | Iowa AgriScope 2030

Soybean Industry Outlook – Risks to Growth 4
• Current issues facing growers
– Competition from corn for acres and DDGs from ethanol plants displacing some of the soybean meal demand
– Although average farm prices for U.S. grown soybeans reached historic highs in 2008, average operating and allocated overhead
costs have exceeded average total gross value of production in heartland states in 10 of the past 13 years. Increased productivity is
needed to ensure adequate supplies to meet greater global demand for soybeans in food, feed and fuel applications; and to lower
costs to sustain profitability in soybean production
– Rising costs for inputs (fertilizer, crop protection products, seed, fuel, land)
– Increased pests and diseases – soybean aphids, soybean cyst nematode (SCN), soybean rust, sudden death syndrome (SDS), iron
deficiency chlorosis, phytophthora root & steam rot, and other plant pathogens and diseases
– Export market acceptance of GM soybeans
– Genetic development of conventional soybean varieties
– Access to Roundup Ready 1 genetics into foreign markets (expiring patent products)
– Foreign sustainability barriers to imports
– Threats of reducing funding to government assistance for exports (i.e. research trade)
– Large federal reductions in funding for American agriculture
– Potential failure of the transportation (rail, river, roads and bridges) infrastructure to keep up with demand
– Threat of Chinese recession/economic crisis due to internal debt
Sources: 2009-2013 Strategic Plan for Advances in Soybean Research: Planning for Iowa’s Growth in Global Soybean Production;
Canada’s Soybean Value Chain
252 | Context | Iowa AgriScope 2030

Soybean Industry Outlook – Risks to Growth 4
• Current concerns facing elevators (feed and grain cooperatives)
– Access to capital and that capital is needed for two reasons:
• Building infrastructure (grain handling, grain storage and fertilizer storage)
– The elevators/coops can not stay ahead of the volume and speed with which this crop comes into them.
• Managing the volatility in the marketplace
– Ability to hire and retain quality employees (High school graduates, 2 year graduates and 4 year graduates)
• This is a huge issue because no one can move a country elevator to a bigger city (i.e., Ames)
Source: Dave Holm, Iowa Institute of Cooperatives
253 | Context | Iowa AgriScope 2030

Soybean Industry Outlook – Risks to Growth 4
• Current concerns facing Biodiesel
– FAPRI is forecasting SBO prices of over $0.50 per pound to 20/21. It
seems highly unlikely that there will be any additional growth in soy-
based biodiesel.
– The permanent loss of the blenders credit could convince a number of
firms to finally exit the business.
– The U.S. biodiesel industry has been operating at ~20% utilization for five
years. Capital is usually redeployed by investors when it fails to provide
adequate returns. A lot of capacity may only exist on paper.Political support for biofuels in
the U.S. is eroding.
The new fleet mileage standards
may accelerate the decline in
liquid fuels use in the U.S. and
the opportunity to blend biofuels.
254 | Context | Iowa AgriScope 2030

Soybean Industry - References
• USDA-NASS Quick Stats http://www.nass.usda.gov/QuickStats/Create_Federal_All.jsp
• USDA – Foreign Ag Service – Production, Supply and Distribution Online http://www.fas.usda.gov/psdonline/psdQuery.aspx
• USDA, World Agricultural Outlook Board, Agricultural Projections to 2020, Feb 2011
http://www.usda.gov/oce/commodity/archive_projections/USDAAgriculturalProjections2020.pdf
• USDA – World Agriculture Supply & Demand Estimates, October 12, 2011 http://www.usda.gov/oce/commodity/wasde/latest.pdf
• ERS-USDA Briefing Room: Market Outlook
• USDA, PSD database, for 2009/10 crop year, accessed 10/25/11
• USDA Agricultural Projections to 2019 http://www.ers.usda.gov/Publications/OCE101/OCE101.pdf
• USDA Agricultural Projects to 2020 – US Crops www.ers.usda.gov/Publications/OCE111/OCE111d.pdf
• WASD, September 2011, for 2009/10 Crop Year
• Importance of the Renewable Fuels Industry to the Economy of Iowa, January 24, 2011
http://www.iowarfa.org/documents/2011IowaBiofuelsEconomicImpactFinal.pdf
• Iowa Soybean Association http://www.iasoybeans.com/index.php
• World Soybean Production: Area Harvested, Yield & Long Term Projections, International Food & Agribusiness Management Review,
2009 http://ageconsearch.umn.edu/bitstream/92573/2/20091023_Formatted.pdf
• Iowa Renewable Fuels Association http://www.iowarfa.org/pr031811.php
• IRFA Wishes Iowans a Happy Biodiesel Day! News Release, Iowa Renewable Fuels Association, March 18, 2011
http://www.iowarfa.org/pr031811.php
• The Biofuel Industry’s Contribution to the Iowa Economy http://www.iowarfa.org/biodiesel_facts.php
• Dave Holm, Iowa Institute of Cooperatives
255 | Context | Iowa AgriScope 2030

Soybean Industry - References
• Soy Demand is Growing All Over, United Soybean Board, January 26, 2011 http://unitedsoybean.org/topics/global-
opportunities/soy-demand-is-growing-all-over
• Soy Stats website http://www.soystats.com/2010/Default-frames.htm
• 2009-2013 Strategic Plan for Advances in Soybean Research: Planning for Iowa’s Growth in Global Soybean Production
• 2012 Crop Input Costs Increase, Along with Profit Margin Opportunities, ISU, August 2011
• Canada’s Soybean Value Chain, Soy 20/20 http://www.soy2020.ca/pdfs/Canadas-Soybean-Value-Chain.pdf
• Estimated Costs of Crop Production in Iowa, 2011 http://www.extension.iastate.edu/publications/fm1712.pdf
• Spectrum Commodities http://www.spectrumcommodities.com/education/commodity/statistics/soybeantable.html
• How the Global Oilseed and Grain Trade Works http://www.soyatech.com/userfiles/file/tradeflow_manual%281%29.pdf
• ProExporter
• Contribution of the Biofuels Industry to the Economy of Iowa, John H. Urbanchuk, LEGC LLC
• Biodiesel Returns U.S. Soybean Farmers' Investment by the Billions, National Biodiesel Board, www.biodiesel.org
• John Baize, President, John Baize and Associates
• FAPRI, U.S. Baseline Briefing Book Projections for agricultural and biofuels markets
256 | Context | Iowa AgriScope 2030

Value Chain & Competitiveness Assessment
257 | Context | Iowa AgriScope 2030
Pork
Economic Importance
Value Chain Summary
OpportunityOutlook
IndustryStatistics

Pork Industry Statistics – World Markets and Trade
• US exports are forecast up 3% to 2.3 million tons with
larger shipments to China and Mexico expected to
outweigh reduced demand from South Korea and
Russia. Exports are increasingly important to the U.S.
pork industry, accounting for 22% of production.
• EU exports are forecast down 5% to 1.9 million tons
largely on tighter supplies as well as weaker demand by
some key importers.
• Lower shipments are expected to Russia due to lower
import quotas and South Korea where domestic
supplies are recovering.
• Brazil exports are forecast down 2% to 570,000 tons as
Russia continues to ban imports from three major pork
producing states. However, Brazil is expected to
expand exports to Hong Kong, Argentina, and other
markets.
• Canada is unchanged at 1.2 million tons as a relatively
strong Canadian dollar and limited supplies are
expected to constrain their competitive position.
1
Source: Livestock and Poultry; World Markets and Trade, USDA-FAS, October 2011
US Builds Its Pork Export Market Share
258 | Context | Iowa AgriScope 2030

Pork Industry Statistics – World Markets and Trade
• US pork exports have seen a steady incline since the 1980s.
• 2010 total US pork exports were $4.781 billion. (1,917,649 metric
tons)
• Top 6 export markets include: Japan, Mexico, Canada, Hong
Kong/China, South Korea, and Taiwan.
• “Many regions of the world are facing very tight pork supplies and
exports from many pork-producing countries are stagnant. The
efficiency and resourcefulness of U.S. producers have allowed
our industry to fill this need, and through aggressive campaigns
such as the global pork butt initiative, we are moving a wider
range of cuts than ever in overseas markets. This has solidified
our position as the world’s leading pork exporter,” according to
USMEF President and CEO Philip Seng in August 2011.
Source: Livestock and Poultry; World Markets and Trade, USDA-FAS, October 2011;
Statistics provided by US government & compiled by US Meat Export Federation ;
August Pork, Beef Exports Soar to New Heights, US Meat Federation, August 2011
1
US Pork Exports (Carcass Weight, Annual)
US Pork Exports to Major MarketsUS Pork Exports to Major Markets
259 | Context | Iowa AgriScope 2030

Pork Industry Statistics – World Markets and Trade
• Imports are forecast down 4% to 6.0 million tons,
constrained by a sharply lower Russian TRQ and
reduced South Korean import demand. Other major
importers are forecast nearly unchanged or, in the case
of Mexico and China, slightly higher.
• Russia’s imports are forecast to drop 25% to 700,000
tons, due mostly to a 30% cut in the import quota in an
attempt to promote domestic production. However, out-
of-quota shipments are expected to continue to be
significant. Lower imports combined with modest
production growth are expected to result in a decline in
consumption.
• South Korea’s imports are expected to fall 20% to
500,000 tons, yet will remain significantly higher than
2010 pre-FMD-impacted levels. The special zero duty
TRQs to facilitate imports in 2011 are not expected to
continue.
• Mexico’s imports are forecast up 3% to 650,000 tons
as pork is expected to be more price competitive vis-à-
vis other meats. Additionally, the expected reduction of
Mexican retaliatory tariffs on hams and shoulders are
expected to make U.S. pork more competitive.
1
Russian and South Korean Imports Fall
• China’s imports are forecast 2% higher to 560,000 tons as
expanding domestic supplies are unable to meet rising
demand.
• Japan’s imports are expected to remain flat at 1.2 million
tons as greater domestic supplies limit import growth.
260 | Context | Iowa AgriScope 2030

Pork Industry Statistics - Consumption
• Pork is one of the most widely eaten meats in the world,
accounting for about 38% of meat production worldwide,
although consumption varies widely from place to place.
• According to the USDA-FAS, nearly 100 million metric tons
of pork were consumed worldwide in 2008 (preliminary
data).
• Increasing urbanization and disposable income have led to
a rapid rise in pork consumption in China, where 2006
consumption was 20% higher than in 2002, and a further
5% increase was projected in 2007.
• Pork is popular throughout eastern Asia and the Pacific,
where whole roast pig is a popular item in Pacific Island
cuisine.
– It is consumed in a great many ways and highly esteemed
in Chinese cuisine.
– There, pork is preferred over beef for economic and
aesthetic reasons.
– The pig is easy to feed and is not used for labor.
– The colors of the meat and the fat of pork are regarded as
more appetizing, while the taste and smell are described
as sweeter and cleaner.
– It is also considered easier to digest.
1
2008 Worldwide Pork Consumption
Sources: USDA-FAS; Food for Thoughts, Global Food Trends, Science News Online,
May 2003; Livestock and Poultry: World Markets and Trade, Circular, USDA-FAS,
October 2006; Encyclopedia of Asian Food. Melbourne: William Heinemann Australia.;
The Modern Art of Chinese Cooking, New York: Hearst Books261 | Context | Iowa AgriScope 2030

Pork Industry Statistics – World Production
• Global pork production is forecast 2% higher to a record
103.4 million tons. Growth is mostly attributed to recovery
in South Korea and China. Modest growth is also expected
from major exporters the United States, Russia, and Brazil.
• South Korea is forecast up 21% to 1.0 million tons as their
pork industry rebuilds following the devastating foot and
mouth disease (FMD) outbreak that slashed their
production by 25%. Record high swine and pork prices
have encouraged producers to quickly rebuild despite
higher compound feed prices. Sow inventories have
expanded rapidly and beginning sow stocks are expected
to reach 98% of pre-FMD levels. Producers are expected to
continue to rebuild through 2012. However, it is unlikely
that total inventories at the end of 2012 will reach pre-FMD
levels due to new regulations increasing minimum barn
space requirements and environmental regulations.
Additionally, the recently implemented Free Trade
Agreement with the EU is expected to increase relative
competitiveness of EU pork, which in turn is expected to
put downward pressure on Korean production.
Global Pork Production Rebounds
• China’s production is forecast to recover 4% to 51.3 million
tons following swine disease problems and poor producer
returns. The rebound is being fueled by sharply higher
prices and recent government measures such as the
productive sow subsidy, although swine inventories are not
expected to fully recover in 2012. Expansion in small scale
operations, which still account for a majority of production,
is being constrained by higher feed costs and swine
disease threats. Meanwhile, large scale operations report
some difficulties in acquiring additional land necessary for
expansion.
1
Source: Livestock and Poultry: World Markets and Trade, USDA-FAS, October 2011262 | Context | Iowa AgriScope 2030

Pork Industry Statistics – World Production
• The United States is forecast up 2% to 10.5 million tons.
Producers are expected to continue to benefit from
productivity gains, with the pig crop up 2% while beginning
sow stocks have increased only slightly. Greater available
supplies compared to competing proteins are expected to
bolster domestic consumption.
• Russia is forecast up 3% to 2.0 million tons, supported by
positive producer gains and government support and
investment. Producers have expanded their breeding herds
in the face of October 2011 lower feed prices, less import
competition due to a sharp reduction in the import quota,
and the prospect of higher pork prices. Production growth
is expected to come from larger operations, as smaller
producers find it difficult to compete with new, modernized
farms.
• Japan’s production is forecast up 2% to 1.3 million tons as
producers are expected to rebuild. Greater domestic
supplies are expected to mitigate import demand.
Global Pork Production Rebounds
• The Canadian hog industry has reached a turning point
after several years of decline. Pork production is forecast
up 1 % to 1.8 million tons with modest increases in
beginning sow inventories and the pig crop. Relatively high
feed costs and uncertainties in both pork prices and foreign
demand will likely temper growth.
• Brazilian pork production is forecast up 2%, to 3.3 million
tons, as domestic demand strengthens in response to
industry promotions. Consumption is also expanding
among the growing Brazilian middle class, as pork prices
are competitive with beef.
1
Source: Livestock and Poultry: World Markets and Trade, USDA-FAS, October 2011263 | Context | Iowa AgriScope 2030

Pork Industry Statistics – US & Iowa Production
• The number of swine in Iowa has grown in the past 20
years.
• The breeding herd has been slowing, declining nationally
and in Iowa. Increasing litter size has offset the need for
more sows.
• Market hog numbers continue to increase in Iowa as the
state’s hog industry has increased importation of feeder
pigs from other states or Canada. Iowa’s feed cost
advantage for finishing hogs is more pronounced than its
cost advantage in the farrowing sector which requires more
labor and capital investment.
• As the number of farms with hogs has declined and the
number of total hogs has been increasing, the inevitable
result is that the average number of hogs per farm has
increased.
• Iowa currently produces about a sixth of the nation’s litters
but feeds almost a third of the nation’s hogs.
1
Swine Breeding Herd – U.S. and Iowa
Market Hog Inventory – U.S. and Iowa
Source: Iowa Concentrated Animal Feeding Operation Air Quality Study, Feb 2002;
Updated Information by Shane Ellis, ISU Ag Extension Economist
264 | Context | Iowa AgriScope 2030

Pork Industry Statistics – Iowa Production
• Inventories have varied cyclically over time, but have
trended upward.
• Sustained profitability in the hog production enterprise
from 2004-2007 spurred expansion in the swine
industry. The introduction of a new vaccine for
circovirus resulted in a notable increase in efficiency
and production. However, an excessive hog supply,
falling hog prices and increased feed costs resulted in
record losses in 2008 and 2009. Modest profitability
returned in 2010 and 2011.
• Average monthly return to hog production in Iowa is
estimated to be $5-6 per head in 2011.
• Iowa has grown its pork production capacity over the
past ten years. However, the hog finishing capacity in
Iowa grew faster than farrowing capacity as weaned
pigs are brought in from surrounding states and
Canada.
1
Iowa Hog Inventory and Share of U.S. Hogs
0
2000
4000
6000
8000
10000
12000
14000
16000
18000
20000
2001 2002 2003 2004 2005 2006 2007 2008 2009 2010
10
00
He
ad
IL
IND
IOWA
MN
NC
4th Quarter Market Share of the Top 5 Pork Producing States
2001-2010
See next slide for trends (2001-2011) regarding returns to
hog production.
Source: The Iowa Pork Industry 2008: Patterns and Economic Importance, ISU, 2008 – Updated by Shane
Ellis, ISU Ag Extension Economist
265 | Context | Iowa AgriScope 2030

• The hog industry continues to gravitate to larger
operations. While the number of very small (<100
head) swine operations has increased with interest in
hobby farming, market share from operations with less
than 2000 head has been declining.
• The dropout from production of the smaller farms has
been largely picked up by expansion within the larger
pig production segment.
• Within Iowa, the number of small swine operations has
declined dramatically in the past two decades. Total
hog operations in the state have declined by more than
half in the state, while the number of larger operations
has more than doubled.
• While USDA data was not available specifically for Iowa
after 2007, the period from 2008-09 saw a continued
decline in small operation numbers as high feed costs
and heavy losses pushed those small operations out of
the industry.
1
Changes in U.S. number of Pork Operations by Size
and Percentage of U.S. Marketings
Herd Size 2004 2009 % change 2004 2009
1-99 41,980 50,370 20.0% 1.0% 0.9%
100-499 9,800 5,370 -45.2% 4.0% 2.2%
500-999 3,830 2,050 -46.5% 4.5% 2.2%
1000-1999 2,300 1,900 -17.4% 6.0% 4.0%
2000-4999 1,850 2,200 18.9% 9.5% 9.7%
5000-9999 620 745 20.2% 7.0% 8.0%
10000-19999 290 350 20.7% 7.0% 7.3%
20000-49999 130 185 42.3% 7.0% 9.0%
50000+ 110 130 18.2% 54.0% 56.7%
% of MarketingsNumber of Operations
Herd Size 1997 2004 2007 % chg 2004-07
1-99 3400 1300 900 -31%
100-499 6900 2600 2300 -12%
500-999 3900 1600 1500 -6%
1000-1999 2250 1600 1500 -6%
2000-4999 1250 1600 1700 6%
5000+ 300 500 600 20%
Total Operations 18000 9200 8500 -8%
Changes in Number of Iowa Pork Operations By Size
Source: Iowa Concentrated Animal Feeding Operation Air Quality Study, Feb 2002;
Updated Information by Shane Ellis, ISU Ag Extension Economist
266 | Context | Iowa AgriScope 2030
Pork Industry Statistics – Industry Structure

• Total hog marketings in Iowa have increased in recent
years but the number of farms raising hogs has continued
to decline.
– Since 1999, the number of farms with hogs decreased
from 14,500 to 8,500 farms.
– Meanwhile, the average inventory of hogs has
increased from 1,062 to 2,282 per farm.
• Structure of Iowa inventory (2007)
– 16% of the hogs are on farms with < 2,000 head
inventory.
– 30% of hog inventory on farms with 2,000-5000 head.
– 54% of hog inventory on farms with > 5,000 head of
hogs.
1
Iowa farms with hogs and hogs per farm
Percent of inventory by size of Iowa hog farm, 2007
Source: The Iowa Pork Industry 2008: Patterns and Economic Importance, ISU, 2008267 | Context | Iowa AgriScope 2030
Pork Industry Statistics – Number and Size of Farms

Pork Industry Statistics – Number & Size of Farms
• One reason for the increased herd sizes is the greater
potential for profit.
• This table shows the percentage of farms that reported
a profit for the year 2000.
• It is clear that the higher percentage of smaller farms
were in the breakeven or net loss return categories
when compared to larger farms.
• The reasons for this are many, but do include those
mentioned earlier (Prior Slide – Pork Industry Structure)
• Larger operations are able to spread out labor,
management and fixed costs over more pigs. Larger
operations also tend to be more proactive in adopting
improved production methods and animal genetics.
• Larger farms are more consistently making a profit
when compared to smaller farms.
1
Profitability by herd size (number of sows) in the US (2000)
Source: Iowa Concentrated Animal Feeding Operation Air Quality Study, Feb 2002;
Updated Information by Shane Ellis, ISU Ag Extension Economist
268 | Context | Iowa AgriScope 2030

Pork Industry Statistics – Iowa Production 1
Estimated Returns to Farrow to Finish Hog Production,
$ Head, ISU Extension
269 | Context | Iowa AgriScope 2030

Pork Industry Economic Impact
• Total industry output measures total dollars of goods and
services produced by an industry, including government
and non-government activity.
• The estimated $4.3 billion of gross output from pork
production activity is linked directly into the state’s hog
slaughtering and processing sectors.
• The total sales from the pork production and processing
sectors support additional input purchases, spending on
transportation and other services, as well as consumer-
related purchases worth $16.1 billion of direct & indirect
sales throughout the Iowa economy.
• This output, or gross sales number should be used with
caution because the value of the hog is counted twice at
the farm level and as part of the total value of pork
products when it is sold from the processor.
• While much of the impacts are concentrated in the
agricultural and input-supply sectors, economic linkages
beyond the farm gate capture additional activities such as
transportation, handling, processing and the personal
consumer spending effects. As a result, the effects of the
pork industry are distributed throughout the economy,
including the services and trade sectors.
2
Economic importance of pork industry in Iowa - 2008
• ~ $340.3 million of direct income to pork producers is linked
to an additional $2.2 billion of income throughout the Iowa
economy, including the pork-processing sector, for a total
impact of $2.55 billion of personal income.
Source: The Iowa Pork Industry 2008: Patterns and Economic Importance, ISU, 2008270 | Context | Iowa AgriScope 2030

Pork Industry Economic Impact – Value Added
• Total Value added measures the total gain in economic
activity to the economy resulting from production of goods
or services. Wages, salaries, taxes & profits are included
in the value-added measure.
• The value-added measure is a good indicator of net
economic activity as only the net incremental value is
summed at each transaction to avoid the double counting
issue that occurs when using the total industrial output
measure.
• The estimated $477 million of value added to pork
production is linked to $3.62 billion of additional indirect and
induced value-added activity in the state’s economy for a
total value added of $4.1 billion.
2
Economic importance of pork industry in Iowa - 2008
Source: The Iowa Pork Industry 2008: Patterns and Economic Importance, ISU, 2008271 | Context | Iowa AgriScope 2030

Pork Industry Economic Impact - Employment
• About 64,000 Iowa jobs are involved in various aspects of the hog industry ranging from input suppliers to producers, to
processors and handlers as well as main-street businesses that benefit from purchases by people in these industries.
• Estimating the labor component involved in hog production represents a special challenge.
• Government sources such as the USDA Hogs and Pigs report estimate that 8,500 farms are involved in hog production, although
many of them operate at a scale too small to be counted as fulltime enterprises.
• Although an estimated 8,500 farms are reported to be involved in hog production in 2007, based on the FTE standard of these
budgets, an estimated 6,131 workers are required to produce the current volume of hogs in Iowa.
• The 6,131 jobs include farm proprietors as well as farm workers and can be interpreted as FTE positions.
• The 6,131 plus the 17,500 at the slaughter and processing level generate a chain of economic activity that supports an additional
39,700 jobs throughout the rest of the economy.
• This service sector provided the largest number of secondary jobs followed by Finance, Insurance and Real Estate and Retailing
(FIRE). The higher number of jobs in services combined with the lower levels of income suggests that many of these jobs are
less than full time.
2
Source: The Iowa Pork Industry 2008: Patterns and Economic Importance, ISU, 2008272 | Context | Iowa AgriScope 2030

Pork Industry Value Chain Summary 3
Iowa pork production and processing sector
Source: The Iowa Pork Industry 2008: Patterns and Economic Importance, ISU, 2008273 | Context | Iowa AgriScope 2030

Pork Industry Value Chain Summary
• The largest single category of expenditure is feed costs.
• With 32.08 million head produced annually, 291.6 million
bushels of corn valued at $1.134 billion are used in Iowa.
• Feed supplements and additives represent another $811.9
million of purchased inputs from suppliers in Iowa. The use
of this scale of feed supplements helps support soybean
prices, the soybean processing industry, local elevators and
transportation services based in rural areas.
• In addition to the backward linkage effects of purchased
inputs by pork producers, forward linkages can be traced to
the slaughter and processing level for impact on the state's
economy. Based on estimates of inter-industry flows used
in the state Input-Output model, the cost of live animals
represents about 50 percent of the total value of the pork at
the slaughtering level and a smaller share at the
processor's product. The remaining margin is for other
inputs including labor, proprietor’s income, and return on
investment. Farm level effects, the backward and forward
linkages, generate significant additional impacts throughout
the Iowa economy.
3
Iowa pork production and processing sector
• The backward linkages include purchased inputs, supplies
and services used by hog producers. The forward linkages
include further value added activities occurring after the
farm gate such as meat preparation and processing.
• Total inputs, including labor, used by the Iowa hog industry
are estimated based on aggregated cost of production
budgets weighted according to the share of hog production
occurring in different types and sizes of production
systems.
Source: The Iowa Pork Industry 2008: Patterns and Economic Importance, ISU, 2008274 | Context | Iowa AgriScope 2030

• Continued sustainability and growth of Iowa’s pork
sector will depend upon the state’s competitiveness
compared to other regions, especially those closer to
major market centers.
• The primary advantage Iowa pork producers enjoy over
other pork producing regions is access to lower cost
feed. Feed is the largest component, representing
~64% of production costs.
• Consequently, feed prices have a dramatic impact.
Iowa has a feed price advantage due to its extensive
farmland and will likely maintain that advantage for the
foreseeable future.
• Higher oil prices have resulted in additional cost of feed
transportation from the Midwest to corn deficient
regions.
• But feed prices have increased more in corn importing
regions.
3
• The largest non-feed cost items provide the greatest
opportunity for producers in other regions to compensate
for Iowa’s feed cost advantage.
• Production efficiency is primarily related to diet,
environmental conditions, genetics and other factors
controlled by management. Much of which would be short
lived.
Distribution of Iowa Pork Production Costs
See next slide for more recent cost of production data and trends.
Source: The Iowa Pork Industry 2008: Patterns and Economic Importance, ISU, 2008275 | Context | Iowa AgriScope 2030
Pork Industry Value Chain Summary

Pork Industry Value Chain Summary
276 | Context | Iowa AgriScope 2030

Pork Industry Opportunity Outlook – Threats to Growth
• Likely Threats to Iowa’s Production Cost Advantage
– The cost of transporting feed gives Iowa a competitive advantage over many other states.
– Iowa tends to be the nation’s leader in advancing the efficiency of the swine industry both in feed conversion and litter size.
– Because hog production units are larger on average, and more specialized than in the past, total economic activity may be more
stable or increase for regions that have production units. Other regions that are losing share of production will lose economic activity.
• Other Threats / Uncertainties
– As production units increase, there is the associated concentration of waste produced & emissions released. On the positive side,
waste from modern deep pitted swine operations is a value nutrient source for farming operations. As fertilizer costs have increased
so has interest in acquiring livestock manure.
– Federal environmental standards may have differing regional impacts on hog production.
– State & county environmental and zoning regulations can greatly alter the competitive position of the local pork industry
– Animal health issues
– Animal welfare guidelines
4
Source: The Iowa Pork Industry 2008: Patterns and Economic Importance, ISU,
2008; Iowa Concentrated Animal Feeding Operation Air Quality Study, Feb 2002277 | Context | Iowa AgriScope 2030

Pork Industry Opportunity Outlook – Threats to Growth
• Necessary ingredients to industry survival are effective:
– Marketing – identification of new markets and positioning themselves to produce products for these markets
– Financial management
– Risk management
– Environmentally-sound facilities & management practices (and be good neighbors in order to remain sustainable)
• Changes in the pork industry have been and will continue to be driven by:
– Emerging technology
– Emerging Markets
– Emerging Information
– Skills of producers
4
Source: The Iowa Pork Industry 2008: Patterns and Economic Importance, ISU,
2008; Iowa Concentrated Animal Feeding Operation Air Quality Study, Feb 2002
278 | Context | Iowa AgriScope 2030

Pork Industry - References
• The Iowa Pork Industry 2008: Patterns and Economic Importance
http://www2.econ.iastate.edu/faculty/lawrence/Iowa%20Pork%20Industry%202008%20Final.pdf
– USDA Disposition, Production and Income report
– USDA Farms, Land in Farms, and Livestock Operations 2007 Summary
– Positioning Your Pork Operation for the 21st Century, Professor Chris Hurt of Purdue University
– The Food and Agricultural Policy Institute (FAPRI)
– IMPLAN system developed by the US Forest Service
• Iowa Concentrated Animal Feeding Operation Air Quality Study, February 2002
http://www.deq.state.or.us/aq/dairy/docs/appendix/appendix_L.pdf
– Chapter 2: Industry Structure and Trends in Iowa
• Food for Thoughts, Global Food Trends, Science News Online, May 31, 2003
• Livestock and Poultry: World Markets and Trade, USDA-FAS, October 2006
http://www.fas.usda.gov/dlp/circular/2006/2006%20Annual/Livestock&Poultry.pdf
• Encyclopedia of Asian Food. Melbourne: William Heinemann Australia.
• The Modern Art of Chinese Cooking, New York: Hearst Books.
• US Pork Export Statistics - Statistics provided by US government & compiled by US Meat Export Federation
http://www.usmef.org/
• August Pork, Beef Exports Soar to New Heights, US Meat Federation, August 2011 http://www.usmef.org/news-statistics/press-
releases/august-pork-beef-exports-soar-to-new-heights-2
• Livestock and Poultry; World Markets and Trade, USDA-FAS, October 2011
http://www.fas.usda.gov/psdonline/circulars/livestock_poultry.pdf
• Shane Ellis, Iowa State University, Ag Extension Economist
• USDA – FAS279 | Context | Iowa AgriScope 2030

Value Chain & Competitiveness Assessment
280 | Context | Iowa AgriScope 2030
Beef
Economic Importance
Value Chain Summary
OpportunityOutlook
IndustryStatistics

Beef Industry Statistics – World Markets and Trade
• The world’s leading beef exporters are: Brazil,
Australia, United States and India.
• Competition is expected to tighten among key beef
exporters in 2012.
• Beef exports are forecast to rise 5% in 2012 on robust
global demand, particularly by Southeast Asia, the
Middle East and North Africa.
• India accounts for nearly half of world growth in 2012 on
increased supplies and price-competitive shipments to
emerging markets.
• Expansion enables the rising exporter, India, to nudge
the United States to become the world’s third largest
exporter.
1
Source: USDA-Livestock and Poultry: World Markets and Trade, 2011
World’s Leading Beef Exporters
281 | Context | Iowa AgriScope 2030

Beef Industry Statistics – World Markets and Trade
• The most significant change in the cattle and beef export
business in recent years has been a dramatic increase in
U.S. exports of beef. By-products like hides and variety
meats remain important to cattle producers. Dollar-value
exports of cattle products continue to exceed imports by a
substantial margin.
– Beef exports in 1993 decreased somewhat for the first time
in years.
– Exports increased again in 1994 and 1995.
– A further increase was expected in 1996, but decreases in
exports to Japan and Korea, partly because of concerns
about E. coli, later brought decreases in total beef exports
for the year in total.
– Exports during 1998 and 1999 were stronger as Asian
economies began to recover.
– The United States maintains gains achieved since 2003, the
last year before the BSE detection in Washington State, to
reach record level exports.
• Despite a weak dollar, additional U.S. growth is constrained
by lower production.
• 2010 beef exports were $4.08 billion, 2.35 billion pounds
• Top 6 export markets included: Mexico, Canada, Japan,
South Korea, China/Hong Kong, and Taiwan.
1
Source: National Cattlemen’s Beef Association; Statistics provided by US Government &
compiled by US Meat Export Federation
0
2000
4000
6000
8000
10000
12000
1981 1983 1985 1987 1989 1991 1993 1995 1997 1999 2001 2003 2005 2007
Beef & Veal Variety Meats Tallow Hides Live Cattle Total
U.S. Cattle and Beef Products – Exports (million dollars)
0
500,000
1,000,000
1,500,000
2,000,000
2,500,000
2001 2002 2003 2004 2005 2006 2007 2008 2009 2010
Japan Mexico Canada
South Korea China/Hong Kong Taiwan
Total Top 6
Leading Markets for U.S. Beef - including variety meat
(metric tons)
282 | Context | Iowa AgriScope 2030

Beef Industry Statistics – World Markets and Trade
• Russia, which now includes trade with Belarus, is
forecast to continue its new found position as world’s
leading importer. Slightly lower production will be
partially offset by an increase in imports. The tariff rate
quota (TRQ) volume remains unchanged in 2012 and
again a significant volume will likely be imported over
quota.
1
World’s Leading Beef Importers
0
2000
4000
6000
8000
10000
12000
1981 1983 1985 1987 1989 1991 1993 1995 1997 1999 2001 2003 2005 2007
Beef & Veal Variety Meats Tallow Hides Live Cattle Total
US Cattle and Beef Products – Imports (million dollars)
Sources: National Cattlemen’s Beef Association;
USDA-Livestock & Poultry: World Trade Markets & Trade, 2011
283 | Context | Iowa AgriScope 2030

Beef Industry Statistics – Consumption & Production
• Per capita consumption of beef has been declining
slowly, but steadily since 2006. While per capita
consumption was declining, total beef production
remained above 26.5 billion pounds. However, beef
production is expected to decline by 4-5% in each of the
next two years.
• Per capita consumption of beef has been declining as
beef exports and national population increases have
out- paced any increased beef production.
• Beef production has become more efficient in recent
years, with more beef produced per beef cow than ever
before.
• US beef production is expected to decline in the next
several years, as a declining national beef cow herd
and drought conditions impact the nation’s beef
production capabilities.
1
U.S. Per Capita Beef Consumption
U.S. Commercial Beef Production
Source: USDA284 | Context | Iowa AgriScope 2030

Beef Industry Statistics – Production 1
• Iowa has the 7th largest cattle inventory in the U.S. with
4.2% of the nation’s cattle.
• Iowa had the 13th largest beef cow herd on January 1,
2011.
• Iowa had the 4th largest inventory of cattle on feed January
1, 2011.
• The inventory of US total cattle tends to follow a ten year
cycle between peaks, with the current decline beginning in
2007.
• Iowa’s total cattle inventories have remained fairly steady,
even though national trends have been declining the past
15 years.
– Iowa beef cow herds have declined by 17% since 2007,
and are now at their lowest level since 1952.
– Dairy cow numbers have been generally steady since
2007.
– 1.38 million head of cattle were on feed at the beginning of
the year, the highest volume since 1980.
All Cattle and Calves, US and Iowa Inventory
January 2011
• More than 50% of the total value of U.S. sales of cattle and
calves comes from the top 5 states:
1. Texas
2. Kansas
3. Nebraska
4. Iowa
5. Colorado
Sources: Economic Importance of the Iowa’s Cattle Industry, 2005,
updated by Shane Ellis at Iowa State University, 2011; USDA 2007 Ag Census
285 | Context | Iowa AgriScope 2030

Beef Industry Statistics – Production 1
• Iowa’s inventory of beef cows was 840,000 head at the
start of 2011.
• The U.S. beef cow inventory had its last significant peak in
1996 and then declined until 2004 before increasing slightly
in 2005. Since then, the national herd has been in decline.
• At least part of the Iowa decline since 1990 is due to a loss
of pasture acres in the state, as crops and land retirement
programs bid land away from cowherds.
• Significantly higher row crop prices in the past five years
encouraged the conversion of land use from pasture
grazing to crop production. Iowa beef cow numbers have
been declining annually by a rate of more than 4% in the
past four years.
• If profitable conditions continue, U.S beef cow inventories
are expected to increase in 2015.
• The figure to the right shows the inverse relationship
between U.S. total cattle inventory and cow-calf herd
returns.
– Generally, the national cattle herd increases after five to six
years of profitability.
– The increased profits then encourage expansion of the
herd and thus the cycle continues.
Beef cows that have calved, January 1 (1,000 head)
U.S. beef cow inventory and cowherd returns
Source: Economic Importance of the Iowa’s Cattle Industry, 2005,
updated by Shane Ellis at Iowa State University, 2011286 | Context | Iowa AgriScope 2030

• As of the most recent count in 2007, there are
approximately 25,000 farms in Iowa with beef cow herds.
• The number of herds in Iowa has declined since the mid-
1980s, then was stable during the early 2000s.
• Since 2007 there has been a dramatic decline in beef cow
numbers in the state. The majority of this decline comes
from a reduction in the number of small production herds
with fewer than 100 head.
• Beef cow herds in Iowa are relatively small, with an
average size of approximately 40 cows per herd.
• It is important to note that the smaller herds are in rural
Iowa and the part time jobs they produce are important to
rural Iowa.
• From the 2007 Census of Ag.
– 34% of the state’s beef cows are in over 15,000 herds with
less than 50 cows
– 25% of Iowa beef cows are in herds between 50-99
– 36% of Iowa beef cows are in herds between 100-499
– 5% of Iowa beef cows are in herds of over 500 head
1
Beef cow herds and cows per herd in Iowa
Percent of inventory by size of Iowa beef cow herd
Sources:
2007 Census of Agriculture; Economic Importance of the Iowa’s Cattle Industry, 2005, updated by
Shane Ellis at Iowa State University, 2011; Iowa Concentrated Animal Feeding Operation Air Quality
Study. 2002
Beef Industry Statistics – Number & Size of Farms
287 | Context | Iowa AgriScope 2030

• Iowa had 1,380,000 head of cattle on feed January 1, 2011.
This figure is 41% greater than in 1990, but 25% more than
2000.
• Iowa’s cattle feeding capacity has increased in the past
decade, especially during 2003-2007. While losses in the
cattle feeding sector during 2008 and 2009 led to a decline
in cattle on feed inventories, Iowa has since returned to
increasing its cattle feeding inventory.
• Cattle feeding returns are cyclical, but profitability has been
brief in the past seven years.
– In 2008 and 2009 a combination of increasing feed costs
and declining demand for finished beef during the recession
produced the longest and most severe period of losses in
the cattle feeding sector on record.
• Even if there are economic losses to the cow-calf or feedlot
enterprise, cattle production still generates value added
economic activity. Inputs to production are still purchased,
labor and services are still used, and cattle are still
transported, sold and processed.
1
All cattle on feed, January (1,000 head)
ISU Estimated Returns to Finishing Yearling Steers
Sources:
Economic Importance of Iowa’s Cattle Industry, 1999, updated by Shane Ellis at Iowa State University,
2011; Iowa Estimated Returns
Beef Industry Statistics – Production
288 | Context | Iowa AgriScope 2030

Beef Industry Statistics – Industry Structure
• The beef industry structure is shaped like a funnel, therefore the ability to affect change gets increasingly difficult as the number
of decision makers increase.
Source: Economic Importance of the Iowa’s Cattle Industry, 2005
1
Over 775,000 farms in the U.S. with Beef Cows
28% of the cows are in 600,000 herds with <50 cows with an average inventory of 15 head
264 feedlots with 16,000 head capacity or more marketed 60% of
the fed cattle in 2004
85% of the fed cattle are marketed by 2,176
feedlots that have 1,000 head or more capacity
3 packers process 75% of the steers and heifers in the US
289 | Context | Iowa AgriScope 2030

Beef Industry Economic Impact
• The estimated $2.13 billion of gross output from beef
production activity supports an additional $2.93 billion of
economic output for a total of $5.06 billion of direct and
indirect economic activity throughout the Iowa economy.
• While much of the impact is concentrated in the agricultural
sectors, the personal income linkages in the economy
results in major economic effects also being distributed in
the services and trade sectors.
• The estimate of $240 million of direct income to beef
producers is linked to an additional $690 million of income
throughout the Iowa economy for a total impact of $930
million of personal income.
– Again, the service and retailing sectors receive strong
stimulus from the initial effect of income earned in the beef
sector.
• The estimated $350 million of value-added for beef
production is linked to $950 million of additional indirect and
induced value-added, for a total of $1.4 billion of value-
added in the state's economy.
2
Economic importance of Iowa cattle industry, 2004
Source: Economic Importance of the Iowa’s Cattle Industry, 2005
290 | Context | Iowa AgriScope 2030

Beef Industry Economic Impact - Employment
• Assigning job numbers to the livestock producing sector is
a little more difficult.
• There are 25,000 Iowa farms with beef herds. However,
18,000 have herds of less than 50 head, clearly less than
full time employment.
• A more appropriate measure would be to use an estimate
of full time employment, but acknowledge there are
additional farms with part time beef enterprises.
– It is important to note that the smaller herds are in rural
Iowa and the part time jobs they produce are important to
rural Iowa.
• The nearly 12 million hours associated with the $2.13 billion
of cattle marketings imply about 6,000 direct jobs in beef
producing activities involving farm workers as well as farm
proprietors. This number is consistent with aggregate
budget estimates of total number of hours needed to
produce 1.498 million fed cattle per year.
• Since the other non-agricultural sectors give credit for jobs
based on part-time employment, it seems appropriate to
give some credit for livestock enterprises that are a
significant activity on Iowa farms.
2
Economic importance of Iowa cattle industry, 2004
• We therefore use an estimate of about 10,000 direct jobs
involved in Iowa livestock production.
• These direct jobs at the farm level support an additional
26,500 jobs throughout the rest of the economy, including in
the meat processing sector.
• The distribution of employment impacts is similar to the
pattern for the other indicators in that effects are present in
all parts of the economy. The service sector provides the
largest number of secondary jobs followed by Finance,
Insurance and Real Estate and Retailing.
Source: Economic Importance of the Iowa’s Cattle Industry, 2005
291 | Context | Iowa AgriScope 2030

Beef Industry Economic Impact - Employment
• The higher number of jobs in services combined with the
lower levels of income suggests that many of these
secondary jobs are less than full-time.
• Estimates of the impacts of the Iowa beef industry include
forward linkages into the meatpacking industry.
• By moving past the farm gate, additional economic
activities including transportation, processing, and handling
are captured in the economic model and presented in the
estimates.
• Based on levels of commercial cattle slaughter in Iowa and
on U.S. averages, we estimate about 2500 workers are
employed in cattle processing in the state.
• An estimated $65 million of wage and salary income is paid
to workers in the cattle slaughtering and processing
sectors.
– Since cattle processing and slaughtering facilities tend to
be located near the source of raw materials, this stage of
the beef industry has the additional benefit of providing
needed jobs in rural labor markets.
2
Economic importance of Iowa cattle industry, 2004
** From an employment standpoint, the numbers employed
may not have changed much since 2004, however
efficiencies have. There is more beef being produced per
labor hour.
Source: Economic Importance of the Iowa’s Cattle Industry, 2005,
updated by Shane Ellis at Iowa State University, 2011
292 | Context | Iowa AgriScope 2030

Beef Industry Value Chain Summary
Iowa cattle industry flowchart
3
2010 estimate: 780,000 calves
2010: 2,021,000 head
Source: Economic Importance of the Iowa’s Cattle Industry, 2005,
updated by Shane Ellis at Iowa State University, 2011
293 | Context | Iowa AgriScope 2030

Beef Industry Value Chain Summary
• The estimated total value of cash inputs used in Iowa sum to
an estimated $921.7 million or $1.025 billion if a $9.00 per
hour average value is assigned to the 11.5 million total hours
of labor used in cattle production in Iowa.
– These hours are based on an estimate of average hours of
labor used per calf until marketed by existing producers in
Iowa.
• Total fixed costs including depreciation and interest on assets
is $229.342 million.
• The residual value between inputs and marketings can be
described as returns to unpaid labor and management.
• The largest single category of expenditure is feed costs.
– With 1.5 million fed cattle sold annually, 107.5 million bushels
of corn valued at $258 million are used in Iowa.
– 2010 Update: 2.026 million fed cattle sold, 145.4 million
bushels of corn, or corn equivalents, valued at $872 million
were used in Iowa.
– Feed supplements and additives represent another $56.5
million of purchased inputs from suppliers in Iowa.
– The use of this scale of feed supplements helps support
soybean prices and the soybean processing industry, as well
as local elevators and transportation services based in rural
areas.
3
Iowa cattle industry flowchart
• Forward linkages can be traced to the slaughter and
processing level for impact on the state's economy.
• Data from the American Meat Institute indicate that, on
average, the cost of live animals represents 89% of the total
value of the processor's product (AMI).
• The remaining margin is for other inputs including labor and
return on investment.
• The final demand uses of processed cattle products are an
estimated 53.6 million pounds going into foreign markets
and 877 million pounds into domestic markets.
2010 estimate: 780,000 calves
2010: 2,021,000 head
Source: Economic Importance of the Iowa’s Cattle Industry, 2005,
updated by Shane Ellis at Iowa State University, 2011294 | Context | Iowa AgriScope 2030

Beef Industry Opportunity Outlook
• The beef industry is also slowly transforming from a commodity to a production orientation with increased interest in value-based
marketing and retained ownership.
– These trends will place greater value on superior cattle and on information systems that will accurately relate value through the marketing
channel.
– New products are playing an increasingly important role in beef sales.
– These new products will have to meet the requirements for fresh, processed, HRI (Hotel, Restaurant, and Institutions), retail and international
markets which are expected to have greater share of branded or labeled products.
– As a result, the different segments of the marketing channel will communicate more closely with one another. This communication and demand for
information will be accelerated by the implementation of the National Animal Identification System (NAIS).
– Once the infrastructure is in place to support the NAIS, the cost of moving data with cattle will be greatly reduced and become the standard for
doing business.
– The additional data handling and processing associated with these new markets will mean additional value-added jobs in Iowa's agri-industries.
• The beef industry is also quickly evolving to an integrated forage, grain, and beef system approach to production.
– Once the market place identifies the genetic characteristics of cattle to fill a particular market niche, the genetics will determine the needed
nutrition, grazing and feeding program.
– Using this system approach to beef production, Iowa producers will remain competitive in the cattle industry and the global protein market.
– An emerging element in the Iowa production system is feeding of distillers grains from the rapidly growing ethanol industry.
• Distillers grains are an excellent feed for beef cattle and an item that can be costly to dry and ship for the ethanol producer if there is not a
local market. Iowa is well positioned to grow the cattle feeding sector in tandem with the ethanol industry creating a win-win scenario for
corn and cattle producers while creating jobs in rural communities
4
Sources: Growing Iowa’s Cattle Industry, Are Iowa’s Feedlots Competitive,
Iowa Beef Center; Economic Importance of the Iowa’s Cattle Industry,
2005; The environmental impact of U.S. beef production: 1977 compared
with 2007, Journal of Animal Science, July 2011
295 | Context | Iowa AgriScope 2030

Beef Industry Opportunity Outlook
• The decline in cow numbers, especially in the southern U.S., opens up big opportunities for Iowa’s cattle industry.
• Existing efficient beef producers will continue to be competitive. Successful beef enterprises in the future will depend on the
manager's ability to develop effective profitable business plans, implement sound plans efficiently, and analyze ongoing
information to determine if the operation is on the chosen path.
• Iowa is competitive compared to some regions and some cattle. However buy and sell price are big determinants of profit. Iowa
is competitive due in part to:
– Lower cost of feed and cost of gain (Cheap feed alone is not enough!)
– Higher quality grade cattle
– Higher yield grade cattle
– However, buy and sell price are big determinants of profit
• Modern beef production (2007) is much more efficient than the equivalent system in 1977.
• Modern beef production (2007) requires considerably fewer resources than the equivalent system in 1977.
– 13% fewer animals in 2007 produced 13% more beef than in 1977
– 20% less feedstuffs
– 14% less water
– 30% less land
– 9% less fossil fuel energy
– 18% decrease in total carbon emissions (methane, nitrous oxide and carbon dioxide)
4
Sources: Growing Iowa’s Cattle Industry, Are Iowa’s Feedlots Competitive, Iowa Beef Center; Economic Importance of the Iowa’s
Cattle Industry, 2005; The environmental impact of U.S. beef production: 1977 compared with 2007, Journal of Animal Science, July
2011; Environmental Sustainability of Beef Production Has Improved Considerably over Last 30 Years, WSU Expert Says,
Washington State University, July 2010
296 | Context | Iowa AgriScope 2030

Beef Industry Opportunity Outlook –
Emerging Issues Facing the Industry
• The beef feedlot sector continues to consolidate into fewer and larger operations at the national level and to a lesser extent in
Iowa.
• The cow-calf sector remains quite dispersed as cow herds tend to locate near available forages.
• The beef industry structure is shaped like a funnel, therefore the ability to affect change gets increasingly difficult as the
number of decision makers increase.
• The environmental impact of beef production is another emerging issue that is not independent of the economic impact of the
industry.
– The beef industry is concerned with the significant loss of pastures. The industry acknowledges that there is
environmental value in keeping marginal land in pasture.
– Because of differences in climate and cropping patterns, uniform federal environmental standards may have regional
impact on cattle production.
– In addition, state and county environmental and zoning regulations can greatly alter the competitive position of the local
beef industry.
– Cost benefit analysis to evaluate the trade-offs between restrictions, regulations, or incentives to alter production
practices and the competitiveness of individual farms will be important.
4
Source: Economic Importance of the Iowa’s Cattle Industry, 2005
297 | Context | Iowa AgriScope 2030

Beef Industry - References
• Iowa Concentrated Animal Feeding Operation Air Quality Study, February 2002, Iowa State University and the University of
Iowa Study Group http://www.public-health.uiowa.edu/ehsrc/cafostudy.htm
• Economic Importance of Iowa’s Cattle Industry, Dept of Economics, ISU, 1999
http://www2.econ.iastate.edu/outreach/agriculture/AgImpactStudy/cattle/state.htm
• Economic Importance of Iowa’s Cattle Industry, Dept of Economics, ISU 2005
http://www.docstoc.com/docs/37742929/ECONOMIC-IMPORTANCE-OF-IOWAS-CATTLE-INDUSTRY
• 2007 Census of Agriculture http://www.agcensus.usda.gov/Publications/2007/Full_Report/usv1.pdf
• USDA Cattle Report
• Iowa Estimated Returns
• National Cattlemen’s Beef Association http://www.beefusa.org/beefindustrystatistics.aspx
• USDA-Livestock & Poultry World Markets and Trade http://www.fas.usda.gov/psdonline/circulars/livestock_poultry.pdf
• US Meat Export Federation (Statistics provided by US Government and Compiled by the USMEF) http://www.usmef.org/news-
statistics/statistics/
• Growing Iowa’s Cattle Industry, Are Iowa’s Feedlots Competitive, Iowa Beef Center
http://www.iowabeefcenter.org/Docs_coproducts/Growing-Iowa_Competitive-Feedlots.pdf
• The environmental impact of U.S. beef production: 1977 compared with 2007, Journal of Animal Science, July 2011
http://jas.fass.org/content/early/2011/07/29/jas.2010-3784.abstract
• Environmental Sustainability of Beef Production Has Improved Considerably over Last 30 Years, WSU Expert Says, Washington
State University, July 2010 http://cahnrsnews.wsu.edu/2010/07/14/environmental-sustainability-of-beef-production-has-
improved-considerably-over-last-30-years-wsu-expert-says/
298 | Context | Iowa AgriScope 2030

Value Chain & Competitiveness Assessment
299 | Context | Iowa AgriScope 2030
Dairy
Economic Importance
Value Chain Summary
OpportunityOutlook
IndustryStatistics

Dairy Industry Statistics - Consumption
• Dairy product consumption has changed substantially over
the past several decades. These changes have important
implications for all involved in the production, processing,
and marketing of milk and milk-based products.
• There has been a continual downward trend in per capita
sales of total beverage milk.
– Per capita sales of whole milk, flavored whole milk, and
buttermilk have all decreased significantly since 1975.
– Moreover, per capita sales of whole milk and buttermilk
during 2009 were less than 50% of the level recorded in
1975.
– While lower fat fluid products posted substantial gains during
much of this time period, per capita sales have declined in
recent years for all items except lower fat milk.
• Iowa ranks 8th in total dairy products processed.
– 7th in cheese production
– 6th in cottage cheese production
– 6th in production of American cheese
– 4th in ice cream production
1
Source: Marketing Service Bulletin: Per Capita Consumption of Selected Dairy Product, Federal Milk Market Administrator, July 2004, USDA
U.S. per capita sales of fluid dairy products
300 | Context | Iowa AgriScope 2030

Dairy Industry Statistics - Consumption
• The change in fluid milk sales has been subtle in the past
twenty years. Most categories of milk have held steady
sales in term of quantity sold.
• Reduced fat milk replaced a large market share of whole
milk.
1
U.S. total sales of fluid dairy products
Source: Marketing Service Bulletin: Per Capita Consumption of Selected Dairy Product, Federal Milk Market Administrator, July 2004, USDA
301 | Context | Iowa AgriScope 2030

Dairy Industry Statistics - Consumption
• Cheese consumption has exhibited large gains.
• To emphasize this point, the milk equivalent of cheese
consumption has been greater than fluid milk and
cream since the late 1980s.
– Mozzarella has posted the largest gains among hard
cheeses with consumption rising from 2.12 pounds per
person in 1975 to 11.3 pounds during 2010.
• Yogurt and cream products also posted significant per
capita consumption gains during this time period.
1
U.S. per capita consumption of cheese pounds
Source: Marketing Service Bulletin: Per Capita Consumption of Selected Dairy Product, Federal Milk Market Administrator, July 2004, USDA
302 | Context | Iowa AgriScope 2030

Dairy Industry Statistics - Consumption 1
Source: Marketing Service Bulletin: Per Capita Consumption of Selected Dairy Product, Federal Milk Market Administrator, July 2004, USDA
US per capita consumption of miscellaneous dairy products US per capita consumption of selected class II products
303 | Context | Iowa AgriScope 2030

Dairy Industry Statistics – Number and Size of Farms
• US dairy production has tended to become concentrated in
fewer counties
• 250 counties produce 75% of the US milk supply (2002)
• Fewer than 15 counties (shown in red) account for about
25% of all milk produced in the country and only one of
those counties lies east of the Mississippi river. (2002)
• Past – Traditional family farm herd with less than 100 cows
dominated the Iowa dairy production sector
• Most recent decade – share of production originating on
larger operations has grown rapidly
• 1999 – farms with < 100 cows produced about 60% of all
Iowa milk
• 2001 – farms with < 100 cows produced about 50% of all
Iowa milk
1
The 250 US Counties that product 75% of the milk
Sources: The Economic Importance of the Iowa Diary Industry, ISU, 2003
304 | Context | Iowa AgriScope 2030

Dairy Industry Statistics - Production
• The dairy industry is one of the six largest commodities
in Iowa. (2009)
• Iowa has had remarkably stable milk production in the
past decade.
• Annual production has remained in the 3.8 – 4.3 billion
pound range.
• Iowa ranks 12th in total pounds of milk produced - 4.34
Billion: pounds of milk produced (2010)
– 12th in milk cow numbers
– 12th in production per cow
– 9th in fluid milk bottling
– 8th in total dairy products processed
– 7th in number of dairy herds
– 7th in cheese production
– 6th in cottage cheese production
– 6th in production of American cheese
– 4th in ice cream production
1
Total milk production in Iowa
Sources: USDA – NASS; Iowa Dairy Facts, Iowa State Dairy Association; The
Economic Importance of the Iowa Diary Industry, ISU, 2003; Bureau of Economic Analysis
305 | Context | Iowa AgriScope 2030

Dairy Industry Statistics – Number, Size & Production 1
• The number of producing dairy cows has been fairly
steady the past 5 years.
– 209,000 milk cows in production (2010)
• Steady increases in production per cow have
permitted a smaller number of cow herds to produce
a constant quantity of milk.
– 1,922 number of dairy farms (2010)
• Iowa ranked 12th in the nation in average milk
production per cow at almost 21,000 pounds of milk
produced per cow (2010)
− This benchmarks quite favorably against virtually
all of the surrounding states – including dairy
states such as MN & WI.
– The steadily increasing production per cow has
occurred as a result of changing technology and
intensity of management in Iowa operations.
Number of dairy cows in Iowa
Average Number of cows per farm in Iowa
Sources: USDA – NASS; Iowa Dairy Facts, Iowa State Dairy Association; The Economic Importance of the Iowa Diary Industry, ISU, 2003;
306 | Context | Iowa AgriScope 2030

Dairy Industry Statistics - Production
• Dairy production has historically been an important farm
enterprise in Iowa.
• Iowa ranks 12th in US Production (2002) and has held that
position for the past 5 years.
– 2010 - Iowa still ranks 12th in milk production
• Although heaviest production occurs in the northeastern
and northwestern portions of the state, there is some level
of dairy production activity in 90% of Iowa counties. (2002)
• Iowa produces about 30% of the milk produced in the
Central Order –more than any of the 6 other states. (2002)
• According to 2009 data from the USDA, the rankings have
changed a bit.
1
2002 Milk production ranking top ten states highlighted
Central federal order milk marketings by county, Dec 2001
Sources: USDA – NASS; Iowa Dairy Facts, Iowa State Dairy Association; The Economic Importance of the Iowa Diary Industry, ISU, 2003, USDA
CA 1
WI 2
NY 3
ID 4
PA 5
MN 6
TX 7
MI 8
NM 9
OH 10
307 | Context | Iowa AgriScope 2030

Dairy Industry Economic Impact
• The estimated $550 million of gross output from dairy
production activity is linked to approximately $1.45 billion
sales in the state’s dairy processing sectors.
• The total sales from these direct components of dairy
production & processing sectors support additional input
purchases, spending on transportation & other services, as
well as consumer-related purchases worth $1.2 billion of
direct & indirect sales throughout the Iowa economy.
– Caution – value of the dairy is counted twice – at the
farm level and as part of the total value of dairy
products when it is sold from the processor.
• Effects of the dairy industry are distributed throughout the
economy, benefiting rural and urban areas including
services & trade sectors.
• The estimate of $230 million of direct income to dairy
producers is linked to an additional $160 million of earnings
to workers in dairy processing and to $342.4 of additional
income throughout the Iowa economy for a total impact of
$732.5 million of personal income.
2
• The value added measure is a good indicator of net
economic activity as only the net incremental value is
summed at each transaction to avoid double counting. The
estimated $253 million of value added for dairy production
and $335.1 million in dairy processing is linked to $535.9
million of additional indirect & induced value added activity
in the state’s economy for a total value added of $1.124
million. The distribution of these values is among different
sectors in the table above.
Economic importance of the Iowa dairy industry, 2002
Sources: The Economic Importance of the Iowa Diary Industry, ISU, 2003; IMPLAN Model
308 | Context | Iowa AgriScope 2030

Dairy Industry Economic Impact – Employment & Earnings
• There are more than 26,000 jobs involved in some aspect
of the dairy industry--including jobs on dairy farms, dairy
processors, and other services that benefit and aid the
dairy industry.
• The 2,390 farms in 2007 and 2,400 direct jobs in the dairy
producing activities involve farm workers as well as farm
proprietors and can be interpreted as FTE positions.
• These 2,400 jobs at the farm level along with the 4,366 at
the processing level generate a chain of economic activity
that supports an additional 12,555 jobs throughout the rest
of the economy.
• Total employment in dairy processing has stayed relatively
constant over the past 20 years, although the composition
of that employment has changed.
– 4,366 workers are employed in dairy processing activities
with the majority of these workers in ice cream production.
(2000)
– In the past (1980), fluid milk processing used to be the
largest category and is now the 3rd largest employer of
dairy processing workers.
2
• An estimated $160 million of wage and salary income is
paid to workers in these sectors. Since dairy processing
facilities tend to be located near the source of the raw
materials, this stage of the dairy industry has the additional
benefit of providing well-paying jobs in rural labor markets.
Employment in Iowa’s dairy processing industries
Earnings in Iowa dairy processing industries
Sources: The Economic Importance of the Iowa Diary Industry, ISU, 2003; IMPLAN Model
309 | Context | Iowa AgriScope 2030

Dairy Industry Value Chain Summary 3
Iowa milk production flowchart, 2001
2010 production is near 2001 levels, therefore the quantities will be about the same. However, commodity values have changed and are
probably near double those noted in the flowchart.
310 | Context | Iowa AgriScope 2030

Dairy Industry Value Chain Summary
• The cost of production and input usage is calculated for the
Iowa dairy numbers based on average costs of production
in the ISU budgets. Based on statewide numbers on cows
and milk production, totals of feed use, other direct inputs,
annual depreciation on capital investments, labor
requirements and returns to management and capital are
generated.
• The right hand side of the schematic represents purchased
cash inputs used by producers at the farm level. The prices
and values in this section are intended to reflect long-run
conditions and prices in the industry and are consistent
with projections made by The Food and Agricultural Policy
Institute (FAPRI).
• The estimated total value of direct inputs used in Iowa sum
to $242.4 million. Additional costs for depreciation of fixed
assets and facilities total an estimated $52.4 million. Labor
and management expenses add an additional $115.2
million of costs for a total of $410 million of aggregate input
costs used in dairy production in Iowa. The residual value
between inputs and marketings can be described as
returns to unpaid labor and management.
3
Iowa milk production flowchart, 2001
• The largest single category of expenditure is feed costs.
• Annually, an estimated 20.1 million bushels of corn valued at
$44.2 million are used.
• 2011 value of corn or corn equivalent used is closer to $120
million
• Other feeding costs include an estimated 2.9 million tons of
hay and silage representing another $135.1 million of value.
• Forward linkages can be traced to further processing
activities in the form of cheese, butter, ice cream, dried milk
and fluid milk. The upper portion of the schematic illustrates
the flow of milk production into various forms of further
processing.
311 | Context | Iowa AgriScope 2030

Dairy Industry Outlook – Risks to Growth
• The Iowa dairy industry is facing numerous policy issues. How these issues are addressed will affect the future growth and
development of Iowa’s dairy industry
– Environmental permitting for production sites (State level regulations will only affect confinement operations that are larger
than 700 cows, but will deal with issues such as runoff, odor, and other factors that create potential conflicts in site selection).
– Federal Milk Market Order pooling/Class I utilization issues
– Federal Farm Program issues
4
Sources: The Economic Importance of the Iowa Diary Industry, ISU, 2003312 | Context | Iowa AgriScope 2030

Dairy Industry Outlook – Risks to Growth
• Environmental permitting for production sites
– Iowa is expected to have the capacity to effectively utilize the animal waste generated by an expanded dairy production base. CAFO
regulations as they are presently configured would allow added manure application to replace the plant nutrients removed in the grain
exported to other states & countries.
– Will deal with issues such as runoff, odor, other factors that create potential conflicts in site selection.
– State permitting process has been streamlined and in some ways made more flexible under recent legislation.
– Implementation of a point system for evaluating permit applications submitted by producers allows proposed projects to be more
closely tailored to specific circumstances and conditions existing at the site.
– The ability to permit new sites and conduct expansions on existing sites cannot be underestimated as a force that will impact the
future growth & success of the dairy industry in Iowa.
– The number of dairy farms has been declining for decades.
– The average size of an Iowa operation has had to increase to maintain total production.
– The existing producer demographics imply that these trends will accelerate going forward, otherwise Iowa production can be
expected to decline.
– To the degree that permitting becomes a significant barrier to larger operations or expansions, current production levels will be difficult
to maintain.
– The CAFO regulations favor regions where there is less chance that there will be nutrient buildup in the soils when animal waste is
applied over an extended time period.
– Such buildup is much less likely to occur in regions where significant quantities of grain are produced and exported for use outside
the producing area. This is currently the case for much of the grain produced in Iowa.
– Iowa, unlike production areas that import feedstuffs, will be able to apply animal waste to replenish nutrients in the harvested grains
that is exported or shipped to domestic markets outside the state.
– The increased flexibility in the state environmental permitting process provided by the point system should also make selecting and
permitting sites more straightforward.
– This approach should provide applicants with the ability to better adapt, but it still requires that permits be re-evaluated if there are
significant expansions to existing facilities.
4
Sources: The Economic Importance of the Iowa Diary Industry, ISU, 2003313 | Context | Iowa AgriScope 2030

Dairy Industry Outlook – Risks to Growth
• Federal Milk Market Order pooling/Class I utilization issues
– New pooling requirements will make it more difficult to pool milk on the Central FMMO without actually diverting milk to
Class I uses. This combined with a rule prohibiting pooling on both a state order and a federal order is expected to raise
Class I utilization %age in the Central FMMO. These changes in the FMMO pooling requirements have not been
implemented long enough to document their impact, but it is estimated that they will increase producer prices by 10-15
cents per cwt.
• Federal Farm Policy Issues
– Current federal farm policy appears to favor states where average herd size is smaller. The average payment per cwt.
under the deficiency payment program would be much higher for herds with fewer than 200 cows. This would tend to
benefit many of the smaller existing herds and smaller scale start-ups or small-scale expansions. While this is favorable for
many current producers it may be of much less benefit for some of the larger operations that are attempting to expand,
operations that have already expanded, and large-scale start-ups. The potential impacts of non-government voluntary herd
buy-out are uncertain at this time. There are provisions for regional caps on the buy-out to gear the production growth since
2000 to the participation rates in different regions. Current milk supply is tight thus even relatively modest reductions in
production in Iowa under the proposed plan could disadvantage Iowa in the longer run.
4
Sources: The Economic Importance of the Iowa Diary Industry, ISU, 2003314 | Context | Iowa AgriScope 2030

Iowa Dairy Production - References
• USDA – NASS
• USDA
• Iowa State Dairy Association www.iowadairy.org
• The Economic Importance of the Iowa Dairy Industry, Iowa State University, 2003
http://www.econ.iastate.edu/sites/default/files/publications/papers/p7629-2003-06-01.pdf
• Marketing Service Bulletin: Per Capita Consumption of Selected Dairy Products, Federal Milk Mark Administrator, July 2004
– http://www.fmmacentral.com/PDFdata/msb0704.pdf
• Bureau of Economic Analysis
315 | Context | Iowa AgriScope 2030

Value Chain & Competitiveness Assessment
316 | Context | Iowa AgriScope 2030
Eggs
Economic Importance
Value Chain Summary
OpportunityOutlook
IndustryStatistics

Egg Industry Statistics - Consumption
• Per capita annual U.S. egg consumption peaked in
1945 at 403, reached its lowest level in 1991 at 235 and
has increased steadily until 2001, where it has leveled
off at 255-257 eggs per person
– Increasing population and rising per capita consumption
have enabled the industry to expand production 14%
from 1998 to 2006.
• Growth in egg consumption over the past decade
occurred primarily in egg products rather than shell
eggs
• In 1990, approximately 20% of egg production was
consumed as egg products. By 2000, this figure had
grown to 29%, where it has remained.
• On a per capita basis, annual shell egg consumption
declined 6% from 1990 to 2007 while product egg
consumption increased 51%.
• Production for shell egg consumption has increased
18% or about 1% per year between 1990 & 2007.
• Product egg production has increased 89% during that
same period.
1
U.S. per capita egg consumption by processing type
Source: Economic Importance of the Iowa Egg Industry, 2008
317 | Context | Iowa AgriScope 2030

How the Industry is Set-Up
• Processing is usually integrated with the production
facility.
• Rapid expansion of the egg industry in Iowa has taken
place primarily in large integrated laying and processing
facilities.
• About 65% of Iowa egg production goes into egg-
breaking facilities for further processing. The additional
processing at the egg-breaking facilities represents
value-added agricultural activity.
• And the remaining portion goes into retail outlets as
shell eggs.
# of Farms & Size of Farms
• Based on aggregate budgeting methods, the full-time
employment equivalent required to produce 13.9 billion
eggs (2007) is about 480 workers.
• This number is less than the 1,934 farms in Iowa that
are listed as producing eggs in 2002.
• The 1997 Census of Ag listed 2,015 farms with layers.
• In both years, a large majority of this total number is
composed of farms with less than 100 layers.
• At the other end, there were 46 farms in Iowa with over
100,000 layers in 2002, up slightly from 41 farms of this
size in 1997.
1
Source: Economic Importance of the Iowa Egg Industry, 2008
Egg Industry Statistics – Structure & Farm Size
318 | Context | Iowa AgriScope 2030

Egg Industry Statistics – Production
• Egg production in the U.S. has slowly increased over the
past 40 years.
• The egg production industry in Iowa dropped off
dramatically in the 1950s and stayed very small until the
1990s.
• Iowa was the largest egg producing state prior to 1958
when farm flocks dominated the industry and the state
became number one again in 2001.
• Since 1990, the egg production industry in Iowa has rapidly
grown to the point that Iowa is now #1 in the U.S. in layer
numbers (~52.7 million layers in Iowa producing 13.9 billion
eggs, per USDA estimates in 2007).
• Iowa also has the fastest growing egg production industry
– Increasing 150% between 1997 and 2006.
– In 2007, Iowa produced more eggs than the second (Ohio)
and third (Pennsylvania) largest states combined and more
than the 30 smallest producing states combined.
• Based on monthly average prices, the total market value of
egg production in Iowa was about $825 million in 2007.
This represents 15.4% of total U.S. production, according
to the USDA.
Annual egg production – U.S. vs. Iowa
1
Sources:
Economic Importance of the Iowa Egg Industry, 2008 &
Iowa Concentrated Animal Feeding Operation Air Quality Study, 2002
319 | Context | Iowa AgriScope 2030

Egg Industry Statistics – Production
• Of the 5 states, only Iowa is still growing in egg
production.
• Since 1990, Iowa’s layer inventory increased over 10%
per year and egg production increased 11% per year.
• This expansion caused Iowa’s production share to
increase from slightly more than 2% in 1990 to more
than 15.4% by 2007.
Iowa egg production and share of U.S. production
Market share of the top 5 egg producing states, 1998-2007
1
Source: Economic Importance of the Iowa Egg Industry, 2008
320 | Context | Iowa AgriScope 2030

Egg Industry Economic Impact
• Iowa egg industry is responsible for generating
economic effects beyond farm & processor. The
purchases made and incomes earned in these core
sectors spill over and impact the rest of the regional
and state economy via the economic linkages.
• The market value of the $825 million for these eggs
incorporates the value of the intermediate poultry
production.
• The direct labor inputs are 2,870 jobs at the hatcheries,
production, and processing levels.
• When all direct and secondary effects are considered,
the total impacts include $1.82 billion of sales, $281.3
million of personal income, $475.7 million of
contribution to the GSP and about 7,600 jobs. Based
on average state tax yields per income, the Iowa egg
industry generates $18.3 million of state general tax
revenues annually.
• These numbers reflect a substantial increase in impacts
since 2002 because the level of annual egg production
increased from 9.8 billion to 13.9 billion in 2007.
2
Economic importance of egg industry in Iowa
Source: Economic Importance of the Iowa Egg Industry, 2008
321 | Context | Iowa AgriScope 2030

Egg Industry Economic Impact - Employment
• Rapid expansion of the egg industry in Iowa has taken place primarily in large integrated laying and processing facilities.
• The growth of Iowa egg industry is positive employment news for rural areas of Iowa.
• There are about 1,800 employees at 12 egg processing facilities (per Iowa Workforce Development). Most concentrated in north-
central Iowa, where high levels of corn production are also located. Annual wage & salary incomes for these workers total about
$54 million.
• Significant rural employment also occurs at the 13 hatcheries in Iowa, which employ about 531 workers (Iowa Workforce Dev).
This generates about $16.6 million of wages and salary.
• These numbers reflect an employment growth of about 15% since 2002 for this segment of the Iowa egg industry.
• Total hatchery, production, and processing workers were ~2,870 in 2007.
– Generating over $123 million in direct payroll.
– Multiplier impacts on the Iowa economy are even more impressive
• Total labor income of $281.3 million to nearly 7,600 total jobs and
• Value added of $475.7 million attributable to direct and indirect impacts of the egg industry on the Iowa economy
2
Source: Economic Importance of the Iowa Egg Industry, 2008
322 | Context | Iowa AgriScope 2030

Egg Industry Value Chain Summary
Iowa egg production and processing sector
3
Source: Economic Importance of the Iowa Egg Industry, 2008
323 | Context | Iowa AgriScope 2030

Egg Industry Value Chain Summary
• Because of the close integration between growers and
processors in the Iowa egg industry, the production and
processing component are considered as the core of
the industry.
• The backward linkages consist of suppliers of inputs
including feed grains, supplements, veterinary and
utilities.
• Based on 2007 levels of production, ~ 50 million
bushels of corn and 453,000 tons of soybean meal
were used by the 52.7 million layers in Iowa.
• Total feed costs were ~ $250.3 million based on prices
of $3.12/bushel corn and $209/ton SBM and 2007
prices for other ingredients.
• At current feed prices ($6/bushel corn, $330/ton SBM)
the value of the feed used in egg production is now
closer to $449 million. (2011)
3
Iowa egg production and processing sector
Source: Economic Importance of the Iowa Egg Industry, 2008 &
Ellis, Shane, Iowa State University, Extension Livestock Economist
324 | Context | Iowa AgriScope 2030

• Continued sustainability and growth of Iowa’s egg
sector will depend upon the state’s competitiveness
compared to other regions, especially those closer to
major market centers.
• The primary advantage Iowa producers enjoy over
other egg producing regions is access to lower cost
feed. Feed is the largest component, representing
~59% of production costs.
• Consequently feed prices have a dramatic impact.
Iowa has a feed price advantage due to its extensive
farmland and will likely maintain that advantage for the
foreseeable future.
• Higher oil prices have resulted in additional cost of feed
transportation from the Midwest to corn deficient
regions.
• But feed prices have increased more in corn importing
regions.
3
• The largest non-feed cost items provide the greatest
opportunity for producers in other regions to compensate
for Iowa’s feed cost advantage: Pullet depreciation, fixed
asset depreciation, labor & energy costs combined.
• Production efficiency is primarily related to diet,
environmental conditions, genetics and other factors
controlled by management. Much of which would be short
lived.
Distribution of Iowa egg production costs
Source: Economic Importance of the Iowa Egg Industry, 2008
Egg Industry Value Chain Summary
325 | Context | Iowa AgriScope 2030

Egg Industry Opportunity Outlook –
Economic Impact of 10% Growth
• Based on recent trends, growth of an additional 10% is a
feasible and reasonable goal
• An additional 1.4 billion eggs marketed at $83 million would
directly and indirectly generate additional impacts of $184
million of sales, $28.4 million of incomes, $48 million of
contribution to the GSP and 767 jobs
• Factors accounting for the phenomenal growth of the egg
industry in Iowa in recent years
– Per capita egg consumption increased from 235 in 1991 to
257 by 2001, a level at which it has stabilized Growing
population and per capita egg consumption have supported
a 1.7% annual expansion rate in egg production over those
18 years. During this same period, Iowa egg production
has increased almost six fold.
– Iowa has a competitive advantage due to low feed costs.
Feed costs represent over 60% of costs to produce a
dozen eggs and most competing states face higher feed
costs than Iowa.
– Although Iowa does market shell eggs in spite of
transportation cost disadvantage in shipping shell eggs to
major metro centers on the east and west coasts, Iowa has
capitalized on the rapidly growing market for breaker or
“processed” eggs, which incur lower transportation costs
4
Economic impact of a 10% growth in Iowa’s Egg Industry
• Trends that have encouraged investment in Iowa egg
production
– Capture its significant feed cost advantage
– Increased proportion of processed eggs
– Improved transportation
– Modern facilities
Source: Economic Importance of the Iowa Egg Industry, 2008
326 | Context | Iowa AgriScope 2030

• Iowa egg prices are consistently below the national
average (recently fluctuating between 29 and 60 cents
per dozen and displaying a slight upward trend).
• The spread between the Iowa price and the national
average price ranged from 6 to 9 cents per dozen and
has average 7.7 cents per dozen since 2000.
• Industry was relatively unprofitable in 2004-2006, but
prices have been stronger in 2007 and at profitable
levels in spite of higher feed costs.
4
Source: Economic Importance of the Iowa Egg Industry, 2008
Egg Industry Opportunity Outlook – Egg Prices
327 | Context | Iowa AgriScope 2030

Egg Industry Opportunity Outlook – Threats to Growth
• Threats to Iowa’s production cost advantage would likely be:
– Increased transportation costs (to major population centers is a growing hindrance to competing in those markets). This is
the primary competitive disadvantage.
– Technological advances that improve feed efficiency. Any advantages created by such changes would likely be short lived,
as Iowa producers would be able to adopt these changes as well.
– Industry shifts that reduce pullet costs. Any advantages created by such changes would likely be short lived, as Iowa
producers would be able to adopt these changes as well.
• Other factors that create uncertainties:
– Animal health issues
– Animal welfare guidelines
– Flock certification processes
4
Source: Economic Importance of the Iowa Egg Industry, 2008
328 | Context | Iowa AgriScope 2030

Egg Industry - References
• Economic Importance of the Iowa Egg Industry, January 2008, Dept of Economics, ISU
http://www.econ.iastate.edu/sites/default/files/publications/papers/paper_12879.pdf
• Iowa Concentrated Animal Feeding Operation Air Quality Study, February 2002, Iowa State University and the University of Iowa
Study Group http://www.public-health.uiowa.edu/ehsrc/cafostudy.htm
329 | Context | Iowa AgriScope 2030

Value Chain & Competitiveness Assessment
330 | Context | Iowa AgriScope 2030
Turkeys
Economic Importance
Value Chain Summary
OpportunityOutlook
IndustryStatistics

Turkey Industry Statistics – World Markets and Trade
• The U.S. is the world’s largest turkey producer and
exporter, contributing 55% of the world’s total
production and 25% of the world’s total turkey exports.
(2009)
– In 2010, the U.S. contributed 49.5% of the world’s
total production.
• U.S. turkey exports account for 9% of its total annual
production. (2009)
• In 2009, U.S. turkey exports were $395 million, an
18% decrease from 2008 and a 99% increase from a
decade ago.
• Mexico is the largest export market for U.S. turkey, with
a 50% market-share, followed by China and Russia,
with 16% and 3% market-shares respectively.
1
US Turkey Exports (Million $)
Largest Markets for US Turkey (2009)
Source: Agricultural Marketing Services Division, Minnesota
Department of Agriculture, January 2010 ; USDA
331 | Context | Iowa AgriScope 2030

Turkey Industry Statistics - Consumption
• During the last three decades, the turkey industry has
come from a single-product, holiday-oriented business
into a fully integrated industry with a diversified product
line that competes with other protein products on a
year-round basis.
• Turkey consumption has increased 102% since 1970,
due to consumers’ recognition of turkey’s good taste
and nutritional value.
• In 2010, US consumption of turkey was 16.4 pounds
per person.
• More and more Americans are realizing that turkey is
not just for holidays. Although 50% of all turkey
consumed in 1970 was during the holidays, today that
number is around 31% as more people enjoy delicious
turkey year-round.
• In 2010, turkey was the #4 protein of choice for
American consumers. Consumption of turkeys for 2010
was approximately 5 billion pounds.
1
Per capita turkey consumption, US
Per capita consumption of turkey
in percentage of consumption *
Source: Eatturkey.com
332 | Context | Iowa AgriScope 2030

Turkey Industry Statistics – Structure
• Nearly all turkeys are either owned by the processor or contracted for delivery to the processor by independent producers. The
processor may raise the birds in its own facility or under a production contract in facilities owned by others. Independent
producers sign a marketing contract before the poults are placed to assure a market for the finished birds. There are two
significant benefits to this approach:
– The producer has a supplier for the birds.
– The producer understands how the price will be established at delivery.
• Short-term marketing contracts with processors, which typically cover the delivery of one or two flocks, are primarily for producers
whose facilities are paid for and who have little or no out-of-pocket overhead expenses.
• To encourage investment in facilities, processors may offer longer-term contracts that provide the producer and the producer’s
lender with some assurance that the investment will cash flow at least until it is paid off.
• The typical Iowa independent turkey producer owns the buildings, equipment and provides the labor, feed, and operating inputs
to grow the turkeys to processing weight. The producer buys the poults and schedules them to match a delivery date at the
processing plant.
• The price is determined in the contract, based on a pricing report/service and also many incorporate the cost of feeding the birds.
• Growers with production contracts do not face price risk and are paid a relatively predictable ROI. Independent producers expect
a higher ROI.
1
Source: Iowa’s Turkey Industry – An Economic Review, 2008
333 | Context | Iowa AgriScope 2030

Turkey Industry Statistics - Production
• The US is the largest producer of turkeys in the world,
contributing 49.5% of worldwide production (2010).
• The number of turkeys raised in the US during 2011 is 248
million, up 2% from the number raised in 2010.
• US turkey industry is geographically concentrated in six
states producing nearly 67% of the total national output
(2011).
• 10 states account for approximately 80% of total
production.
• Market share among the Top 3 states over the past year
has:
– Fallen in Minnesota by 1%
– Maintained in North Carolina
– Grown in Arkansas by 7%
1
0
10,000
20,000
30,000
40,000
50,000
MN NC AR MO VA IN CA SC IA
2010 2011
Annual turkey production:
Selected states 2010, 2011
Sources: Iowa’s Turkey Industry – An Economic Review, 2008; USDA
334 | Context | Iowa AgriScope 2030

Turkey Industry Statistics - Production
• Iowa’s share of total US production declined between the
mid-1970s and late 1990s, but has been steadily rising
since 1999.
– In fact, it grew 11% in 2011 compared with the year prior.
– Production is expected to grow another 3% in 2012 to over
11 million birds.
• Though still trailing Minnesota, Iowa has gained relative to
other leading states.
• Iowa’s neighboring states of Minnesota and Missouri have
similar input prices but produce more turkeys than Iowa
and both also produce more turkeys than they process.
1
Iowa turkey production &
Market share of total US production
Sources: Iowa’s Turkey Industry – An Economic Review, 2008; USDA;
Iowa Turkey Federation
2.0%
2.5%
3.0%
3.5%
4.0%
4.5%
5.0%
-
2
4
6
8
10
12
2007 2008 2009 2010 2011
Mill
ion
s
Annual Production Percent of US Production
Iowa turkey production &
Market share of total US production
335 | Context | Iowa AgriScope 2030

Turkey Industry Economic Impact
• The value of the 14.1 million turkeys processed and the
8.54 million produced in Iowa serve as the direct effects
that stimulate the successive rounds of economic
activity in this model.
• When all direct and secondary effects are considered,
the total impacts include:
– $810.7 million of sales
– $158.7 million of personal income
– $253.3 million of contribution to the gross state product
– More than 4,200 jobs
• Based on average state tax yields per income, the Iowa
turkey industry generates $13.7 million of state general
tax revenues annually.
2
Economic importance of turkey industry in Iowa
Source: Iowa’s Turkey Industry – An Economic Review, 2008
336 | Context | Iowa AgriScope 2030

Turkey Industry Value Chain Summary 3
Iowa turkey production and processing sector, 2007
Source: Iowa’s Turkey Industry – An Economic Review, 2008
337 | Context | Iowa AgriScope 2030

Turkey Industry Value Chain Summary - Employment
• The presence of the Iowa turkey industry is an
important agricultural value-added activity providing
income and employment opportunities for rural areas in
Iowa.
• Most of Iowa’s turkey production is done on modern
farms that use highly automated facilities for efficient
labor utilization.
• Based on the average labor requirements indicated by
the operating budgets, the 8.54 million turkeys
produced in Iowa require 207 FTE employees.
– At current average wages in this sector, the aggregate
annual wage for turkey production bill totals to about
$5.6 million.
• Secondary data from 2006 indicated that about 1,750
employees worked at the four processing facilities in
Iowa.
– Wages and salaries paid at these facilities totaled about
$50 million annually.
– The combined economic effect of these two
components of the turkey industry totals 1,960 workers
and $55.6 million of wages and salaries for the
processing and production levels.
3
Iowa turkey production and processing sector
Source: Iowa’s Turkey Industry – An Economic Review, 2008
338 | Context | Iowa AgriScope 2030

Turkey Industry Value Chain Summary
• At the processing level, records indicate considerable
number of birds are imported into Iowa for processing.
• Total processing numbers for 2007 indicated that about
14.1 million turkeys would be processed in Iowa, which
meant 5.5 million birds were brought in from
surrounding states.
• Because of the close integration between growers and
processors, the production and processing component
are considered to be the core of the industry.
• The backward linkages consist of suppliers of inputs
including feed grains, supplements, veterinary, and
utilities.
• Based on the 2007 levels of production, approximately
9.7 million bushels of corn and 108,000 tons of soybean
meal were used by the 8.54 million turkeys produced in
Iowa.
• Total feed costs were estimated to be $88.9 million
based on $3.12/bushel corn and $209/ton SBM prices
and 2007 prices for other ingredients.
• Costs of other inputs including labor, depreciation,
transportation, and miscellaneous expenses totaled
$52.8 million for the Iowa turkey industry.
3
Iowa turkey production and processing sector
Source: Iowa’s Turkey Industry – An Economic Review, 2008
339 | Context | Iowa AgriScope 2030

Turkey Industry Value Chain Summary
• Iowa produces primarily Tom Turkeys-41 pounds over
20 weeks.
• Feed cost is the single largest expense, over 60% of
the total cost depending on feed prices
• The bird receives several different diets during the
production cycle matched to its nutritional requirements.
• Diet is predominantly corn (56%) and soybean meal
(23%) with other ingredients to supply the remainder of
its nutritional requirements.
• The estimated cost of producing a 41-pound tom in
Iowa is $16.60 per bird or $.4048 per pound of live
weight.
• Operation typically turns 2.4 - 4 flocks per farm per
year.
3
Representative feed ration for life of tom
Estimated cost of producing 41-pound tom turkeys in Iowa
Distribution of Iowa turkey cost of production
Source: Iowa’s Turkey Industry – An Economic Review, 2008
340 | Context | Iowa AgriScope 2030

Turkey Industry Opportunity Outlook-
Economic Impact of 5.6 Million Additional Turkeys
• The current turkey processing capacity in Iowa exceeds the
level of in-state turkey production, therefore birds are
brought in from surrounding states for processing at Iowa
facilities.
• Because of Iowa’s processing capacity, feed price
advantage, and ability to utilize manure nutrients effectively,
there is potential to grow turkey production in the state.
• Increasing in-state production by 5.6 million birds to more
closely match processing capacity could increase economic
activity by $120 million and 380 full time jobs.
• The current turkey processing capacity in Iowa exceeds the
level of in-state turkey production as indicated by the 5.56
million birds brought in from surrounding states for
processing at Iowa facilities.
• This need to import birds from surrounding states suggests
a plausible development scenario.
• The estimated economic impact of 5.56 million additional
turkeys would be valued at $82 million.
• This new economic activity is focused at the producer level
and does not generate any additional processing-level jobs.
• At the farm level, they anticipate an additional 134 FTE jobs
with about $4.0 million of wages to raise Iowa turkey
production to 14.1 million birds.
4
Economic importance of 5.6 million additional turkeys in Iowa
• Total combined direct and secondary impacts include:
– $119 million of sales
– $14.5 million of income
– 381 total jobs
Source: Iowa’s Turkey Industry – An Economic Review, 2008
341 | Context | Iowa AgriScope 2030

Turkey Industry Opportunity Outlook
• Now that the market is maturing, there seems to be a trend away from maintaining production facilities in high-cost states such
as California and N. Carolina, and a trend toward more cost-effective regions, such as the Midwest.
– Minnesota does have slightly less expensive feed costs than Iowa.
– Minnesota and Iowa have substantially lower feed costs than N. Carolina or Arkansas.
• This suggests that feed cost differences are becoming a more significant factor.
• It is possible that as cost pressures increase, production will locate where feed costs are lowest, which will give Iowa an
advantage.
• However, the industry will move very slowly!
• The absence of any major new markets will slow construction of new facilities and older facilities will remain in production as
long as prices cover variable costs.
• Individual states may see some growth, but it will come at the expense of other states.
• Increased attention must be paid to reducing costs and matching production and processing capacity.
• The industry may continue to consolidate.
• Higher cost of transporting grain to corn deficient regions and increased value of turkey litter as fertilizer tend to favor the Corn
Belt, if additional growth is justified.
• However, without any major new markets, the industry will be slow to relocate.
• With an industry as finely balanced between profits and losses, any new production without new markets could create an
oversupply and cause the industry to return to a loss situation.
4
Source: Iowa’s Turkey Industry – An Economic Review, 2008
342 | Context | Iowa AgriScope 2030

Turkey Industry Opportunity Outlook
• Future growth for this industry depends on its ability to
meet two significant challenges:
– Increase domestic consumption of turkey
– Open new export markets
• Per capita consumption of animal protein in the US has
grown.
• Cost of producing turkey is higher than the cost of
producing chicken, but less than beef and pork.
• It will take successful new turkey products to capture
shares from these markets.
• The US exports approximately 10.64% of its total turkey
production (2010). US turkey exports have had an average
annual growth rate of 8.6% in volume and 9.1% in value in
1991-2010. Export markets are dominated by Mexico,
where demand has grown substantially since 1995 and
now represents 55-60% of US exports. Continued growth
in Mexico will depend on the strength of its economy.
• These are highly price sensitive markets that often absorb
by-products such as thighs, drumsticks, and mechanically
separated meat.
• These export markets will exist as long as inexpensive by-
products are available.
4
• However, these low-value export markets are unlikely to
create the financial incentives required for further growth in
turkey production.
• The US turkey industry has entered a mature phase with
possible overabundance of buildings & processing capacity.
• Unless demand from a new product line exceeds
production, prices will continue to hover at the break-even
point.
• High cost producers exit during times of negative returns
and lower cost producers prevail and expand during
upturns in the market.
US Turkey exports by country
Sources: Iowa’s Turkey Industry – An Economic Review, 2008;
2011 Outlook USPEEC; An Overview of U.S. Poultry Exports
343 | Context | Iowa AgriScope 2030

Turkey Industry Opportunity Outlook
• Turkey production has continued to increase in Iowa. In fact, according to 2012 estimates, the state estimates production to
increase by 500,000 more birds to 11 million turkeys, an increase of 5%.
• Sara Lee Foods continues to add more farmers. Farmers are currently turning ground.
• The turkey industry is offering more and innovative turkey products to meet consumer needs. The turkey industry hopes to
continue to be priced favorable in the increasing cost for protein.
• Environmentally, the turkey industry has an annual on-farm environmental audit of all farms conducted by a third party. Many
farmers are adding tree and vegetative plantings.
4
Source: Iowa’s Turkey Industry – An Economic Review, 2008
344 | Context | Iowa AgriScope 2030

Turkey Industry Opportunity Outlook – Threats to Growth
• Increasing turkey production will require additional production facilities.
– These facilities are a significant capital investment and require financing and a stable market environment over the life of the facility.
Regardless of the production site developed, the cost of facilities for modern turkey production is a multi-million dollar investment.
– Farmers investing in these facilities may enter a production contract with a processor.
– Farmers that belong to the Iowa-based processing cooperative may have to purchase additional processing shares in addition to the
production facilities.
– The high capital requirement is often a barrier to entry for young farmers and is a concern for the continued success and growth of the
industry.
– Innovative business models or loan programs that lower the capital barrier are needed to attract new producers and will help retain
the value of existing sites if there is more opportunity for young farmers to buy into the industry.
• Another macro concern is demand for turkey products from U.S. and export customers.
– Per capita turkey consumption that increased dramatically in the 1990s has drifted gradually lower in recent years.
– Turkey also faces significant competition from chicken and pork production, both of which continue to set new records for
supply.
– Turkey products must continue to address consumer expectation for a safe, wholesome, affordable mealtime alternative.
– Industry innovation in new product development and efficient production and processing systems will be necessary to
assure the long-term success of the industry.
4
Source: Iowa’s Turkey Industry – An Economic Review, 2008
345 | Context | Iowa AgriScope 2030

Turkey Industry Opportunity Outlook – Threats to Growth
• Environmental management and regulations are ongoing issues of all livestock and poultry producers.
– The increasing oil and natural gas prices have led to a doubling in fertilizer prices between 2002 and 2007.
– As a result the nutrient value of turkey manure as a commercial fertilizer substitute has also doubled.
– At 2007 commercial fertilizer prices, turkey litter had over $30/ton of crop nutrients when applied following a nutrient
management plan in a corn-soybean rotation.
– It is high in organic matter and nitrogen, phosphorous, and potassium.
– The challenge is to have cost effective methods to handle, store, transport, and apply turkey litter in a manner that is
economically efficient and environmentally sound.
– While soil conditions and crop needs differ, a nutrient plan that applies litter every third or fourth year can be an effective
management strategy to protect water resources and capture the greatest nutrient value.
– Additional research, education, and demonstrations are needed to assure crop farmers of the full benefit of turkey litter as a
soil amendment and fertilizer.
– Likewise, additional work is needed on effective equipment, timing, and quality control of litter application to capture the
greatest value.
– Work is also needed to quantify and minimize the risk to water quality of handling and application methods. Practical
solutions are needed that optimize litter value while assuring the public that water resources are protected.
4
Source: Iowa’s Turkey Industry – An Economic Review, 2008
346 | Context | Iowa AgriScope 2030

Turkey Industry - References
• Iowa Concentrated Animal Feeding Operation Air Quality Study, February 2002, Iowa State University and the University of Iowa
Study Group http://www.public-health.uiowa.edu/ehsrc/cafostudy.htm
• Iowa’s Turkey Industry – An Economic Review, January 2008
– http://www2.econ.iastate.edu/research/webpapers/paper_12880.pdf
• Feeding People, Iowa’s Turkey Industry
• An Overview of U.S. Poultry Exports
• USDA
• Agricultural Marketing Services Division, Minnesota Department of Agriculture, January 2010
http://www.mda.state.mn.us/food/business/~/media/Files/food/business/economics/exports-turkey.ashx
• Turkey Statistics
– www.eatturkey.com
347 | Context | Iowa AgriScope 2030

Value Chain & Competitiveness Assessment
348 | Context | Iowa AgriScope 2030
Biofuels
Economic Importance
Value Chain Summary
OpportunityOutlook
IndustryStatistics

1Biofuels Industry Statistics – World Production of Biofuels
0
2,000
4,000
6,000
8,000
10,000
12,000
14,000
16,000
2000 2001 2002 2003 2004 2005 2006 2007 2008 2009 2010
Bio
fuels
Pro
du
cti
on
(in
millio
n g
allo
ns)
U.S. Brazil Europe & Eurasia Other Americas Asia Pacific
Global Biofuels Production by Country/Region
Source: BP, 2011 Statistical Review of World Energy, 2011
• Total global production of biofuels (ethanol and biodiesel)
reached just over 29 billion gallons in 2010 according to data
compiled by BP from F.O. Lichts and the U.S. Energy Information
Administration. The U.S. produced 46.6% of global biofuels
production followed by Brazil at 27.8% of global production. The
European Union and Russia combined produced 15% of global
production.
• The U.S. overtook Brazil as the leader in biofuels production in
2006 mostly on the growth in ethanol production. Brazil
production growth plateaued in 2006 as sugar prices jumped and
sugar refiners reallocated production towards table sugar instead
of ethanol. This year the Brazilian government reduced the
mandated blend rate of ethanol with gasoline from 25% to 20%
in recognition of the changes in the sugar market. Earlier this
year Brazilian fuel blenders had been importing U.S. ethanol to
meet the 25% government blending requirement.
• Growth in the production of biofuels in Europe flattened out after
several countries (e.g. Germany) removed subsidies for biofuels
and the EU passed a directive that set strict requirements for the
lifecycle GHG emissions from biofuels. U.S. soy-based biodiesel
exports to the EU dropped precipitously after the EU determined
that U.S. biodiesel was being dumped at below market prices in
the EU and countervailing duties were imposed.
• Ethanol accounts for over 85% of global biofuels production and
biodiesel accounts for the rest.
349 | Context | Iowa AgriScope 2030

1Biofuels Industry Statistics – Growth in U.S. Biofuels Production
0
2,000
4,000
6,000
8,000
10,000
12,000
2001 2002 2003 2004 2005 2006 2007 2008 2009
Pro
du
cti
on
(m
illio
n g
allo
ns)
Production
Consumption
Ethanol Biodiesel
0
100
200
300
400
500
600
700
800
2001 2002 2003 2004 2005 2006 2007 2008 2009
Pro
du
cti
on
(m
illi
on
ga
llo
ns
)
Production
Consumption
Source: U.S. Energy Information Administration, Annual Energy Review, 2009 Source: U.S. Energy Information Administration, Annual Energy Review, 2009
• The U.S. ethanol industry grew by over five-fold from 2001 to 2009 or
25.3% per year. Starting in 2002, consumption has been slightly
greater than production, making the U.S. a net importer of ethanol.
Imports reached a high point in 2007 when the country imported over
5% of its ethanol needs. Most of the imported ethanol came from
Brazil via the Caribbean where hydrous ethanol was dehydrated.
• Production continued to grow in 2008, 2009 and 2010 (not shown)
despite the financial crisis of late 2007.
• The U.S. biodiesel industry grew by over fifty-fold from 2001 to 2009
or 66.5% per year. Starting in 2007, production exceeded
consumption by a substantial amount In 2008, more U.S. biodiesel
production was exported than consumed in the U.S. That situation
was short-lived when the European Commission judged U.S.
biodiesel was being “dumped” and countervailing duties were
imposed..
• Production peaked in 2008 and began to recover in 2011 as a result
of the minimum blending requirements set forth in RFS2 and the
increasing value of RIN’s for biodiesel. Total 2011 production is
expected to exceed the peak amount produced in 2008.
350 | Context | Iowa AgriScope 2030

Mandated U.S. Renewable Fuels Use per RFS2
Source: H.R. 6, Energy Independence & Security Act of 2007
0.0
5.0
10.0
15.0
20.0
25.0
30.0
35.0
40.0
2008
2009
2010
2011
2012
2013
2014
2015
2016
2017
2018
2019
2020
2021
2022
Bio
fuels
Vo
lum
e (
billio
n g
allo
ns)
Conventional Biofuels Cellulosic Ethanol Biodiesel Other Advanced Biofuels
1
• The Energy Independence & Security Act of 2007 (EISA) essentially
defines the size and make-up of the U.S. renewable fuels market.
The act was passed just after spot oil prices exceeded $80 per
barrel for the first time and surged to $147 per barrel seven months
later.
• EISA mandates minimum biofuels use from 2008 to 2022. The act
specifies the use (but not necessarily production) of four types of
fuels: conventional (corn-based) ethanol, biomass-based biodiesel,
cellulosic ethanol and advanced biofuels. Advanced biofuels consist
of most any biobased alternative fuel that provides at least a 50%
reduction in GHG emissions compared to the comparable,
petroleum-based fuel and are not produced from corn or cellulose.
• The RFS2 provisions with EISA are effectively designed to substitute
20% of the country’s gasoline usage with renewable fuels. Corn-
based ethanol provides 10% while advanced biofuels (of all types)
provide the other 10%. Use of corn-based ethanol is “capped” at 15
billion gallons by 2015 by limiting the amount eligible for tradable
renewable identification numbers (RIN’s). The value of a corn-based
ethanol RIN is forecasted to be $0.02 per gallon for the 10/11
marketing year, rising to $0.63 per gallon by 16/17 according to
FAPRI.
• Use of biomass-based biodiesel is mandated to reach 1 billion
gallons by 2012.
• The U.S. has failed to meet the advanced fuels and cellulosic
ethanol targets to date and is unlikely to meet them for the remainder
of the period covered by EISA (to 2022).
Biofuels Industry Statistics – EISA and the Renewable Fuels
Standard
351 | Context | Iowa AgriScope 2030

Biofuels Industry Statistics – Biofuels Plants
Iowa Ethanol Plants Iowa Biodiesel Plants
1
Source: Iowa Renewable Fuels Association, located at www.iowalifechanging .com Source: Iowa Renewable Fuels Association, located at www.iowalifechanging .com
• Iowa has 41 ethanol plants which are all in operation. There is a
single cellulosic ethanol project under development but no other
active projects to expand output at the existing plants.
• The majority of Iowa’s ethanol plants are located in the north-
central and north-western part of the state, away from the large
wet mills in Cedar Rapids (ADM) and Eddyville (Cargill) which
were developed prior to the surge in ethanol plant construction
ten years ago.
• Iowa leads the nation with the highest number of ethanol plants
(41) and total installed capacity (3.7 billion gallons).
• According to data from the Iowa Renewable Fuels Association
there are a dozen biodiesel plants in Iowa (some other sources
list 13 to 15). Ten facilities with an installed capacity of 226
million gallons are in operation. Two facilities with a combined
capacity of 95 million gallons are being retrofitted/expanded.
The actual output from the operating plants is unknown.
• According to data from the Iowa Department of Economic
Development, Iowa ranked fourth in the nation in biodiesel
production in 2010.
352 | Context | Iowa AgriScope 2030

Biofuels Industry Statistics – Utilization of Feedstocks
Corn for Ethanol Soybean Oil for Biodiesel
0
2,000
4,000
6,000
8,000
10,000
12,000
14,000
16,000
10/11 11/12 12/13 13/14 14/15 15/16 16/17
Co
rn U
iliz
ati
on
(in
millio
n b
ush
els
)
Ethanol Feed & Residual Food & Other Export
0
5,000
10,000
15,000
20,000
25,000
10/11 11/12 12/13 13/14 14/15 15/16 16/17
So
yb
ean
Oil U
tilizati
on
(in
millio
n lb
s.)
Food & Other Biodiesel Exports
1
Source: FAPRI, August 2011 Baseline Update for U.S. Agricultural Markets Source: FAPRI, U.S. Baseline Briefing Book Projections for agricultural and biofuels markets
• Utilization of corn to produce ethanol rises from 37.9% of total
use to 40.2% of total use by the 16/17 marketing year.
• Use of corn to make ethanol exceeds use of corn for feed and
residual for the first time in 10/11. By the 16/17 marketing year
corn devoted to ethanol production will exceed the amount for
feed and residual use by 12.5%.
• Corn for exports are forecasted by FAPRI to decline in 10/11 by
9% from the previous year and doesn’t reach the prior high
through the forecast period. Corn for food and other grows
gradually.
• Utilization of SBO to produce biodiesel jumps from 14.8% of total
use in the 10/11 marketing year to 17.4% in the following year.
Thereafter it declines to 15.0% of total use by 16/17.
• Soybean oil for food and other application remains fairly constant
at ~71% of total soybean oil use.
• Soybean oil exports are forecast to decline by 9.2% from the
10/11 marketing year to the 11/12 marketing year. They don’t
exceed the amount for 10/11 until the 15/16 marketing year.
353 | Context | Iowa AgriScope 2030

Biofuels Industry Economic Impact
Economic importance of Iowa biofuels industry, 2009
Purchases
(million $’s)
GDP
(million $’s)
Household
Earnings
(million $’s)
Employment
(Jobs)
State Tax
Revenues
(million $’s)
Operations
Ethanol 4,999.6 10,473.6 1,887.8 59,010 476.0
Biodiesel 224.3 471.2 103.0 2,911 22.3
Subtotal 5,224.0 10,944.8 1,990.8 61,921 498.3
New
Construction
Ethanol 520.7 547.4 295.5 8,260 34.1
Biodiesel 0.0 0.0 0.0 0 0.0
Subtotal 520.7 547.4 295.5 8,260 34.1
Total 5744.7 11,492.2 2,286.3 70,181 532.4
Source: John H. Urbanchuk, LEGC LLC, Contribution of the Biofuels Industry to the Economy of Iowa
• Biofuels production is part of the manufacturing sector that adds
value to agricultural commodities produced in Iowa and makes a
significant contribution to the Iowa economy.
• Iowa produced 3.2 billion gallons of ethanol from 39 operating
plants and 85 million gallons of biodiesel from 9 operating plants
in 2009.
• In 2009 biofuels production contributed $11.5 billion to the Iowa
economy or 8% of total state GDP. Half of industry GDP was
generated through purchases and the other half through value-
added operations. Approximately 95% of the industry’s
contribution to state GDP came from operations and the rest
from new construction.
• It generated $2.3 billion in household earnings, 70,181 full and
part time jobs and state tax revenues of $532.2 million.
• The industry also consumed $5.75 billion of raw materials, other
inputs, goods and services. Just over half of purchases were for
feedstocks (grains, vegetable oil and animal fats).
• The Iowa ethanol industry consumed 1.14 billion bushels of corn
(46% of the state’s production) providing $2.9 billion in revenues
to Iowa farmers. The Iowa biodiesel industry consumed 353
million pounds of soybean oil, 218 million pounds of other fats
and oils and 71 million pounds of corn oil. The total value of
these feedstocks was $194.5 million.
• Half of Iowa’s ethanol plants, representing a third of the state’s
production capacity are locally owned.
• DDGS, a co-product generated in the production of ethanol has
become an important input to the animal feed industry globally.
2
354 | Context | Iowa AgriScope 2030

Biofuels Industry Economic Impact - Employment 2
Employment Impact of Iowa biofuels industry, 2009
Industry
Ethanol
Industry Jobs
Biodiesel
Industry Jobs
Total Biofuels
Industry Jobs
Construction 8,260 0 8,260
Operations
Feedstocks 35,029 2,251 37,280
Process Chemicals 2,362 83 2,445
Denaturant 514 n.a. 514
Utilities 3,058 42 3,100
Maintenance & Repair 1,583 100 1,683
Administration 1,130 53 1,183
Labor 808 58 866
Wholesale Trade 10,186 178 10,364
Transportation 4,340 147 4,487
Operations Subtotal 59,010 2,911 61,921
Total 67,269 2,911 70,181
Source: John H. Urbanchuk, LEGC LLC, Contribution of the Biofuels Industry to the Economy of Iowa
• The biofuels industry supports 70,181 full and part time jobs in Iowa
with the ethanol supporting about 96% of the total and the biodiesel
industry providing the remaining 4%. There were 61,921 jobs
associated with ongoing operations and another 8,260 involved in the
construction of new facilities. Note that construction of new facilities
has declined since 2009 but a number of jobs in operations have been
added as the plants previously under construction are now in
operation.
• The industry supports 37,280 jobs in agriculture and another 2,959
jobs to produce other materials (enzymes, process chemicals,
denaturant) used in the production of biofuels.
• Employment in the utilities industry is also supported by the biofuels
industry. A total of 3,100 jobs in the natural gas, electric utility, water
and wastewater industries are required to support biofuels production.
• A total of 1,683 service-type jobs for maintenance and repair are
associated with the biofuels.
• Direct jobs associated with the Iowa biofuels industry number
approximately 2,049 with 58% in administrative positions and 42% in
labor.
• Wholesales trade accounted for about 15% of the 70,181 jobs
supported by the industry while transportation accounted for 6.4%.
355 | Context | Iowa AgriScope 2030

Biofuels Industry Value Chain Summary – The major components of the value
chain are raw materials production, conversion, transportation and enduse.3
Source: National Bioenergy Center, National Renewable Energy Laboratory;
Example: Ethanol Industry
356 | Context | Iowa AgriScope 2030

Biofuels Industry Value Chain Summary – Operations (2009) 3
Iowa Biofuels Processing Sector
Gasoline
MarketDistillate
MarketAnimal Feed
Chemicals
Market
Ethanol:
3.2 billion gals.
Biodiesel:
85 million gals.
$259 million
(biodiesel)
$2.3 million
(glycerin)
$5.13 billion
(ethanol)
$820 million
(DDGS)
Feedstocks Other Inputs UtilitiesAdministration
& LaborCapital
$3.0 billion $443 million $495 million $135 million $4.5- 5.0 billion
Wholesales Trade
(Inputs & Outputs)
$ 758 million
Transportation
(Inputs & Outputs)
$ 311 million
Source: Data from John H. Urbanchuk, LEGC LLC, Contribution of the Biofuels Industry to the Economy of Iowa
357 | Context | Iowa AgriScope 2030

Biofuels Industry Value Chain Summary – Production Costs 3
Ethanol Biodiesel
• The cost structure of the ethanol industry has changed over time
with corn becoming a significantly higher % of total costs. In
contrast, natural gas prices, once a major cost concern, have
moderated and are now much lower % of total costs. Other
utility costs are rising but the industry has made a number of
process improvements to reduce water and electricity use.
• Labor and administrative costs have dropped as a % of total
costs as average plant sizes have increased.
• Transportation costs are rising as ethanol plants are having to
ship further distances to gain access new markets.
• The biodiesel industry continues to struggle with an
uncompetitive cost structure due to feedstock costs. The plants
that are operating are using a combination of SBO, animal fats
and corn oil extracted from DDGS.
• Biodiesel breakeven prices run far above market prices and few
biodiesel operators would survive without the blenders’ credit.
Cost of Biodiesel Production($/gallon) (2007 to present)
$-
$1.00
$2.00
$3.00
$4.00
$5.00
$6.00
Apr-07
Jun-0
7
Aug-07
Oct-0
7
Dec-0
7
Feb-0
8
Apr-08
Jun-0
8
Aug-08
Oct-0
8
Dec-0
8
Feb-0
9
Apr-09
Jun-0
9
Aug-09
Oct-0
9
Dec-0
9
Feb-1
0
Apr-10
Jun-1
0
Aug-10
Oct-1
0
Dec-1
0
Feb-1
1
Apr-11
Jun-1
1
Aug-11
$ p
er
gall
on
Soybean Oil Natural Gas Methanol Other Variable Fixed Costs
Sources: Iowa Soybean Processors Report, EIA,
Methanex
Cost of Ethanol Production
$-
$0.50
$1.00
$1.50
$2.00
$2.50
$3.00
$3.50
Jan-
05
Apr
-05
Jul-0
5
Oct
-05
Jan-
06
Apr
-06
Jul-0
6
Oct
-06
Jan-
07
Apr
-07
Jul-0
7
Oct
-07
Jan-
08
Apr
-08
Jul-0
8
Oct
-08
Jan-
09
Apr
-09
Jul-0
9
Oct
-09
Jan-
10
Apr
-10
Jul-1
0
Oct
-10
Jan-
11
Apr
-11
Jul-1
1
$ p
er
ga
llo
n
Corn Natural Gas Other Variable Fixed Costs
Source: USDA AMS Iowa Ethanol Report, EIA
358 | Context | Iowa AgriScope 2030

Biofuels Industry Value Chain Summary – Industry Profitability 3
Ethanol Production Grind Margin and
Return Over Variable and Total Cost
$(0.50)
$-
$0.50
$1.00
$1.50
$2.00
$2.50
$3.00
Jan-
05
Apr
-05
Jul-0
5
Oct
-05
Jan-
06
Apr
-06
Jul-0
6
Oct
-06
Jan-
07
Apr
-07
Jul-0
7
Oct
-07
Jan-
08
Apr
-08
Jul-0
8
Oct
-08
Jan-
09
Apr
-09
Jul-0
9
Oct
-09
Jan-
10
Apr
-10
Jul-1
0
Oct
-10
Jan-
11
Apr
-11
Jul-1
1
$ p
er
ga
llo
n
Return Over Total Cost Return Over Variable Cost Return Over Grind Margin
Return to
Introduction
Source: USDA AMS Iowa Ethanol Report, EIA
Biodiesel Revenue, Costs, and Profit($ per gallon) (2007 - Present)
$(1.00)
$-
$1.00
$2.00
$3.00
$4.00
$5.00
$6.00
Apr-07
Jun-0
7
Aug-07
Oct-0
7
Dec-07
Feb-0
8
Apr-08
Jun-0
8
Aug-08
Oct-0
8
Dec-08
Feb-0
9
Apr-09
Jun-0
9
Aug-09
Oct-0
9
Dec-09
Feb-1
0
Apr-10
Jun-1
0
Aug-10
Oct-1
0
Dec-10
Feb-1
1
Apr-11
Jun-1
1
Aug-11
$ p
er
gallo
n
Total Cost per Gallon Revenue per Gallon Net Return/Gal.
Ethanol Biodiesel
• Ethanol industry profitability has oscillated between breakeven
and modestly profitable since late 2007. The plants that have
continued to operate have done so by effective hedging of raw
material costs and finished goods prices, making large
improvements in operating efficiency and skillfully managing
working capital.
• Sales of DDGS and corn oil (by some) have become crucial to
plant profitability.
• The ongoing high price of corn is challenging the industry.
• The biodiesel industry has been a breakeven to losing business
for years. The plants that have been able to survive have multi-
feedstock capability, have been able to access some specialty
markets and have a reputation for a quality product.
• Glycerin, a co-product of biodiesel production provides little
additional revenue to biodiesel operators.
• The cost of SBO and the potential permanent loss of the
blenders credit is severely limiting the industry’s future
prospects.
359 | Context | Iowa AgriScope 2030

4
Ethanol Biodiesel
0
5,000
10,000
15,000
20,000
25,000
10/11 11/12 12/13 13/14 14/15 15/16 16/17
Eth
an
ol S
up
ply
(m
illio
n g
allo
ns)
EtOH-corn Cellulosic EtOH-imports
0
200
400
600
800
1,000
1,200
10/11 11/12 12/13 13/14 14/15 15/16 16/17
Eth
an
ol S
up
ply
(m
illio
n g
allo
ns)
Soy-based Corn Oil-based Other
Source: FAPRI, August 2011 Baseline Update for U.S. Agricultural Markets Source: FAPRI, U.S. Baseline Briefing Book Projections for agricultural and biofuels markets
• FAPRI is forecasting corn-based ethanol to continue to grow,
exceeding the RFS2 mandate of 15 billion gallons by the 15/16
marketing year, despite the loss of blenders credit and the import
tariff. The major drivers of continued growth are the RFS2 mandate,
the rising value of RIN’s, ethanol’s price competitiveness with gasoline
and the marketing of E15. The January forecast projects corn-based
ethanol volumes will reach 16 billion gallons by 20/21.
• Cellulosic ethanol only reaches 242 million gallons in 16/17.
• Ethanol imports (sugarcane-based) rise to fulfill a portion of the
advanced biofuels requirement of RFS2. They reach 3.7 billion
gallons by the 16/17 marketing year.
• The biodiesel industry is forecast to continue to grow on the strength
of the biodiesel mandate within RFS2, despite the loss of the
blender’s credit by the end of 2011. RIN values surged at the
beginning of the year to draw more capacity into production.
• SBO and animal fats are expected to provide the bulk of the
feedstocks needed in the 10/11 marketing year.
• Use of SBO for biodiesel production peaks in 11/12 and declines
gradually thereafter. Corn oil extracted from DDGS at ethanol plants
accounts for 20% of biodiesel feedstocks by 16/17, gaining share at
the expense of animal fats.
360 | Context | Iowa AgriScope 2030
Biofuels Industry Outlook – Future Opportunity

4
Ethanol
• Current installed capacity is approximately 14.7 billion gallons, with no
new corn-based plants under construction. It is difficult to see why
investors would commit $150 million to build a new plant when returns
have been so marginal.
• A prior FAPRI analysis of the loss of the benders credit estimated that
production capacity could drop by ~1 billion gallons, yet their most recent
analysis shows no real effect from the imminent loss of the credit.
• The FAPRI forecast is based on minimal year-to-year volatility in corn or
ethanol prices which seems questionable. Plant margins may face
additional pressure in the years ahead and some older capacity could be
retired rather than face periods of negative returns and the costs of
replacing equipment.
• Water is going to become an increasing problem in the plains states and
ethanol plants could see water allocations reduced in favor of municipal
use.
• The ethanol industry is approaching the maximum blending requirements
of RFS2 which will inhibit future growth.
• Market acceptance of higher ethanol blends is weak and some states are
removing incentives for corn-based ethanol or resisting the introduction
of E15 on non-flex fuels vehicles.
Political support for biofuels in
the U.S. is eroding.
The new fleet mileage standards
may accelerate the decline in
liquid fuels use in the U.S. and
the opportunity to blend biofuels.
361 | Context | Iowa AgriScope 2030
Biofuels Industry Outlook – Risks to Growth

4
Biodiesel
• FAPRI is forecasting SBO prices of over $0.50 per pound to 20/21. It
seems highly unlikely that there will be any additional growth in soy-
based biodiesel.
• The permanent loss of the blenders credit could convince a number of
firms to finally exit the business.
• The U.S. biodiesel industry has been operating at ~20% utilization for
five years. Capital is usually redeployed by investors when it fails to
provide adequate returns. A lot of capacity may only exist on paper.Political support for biofuels in
the U.S. is eroding.
The new fleet mileage standards
may accelerate the decline in
liquid fuels use in the U.S. and
the opportunity to blend biofuels.
362 | Context | Iowa AgriScope 2030
Biofuels Industry Outlook – Risks to Growth

Biofuels Industry - References
• BP - http://www.bp.com/sectionbodycopy.do?categoryId=7500&contentId=7068481
• govtrack.us - http://www.govtrack.us/congress/bill.xpd?bill=h110-6
• Iowa Biodiesel Board - http://www.iowabiodiesel.org/
• Iowa Department of Economic Development - http://www.iowalifechanging.com/business/ethanol_biodiesel.aspx
• Iowa Renewable Fuels Association - http://www.iowarfa.org/documents/2008IowaBiofuelsEconomicImpact012409_000.pdf
• The Agricultural Marketing Resource Center at Iowa State University - http://www.agmrc.org/
• The Food and Agricultural Policy Research Institute - http://www.fapri.org/
• U.S. Energy Information Administration - http://www.eia.gov/
363 | Context | Iowa AgriScope 2030

Chapter 6: Appendix
364 | Context | Iowa AgriScope 2030

Appendix A
365 | Context | Iowa AgriScope 2030
Summary of Steering Committee Meetings

First Steering Committee Meeting
Date: April 14, 2011
Time: 3:00-5:00 p.m.
Location: Embassy Suites, Downtown Des Moines
Agenda
• Meet & Greet
• Project Introduction
• Steering Committee Introductions
• Governor Branstad Remarks
• Working Session
– “Big Picture” Assumptions – Situational Analysis
– Opportunities / Obstacles
– Recommended Interviewees & Research
• Wrap-Up
366 | Context | Iowa AgriScope 2030

First Steering Committee Meeting –
Top Obstacles & Opportunities for Iowa Agriculture Identified by Steering Committee
• Obstacles
– Uncertain public policy (federal and Iowa)
– Regulations (federal, state, local)
– Inadequate infrastructure for logistics, processing
– General public not connected to, or knowledgeable about, agriculture
– Not enough educated/skilled labor
– Need available credit, especially for diversification and entrepreneurship
– Inadequate education/R&D funding
• Opportunities
– Projected increase in global demand for vegetable oil and protein
– Expand trade agreements/relationships
– Logistics to access world markets (Missouri River given as an example)
– Potential to create incentives to attract businesses to Iowa
– Grow/expand livestock production and processing
– Revisit CRP - return idle land to production
– Create incentives to start businesses in Iowa
367 | Context | Iowa AgriScope 2030

Second Steering Committee Meeting
Date: July 13, 2011
Time: 8:00 a.m. – 1:00 p.m.
Location: Iowa Pork Producers Office, Clive
Agenda
• Welcome
• Presentation by Kip Thompson, President of Global Site Strategies, Economic Development Advisors
• Project Update
• Introduction to Working Session
• Working Session Breakouts
– Innovation
– Business Climate
– Comparative Advantages
– Build on Iowa’s Agricultural Strengths
– New to Iowa
– Add Value
• Report Out
• Wrap-up
• Lunch & Learn with Dr. Dermot Hayes
368 | Context | Iowa AgriScope 2030

Final Steering Committee Meeting
Date: October 4, 2011
Time: 9:00 a.m. – 12:00 p.m.
Location: Iowa Soybean Association, Ankeny
Agenda
• Welcome
• Setting the Stage: Iowa in the World of Agriculture
• Iowa Agriculture in 2030
– Strategies
– Recommendations
• Prioritization Exercise
• Discussion
• Next Steps & Closing
• Lunch
369 | Context | Iowa AgriScope 2030

Appendix B | Final Steering Committee Meeting
370 | Context | Iowa AgriScope 2030
Prioritization Exercise Results

Prioritization Process
• A list of 42 Recommendations was formulated as a result of the almost 100 interviews completed.
• Each Steering Committee member was asked to prioritize the 42 Recommendations (along with their
corresponding Actions)
• For each Recommendation, Steering Committee members were asked to place a blue dot on a grid that was
split into 4 quadrants
– Along the X axis was “Doability” - The ease with which the recommendation could be implemented (difficult / easy)
– Along the Y axis was “Economic Importance/Impact” – It’s the additional value created (increase in GSP; increase in
incomes and jobs)
– It was important for them to not only consider which box to place their dot but also the relativity of each axis
– It was made clear that blue dots in Quadrant 4 (High Economic Impact & Low Doability would likely be the “highest
priority” recommendations and be presented as such in the final report.
– Each Steering Committee member was also given a few “red” dots. The red dots were also known as “save cards”. They
were to place a “red” dot on the grid if they were concerned that the Recommendation was not going to be among the
“highest priority” recommendations but were “highly important” and should be strongly considered as such.
– We also asked the Steering Committee members to consider if any recommendations were potentially missing and to
bring those forward in the process.
• The slides that follow are a compilation of the prioritization exercise with the Steering Committee.
371 | Context | Iowa AgriScope 2030

372 | Context | Iowa AgriScope 2030
2
3
7
Top 3 Priorities at the “highest” level (section of the visual)
• Improve Business Climate• Protect Comparative Advantage• Expand Exports
2
2
3 0
There are 3 Top Priorities based on analyzing the data according to the
seven sections of the visual
* The numbers in each circle represent the number of “recommendations” that were prioritized by the Steering Committee as the “highest priority”.

There are 5 Top Priorities based on analyzing the data according to
the 12 Strategies
373 | Context | Iowa AgriScope 2030
1. Strong Soil, Safe Water *
2. Improved Transportation Infrastructure
3. Qualified, Adequate Workforce *
4. Reasonable Regulations and Taxes **
5. Supportive Business Environment **
6. Innovation Reputation
7. World-Class Research and Education
8. Building the Base
9. Adding Value
10. Nurturing the New
11. Expanding Exports
12. Strategic Leadership
Top 5 Priorities by “Strategy” level
* These 2 Strategies are 2 of the 3 areas under “Protect Comparative Advantages”** These 2 Strategies are 2 of the 3 areas under “Improve Business Climate”

There are 19 Top Priorities based on analyzing the data according to
the 42 Recommendations
374 | Context | Iowa AgriScope 2030
Top 7 by “Recommendations” level
under the Lens of “Expanding Economic Activity”
Top 12 by “Recommendations” level
under the Lens of “the Fundamentals for Growth”
4- 2nd tier8 – 3rd tier
2 – Lowest tier
0 - 2nd tier2 – 3rd tier
7 – Lowest tier

There are 19 Top Priorities based on analyzing the data according to
the 42 Recommendations
375 | Context | Iowa AgriScope 2030
Top 7 by “Recommendations” level
Under the Lens of “Expanding Economic Activity”
0 - 2nd tier2 – 3rd tier
7 – Lowest tier

1 2
43
-10
-5
0
5
10
-10 -5 0 5 10
Expand Economic Activity
376 | Context | Iowa AgriScope 2030
-10
-5
0
5
10
-10 -5 0 5 10
-10
-5
0
5
10
-10 -5 0 5 10
-10
-5
0
5
10
-10 -5 0 5 10
Build the BaseAdd ValueNurture the New Expand Exports
1
2
1
2
AV2AV6
AV3high
low
Eco
no
mic
Imp
act
difficult easy
Do-ability

• Increase the production of established Iowa commodities, both crop and
livestock.
• Embrace production agriculture as an Iowa tradition, strength and base for
future growth.
• Adopt a pro-active, self-regulating attitude in order to prevent problems.
• Recognize the debt and equity capital needs of commodity producers, and
processors that source commodities, caused by increasingly volatile market
cycles.
Building the Base
377 | Context | Iowa AgriScope 2030

BB 1 – Increase the production of established Iowa commodities, both
crop and livestock.
378 | Context | Iowa AgriScope 2030
Strong Quadrant 4 (4.5, 6.5) representation among Private & Public
Sectors; 2 Red Dots indicating its importance (Both Public Sector)
1 2
43

BB 2 – Embrace production agriculture as an Iowa tradition, strength &
base for future growth
379 | Context | Iowa AgriScope 2030
Strong Quadrant 4 (5, 3) representation among Private & Public
Sectors
1 2
43

BB 3 – Adopt a pro-active, self-regulating attitude in order to prevent
problems
380 | Context | Iowa AgriScope 2030
Quadrant 1 (-1,-4.25) representation among Private & Public Sectors
1 2
43

BB 4 – Recognize the debt & equity capital needs of commodity producers &
processors that source commodities, caused by increasingly volatile market
cycles
381 | Context | Iowa AgriScope 2030
Borderline Quadrants 1 & 3 (-1.25, .5) representation among Private
& Public Sectors
1 2
43

• Provide a flexible, responsive business, government and social environment
where unimagined value-added businesses may establish themselves and
flourish.
• Add value to the value-added and build on the success of Iowa businesses.
• Recruit further processing businesses to locate and grow in Iowa, especially in
rural communities.
• Develop product- to-customer systems that are flexible enough to
accommodate specialty crop production, identity preserved production and
higher quality production.
• Build on global leadership in added-value products (i.e. bio-fuels, meat and
other food processing).
Adding Value
382 | Context | Iowa AgriScope 2030

AV 1 – Provide a flexible, responsive business, government & social environment
where unimagined value-added businesses may establish themselves & flourish
383 | Context | Iowa AgriScope 2030
Solid Quadrant 3 (-4.5, 2.75) representation among Private & Public
Sectors
1 2
43

AV 2 – Add value to the value-added & build on the success of Iowa
businesses
384 | Context | Iowa AgriScope 2030
Strong Quadrant 4 (1.5, 6.25); moderate difficulty yet high economic
impact; Concerns relative to difficulty were expressed by 3 SC members
1 2
43

AV 3 – Recruit further processing businesses to locate & grow in Iowa,
especially in rural communities
385 | Context | Iowa AgriScope 2030
Borderline Quadrant 3 & 4 (-.25, 6); very high economic impact; more
concern about degree of difficulty particularly from the Private sector
1 2
43

AV 4 – Develop product-to-customer systems that are flexible enough to
accommodate specialty crop, identity preserved production and higher quality
production
386 | Context | Iowa AgriScope 2030
Quadrant 1 (-1.5, -1.5) representation among Private & Public Sectors (Public Sector tended to view as a little easier to implement than the Private Sector)
1 2
43

AV 5 – Build on global leadership in value-added products (i.e. bio-fuels,
meat and other food processing
387 | Context | Iowa AgriScope 2030
Strong Quadrant 4 (1.5, 5.5) representation across both sectors; very high economic impact (concern expressed by a SC member with experience about level of difficulty to implement)
1 2
43

• Provide an environment in which non-traditional ideas, farming operations and
businesses may establish a foothold and grow.
• Review the needs of new, innovative agriculture production and processing and
prioritize efforts to help with those needs.
• Encourage institutions to incorporate local production into their food service
menus.
• Assist ‘new to Iowa’ production and processing in their efforts to access
investment capital.
Nurturing the New
388 | Context | Iowa AgriScope 2030

NN 1 – Provide an environment in which non-traditional ideas/
businesses may establish a foothold & grow
389 | Context | Iowa AgriScope 2030
Strong Quadrant 1 (-1.75, -3.5) across both sectors
1 2
43

NN 2 – Review the needs of the new, innovative agriculture production &
processing and prioritize efforts to help with those needs
390 | Context | Iowa AgriScope 2030
Strong Quadrant 2 (5, -6) representation across both sectors
1 2
43

NN 3 – Encourage institutions to incorporate local production into their
food service menus
391 | Context | Iowa AgriScope 2030
Strong Quadrant 2 (2.5, -7.5) representation across both sectors;
very low projected economic impact
1 2
43

NN 4 – Assist “new to IA” production & processing in their efforts to
access investment capital
392 | Context | Iowa AgriScope 2030
Strong Quadrant 2 (2, -3) representation across both sectors;
projected low economic impact
1 2
43

• Lead efforts to open markets for Iowa commodities and value-added products.
• Include Iowa-based animal health products and production systems in
promotion efforts, as livestock production continues to increase globally.
• Promote and market Iowa agriculture and processing knowledge, expertise and
management skills: Knowledge based consulting for bio fuels processing, food
safety, food processing, livestock production, etc.
Expanding Exports
393 | Context | Iowa AgriScope 2030

EE 1 – Lead efforts to open markets for Iowa commodities & value-added
products
394 | Context | Iowa AgriScope 2030
Strong Quadrant 4 (1.75, 6.75) representation across both sectors; very high economic impact (Concern expressed by 2 SC members about level of difficulty to implement)
1 2
43

EE 2 – Include Iowa-based animal health products, production systems in
promotion efforts, as livestock production continues to increase globally
395 | Context | Iowa AgriScope 2030
Quadrant 4 (1.25, 1.5); moderate difficulty & economic impact
(concern expressed by Private Sector)
1 2
43

EE 3 – Promote & market Iowa agriculture & processing knowledge, expertise &
management skills: Knowledge based consulting for bio-fuels processing, food
safety, food processing, livestock production, etc.
396 | Context | Iowa AgriScope 2030
Borderline Quadrant 2 & 4 (1.5, -.5); moderate difficulty & moderate
economic impact
1 2
43

There are 19 Top Priorities based on analyzing the data according to the
42 Recommendations
397 | Context | Iowa AgriScope 2030
Top 12 by “Recommendations” level
under the Lens of “the Fundamentals for Growth”
4- 2nd tier8 – 3rd tier
2 – Lowest tier

Fundamentals to Expanding Economic Activity
398 | Context | Iowa AgriScope 2030
-10
-5
0
5
10
-10 -5 0 5 10
-10
-5
0
5
10
-10 -5 0 5 10
-10
-5
0
5
10
-10 -5 0 5 10
Protect Comparative Advantages
S&WTransportation InfrastructureWorkforce
13
S&W2
1
1
4
2
3
high
low
Eco
no
mic
Imp
act
difficult easy
Do-ability
1 2
43

Fundamentals to Expanding Economic Activity
399 | Context | Iowa AgriScope 2030
Improve Business Climate
-10
-5
0
5
10
-10 -5 0 5 10
-10
-5
0
5
10
-10 -5 0 5 10
-10
-5
0
5
10
-10 -5 0 5 10
1
2
3
4
1
23 4
1
23
Open for BusinessRegulations & TaxesStrategic Leadership
high
low
Eco
no
mic
Imp
act
difficult easy
Do-ability
1 2
43

Fundamentals to Expanding Economic Activity
400 | Context | Iowa AgriScope 2030
Encourage Innovation
-10
-5
0
5
10
-10 -5 0 5 10
-10
-5
0
5
10
-10 -5 0 5 10
Research & EducationInnovation, Culture & Technology & Entrepreneurism
3
R&E 1 & 2
34
1
ICTE 2
high
low
Eco
no
mic
Imp
act
difficult easyDo-ability
1 2
43

• Re-energize Iowa’s commitment to soil stewardship, addressing both retention
and quality concerns.
• Protect Iowa’s ground and surface water while optimizing efficient utilization for
both production and processing.
• Prioritize vulnerable landscapes and soils for federal and state incentive
programs.
Workforce
Soil &
Water
Transportation
Infrastructure
Strong Soil, Safe Water
401 | Context | Iowa AgriScope 2030

PCA - S&W 1 – Re-energize Iowa’s commitment to soil stewardship,
addressing both retention and quality concerns
402 | Context | Iowa AgriScope 2030
Strong Quadrant 4 (2, 6.5) Representation among Private & Public
Sectors; very high economic impact projected
1 2
43

PCA - S&W 2 – Protect Iowa’s ground & surface water while optimizing
efficient utilization for both production and processing
403 | Context | Iowa AgriScope 2030
Median in Borderline between Quadrant 3 & 4 (-.5, 5.25); high
economic impact projected
1 2
43

PCA - S&W 3 – Prioritize vulnerable landscapes & soils for federal and
state incentive programs
404 | Context | Iowa AgriScope 2030
Strong Quadrant 4 (3, 5.25) Representation among Private & Public
Sectors; high economic impact projected
1 2
43

• Influence Congress to appropriate funding for lock expansion projects on the
Upper Mississippi and Illinois rivers (authorized in the 2007 Water Resources
Development Act).
• Assure that the Missouri River is maintained as a viable option for commercial
movement of western Iowa commodities and related products into the
extensive US inland waterway system and global markets.
• Plan for projected increases in Iowa crop and livestock production, food and
fuel processing and manufacturing, and resultant truck traffic increases.
• Assure adequate freight rail line capacity, access and provider options to serve
agricultural production and processed product rail needs.
Workforce
Soil &
Water
Transportation
Infrastructure
Improved Transportation Infrastructure
405 | Context | Iowa AgriScope 2030

PCA - TI 1 – Influence Congress to appropriate funding for lock expansion
projects on the Upper Mississippi and Illinois rivers (authorized in the 2007 Water
Resources Development Act)
406 | Context | Iowa AgriScope 2030
Strong Quadrant 3 (-4.75, 1.5) Representation among Private &
Public Sectors; Received 1 Red Dot (Public Sector)
1 2
43

PCA - TI 2 – Assure that Missouri River is maintained as a viable option for
commercial movement of western Iowa commodities and related products into
the extensive US inland waterway system and global markets
407 | Context | Iowa AgriScope 2030
Quadrant 1 (-2, -1.75) Representation among Private & Public
Sectors; 2 Red Dots (1 Private & 1 Public Sector)
1 2
43

PCA - TI 3 – Plan for projected increases in Iowa crop & livestock production,
food and fuel processing and manufacturing, and resultant truck traffic increases
408 | Context | Iowa AgriScope 2030
Quadrant 3 (-1.5, 4.5) Representation among Private & Public
Sectors; 1 Red Dot (Public Sector)
1 2
43

PCA - TI 4 – Assure adequate freight rail line capacity, access and provider
options to serve agricultural production and processed product rail needs
409 | Context | Iowa AgriScope 2030
Strong Quadrant 3 (-8.5, 3.75) Representation among Private &
Public Sectors; 1 Red Dot (Private Sector)
1 2
43

• Educate, recruit, attract and retain a workforce with knowledge of and passion
about production agriculture, processing and the businesses that serve
ag/processing.
Workforce
Soil &
Water
Transportation
Infrastructure
Qualified, Adequate Workforce
410 | Context | Iowa AgriScope 2030

PCA - W 1 – Educate, recruit, attract & retain a workforce with knowledge of &
passion about agriculture, processing and the businesses that serve
ag/processing
411 | Context | Iowa AgriScope 2030
Borderline between Quadrant 3 & 4 (-.25, 6) therefore moderate difficulty yet very high economic impact representation among Private & Public Sectors
1 2
43

• Stabilize regulations that affect businesses and assure that they are based on
science; documented experience in Iowa or other states; and thorough,
relevant study.
• Administer reasonable, fair and relevant regulatory enforcement.
• Effect lasting improvement to the state regulatory and permitting processes.
• Determine the effect that Iowa’s business tax ranking is having on the retention
and attraction of bio based businesses to Iowa. If advisable, take measures to
improve Iowa’s business tax ranking over the next five years, then continue to
strive for an ever more business-friendly tax structure.
Strategic
Leadership
Regulations
& Taxes
Open for
Business
Reasonable Regulations and Taxes
412 | Context | Iowa AgriScope 2030

IBC – R&T 1 – Stabilize regulations that affect businesses and assure that they
are based on science, documented experience in Iowa or other states, and
thorough relevant study
413 | Context | Iowa AgriScope 2030
Strong Quadrant 3 (-2.25, 8.5) representation among Private & Public
Sectors; very high economic impact; 1 red dot (private sector)
1 2
43

IBC – R&T 2 – Administer reasonable, fair and relevant regulatory
enforcement
414 | Context | Iowa AgriScope 2030
Borderline Q3 & Q4 (-.5, 7); very high economic impact;
1 Red Dot
1 2
43

IBC – R&T 3 – Effect lasting improvement to the state regulatory and
permitting processes
415 | Context | Iowa AgriScope 2030
Borderline Q3 & Q4 (0, 5.5); high economic impact projected;
2 red dots from public & private
1 2
43

IBC – R&T 4 – Determine the effect that Iowa’s business tax ranking is having on retention and
attraction of bio based businesses to Iowa. If advisable, take measures to improve Iowa’s business
tax ranking over the next 5 years, then continue to strive for an ever more business-friendly tax
structure
416 | Context | Iowa AgriScope 2030
Quadrant 4 (.75, 5); high projected economic impact
1 2
43

• Convince Iowa businesses and those considering locating here that Iowa is
“Open for Business” and is ready to help resolve problems or share
opportunities.
• Support Iowa’s new public-private approach to economic development and
assure the new system is supportive of a bio-economy and prioritizes its
needs.
• Assure fiber optic broadband transmission is available to Iowa communities for
use by agriculture businesses, processing businesses, input providers &
assure the integrity of satellite transmissions to GPS receivers.
• Encourage foreign investment in Iowa-based agricultural research, production
and processing.
Strategic
Leadership
Regulations
& Taxes
Open for
Business
Supportive Business Environment
417 | Context | Iowa AgriScope 2030

IBC - OB 1 – Convince Iowa businesses & those considering locating here that
Iowa is “Open for Business” and is ready to help resolve problems or share
opportunities
418 | Context | Iowa AgriScope 2030
Strong Quadrant 4 (5.5, 5) representation among Private & Public
Sectors
1 2
43

IBC - OB 2 – Support Iowa’s new public-private approach to economic
development and assure the new system is supportive of a bio economy and
prioritizes its needs
419 | Context | Iowa AgriScope 2030
Quadrant 4 (4, 1.25) representation among Private & Public Sectors
1 2
43

IBC - OB 3 - Assure fiber optic broadband transmission is available to Iowa
communities for use by ag businesses, processing businesses, input providers
& assure the integrity of satellite transmission to GPS receivers
420 | Context | Iowa AgriScope 2030
Borderline Quadrant 4 (.25, 3.5) with moderate difficulty & adequate
economic impact
1 2
43

IBC - OB 4 – Encourage foreign investment in Iowa-based agricultural
research, production and processing
421 | Context | Iowa AgriScope 2030
Borderline between Quadrant 3 & 4 (-1, .5) with moderate difficulty
and moderate economic impact
1 2
43

• Governor Branstad leads Iowa campaign to increase the size and scope of
agriculture.
• Governor Branstad forms and leads an I-State Coalition (IA, IL, IN)
• Increase the effective collaboration of agriculture and related sectors by
forming and empowering an Iowa Agri-Growth Council that provides a
foundation for cooperation and prioritization across Iowa’s diverse agriculture
sector.
Strategic
Leadership
Regulations
& Taxes
Open for
Business
Strategic Leadership
422 | Context | Iowa AgriScope 2030

IBC - SL 1 – Governor Branstad leads Iowa campaign to increase the
size & scope of agriculture
423 | Context | Iowa AgriScope 2030
Quadrant 4 (1.75, 2) representation among Private & Public Sectors
1 2
43

IBC - SL 2 – Gov. Branstad forms & leads an I-State Coalition
424 | Context | Iowa AgriScope 2030
Quadrant 2 (3.25, -2.25) representation among Private & Public
Sectors; 1 Red Dot (Private Sector)
1 2
43

IBC - SL 3 – Increase the effective collaboration of agriculture by forming &
empowering an Iowa Agri-Growth Council that provides a foundation for
cooperation and prioritization across Iowa’s diverse agriculture sector
425 | Context | Iowa AgriScope 2030
Quadrant 2 (4, -1.5) representation among Private & Public Sectors
1 2
43

• Recognize the value of research as both a basis and a catalyst for innovation
and provide Iowa’s public research institutions with the resources needed to
effectively foster innovation.
• Establish and foster an innovative and entrepreneurial climate throughout
Iowa’s education systems.
• Strengthen the exchange of knowledge between science and
business/industry.
Innovation Culture, Technology
& Entrepreneurism
Research &
Education
World-Class Research and Education
426 | Context | Iowa AgriScope 2030

EI - R&E 1 – Recognize the value of research as both a basis & a catalyst for
innovation & provide Iowa’s public research institutions with the resources
needed to effectively foster innovation
427 | Context | Iowa AgriScope 2030
Quadrant 3 (-2, 6) with very high economic impact;
3 Red Dots (1 Private & 2 Public Sector)
1 2
43

EI - R&E 2 – Establish & foster an innovative & entrepreneurial climate
throughout IA’s education systems
428 | Context | Iowa AgriScope 2030
Quadrant 3 (-2, 6) with very high economic impact;
1 2
43

EI - R&E 3 –Strengthen the exchange of knowledge between science &
business/industry
429 | Context | Iowa AgriScope 2030
Borderline Quadrant 4 (.75, .25) with moderate difficulty & moderate
economic impact; 1 Red Dot (Private sector)
1 2
43

• Take the lead for development of food safety technologies, systems and
businesses that will serve the growing global demand for safe food supplies.
• Identify and eliminate any unnecessary laws and regulations that stifle or slow
adoption and utilization of technologies. Avoid passage of such
laws/regulations in the future.
• Create a climate for innovation in agriculture, food, fiber, pharmaceutical and
renewable fuel businesses, and in the supporting sciences.
• Encourage and support entrepreneurism.
Innovation Culture, Technology
& Entrepreneurism
Research &
Education
Innovation Reputation
430 | Context | Iowa AgriScope 2030

EI - ICTE 1 – Take the lead for development of food safety technologies, systems
& businesses that will serve the growing global demand for safe food supplies
431 | Context | Iowa AgriScope 2030
Borderline Quadrant 3 & 4 (-.25, .75); moderate difficulty & economic importance; Public sector tended to rate this higher on economic importance than the private sector
1 2
43

EI - ICTE 2 – Identify & eliminate any unnecessary laws & regulations that stifle or
slow adoption & utilization of technologies. Avoid passage of such
laws/regulations in the future
432 | Context | Iowa AgriScope 2030
Borderline Quadrant 3 & 4 (-.25, 3.25); moderate difficulty however relatively higher on economic importance; 2 Red dots (Both Public Sector)
1 2
43

EI - ICTE 3 – Create a climate for innovation in agriculture, food, fiber,
f(ph)armaceutical and renewable fuel businesses, and in the supporting sciences
433 | Context | Iowa AgriScope 2030
Quadrant 4 (.5, 4.75) representation among Private & Public Sectors;
fairly high for projected economic impact; 1 Red Dot (Private sector)
1 2
43

EI - ICTE 4 – Encourage & support entrepreneurism
434 | Context | Iowa AgriScope 2030
Borderline Quadrant 3 & 4 (-.5, 3.5); moderately high projected
economic impact with moderate difficulty
1 2
43

Appendix C | Responsibilities
435 | Context | Iowa AgriScope 2030
Priority and Secondary Recommendations and
Actions Organized by Who is Responsible

Recommendations, Actions & Responsible Parties
• After the recommendations were prioritized, the Context Team identified who would be the potential parties to
lead and/or be a team member for each Recommendation and its corresponding Actions.
• The following slides are organized by the parties responsible for implementing each Recommendation and its
corresponding Actions. Each responsible party has two types of slides:
– Team Leader(s)
– Team Member(s)
436 | Context | Iowa AgriScope 2030

Priority Strategies, Recommendations and Actions
Organized by Who is Responsible
437 | Context | Iowa AgriScope 2030

USDA
438 | Context | Iowa AgriScope 2030
Team
Leader
Strategy Recommendations Actions Team Leader(s) Team Member(s)
Build the Base
Increase the production of
established Iowa commodities, both
crop and livestock.
Facilitate approval and adoption of technologies
that will increase yields without depleting or
compromising resources.
USDA
Congress, Iowa Secretary
of Ag, ISU, Ag &
Commodity Organizations,
Ag Producers

USDA
439 | Context | Iowa AgriScope 2030
Team
Member
Strategy Recommendations Actions Team Leader(s) Team Member(s)
Increase funding levels for public research that
develops pathways for sustainable production
increases and profitability: solving problems of
commercial crop and livestock production.
Congress, Iowa Legislature
USDA, Iowa Governor,
Iowa Secretary of Ag, ISU,
Ag & Commodity
Organizations, Ag
Producers
Support research and development of processes
that turn bi-products and waste materials into
usable products.
Businesses
USDA, Iowa Governor,
Iowa Legislature, ISU, Ag
& Commodity
Organizations, Ag
Producers
Support biofuels research and development to
stay on the cutting edge of new efficiencies and
technologies.
Businesses
USDA, Iowa Governor,
Iowa Legislature, ISU, Ag
& Commodity
Organizations
Promote and utilize livestock manure as a
valuable, natural, locally-produced source of
nitrogen and organic matter.
Iowa Secretary of Ag
USDA, Iowa Legislature,
IDALS, ISU, Ag &
Commodity Organizations,
Ag Producers, SWCDs,
Coalition to Support
Farmers
Prevent the need for subsidy programs by
providing access to revenue insurance, loan
guarantees, etc.
Congress USDA, Iowa Governor
Recognize the debt and equity capital needs of
commodity producers, and processors that
source commodities, caused by increasingly
volatile market cycles.
Lenders
USDA, Congress, Iowa
Governor, Iowa Secretary
of Ag, Businesses
World Class
Research &
Education
Support, to the greatest extent
possible, research and innovation that
builds Iowa's agriculture production
and value added endeavors.
Build the Base
Increase the production of
established Iowa commodities, both
crop and livestock.

USDA NRCS
440 | Context | Iowa AgriScope 2030
Team
Leader
Strategy Recommendations Actions Team Leader(s) Team Member(s)
Target vulnerable landscapes that need more
protective measures and, possibly, more incentive
for set-aside.
USDA NRCS Congress
Release non-vulnerable land from protection, or
set-aside, in order to meet growing production
needs.
USDA NRCS
Strong Soil, Safe
Water
Prioritize vulnerable landscapes and
soils for federal and state incentive
programs.

USDA NRCS
441 | Context | Iowa AgriScope 2030
Team
Member
Strategy Recommendations Actions Team Leader(s) Team Member(s)
Educate landlords about the value of their asset
and the potential to lose that value through tillage
practices that do not protect the soil from eroding
and losing organic matter.
SWCDsUSDA NRCS, ISU, Ag
Producers
Promote the value of adding organic matter to
Iowa soils by proving long-term enhancement of
productive capacity and retention of top soil.
SWCDsUSDA NRCS, IDALS, Ag
Producers
Strong Soil, Safe
Water
Re-energize Iowa’s commitment to
soil stewardship, addressing both
retention and quality concerns.

Congress
442 | Context | Iowa AgriScope 2030
Team
Leader
Strategy Recommendations Actions Team Leader(s) Team Member(s)
World Class
Research &
Education
Support, to the greatest extent
possible, research and innovation that
builds Iowa's agriculture production
and value added endeavors.
Increase funding levels for public research that
develops pathways for sustainable production
increases and profitability: solving problems of
commercial crop and livestock production.
Congress, Iowa Legislature
USDA, Iowa Governor,
Iowa Secretary of Ag, ISU,
Ag & Commodity
Organizations, Ag
Producers
Build the Base
Increase the production of
established Iowa commodities, both
crop and livestock.
Prevent the need for subsidy programs by
providing access to revenue insurance, loan
guarantees, etc.
Congress USDA, Iowa Governor

Congress
443 | Context | Iowa AgriScope 2030
Team
Member
Strategy Recommendations Actions Team Leader(s) Team Member(s)
Strong Soil, Safe
Water
Prioritize vulnerable landscapes and
soils for federal and state incentive
programs.
Target vulnerable landscapes that need more
protective measures and, possibly, more incentive
for set-aside.
USDA NRCS Congress
Facilitate approval and adoption of technologies
that will increase yields without depleting or
compromising resources.
USDA
Congress, Iowa Secretary
of Ag, ISU, Ag &
Commodity Organizations,
Ag Producers
Recognize the debt and equity capital needs of
commodity producers, and processors that
source commodities, caused by increasingly
volatile market cycles.
Lenders
USDA, Congress, Iowa
Governor, Iowa Secretary
of Ag, Businesses
Expand Exports
Lead efforts to open markets for
Iowa commodities and value-added
products.
Influence US Administration to swiftly negotiate
pending and future Free Trade Agreements.Iowa Governor
Congress, Iowa
Legislature, Iowa
Secretary of Ag
Build the Base
Increase the production of
established Iowa commodities, both
crop and livestock.

Iowa Governor
444 | Context | Iowa AgriScope 2030
Team
Leader
Strategy Recommendations Actions Team Leader(s) Team Member(s)
Perform an in-depth scan of regulatory and
permitting programs to identify those that are not
delivering the legislated intent.
Iowa GovernorIDNR, Other Regulatory
Agencies
Evaluate systems proven to bring about
improvement and choose one best suited to
Iowa’s government (i.e. Six Sigma, Good to
Great, Lean Manufacturing, etc.).
Iowa Governor
Provide funding and lead application of the
chosen system to government agencies and
systems, beginning with regulatory and permitting
programs that affect agriculture and related
businesses.
Iowa Governor Iowa Legislature
Determine the effect that Iowa’s
business tax ranking is having on the
retention and attraction of bio based
businesses to Iowa.
If analysis proves advisable, take measures to
improve Iowa’s business tax ranking over the next
five years, then continue to strive for an ever
more business-friendly tax structure.
Iowa Governor Iowa Legislature
World Class
Research &
Education
Recognize the value of research as
both a basis and a catalyst for
innovation and provide Iowa's public
research institutions with the
resources needed to effectively
foster innovation.
Increase state support of research and
development that improves Iowa’s position as an
agriculture, food and renewable fuel innovator.
Iowa Governor, Iowa
Legislature
Influence US Administration to swiftly negotiate
pending and future Free Trade Agreements.Iowa Governor
Congress, Iowa
Legislature, Iowa
Secretary of Ag
Explore opportunities to pursue direct market
arrangements between Iowa producers and
processors with potential foreign customers.
Iowa Governor Iowa Secretary of Ag
Capitalize on Iowa’s ‘brand’ for quality and
dependability: promote Iowa products as high
quality, safe and beneficial .
Iowa Governor
Iowa Secretary of Ag, I-
PEP, Ag & Commodity
Organizations, Businesses
Effect lasting improvement to the
state regulatory and permitting
processes.
Lead efforts to open markets for
Iowa commodities and value-added
products.
Reasonable
Regulations &
Taxes
Expand Exports

Iowa Governor
445 | Context | Iowa AgriScope 2030
Team
Member
Strategy Recommendations Actions Team Leader(s) Team Member(s)
Pass only laws/regulations with sunset dates so
that they must be revisited within a few years and
determined to be still valid, or not.
Iowa Legislature Iowa Governor
Reform the permit system to allow applications
and permits to cover the entire state, not just a
particular jurisdiction.
IDNR, Other Regulatory
Agencies
Iowa Governor, Iowa
Legislature, Rural
Counties/Communities
Reform the permit system to allow amendment of
permits, so that reapplication is not necessary
each time regulations change or when businesses
change only one aspect of their operation.
IDNR, Other Regulatory
Agencies
Iowa Governor, Iowa
Legislature, Rural
Counties/Communities
Administer reasonable, fair and
relevant regulatory enforcement.
Create a culture of goal-directed enforcement
within state regulatory agencies (enforcement
should be directed by the goal of the regulation)
and discourage a ‘gotcha’ approach.
IDNR, Other Regulatory
AgenciesIowa Governor
Determine the effect that Iowa’s
business tax ranking is having on the
retention and attraction of bio based
businesses to Iowa.
Lower corporate income tax or provide a tax
credit for investment to offset inhibiting effect of
business tax.
Iowa Legislature Iowa Governor
Reasonable
Regulations &
Taxes
Effect lasting improvement to the
state regulatory and permitting
processes.

Iowa Governor
446 | Context | Iowa AgriScope 2030
Team
Member
Strategy Recommendations Actions Team Leader(s) Team Member(s)
Increase funding levels for public research that
develops pathways for sustainable production
increases and profitability: solving problems of
commercial crop and livestock production.
Congress, Iowa Legislature
USDA, Iowa Governor,
Iowa Secretary of Ag, ISU,
Ag & Commodity
Organizations, Ag
Producers
Support research and development of processes
that turn bi-products and waste materials into
usable products.
Businesses
USDA, Iowa Governor,
Iowa Legislature, ISU, Ag
& Commodity
Organizations, Ag
Producers
Support biofuels research and development to
stay on the cutting edge of new efficiencies and
technologies.
Businesses
USDA, Iowa Governor,
Iowa Legislature, ISU, Ag
& Commodity
Organizations
Focus currently available state funding on
research and development programs that foster
innovation and lead to economic activity.
ISU
Iowa Governor, Iowa
Legislature, Other
Universities
Reward those institutions or individuals who focus
their research on innovative, cutting edge solutions
to current and emerging challenges in Iowa’s
agriculture industry.
Board of RegentsIowa Governor, Iowa
Legislature, IDALS, I-PEP
Provide an information infrastructure that makes it
possible for Iowa researchers to monitor and
manage research and development around the
world.
Businesses
Iowa Governor, Iowa
Legislature, ISU, Other
Universities
Tie state research funding to an incentive to
develop and commercialize in Iowa.ISU
Iowa Governor, Iowa
Legislature
Support, to the greatest extent
possible, research and innovation that
builds Iowa's agriculture production
and value added endeavors.
Recognize the value of research as
both a basis and a catalyst for
innovation and provide Iowa's public
research institutions with the
resources needed to effectively
foster innovation.
World Class
Research &
Education

Iowa Governor
447 | Context | Iowa AgriScope 2030
Team
Member
Strategy Recommendations Actions Team Leader(s) Team Member(s)
Prevent the need for subsidy programs by
providing access to revenue insurance, loan
guarantees, etc.
Congress USDA, Iowa Governor
Recognize the debt and equity capital needs of
commodity producers, and processors that
source commodities, caused by increasingly
volatile market cycles.
Lenders
USDA, Congress, Iowa
Governor, Iowa Secretary
of Ag, Businesses
Build on global leadership in value-
added products (i.e. bio-fuels, meat
and other food processing).
Recruit new food processing businesses to the
state.I-PEP
Iowa Governor, Iowa
Secretary of Ag, IDALS,
Ag & Commodity
Organizations, Businesses
Add value to the value-added and
build on the success of Iowa
businesses.
Encourage Iowans to invest in businesses that are
adding value to local commodities and providing
economic activity in their communities through
investment income tax policy.
Iowa LegislatureIowa Governor, Iowa
Secretary of Ag
Increase the production of
established Iowa commodities, both
crop and livestock.
Build the Base
Add Value

Iowa Legislators
448 | Context | Iowa AgriScope 2030
Team
Leader
Strategy Recommendations Actions Team Leader(s) Team Member(s)
Effect lasting improvement to the
state regulatory and permitting
processes.
Pass only laws/regulations with sunset dates so
that they must be revisited within a few years and
determined to be still valid, or not.
Iowa Legislature Iowa Governor
Determine the effect that Iowa’s
business tax ranking is having on the
retention and attraction of bio based
businesses to Iowa.
Lower corporate income tax or provide a tax
credit for investment to offset inhibiting effect of
business tax.
Iowa Legislature Iowa Governor
Support, to the greatest extent
possible, research and innovation that
builds Iowa's agriculture production
and value added endeavors.
Increase funding levels for public research that
develops pathways for sustainable production
increases and profitability: solving problems of
commercial crop and livestock production.
Congress, Iowa Legislature
USDA, Iowa Governor,
Iowa Secretary of Ag, ISU,
Ag & Commodity
Organizations, Ag
Producers
Recognize the value of research as
both a basis and a catalyst for
innovation and provide Iowa's public
research institutions with the
resources needed to effectively
foster innovation.
Increase state support of research and
development that improves Iowa’s position as an
agriculture, food and renewable fuel innovator.
Iowa Governor, Iowa
Legislature
Add Value
Add value to the value-added and
build on the success of Iowa
businesses.
Encourage Iowans to invest in businesses that are
adding value to local commodities and providing
economic activity in their communities through
investment income tax policy.
Iowa LegislatureIowa Governor, Iowa
Secretary of Ag
Reasonable
Regulations &
Taxes
World Class
Research &
Education

Iowa Legislators
449 | Context | Iowa AgriScope 2030
Team
Member
Strategy Recommendations Actions Team Leader(s) Team Member(s)
Provide funding and lead application of the
chosen system to government agencies and
systems, beginning with regulatory and permitting
programs that affect agriculture and related
businesses.
Iowa Governor Iowa Legislature
Reform the permit system to allow applications
and permits to cover the entire state, not just a
particular jurisdiction.
IDNR, Other Regulatory
Agencies
Iowa Governor, Iowa
Legislature, Rural
Counties/Communities
Reform the permit system to allow amendment of
permits, so that reapplication is not necessary
each time regulations change or when businesses
change only one aspect of their operation.
IDNR, Other Regulatory
Agencies
Iowa Governor, Iowa
Legislature, Rural
Counties/Communities
Determine the effect that Iowa’s
business tax ranking is having on the
retention and attraction of bio based
businesses to Iowa.
If analysis proves advisable, take measures to
improve Iowa’s business tax ranking over the next
five years, then continue to strive for an ever
more business-friendly tax structure.
Iowa Governor Iowa Legislature
Reasonable
Regulations &
Taxes
Effect lasting improvement to the
state regulatory and permitting
processes.

Iowa Legislators
450 | Context | Iowa AgriScope 2030
Team
Member
Strategy Recommendations Actions Team Leader(s) Team Member(s)
Support research and development of processes
that turn bi-products and waste materials into
usable products.
Businesses
USDA, Iowa Governor,
Iowa Legislature, ISU, Ag
& Commodity
Organizations, Ag
Producers
Support biofuels research and development to
stay on the cutting edge of new efficiencies and
technologies.
Businesses
USDA, Iowa Governor,
Iowa Legislature, ISU, Ag
& Commodity
Organizations
Focus currently available state funding on
research and development programs that foster
innovation and lead to economic activity.
ISU
Iowa Governor, Iowa
Legislature, Other
Universities
Reward those institutions or individuals who focus
their research on innovative, cutting edge solutions
to current and emerging challenges in Iowa’s
agriculture industry.
Board of RegentsIowa Governor, Iowa
Legislature, IDALS, I-PEP
Provide an information infrastructure that makes it
possible for Iowa researchers to monitor and
manage research and development around the
world.
Businesses
Iowa Governor, Iowa
Legislature, ISU, Other
Universities
Tie state research funding to an incentive to
develop and commercialize in Iowa.ISU
Iowa Governor, Iowa
Legislature
World Class
Research &
Education
Support, to the greatest extent
possible, research and innovation that
builds Iowa's agriculture production
and value added endeavors.
Recognize the value of research as
both a basis and a catalyst for
innovation and provide Iowa's public
research institutions with the
resources needed to effectively
foster innovation.

Iowa Legislators
451 | Context | Iowa AgriScope 2030
Team
Member
Strategy Recommendations Actions Team Leader(s) Team Member(s)
Build the Base
Increase the production of
established Iowa commodities, both
crop and livestock.
Promote and utilize livestock manure as a
valuable, natural, locally-produced source of
nitrogen and organic matter.
Iowa Secretary of Ag
USDA, Iowa Legislature,
IDALS, ISU, Ag &
Commodity Organizations,
Ag Producers, SWCDs,
Coalition to Support
Farmers
Influence US Administration to swiftly negotiate
pending and future Free Trade Agreements.Iowa Governor
Congress, Iowa
Legislature, Iowa
Secretary of Ag
Support crop and livestock health protection
systems and tools that prevent contracting and
spreading diseases that will close markets.
Iowa Secretary of Ag
Iowa Legislature, IDALS,
ISU, Ag & Commodity
Organizations, Businesses,
Ag Producers
Expand Exports
Lead efforts to open markets for
Iowa commodities and value-added
products.

Iowa Secretary of Agriculture
452 | Context | Iowa AgriScope 2030
Team
Leader
Strategy Recommendations Actions Team Leader(s) Team Member(s)
Strong Soil, Safe
Water
Protect Iowa’s ground and surface
water while optimizing efficient
utilization for both production and
processing.
Take a national leadership role, through a Nutrient
Management Strategy, in developing approaches
to water quality protection that do not
unnecessarily compromise production practices or
processing needs.
Iowa Secretary of Ag
IDALS, Ag & Commodity
Organizations, Ag
Producers, SWCDs
Build the Base
Increase the production of
established Iowa commodities, both
crop and livestock.
Promote and utilize livestock manure as a
valuable, natural, locally-produced source of
nitrogen and organic matter.
Iowa Secretary of Ag
USDA, Iowa Legislature,
IDALS, ISU, Ag &
Commodity Organizations,
Ag Producers, SWCDs,
Coalition to Support
Farmers
Add Value
Build on global leadership in value-
added products (i.e. bio-fuels, meat
and other food processing).
Assure a plentiful supply of base commodities by
encouraging the livestock sector in Iowa.Iowa Secretary of Ag
IDALS, I-PEP, Ag &
Commodity Organizations,
Ag Producers, Coalition to
Support Farmers
Lead efforts to open markets for
Iowa commodities and value-added
products.
Support crop and livestock health protection
systems and tools that prevent contracting and
spreading diseases that will close markets.
Iowa Secretary of Ag
Iowa Legislature, IDALS,
ISU, Ag & Commodity
Organizations, Businesses,
Ag Producers
Include Iowa-based animal health
products and production systems in
promotion efforts, as livestock
production continues to increase
globally.
Iowa Secretary of AgI-PEP, Ag & Commodity
Organizations
Promote and market Iowa agriculture
and processing knowledge, expertise
and management skills: Knowledge
based consulting for bio fuels
processing, food safety, food
processing, livestock production, etc.
Iowa Secretary of Ag I-PEP
Expand Exports

Iowa Secretary of Agriculture
453 | Context | Iowa AgriScope 2030
Team
Member
Strategy Recommendations Actions Team Leader(s) Team Member(s)
World Class
Research &
Education
Support, to the greatest extent
possible, research and innovation that
builds Iowa's agriculture production
and value added endeavors.
Increase funding levels for public research that
develops pathways for sustainable production
increases and profitability: solving problems of
commercial crop and livestock production.
Congress, Iowa Legislature
USDA, Iowa Governor,
Iowa Secretary of Ag, ISU,
Ag & Commodity
Organizations, Ag
Producers
Facilitate approval and adoption of technologies
that will increase yields without depleting or
compromising resources.
USDA
Congress, Iowa Secretary
of Ag, ISU, Ag &
Commodity Organizations,
Ag Producers
Recognize the debt and equity capital needs of
commodity producers, and processors that
source commodities, caused by increasingly
volatile market cycles.
Lenders
USDA, Congress, Iowa
Governor, Iowa Secretary
of Ag, Businesses
Build the Base
Increase the production of
established Iowa commodities, both
crop and livestock.

Iowa Secretary of Agriculture
454 | Context | Iowa AgriScope 2030
Team
Member
Strategy Recommendations Actions Team Leader(s) Team Member(s)
Support development of biofuels bi-product
markets.I-PEP
Iowa Secretary of Ag,
IDALS, ISU, Ag &
Commodity Organizations,
Businesses
Recruit new food processing businesses to the
state.I-PEP
Iowa Governor, Iowa
Secretary of Ag, IDALS,
Ag & Commodity
Organizations, Businesses
Add value to the value-added and
build on the success of Iowa
businesses.
Encourage Iowans to invest in businesses that are
adding value to local commodities and providing
economic activity in their communities through
investment income tax policy.
Iowa LegislatureIowa Governor, Iowa
Secretary of Ag
Recruit further processing businesses
to locate and grow in Iowa,
especially in rural communities.
Identify potential for ‘clusters’ and pursue
businesses in those sectors.Businesses
Iowa Secretary of Ag, I-
PEP, Rural
Counties/Communities
Assess the costs vs. benefit of affecting change in
the system and determine advisability.ISU
Iowa Secretary of Ag,
IDALS, Ag & Commodity
Organizations, Businesses,
Ag Producers
Facilitate changes in the current system that have
the potential to benefit consumers and a full
spectrum of production.
Businesses
Iowa Secretary of Ag, Ag
& Commodity
Organizations, Ag
Producers
Add Value
Build on global leadership in value-
added products (i.e. bio-fuels, meat
and other food processing).
Develop infrastructure and systems
that support segregation, storage,
movement and marketing of value-
added crops and products, specialty
crops, livestock, etc.

Iowa Secretary of Agriculture
455 | Context | Iowa AgriScope 2030
Team
Member
Strategy Recommendations Actions Team Leader(s) Team Member(s)
Influence US Administration to swiftly negotiate
pending and future Free Trade Agreements.Iowa Governor
Congress, Iowa
Legislature, Iowa
Secretary of Ag
Explore opportunities to pursue direct market
arrangements between Iowa producers and
processors with potential foreign customers.
Iowa Governor Iowa Secretary of Ag
Capitalize on Iowa’s ‘brand’ for quality and
dependability: promote Iowa products as high
quality, safe and beneficial .
Iowa Governor
Iowa Secretary of Ag, I-
PEP, Ag & Commodity
Organizations, Businesses
Expand Exports
Lead efforts to open markets for
Iowa commodities and value-added
products.

Iowa Department of Agriculture and Land Stewardship
456 | Context | Iowa AgriScope 2030
Team
Leader
Strategy Recommendations Actions Team Leader(s) Team Member(s)
Work toward and maintain a limit of soil loss
tolerance (T) or less.IDALS Ag Producers, SWCDs
Encourage landlords to use leases that include
incentives for improving the quality of their soil and
conservation practices.
IDALS, Ag Producers,
SWCDsISU
Add Value
Build on global leadership in value-
added products (i.e. bio-fuels, meat
and other food processing).
Encourage branded products built on quality and
unique, value-added attributes.IDALS Businesses, I-PEP, ISU
Strong Soil, Safe
Water
Re-energize Iowa’s commitment to
soil stewardship, addressing both
retention and quality concerns.

Iowa Department of Agriculture and Land Stewardship
457 | Context | Iowa AgriScope 2030
Team
Member
Strategy Recommendations Actions Team Leader(s) Team Member(s)
Re-energize Iowa’s commitment to
soil stewardship, addressing both
retention and quality concerns
Promote the value of adding organic matter to
Iowa soils by proving long-term enhancement of
productive capacity and retention of top soil.
SWCDsUSDA NRCS, IDALS, Ag
Producers
Protect Iowa’s ground and surface
water while optimizing efficient
utilization for both production and
processing.
Take a national leadership role, through a Nutrient
Management Strategy, in developing approaches
to water quality protection that do not
unnecessarily compromise production practices or
processing needs.
Iowa Secretary of Ag
IDALS, Ag & Commodity
Organizations, Ag
Producers, SWCDs
World Class
Research &
Education
Recognize the value of research as
both a basis and a catalyst for
innovation and provide Iowa's public
research institutions with the
resources needed to effectively
foster innovation.
Reward those institutions or individuals who focus
their research on innovative, cutting edge solutions
to current and emerging challenges in Iowa’s
agriculture industry.
Board of RegentsIowa Governor, Iowa
Legislature, IDALS, I-PEP
Promote and utilize livestock manure as a
valuable, natural, locally-produced source of
nitrogen and organic matter.
Iowa Secretary of Ag
USDA, Iowa Legislature,
IDALS, ISU, Ag &
Commodity Organizations,
Ag Producers, SWCDs,
Coalition to Support
Farmers
Encourage and assist local communities that want
to attract and support local livestock production
and food processing.
I-PEP IDALS
Strong Soil, Safe
Water
Build the Base
Increase the production of
established Iowa commodities, both
crop and livestock.

Iowa Department of Agriculture and Land Stewardship
458 | Context | Iowa AgriScope 2030
Team
Member
Strategy Recommendations Actions Team Leader(s) Team Member(s)
Support development of biofuels bi-product
markets.I-PEP
Iowa Secretary of Ag,
IDALS, ISU, Ag &
Commodity Organizations,
Businesses
Assure a plentiful supply of base commodities by
encouraging the livestock sector in Iowa.Iowa Secretary of Ag
IDALS, I-PEP, Ag &
Commodity Organizations,
Ag Producers, Coalition to
Support Farmers
Recruit new food processing businesses to the
state.I-PEP
Iowa Governor, Iowa
Secretary of Ag, IDALS,
Ag & Commodity
Organizations, Businesses
Recruit further processing businesses
to locate and grow in Iowa,
especially in rural communities.
Identify and promote communities that have
plentiful water supply and treatment capability for
ag and food processing plants.
Regional Economic
Development Organizations
I-PEP, IDALS, Rural
Counties/Communities
Develop infrastructure and systems
that support segregation, storage,
movement and marketing of value-
added crops and products, specialty
crops, livestock, etc.
Assess the costs vs. benefit of affecting change in
the system and determine advisability.ISU
Iowa Secretary of Ag,
IDALS, Ag & Commodity
Organizations, Businesses,
Ag Producers
Expand Exports
Lead efforts to open markets for
Iowa commodities and value-added
products.
Support crop and livestock health protection
systems and tools that prevent contracting and
spreading diseases that will close markets.
Iowa Secretary of Ag
Iowa Legislature, IDALS,
ISU, Ag & Commodity
Organizations, Businesses,
Ag Producers
Add Value
Build on global leadership in value-
added products (i.e. bio-fuels, meat
and other food processing).

Iowa Partnership for Economic Progress
459 | Context | Iowa AgriScope 2030
Team
Leader
Strategy Recommendations Actions Team Leader(s) Team Member(s)
Build the Base
Increase the production of
established Iowa commodities, both
crop and livestock.
Encourage and assist local communities that want
to attract and support local livestock production
and food processing.
I-PEP IDALS
Support development of biofuels bi-product
markets.I-PEP
Iowa Secretary of Ag,
IDALS, ISU, Ag &
Commodity Organizations,
Businesses
Recruit new food processing businesses to the
state.I-PEP
Iowa Governor, Iowa
Secretary of Ag, IDALS,
Ag & Commodity
Organizations, Businesses
Identify opportunities for adding value to products
and bi-products and target those opportunities in
promotional efforts.
I-PEPISU, Businesses,
Innovation Council
Recruit businesses that can locate near Iowa’s
ethanol plants and process co-products.I-PEP
Ag & Commodity
Organizations, Rural
Counties/Communities, Ag
Producers
Recruit further processing businesses
to locate and grow in Iowa,
especially in rural communities.
Continually observe trends and keep Iowa in the
forefront of capitalizing on those trends.I-PEP
ISU, Ag & Commodity
Organizations, Businesses,
Ag Producers
Add Value
Build on global leadership in value-
added products (i.e. bio-fuels, meat
and other food processing).
Add value to the value-added and
build on the success of Iowa
businesses.

Iowa Partnership for Economic Progress
460 | Context | Iowa AgriScope 2030
Team
Member
Strategy Recommendations Actions Team Leader(s) Team Member(s)
World Class
Research &
Education
Recognize the value of research as
both a basis and a catalyst for
innovation and provide Iowa's public
research institutions with the
resources needed to effectively
foster innovation.
Reward those institutions or individuals who focus
their research on innovative, cutting edge solutions
to current and emerging challenges in Iowa’s
agriculture industry.
Board of RegentsIowa Governor, Iowa
Legislature, IDALS, I-PEP
Build on global leadership in value-
added products (i.e. bio-fuels, meat
and other food processing).
Assure a plentiful supply of base commodities by
encouraging the livestock sector in Iowa.Iowa Secretary of Ag
IDALS, I-PEP, Ag &
Commodity Organizations,
Ag Producers, Coalition to
Support Farmers
Recruit further processing businesses
to locate and grow in Iowa,
especially in rural communities.
Identify potential for ‘clusters’ and pursue
businesses in those sectors.Businesses
Iowa Secretary of Ag, I-
PEP, Rural
Counties/Communities
Recruit further processing businesses
to locate and grow in Iowa,
especially in rural communities.
Identify and promote communities that have
plentiful water supply and treatment capability for
ag and food processing plants.
Regional Economic
Development Organizations
I-PEP, IDALS, Rural
Counties/Communities
Add Value

Iowa Partnership for Economic Progress
461 | Context | Iowa AgriScope 2030
Team
Member
Strategy Recommendations Actions Team Leader(s) Team Member(s)
Lead efforts to open markets for
Iowa commodities and value-added
products.
Capitalize on Iowa’s ‘brand’ for quality and
dependability: promote Iowa products as high
quality, safe and beneficial .
Iowa Governor
Iowa Secretary of Ag, I-
PEP, Ag & Commodity
Organizations, Businesses
Include Iowa-based animal health
products and production systems in
promotion efforts, as livestock
production continues to increase
globally.
Iowa Secretary of AgI-PEP, Ag & Commodity
Organizations
Promote and market Iowa agriculture
and processing knowledge, expertise
and management skills: Knowledge
based consulting for bio fuels
processing, food safety, food
processing, livestock production, etc.
Iowa Secretary of Ag I-PEP
Add Value
Build on global leadership in value-
added products (i.e. bio-fuels, meat
and other food processing).
Encourage branded products built on quality and
unique, value-added attributes.IDALS Businesses, I-PEP, ISU
Expand Exports

Iowa Department of Natural Resources
462 | Context | Iowa AgriScope 2030
Team
Leader
Strategy Recommendations Actions Team Leader(s) Team Member(s)
Strong Soil, Safe
Water
Protect Iowa’s ground and surface
water while optimizing efficient
utilization for both production and
processing.
Continue to administer fair and reasonable
regulations that prevent run-off from production
agriculture and processing businesses into
surface water supplies.
IDNR
Process applications and permits in a timely,
professional manner. Notify applicants
immediately if there is a problem with the
application and/or notify of delays in the process.
IDNR, Other Regulatory
Agencies
Reform the permit system to allow applications
and permits to cover the entire state, not just a
particular jurisdiction.
IDNR, Other Regulatory
Agencies
Iowa Governor, Iowa
Legislature, Rural
Counties/Communities
Reform the permit system to allow amendment of
permits, so that reapplication is not necessary
each time regulations change or when businesses
change only one aspect of their operation.
IDNR, Other Regulatory
Agencies
Iowa Governor, Iowa
Legislature, Rural
Counties/Communities
Punish habitual offenders and scofflaws, but bring
reason to bear on apparent mistakes,
misunderstandings or alternative interpretation of
the regulation, especially for first-time offenders.
IDNR, Other Regulatory
Agencies
Create a culture of goal-directed enforcement
within state regulatory agencies (enforcement
should be directed by the goal of the regulation)
and discourage a ‘gotcha’ approach.
IDNR, Other Regulatory
AgenciesIowa Governor
Reasonable
Regulations &
Taxes
Effect lasting improvement to the
state regulatory and permitting
processes.
Administer reasonable, fair and
relevant regulatory enforcement.

Iowa Department of Natural Resources
463 | Context | Iowa AgriScope 2030
Team
Member
Strategy Recommendations Actions Team Leader(s) Team Member(s)
Reasonable
Regulations &
Taxes
Effect lasting improvement to the
state regulatory and permitting
processes.
Perform an in-depth scan of regulatory and
permitting programs to identify those that are not
delivering the legislated intent.
Iowa GovernorIDNR, Other Regulatory
Agencies

Iowa Department of Education
464 | Context | Iowa AgriScope 2030
Team
Leader
Strategy Recommendations Actions Team Leader(s) Team Member(s)
Develop and encourage K-12 and post-secondary
education programs that support entrepreneurial
activities and innovation.
IDE local school boards
Encourage an innovation and entrepreneurship
component for STEM.IDE
Ag & Commodity
Organizations, Businesses
Support, encourage and raise the profile of
community college and university education
programs that foster innovation.
IDE
ISU, Other Universities,
Community Colleges,
Board of Regents
World Class
Research &
Education
Establish and foster an innovative and
entrepreneurial climate throughout
Iowa’s education systems.

Iowa State University
465 | Context | Iowa AgriScope 2030
Team
Leader
Strategy Recommendations Actions Team Leader(s) Team Member(s)
Strong Soil, Safe
Water
Re-energize Iowa’s commitment to
soil stewardship, addressing both
retention and quality concerns.
Research use of cover crops as a potential
mitigation for soil loss created by the increasing
number of heavy rain events in Iowa.
ISU
Focus currently available state funding on
research and development programs that foster
innovation and lead to economic activity.
ISU
Iowa Governor, Iowa
Legislature, Other
Universities
Maximize resources and achieve better, quicker
research results by providing leadership for
collaboration with other states’ and countries’
research institutions.
ISU Other Universities
Tie state research funding to an incentive to
develop and commercialize in Iowa.ISU
Iowa Governor, Iowa
Legislature
Build on global leadership in value-
added products (i.e. bio-fuels, meat
and other food processing).
Commit to discovery and adoption of food safety
technologies and processes that assure consumer
confidence.
ISU Businesses
Assess the costs vs. benefit of affecting change in
the system and determine advisability.ISU
Iowa Secretary of Ag,
IDALS, Ag & Commodity
Organizations, Businesses,
Ag Producers
Encourage use of technologies that facilitate crop
to market systems in order to avoid costly
changes.
ISU Businesses, Ag Producers
Add Value
Recognize the value of research as
both a basis and a catalyst for
innovation and provide Iowa's public
research institutions with the
resources needed to effectively
foster innovation.
Develop infrastructure and systems
that support segregation, storage,
movement and marketing of value-
added crops and products, specialty
crops, livestock, etc.
World Class
Research &
Education

Iowa State University
466 | Context | Iowa AgriScope 2030
Team
Member
Strategy Recommendations Actions Team Leader(s) Team Member(s)
Educate landlords about the value of their asset
and the potential to lose that value through tillage
practices that do not protect the soil from eroding
and losing organic matter.
SWCDsUSDA NRCS, ISU, Ag
Producers
Encourage landlords to use leases that include
incentives for improving the quality of their soil and
conservation practices.
IDALS, Ag Producers,
SWCDsISU
Increase funding levels for public research that
develops pathways for sustainable production
increases and profitability: solving problems of
commercial crop and livestock production.
Congress, Iowa Legislature
USDA, Iowa Governor,
Iowa Secretary of Ag, ISU,
Ag & Commodity
Organizations, Ag
Producers
Support research and development of processes
that turn bi-products and waste materials into
usable products.
Businesses
USDA, Iowa Governor,
Iowa Legislature, ISU, Ag
& Commodity
Organizations, Ag
Producers
Support biofuels research and development to
stay on the cutting edge of new efficiencies and
technologies.
Businesses
USDA, Iowa Governor,
Iowa Legislature, ISU, Ag
& Commodity
Organizations
Recognize the value of research as
both a basis and a catalyst for
innovation and provide Iowa's public
research institutions with the
resources needed to effectively
foster innovation.
Provide an information infrastructure that makes it
possible for Iowa researchers to monitor and
manage research and development around the
world.
Businesses
Iowa Governor, Iowa
Legislature, ISU, Other
Universities
Establish and foster an innovative and
entrepreneurial climate throughout
Iowa’s education systems.
Support, encourage and raise the profile of
community college and university education
programs that foster innovation.
IDE
ISU, Other Universities,
Community Colleges,
Board of Regents
Strengthen the exchange of
knowledge between science and
business/industry.
Fully utilize viable results of Iowa-based research
to add value to Iowa products.Businesses
ISU, Ag & Commodity
Organizations, Ag
Producers
Re-energize Iowa’s commitment to
soil stewardship, addressing both
retention and quality concerns.
Support, to the greatest extent
possible, research and innovation that
builds Iowa's agriculture production
and value added endeavors.
Strong Soil, Safe
Water
World Class
Research &
Education

Iowa State University
467 | Context | Iowa AgriScope 2030
Team
Member
Strategy Recommendations Actions Team Leader(s) Team Member(s)
Facilitate approval and adoption of technologies
that will increase yields without depleting or
compromising resources.
USDA
Congress, Iowa Secretary
of Ag, ISU, Ag &
Commodity Organizations,
Ag Producers
Promote and utilize livestock manure as a
valuable, natural, locally-produced source of
nitrogen and organic matter.
Iowa Secretary of Ag
USDA, Iowa Legislature,
IDALS, ISU, Ag &
Commodity Organizations,
Ag Producers, SWCDs,
Coalition to Support
Farmers
Support development of biofuels bi-product
markets.I-PEP
Iowa Secretary of Ag,
IDALS, ISU, Ag &
Commodity Organizations,
Businesses
Encourage branded products built on quality and
unique, value-added attributes.IDALS Businesses, I-PEP, ISU
Add value to the value-added and
build on the success of Iowa
businesses.
Identify opportunities for adding value to products
and bi-products and target those opportunities in
promotional efforts.
I-PEPISU, Businesses,
Innovation Council
Recruit further processing businesses
to locate and grow in Iowa,
especially in rural communities.
Continually observe trends and keep Iowa in the
forefront of capitalizing on those trends.I-PEP
ISU, Ag & Commodity
Organizations, Businesses,
Ag Producers
Expand Exports
Lead efforts to open markets for
Iowa commodities and value-added
products.
Support crop and livestock health protection
systems and tools that prevent contracting and
spreading diseases that will close markets.
Iowa Secretary of Ag
Iowa Legislature, IDALS,
ISU, Ag & Commodity
Organizations, Businesses,
Ag Producers
Add Value
Build on global leadership in value-
added products (i.e. bio-fuels, meat
and other food processing).
Increase the production of
established Iowa commodities, both
crop and livestock.
Build the Base

Other Universities
468 | Context | Iowa AgriScope 2030
Team
Member
Strategy Recommendations Actions Team Leader(s) Team Member(s)
Focus currently available state funding on
research and development programs that foster
innovation and lead to economic activity.
ISU
Iowa Governor, Iowa
Legislature, Other
Universities
Maximize resources and achieve better, quicker
research results by providing leadership for
collaboration with other states’ and countries’
research institutions.
ISU Other Universities
Provide an information infrastructure that makes it
possible for Iowa researchers to monitor and
manage research and development around the
world.
Businesses
Iowa Governor, Iowa
Legislature, ISU, Other
Universities
Establish and foster an innovative and
entrepreneurial climate throughout
Iowa’s education systems.
Support, encourage and raise the profile of
community college and university education
programs that foster innovation.
IDE
ISU, Other Universities,
Community Colleges,
Board of Regents
World Class
Research &
Education
Recognize the value of research as
both a basis and a catalyst for
innovation and provide Iowa's public
research institutions with the
resources needed to effectively
foster innovation.

Community Colleges
469 | Context | Iowa AgriScope 2030
Team
Member
Strategy Recommendations Actions Team Leader(s) Team Member(s)
World Class
Research &
Education
Establish and foster an innovative and
entrepreneurial climate throughout
Iowa’s education systems.
Support, encourage and raise the profile of
community college and university education
programs that foster innovation.
IDE
ISU, Other Universities,
Community Colleges,
Board of Regents

Agriculture & Commodity Organizations
470 | Context | Iowa AgriScope 2030
Team
Leader
Strategy Recommendations Actions Team Leader(s) Team Member(s)
Build the Base
Increase the production of
established Iowa commodities, both
crop and livestock.
Capitalize on Iowa’s competitive advantage for
livestock production and establish a ‘Protein Pro
Team’ approach to promoting responsible growth
in the sector.
Ag & Commodity
OrganizationsAg Producers

Agriculture & Commodity Organizations
471 | Context | Iowa AgriScope 2030
Team
Member
Strategy Recommendations Actions Team Leader(s) Team Member(s)
Strong Soil, Safe
Water
Protect Iowa’s ground and surface
water while optimizing efficient
utilization for both production and
processing.
Take a national leadership role, through a Nutrient
Management Strategy, in developing approaches
to water quality protection that do not
unnecessarily compromise production practices or
processing needs.
Iowa Secretary of Ag
IDALS, Ag & Commodity
Organizations, Ag
Producers, SWCDs
Increase funding levels for public research that
develops pathways for sustainable production
increases and profitability: solving problems of
commercial crop and livestock production.
Congress, Iowa Legislature
USDA, Iowa Governor,
Iowa Secretary of Ag, ISU,
Ag & Commodity
Organizations, Ag
Producers
Support research and development of processes
that turn bi-products and waste materials into
usable products.
Businesses
USDA, Iowa Governor,
Iowa Legislature, ISU, Ag
& Commodity
Organizations, Ag
Producers
Support biofuels research and development to
stay on the cutting edge of new efficiencies and
technologies.
Businesses
USDA, Iowa Governor,
Iowa Legislature, ISU, Ag
& Commodity
Organizations
Establish and foster an innovative and
entrepreneurial climate throughout
Iowa’s education systems.
Encourage an innovation and entrepreneurship
component for STEM.IDE
Ag & Commodity
Organizations, Businesses
Strengthen the exchange of
knowledge between science and
business/industry.
Fully utilize viable results of Iowa-based research
to add value to Iowa products.Businesses
ISU, Ag & Commodity
Organizations, Ag
Producers
Support, to the greatest extent
possible, research and innovation that
builds Iowa's agriculture production
and value added endeavors.
World Class
Research &
Education

Agriculture & Commodity Organizations
472 | Context | Iowa AgriScope 2030
Team
Member
Strategy Recommendations Actions Team Leader(s) Team Member(s)
Facilitate approval and adoption of technologies
that will increase yields without depleting or
compromising resources.
USDA
Congress, Iowa Secretary
of Ag, ISU, Ag &
Commodity Organizations,
Ag Producers
Promote and utilize livestock manure as a
valuable, natural, locally-produced source of
nitrogen and organic matter.
Iowa Secretary of Ag
USDA, Iowa Legislature,
IDALS, ISU, Ag &
Commodity Organizations,
Ag Producers, SWCDs,
Coalition to Support
Farmers
Adopt a pro-active, self-regulating attitude in
order to prevent problems.Ag Producers
Ag & Commodity
Organizations
Increase the production of
established Iowa commodities, both
crop and livestock.
Build the Base

Agriculture & Commodity Organizations
473 | Context | Iowa AgriScope 2030
Team
Member
Strategy Recommendations Actions Team Leader(s) Team Member(s)
Support development of biofuels bi-product
markets.I-PEP
Iowa Secretary of Ag,
IDALS, ISU, Ag &
Commodity Organizations,
Businesses
Assure a plentiful supply of base commodities by
encouraging the livestock sector in Iowa.Iowa Secretary of Ag
IDALS, I-PEP, Ag &
Commodity Organizations,
Ag Producers, Coalition to
Support Farmers
Recruit new food processing businesses to the
state.I-PEP
Iowa Governor, Iowa
Secretary of Ag, IDALS,
Ag & Commodity
Organizations, Businesses
Add value to the value-added and
build on the success of Iowa
businesses.
Recruit businesses that can locate near Iowa’s
ethanol plants and process co-products.I-PEP
Ag & Commodity
Organizations, Rural
Counties/Communities, Ag
Producers
Recruit further processing businesses
to locate and grow in Iowa,
especially in rural communities.
Continually observe trends and keep Iowa in the
forefront of capitalizing on those trends.I-PEP
ISU, Ag & Commodity
Organizations, Businesses,
Ag Producers
Assess the costs vs. benefit of affecting change in
the system and determine advisability.ISU
Iowa Secretary of Ag,
IDALS, Ag & Commodity
Organizations, Businesses,
Ag Producers
Facilitate changes in the current system that have
the potential to benefit consumers and a full
spectrum of production.
Businesses
Iowa Secretary of Ag, Ag
& Commodity
Organizations, Ag
Producers
Build on global leadership in value-
added products (i.e. bio-fuels, meat
and other food processing).
Develop infrastructure and systems
that support segregation, storage,
movement and marketing of value-
added crops and products, specialty
crops, livestock, etc.
Add Value

Agriculture & Commodity Organizations
474 | Context | Iowa AgriScope 2030
Team
Member
Strategy Recommendations Actions Team Leader(s) Team Member(s)
Capitalize on Iowa’s ‘brand’ for quality and
dependability: promote Iowa products as high
quality, safe and beneficial .
Iowa Governor
Iowa Secretary of Ag, I-
PEP, Ag & Commodity
Organizations, Businesses
Support crop and livestock health protection
systems and tools that prevent contracting and
spreading diseases that will close markets.
Iowa Secretary of Ag
Iowa Legislature, IDALS,
ISU, Ag & Commodity
Organizations, Businesses,
Ag Producers
Include Iowa-based animal health
products and production systems in
promotion efforts, as livestock
production continues to increase
globally.
Iowa Secretary of AgI-PEP, Ag & Commodity
Organizations
Lead efforts to open markets for
Iowa commodities and value-added
products.
Expand Exports

Other Organizations
475 | Context | Iowa AgriScope 2030
Team
Member
Strategy Recommendations Actions Team Leader(s) Team Member(s)
Build the Base
Increase the production of
established Iowa commodities, both
crop and livestock.
Mitigate concerns/conflicts that arise from
erroneous perceptions or cavalier attitudes.
Coalition to Support
Farmers
Other Organizations,
SWCDs

Rural Counties & Communities
476 | Context | Iowa AgriScope 2030
Team
Member
Strategy Recommendations Actions Team Leader(s) Team Member(s)
Reform the permit system to allow applications
and permits to cover the entire state, not just a
particular jurisdiction.
IDNR, Other Regulatory
Agencies
Iowa Governor, Iowa
Legislature, Rural
Counties/Communities
Reform the permit system to allow amendment of
permits, so that reapplication is not necessary
each time regulations change or when businesses
change only one aspect of their operation.
IDNR, Other Regulatory
Agencies
Iowa Governor, Iowa
Legislature, Rural
Counties/Communities
Add value to the value-added and
build on the success of Iowa
businesses.
Recruit businesses that can locate near Iowa’s
ethanol plants and process co-products.I-PEP
Ag & Commodity
Organizations, Rural
Counties/Communities, Ag
Producers
Identify potential for ‘clusters’ and pursue
businesses in those sectors.Businesses
Iowa Secretary of Ag, I-
PEP, Rural
Counties/Communities
Identify and promote communities that have
plentiful water supply and treatment capability for
ag and food processing plants.
Regional Economic
Development Organizations
I-PEP, IDALS, Rural
Counties/Communities
Reasonable
Regulations &
Taxes
Add Value
Effect lasting improvement to the
state regulatory and permitting
processes.
Recruit further processing businesses
to locate and grow in Iowa,
especially in rural communities.

Businesses
477 | Context | Iowa AgriScope 2030
Team
Leader
Strategy Recommendations Actions Team Leader(s) Team Member(s)
Support research and development of processes
that turn bi-products and waste materials into
usable products.
Businesses
USDA, Iowa Governor,
Iowa Legislature, ISU, Ag
& Commodity
Organizations, Ag
Producers
Support biofuels research and development to
stay on the cutting edge of new efficiencies and
technologies.
Businesses
USDA, Iowa Governor,
Iowa Legislature, ISU, Ag
& Commodity
Organizations
Recognize the value of research as
both a basis and a catalyst for
innovation and provide Iowa's public
research institutions with the
resources needed to effectively
foster innovation.
Provide an information infrastructure that makes it
possible for Iowa researchers to monitor and
manage research and development around the
world.
Businesses
Iowa Governor, Iowa
Legislature, ISU, Other
Universities
Strengthen the exchange of
knowledge between science and
business/industry.
Fully utilize viable results of Iowa-based research
to add value to Iowa products.Businesses
ISU, Ag & Commodity
Organizations, Ag
Producers
Recruit further processing businesses
to locate and grow in Iowa,
especially in rural communities.
Identify potential for ‘clusters’ and pursue
businesses in those sectors.Businesses
Iowa Secretary of Ag, I-
PEP, Rural
Counties/Communities
Develop infrastructure and systems
that support segregation, storage,
movement and marketing of value-
added crops and products, specialty
crops, livestock, etc.
Facilitate changes in the current system that have
the potential to benefit consumers and a full
spectrum of production.
Businesses
Iowa Secretary of Ag, Ag
& Commodity
Organizations, Ag
Producers
World Class
Research &
Education
Support, to the greatest extent
possible, research and innovation that
builds Iowa's agriculture production
and value added endeavors.
Add Value

Businesses
478 | Context | Iowa AgriScope 2030
Team
Member
Strategy Recommendations Actions Team Leader(s) Team Member(s)
World Class
Research &
Education
Establish and foster an innovative and
entrepreneurial climate throughout
Iowa’s education systems.
Encourage an innovation and entrepreneurship
component for STEM.IDE
Ag & Commodity
Organizations, Businesses
Build the Base
Increase the production of
established Iowa commodities, both
crop and livestock.
Recognize the debt and equity capital needs of
commodity producers, and processors that
source commodities, caused by increasingly
volatile market cycles.
Lenders
USDA, Congress, Iowa
Governor, Iowa Secretary
of Ag, Businesses
Support development of biofuels bi-product
markets.I-PEP
Iowa Secretary of Ag,
IDALS, ISU, Ag &
Commodity Organizations,
Businesses
Commit to discovery and adoption of food safety
technologies and processes that assure consumer
confidence.
ISU Businesses
Recruit new food processing businesses to the
state.I-PEP
Iowa Governor, Iowa
Secretary of Ag, IDALS,
Ag & Commodity
Organizations, Businesses
Add value to the value-added and
build on the success of Iowa
businesses.
Identify opportunities for adding value to products
and bi-products and target those opportunities in
promotional efforts.
I-PEPISU, Businesses,
Innovation Council
Recruit further processing businesses
to locate and grow in Iowa,
especially in rural communities.
Continually observe trends and keep Iowa in the
forefront of capitalizing on those trends.I-PEP
ISU, Ag & Commodity
Organizations, Businesses,
Ag Producers
Assess the costs vs. benefit of affecting change in
the system and determine advisability.ISU
Iowa Secretary of Ag,
IDALS, Ag & Commodity
Organizations, Businesses,
Ag Producers
Encourage use of technologies that facilitate crop
to market systems in order to avoid costly
changes.
ISU Businesses, Ag Producers
Add Value
Build on global leadership in value-
added products (i.e. bio-fuels, meat
and other food processing).
Develop infrastructure and systems
that support segregation, storage,
movement and marketing of value-
added crops and products, specialty
crops, livestock, etc.

Businesses
479 | Context | Iowa AgriScope 2030
Team
Member
Strategy Recommendations Actions Team Leader(s) Team Member(s)
Capitalize on Iowa’s ‘brand’ for quality and
dependability: promote Iowa products as high
quality, safe and beneficial .
Iowa Governor
Iowa Secretary of Ag, I-
PEP, Ag & Commodity
Organizations, Businesses
Support crop and livestock health protection
systems and tools that prevent contracting and
spreading diseases that will close markets.
Iowa Secretary of Ag
Iowa Legislature, IDALS,
ISU, Ag & Commodity
Organizations, Businesses,
Ag Producers
Add Value
Build on global leadership in value-
added products (i.e. bio-fuels, meat
and other food processing).
Encourage branded products built on quality and
unique, value-added attributes.IDALS Businesses, I-PEP, ISU
Expand Exports
Lead efforts to open markets for
Iowa commodities and value-added
products.

Agriculture Producers
480 | Context | Iowa AgriScope 2030
Team
Leader
Strategy Recommendations Actions Team Leader(s) Team Member(s)
Protect and retain current soil saving
structures/practices and resist incentives to farm
through or over them.
Ag Producers
Encourage landlords to use leases that include
incentives for improving the quality of their soil and
conservation practices.
IDALS, Ag Producers,
SWCDsISU
Employ practices recommended to increase
organic carbon levels in soil such as no-till, cover
crops, crop rotation and use of livestock manure
for fertilizer.
Ag Producers
Build the Base
Increase the production of
established Iowa commodities, both
crop and livestock.
Adopt a pro-active, self-regulating attitude in
order to prevent problems.Ag Producers
Ag & Commodity
Organizations
Re-energize Iowa’s commitment to
soil stewardship, addressing both
retention and quality concerns.
Strong Soil, Safe
Water

Agriculture Producers
481 | Context | Iowa AgriScope 2030
Team
Member
Strategy Recommendations Actions Team Leader(s) Team Member(s)
Work toward and maintain a limit of soil loss
tolerance (T) or less.IDALS Ag Producers, SWCDs
Educate landlords about the value of their asset
and the potential to lose that value through tillage
practices that do not protect the soil from eroding
and losing organic matter.
SWCDsUSDA NRCS, ISU, Ag
Producers
Promote the value of adding organic matter to
Iowa soils by proving long-term enhancement of
productive capacity and retention of top soil.
SWCDsUSDA NRCS, IDALS, Ag
Producers
Protect Iowa’s ground and surface
water while optimizing efficient
utilization for both production and
processing.
Take a national leadership role, through a Nutrient
Management Strategy, in developing approaches
to water quality protection that do not
unnecessarily compromise production practices or
processing needs.
Iowa Secretary of Ag
IDALS, Ag & Commodity
Organizations, Ag
Producers, SWCDs
Increase funding levels for public research that
develops pathways for sustainable production
increases and profitability: solving problems of
commercial crop and livestock production.
Congress, Iowa Legislature
USDA, Iowa Governor,
Iowa Secretary of Ag, ISU,
Ag & Commodity
Organizations, Ag
Producers
Support research and development of processes
that turn bi-products and waste materials into
usable products.
Businesses
USDA, Iowa Governor,
Iowa Legislature, ISU, Ag
& Commodity
Organizations, Ag
Producers
Strengthen the exchange of
knowledge between science and
business/industry.
Fully utilize viable results of Iowa-based research
to add value to Iowa products.Businesses
ISU, Ag & Commodity
Organizations, Ag
Producers
Strong Soil, Safe
Water
World Class
Research &
Education
Re-energize Iowa’s commitment to
soil stewardship, addressing both
retention and quality concerns.
Support, to the greatest extent
possible, research and innovation that
builds Iowa's agriculture production
and value added endeavors.

Agriculture Producers
482 | Context | Iowa AgriScope 2030
Team
Member
Strategy Recommendations Actions Team Leader(s) Team Member(s)
Facilitate approval and adoption of technologies
that will increase yields without depleting or
compromising resources.
USDA
Congress, Iowa Secretary
of Ag, ISU, Ag &
Commodity Organizations,
Ag Producers
Promote and utilize livestock manure as a
valuable, natural, locally-produced source of
nitrogen and organic matter.
Iowa Secretary of Ag
USDA, Iowa Legislature,
IDALS, ISU, Ag &
Commodity Organizations,
Ag Producers, SWCDs,
Coalition to Support
Farmers
Capitalize on Iowa’s competitive advantage for
livestock production and establish a ‘Protein Pro
Team’ approach to promoting responsible growth
in the sector.
Ag & Commodity
OrganizationsAg Producers
Increase the production of
established Iowa commodities, both
crop and livestock.
Build the Base

Agriculture Producers
483 | Context | Iowa AgriScope 2030
Team
Member
Strategy Recommendations Actions Team Leader(s) Team Member(s)
Build on global leadership in value-
added products (i.e. bio-fuels, meat
and other food processing).
Assure a plentiful supply of base commodities by
encouraging the livestock sector in Iowa.Iowa Secretary of Ag
IDALS, I-PEP, Ag &
Commodity Organizations,
Ag Producers, Coalition to
Support Farmers
Add value to the value-added and
build on the success of Iowa
businesses.
Recruit businesses that can locate near Iowa’s
ethanol plants and process co-products.I-PEP
Ag & Commodity
Organizations, Rural
Counties/Communities, Ag
Producers
Recruit further processing businesses
to locate and grow in Iowa,
especially in rural communities.
Continually observe trends and keep Iowa in the
forefront of capitalizing on those trends.I-PEP
ISU, Ag & Commodity
Organizations, Businesses,
Ag Producers
Assess the costs vs. benefit of affecting change in
the system and determine advisability.ISU
Iowa Secretary of Ag,
IDALS, Ag & Commodity
Organizations, Businesses,
Ag Producers
Encourage use of technologies that facilitate crop
to market systems in order to avoid costly
changes.
ISU Businesses, Ag Producers
Facilitate changes in the current system that have
the potential to benefit consumers and a full
spectrum of production.
Businesses
Iowa Secretary of Ag, Ag
& Commodity
Organizations, Ag
Producers
Expand Exports
Lead efforts to open markets for
Iowa commodities and value-added
products.
Support crop and livestock health protection
systems and tools that prevent contracting and
spreading diseases that will close markets.
Iowa Secretary of Ag
Iowa Legislature, IDALS,
ISU, Ag & Commodity
Organizations, Businesses,
Ag Producers
Develop infrastructure and systems
that support segregation, storage,
movement and marketing of value-
added crops and products, specialty
crops, livestock, etc.
Add Value

Soil & Water Conservation Districts
484 | Context | Iowa AgriScope 2030
Team
Leader
Strategy Recommendations Actions Team Leader(s) Team Member(s)
Educate landlords about the value of their asset
and the potential to lose that value through tillage
practices that do not protect the soil from eroding
and losing organic matter.
SWCDsUSDA NRCS, ISU, Ag
Producers
Encourage landlords to use leases that include
incentives for improving the quality of their soil and
conservation practices.
IDALS, Ag Producers,
SWCDsISU
Promote the value of adding organic matter to
Iowa soils by proving long-term enhancement of
productive capacity and retention of top soil.
SWCDsUSDA NRCS, IDALS, Ag
Producers
Strong Soil, Safe
Water
Re-energize Iowa’s commitment to
soil stewardship, addressing both
retention and quality concerns.

Soil & Water Conservation Districts
485 | Context | Iowa AgriScope 2030
Team
Member
Strategy Recommendations Actions Team Leader(s) Team Member(s)
Re-energize Iowa’s commitment to
soil stewardship, addressing both
retention and quality concerns.
Work toward and maintain a limit of soil loss
tolerance (T) or less.IDALS Ag Producers, SWCDs
Protect Iowa’s ground and surface
water while optimizing efficient
utilization for both production and
processing.
Take a national leadership role, through a Nutrient
Management Strategy, in developing approaches
to water quality protection that do not
unnecessarily compromise production practices or
processing needs.
Iowa Secretary of Ag
IDALS, Ag & Commodity
Organizations, Ag
Producers, SWCDs
Promote and utilize livestock manure as a
valuable, natural, locally-produced source of
nitrogen and organic matter.
Iowa Secretary of Ag
USDA, Iowa Legislature,
IDALS, ISU, Ag &
Commodity Organizations,
Ag Producers, SWCDs,
Coalition to Support
Farmers
Mitigate concerns/conflicts that arise from
erroneous perceptions or cavalier attitudes.
Coalition to Support
Farmers
Other Organizations,
SWCDs
Strong Soil, Safe
Water
Build the Base
Increase the production of
established Iowa commodities, both
crop and livestock.

Board of Regents
486 | Context | Iowa AgriScope 2030
Team
Leader
Strategy Recommendations Actions Team Leader(s) Team Member(s)
World Class
Research &
Education
Recognize the value of research as
both a basis and a catalyst for
innovation and provide Iowa's public
research institutions with the
resources needed to effectively
foster innovation.
Reward those institutions or individuals who focus
their research on innovative, cutting edge solutions
to current and emerging challenges in Iowa’s
agriculture industry.
Board of RegentsIowa Governor, Iowa
Legislature, IDALS, I-PEP

Board of Regents
487 | Context | Iowa AgriScope 2030
Team
Member
Strategy Recommendations Actions Team Leader(s) Team Member(s)
World Class
Research &
Education
Establish and foster an innovative and
entrepreneurial climate throughout
Iowa’s education systems.
Support, encourage and raise the profile of
community college and university education
programs that foster innovation.
IDE
ISU, Other Universities,
Community Colleges,
Board of Regents

Local School Boards
488 | Context | Iowa AgriScope 2030
Team
Member
Strategy Recommendations Actions Team Leader(s) Team Member(s)
World Class
Research &
Education
Establish and foster an innovative and
entrepreneurial climate throughout
Iowa’s education systems.
Develop and encourage K-12 and post-secondary
education programs that support entrepreneurial
activities and innovation.
IDE local school boards

Innovation Council
489 | Context | Iowa AgriScope 2030
Team
Member
Strategy Recommendations Actions Team Leader(s) Team Member(s)
Add Value
Add value to the value-added and
build on the success of Iowa
businesses.
Identify opportunities for adding value to products
and bi-products and target those opportunities in
promotional efforts.
I-PEPISU, Businesses,
Innovation Council

Lenders
490 | Context | Iowa AgriScope 2030
Team
Leader
Strategy Recommendations Actions Team Leader(s) Team Member(s)
Build the Base
Increase the production of
established Iowa commodities, both
crop and livestock.
Recognize the debt and equity capital needs of
commodity producers, and processors that
source commodities, caused by increasingly
volatile market cycles.
Lenders
USDA, Congress, Iowa
Governor, Iowa Secretary
of Ag, Businesses

Coalition to Support Iowa Farmers
491 | Context | Iowa AgriScope 2030
Team
Leader
Strategy Recommendations Actions Team Leader(s) Team Member(s)
Build the Base
Increase the production of
established Iowa commodities, both
crop and livestock.
Mitigate concerns/conflicts that arise from
erroneous perceptions or cavalier attitudes.
Coalition to Support
Farmers
Other Organizations,
SWCDs

Coalition to Support Iowa Farmers
492 | Context | Iowa AgriScope 2030
Team
Member
Strategy Recommendations Actions Team Leader(s) Team Member(s)
Build the Base
Increase the production of
established Iowa commodities, both
crop and livestock.
Promote and utilize livestock manure as a
valuable, natural, locally-produced source of
nitrogen and organic matter.
Iowa Secretary of Ag
USDA, Iowa Legislature,
IDALS, ISU, Ag &
Commodity Organizations,
Ag Producers, SWCDs,
Coalition to Support
Farmers
Add Value
Build on global leadership in value-
added products (i.e. bio-fuels, meat
and other food processing).
Assure a plentiful supply of base commodities by
encouraging the livestock sector in Iowa.Iowa Secretary of Ag
IDALS, I-PEP, Ag &
Commodity Organizations,
Ag Producers, Coalition to
Support Farmers

Other Regulatory Agencies
493 | Context | Iowa AgriScope 2030
Team
Leader
Strategy Recommendations Actions Team Leader(s) Team Member(s)
Process applications and permits in a timely,
professional manner. Notify applicants
immediately if there is a problem with the
application and/or notify of delays in the process.
IDNR, Other Regulatory
Agencies
Reform the permit system to allow applications
and permits to cover the entire state, not just a
particular jurisdiction.
IDNR, Other Regulatory
Agencies
Iowa Governor, Iowa
Legislature, Rural
Counties/Communities
Reform the permit system to allow amendment of
permits, so that reapplication is not necessary
each time regulations change or when businesses
change only one aspect of their operation.
IDNR, Other Regulatory
Agencies
Iowa Governor, Iowa
Legislature, Rural
Counties/Communities
Punish habitual offenders and scofflaws, but bring
reason to bear on apparent mistakes,
misunderstandings or alternative interpretation of
the regulation, especially for first-time offenders.
IDNR, Other Regulatory
Agencies
Create a culture of goal-directed enforcement
within state regulatory agencies (enforcement
should be directed by the goal of the regulation)
and discourage a ‘gotcha’ approach.
IDNR, Other Regulatory
AgenciesIowa Governor
Reasonable
Regulations &
Taxes
Effect lasting improvement to the
state regulatory and permitting
processes.
Administer reasonable, fair and
relevant regulatory enforcement.

Other Regulatory Agencies
494 | Context | Iowa AgriScope 2030
Team
Member
Strategy Recommendations Actions Team Leader(s) Team Member(s)
Reasonable
Regulations &
Taxes
Effect lasting improvement to the
state regulatory and permitting
processes.
Perform an in-depth scan of regulatory and
permitting programs to identify those that are not
delivering the legislated intent.
Iowa GovernorIDNR, Other Regulatory
Agencies

Regional Economic Development Organizations
495 | Context | Iowa AgriScope 2030
Strategy Recommendations Actions Team Leader(s) Team Member(s)
Add Value
Recruit further processing businesses
to locate and grow in Iowa,
especially in rural communities.
Identify and promote communities that have
plentiful water supply and treatment capability for
ag and food processing plants.
Regional Economic
Development Organizations
I-PEP, IDALS, Rural
Counties/Communities
Team
Leader

Secondary Strategies, Recommendations and Actions
Organized by Who is Responsible
496 | Context | Iowa AgriScope 2030

Congress
497 | Context | Iowa AgriScope 2030
Team
Leader
Strategy Recommendations Actions Team Leader(s) Team Member(s)
Improved
Transportation
Infrastructure
Plan for projected increases in Iowa
crop and livestock production, food
and fuel processing and
manufacturing, and resultant truck
traffic increases.
Assure adequate maintenance and rebuilding,
when necessary, of interstate highways.Congress
Iowa Legislature, IDOT, Ag
& Commodity
Organizations
Business
Environment
Assure broadband transmission is
available to Iowa communities for use
by agriculture businesses, processing
businesses, input providers and
assure the integrity of satellite
transmissions to GPS receivers.
Influence and support federal (FCC) reform of the
Universal Services Fund (USF) by shifting funds
away from landlines to broadband services,
encouraging investment in broadband to all of
Iowa and emphasizing rural areas. Continually
monitor information technology needs and early
access to keep Iowa ‘ahead of the pack’.
CongressIowa Governor, Innovation
Council

Congress
498 | Context | Iowa AgriScope 2030
Team
Member
Strategy Recommendations Actions Team Leader(s) Team Member(s)
Influence Congress to appropriate
funding for lock expansion projects on
the Upper Mississippi and Illinois
rivers authorized in the 2007 Water
Resources Development Act.
Establish this project as a top priority for Iowa’s
(bipartisan) state leadership and Congressional
delegation.
Iowa Governor
Congress, Iowa
Legislature, Iowa
Secretary of Ag, IDOT, Ag
& Commodity
Organizations, Ag
Producers
Influence Congress to appropriate
funding for lock expansion projects on
the Upper Mississippi and Illinois
rivers authorized in the 2007 Water
Resources Development Act.
Support the increase of the lock and dam system
on the Upper Mississippi River Basin, the
improvement/replacement of locks and dams, and
the modification and expansion of other structures
and facilities that increase transportation
efficiency.
Iowa Governor
Congress, Iowa
Legislature, Iowa
Secretary of Ag, IDOT, Ag
& Commodity
Organizations, Ag
Producers
Assure adequate freight rail line
capacity, access and provider
options to serve agricultural
production and processed product
rail needs.
Encourage adequate financial resources be
employed, when necessary, for the development
of viable inter and intra-state railroads.
IDOT
Iowa Governor, Iowa
Secretary of Ag, Ag &
Commodity Organizations,
Businesses, Congress
Business
Environment
Assure broadband transmission is
available to Iowa communities for use
by agriculture businesses, processing
businesses, input providers and
assure the integrity of satellite
transmissions to GPS receivers.
Monitor and oppose, if necessary, efforts to utilize
mobile satellite spectrum for wireless
communications that would compromise the
current use of the spectrum or limit increased use
for ag production and business.
Ag & Commodity
Organizations
Congress, Iowa Secretary
of Ag, Businesses, Ag
Producers
Improved
Transportation
Infrastructure

Iowa Governor
499 | Context | Iowa AgriScope 2030
Team
Leader
Strategy Recommendations Actions Team Leader(s) Team Member(s)
Establish this project as a top priority for Iowa’s
(bipartisan) state leadership and Congressional
delegation.
Iowa Governor
Congress, Iowa
Legislature, Iowa
Secretary of Ag, IDOT, Ag
& Commodity
Organizations, Ag
Producers
Provide leadership, through Governor Branstad,
to Midwest governors and US Senators to derive
adequate funding.
Iowa Governor
Support the increase of the lock and dam system
on the Upper Mississippi River Basin, the
improvement/replacement of locks and dams, and
the modification and expansion of other structures
and facilities that increase transportation
efficiency.
Iowa Governor
Congress, Iowa
Legislature, Iowa
Secretary of Ag, IDOT, Ag
& Commodity
Organizations, Ag
Producers
Join other affected states to bring pressure to
bear on policy makers and the US Army Corps of
Engineers to prioritize flood control and
commercial use of the river.
Iowa Governor
Oppose changes to Army Corps of Engineers
river operations that lead to reduced navigation,
reduced flood control measures or spring rises.
Iowa Governor
Iowa Legislature, Iowa
Secretary of Ag, IDOT, Ag
& Commodity
Organizations, Ag
Producers
Influence Congress to appropriate
funding for lock expansion projects on
the Upper Mississippi and Illinois
rivers authorized in the 2007 Water
Resources Development Act.
Assure that the Missouri River is
maintained as viable option for
commercial movement of western
Iowa commodities and related
products into the extensive US inland
waterway system and global
markets.
Improved
Transportation
Infrastructure

Iowa Governor
500 | Context | Iowa AgriScope 2030
Team
Leader
Strategy Recommendations Actions Team Leader(s) Team Member(s)
Business
Environment
Convince Iowa businesses and those
considering locating or investing here
that Iowa is “Open for Business” and
is ready to help resolve problems or
share opportunities.
Encourage foreign investment in Iowa-based
agricultural research, production, and processing.Iowa Governor
I-PEP, Iowa Secretary of
Ag, IDALS
Innovation
Reputation
Encourage and support
entrepreneurism.
Attract investment capital by positioning Iowa as
the “Bio-Capital” of North America through
progressive state-backed programs, developed in
conjunction with private industry.
Iowa Governor, I-PEPAg & Commodity
Organizations, Businesses

Iowa Governor
501 | Context | Iowa AgriScope 2030
Team
Leader
Strategy Recommendations Actions Team Leader(s) Team Member(s)
Embrace production agriculture as an Iowa
tradition, strength and base for future growth.Iowa Governor
Iowa Legislature, Iowa
Secretary of Ag, IDALS, I-
PEP, IDNR, IDOT, ISU,
Other Universities,
Community Colleges, Ag &
Commodity Organizations,
Other Organizations, Rural
Counties/Communities,
Businesses, Ag Producers,
Media, Innovation Council,
Lenders, Coalition to
Support Farmers
Use campaign as a method of drawing attention
to Iowa’s assets.Iowa Governor
Iowa Secretary of Ag, I-
PEP
Actively recruit bio processing and bio businesses
to the state.Iowa Governor
Iowa Secretary of Ag, I-
PEP
Promote the research and development assets in
which Iowa has already invested and that are
poised to support the development of bio-based
innovation and technologies.
Iowa Governor
Iowa Secretary of Ag, I-
PEP, ISU, Other
Universities, Board of
RegentsLead the transition to a bio knowledge economy:
one that replaces low profit manufacturing with
science-based, higher profit, innovation-based
businesses.
Iowa GovernorIowa Secretary of Ag, I-
PEP, Innovation Council
Invite business leaders for ‘reverse trade
missions’ to Iowa communities that are ready for
and eager to site bio based businesses.
Iowa Governor
Iowa Secretary of Ag, I-
PEP, Rural
Counties/Communities,
BusinessesAchieve effective collaboration
between agriculture and related
sectors by encouraging formation of
an organization or system that
becomes a foundation for
cooperation and issue prioritization
across Iowa’s diverse agriculture
sector.
Host an annual seminar for Iowa government
administration, legislature and Congressional
delegation to learn about the many aspects of
agriculture in Iowa, its impact on the state’s
economy and crucial, current issues affecting the
broad spectrum of ‘seed to table or tank’.
Iowa Governor, new
organization or system
Iowa Secretary of Ag,
IDALS, I-PEP, Ag &
Commodity Organizations,
Businesses, Ag Producers,
Innovation Council
Lead campaign to increase the size
and scope of Iowa agriculture.
Leadership

Iowa Governor
502 | Context | Iowa AgriScope 2030
Team
Member
Strategy Recommendations Actions Team Leader(s) Team Member(s)
Improved
Transportation
Infrastructure
Assure adequate freight rail line
capacity, access and provider
options to serve agricultural
production and processed product
rail needs.
Encourage adequate financial resources be
employed, when necessary, for the development
of viable inter and intra-state railroads.
IDOT
Iowa Governor, Iowa
Secretary of Ag, Ag &
Commodity Organizations,
Businesses, Congress
Create “business concierge” service, either
government-based or private sector, that provides
one-on-one specific assistance to both
established Iowa businesses and those
considering locating in Iowa as they navigate
government requirements and incentives.
I-PEP Iowa Governor, Businesses
Provide a flexible, responsive business,
government and social environment where
currently unimagined value-added businesses may
establish and flourish.
I-PEP
Iowa Governor, Iowa
Legislature, IDALS, IDNR,
Rural
Counties/Communities,
Businesses
Change Iowa’s property tax structure to create
equity among broadband providers and encourage
investment in broadband to all of Iowa,
emphasizing rural areas.
Iowa LegislatureIowa Governor, I-PEP,
Innovation Council
Influence and support federal (FCC) reform of the
Universal Services Fund (USF) by shifting funds
away from landlines to broadband services,
encouraging investment in broadband to all of
Iowa and emphasizing rural areas. Continually
monitor information technology needs and early
access to keep Iowa ‘ahead of the pack’.
CongressIowa Governor, Innovation
Council
Business
Environment
Convince Iowa businesses and those
considering locating or investing here
that Iowa is “Open for Business” and
is ready to help resolve problems or
share opportunities.
Assure broadband transmission is
available to Iowa communities for use
by agriculture businesses, processing
businesses, input providers and
assure the integrity of satellite
transmissions to GPS receivers.

Iowa Governor
503 | Context | Iowa AgriScope 2030
Team
Member
Strategy Recommendations Actions Team Leader(s) Team Member(s)
Build Iowa’s reputation as a hotbed of innovation. Innovation CouncilIowa Governor, I-PEP,
Businesses, Media
Support growth of innovative businesses and
activities already rooted in Iowa.I-PEP Iowa Governor
Recruit innovative businesses, particularly those in
the agriculture sector.I-PEP
Iowa Governor, Ag &
Commodity Organizations,
Iowa Secretary of Ag
Identify and eliminate any unnecessary laws and
regulations that stifle or slow adoption and
utilization of technologies. Avoid passage of such
laws/regulations in the future.
Iowa LegislatureIowa Governor, IDALS, I-
PEP, IDNR
Sponsor a competition and significant award for
best annual innovation that benefits Iowa’s
agriculture, agri business, food processing, bio
fuel sectors or other, related sectors.
Innovation CouncilIowa Governor, Iowa
Secretary of Ag
Sponsor agriculture, renewable energy and food
processing conferences that bring the most
innovative businesses to the state.
Iowa Secretary of Ag
Iowa Governor, Ag &
Commodity Organizations,
Businesses, Innovation
Council
Establish Iowa as a leader in the development of
food safety technologies, systems and businesses
that will serve the growing global demand for safe
food supplies .
ISU
Iowa Governor, Iowa
Legislature, Iowa
Secretary of Ag,
Businesses
Create a climate for innovation in
agriculture, food, fiber,
f(ph)armaceutical and renewable fuel
businesses, and in the supporting
sciences.
Innovation
Reputation

Iowa Governor
504 | Context | Iowa AgriScope 2030
Team
Member
Strategy Recommendations Actions Team Leader(s) Team Member(s)
LeadershipLead campaign to increase the size
and scope of Iowa agriculture.
Use Iowa’s productive resources and 21st century
innovative technologies to create clean sought-
after jobs and economic activity.
Businesses
Iowa Governor, Iowa
Legislature, Iowa
Secretary of Ag, I-PEP,
ISU, Ag & Commodity
Organizations, Ag
Producers

Iowa Legislators
505 | Context | Iowa AgriScope 2030
Team
Leader
Strategy Recommendations Actions Team Leader(s) Team Member(s)
Improved
Transportation
Infrastructure
Plan for projected increases in Iowa
crop and livestock production, food
and fuel processing and
manufacturing, and resultant truck
traffic increases.
Increase funding for rural roads and bridges via
an agreed revenue stream.
Iowa Legislature, Ag &
Commodity Organizations
Ag Producers, Rural
Counties/Communities
Business
Environment
Assure broadband transmission is
available to Iowa communities for use
by agriculture businesses, processing
businesses, input providers and
assure the integrity of satellite
transmissions to GPS receivers.
Change Iowa’s property tax structure to create
equity among broadband providers and encourage
investment in broadband to all of Iowa,
emphasizing rural areas.
Iowa LegislatureIowa Governor, I-PEP,
Innovation Council
Innovation
Reputation
Create a climate for innovation in
agriculture, food, fiber,
f(ph)armaceutical and renewable fuel
businesses, and in the supporting
sciences.
Identify and eliminate any unnecessary laws and
regulations that stifle or slow adoption and
utilization of technologies. Avoid passage of such
laws/regulations in the future.
Iowa LegislatureIowa Governor, IDALS, I-
PEP, IDNR

Iowa Legislators
506 | Context | Iowa AgriScope 2030
Team
Member
Strategy Recommendations Actions Team Leader(s) Team Member(s)
Establish this project as a top priority for Iowa’s
(bipartisan) state leadership and Congressional
delegation.
Iowa Governor
Congress, Iowa
Legislature, Iowa
Secretary of Ag, IDOT, Ag
& Commodity
Organizations, Ag
Producers
Support the increase of the lock and dam system
on the Upper Mississippi River Basin, the
improvement/replacement of locks and dams, and
the modification and expansion of other structures
and facilities that increase transportation
efficiency.
Iowa Governor
Congress, Iowa
Legislature, Iowa
Secretary of Ag, IDOT, Ag
& Commodity
Organizations, Ag
Producers
Assure that the Missouri River is
maintained as viable option for
commercial movement of western
Iowa commodities and related
products into the extensive US inland
waterway system and global
markets.
Oppose changes to Army Corps of Engineers
river operations that lead to reduced navigation,
reduced flood control measures or spring rises.
Iowa Governor
Iowa Legislature, Iowa
Secretary of Ag, IDOT, Ag
& Commodity
Organizations, Ag
Producers
Assure adequate maintenance and rebuilding,
when necessary, of interstate highways.Congress
Iowa Legislature, IDOT, Ag
& Commodity
Organizations
Develop a state highway plan that provides the
necessary capacity, and assure its
implementation before it is needed.
IDOT Iowa Legislature
Influence Congress to appropriate
funding for lock expansion projects on
the Upper Mississippi and Illinois
rivers authorized in the 2007 Water
Resources Development Act.
Plan for projected increases in Iowa
crop and livestock production, food
and fuel processing and
manufacturing, and resultant truck
traffic increases.
Improved
Transportation
Infrastructure

Iowa Legislators
507 | Context | Iowa AgriScope 2030
Team
Member
Strategy Recommendations Actions Team Leader(s) Team Member(s)
Business
Environment
Convince Iowa businesses and those
considering locating or investing here
that Iowa is “Open for Business” and
is ready to help resolve problems or
share opportunities.
Provide a flexible, responsive business,
government and social environment where
currently unimagined value-added businesses may
establish and flourish.
I-PEP
Iowa Governor, Iowa
Legislature, IDALS, IDNR,
Rural
Counties/Communities,
Businesses
Innovation
Reputation
Create a climate for innovation in
agriculture, food, fiber,
f(ph)armaceutical and renewable fuel
businesses, and in the supporting
sciences.
Establish Iowa as a leader in the development of
food safety technologies, systems and businesses
that will serve the growing global demand for safe
food supplies .
ISU
Iowa Governor, Iowa
Legislature, Iowa
Secretary of Ag,
Businesses
Nurture the New
Provide an environment in which non-
traditional ideas, farming operations
and businesses may establish a
foothold and grow.
Include the full diversity of Iowa production and
processing in government, university and
organization programs.
IDALS, ISU
Iowa Legislature, Iowa
Secretary of Ag, I-PEP,
Other Universities,
Community Colleges
Embrace production agriculture as an Iowa
tradition, strength and base for future growth.Iowa Governor
Iowa Legislature, Iowa
Secretary of Ag, IDALS, I-
PEP, IDNR, IDOT, ISU,
Other Universities,
Community Colleges, Ag &
Commodity Organizations,
Other Organizations, Rural
Counties/Communities,
Businesses, Ag Producers,
Media, Innovation Council,
Lenders, Coalition to
Support Farmers
Use Iowa’s productive resources and 21st century
innovative technologies to create clean sought-
after jobs and economic activity.
Businesses
Iowa Governor, Iowa
Legislature, Iowa
Secretary of Ag, I-PEP,
ISU, Ag & Commodity
Organizations, Ag
Producers
Lead campaign to increase the size
and scope of Iowa agriculture.Leadership

Iowa Secretary of Agriculture
508 | Context | Iowa AgriScope 2030
Team
Leader
Strategy Recommendations Actions Team Leader(s) Team Member(s)
Innovation
Reputation
Create a climate for innovation in
agriculture, food, fiber,
f(ph)armaceutical and renewable fuel
businesses, and in the supporting
sciences.
Sponsor agriculture, renewable energy and food
processing conferences that bring the most
innovative businesses to the state.
Iowa Secretary of Ag
Iowa Governor, Ag &
Commodity Organizations,
Businesses, Innovation
Council
Nurture the New
Assist ‘new to Iowa’ production and
processing in their efforts to access
investment capital.
Open doors with investment funds and individual
investors.Iowa Secretary of Ag I-PEP, Businesses
Leadership
Achieve effective collaboration
between agriculture and related
sectors by encouraging formation of
an organization or system that
becomes a foundation for
cooperation and issue prioritization
across Iowa’s diverse agriculture
sector.
Investigate other effective models, such as the
Minnesota Agri Growth Council, and gain
consensus on the best way to provide unified
support for the factors that will "Increase the Size
and Scope of Iowa Agriculture".
Iowa Secretary of Ag
IDALS, ISU, Ag &
Commodity Organizations,
Businesses, Ag Producers,
Coalition to Support
Farmers

Iowa Secretary of Agriculture
509 | Context | Iowa AgriScope 2030
Team
Member
Strategy Recommendations Actions Team Leader(s) Team Member(s)
Establish this project as a top priority for Iowa’s
(bipartisan) state leadership and Congressional
delegation.
Iowa Governor
Congress, Iowa
Legislature, Iowa
Secretary of Ag, IDOT, Ag
& Commodity
Organizations, Ag
Producers
Support the increase of the lock and dam system
on the Upper Mississippi River Basin, the
improvement/replacement of locks and dams, and
the modification and expansion of other structures
and facilities that increase transportation
efficiency.
Iowa Governor
Congress, Iowa
Legislature, Iowa
Secretary of Ag, IDOT, Ag
& Commodity
Organizations, Ag
Producers
Oppose changes to Army Corps of Engineers
river operations that lead to reduced navigation,
reduced flood control measures or spring rises.
Iowa Governor
Iowa Legislature, Iowa
Secretary of Ag, IDOT, Ag
& Commodity
Organizations, Ag
Producers
Encourage adequate financial resources be
employed, when necessary, for the development
of viable inter and intra-state railroads.
IDOT
Iowa Governor, Iowa
Secretary of Ag, Ag &
Commodity Organizations,
Businesses, Congress
Improved
Transportation
Infrastructure
Influence Congress to appropriate
funding for lock expansion projects on
the Upper Mississippi and Illinois
rivers authorized in the 2007 Water
Resources Development Act.
Assure that the Missouri River is
maintained as viable option for
commercial movement of western
Iowa commodities and related
products into the extensive US inland
waterway system and global
markets.

Iowa Secretary of Agriculture
510 | Context | Iowa AgriScope 2030
Team
Member
Strategy Recommendations Actions Team Leader(s) Team Member(s)
Convince Iowa businesses and those
considering locating or investing here
that Iowa is “Open for Business” and
is ready to help resolve problems or
share opportunities.
Encourage foreign investment in Iowa-based
agricultural research, production, and processing.Iowa Governor
I-PEP, Iowa Secretary of
Ag, IDALS
Monitor and oppose, if necessary, efforts to utilize
mobile satellite spectrum for wireless
communications that would compromise the
current use of the spectrum or limit increased use
for ag production and business.
Ag & Commodity
Organizations
Congress, Iowa Secretary
of Ag, Businesses, Ag
Producers
Influence Congress to provide adequate spectrum
access necessary for growth in the use of remote
sensors and GPS positioning for production
agriculture and commodity processing systems.
Ag & Commodity
Organizations
Iowa Secretary of Ag,
Businesses, Ag Producers
Business
Environment Assure broadband transmission is
available to Iowa communities for use
by agriculture businesses, processing
businesses, input providers and
assure the integrity of satellite
transmissions to GPS receivers.

Iowa Secretary of Agriculture
511 | Context | Iowa AgriScope 2030
Team
Member
Strategy Recommendations Actions Team Leader(s) Team Member(s)
Recruit innovative businesses, particularly those in
the agriculture sector.I-PEP
Iowa Governor, Ag &
Commodity Organizations,
Iowa Secretary of Ag
Sponsor a competition and significant award for
best annual innovation that benefits Iowa’s
agriculture, agri business, food processing, bio
fuel sectors or other, related sectors.
Innovation CouncilIowa Governor, Iowa
Secretary of Ag
Actively support and encourage the new Iowa
Innovation Council and assure bio economy based
input for its strategy and resultant programs.
Ag & Commodity
Organizations
Iowa Secretary of Ag,
Businesses, Ag Producers
Establish Iowa as a leader in the development of
food safety technologies, systems and businesses
that will serve the growing global demand for safe
food supplies .
ISU
Iowa Governor, Iowa
Legislature, Iowa
Secretary of Ag,
Businesses
Provide an environment in which non-
traditional ideas, farming operations
and businesses may establish a
foothold and grow.
Include the full diversity of Iowa production and
processing in government, university and
organization programs.
IDALS, ISU
Iowa Legislature, Iowa
Secretary of Ag, I-PEP,
Other Universities,
Community Colleges
Review the needs of new, innovative
agriculture production and processing
and prioritize efforts to help with
those needs.
Host web-based forums and an annual attendance
forum where non-traditional producers and
processors may network and share concerns,
seek solutions.
ISU
Iowa Secretary of Ag,
IDALS, Ag & Commodity
Organizations
Innovation
Reputation
Create a climate for innovation in
agriculture, food, fiber,
f(ph)armaceutical and renewable fuel
businesses, and in the supporting
sciences.
Nurture the New

Iowa Secretary of Agriculture
512 | Context | Iowa AgriScope 2030
Team
Member
Strategy Recommendations Actions Team Leader(s) Team Member(s)
Embrace production agriculture as an Iowa
tradition, strength and base for future growth.Iowa Governor
Iowa Legislature, Iowa
Secretary of Ag, IDALS, I-
PEP, IDNR, IDOT, ISU,
Other Universities,
Community Colleges, Ag &
Commodity Organizations,
Other Organizations, Rural
Counties/Communities,
Businesses, Ag Producers,
Media, Innovation Council,
Lenders, Coalition to
Support Farmers
Use Iowa’s productive resources and 21st century
innovative technologies to create clean sought-
after jobs and economic activity.
Businesses
Iowa Governor, Iowa
Legislature, Iowa
Secretary of Ag, I-PEP,
ISU, Ag & Commodity
Organizations, Ag
Producers
Use campaign as a method of drawing attention
to Iowa’s assets.Iowa Governor
Iowa Secretary of Ag, I-
PEP
Actively recruit bio processing and bio businesses
to the state.Iowa Governor
Iowa Secretary of Ag, I-
PEP
Promote the research and development assets in
which Iowa has already invested and that are
poised to support the development of bio-based
innovation and technologies.
Iowa Governor
Iowa Secretary of Ag, I-
PEP, ISU, Other
Universities, Board of
Regents
Lead the transition to a bio knowledge economy:
one that replaces low profit manufacturing with
science-based, higher profit, innovation-based
businesses.
Iowa GovernorIowa Secretary of Ag, I-
PEP, Innovation Council
Invite business leaders for ‘reverse trade
missions’ to Iowa communities that are ready for
and eager to site bio based businesses.
Iowa Governor
Iowa Secretary of Ag, I-
PEP, Rural
Counties/Communities,
Businesses
Achieve effective collaboration
between agriculture and related
sectors by encouraging formation of
an organization or system that
becomes a foundation for
cooperation and issue prioritization
across Iowa’s diverse agriculture
sector.
Host an annual seminar for Iowa government
administration, legislature and Congressional
delegation to learn about the many aspects of
agriculture in Iowa, its impact on the state’s
economy and crucial, current issues affecting the
broad spectrum of ‘seed to table or tank’.
Iowa Governor, new
organization or system
Iowa Secretary of Ag,
IDALS, I-PEP, Ag &
Commodity Organizations,
Businesses, Ag Producers,
Innovation Council
Leadership
Lead campaign to increase the size
and scope of Iowa agriculture.

Iowa Department of Agriculture and Land Stewardship
513 | Context | Iowa AgriScope 2030
Team
Leader
Strategy Recommendations Actions Team Leader(s) Team Member(s)
Nurture the New
Provide an environment in which non-
traditional ideas, farming operations
and businesses may establish a
foothold and grow.
Include the full diversity of Iowa production and
processing in government, university and
organization programs.
IDALS, ISU
Iowa Legislature, Iowa
Secretary of Ag, I-PEP,
Other Universities,
Community Colleges

Iowa Department of Agriculture and Land Stewardship
514 | Context | Iowa AgriScope 2030
Team
Member
Strategy Recommendations Actions Team Leader(s) Team Member(s)
Provide a flexible, responsive business,
government and social environment where
currently unimagined value-added businesses may
establish and flourish.
I-PEP
Iowa Governor, Iowa
Legislature, IDALS, IDNR,
Rural
Counties/Communities,
Businesses
Encourage foreign investment in Iowa-based
agricultural research, production, and processing.Iowa Governor
I-PEP, Iowa Secretary of
Ag, IDALS
Innovation
Reputation
Create a climate for innovation in
agriculture, food, fiber,
f(ph)armaceutical and renewable fuel
businesses, and in the supporting
sciences.
Identify and eliminate any unnecessary laws and
regulations that stifle or slow adoption and
utilization of technologies. Avoid passage of such
laws/regulations in the future.
Iowa LegislatureIowa Governor, IDALS, I-
PEP, IDNR
Provide arbitration for controversial situations or
circumstances that arise between existing and non-
traditional production methods.
new organization or systemIDALS, Coalition to Support
Farmers
Facilitate transfer of beneficial techniques,
information and systems that are developed by
non-traditional producers and processors that can
be adapted and adopted by traditional producers
and processors.
ISU
IDALS, Ag & Commodity
Organizations, Ag
Producers
Review the needs of new, innovative
agriculture production and processing
and prioritize efforts to help with
those needs.
Host web-based forums and an annual attendance
forum where non-traditional producers and
processors may network and share concerns,
seek solutions.
ISU
Iowa Secretary of Ag,
IDALS, Ag & Commodity
Organizations
Nurture the New
Provide an environment in which non-
traditional ideas, farming operations
and businesses may establish a
foothold and grow.
Business
Environment
Convince Iowa businesses and those
considering locating or investing here
that Iowa is “Open for Business” and
is ready to help resolve problems or
share opportunities.

Iowa Department of Agriculture and Land Stewardship
515 | Context | Iowa AgriScope 2030
Team
Member
Strategy Recommendations Actions Team Leader(s) Team Member(s)
Lead campaign to increase the size
and scope of Iowa agriculture.
Embrace production agriculture as an Iowa
tradition, strength and base for future growth.Iowa Governor
Iowa Legislature, Iowa
Secretary of Ag, IDALS, I-
PEP, IDNR, IDOT, ISU,
Other Universities,
Community Colleges, Ag &
Commodity Organizations,
Other Organizations, Rural
Counties/Communities,
Businesses, Ag Producers,
Media, Innovation Council,
Lenders, Coalition to
Support Farmers
Investigate other effective models, such as the
Minnesota Agri Growth Council, and gain
consensus on the best way to provide unified
support for the factors that will "Increase the Size
and Scope of Iowa Agriculture".
Iowa Secretary of Ag
IDALS, ISU, Ag &
Commodity Organizations,
Businesses, Ag Producers,
Coalition to Support
Farmers
Host an annual seminar for Iowa government
administration, legislature and Congressional
delegation to learn about the many aspects of
agriculture in Iowa, its impact on the state’s
economy and crucial, current issues affecting the
broad spectrum of ‘seed to table or tank’.
Iowa Governor, new
organization or system
Iowa Secretary of Ag,
IDALS, I-PEP, Ag &
Commodity Organizations,
Businesses, Ag Producers,
Innovation Council
Leadership
Achieve effective collaboration
between agriculture and related
sectors by encouraging formation of
an organization or system that
becomes a foundation for
cooperation and issue prioritization
across Iowa’s diverse agriculture
sector.

Iowa Partnership for Economic Progress
516 | Context | Iowa AgriScope 2030
Team
Leader
Strategy Recommendations Actions Team Leader(s) Team Member(s)
Create “business concierge” service, either
government-based or private sector, that provides
one-on-one specific assistance to both
established Iowa businesses and those
considering locating in Iowa as they navigate
government requirements and incentives.
I-PEP Iowa Governor, Businesses
Provide a flexible, responsive business,
government and social environment where
currently unimagined value-added businesses may
establish and flourish.
I-PEP
Iowa Governor, Iowa
Legislature, IDALS, IDNR,
Rural
Counties/Communities,
Businesses
Support growth of innovative businesses and
activities already rooted in Iowa.I-PEP Iowa Governor
Recruit innovative businesses, particularly those in
the agriculture sector.I-PEP
Iowa Governor, Ag &
Commodity Organizations,
Iowa Secretary of Ag
Identify, develop and create an entrepreneurial
talent pool that is coordinated across the state,
interacts with various regional organizations and is
committed to entrepreneurial development within
the state of Iowa.
I-PEPAg & Commodity
Organizations, Businesses
Attract investment capital by positioning Iowa as
the “Bio-Capital” of North America through
progressive state-backed programs, developed in
conjunction with private industry.
Iowa Governor, I-PEPAg & Commodity
Organizations, Businesses
Define parameters for successful solicitation of
investment capital.I-PEP Businesses
Help those interested develop approved business
plans, etc.I-PEP Community Colleges
Create a climate for innovation in
agriculture, food, fiber,
f(ph)armaceutical and renewable fuel
businesses, and in the supporting
sciences.
Encourage and support
entrepreneurism.
Assist ‘new to Iowa’ production and
processing in their efforts to access
investment capital.
Business
Environment
Innovation
Reputation
Nurture the New
Convince Iowa businesses and those
considering locating or investing here
that Iowa is “Open for Business” and
is ready to help resolve problems or
share opportunities.

Iowa Partnership for Economic Progress
517 | Context | Iowa AgriScope 2030
Team
Member
Strategy Recommendations Actions Team Leader(s) Team Member(s)
Workforce
Educate, recruit, attract and retain a
workforce with knowledge of and
passion about production agriculture,
processing and the businesses that
serve agriculture and processing.
Achieve adequate levels of applicants for ag
production and processing jobs by developing a
program to recruit legal immigrants who want to
work in ag production and ag/food processing
sectors – attract the ’cream of the crop’ to Iowa.
Ag & Commodity
Organizations, BusinessesI-PEP, Ag Producers
Convince Iowa businesses and those
considering locating or investing here
that Iowa is “Open for Business” and
is ready to help resolve problems or
share opportunities.
Encourage foreign investment in Iowa-based
agricultural research, production, and processing.Iowa Governor
I-PEP, Iowa Secretary of
Ag, IDALS
Assure broadband transmission is
available to Iowa communities for use
by agriculture businesses, processing
businesses, input providers and
assure the integrity of satellite
transmissions to GPS receivers.
Change Iowa’s property tax structure to create
equity among broadband providers and encourage
investment in broadband to all of Iowa,
emphasizing rural areas.
Iowa LegislatureIowa Governor, I-PEP,
Innovation Council
Build Iowa’s reputation as a hotbed of innovation. Innovation CouncilIowa Governor, I-PEP,
Businesses, Media
Identify and eliminate any unnecessary laws and
regulations that stifle or slow adoption and
utilization of technologies. Avoid passage of such
laws/regulations in the future.
Iowa LegislatureIowa Governor, IDALS, I-
PEP, IDNR
Provide an environment in which non-
traditional ideas, farming operations
and businesses may establish a
foothold and grow.
Include the full diversity of Iowa production and
processing in government, university and
organization programs.
IDALS, ISU
Iowa Legislature, Iowa
Secretary of Ag, I-PEP,
Other Universities,
Community Colleges
Assist ‘new to Iowa’ production and
processing in their efforts to access
investment capital.
Open doors with investment funds and individual
investors.Iowa Secretary of Ag I-PEP, Businesses
Create a climate for innovation in
agriculture, food, fiber,
f(ph)armaceutical and renewable fuel
businesses, and in the supporting
sciences.
Business
Environment
Innovation
Reputation
Nurture the New

Iowa Partnership for Economic Progress
518 | Context | Iowa AgriScope 2030
Team
Member
Strategy Recommendations Actions Team Leader(s) Team Member(s)
Embrace production agriculture as an Iowa
tradition, strength and base for future growth.Iowa Governor
Iowa Legislature, Iowa
Secretary of Ag, IDALS, I-
PEP, IDNR, IDOT, ISU,
Other Universities,
Community Colleges, Ag &
Commodity Organizations,
Other Organizations, Rural
Counties/Communities,
Businesses, Ag Producers,
Media, Innovation Council,
Lenders, Coalition to
Support Farmers
Use Iowa’s productive resources and 21st century
innovative technologies to create clean sought-
after jobs and economic activity.
Businesses
Iowa Governor, Iowa
Legislature, Iowa
Secretary of Ag, I-PEP,
ISU, Ag & Commodity
Organizations, Ag
Producers
Use campaign as a method of drawing attention
to Iowa’s assets.Iowa Governor
Iowa Secretary of Ag, I-
PEP
Actively recruit bio processing and bio businesses
to the state.Iowa Governor
Iowa Secretary of Ag, I-
PEP
Promote the research and development assets in
which Iowa has already invested and that are
poised to support the development of bio-based
innovation and technologies.
Iowa Governor
Iowa Secretary of Ag, I-
PEP, ISU, Other
Universities, Board of
Regents
Lead the transition to a bio knowledge economy:
one that replaces low profit manufacturing with
science-based, higher profit, innovation-based
businesses.
Iowa GovernorIowa Secretary of Ag, I-
PEP, Innovation Council
Invite business leaders for ‘reverse trade
missions’ to Iowa communities that are ready for
and eager to site bio based businesses.
Iowa Governor
Iowa Secretary of Ag, I-
PEP, Rural
Counties/Communities,
Businesses
Achieve effective collaboration
between agriculture and related
sectors by encouraging formation of
an organization or system that
becomes a foundation for
cooperation and issue prioritization
across Iowa’s diverse agriculture
sector.
Host an annual seminar for Iowa government
administration, legislature and Congressional
delegation to learn about the many aspects of
agriculture in Iowa, its impact on the state’s
economy and crucial, current issues affecting the
broad spectrum of ‘seed to table or tank’.
Iowa Governor, new
organization or system
Iowa Secretary of Ag,
IDALS, I-PEP, Ag &
Commodity Organizations,
Businesses, Ag Producers,
Innovation Council
Lead campaign to increase the size
and scope of Iowa agriculture.
Leadership

Iowa Department of Natural Resources
519 | Context | Iowa AgriScope 2030
Team
Member
Strategy Recommendations Actions Team Leader(s) Team Member(s)
Business
Environment
Convince Iowa businesses and those
considering locating or investing here
that Iowa is “Open for Business” and
is ready to help resolve problems or
share opportunities.
Provide a flexible, responsive business,
government and social environment where
currently unimagined value-added businesses may
establish and flourish.
I-PEP
Iowa Governor, Iowa
Legislature, IDALS, IDNR,
Rural
Counties/Communities,
Businesses
Innovation
Reputation
Create a climate for innovation in
agriculture, food, fiber,
f(ph)armaceutical and renewable fuel
businesses, and in the supporting
sciences.
Identify and eliminate any unnecessary laws and
regulations that stifle or slow adoption and
utilization of technologies. Avoid passage of such
laws/regulations in the future.
Iowa LegislatureIowa Governor, IDALS, I-
PEP, IDNR
LeadershipLead campaign to increase the size
and scope of Iowa agriculture.
Embrace production agriculture as an Iowa
tradition, strength and base for future growth.Iowa Governor
Iowa Legislature, Iowa
Secretary of Ag, IDALS, I-
PEP, IDNR, IDOT, ISU,
Other Universities,
Community Colleges, Ag &
Commodity Organizations,
Other Organizations, Rural
Counties/Communities,
Businesses, Ag Producers,
Media, Innovation Council,
Lenders, Coalition to
Support Farmers

Iowa Department of Transportation
520 | Context | Iowa AgriScope 2030
Team
Leader
Strategy Recommendations Actions Team Leader(s) Team Member(s)
Plan for projected increases in Iowa
crop and livestock production, food
and fuel processing and
manufacturing, and resultant truck
traffic increases.
Develop a state highway plan that provides the
necessary capacity, and assure its
implementation before it is needed.
IDOT Iowa Legislature
Encourage adequate financial resources be
employed, when necessary, for the development
of viable inter and intra-state railroads.
IDOT
Iowa Governor, Iowa
Secretary of Ag, Ag &
Commodity Organizations,
Businesses, Congress
Identify strategic agricultural rail routes and
collaborate with inter-state rail companies to
maintain and develop lines to support value-added
agricultural business opportunities.
IDOT, BusinessesAg & Commodity
Organizations
Improved
Transportation
InfrastructureAssure adequate freight rail line
capacity, access and provider
options to serve agricultural
production and processed product
rail needs.

Iowa Department of Transportation
521 | Context | Iowa AgriScope 2030
Team
Member
Strategy Recommendations Actions Team Leader(s) Team Member(s)
Establish this project as a top priority for Iowa’s
(bipartisan) state leadership and Congressional
delegation.
Iowa Governor
Congress, Iowa
Legislature, Iowa
Secretary of Ag, IDOT, Ag
& Commodity
Organizations, Ag
Producers
Support the increase of the lock and dam system
on the Upper Mississippi River Basin, the
improvement/replacement of locks and dams, and
the modification and expansion of other structures
and facilities that increase transportation
efficiency.
Iowa Governor
Congress, Iowa
Legislature, Iowa
Secretary of Ag, IDOT, Ag
& Commodity
Organizations, Ag
Producers
Assure that the Missouri River is
maintained as viable option for
commercial movement of western
Iowa commodities and related
products into the extensive US inland
waterway system and global
markets.
Oppose changes to Army Corps of Engineers
river operations that lead to reduced navigation,
reduced flood control measures or spring rises.
Iowa Governor
Iowa Legislature, Iowa
Secretary of Ag, IDOT, Ag
& Commodity
Organizations, Ag
Producers
Plan for projected increases in Iowa
crop and livestock production, food
and fuel processing and
manufacturing, and resultant truck
traffic increases.
Assure adequate maintenance and rebuilding,
when necessary, of interstate highways.Congress
Iowa Legislature, IDOT, Ag
& Commodity
Organizations
Assure adequate freight rail line
capacity, access and provider
options to serve agricultural
production and processed product
rail needs.
Collaborate with regional rail companies to ensure
cost-effective connections to access export
growth markets via Pacific Northwest ports.
Sustain already established rail routes to national
and export markets.
Ag & Commodity
Organizations, BusinessesIDOT
LeadershipLead campaign to increase the size
and scope of Iowa agriculture.
Embrace production agriculture as an Iowa
tradition, strength and base for future growth.Iowa Governor
Iowa Legislature, Iowa
Secretary of Ag, IDALS, I-
PEP, IDNR, IDOT, ISU,
Other Universities,
Community Colleges, Ag &
Commodity Organizations,
Other Organizations, Rural
Counties/Communities,
Businesses, Ag Producers,
Media, Innovation Council,
Lenders, Coalition to
Support Farmers
Improved
Transportation
Infrastructure
Influence Congress to appropriate
funding for lock expansion projects on
the Upper Mississippi and Illinois
rivers authorized in the 2007 Water
Resources Development Act.

Iowa Department of Education
522 | Context | Iowa AgriScope 2030
Team
Member
Strategy Recommendations Actions Team Leader(s) Team Member(s)
Workforce
Educate, recruit, attract and retain a
workforce with knowledge of and
passion about production agriculture,
processing and the businesses that
serve agriculture and processing.
Coordinate community colleges’ training,
statewide, for both agriculture production and
processing.
Community Colleges IDE

Iowa State University
523 | Context | Iowa AgriScope 2030
Team
Leader
Strategy Recommendations Actions Team Leader(s) Team Member(s)
Build and provide education and training programs
that are relevant, efficiently managed and focused
on future needs, such as food safety tech, food
processing, biofuel engineering and fermentation
manufacturing, etc.
ISUOther Universities,
Community Colleges
Provide extension programming, applied research
and undergraduate curriculum to support new
opportunities in agriculture, such as production for
niche markets and bio-energy production.
ISU
Innovation
Reputation
Create a climate for innovation in
agriculture, food, fiber,
f(ph)armaceutical and renewable fuel
businesses, and in the supporting
sciences.
Establish Iowa as a leader in the development of
food safety technologies, systems and businesses
that will serve the growing global demand for safe
food supplies .
ISU
Iowa Governor, Iowa
Legislature, Iowa
Secretary of Ag,
Businesses
Include the full diversity of Iowa production and
processing in government, university and
organization programs.
IDALS, ISU
Iowa Legislature, Iowa
Secretary of Ag, I-PEP,
Other Universities,
Community Colleges
Facilitate transfer of beneficial techniques,
information and systems that are developed by
non-traditional producers and processors that can
be adapted and adopted by traditional producers
and processors.
ISU
IDALS, Ag & Commodity
Organizations, Ag
Producers
Host web-based forums and an annual attendance
forum where non-traditional producers and
processors may network and share concerns,
seek solutions.
ISU
Iowa Secretary of Ag,
IDALS, Ag & Commodity
Organizations
Focus ISU extension service work on helping start-
ups, especially those growing non-traditional
crops or accessing their market in new ways.
ISU
Educate, recruit, attract and retain a
workforce with knowledge of and
passion about production agriculture,
processing and the businesses that
serve agriculture and processing.
Provide an environment in which non-
traditional ideas, farming operations
and businesses may establish a
foothold and grow.
Review the needs of new, innovative
agriculture production and processing
and prioritize efforts to help with
those needs.
Workforce
Nurture the New

Iowa State University
524 | Context | Iowa AgriScope 2030
Team
Leader
Strategy Recommendations Actions Team Leader(s) Team Member(s)
Develop and implement professional production
and processing certificate programs.ISU
Community Colleges, Ag &
Commodity Organizations,
Businesses, Ag Producers
Provide professional development programs that
keep Iowa farmers and businesses ahead of their
competition.
ISU
Community Colleges, Ag &
Commodity Organizations,
Businesses, Ag Producers
Educate, recruit, attract and retain a
workforce with knowledge of and
passion about production agriculture,
processing and the businesses that
serve agriculture and processing.
Workforce

Iowa State University
525 | Context | Iowa AgriScope 2030
Team
Member
Strategy Recommendations Actions Team Leader(s) Team Member(s)
Innovation
Reputation
Encourage and support
entrepreneurism.
Develop business talent by working with
experienced entrepreneurial groups and
universities, develop entrepreneurial programs
and reality based curriculums utilizing a synergistic
pool of academia, entrepreneurs and
entrepreneurial development groups.
Businesses ISU, Other Universities
Embrace production agriculture as an Iowa
tradition, strength and base for future growth.Iowa Governor
Iowa Legislature, Iowa
Secretary of Ag, IDALS, I-
PEP, IDNR, IDOT, ISU,
Other Universities,
Community Colleges, Ag &
Commodity Organizations,
Other Organizations, Rural
Counties/Communities,
Businesses, Ag Producers,
Media, Innovation Council,
Lenders, Coalition to
Support Farmers
Use Iowa’s productive resources and 21st century
innovative technologies to create clean sought-
after jobs and economic activity.
Businesses
Iowa Governor, Iowa
Legislature, Iowa
Secretary of Ag, I-PEP,
ISU, Ag & Commodity
Organizations, Ag
Producers
Promote the research and development assets in
which Iowa has already invested and that are
poised to support the development of bio-based
innovation and technologies.
Iowa Governor
Iowa Secretary of Ag, I-
PEP, ISU, Other
Universities, Board of
Regents
Achieve effective collaboration
between agriculture and related
sectors by encouraging formation of
an organization or system that
becomes a foundation for
cooperation and issue prioritization
across Iowa’s diverse agriculture
sector.
Investigate other effective models, such as the
Minnesota Agri Growth Council, and gain
consensus on the best way to provide unified
support for the factors that will "Increase the Size
and Scope of Iowa Agriculture".
Iowa Secretary of Ag
IDALS, ISU, Ag &
Commodity Organizations,
Businesses, Ag Producers,
Coalition to Support
Farmers
Leadership
Lead campaign to increase the size
and scope of Iowa agriculture.

Other Universities
526 | Context | Iowa AgriScope 2030
Team
Member
Strategy Recommendations Actions Team Leader(s) Team Member(s)
Workforce
Educate, recruit, attract and retain a
workforce with knowledge of and
passion about production agriculture,
processing and the businesses that
serve agriculture and processing.
Build and provide education and training programs
that are relevant, efficiently managed and focused
on future needs, such as food safety tech, food
processing, biofuel engineering and fermentation
manufacturing, etc.
ISUOther Universities,
Community Colleges
Innovation
Reputation
Encourage and support
entrepreneurism.
Develop business talent by working with
experienced entrepreneurial groups and
universities, develop entrepreneurial programs
and reality based curriculums utilizing a synergistic
pool of academia, entrepreneurs and
entrepreneurial development groups.
Businesses ISU, Other Universities
Nurture the New
Provide an environment in which non-
traditional ideas, farming operations
and businesses may establish a
foothold and grow.
Include the full diversity of Iowa production and
processing in government, university and
organization programs.
IDALS, ISU
Iowa Legislature, Iowa
Secretary of Ag, I-PEP,
Other Universities,
Community Colleges
Embrace production agriculture as an Iowa
tradition, strength and base for future growth.Iowa Governor
Iowa Legislature, Iowa
Secretary of Ag, IDALS, I-
PEP, IDNR, IDOT, ISU,
Other Universities,
Community Colleges, Ag &
Commodity Organizations,
Other Organizations, Rural
Counties/Communities,
Businesses, Ag Producers,
Media, Innovation Council,
Lenders, Coalition to
Support Farmers
Promote the research and development assets in
which Iowa has already invested and that are
poised to support the development of bio-based
innovation and technologies.
Iowa Governor
Iowa Secretary of Ag, I-
PEP, ISU, Other
Universities, Board of
Regents
LeadershipLead campaign to increase the size
and scope of Iowa agriculture.

Community Colleges
527 | Context | Iowa AgriScope 2030
Team
Leader
Strategy Recommendations Actions Team Leader(s) Team Member(s)
Workforce
Educate, recruit, attract and retain a
workforce with knowledge of and
passion about production agriculture,
processing and the businesses that
serve agriculture and processing.
Coordinate community colleges’ training,
statewide, for both agriculture production and
processing.
Community Colleges IDE

Community Colleges
528 | Context | Iowa AgriScope 2030
Team
Member
Strategy Recommendations Actions Team Leader(s) Team Member(s)
Build and provide education and training programs
that are relevant, efficiently managed and focused
on future needs, such as food safety tech, food
processing, biofuel engineering and fermentation
manufacturing, etc.
ISUOther Universities,
Community Colleges
Develop and implement professional production
and processing certificate programs.ISU
Community Colleges, Ag &
Commodity Organizations,
Businesses, Ag Producers
Provide professional development programs that
keep Iowa farmers and businesses ahead of their
competition.
ISU
Community Colleges, Ag &
Commodity Organizations,
Businesses, Ag Producers
Provide an environment in which non-
traditional ideas, farming operations
and businesses may establish a
foothold and grow.
Include the full diversity of Iowa production and
processing in government, university and
organization programs.
IDALS, ISU
Iowa Legislature, Iowa
Secretary of Ag, I-PEP,
Other Universities,
Community Colleges
Assist ‘new to Iowa’ production and
processing in their efforts to access
investment capital.
Help those interested develop approved business
plans, etc.I-PEP Community Colleges
LeadershipLead campaign to increase the size
and scope of Iowa agriculture.
Embrace production agriculture as an Iowa
tradition, strength and base for future growth.Iowa Governor
Iowa Legislature, Iowa
Secretary of Ag, IDALS, I-
PEP, IDNR, IDOT, ISU,
Other Universities,
Community Colleges, Ag &
Commodity Organizations,
Other Organizations, Rural
Counties/Communities,
Businesses, Ag Producers,
Media, Innovation Council,
Lenders, Coalition to
Support Farmers
Nurture the New
Workforce
Educate, recruit, attract and retain a
workforce with knowledge of and
passion about production agriculture,
processing and the businesses that
serve agriculture and processing.

Agriculture & Commodity Organizations
529 | Context | Iowa AgriScope 2030
Team
Leader
Strategy Recommendations Actions Team Leader(s) Team Member(s)
Plan for projected increases in Iowa
crop and livestock production, food
and fuel processing and
manufacturing, and resultant truck
traffic increases.
Increase funding for rural roads and bridges via
an agreed revenue stream.
Iowa Legislature, Ag &
Commodity Organizations
Ag Producers, Rural
Counties/Communities
Assure adequate freight rail line
capacity, access and provider
options to serve agricultural
production and processed product
rail needs.
Collaborate with regional rail companies to ensure
cost-effective connections to access export
growth markets via Pacific Northwest ports.
Sustain already established rail routes to national
and export markets.
Ag & Commodity
Organizations, BusinessesIDOT
Workforce
Educate, recruit, attract and retain a
workforce with knowledge of and
passion about production agriculture,
processing and the businesses that
serve agriculture and processing.
Achieve adequate levels of applicants for ag
production and processing jobs by developing a
program to recruit legal immigrants who want to
work in ag production and ag/food processing
sectors – attract the ’cream of the crop’ to Iowa.
Ag & Commodity
Organizations, BusinessesI-PEP, Ag Producers
Support the new Iowa Partnership for
Economic Progress (I-PEP)and its
public-private approach to economic
development. Assure the new system
is supportive of a bio based economy
and that its needs are prioritized.
Ag & Commodity
Organizations
Other Organizations, Rural
Counties/Communities,
Businesses, Ag Producers
Monitor and oppose, if necessary, efforts to utilize
mobile satellite spectrum for wireless
communications that would compromise the
current use of the spectrum or limit increased use
for ag production and business.
Ag & Commodity
Organizations
Congress, Iowa Secretary
of Ag, Businesses, Ag
Producers
Influence Congress to provide adequate spectrum
access necessary for growth in the use of remote
sensors and GPS positioning for production
agriculture and commodity processing systems.
Ag & Commodity
Organizations
Iowa Secretary of Ag,
Businesses, Ag Producers
Innovation
Reputation
Create a climate for innovation in
agriculture, food, fiber,
f(ph)armaceutical and renewable fuel
businesses, and in the supporting
sciences.
Actively support and encourage the new Iowa
Innovation Council and assure bio economy based
input for its strategy and resultant programs.
Ag & Commodity
Organizations
Iowa Secretary of Ag,
Businesses, Ag Producers
Assure broadband transmission is
available to Iowa communities for use
by agriculture businesses, processing
businesses, input providers and
assure the integrity of satellite
transmissions to GPS receivers.
Improved
Transportation
Infrastructure
Business
Environment

Agriculture & Commodity Organizations
530 | Context | Iowa AgriScope 2030
Team
Member
Strategy Recommendations Actions Team Leader(s) Team Member(s)
Establish this project as a top priority for Iowa’s
(bipartisan) state leadership and Congressional
delegation.
Iowa Governor
Congress, Iowa
Legislature, Iowa
Secretary of Ag, IDOT, Ag
& Commodity
Organizations, Ag
Producers
Support the increase of the lock and dam system
on the Upper Mississippi River Basin, the
improvement/replacement of locks and dams, and
the modification and expansion of other structures
and facilities that increase transportation
efficiency.
Iowa Governor
Congress, Iowa
Legislature, Iowa
Secretary of Ag, IDOT, Ag
& Commodity
Organizations, Ag
Producers
Assure that the Missouri River is
maintained as viable option for
commercial movement of western
Iowa commodities and related
products into the extensive US inland
waterway system and global
markets.
Oppose changes to Army Corps of Engineers
river operations that lead to reduced navigation,
reduced flood control measures or spring rises.
Iowa Governor
Iowa Legislature, Iowa
Secretary of Ag, IDOT, Ag
& Commodity
Organizations, Ag
Producers
Encourage each Iowa county to maintain
necessary farm-to-market roads and to close
roads and bridges that are no longer essential.
Ag Producers
Ag & Commodity
Organizations, Rural
Counties/Communities
Assure adequate maintenance and rebuilding,
when necessary, of interstate highways.Congress
Iowa Legislature, IDOT, Ag
& Commodity
Organizations
Encourage adequate financial resources be
employed, when necessary, for the development
of viable inter and intra-state railroads.
IDOT
Iowa Governor, Iowa
Secretary of Ag, Ag &
Commodity Organizations,
Businesses, Congress
Identify strategic agricultural rail routes and
collaborate with inter-state rail companies to
maintain and develop lines to support value-added
agricultural business opportunities.
IDOT, BusinessesAg & Commodity
Organizations
Influence Congress to appropriate
funding for lock expansion projects on
the Upper Mississippi and Illinois
rivers authorized in the 2007 Water
Resources Development Act.
Plan for projected increases in Iowa
crop and livestock production, food
and fuel processing and
manufacturing, and resultant truck
traffic increases.
Assure adequate freight rail line
capacity, access and provider
options to serve agricultural
production and processed product
rail needs.
Improved
Transportation
Infrastructure

Agriculture & Commodity Organizations
531 | Context | Iowa AgriScope 2030
Team
Member
Strategy Recommendations Actions Team Leader(s) Team Member(s)
Workforce
Educate, recruit, attract and retain a
workforce with knowledge of and
passion about production agriculture,
processing and the businesses that
serve agriculture and processing.
Support Iowa STEM initiative and provide
biosciences expertise for program development.Businesses
Ag & Commodity
Organizations
Recruit innovative businesses, particularly those in
the agriculture sector.I-PEP
Iowa Governor, Ag &
Commodity Organizations,
Iowa Secretary of Ag
Sponsor agriculture, renewable energy and food
processing conferences that bring the most
innovative businesses to the state.
Iowa Secretary of Ag
Iowa Governor, Ag &
Commodity Organizations,
Businesses, Innovation
Council
Identify, develop and create an entrepreneurial
talent pool that is coordinated across the state,
interacts with various regional organizations and is
committed to entrepreneurial development within
the state of Iowa.
I-PEPAg & Commodity
Organizations, Businesses
Attract investment capital by positioning Iowa as
the “Bio-Capital” of North America through
progressive state-backed programs, developed in
conjunction with private industry.
Iowa Governor, I-PEPAg & Commodity
Organizations, Businesses
Provide an environment in which non-
traditional ideas, farming operations
and businesses may establish a
foothold and grow.
Facilitate transfer of beneficial techniques,
information and systems that are developed by
non-traditional producers and processors that can
be adapted and adopted by traditional producers
and processors.
ISU
IDALS, Ag & Commodity
Organizations, Ag
Producers
Review the needs of new, innovative
agriculture production and processing
and prioritize efforts to help with
those needs.
Host web-based forums and an annual attendance
forum where non-traditional producers and
processors may network and share concerns,
seek solutions.
ISU
Iowa Secretary of Ag,
IDALS, Ag & Commodity
Organizations
Innovation
Reputation
Create a climate for innovation in
agriculture, food, fiber,
f(ph)armaceutical and renewable fuel
businesses, and in the supporting
sciences.
Encourage and support
entrepreneurism.
Nurture the New

Agriculture & Commodity Organizations
532 | Context | Iowa AgriScope 2030
Team
Member
Strategy Recommendations Actions Team Leader(s) Team Member(s)
Embrace production agriculture as an Iowa
tradition, strength and base for future growth.Iowa Governor
Iowa Legislature, Iowa
Secretary of Ag, IDALS, I-
PEP, IDNR, IDOT, ISU,
Other Universities,
Community Colleges, Ag &
Commodity Organizations,
Other Organizations, Rural
Counties/Communities,
Businesses, Ag Producers,
Media, Innovation Council,
Lenders, Coalition to
Support Farmers
Use Iowa’s productive resources and 21st century
innovative technologies to create clean sought-
after jobs and economic activity.
Businesses
Iowa Governor, Iowa
Legislature, Iowa
Secretary of Ag, I-PEP,
ISU, Ag & Commodity
Organizations, Ag
Producers
Investigate other effective models, such as the
Minnesota Agri Growth Council, and gain
consensus on the best way to provide unified
support for the factors that will "Increase the Size
and Scope of Iowa Agriculture".
Iowa Secretary of Ag
IDALS, ISU, Ag &
Commodity Organizations,
Businesses, Ag Producers,
Coalition to Support
Farmers
Use selected organization or system to develop
consistent, prioritized advice for government and
other public sector institutions as they work to
"Increase the Size and Scope of Iowa
Agriculture".
new organization or system
Ag & Commodity
Organizations, Businesses,
Ag Producers
Host an annual seminar for Iowa government
administration, legislature and Congressional
delegation to learn about the many aspects of
agriculture in Iowa, its impact on the state’s
economy and crucial, current issues affecting the
broad spectrum of ‘seed to table or tank’.
Iowa Governor, new
organization or system
Iowa Secretary of Ag,
IDALS, I-PEP, Ag &
Commodity Organizations,
Businesses, Ag Producers,
Innovation Council
Lead campaign to increase the size
and scope of Iowa agriculture.
Achieve effective collaboration
between agriculture and related
sectors by encouraging formation of
an organization or system that
becomes a foundation for
cooperation and issue prioritization
across Iowa’s diverse agriculture
sector.
Leadership

Agriculture & Commodity Organizations
533 | Context | Iowa AgriScope 2030
Team
Member
Strategy Recommendations Actions Team Leader(s) Team Member(s)
Develop and implement professional production
and processing certificate programs.ISU
Community Colleges, Ag &
Commodity Organizations,
Businesses, Ag Producers
Provide professional development programs that
keep Iowa farmers and businesses ahead of their
competition.
ISU
Community Colleges, Ag &
Commodity Organizations,
Businesses, Ag Producers
Educate, recruit, attract and retain a
workforce with knowledge of and
passion about production agriculture,
processing and the businesses that
serve agriculture and processing.
Workforce

Other Organizations
534 | Context | Iowa AgriScope 2030
Team
Member
Strategy Recommendations Actions Team Leader(s) Team Member(s)
Business
Environment
Support the new Iowa Partnership for
Economic Progress (I-PEP)and its
public-private approach to economic
development. Assure the new system
is supportive of a bio based economy
and that its needs are prioritized.
Ag & Commodity
Organizations
Other Organizations, Rural
Counties/Communities,
Businesses, Ag Producers
LeadershipLead campaign to increase the size
and scope of Iowa agriculture.
Embrace production agriculture as an Iowa
tradition, strength and base for future growth.Iowa Governor
Iowa Legislature, Iowa
Secretary of Ag, IDALS, I-
PEP, IDNR, IDOT, ISU,
Other Universities,
Community Colleges, Ag &
Commodity Organizations,
Other Organizations, Rural
Counties/Communities,
Businesses, Ag Producers,
Media, Innovation Council,
Lenders, Coalition to
Support Farmers

Rural Counties & Communities
535 | Context | Iowa AgriScope 2030
Team
Member
Strategy Recommendations Actions Team Leader(s) Team Member(s)
Encourage each Iowa county to maintain
necessary farm-to-market roads and to close
roads and bridges that are no longer essential.
Ag Producers
Ag & Commodity
Organizations, Rural
Counties/Communities
Increase funding for rural roads and bridges via
an agreed revenue stream.
Iowa Legislature, Ag &
Commodity Organizations
Ag Producers, Rural
Counties/Communities
Convince Iowa businesses and those
considering locating or investing here
that Iowa is “Open for Business” and
is ready to help resolve problems or
share opportunities.
Provide a flexible, responsive business,
government and social environment where
currently unimagined value-added businesses may
establish and flourish.
I-PEP
Iowa Governor, Iowa
Legislature, IDALS, IDNR,
Rural
Counties/Communities,
Businesses
Support the new Iowa Partnership for
Economic Progress (I-PEP)and its
public-private approach to economic
development. Assure the new system
is supportive of a bio based economy
and that its needs are prioritized.
Ag & Commodity
Organizations
Other Organizations, Rural
Counties/Communities,
Businesses, Ag Producers
Embrace production agriculture as an Iowa
tradition, strength and base for future growth.Iowa Governor
Iowa Legislature, Iowa
Secretary of Ag, IDALS, I-
PEP, IDNR, IDOT, ISU,
Other Universities,
Community Colleges, Ag &
Commodity Organizations,
Other Organizations, Rural
Counties/Communities,
Businesses, Ag Producers,
Media, Innovation Council,
Lenders, Coalition to
Support Farmers
Invite business leaders for ‘reverse trade
missions’ to Iowa communities that are ready for
and eager to site bio based businesses.
Iowa Governor
Iowa Secretary of Ag, I-
PEP, Rural
Counties/Communities,
Businesses
Business
Environment
LeadershipLead campaign to increase the size
and scope of Iowa agriculture.
Improved
Transportation
Infrastructure
Plan for projected increases in Iowa
crop and livestock production, food
and fuel processing and
manufacturing, and resultant truck
traffic increases.

Businesses
536 | Context | Iowa AgriScope 2030
Team
Leader
Strategy Recommendations Actions Team Leader(s) Team Member(s)
Identify strategic agricultural rail routes and
collaborate with inter-state rail companies to
maintain and develop lines to support value-added
agricultural business opportunities.
IDOT, BusinessesAg & Commodity
Organizations
Collaborate with regional rail companies to ensure
cost-effective connections to access export
growth markets via Pacific Northwest ports.
Sustain already established rail routes to national
and export markets.
Ag & Commodity
Organizations, BusinessesIDOT
Support Iowa STEM initiative and provide
biosciences expertise for program development.Businesses
Ag & Commodity
Organizations
Achieve adequate levels of applicants for ag
production and processing jobs by developing a
program to recruit legal immigrants who want to
work in ag production and ag/food processing
sectors – attract the ’cream of the crop’ to Iowa.
Ag & Commodity
Organizations, BusinessesI-PEP, Ag Producers
Workforce
Educate, recruit, attract and retain a
workforce with knowledge of and
passion about production agriculture,
processing and the businesses that
serve agriculture and processing.
Improved
Transportation
Infrastructure
Assure adequate freight rail line
capacity, access and provider
options to serve agricultural
production and processed product
rail needs.

Businesses
537 | Context | Iowa AgriScope 2030
Team
Leader
Strategy Recommendations Actions Team Leader(s) Team Member(s)
Link mentorship to investment. Businesses
Identify and recruit management with
entrepreneurial or start-up experience and match
business organizational needs with commercial
management expertise.
Businesses
Develop business talent by working with
experienced entrepreneurial groups and
universities, develop entrepreneurial programs
and reality based curriculums utilizing a synergistic
pool of academia, entrepreneurs and
entrepreneurial development groups.
Businesses ISU, Other Universities
Nurture the New
Provide an environment in which non-
traditional ideas, farming operations
and businesses may establish a
foothold and grow.
Encourage producers to raise differentiated crops
that are grown for specific traits and contracted
directly by the customer to limit risk.
Businesses
LeadershipLead campaign to increase the size
and scope of Iowa agriculture.
Use Iowa’s productive resources and 21st century
innovative technologies to create clean sought-
after jobs and economic activity.
Businesses
Iowa Governor, Iowa
Legislature, Iowa
Secretary of Ag, I-PEP,
ISU, Ag & Commodity
Organizations, Ag
Producers
Innovation
Reputation
Encourage and support
entrepreneurism.

Businesses
538 | Context | Iowa AgriScope 2030
Team
Member
Strategy Recommendations Actions Team Leader(s) Team Member(s)
Improved
Transportation
Infrastructure
Assure adequate freight rail line
capacity, access and provider
options to serve agricultural
production and processed product
rail needs.
Encourage adequate financial resources be
employed, when necessary, for the development
of viable inter and intra-state railroads.
IDOT
Iowa Governor, Iowa
Secretary of Ag, Ag &
Commodity Organizations,
Businesses, Congress
Create “business concierge” service, either
government-based or private sector, that provides
one-on-one specific assistance to both
established Iowa businesses and those
considering locating in Iowa as they navigate
government requirements and incentives.
I-PEP Iowa Governor, Businesses
Provide a flexible, responsive business,
government and social environment where
currently unimagined value-added businesses may
establish and flourish.
I-PEP
Iowa Governor, Iowa
Legislature, IDALS, IDNR,
Rural
Counties/Communities,
Businesses
Support the new Iowa Partnership for
Economic Progress (I-PEP)and its
public-private approach to economic
development. Assure the new system
is supportive of a bio based economy
and that its needs are prioritized.
Ag & Commodity
Organizations
Other Organizations, Rural
Counties/Communities,
Businesses, Ag Producers
Monitor and oppose, if necessary, efforts to utilize
mobile satellite spectrum for wireless
communications that would compromise the
current use of the spectrum or limit increased use
for ag production and business.
Ag & Commodity
Organizations
Congress, Iowa Secretary
of Ag, Businesses, Ag
Producers
Influence Congress to provide adequate spectrum
access necessary for growth in the use of remote
sensors and GPS positioning for production
agriculture and commodity processing systems.
Ag & Commodity
Organizations
Iowa Secretary of Ag,
Businesses, Ag Producers
Business
Environment
Convince Iowa businesses and those
considering locating or investing here
that Iowa is “Open for Business” and
is ready to help resolve problems or
share opportunities.
Assure broadband transmission is
available to Iowa communities for use
by agriculture businesses, processing
businesses, input providers and
assure the integrity of satellite
transmissions to GPS receivers.

Businesses
539 | Context | Iowa AgriScope 2030
Team
Member
Strategy Recommendations Actions Team Leader(s) Team Member(s)
Build Iowa’s reputation as a hotbed of innovation. Innovation CouncilIowa Governor, I-PEP,
Businesses, Media
Sponsor agriculture, renewable energy and food
processing conferences that bring the most
innovative businesses to the state.
Iowa Secretary of Ag
Iowa Governor, Ag &
Commodity Organizations,
Businesses, Innovation
Council
Actively support and encourage the new Iowa
Innovation Council and assure bio economy based
input for its strategy and resultant programs.
Ag & Commodity
Organizations
Iowa Secretary of Ag,
Businesses, Ag Producers
Establish Iowa as a leader in the development of
food safety technologies, systems and businesses
that will serve the growing global demand for safe
food supplies .
ISU
Iowa Governor, Iowa
Legislature, Iowa
Secretary of Ag,
Businesses
Identify, develop and create an entrepreneurial
talent pool that is coordinated across the state,
interacts with various regional organizations and is
committed to entrepreneurial development within
the state of Iowa.
I-PEPAg & Commodity
Organizations, Businesses
Attract investment capital by positioning Iowa as
the “Bio-Capital” of North America through
progressive state-backed programs, developed in
conjunction with private industry.
Iowa Governor, I-PEPAg & Commodity
Organizations, Businesses
Define parameters for successful solicitation of
investment capital.I-PEP Businesses
Open doors with investment funds and individual
investors.Iowa Secretary of Ag I-PEP, Businesses
Innovation
Reputation
Create a climate for innovation in
agriculture, food, fiber,
f(ph)armaceutical and renewable fuel
businesses, and in the supporting
sciences.
Encourage and support
entrepreneurism.
Nurture the New
Assist ‘new to Iowa’ production and
processing in their efforts to access
investment capital.

Businesses
540 | Context | Iowa AgriScope 2030
Team
Member
Strategy Recommendations Actions Team Leader(s) Team Member(s)
Embrace production agriculture as an Iowa
tradition, strength and base for future growth.Iowa Governor
Iowa Legislature, Iowa
Secretary of Ag, IDALS, I-
PEP, IDNR, IDOT, ISU,
Other Universities,
Community Colleges, Ag &
Commodity Organizations,
Other Organizations, Rural
Counties/Communities,
Businesses, Ag Producers,
Media, Innovation Council,
Lenders, Coalition to
Support Farmers
Invite business leaders for ‘reverse trade
missions’ to Iowa communities that are ready for
and eager to site bio based businesses.
Iowa Governor
Iowa Secretary of Ag, I-
PEP, Rural
Counties/Communities,
Businesses
Investigate other effective models, such as the
Minnesota Agri Growth Council, and gain
consensus on the best way to provide unified
support for the factors that will "Increase the Size
and Scope of Iowa Agriculture".
Iowa Secretary of Ag
IDALS, ISU, Ag &
Commodity Organizations,
Businesses, Ag Producers,
Coalition to Support
Farmers
Use selected organization or system to develop
consistent, prioritized advice for government and
other public sector institutions as they work to
"Increase the Size and Scope of Iowa
Agriculture".
new organization or system
Ag & Commodity
Organizations, Businesses,
Ag Producers
Host an annual seminar for Iowa government
administration, legislature and Congressional
delegation to learn about the many aspects of
agriculture in Iowa, its impact on the state’s
economy and crucial, current issues affecting the
broad spectrum of ‘seed to table or tank’.
Iowa Governor, new
organization or system
Iowa Secretary of Ag,
IDALS, I-PEP, Ag &
Commodity Organizations,
Businesses, Ag Producers,
Innovation Council
Leadership
Lead campaign to increase the size
and scope of Iowa agriculture.
Achieve effective collaboration
between agriculture and related
sectors by encouraging formation of
an organization or system that
becomes a foundation for
cooperation and issue prioritization
across Iowa’s diverse agriculture
sector.

Businesses
541 | Context | Iowa AgriScope 2030
Team
Member
Strategy Recommendations Actions Team Leader(s) Team Member(s)
Develop and implement professional production
and processing certificate programs.ISU
Community Colleges, Ag &
Commodity Organizations,
Businesses, Ag Producers
Provide professional development programs that
keep Iowa farmers and businesses ahead of their
competition.
ISU
Community Colleges, Ag &
Commodity Organizations,
Businesses, Ag Producers
Workforce
Educate, recruit, attract and retain a
workforce with knowledge of and
passion about production agriculture,
processing and the businesses that
serve agriculture and processing.

Agriculture Producers
542 | Context | Iowa AgriScope 2030
Team
Leader
Strategy Recommendations Actions Team Leader(s) Team Member(s)
Improved
Transportation
Infrastructure
Plan for projected increases in Iowa
crop and livestock production, food
and fuel processing and
manufacturing, and resultant truck
traffic increases.
Encourage each Iowa county to maintain
necessary farm-to-market roads and to close
roads and bridges that are no longer essential.
Ag Producers
Ag & Commodity
Organizations, Rural
Counties/Communities

Agriculture Producers
543 | Context | Iowa AgriScope 2030
Team
Member
Strategy Recommendations Actions Team Leader(s) Team Member(s)
Establish this project as a top priority for Iowa’s
(bipartisan) state leadership and Congressional
delegation.
Iowa Governor
Congress, Iowa
Legislature, Iowa
Secretary of Ag, IDOT, Ag
& Commodity
Organizations, Ag
Producers
Support the increase of the lock and dam system
on the Upper Mississippi River Basin, the
improvement/replacement of locks and dams, and
the modification and expansion of other structures
and facilities that increase transportation
efficiency.
Iowa Governor
Congress, Iowa
Legislature, Iowa
Secretary of Ag, IDOT, Ag
& Commodity
Organizations, Ag
Producers
Assure that the Missouri River is
maintained as viable option for
commercial movement of western
Iowa commodities and related
products into the extensive US inland
waterway system and global
markets.
Oppose changes to Army Corps of Engineers
river operations that lead to reduced navigation,
reduced flood control measures or spring rises.
Iowa Governor
Iowa Legislature, Iowa
Secretary of Ag, IDOT, Ag
& Commodity
Organizations, Ag
Producers
Plan for projected increases in Iowa
crop and livestock production, food
and fuel processing and
manufacturing, and resultant truck
traffic increases.
Increase funding for rural roads and bridges via
an agreed revenue stream.
Iowa Legislature, Ag &
Commodity Organizations
Ag Producers, Rural
Counties/Communities
Workforce
Educate, recruit, attract and retain a
workforce with knowledge of and
passion about production agriculture,
processing and the businesses that
serve agriculture and processing.
Achieve adequate levels of applicants for ag
production and processing jobs by developing a
program to recruit legal immigrants who want to
work in ag production and ag/food processing
sectors – attract the ’cream of the crop’ to Iowa.
Ag & Commodity
Organizations, BusinessesI-PEP, Ag Producers
Improved
Transportation
Infrastructure
Influence Congress to appropriate
funding for lock expansion projects on
the Upper Mississippi and Illinois
rivers authorized in the 2007 Water
Resources Development Act.

Agriculture Producers
544 | Context | Iowa AgriScope 2030
Team
Member
Strategy Recommendations Actions Team Leader(s) Team Member(s)
Support the new Iowa Partnership for
Economic Progress (I-PEP)and its
public-private approach to economic
development. Assure the new system
is supportive of a bio based economy
and that its needs are prioritized.
Ag & Commodity
Organizations
Other Organizations, Rural
Counties/Communities,
Businesses, Ag Producers
Monitor and oppose, if necessary, efforts to utilize
mobile satellite spectrum for wireless
communications that would compromise the
current use of the spectrum or limit increased use
for ag production and business.
Ag & Commodity
Organizations
Congress, Iowa Secretary
of Ag, Businesses, Ag
Producers
Influence Congress to provide adequate spectrum
access necessary for growth in the use of remote
sensors and GPS positioning for production
agriculture and commodity processing systems.
Ag & Commodity
Organizations
Iowa Secretary of Ag,
Businesses, Ag Producers
Innovation
Reputation
Create a climate for innovation in
agriculture, food, fiber,
f(ph)armaceutical and renewable fuel
businesses, and in the supporting
sciences.
Actively support and encourage the new Iowa
Innovation Council and assure bio economy based
input for its strategy and resultant programs.
Ag & Commodity
Organizations
Iowa Secretary of Ag,
Businesses, Ag Producers
Nurture the New
Provide an environment in which non-
traditional ideas, farming operations
and businesses may establish a
foothold and grow.
Facilitate transfer of beneficial techniques,
information and systems that are developed by
non-traditional producers and processors that can
be adapted and adopted by traditional producers
and processors.
ISU
IDALS, Ag & Commodity
Organizations, Ag
Producers
Business
EnvironmentAssure broadband transmission is
available to Iowa communities for use
by agriculture businesses, processing
businesses, input providers and
assure the integrity of satellite
transmissions to GPS receivers.

Agriculture Producers
545 | Context | Iowa AgriScope 2030
Team
Member
Strategy Recommendations Actions Team Leader(s) Team Member(s)
Embrace production agriculture as an Iowa
tradition, strength and base for future growth.Iowa Governor
Iowa Legislature, Iowa
Secretary of Ag, IDALS, I-
PEP, IDNR, IDOT, ISU,
Other Universities,
Community Colleges, Ag &
Commodity Organizations,
Other Organizations, Rural
Counties/Communities,
Businesses, Ag Producers,
Media, Innovation Council,
Lenders, Coalition to
Support Farmers
Use Iowa’s productive resources and 21st century
innovative technologies to create clean sought-
after jobs and economic activity.
Businesses
Iowa Governor, Iowa
Legislature, Iowa
Secretary of Ag, I-PEP,
ISU, Ag & Commodity
Organizations, Ag
Producers
Investigate other effective models, such as the
Minnesota Agri Growth Council, and gain
consensus on the best way to provide unified
support for the factors that will "Increase the Size
and Scope of Iowa Agriculture".
Iowa Secretary of Ag
IDALS, ISU, Ag &
Commodity Organizations,
Businesses, Ag Producers,
Coalition to Support
Farmers
Use selected organization or system to develop
consistent, prioritized advice for government and
other public sector institutions as they work to
"Increase the Size and Scope of Iowa
Agriculture".
new organization or system
Ag & Commodity
Organizations, Businesses,
Ag Producers
Host an annual seminar for Iowa government
administration, legislature and Congressional
delegation to learn about the many aspects of
agriculture in Iowa, its impact on the state’s
economy and crucial, current issues affecting the
broad spectrum of ‘seed to table or tank’.
Iowa Governor, new
organization or system
Iowa Secretary of Ag,
IDALS, I-PEP, Ag &
Commodity Organizations,
Businesses, Ag Producers,
Innovation Council
Achieve effective collaboration
between agriculture and related
sectors by encouraging formation of
an organization or system that
becomes a foundation for
cooperation and issue prioritization
across Iowa’s diverse agriculture
sector.
Leadership
Lead campaign to increase the size
and scope of Iowa agriculture.

Agriculture Producers
546 | Context | Iowa AgriScope 2030
Team
Member
Strategy Recommendations Actions Team Leader(s) Team Member(s)
Develop and implement professional production
and processing certificate programs.ISU
Community Colleges, Ag &
Commodity Organizations,
Businesses, Ag Producers
Provide professional development programs that
keep Iowa farmers and businesses ahead of their
competition.
ISU
Community Colleges, Ag &
Commodity Organizations,
Businesses, Ag Producers
Educate, recruit, attract and retain a
workforce with knowledge of and
passion about production agriculture,
processing and the businesses that
serve agriculture and processing.
Workforce

Board of Regents
547 | Context | Iowa AgriScope 2030
Team
Member
Strategy Recommendations Actions Team Leader(s) Team Member(s)
LeadershipLead campaign to increase the size
and scope of Iowa agriculture.
Promote the research and development assets in
which Iowa has already invested and that are
poised to support the development of bio-based
innovation and technologies.
Iowa Governor
Iowa Secretary of Ag, I-
PEP, ISU, Other
Universities, Board of
Regents

Media
548 | Context | Iowa AgriScope 2030
Team
Member
Strategy Recommendations Actions Team Leader(s) Team Member(s)
Innovation
Reputation
Create a climate for innovation in
agriculture, food, fiber,
f(ph)armaceutical and renewable fuel
businesses, and in the supporting
sciences.
Build Iowa’s reputation as a hotbed of innovation. Innovation CouncilIowa Governor, I-PEP,
Businesses, Media
LeadershipLead campaign to increase the size
and scope of Iowa agriculture.
Embrace production agriculture as an Iowa
tradition, strength and base for future growth.Iowa Governor
Iowa Legislature, Iowa
Secretary of Ag, IDALS, I-
PEP, IDNR, IDOT, ISU,
Other Universities,
Community Colleges, Ag &
Commodity Organizations,
Other Organizations, Rural
Counties/Communities,
Businesses, Ag Producers,
Media, Innovation Council,
Lenders, Coalition to
Support Farmers

Innovation Council
549 | Context | Iowa AgriScope 2030
Team
Leader
Strategy Recommendations Actions Team Leader(s) Team Member(s)
Build Iowa’s reputation as a hotbed of innovation. Innovation CouncilIowa Governor, I-PEP,
Businesses, Media
Sponsor a competition and significant award for
best annual innovation that benefits Iowa’s
agriculture, agri business, food processing, bio
fuel sectors or other, related sectors.
Innovation CouncilIowa Governor, Iowa
Secretary of Ag
Create a climate for innovation in
agriculture, food, fiber,
f(ph)armaceutical and renewable fuel
businesses, and in the supporting
sciences.
Innovation
Reputation

Innovation Council
550 | Context | Iowa AgriScope 2030
Team
Member
Strategy Recommendations Actions Team Leader(s) Team Member(s)
Change Iowa’s property tax structure to create
equity among broadband providers and encourage
investment in broadband to all of Iowa,
emphasizing rural areas.
Iowa LegislatureIowa Governor, I-PEP,
Innovation Council
Influence and support federal (FCC) reform of the
Universal Services Fund (USF) by shifting funds
away from landlines to broadband services,
encouraging investment in broadband to all of
Iowa and emphasizing rural areas. Continually
monitor information technology needs and early
access to keep Iowa ‘ahead of the pack’.
CongressIowa Governor, Innovation
Council
Innovation
Reputation
Create a climate for innovation in
agriculture, food, fiber,
f(ph)armaceutical and renewable fuel
businesses, and in the supporting
sciences.
Sponsor agriculture, renewable energy and food
processing conferences that bring the most
innovative businesses to the state.
Iowa Secretary of Ag
Iowa Governor, Ag &
Commodity Organizations,
Businesses, Innovation
Council
Business
Environment
Assure broadband transmission is
available to Iowa communities for use
by agriculture businesses, processing
businesses, input providers and
assure the integrity of satellite
transmissions to GPS receivers.

Innovation Council
551 | Context | Iowa AgriScope 2030
Team
Member
Strategy Recommendations Actions Team Leader(s) Team Member(s)
Embrace production agriculture as an Iowa
tradition, strength and base for future growth.Iowa Governor
Iowa Legislature, Iowa
Secretary of Ag, IDALS, I-
PEP, IDNR, IDOT, ISU,
Other Universities,
Community Colleges, Ag &
Commodity Organizations,
Other Organizations, Rural
Counties/Communities,
Businesses, Ag Producers,
Media, Innovation Council,
Lenders, Coalition to
Support Farmers
Lead the transition to a bio knowledge economy:
one that replaces low profit manufacturing with
science-based, higher profit, innovation-based
businesses.
Iowa GovernorIowa Secretary of Ag, I-
PEP, Innovation Council
Achieve effective collaboration
between agriculture and related
sectors by encouraging formation of
an organization or system that
becomes a foundation for
cooperation and issue prioritization
across Iowa’s diverse agriculture
sector.
Host an annual seminar for Iowa government
administration, legislature and Congressional
delegation to learn about the many aspects of
agriculture in Iowa, its impact on the state’s
economy and crucial, current issues affecting the
broad spectrum of ‘seed to table or tank’.
Iowa Governor, new
organization or system
Iowa Secretary of Ag,
IDALS, I-PEP, Ag &
Commodity Organizations,
Businesses, Ag Producers,
Innovation Council
Leadership
Lead campaign to increase the size
and scope of Iowa agriculture.

Lenders
552 | Context | Iowa AgriScope 2030
Team
Member
Strategy Recommendations Actions Team Leader(s) Team Member(s)
LeadershipLead campaign to increase the size
and scope of Iowa agriculture.
Embrace production agriculture as an Iowa
tradition, strength and base for future growth.Iowa Governor
Iowa Legislature, Iowa
Secretary of Ag, IDALS, I-
PEP, IDNR, IDOT, ISU,
Other Universities,
Community Colleges, Ag &
Commodity Organizations,
Other Organizations, Rural
Counties/Communities,
Businesses, Ag Producers,
Media, Innovation Council,
Lenders, Coalition to
Support Farmers

Coalition to Support Iowa Farmers
553 | Context | Iowa AgriScope 2030
Team
Member
Strategy Recommendations Actions Team Leader(s) Team Member(s)
Nurture the New
Provide an environment in which non-
traditional ideas, farming operations
and businesses may establish a
foothold and grow.
Provide arbitration for controversial situations or
circumstances that arise between existing and non-
traditional production methods.
new organization or systemIDALS, Coalition to Support
Farmers
Lead campaign to increase the size
and scope of Iowa agriculture.
Embrace production agriculture as an Iowa
tradition, strength and base for future growth.Iowa Governor
Iowa Legislature, Iowa
Secretary of Ag, IDALS, I-
PEP, IDNR, IDOT, ISU,
Other Universities,
Community Colleges, Ag &
Commodity Organizations,
Other Organizations, Rural
Counties/Communities,
Businesses, Ag Producers,
Media, Innovation Council,
Lenders, Coalition to
Support Farmers
Achieve effective collaboration
between agriculture and related
sectors by encouraging formation of
an organization or system that
becomes a foundation for
cooperation and issue prioritization
across Iowa’s diverse agriculture
sector.
Investigate other effective models, such as the
Minnesota Agri Growth Council, and gain
consensus on the best way to provide unified
support for the factors that will "Increase the Size
and Scope of Iowa Agriculture".
Iowa Secretary of Ag
IDALS, ISU, Ag &
Commodity Organizations,
Businesses, Ag Producers,
Coalition to Support
Farmers
Leadership

New Organization or System
554 | Context | Iowa AgriScope 2030
Strategy Recommendations Actions Team Leader(s) Team Member(s)
Nurture the New
Provide an environment in which non-
traditional ideas, farming operations
and businesses may establish a
foothold and grow.
Provide arbitration for controversial situations or
circumstances that arise between existing and non-
traditional production methods.
new organization or systemIDALS, Coalition to Support
Farmers
Use selected organization or system to develop
consistent, prioritized advice for government and
other public sector institutions as they work to
"Increase the Size and Scope of Iowa
Agriculture".
new organization or system
Ag & Commodity
Organizations, Businesses,
Ag Producers
Host an annual seminar for Iowa government
administration, legislature and Congressional
delegation to learn about the many aspects of
agriculture in Iowa, its impact on the state’s
economy and crucial, current issues affecting the
broad spectrum of ‘seed to table or tank’.
Iowa Governor, new
organization or system
Iowa Secretary of Ag,
IDALS, I-PEP, Ag &
Commodity Organizations,
Businesses, Ag Producers,
Innovation Council
Leadership
Achieve effective collaboration
between agriculture and related
sectors by encouraging formation of
an organization or system that
becomes a foundation for
cooperation and issue prioritization
across Iowa’s diverse agriculture
sector.
Team
Leader

Local Production Advocacy Groups
555 | Context | Iowa AgriScope 2030
Strategy Recommendations Actions Team Leader(s) Team Member(s)
Nurture the New
Provide an environment in which non-
traditional ideas, farming operations
and businesses may establish a
foothold and grow.
Encourage institutions to incorporate local
production into their food service menus.
Local production advocacy
groups
Team
Leader

Appendix D
556 | Context | Iowa AgriScope 2030
Resources

557 | Context | Iowa AgriScope 2030
Supportive Business Environment - Rationale
Support the new Iowa Partnership for Economic Progress (I-PEP) and its public-private approach to economic development. Assure the new system is supportive of a bio based economy and that its needs are prioritized.
Source: Image of Proposed Organizational Structure of Iowa Partnership for Economic Progress

Report - References
• Soil Survey & Digital Soil Maps, ISU http://extension.agron.iastate.edu/soils/SSDS_maps.html
• Soil Quality, Better Lawns Made Easy
http://www.agriculture.state.ia.us/press/pdfs/FinalSQR.pdf
• ISU researcher: Iowa has lower-quality topsoil than 50 years ago, Jessica Veenstra, Agronomy, ISU
http://www.public.iastate.edu/~nscentral/news/2009/feb/veenstra.shtml
• Iowa Geology 1995, Iowa Department of Natural Resources http://www.igsb.uiowa.edu/Browse/satelite/satelite.htm
• The impact of regulatory costs on small firms, Nicole V. Crain and W. Mark Crain, Lafayette College, 2010
http://www.sba.gov/sites/default/files/rs371.pdf
• A Report on Agricultural Productivity and Agricultural Research, National Agricultural Research, Extension, Education and
Economics Advisory Board, 2011
http://www.ree.usda.gov/ree/nareeeab/reports/05122011Productivity_and_Research_Final.pdf
• The Role of Basic Research in Innovation, Magnus Gulbrandsen
http://www.cas.uio.no/Publications/Seminar/Confluence_Gulbrandsen.pdf
• 2011 Iowa STEM Education Roadmap http://www.iowastem.org/assets/roadmap.pdf
• Population Division of the Department of Economic and Social Affairs of the United Nations Secretariat
• USDA, Economic Research Service using in the World Trade Organization Regional Trade Agreements database
http://rtais.wto.org/UI/PublicMaintainRTAHome.aspx (slide 109)
• http://www.agweb.com/livestock/
• Exporter Data Base, ITA, Bureau of Census
• Ethanol 2020 – Global Market Survey, Next Generation Trends, and Forecast, Multi-Client Study, Emerging Markets Online,
2008 http://www.emerging-markets.com/ethanol2020/Ethanol2020_GlobalSurvey_Contents.pdf
• U.S. Bureau of Economic Analysis, 2009 and Iowa Workforce Development, 2010
• Cluster Manufacturing: A Supply Chain Perspective, Cognizant http://www.cognizant.com/InsightsWhitepapers/Cluster-
Manuf.pdf558 | Context | Iowa AgriScope 2030

Report - References
• Rivers Project, US Army Corps of Engineers http://www.mvs.usace.army.mil/rivers/locks-dams.html (slide 114)
• USDA http://2.bp.blogspot.com/-
NvNHHnraSv8/TgQUS15BVqI/AAAAAAAAAe8/tn_2Qi3FJOM/s1600/USDA+Photo+of+Missouri+River+Flooding+2011.jpg
• Iowa population shift from rural to urban, USA Today | Census, 2011 http://www.usatoday.com/news/nation/census/profile/IA
• infrastructurist.com http://www.infrastructurist.com/wp-content/uploads/3194744389_4a62759d8c-300x199.jpg
• Wells http://www.wellsenterprisesinc.com/Default.aspx
• Becker Underwood website http://www.beckerunderwood.com/
• Niman Ranch website http://www.nimanranch.com/Index.aspx
• Iowa Local Food and Farm Plan, Leopold Center for Sustainable Agriculture, 2011
http://www.leopold.iastate.edu/sites/default/files/pubs-and-papers/2011-01-iowa-local-food-and-farm-plan.pdf
• Life Cycle Assessment of Commodity and Niche Swine Production Systems, ISU Leopold Center, 2010
http://www.leopold.iastate.edu/sites/default/files/pubs-and-papers/2010-09-life-cycle-assessment-commodity-and-niche-swine-
production-systems.pdf
• Hog Buildings : http://www.hoksdsconst.com/our_work.html
• The Impact of Regulatory Costs on Small Firms, US Commerce Department
• Iowa ranks 45th in the Tax Foundation‘s 2011 State Business Tax Climate Index, Tax Foundation
http://www.taxfoundation.org/research/topic/28.html
• Iowa Department of Economic Development
• Chad Hart, ISU, Assistant Professor Economics, Extension Economist, Grain Market Specialist
559 | Context | Iowa AgriScope 2030