ir evaluation evaluate what? –user satisfaction on specific task –speed –presentation...
TRANSCRIPT

IR Evaluation
• Evaluate what?– user satisfaction on specific task– speed– presentation (interface) issue– etc.
• My focus today:– comparative performance of system
components– “Cranfield tradition”
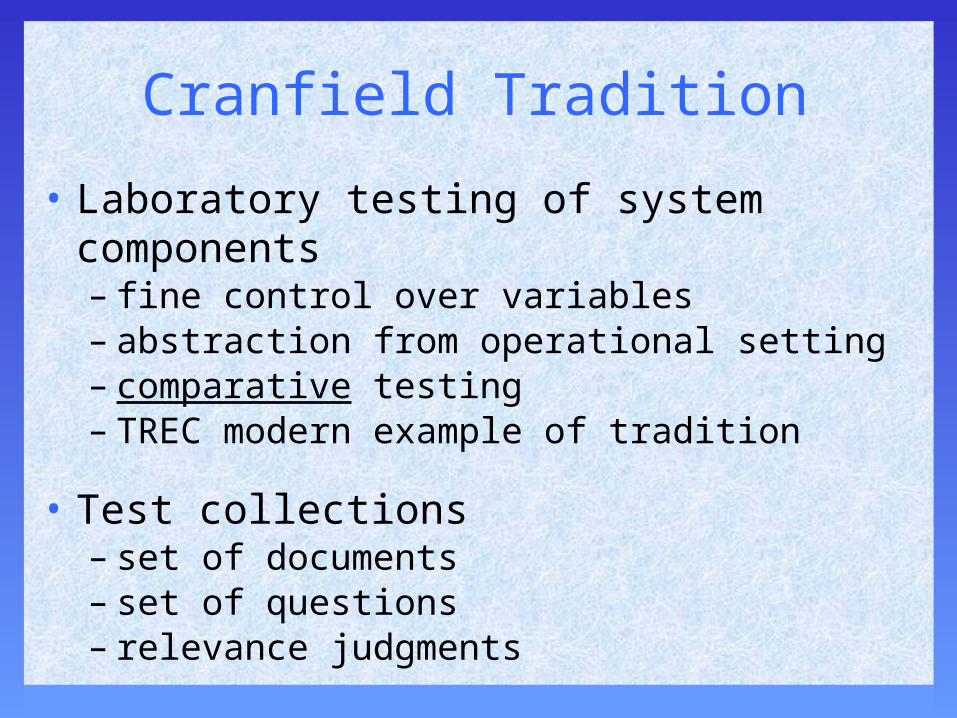
Cranfield Tradition
• Laboratory testing of system components– fine control over variables– abstraction from operational setting– comparative testing– TREC modern example of tradition
• Test collections– set of documents– set of questions– relevance judgments
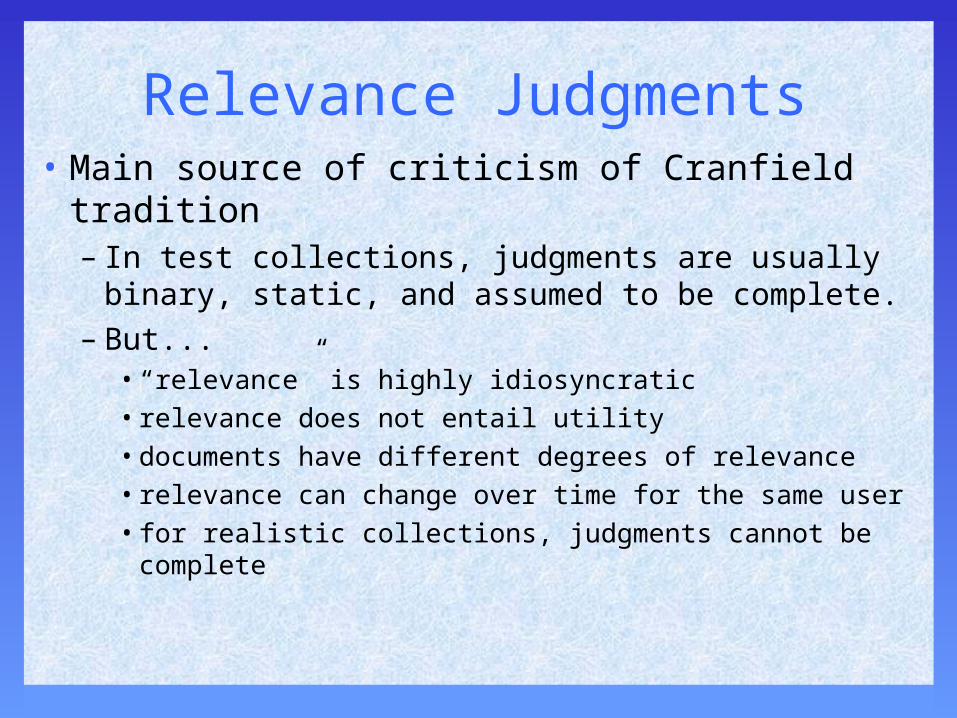
Relevance Judgments• Main source of criticism of Cranfield
tradition– In test collections, judgments are usually
binary, static, and assumed to be complete.– But...
• “relevance” is highly idiosyncratic• relevance does not entail utility• documents have different degrees of relevance • relevance can change over time for the same user• for realistic collections, judgments cannot be
complete
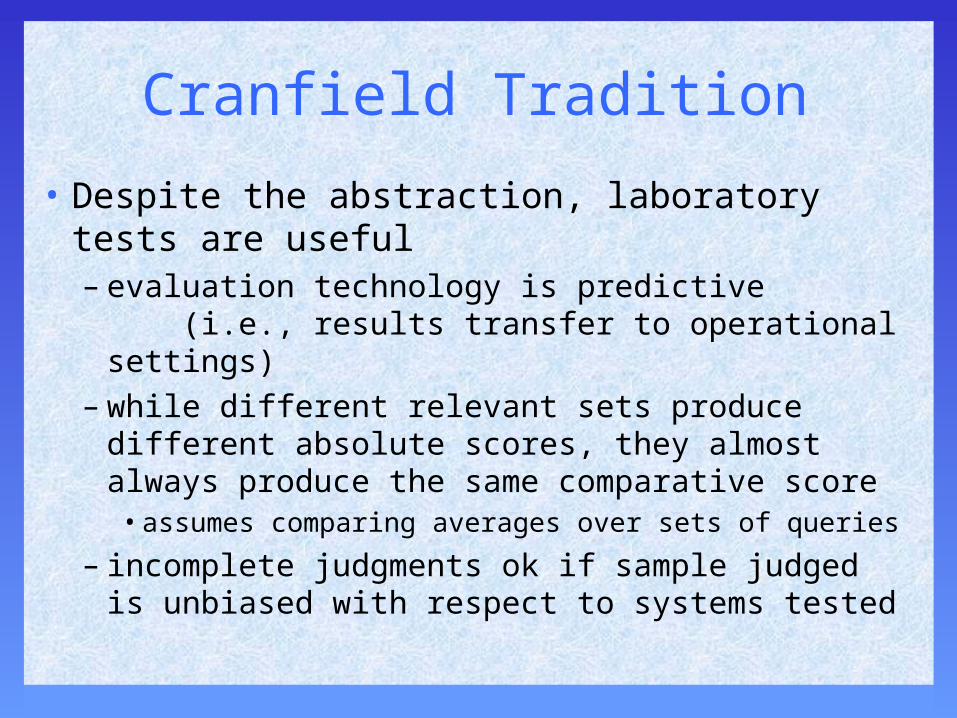
Cranfield Tradition
• Despite the abstraction, laboratory tests are useful– evaluation technology is predictive
(i.e., results transfer to operational settings)– while different relevant sets produce
different absolute scores, they almost always produce the same comparative score• assumes comparing averages over sets of
queries
– incomplete judgments ok if sample judged is unbiased with respect to systems tested

Assessor Agreement
0100200300400500
# Relevant per Topic by Assessor
Primary A B
Assessor Group Overlap
Primary & A .421
Primary & B .494
A & B .426
All 3 .301

0
0.1
0.2
0.3
0.4
System
Ave
rage
Pre
cisi
on
Line 1
Line 2
Mean
Original
Union
I ntersection
Average Precision by Qrel
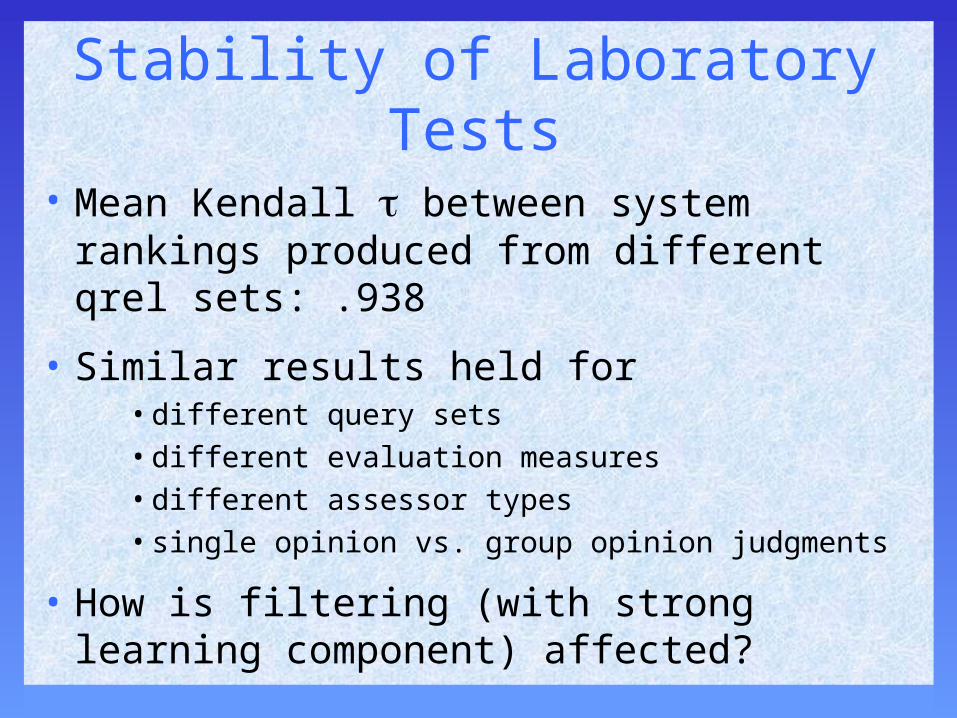
Stability of Laboratory Tests
• Mean Kendall between system rankings produced from different qrel sets: .938
• Similar results held for• different query sets• different evaluation measures• different assessor types• single opinion vs. group opinion judgments
• How is filtering (with strong learning component) affected?
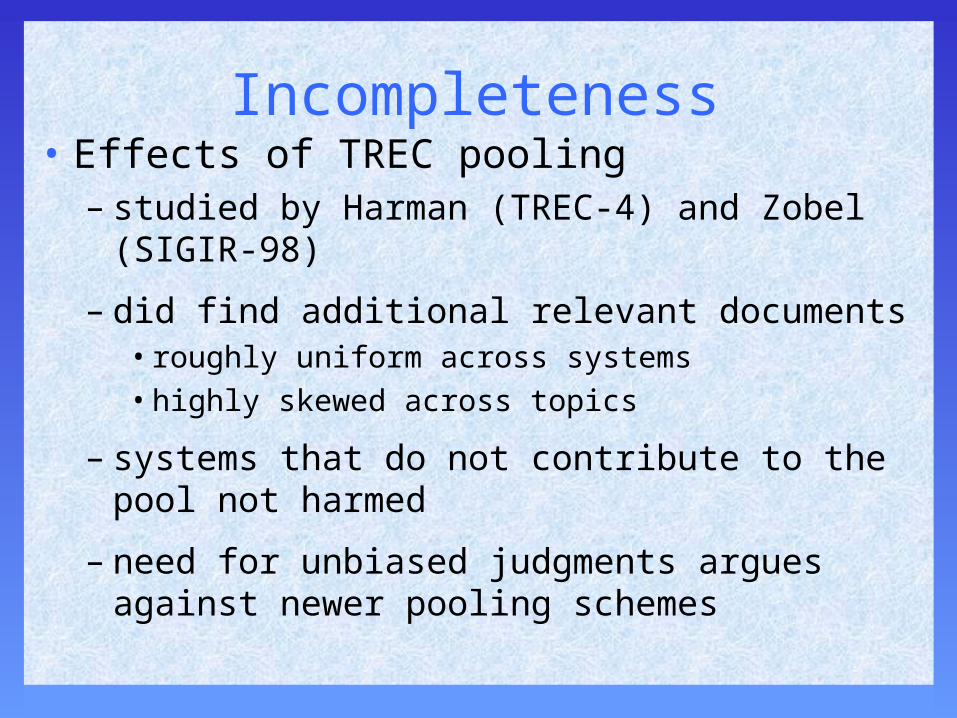
Incompleteness• Effects of TREC pooling
– studied by Harman (TREC-4) and Zobel (SIGIR-98)
– did find additional relevant documents• roughly uniform across systems• highly skewed across topics
– systems that do not contribute to the pool not harmed
– need for unbiased judgments argues against newer pooling schemes

Effectiveness Measures
• Given well-constructed test collection, what should you measure?
– assume ranked retrieval results
– assume evaluate over a set of queries (> 25)
– desirable to have one summary number
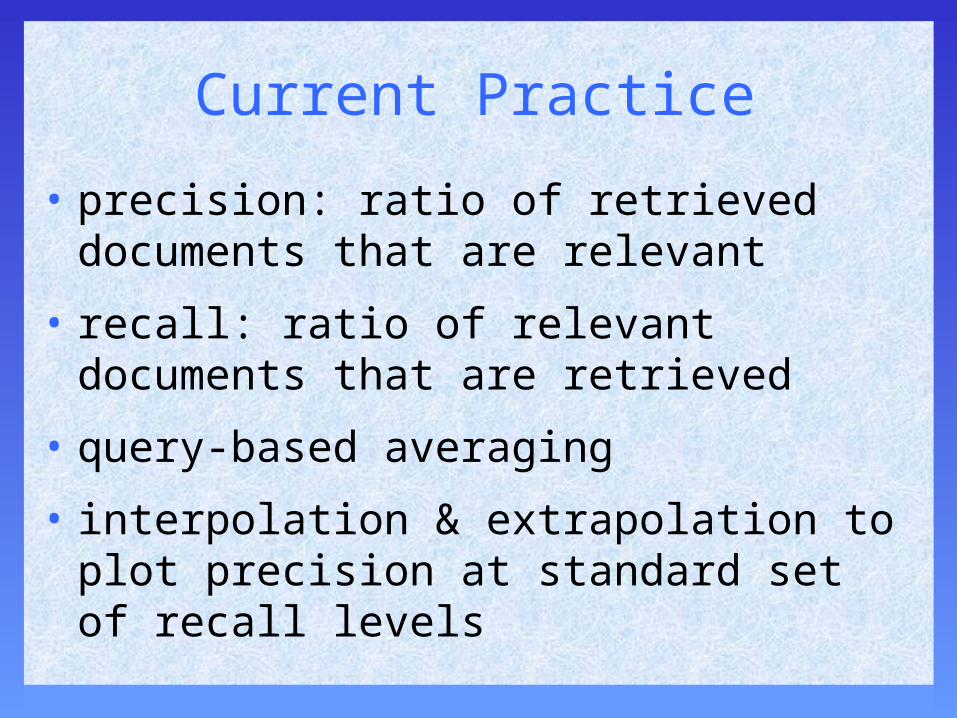
Current Practice
• precision: ratio of retrieved documents that are relevant
• recall: ratio of relevant documents that are retrieved
• query-based averaging
• interpolation & extrapolation to plot precision at standard set of recall levels
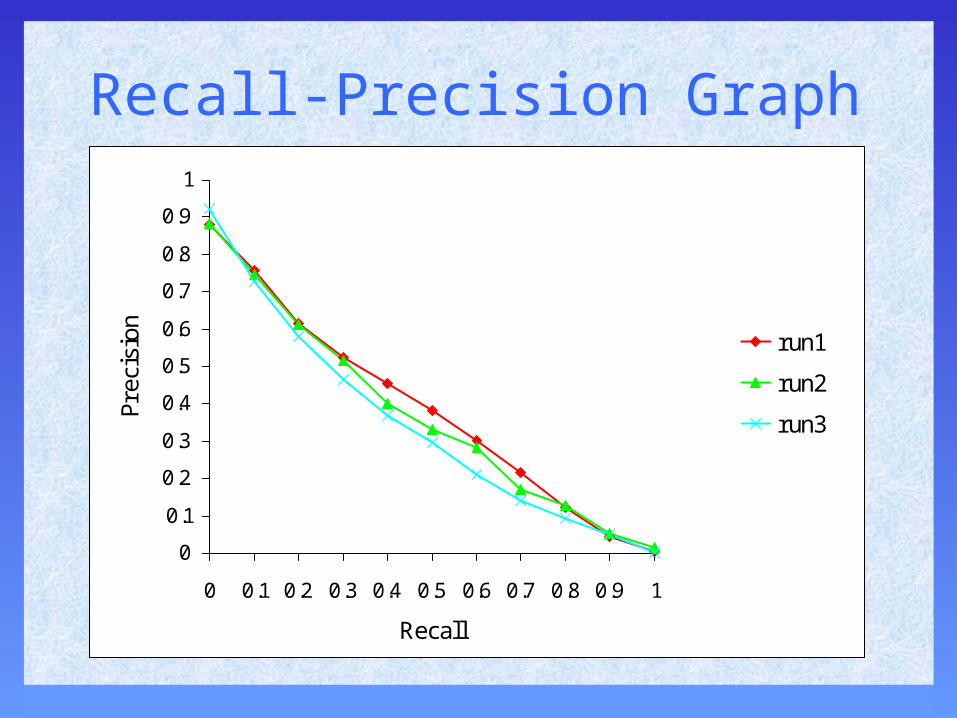
Recall-Precision Graph
0
0.1
0.2
0.3
0.4
0.5
0.6
0.7
0.8
0.9
1
0 0.1 0.2 0.3 0.4 0.5 0.6 0.7 0.8 0.9 1
Recall
Prec
isio
n
run1
run2
run3

Uninterpolated R-P Curve for Single topic
0
0.1
0.2
0.3
0.4
0.5
0.6
0.7
0.8
0.9
1
0 0.11 0.22 0.33 0.44 0.56 0.67 0.78 0.89 1
Recall
Prec
isio
n run1
run2
run3

Interpolated R-P Curves for Individual Topics
0
0.1
0.2
0.3
0.4
0.5
0.6
0.7
0.8
0.9
1
0 0.1 0.2 0.3 0.4 0.5 0.6 0.7 0.8 0.9 1
Recall
Prec
isio
n

Single Number Summary Scores
• Precision (X): # rel in top X / X
• Recall(Y): # rel in top Y/ R
• Average precision: Avgr (Prec(rank of r))
• R-Precision: Prec(R)
• Recall at .5 precision– use Prec(10) if precision < .5 in top 10
• Rank of first relevant (expected search length)

Runs Ranked by Different Measures
P(10) P(30) R-Prec Ave Prec Recall at.5 Prec
Recall(1000)
Total Rel Rank of1st Rel
I NQ502 I NQ502 ok7ax ok7ax att98atdc ok7ax ok7ax tno7tw4ok7ax ok7ax I NQ502 att98atdc ok7ax tno7exp1 tno7exp1 bbn1
att98atdc I NQ501 ok7am att98atde mds98td att98atdc att98atdc I NQ502att98atde att98atdc att98atdc ok7am ok7am att98atde bbn1 nect’challI NQ501 nect’chall att98atde I NQ502 I NQ502 Cor7A3rrf att98atde tnocbm25nect’chall att98atde I NQ501 mds98td att98atde ok7am I NQ502 MerAbtndnect’chdes ok7am bbn1 bbn1 I NQ501 bbn1 I NQ501 att98atdc
ok7am nect’chdes mds98td tno7exp1 ok7as pirc8Aa2 ok7am acsys7almds98td I NQ503 nect’chdes I NQ501 bbn1 I NQ502 Cor7A3rrf mds98tdI NQ503 bbn1 nect’chall pirc8Aa2 nect’chall pirc8Ad pirc8Aa2 ibms98a
Cor7A3rrf tno7exp1 ok7as Cor7A3rrf tno7exp1 I NQ501 nect’chdes Cor7A3rrftno7tw4 mds98td tno7exp1 acsys7al Cor7A3rrf nect’chdes mds98td ok7ax
MerAbtnd pirc8Aa2 acsys7al ok7as acsys7al nect’chall acsys7al att98atdeacsys7al Cor7A3rrf pirc8Aa2 nect’chdes Cor7A2rrd acsys7al nect’chall Brkly25
iowacuhk1 ok7as Cor7A3rrf nect’chall I NQ503 mds98td pirc8Ad nect’chdes
Ranked by measure averaged over 50 topics

Correlations Between Rankings
Kendall’s computed between pairs of rankings
P(30) R Prec AvePrec
Recallat .5 P
Recall(1000)
TotalRels
Rank1st Rel
P(10) .8851 .8151 .7899 .7855 .7817 .7718 .6378P(30) .8676 .8446 .8238 .7959 .7915 .6213R Prec .9245 .8654 .8342 .8320 .5896Ave Prec .8840 .8473 .8495 .5612R at .5 P .7707 .7762 .5349Recall(1000) .9212 .5891Total Rels .5880
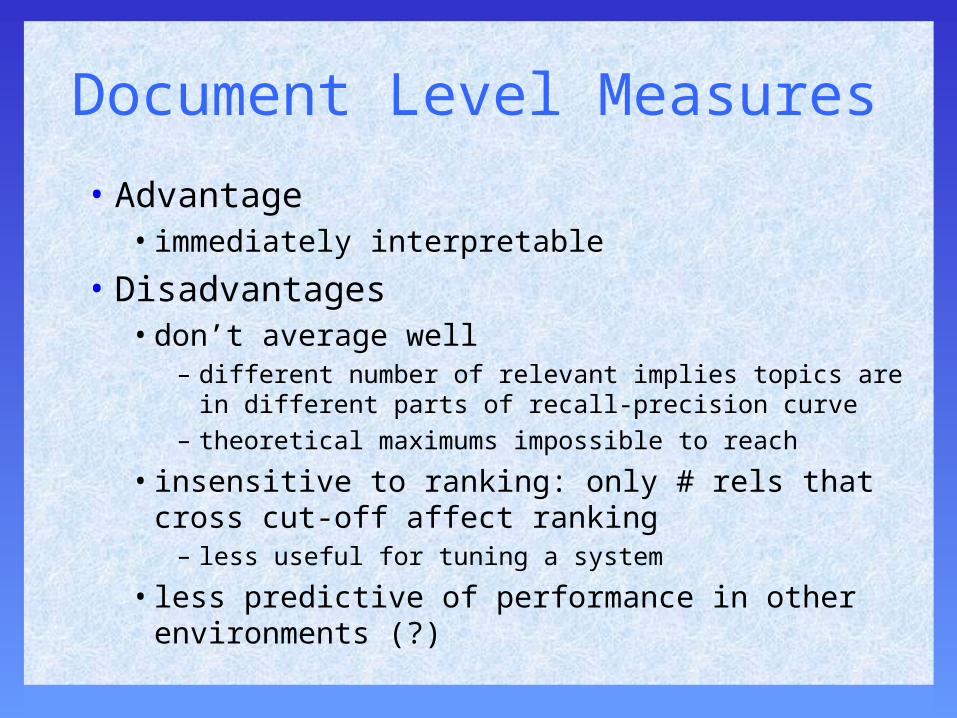
Document Level Measures
• Advantage• immediately interpretable
• Disadvantages• don’t average well
– different number of relevant implies topics are in different parts of recall-precision curve
– theoretical maximums impossible to reach
• insensitive to ranking: only # rels that cross cut-off affect ranking
– less useful for tuning a system
• less predictive of performance in other environments (?)
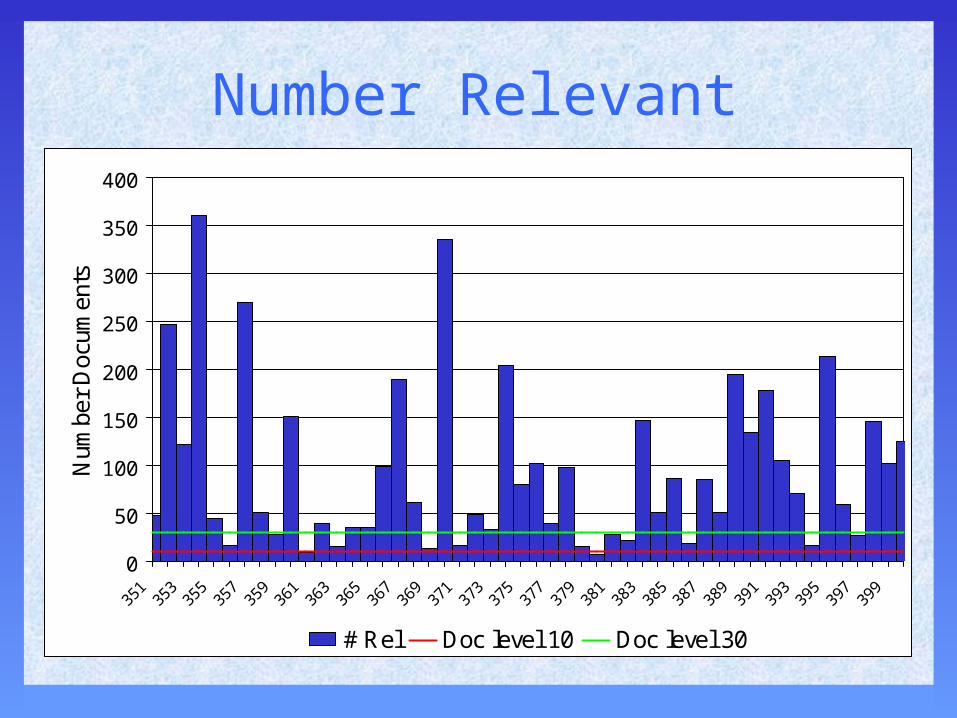
0
50
100
150
200
250
300
350
400
351
353
355
357
359
361
363
365
367
369
371
373
375
377
379
381
383
385
387
389
391
393
395
397
399
Num
ber
Doc
umen
ts
# Rel Doc level 10 Doc level 30
Number Relevant
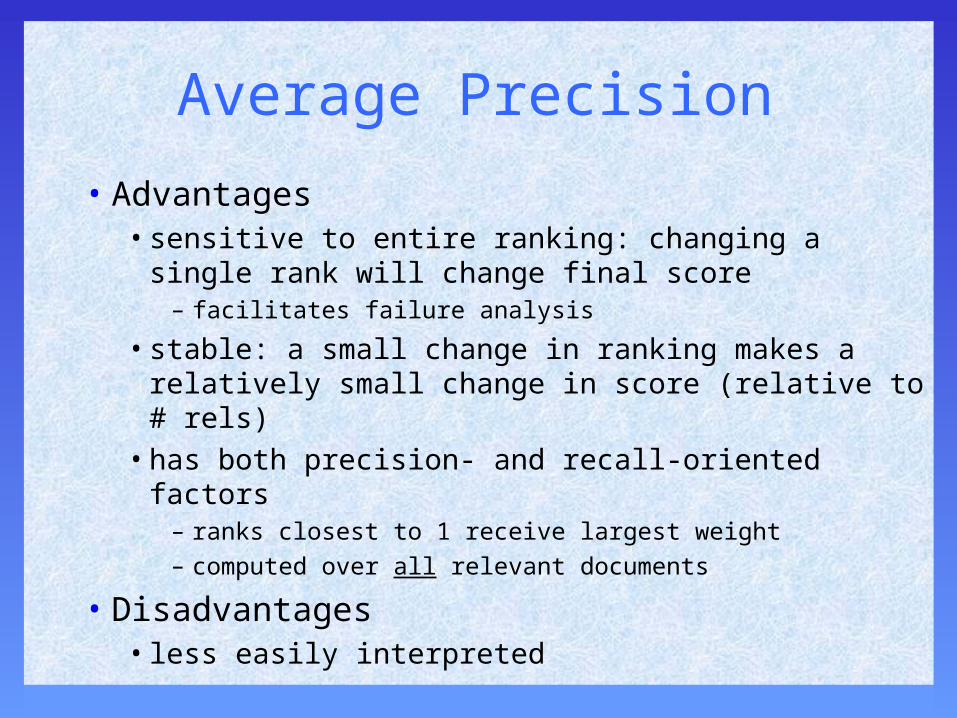
Average Precision
• Advantages• sensitive to entire ranking: changing a single
rank will change final score – facilitates failure analysis
• stable: a small change in ranking makes a relatively small change in score (relative to # rels)
• has both precision- and recall-oriented factors– ranks closest to 1 receive largest weight– computed over all relevant documents
• Disadvantages• less easily interpreted
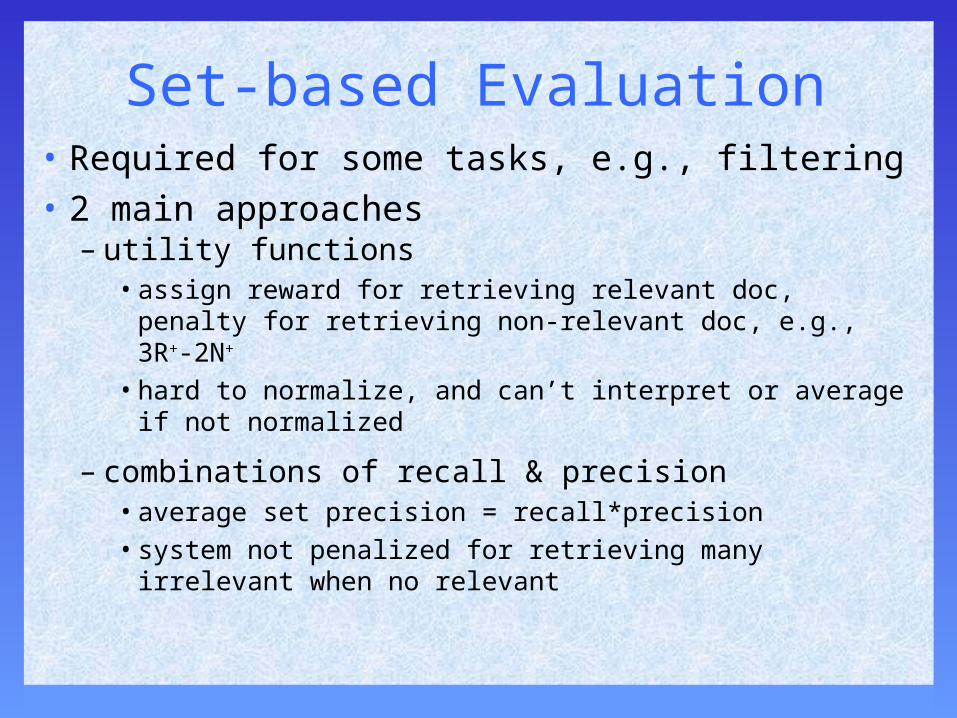
Set-based Evaluation• Required for some tasks, e.g., filtering• 2 main approaches
– utility functions• assign reward for retrieving relevant doc, penalty
for retrieving non-relevant doc, e.g., 3R+-2N+
• hard to normalize, and can’t interpret or average if not normalized
– combinations of recall & precision• average set precision = recall*precision• system not penalized for retrieving many
irrelevant when no relevant
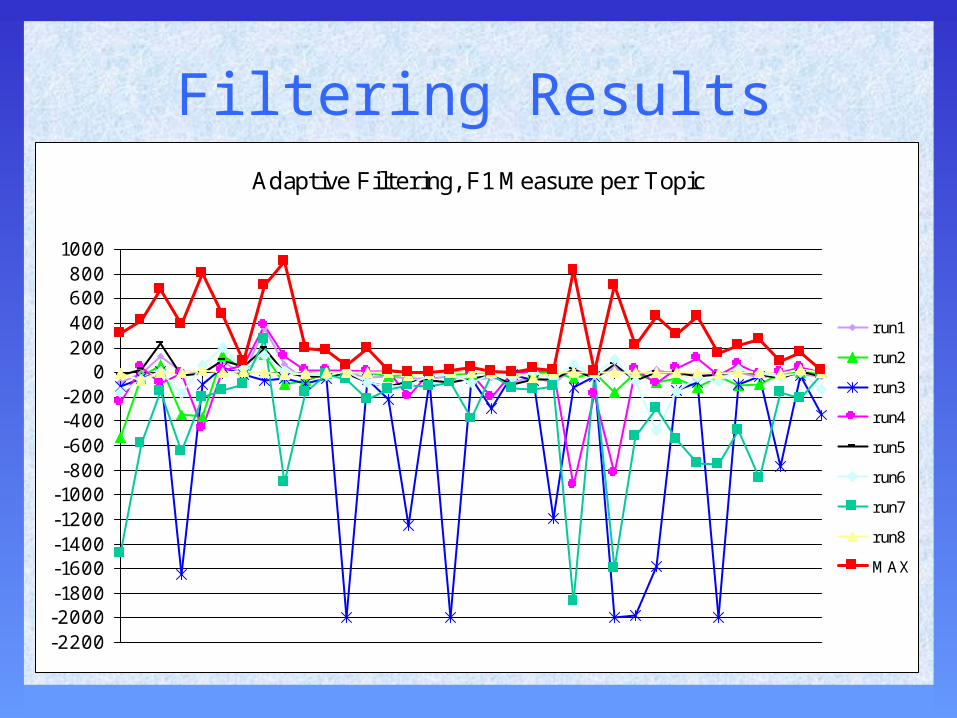
Filtering ResultsAdaptive Filtering, F1 Measure per Topic
-2200-2000-1800-1600-1400-1200-1000-800-600-400-200
0200400600800
1000
run1
run2
run3
run4
run5
run6
run7
run8
MAX
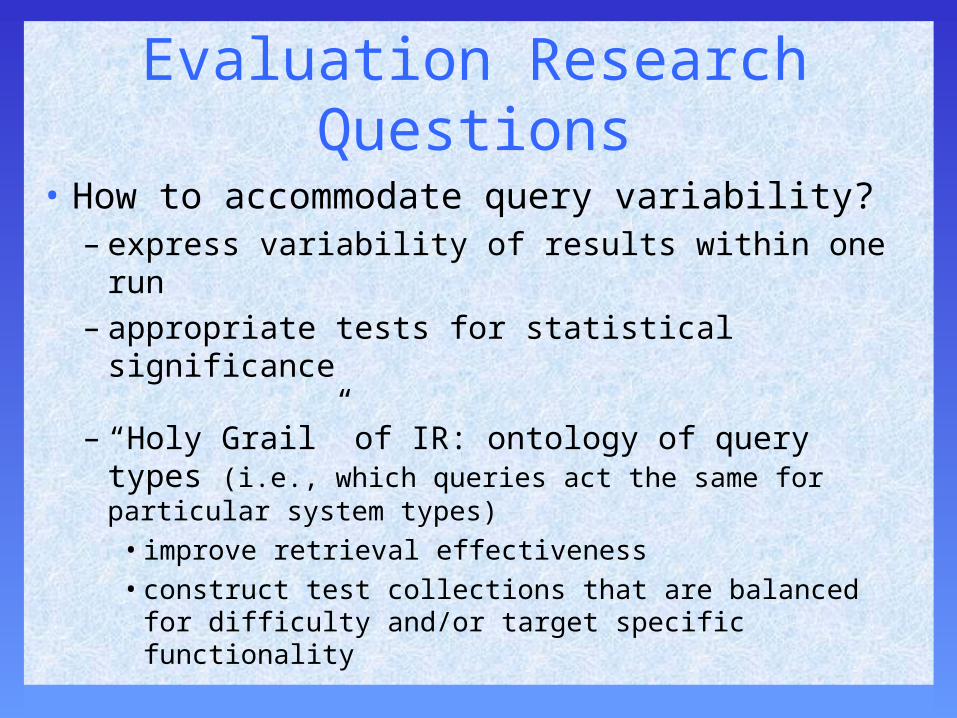
Evaluation Research Questions
• How to accommodate query variability?– express variability of results within one run– appropriate tests for statistical significance
– “Holy Grail” of IR: ontology of query types (i.e., which queries act the same for particular system types)• improve retrieval effectiveness• construct test collections that are balanced for
difficulty and/or target specific functionality
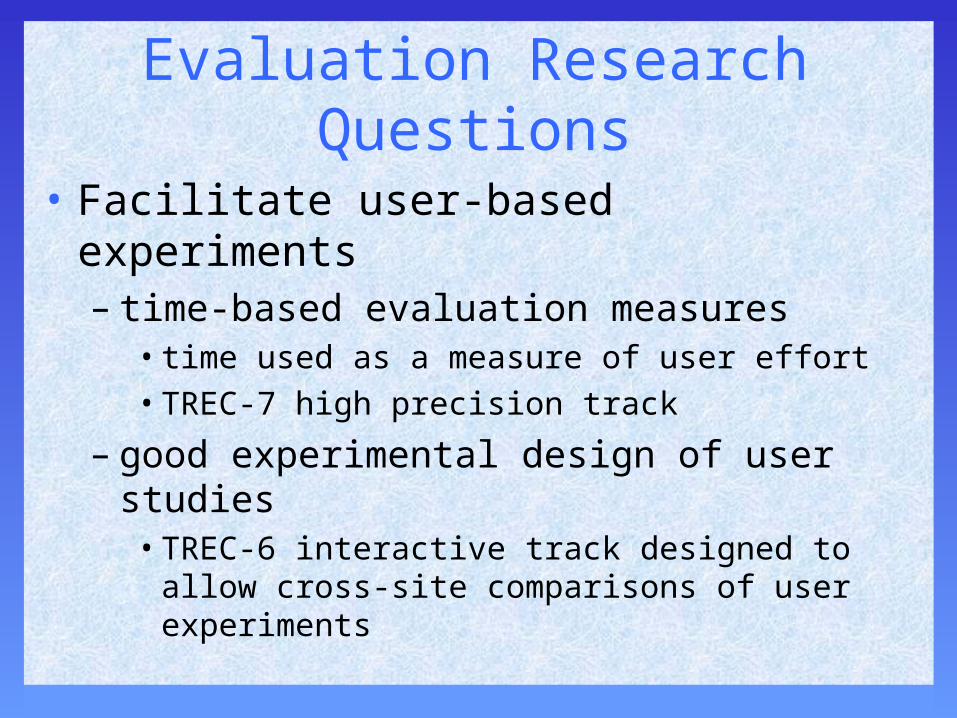
Evaluation Research Questions
• Facilitate user-based experiments– time-based evaluation measures
• time used as a measure of user effort• TREC-7 high precision track
– good experimental design of user studies• TREC-6 interactive track designed to allow
cross-site comparisons of user experiments